Article

Assessment of an External Cooling System Using Experimental Methods for Thrust Bearing in a Large Hydraulic Unit

1
Energy Technologies Division, Marmara Research Center, The Scientific and Technological Research Council of Türkiye, Kocaeli 41400, Türkiye
2
Energy Technologies Division, Marmara Research Center, The Scientific and Technological Research Council of Türkiye, Ankara 06531, Türkiye
*
Author to whom correspondence should be addressed.
Water 2025, 17(6), 795; https://doi.org/10.3390/w17060795
Submission received: 3 January 2025 / Revised: 19 February 2025 / Accepted: 25 February 2025 / Published: 10 March 2025

Abstract

:
This research was conducted to evaluate and compare the efficiency of the modern external type thrust bearing cooling system (TBCS) with plate-type heat exchangers (PTHEs) applied as an alternative to standard design external type TBCS with shell-and-tube heat exchangers (STHEs) in a 180 MW large hydro power plant by experimental methods. Although similar studies are available in the literature, there is no comprehensive study on the effects of different parameters on performance and other plant parameters. The main parameters examined in the study are the cooling rate, oil temperature difference, average pad temperature (APT), and generator winding temperature. The tests were carried out over the range of 144–150.1 MW unit loads, 580–1317 L/min water flow rates, and 998–1411 L/min oil circulation flow rates. The results showed that the APT can only be reduced up to 73.4 °C at 1411 L/min oil circulation flow rate by 252.6 kW cooling, the optimum oil circulation flow rate is 1195 L/min, APT can be reduced by 1.7 °C and the maximum winding temperature by 1.3 °C when external type TBCS with PTHEs is used, and structural changes must be made in the thrust bearing design to provide further decrease in pad temperature.

1. Introduction

Hydropower plants have the largest electricity generation capacity [1,2] and are one of the most important renewable and clean energy sources [3,4]. These power plants are not only an environmentally friendly and cheap source of electricity but also have great importance in regulating the stable operation of electric power systems [5]. However, the increase in the energy production capacity of variable Renewable Energy Sources (v-RES) [6,7] further increases system variability [8,9]. So, the increasing share of v-RES in power generation necessitates more frequent and rapid adjustment of the grid. Hydro turbines are well suited to this type of operation, but their design needs to be improved [10]. One of the areas studied to increase the efficiency and grid adaptation of hydroelectric power plants is thrust bearings, which are a hydrodynamic axial bearing [11,12]. Its operating condition and environment have a direct impact on the unit’s safety, stability [13], and availability.
Large hydraulic units are designed vertically, and this structure enables them to carry the forces resulting from weight and rotational inertia. In particular, vertical loads are carried by thrust bearings [11,14,15]. Lubrication and cooling are critical considerations for bearing life and efficiency [15]. In the thrust bearing, rotational movement occurs on a fluid film that completely separates the fixed surfaces called pads and the moving surface called the shaft [16]. The fluid film prevents direct metal-to-metal contact and serves as a medium to dissipate heat resulting from friction [17]. The formation of the fluid film depends on the formation of the hydrodynamic pressure wave, which determines the load-carrying capacity [16,18]. The load-carrying capacity depends on three main parameters, namely oil film thickness, mechanical strength, and temperature [19]. The load-carrying capacity is one of the main factors limiting the maximum capacity that can be obtained from hydro units [20].
Thrust bearing pads are usually coated with a thin layer of soft alloy called white metal. Since white metal begins to creep at high temperatures, it places a temperature limit on the safe operation of the bearing [21,22]. Due to the nature of the white metal coating, it is essential to ensure effective cooling. On the other hand, failure to obtain optimum conditions causes pad deformation, increased maintenance costs, and production losses [23]. The oil that cools the pads in the thrust bearings is cooled by air or water, depending on the scale of the hydraulic unit. In high-capacity hydraulic units, water cooling is preferred to provide sufficient cooling capacity [23].
Traditional design thrust bearing cooling system (TBCS) commonly has internal coolers inside housing or external coolers under housing without a pump system. Internal oil coolers are located directly in the oil chamber and cool the oil with cold water circulating inside the pipes. They were the standard design used in the past [19]. The housing where the thrust bearing is placed and the reinforced concrete structure around the housing limit the area where the internal cooler can be placed and the size of the internal cooler. Also, oil circulation in the internal coolers is provided by the rotational inertia of the unit, making it difficult to control the character and amount of oil flow outside the coolers because there is no external pump system [19]. In addition, water leakage at internal water-cooled systems reduces the load-carrying capacity of the bearing and causes pad deformation. As a result, the entire thrust bearing must be dismantled, which increases maintenance costs and causes production losses. In contrast, external TBCS with oil circulation pumps, where oil is cooled by pumping it out of the thrust bearing, offer distinct advantages. These include larger exchanger surface area, high heat transfer intensity, and controlled operation. The main drawbacks of external TBCS are additional energy consumption by the pumps and complexity of the system [19].
Heat exchangers are the most important components, acting as thermal transfer devices that transfer heat from hot to cold fluids by conduction [24]. Both shell-and-tube heat exchangers (STHEs) and plate-type heat exchangers (PTHEs) can be used as external heat exchangers [25] in TBCS. STHEs are widely employed in many industries due to their ease of manufacturing and ability to withstand extreme temperatures and pressures [26]. However, it has drawbacks such as low thermal efficiency, significant pressure loss, damaging vibration [25,27], restricted surface area expansion capability [28], and easily susceptible to blockage because of low water velocity. PTHEs have become essential components in power and process industries during the past 30 years [29]. PTHEs are widely used in industries due to numerous advantages, including high heat transfer coefficients (110–180 W/m2K in STHEs, 600–680 W/m2K in PTHEs), large heat transfer areas, compact sizes, low liquid hold-up, and ease of cleaning and maintenance [19,24,28,30]. The compact size of PTHEs makes them particularly efficient in facilities with limited space, such as power plants. Furthermore, because of their higher efficiency than STHEs, PTHEs allow for similar levels of heat transfer while using less cooling water. The most important advantages of PTHEs used in TBCS are: high heat transfer coefficient, decreasing of water leakages in the oil chamber, preventing zebra mussel formation due to high water speed, and preventing pad deformations by preventing water from mixing with the oil thanks to the special plate and seal design.
At Porąbka Żar Power Plant with 125 MW Francis turbines, the old internal TBCS was replaced with an external type TBCS with PTHE to keep the APT temperature below 80 °C. When the old internal cooling system was used in the plant, the bearing temperature was kept below 80 °C when the cooling water temperature was below 14 °C (in winter), but when the cooling water temperature rose to 22 °C (in summer), the APT reached the alarm level of 85 °C. With the newly installed external type TBCS with PTHE, the APT did not exceed 77 °C (83 °C before modernization) even at the highest cooling water temperature of 22 °C [31]. Najar and Harmain made a structural change in the thrust bearing by placing a cooling pipe inside the pad. The aim of the study was to reduce the pad temperature and analyze the thermal effects of the change in the oil film temperature. As a result of the study, it was stated that the pad temperature decreased significantly compared to traditional cooling systems [32]. In another study by Najar and Harmain, the structural changes made to the thrust bearing pad and the thermal effects of the cooling pipes embedded in the pad were investigated. In the study, the Reynolds equation, energy equation, and generalized Fourier heat transfer equation were solved by the finite difference method. It was stated that the pad and oil film temperature was significantly reduced compared to traditional cooling systems with the cooling pipes embedded in the pad [33]. Bhat et al. investigated the effect of integrating cooling pipes into the pads by making structural changes in the bearing cooling system on the pad temperature, oil film thickness and bearing load-carrying capacity. As a result of the study, it was observed that more homogeneous heat distribution was achieved and the load-carrying capacity was increased with the integrated cooling design into the pad. In addition, a CFD model was created and verified to numerically evaluate the effects of the new design on the bearing performance parameters. As a result of the study, the maximum pad temperature was reduced from 85 °C to 71 °C [34]. As reported in the studies conducted by Najar and Harmain and Bhat et al., embedding cooling pipes into the pad by making structural changes in the bed is advantageous in terms of reducing APT by directly reducing the temperature of the oil film on the pad surface. However, it is disadvantageous in terms of creating a risk of water leakage since cooling water pipes are placed inside the oil chamber, similar to internal TBCSs.
TBCS of the pilot hydroelectric power plant was initially designed to use two external type STHEs which are located under housing. However, current STHEs have performance degradation owing to fouling, zebra mussel blockage, and blindness after pipe bursts, and because both STHEs are in operation at the same time, maintenance is not possible. When the pipes in STHEs burst, water mixes with the oil, causing deactivation of units and production losses. Additionally, the absence of an oil filter in the existing cooling system causes the oil to become dirty more quickly. Contaminated oil accelerates the deformation of the pad surface, reduces load-carrying capacity, and increases heat losses due to friction. As a result, bearing temperatures rise, deformations and production losses occur, and maintenance costs increase.
A comprehensive literature review reveals a lack of studies on the conversion of external type TBCS with STHEs to external type TBCS with PTHEs and the effects of its different parameters on the performance in the modernization of vertical Francis type large hydropower units. In this context, the following studies are aimed at filling the gap in the literature:
  • Investigation of the effect of changes in oil and water flow rates of the new TBCS with PTHEs on the bearing pad temperatures.
  • Investigation of the effect of replacing old type STHEs with modern technology PTHEs on cooling performance of TBCS.
  • Comparison of operating performances of existing STHEs and new PTHEs.
  • Determining the optimum operating condition and evaluating the system performance by operating new PTHEs under different conditions with a modern automation system.

2. Materials and Methods

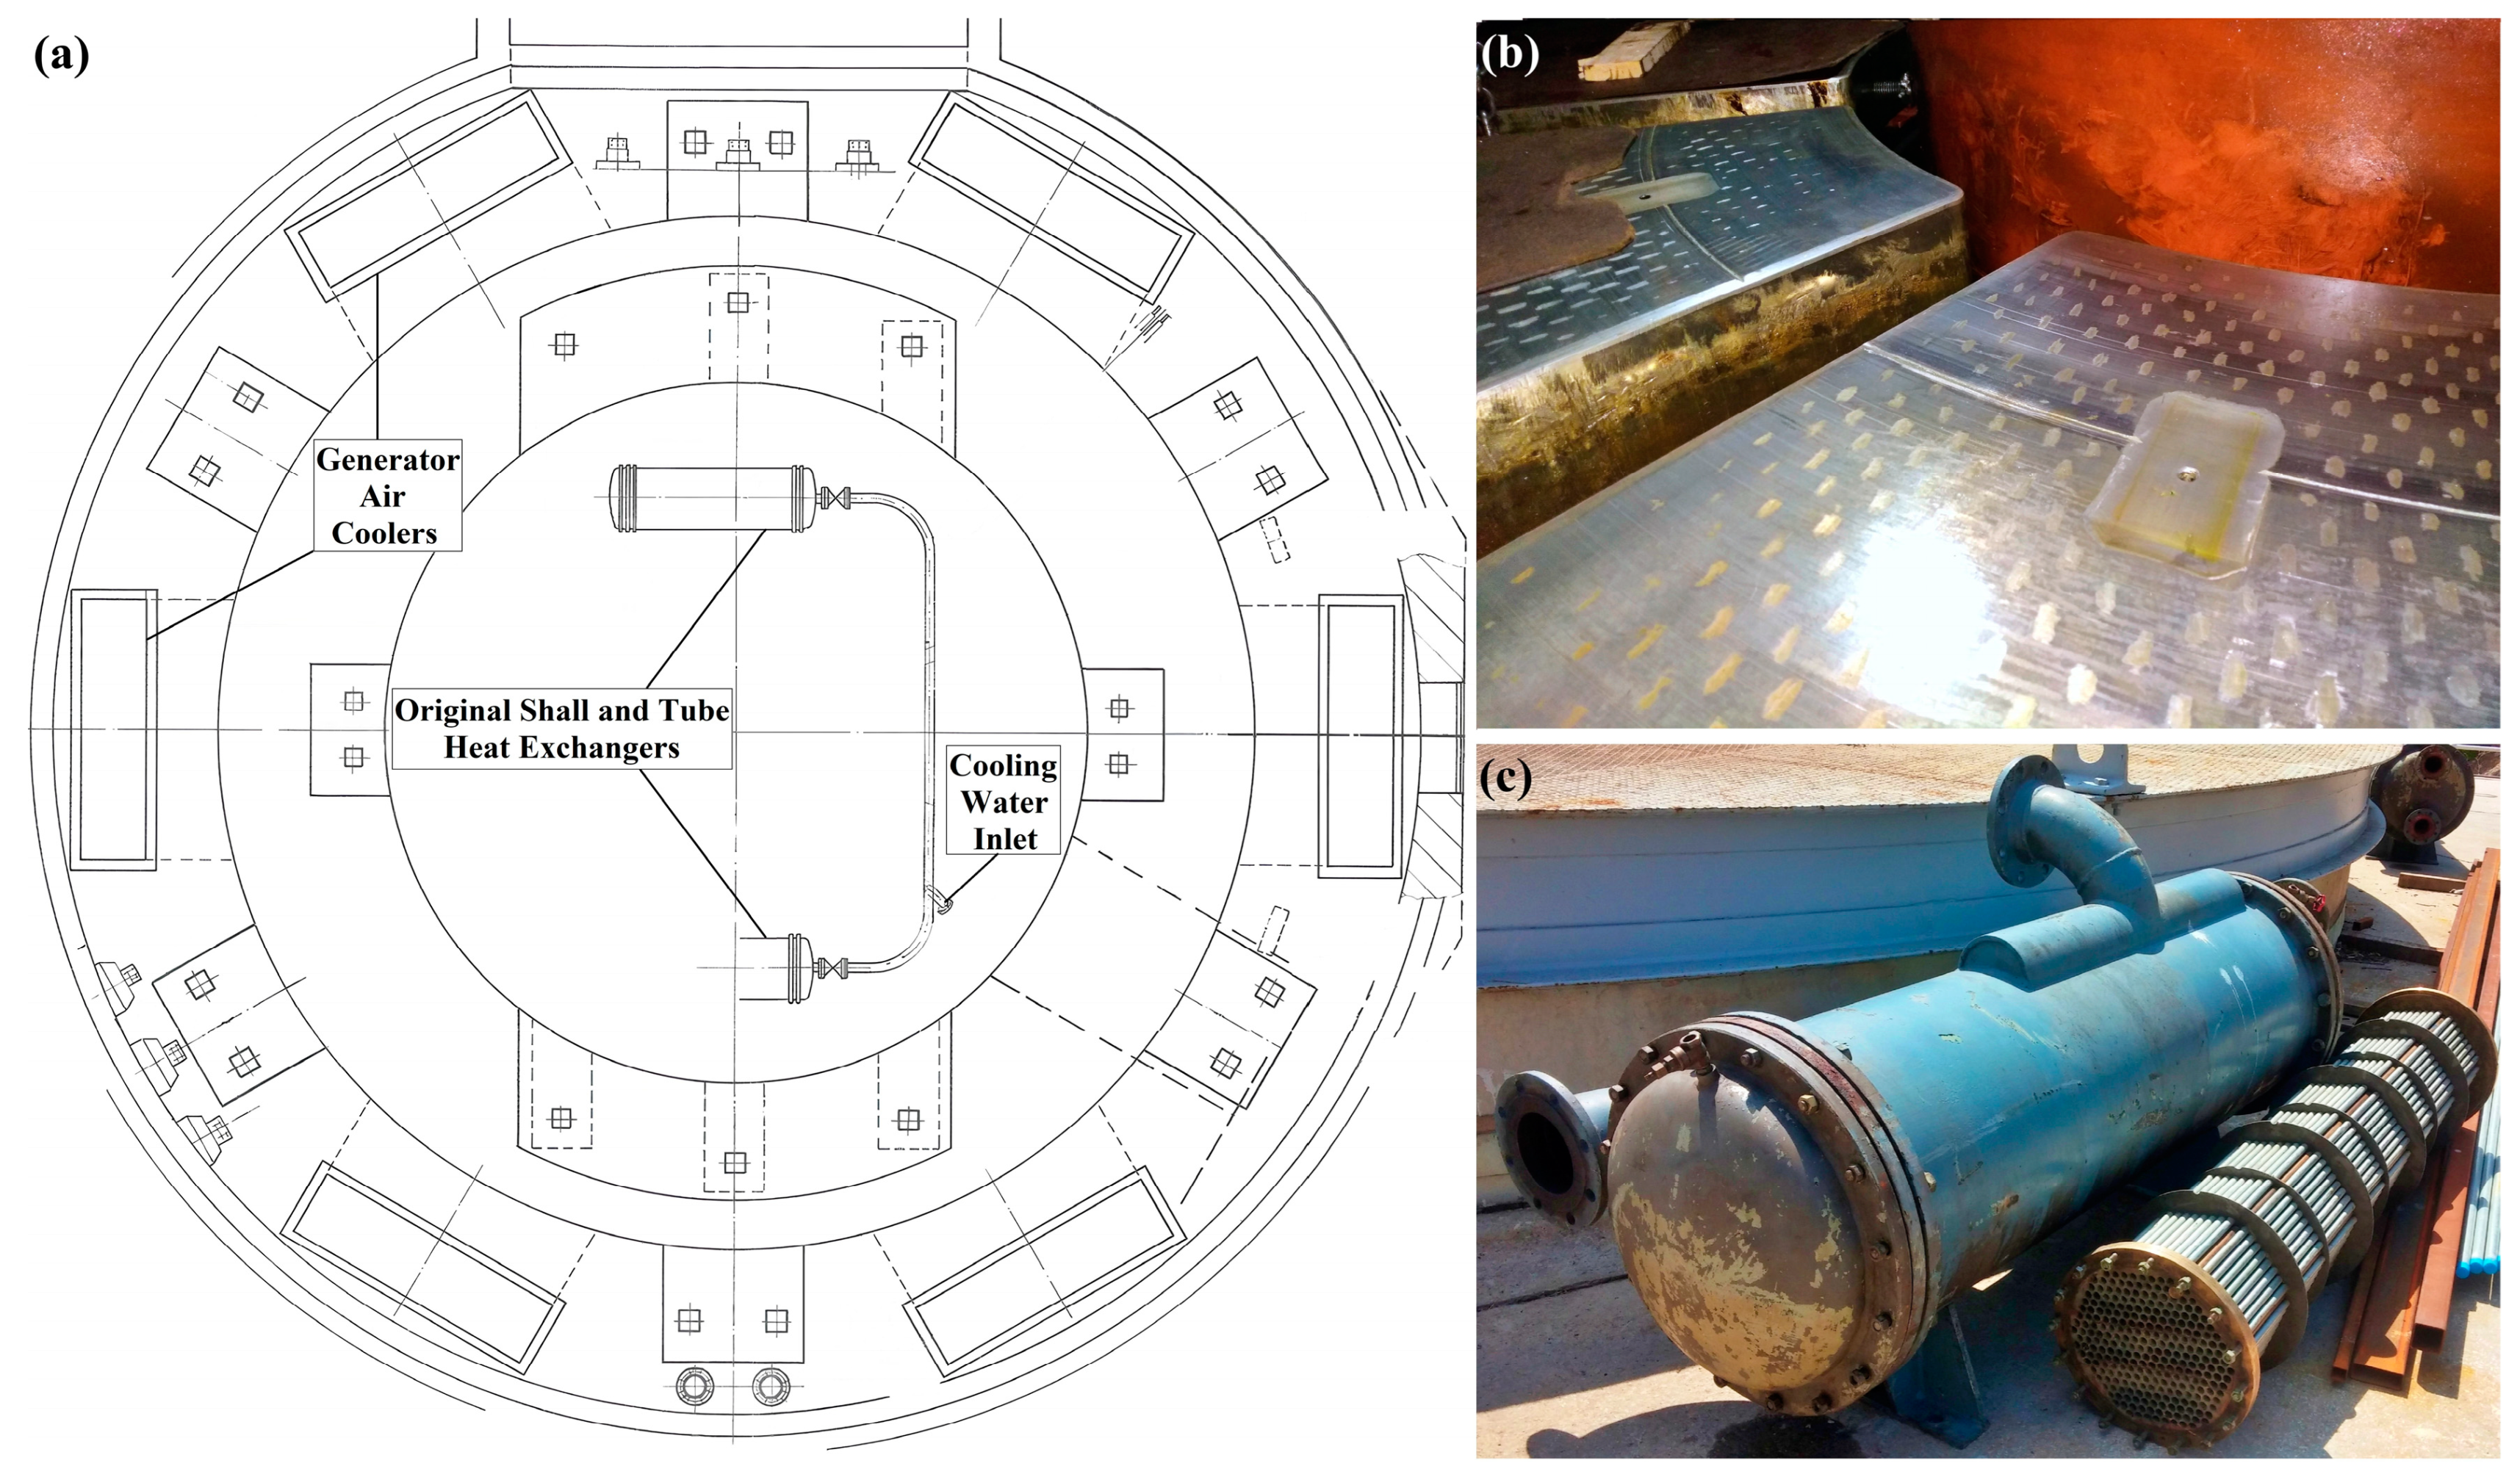
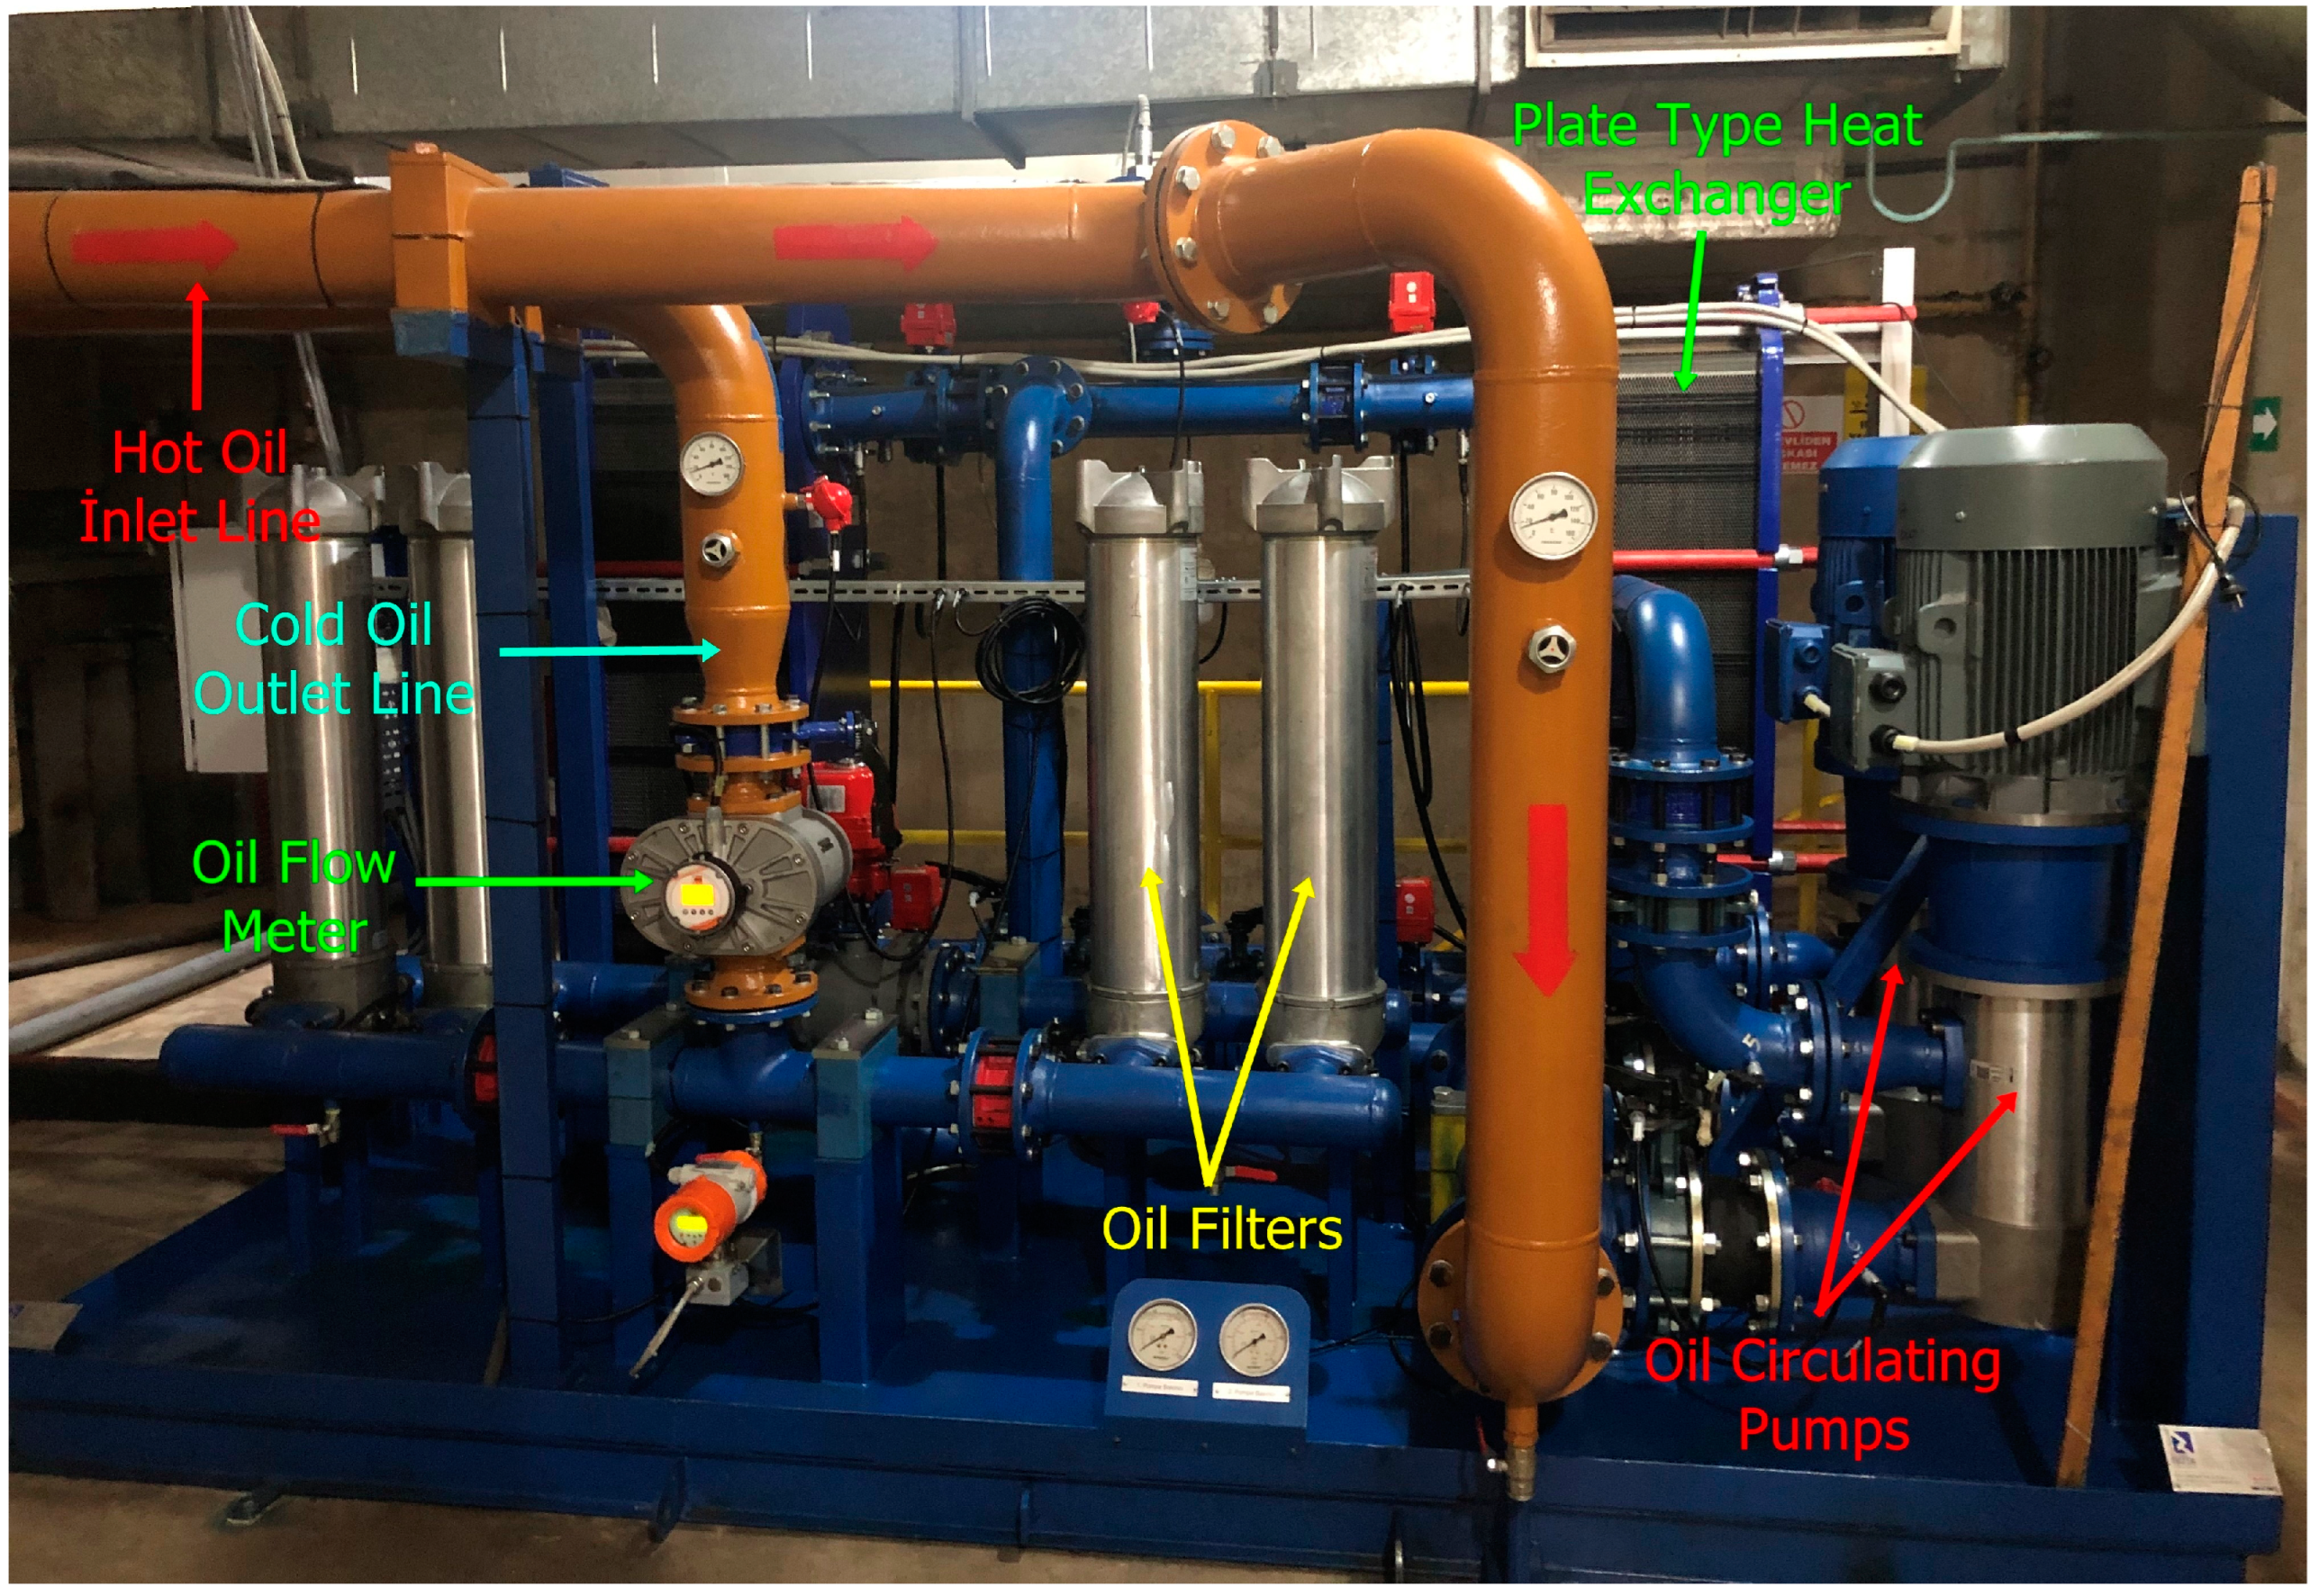
2.1. External Thrust Bearing Cooling System Design

The pilot hydroelectric unit has a nominal capacity of 180 MW. TBCS of the unit includes two external type STHEs to cool the thrust bearing oil. The thrust bearing has 10 white metal-coated (containing at least 80% tin) pads manufactured using AISI 4140 material (Siemens, Munich, Germany). Each pad is 600 mm long, 280 mm wide on the short side, 600 mm wide on the long side, and 100 mm high. Figure 1 shows a technical drawing of the area where the thrust bearing pads are placed and the location of the existing STHEs, thrust bearing pads, and original STHE.
Figure 2 shows the 3D model of the original and newly applied TBCSs, Figure 3 shows the picture of newly installed external type TBCS with PTHEs, and Figure 4 shows the flow diagram. The original TBCS consists of two STHEs located at the top of the turbine shaft (under housing). In this configuration, oil circulation is provided by the rotational inertia of the unit without the need for a pump. While oil temperatures are measured with temperature sensors placed at the inlet and outlet of the original STHEs, the inlet–outlet temperature, pressure, and flow rate of the cooling water are measured with sensors placed in the cooling water line.
The newly installed TBCS can be put into operation by being completely isolated with the valves in the oil and water lines in the original system (Figure 3 and Figure 4). Unlike the original TBCS, the new system includes two PTHEs, two pumps, and two filters, and one of each of these equipment is used as a spare (Figure 3 and Figure 4). In the new system, the oil sucked from the bearing is cooled by sending it to the PTHEs with a pump. The cooled oil is filtered and fed to the bearing. In this way, particles in the oil are filtered and the pads operate for a longer time without deformation. While the oil flow rate is adjusted by changing the frequency of the pump motors, the water flow rate can be adjusted with the proportional valve in the cooling water line. This configuration provides fine control over the cooling rate as well as the amount of oil circulation.
The temperature, pressure, and flow rate of water and oil are measured with the sensors located in the oil and water lines of the new system and shown in Figure 3. Additionally, each pad temperature in the thrust bearing, generator cooling water, and winding temperatures are constantly measured and recorded. All measurements made with sensors are recorded in the established unit control system and trends can be monitored. In this way, the effect of temperature, pressure, and flow rate changes in the new and old system on pad temperatures can be seen. In addition, the unit can be put into an emergency stop by receiving the necessary warning signals before the pad temperatures reach the critical value.
Within the scope of the tests, the unit was operated for at least six hours under each test condition, data were collected, and calculations were made. When the thrust bearing average pad temperature (APT) becomes stable, the amount of heat generation in the thrust bearing, as a result of friction, equals the amount of oil cooling rate. The cooling rate is calculated as follows [35]:
Q ˙ = m ˙ c p Δ T ,
m ˙ = V ˙ ƍ ,
ΔT = ToutTin,
Q ˙ = V ˙ ƍ c p ( T out T in )
where Q ˙ is cooling rate of the bearing (kW), m ˙ is mass flow rate (kg/s), cp is the oil-specific heat (kJ/kg. °C), V ˙ is the volume flow rate (m3/s), ƍ is the oil density (kg/m3), ΔT is the oil temperature difference (°C), Tout is the oil outlet temperature from the thrust bearing (°C), and Tin is the oil inlet temperature to the thrust bearing (°C).

2.2. Digitalization of Thrust Bearing and Cooling Systems

The aging power plants exhibit constrained instrumentation capacity characterized by diminished measurement resolution and logging capabilities. The original sensors are inherently limited, allowing only real-time observation without automated recording functionality. The power plant where field tests were conducted is approximately 60 years old, and therefore temperature, pressure, and flow sensors are insufficient. Within the scope of the study, a total of 46 additional measuring instruments were installed to make measurements, the details of which are given in Table 1. For temperature measurements, Ordel Middle East Electronics, Ankara, Türkiye-OR02 model resistance thermometers (PT-100) manufactured in accordance with DIN 43760 and with a standard accuracy of ±0.1% and class B were used; Hydrotechnik GmbH, Limburg, Germany -3403-32-I5.37S model pressure sensors with a measurement accuracy of ±0.5% were used for pressure measurements. A positive displacement oval gear flowmeter (Kobold Messring GmbH, Hofheim, Germany -DON1-55H-FC-4-L0-M-0–Accuracy: ±1%) was used for oil flow measurement, a magnetic inductive flowmeter (Kobold Messring GmbH, Hofheim, Germany -PIT-S 317B 016H 01000 K-Accuracy: ±1.5%) was used for the new TBCS water flow measurement, and a FLEXIM GmbH, Berlin, Germany, FLUXUS F501 (Accuracy: ±1.5%) model ultrasonic flowmeter was used for the original TBCS water flow measurement. These sensors, engineered for compatibility with the control system, are interconnected with input cards within the new unit control system. Consequently, the signals are systematically gathered for logging and trending purposes.

3. Results and Discussion

The tests were carried out in three separate stages, where various parameters of the new external type TBCS with PTHEs were examined and compared with the original external type TBCS with STHEs. In the first stage tests, the effect of the change in oil flow rate at constant cooling water flow rate on the following parameters is examined:
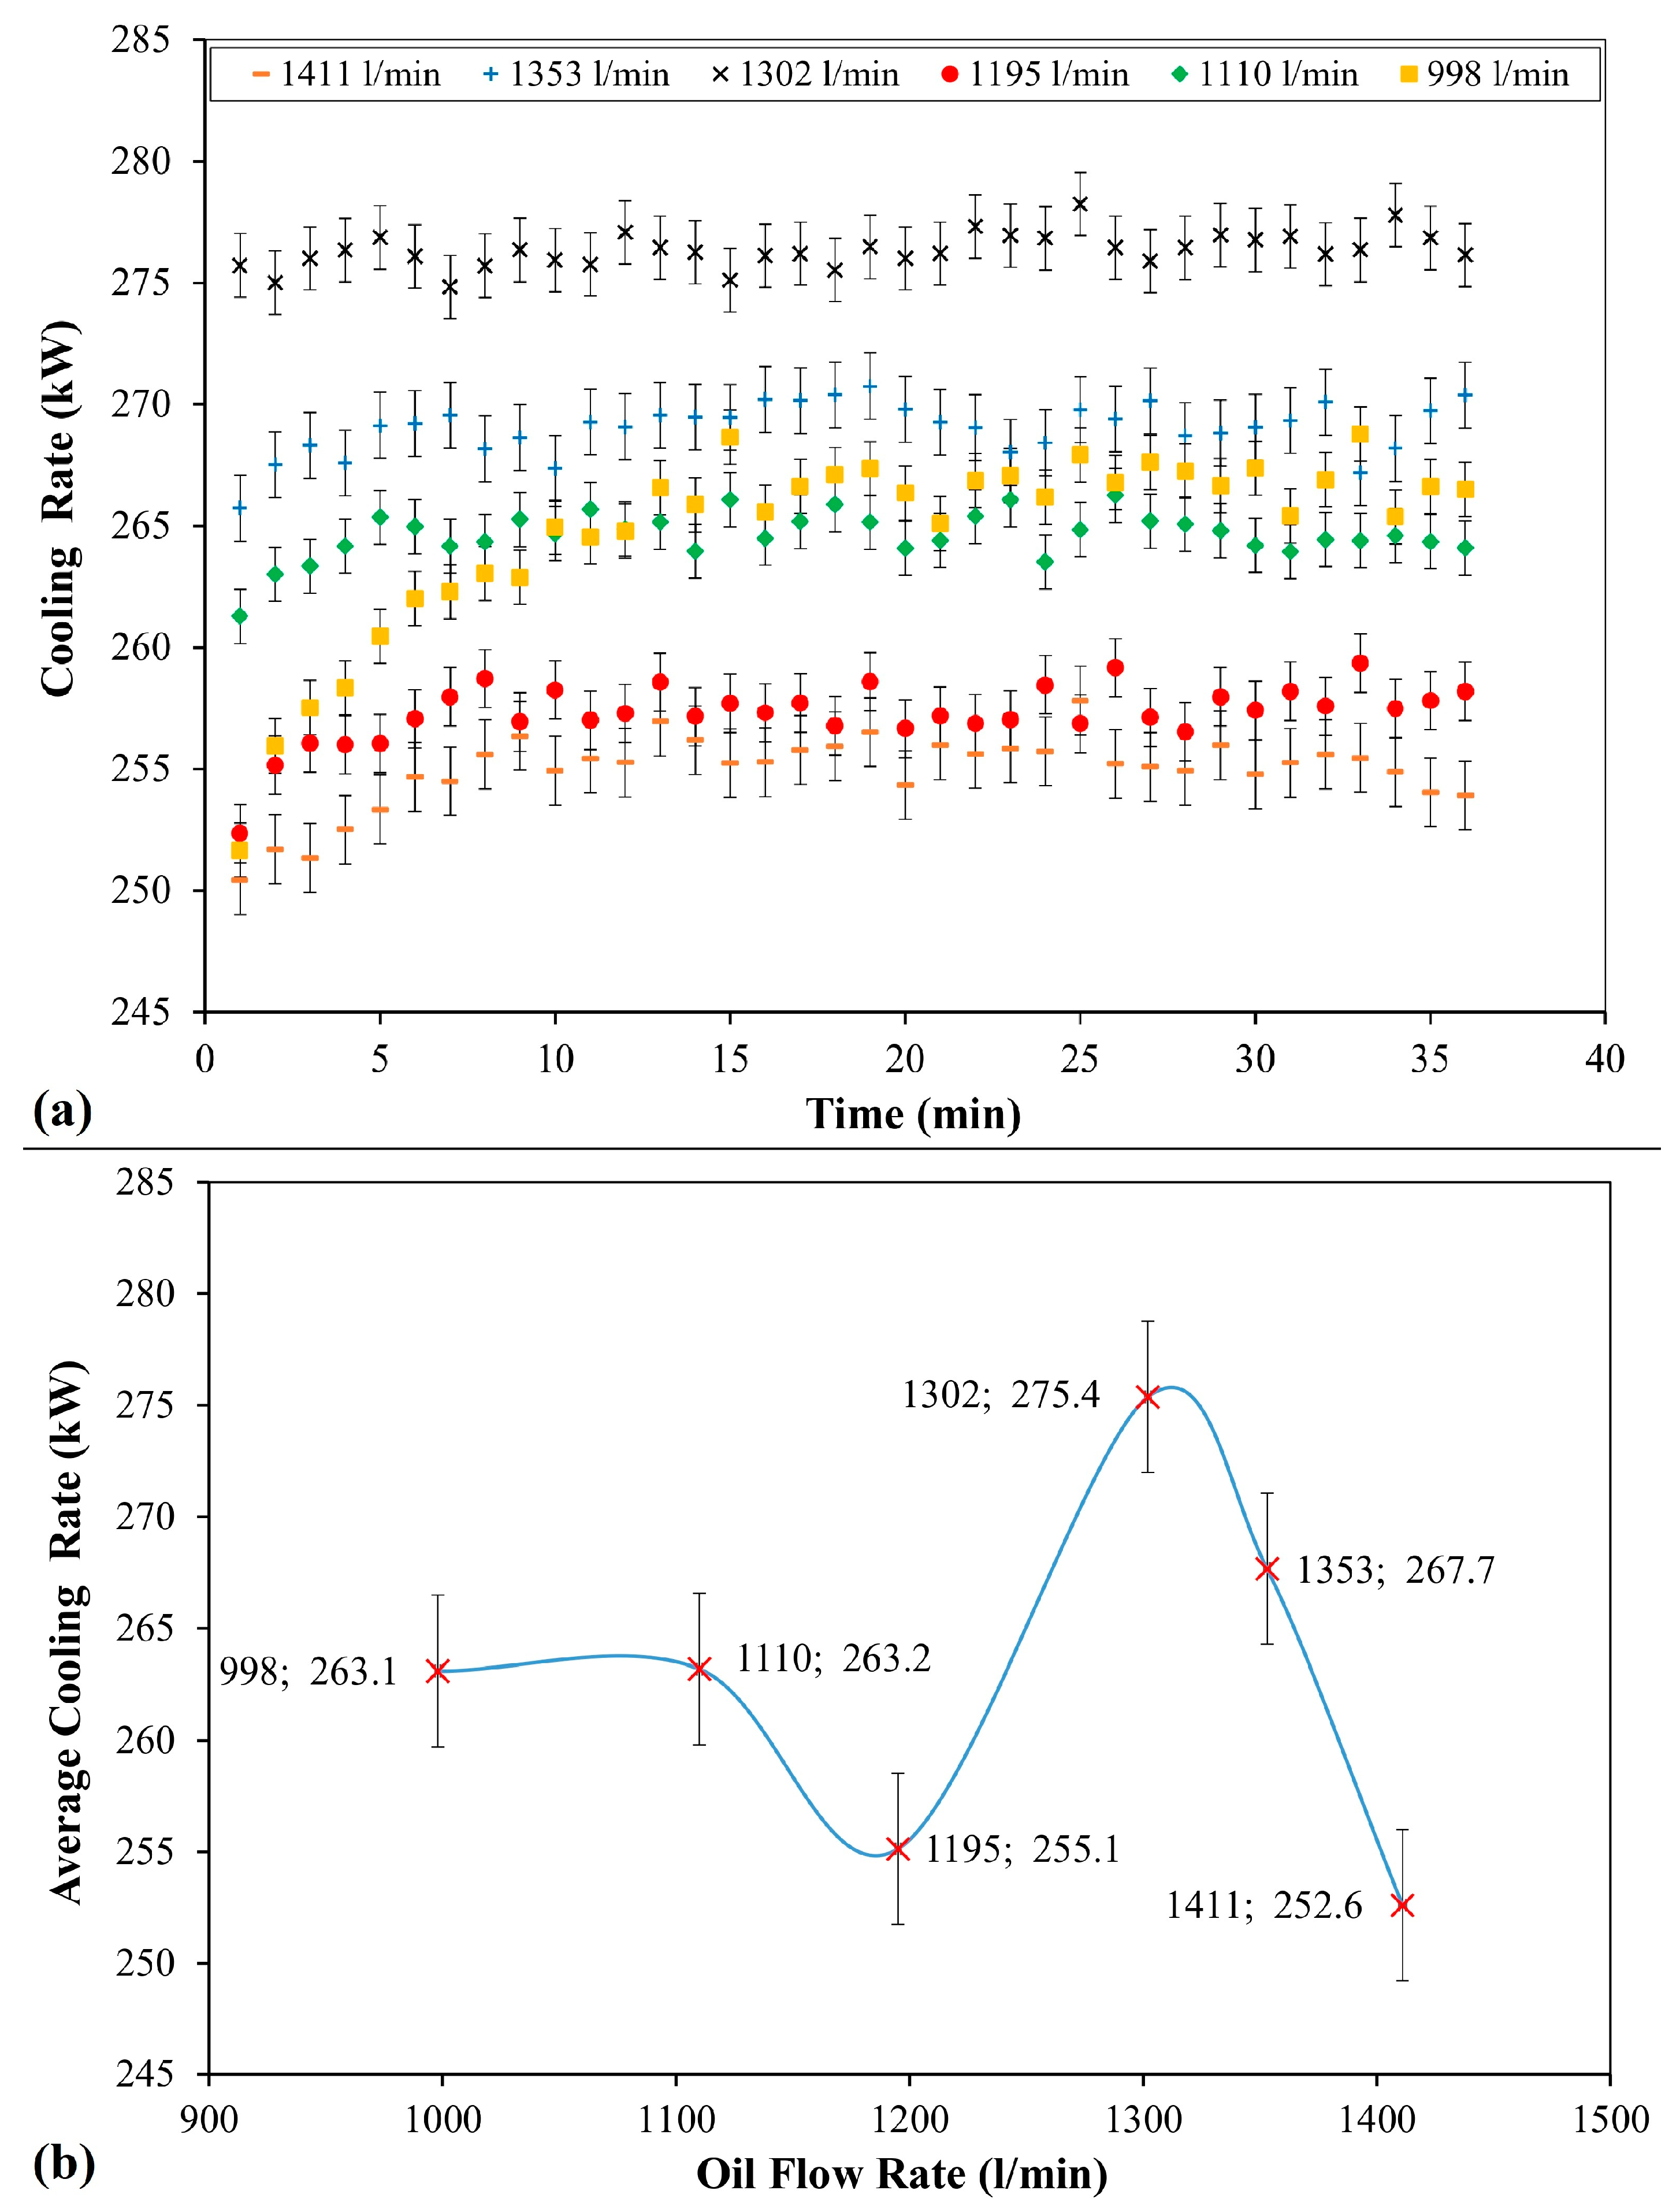
  • Amount of oil cooling rates;
  • Average cooling rate;
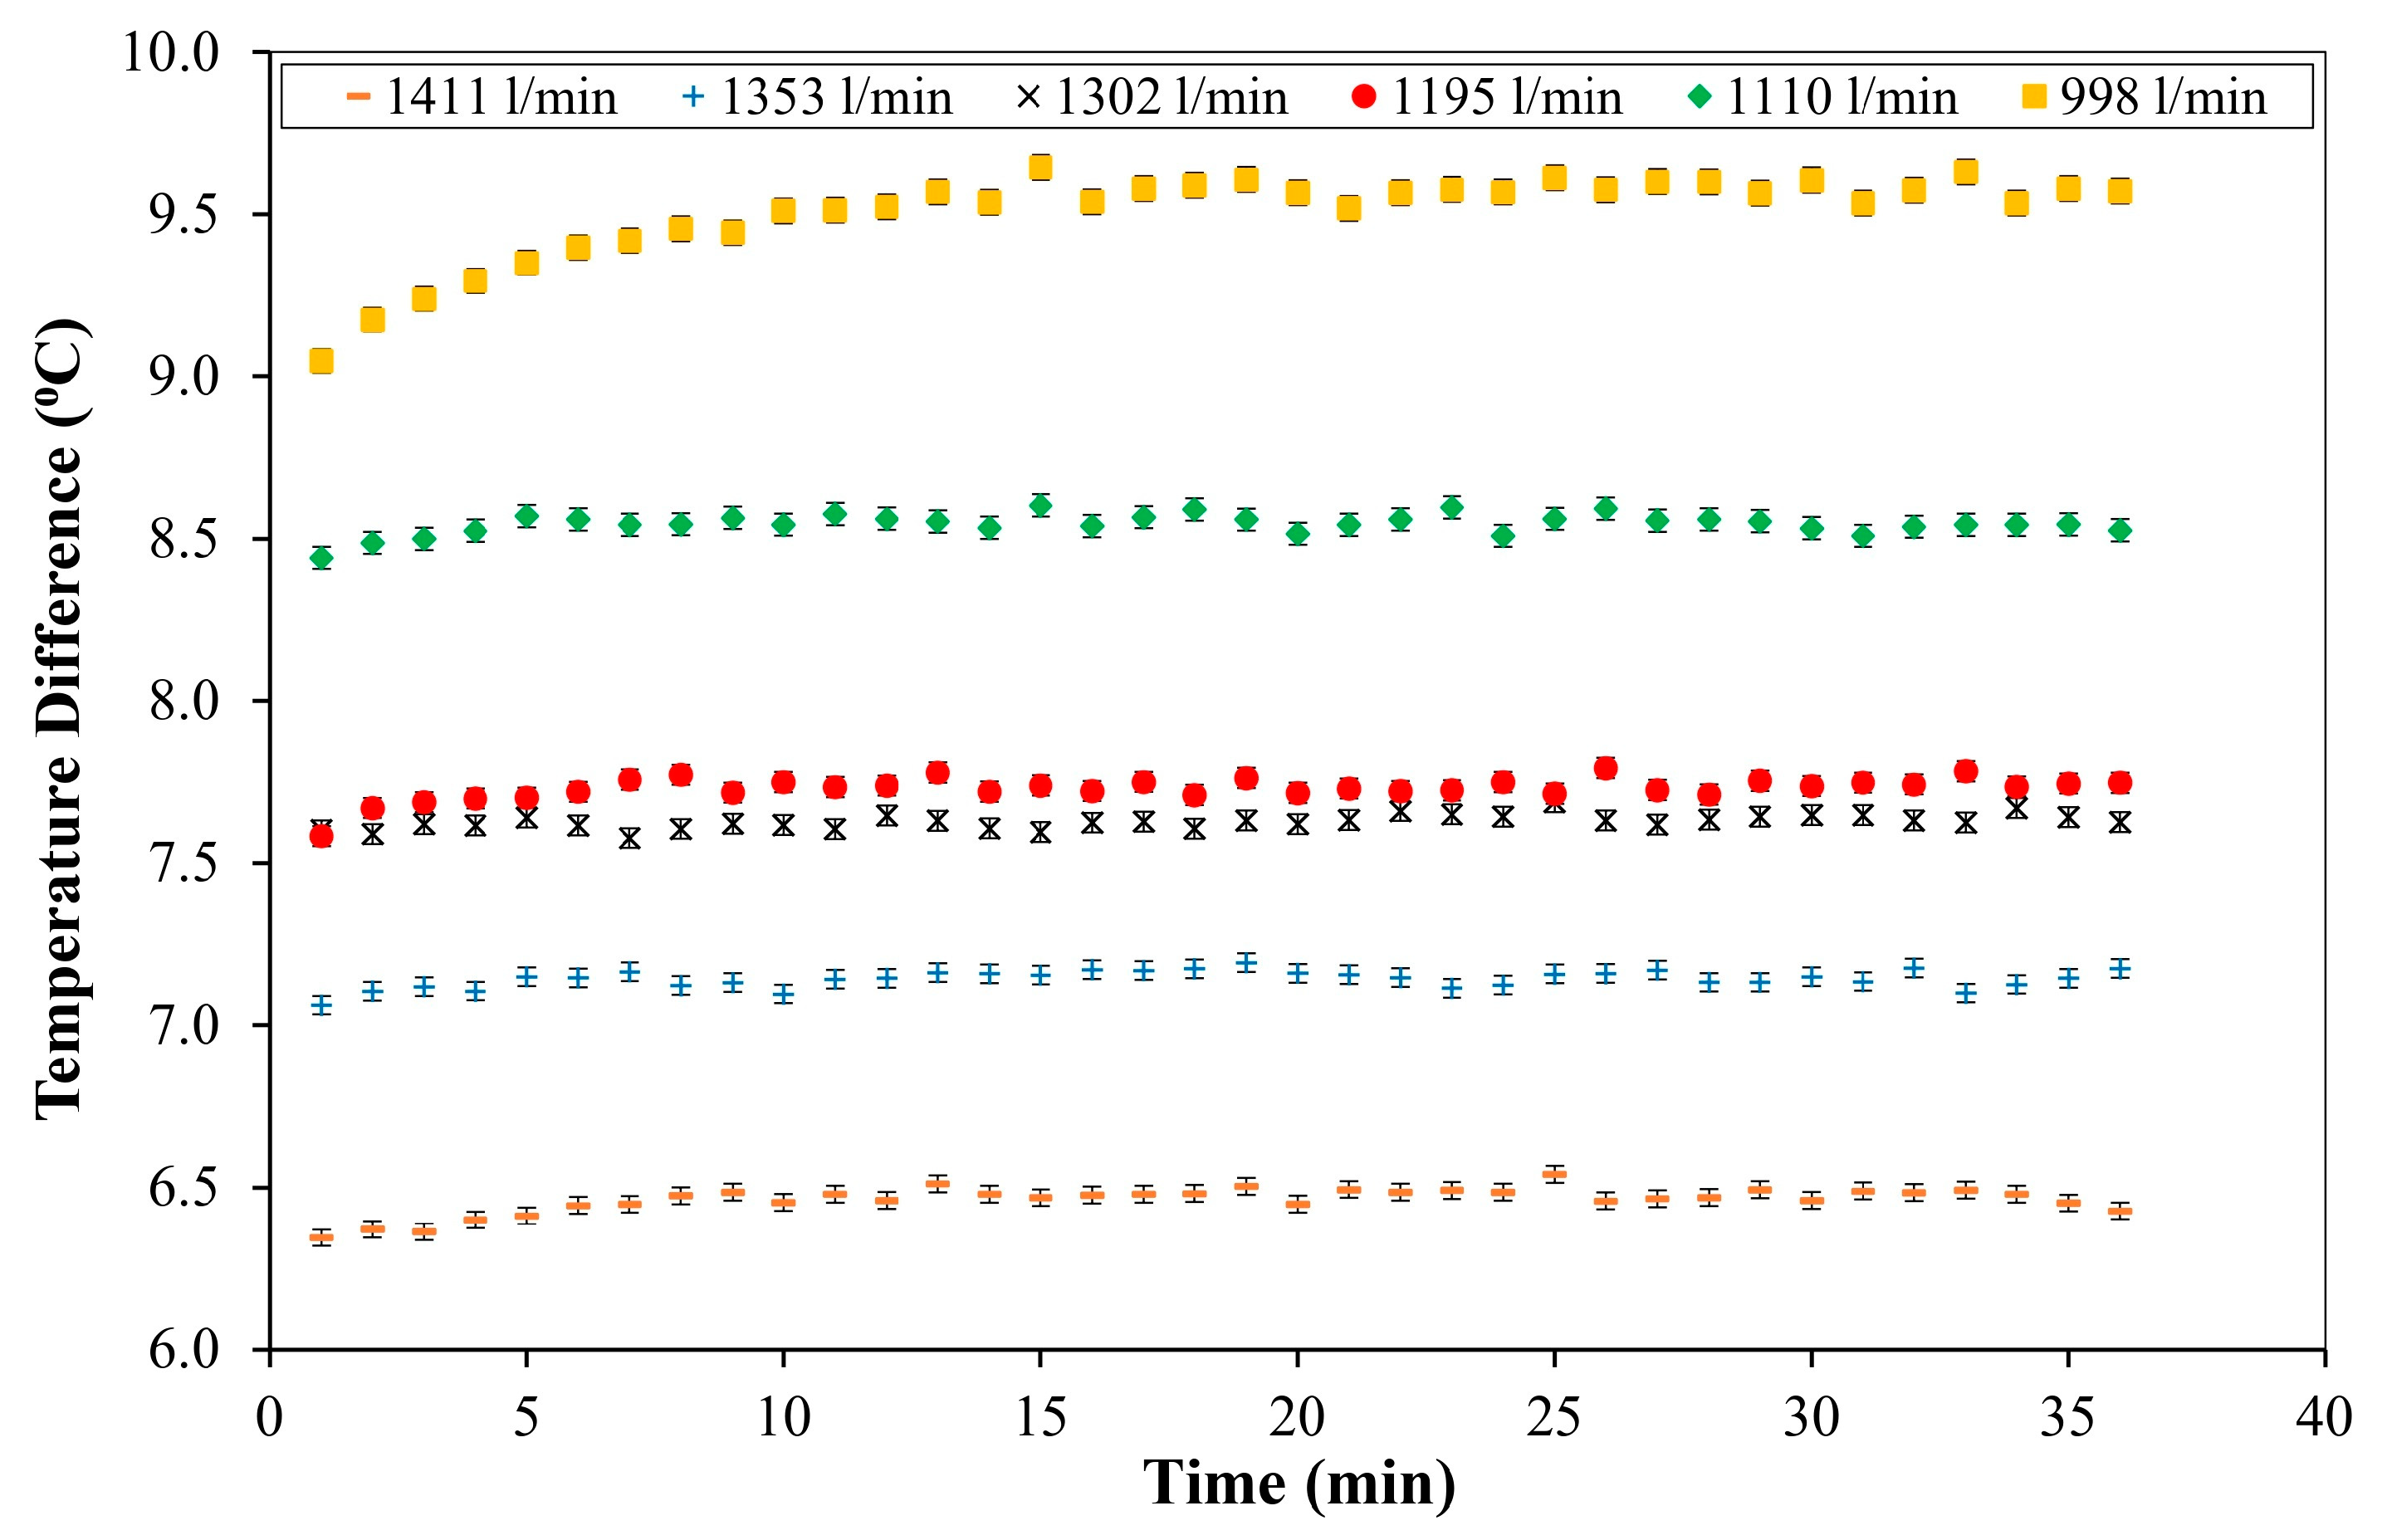
  • Oil temperature difference;
  • APT.
In the second stage, the effects of changes in oil circulation and cooling water flow rates on the following parameters were investigated at different unit powers:
  • Average cooling rate;
  • Oil inlet–outlet temperature and oil temperature difference;
  • APT;
  • Generator winding temperature.
In the third phase tests, the old external type TBCS with STHEs was commissioned and compared with the newly installed external type TBCS with PTHE.

3.1. First Stage of the Tests

In the first stage tests, cooling water flow rate is kept constant by fully opening all valves at an average of 660 L/min and six different oil circulation flow rates of 998, 1110, 1195, 1302, 1353, 1411 L/min are obtained by changing the frequency of the pump motor between 30, 35, 39, 43, 48, and 50 Hz. Within the scope of the tests, a six-hour operating interval is examined, where the average bearing temperature is above 70 °C, the average unit power is approximately 144 MW and remains within a certain range.
In all different oil circulation flow rates, the cooling rate in the bearing stabilizes after approximately 120 min (Figure 5a). This shows that the heat released in the bearing (as well as the cooling rate) and the bearing temperatures stabilize in approximately 120 min. Therefore, each test was conducted for at least six hours. In addition, when the cooling rate in the bearing stabilizes, the highest cooling rate is obtained with an average of 275.4 kW and an oil circulation flow rate of 1302 L/min; the lowest cooling rate is provided with an average of 252.6 kW and an oil circulation flow rate of 1411 L/min. With an oil circulation flow rate of 1195 L/min and an oil circulation flow rate of 1411 L/min, almost the same amount of cooling is provided with an approximately 250 kW cooling rate. A similar rate of cooling is provided with approximately 263 kW at oil circulation flow rates of 998 L/min and 1110 L/min (Figure 5b).
The cooling rate gradually decreases until the oil circulation flow rate increases from 998 L/min to 1195 L/min, and the cooling rate suddenly increases when the oil circulation flow rate increases from 1195 L/min to 1302 L/min. The cooling rate gradually decreases until the oil circulation flow rate reaches 1411 L/min from 1302 L/min (Figure 5b). While the lowest average cooling rate (252.6 kW) is obtained at the highest oil circulation flow rate of 1411 L/min, the highest average cooling rate (275.4 kW) is obtained at the oil circulation flow rate of 1302 L/min (Figure 5b). The same cooling rate (~265 kW) is attained at oil circulation flow rates of 1353, 1110, and 998 L/min. In addition, approximately the same rate of cooling is provided at oil circulation flow rates of 1195 L/min and 1411 L/min (the flow rate at which the lowest cooling rate is obtained) (Figure 5b).
As a result, there is no linear relationship between the increase in oil circulation flow rate and the cooling rate. The fluctuation in the cooling rate of the bearing with the increase in oil circulation flow rate exhibits characteristics similar to the changes in local friction and heat transfer coefficients in the flow on a flat plate (Figure 5b). This situation also shows the change in the amount of heat released as a result of friction in the bearing. Therefore, increasing the oil circulation flow rate to 1302 L/min also means an increase in the amount of heat released in the bearing. So, in order to determine the optimum operating condition of the system, pad temperatures, oil inlet–outlet temperature difference and energy consumption of the pumps should be taken into consideration besides the cooling rate.
To prevent the formation of a mixed oil film on the thrust bearing pads, the temperature difference between the oil inlet and outlet of the bearing should not exceed 10 °C. The bearing oil inlet and outlet temperature vary depending on the oil circulation flow rate. Figure 6 illustrates the variation in oil temperature difference based on the oil circulation flow rate. As the oil circulation flow rate increases, the oil inlet temperature of the bearing decreases (Figure 6). Consequently, an inversely proportional relationship is observed between the oil circulation flow rate and the temperature difference of the circulating oil, as expected.
The lowest oil temperature difference of 6.5 °C is obtained at the highest oil circulation flow rate (1411 L/min), while the highest oil temperature difference of 9.5 °C is obtained at the lowest oil circulation flow rate (998 L/min). This situation is due to the decrease in contact time with high temperature surfaces as the oil circulation flow rate increases. However, the change in oil temperature difference with the increase in oil circulation flow rate is not linear. For example, when the oil circulation flow rate increases from 998 L/min to 1110 L/min by 112 L/min, the oil temperature difference changes by approximately 1 °C; when it increases from 1195 L/min to 1302 L/min by 107 L/min, the oil temperature difference changes by only 0.1 °C. Although the oil stays in the bearing for a shorter period at 1302 L/min oil circulation flow rate compared to 1195 L/min, the friction in the bearing increases at 1302 L/min flow rate, causing the oil temperature difference to remain almost unchanged. Therefore, increasing the oil circulation flow rate from 1195 L/min to 1302 L/min negatively affects the performance of the system.
Figure 7 illustrates the variation of the APT depending on the oil circulation flow rate. The lowest APT is obtained at 73.4 °C at the maximum oil flow rate of 1411 L/min, while the highest APT is obtained at 74.8 °C at the minimum oil flow rate of 998 L/min. Approximately the same APT is obtained at oil flow rates of 1302 L/min (74.3 °C) and 1195 L/min (74.1 °C).
As a result, when the oil circulation flow rate of 998 L/min is increased by 41% to 1411 L/min (the highest capacity of the pump), a limited reduction of a maximum of 1.4 °C in the APT can be achieved. Consequently, maintaining the oil flow rate at 1195 L/min with a constant water flow rate proves to be more optimal, demonstrating efficacy in both diminishing the released heat quantity and facilitating the circulation of low-viscosity oil within the bearing. Moreover, a value close to the minimum pad temperature (73.4 °C) achieved with an oil circulation flow rate of 1411 L/min can be reached with a flow rate of approximately 15% lower at 1195 L/min. In this way, a similar amount of cooling can be achieved with oil circulation pumps with lower energy consumption. In this way, the system’s energy consumption can be reduced and its efficiency can be increased.

3.2. Second Stage of the Tests

In the second stage tests, cooling water flow rate is adjusted by a proportional control valve between 580–660 L/min; three different oil circulation flow rates of 1110, 1195, and 1411 L/min are obtained by changing the frequency of the pump motor between 35, 39, and 50 Hz, and 3 different unit power of 145.9, 146.1, and 150.1 MW is adjusted. Within the scope of the tests, a six-hour operating interval is examined, where the average bearing temperature is above 70 °C. The second stage test conditions and results are presented in Table 2.
The amount of cooling water can be adjusted with the proportional valve located at the inlet of the new TBCS with PTHEs. In this way, the effect of the cooling water change on the new TBCS performance and APT can be examined.
In tests 4, 5, and 6 (Table 2), the unit power was kept constant at 150.1 MW and the cooling water flow rate was kept constant at 580 L/min. The following results were obtained as a result of the study.
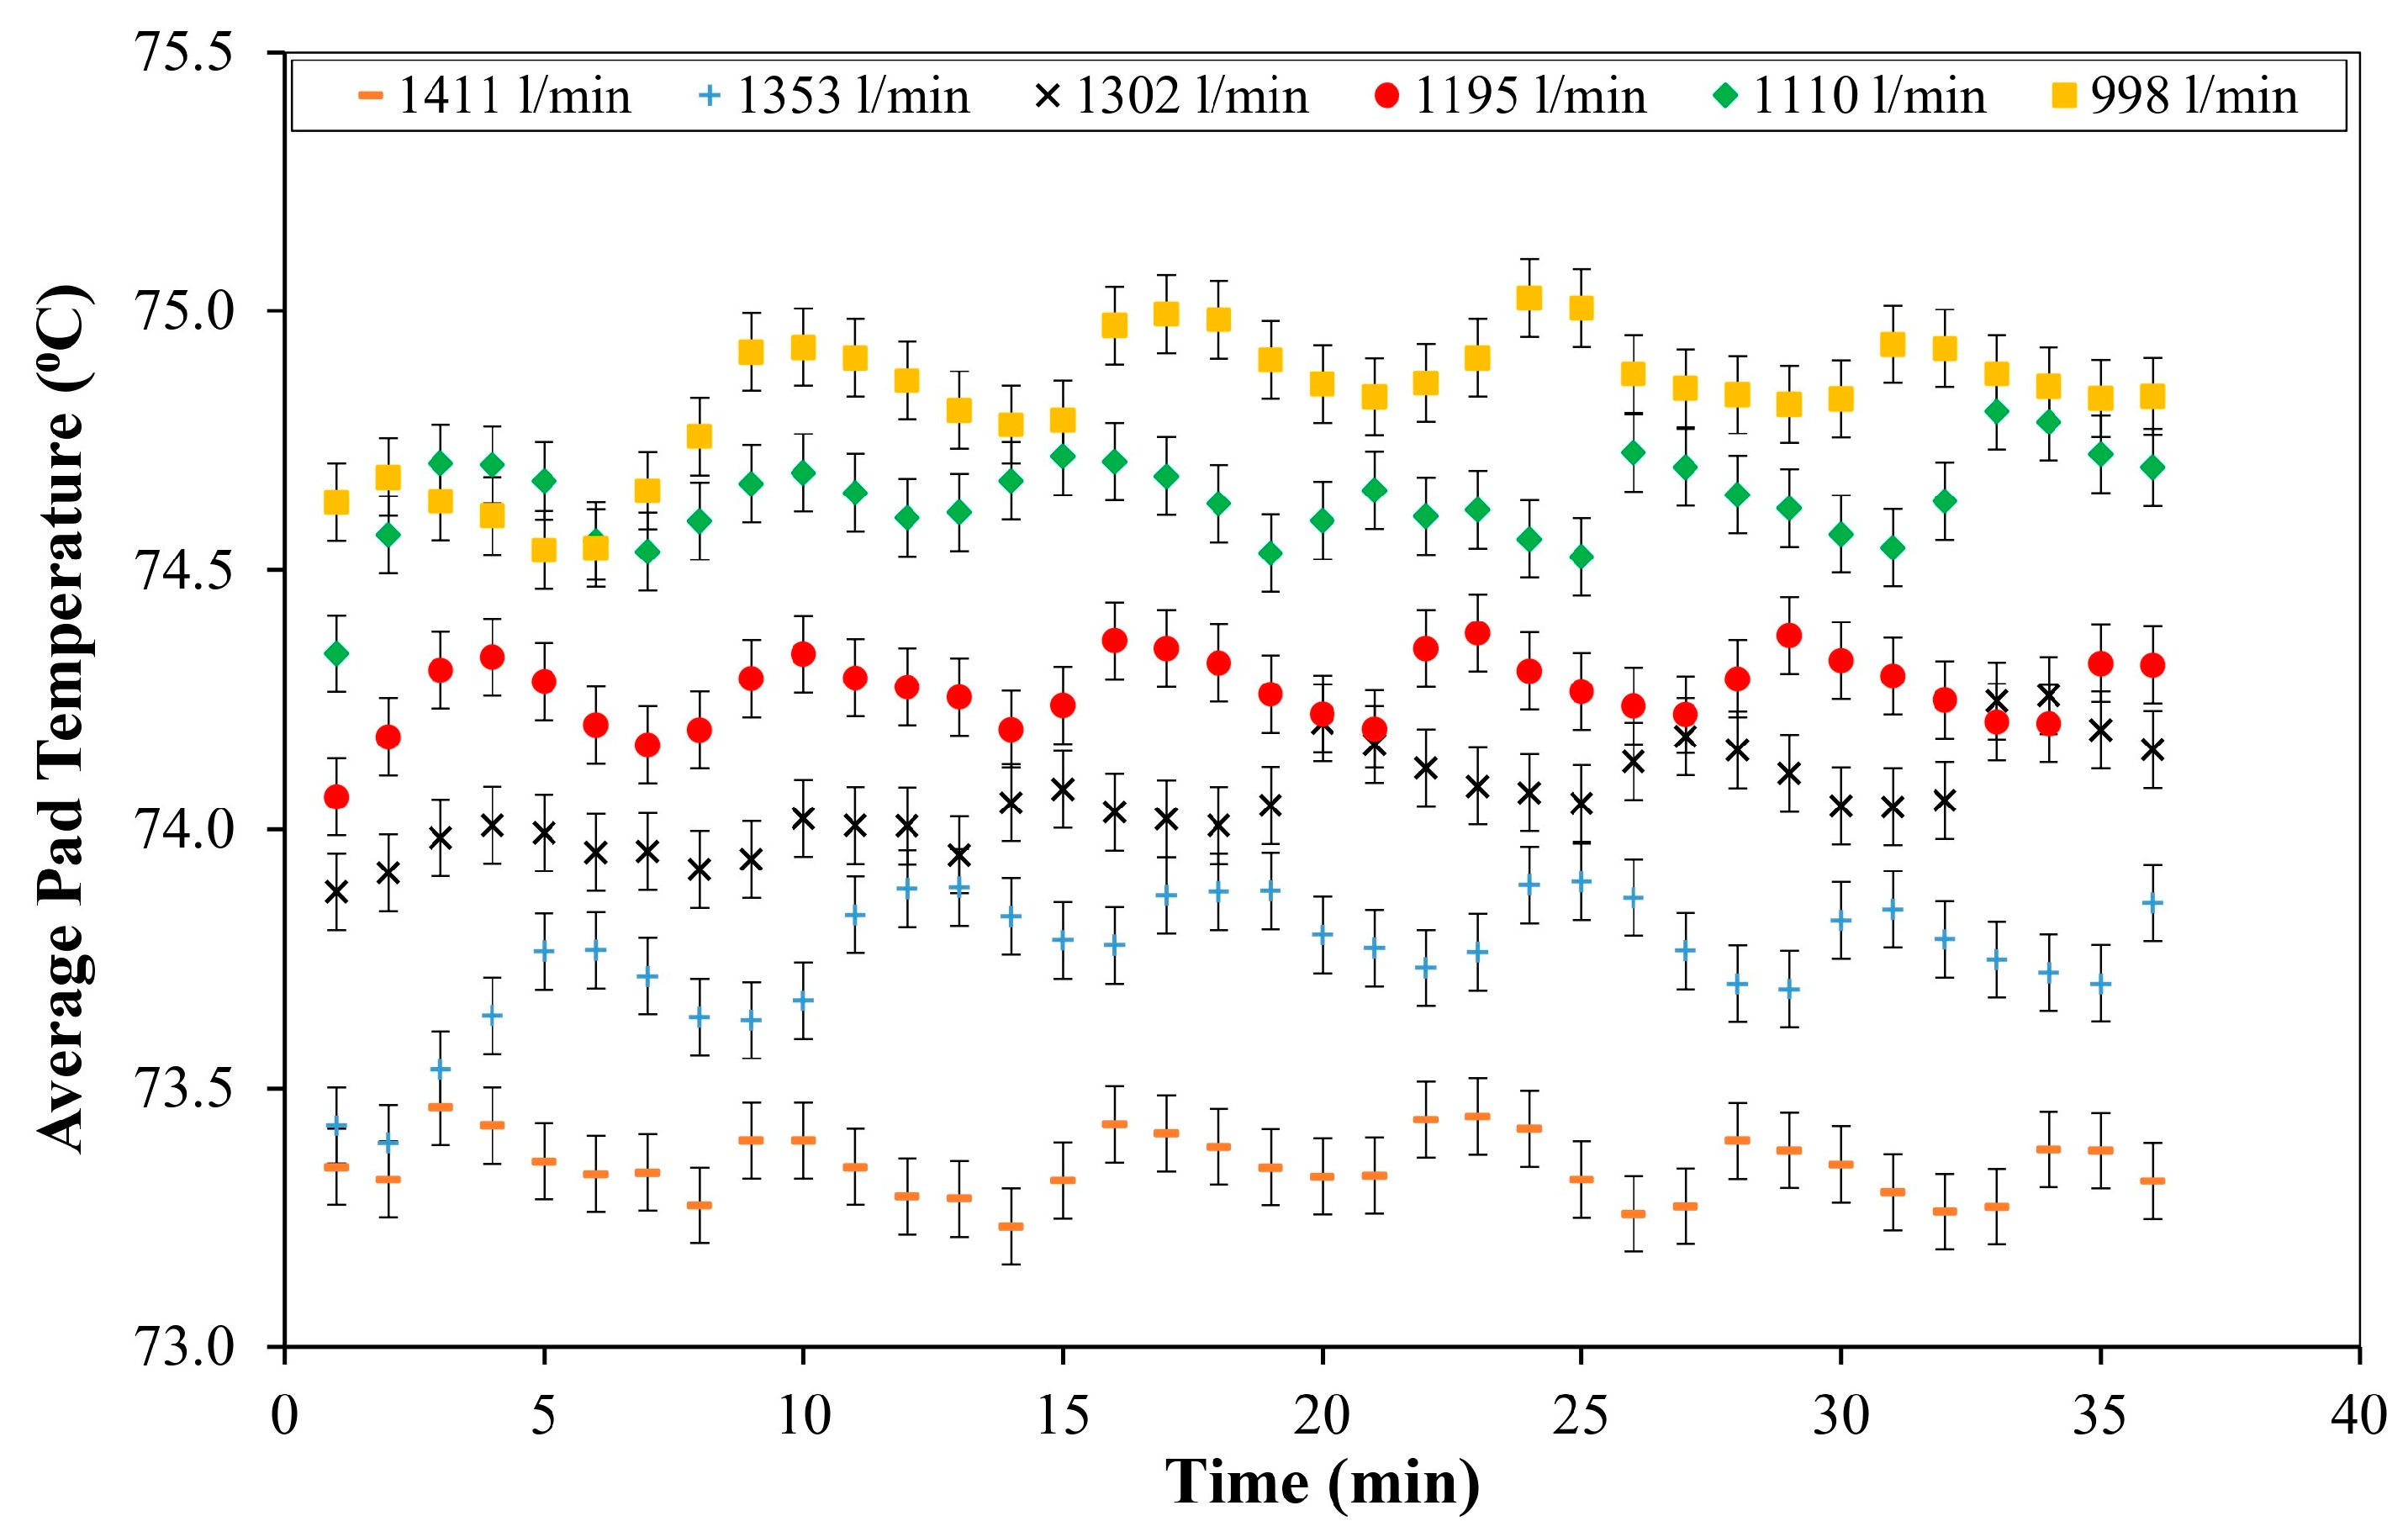
  • At 1110, 1195, and 1411 L/min oil flow rate, APT is 75.4 °C to 75.2 °C and 74.6 °C, respectively.
  • When the oil circulation flow rate was increased from 1110 to 1195 (7.7% increase) and 1411 L/min (21% increase), the APT decreased by 0.2 °C (0.27% decrease) and 0.8 °C (1.1% decrease), respectively.
  • Oil inlet temperature of the bearing is almost unchanged at ~25.8 °C because of high efficiency of PTHE and increasing heat transfer coefficient by increasing oil flow rate, causing the oil temperature at the exchanger outlet to be similar.
  • At 1110, 1195, and 1411 L/min oil flow rate, the oil outlet temperature is 33.8 °C, 32.9 °C, and 32.1 °C, respectively. This situation shows that the PTHEs used in the new TBCS can provide sufficient cooling even when the water flow rate decreases and the increase in the oil circulation flow rate is effective in reducing the APT and the temperature of the oil leaving the bearing.
  • The unit increase in oil circulation flow rate causes a decrease of approximately 0.0025 °C in the APT.
In tests 3 and 4 (Table 2), the unit power was kept constant at 150.1 MW, the oil circulation flow rate was kept constant at 1110 L/min, and the cooling water flow rate was reduced from 608 to 580 L/min. The following results were obtained as a result of the study.
  • When the water circulation flow rate was reduced from 608 to 580 L/min, the APT increased from 75.3 to 75.4 (0.2 °C and 0.27%).
  • The unit decrease in the cooling water flow rate caused an increase of approximately 0.007 °C in the APT.
In tests 1 and 4 (Table 2), the oil circulation flow rate was kept constant at 1110 L/min, the unit power was increased from 145.9 to 150.1 MW, and the oil circulation was decreased from 660 to 580 L/min. The following results were obtained as a result of the study.
  • Since the unit decrease in water flow rate increased the APT by approximately 0.007 °C, an increase of approximately 0.57 °C occurred in the APT in addition to the increase caused by the decrease in water flow rate.
  • The APT also increases with the increase in unit power and this increase is approximately 0.008 °C per megawatt.
In tests 1, 2, and 4 (Table 2), the average unit power elevated from 145.9 MW to 146.1 MW and 150.1 MW, and cooling water flow rate decreased from 660 to 620 and 608 with a constant oil circulation flow rate of 1100 L/min. The following results were obtained as a result of the study.
  • APT underwent an incremental rise from 74.8 °C (at 145.9 MW) to 74.9 °C (at 146.1 MW) and 75.2 °C (at 150.1 MW). Concurrently, the maximum winding temperature ascended to 95.3 °C, 95.7 °C, and 99.6 °C, respectively.
  • Despite the decrease in water flow rate (40 and 52 L/min) to the new TBCS with PTHE and the unit power’s approximate 4 MW augmentation, no substantial increase in APTs was noted (0.4 °C increase).
  • The increase in unit power also increases the winding temperatures. Each megawatt increase in unit power increases the maximum winding temperature by approximately 1.1 °C.
As a result, unit change in APT is most sensitive to unit power, followed by cooling water flow rate which is least sensitive to oil circulation flow rate. On the other hand, unit change in these three parameters causes close changes in APT. Generator winding temperature is the parameter most affected by unit power change in the unit and unit power change causes approximately unit temperature change.

3.3. Third Stage of the Tests

Within the scope of the study, sensors were installed to measure the pressure, temperature, and flow rate of the water, and temperature of the oil entering and leaving the original TBCS with STHEs. The data obtained from these sensors were recorded by the new automation system. In the third stage tests, the original TBCS with STHEs was reactivated and compared with the newly installed TBCS with PTHEs (Table 3). During the tests the unit operated at approximately 144 MW.
Comparing the old TBCS with the new TBCS:
  • The cooling rate in the old and new systems is approximately the same;
  • Approximately twice as much cooling water is used to provide the same amount of cooling as the old TBCS with STHEs;
  • The APT is 1.7 °C higher, the oil temperature difference is 1 °C and the average winding temperature is 1.3 °C higher when the old TBCS is used;
  • The temperature of the oil entering and leaving the old cooling system is approximately 4 °C higher than in the new system;
  • The oil temperature difference in the old cooling system is approximately 1 °C higher than in the new system;
  • The PTHEs used in the new system have much higher performance than the STHEs in the old system;
  • Thanks to the low water consumption in the new system, more cooling water is supplied to the generator winding cooling system and the maximum winding temperature is 1.3 °C lower.
In this study, only the cooling system was changed without any structural changes in the existing axial bearing. As a result, a limited decrease in APT (1.7 °C) can be achieved with the new external type TBCS with PTHEs. In a similar study conducted at Porąbka Żar Power Plant, the pad temperature was reduced by 6 °C compared to the old internal type TBCS system thanks to the newly installed external type TBCS with PTHE. However, the main reason for this decrease in pad temperatures is the seasonal change of the cooling water temperature used in the plant by 8 °C [19,31]. Since the heat exchangers used in the old system were of low efficiency, the cooling water temperature was affected by the change. In the power plant examined within the scope of this study, unlike Porąbka Żar Power Plant, the cooling water temperature almost does not change throughout the year. In the study conducted by Bhat et al., the cooling water pipes were placed inside the pads with structural changes, and the maximum pad temperature was reduced by 14 °C [34]. Similarly, in the studies conducted by Najar and Harmain, it was reported that the temperature could be significantly reduced by placing the cooling pipes inside the pad [32,33]. While the cooling water pipes placed inside the pads are advantageous in terms of reducing the pad temperature, they are disadvantageous in terms of the risk of water leakage. As a result, in order to achieve a further reduction in APT in the power plant examined within the scope of the study, structural changes such as changing the bearing design, number of pads, and pad coating material should be made. The external TBCS with PTHEs used within the scope of this study contributes to the reduction of APT, albeit limited. On the other hand, it has a more complex structure than the existing pumpless system and causes additional energy consumption due to oil circulation pumps.

3.4. Error Analysis

The parameters used in error analysis are divided into two as those measured directly and those obtained indirectly by calculation. In this study, the flow meter used to calculate the cooling amount has an accuracy of ± 1%, while the temperature sensors have an accuracy of ±0.1%. The fixed amount of error (uncertainty) for these parameters can be calculated in the below equation [36] by Pythagorean theorem and the results with parameters are presented in Table 4;
R = R (x1, x2, x3, …, xn),
w R = R x 1 w 1 2 + R x 2 w 2 2 + + R x n w n 2 ,
where R is the investigated parameter; x1, x2 to xn refer to the parameters recorded directly and w1, w2 to wn are the error parameters corresponding to x1, x2 to xn, respectively.
The error analysis and measurement uncertainties performed by taking into account the measurement accuracy of the sensors used in the study are presented in Table 2. As a result of the calculation, the lowest measurement uncertainty was calculated as ±1.11 kW and ±0.0038% at 998 L/min oil flow rate, while the highest measurement uncertainty was calculated as ±1.41 kW and ±0.0056% at 1411 L/min oil flow rate. As a result, since values well below 1% were obtained even at the highest measurement uncertainty, it is seen that the measurement accuracy of the sensors used in the study is at a sufficient level and allows the measurement results to be evaluated objectively. In the temperature measurements, the maximum error in the highest temperature value measured is ±0.075 °C. Therefore, it is at a level that will not affect the evaluations made after the measurements and calculations.

4. Conclusions

In this study, replacing the external TBCS with STHEs in a hydraulic unit with an external TBCS with PTHEs and the effects of parameters—such as oil circulation flow rate, cooling water flow rate, and unit power—on the cooling rate, APT, oil temperature difference, and generator winding temperature were investigated experimentally. It was found that there is no linear relationship between the increase in oil circulation flow rate and the cooling rate, oil temperature difference and the APT can be reduced by increasing the oil circulation flow rate. However, even if the oil circulation flow rate is increased from 998 L/min (APT is 74.8 °C) to the highest capacity of the pump, 1411 L/min (41% increase and APT is 73.4 °C), a limited decrease of maximum 1.4 °C in the APT (minimum 73.4 °C) can be achieved.
Considering the cooling rate (amount of heat released in the bearing) and the energy consumption of the oil circulation pump, the optimum oil flow rate is 1195 L/min, which provides approximately the same cooling rate as the highest oil circulation flow rate (1411 L/min).
Unit changes in unit power, cooling water flow rate, and oil circulation flow rate affect the change in APT in similar amounts. On the other hand, generator winding temperature is the parameter most affected by the unit power change in the unit.
Reducing the bearing cooling water flow rate by approximately 10% does not significantly increase the temperature of the oil entering the bearing, whereas increasing the power in the unit increases the APT and the winding temperature and increasing the oil circulation flow rate decreases the pad temperature and oil outlet temperature.
In the plant where the study was conducted, the cooling water temperature does not change seasonally (8 °C change in a similar study in the literature) and when the new external TBCS with PTHE was used instead of the old external TBCS with SHTE without any structural changes in the existing bearing, a maximum decrease of 1.7 °C in APT was achieved (6 °C decrease was achieved in a similar study in the literature [19,31]). In different studies, it was observed that decreases of up to 14 °C [34] in APT could be achieved with structural changes in the bearing. Therefore, structural changes should be made in the bearing to further reduce the APT in the existing plant. Although a limited decrease in APT could be achieved with the newly installed external type TBCS with PTHEs, there are some disadvantages such as the complex structure of the new system and additional energy consumption of the oil circulation pumps.
It was observed that the measurement precision of the sensors used in the study was at a sufficient level and caused an error of ±0.01% and a measurement uncertainty of ±0.0056% in the measurements and calculations.
In order to determine the relationship between oil filtration and pad deformation, a long-term study (at least one year) is required and is a subject that can be examined as a separate study.
The impact of maintaining clean bearings through oil filtration on pad deformation could not be definitively ascertained in the short-term, necessitating long-term observation. The absence of zebra mussels is noted in the new system with ongoing scrutiny required for long-term assessment.
In a separate study, relations can be developed to calculate the APT and cooling rate of bearing using parameters such as cooling water temperature, oil circulation flow rate, and unit power.

Author Contributions

Conceptualization, D.G. and M.S.Ç.; methodology, M.S.Ç. and D.G.; software, D.G.; validation, M.S.Ç. and D.G.; formal analysis, M.S.Ç.; investigation, M.S.Ç. and D.G.; resources, M.S.Ç. and D.G.; data curation, M.S.Ç.; writing—original draft preparation, M.S.Ç.; writing—review and editing, D.G.; visualization, D.G.; supervision, D.G.; project administration, D.G.; funding acquisition, D.G. All authors have read and agreed to the published version of the manuscript.

Funding

This research is supported by the project “Development of Control Systems for Keban HEPP” numbered 5172804.

Data Availability Statement

The original contributions presented in this study are included in the article. Further inquiries can be directed to the corresponding author.

Acknowledgments

This research is conducted at Scientific and Technological Research Council of Türkiye (TUBITAK) Marmara Research Center (MRC) Energy Technologies Division. The authors would like to kindly thank TUBITAK MRC.

Conflicts of Interest

We confirm that this manuscript is original, has not been previously published, and is not under consideration for publication elsewhere. We acknowledge that the corresponding author is the primary point of contact for the editorial process, responsible for communicating with the co-authors regarding the manuscript’s progress, submission of revisions, and final approval of proofs. Additionally, we declare that there are no conflicts of interest related to this manuscript.

Abbreviations

The following abbreviations are used in this manuscript:
TBCSthrust bearing cooling system
GWGigawatts
STHEsShell-and-tube heat exchangers
PTHEsPlate-type heat exchangers
APTAverage pad temperature

References

  1. Zhao, Y.; Yang, C.; Shi, G.; Xu, Y.; Mei, X.; Yan, D.; Lowell, Z. From order to reorder: Assessment of the living environment of hydropower resettlement for just energy transition in China. Energy Rep. 2024, 11, 5668–5681. [Google Scholar] [CrossRef]
  2. Yu, P.S.; Yang, T.C.; Kuo, C.M.; Chou, J.C.; Tseng, H.W. Climate change impacts on reservoir inflows and subsequent hydroelectric power generation for cascaded hydropower plants. Hydrol. Sci. J. 2014, 59, 1196–1212. [Google Scholar] [CrossRef]
  3. Aryal, S.; Ghimire, S.; Tiwari, S.; Baaniya, Y.; Pandey, V.P. Evolution and future prospects of hydropower sector in Nepal: A review. Heliyon 2024, 10, e31139. [Google Scholar] [CrossRef] [PubMed]
  4. Liu, B.; Yang, Z.; Chen, Y.; Li, L.; Chen, S. A decision-making framework for scheme selection for sustainable hydropower development. Int. J. Green Energy 2021, 18, 951–965. [Google Scholar] [CrossRef]
  5. Kazantsev, Y.; Kornilovich, D.V.D.V.; Khalyasmaa, A.I.; Arhipov, A.A.; Miklukhin, A.V.; Sergievichev, L.Y.; Tsuran, M.V. Novel technologies for optimization of hydroelectric power plants with hydrogen energy storage system. Int. J. Hydrogen Energy 2024, 96, 952–961. [Google Scholar] [CrossRef]
  6. Pereira da Silva, P.; Horta, P. The effect of variable renewable energy sources on electricity price volatility: The case of the Iberian market. Int. J. Sustain. Energy 2019, 38, 794–813. [Google Scholar] [CrossRef]
  7. He, M.; Han, S.; Chen, D.; Zhao, Z.; Jurasz, J.; Mahmud, M.A.; Deng, M. Optimizing Cascade Hydropower-VRE Hybrid Systems: A Novel Approach Addressing Whole-Process Vibration to Enhance Operational Safety. Energy 2024, 304, 131965. [Google Scholar] [CrossRef]
  8. Salkuti, S.R. Multi-objective-based optimal transmission switching and demand response for managing congestion in hybrid power systems. Int. J. Green Energy 2020, 17, 457–466. [Google Scholar] [CrossRef]
  9. Aljafari, B.; Pamshetti, V.B.; Thanikanti, S.B. Maximizing techno-economic-environmental benefits of renewable energy allocation with smart inverter in distribution system: A two-layer stochastic optimization framework. Int. J. Green Energy 2023, 1–18. [Google Scholar] [CrossRef]
  10. Cheng, Q.; Liu, P.; Feng, M.; Cheng, L.; Ming, B.; Luo, X.; Xia, J. Complementary operation with wind and photovoltaic power induces the decrease in hydropower efficiency. Appl. Energy 2023, 339, 121006. [Google Scholar] [CrossRef]
  11. Fillon, M.; Wodtke, M.; Wasilczuk, M. Effect of presence of lifting pocket on the THD performance of a large tilting-pad thrust bearing. Friction 2015, 3, 266–274. [Google Scholar] [CrossRef]
  12. Pajączkowski, P.; Schubert, A.; Wasilczuk, M.; Wodtke, M. Simulation of large thrust-bearing performance at transient states, warm and cold start-up. Proc. Inst. Mech. Eng. Part J J. Eng. Tribol. 2014, 228, 96–103. [Google Scholar] [CrossRef]
  13. Ji, Z.; Shi, Y.; Da, X.; Cao, J.; Gong, Q.; Wang, Z.; Huang, X. Influence of installation deviation of thrust bearing on oil film flow of 1000 MW hydraulic turbine unit. Water 2023, 15, 1649. [Google Scholar] [CrossRef]
  14. Wodtke, M.; Schubert, A.; Fillon, M.; Wasilczuk, M.; Pajączkowski, P. Large hydrodynamic thrust bearing: Comparison of the calculations and measurements. Proceedings of the Institution of Mechanical Engineers. Part J J. Eng. Tribol. 2014, 228, 974–983. [Google Scholar] [CrossRef]
  15. Sedlář, M.; Abrahámek, P. Numerical Analysis of Oil Lubrication and Cooling of Roller Thrust Bearing in High-Performance Mixed-Flow Pump. Energies 2023, 16, 6890. [Google Scholar] [CrossRef]
  16. Dąbrowski, L.; Wasilczuk, M. Evaluation of water turbine hydrodynamic thrust bearing performance on the basis of thermoelastohydrodynamic calculations and operational data. Proc. Inst. Mech. Eng. Part J J. Eng. Tribol. 2004, 218, 413–421. [Google Scholar] [CrossRef]
  17. Kingsbury, I. A General Guide to the Principles, Operation and Troubleshooting of: Hydrodynamic Bearings; Publication HB: Philadelphia, PA, USA, 2016; p. 10. [Google Scholar]
  18. Liu, H.; Yu, Q.; Tan, Y.; Xu, W.; Huang, B.; Xie, Z.; Mao, J. Feasibility study on temperature distribution measurement method of thrust sliding bearing bush based on FBG quasi-distributed sensing. Sensors 2019, 19, 3245. [Google Scholar] [CrossRef] [PubMed]
  19. Wasilczuk, M. Friction and lubrication of large tilting-pad thrust bearings. Lubricants 2015, 3, 164–180. [Google Scholar] [CrossRef]
  20. Liming, Z.; Yongyao, L.; Zhengwei, W.; Xin, L.; Yexiang, X. A review on the large tilting pad thrust bearings in the hydropower units. Renew. Sustain. Energy Rev. 2017, 69, 1182–1198. [Google Scholar] [CrossRef]
  21. Glavatskih, S.B.; Fillon, M. TEHD analysis of thrust bearings with PTFE-faced pads. J. Tribol. 2006, 128, 49–58. [Google Scholar] [CrossRef]
  22. Zhou, J.; Blair, B.; Argires, J.; Pitsch, D. Experimental performance study of a high speed oil lubricated polymer thrust bearing. Lubricants 2015, 3, 3–13. [Google Scholar] [CrossRef]
  23. Mottershead, G.; Bomben, S.; Kerszenbaum, I.; Klempner, G. Handbook of Large Hydro Generators: Operation and Maintenance; John Wiley & Sons: Hoboken, NJ, USA, 2020; p. 76. [Google Scholar]
  24. Bahiraei, M.; Naseri, M.; Monavari, A. A second law analysis on flow of a nanofluid in a shell-and-tube heat exchanger equipped with new unilateral ladder type helical baffles. Powder Technol. 2021, 394, 234–249. [Google Scholar] [CrossRef]
  25. Panday, N.K.; Singh, S.N. Study of thermo-hydraulic performance of chevron type plate heat exchanger with wire inserts in the channel. Int. J. Therm. Sci. 2022, 173, 107360. [Google Scholar] [CrossRef]
  26. Mohammadi, K.; Heidemann, W.; Müller-Steinhagen, H. Numerical investigation of the effect of baffle orientation on heat transfer and pressure drop in a shell and tube heat exchanger with leakage flows. Heat Transf. Eng. 2009, 30, 1123–1135. [Google Scholar] [CrossRef]
  27. Wang, Q.; Chen, G.; Chen, Q.; Zeng, M. Review of Improvements on Shell-and-Tube Heat Exchangers with Helical Baffles. Heat Transf. Eng. 2010, 31, 836–853. [Google Scholar] [CrossRef]
  28. Lin, W.; Zhang, W.; Ling, Z.; Fang, X.; Zhang, Z. Experimental study of the thermal performance of a novel plate type heat exchanger with phase change material. Appl. Therm. Eng. 2020, 178, 115630. [Google Scholar] [CrossRef]
  29. Jegla, Z.; Stehlik, P.; Kohoutek, J. Alternative approach in optimization of plate type heat exchangers. Heat Transf. Eng. 2004, 25, 6–15. [Google Scholar] [CrossRef]
  30. Hamedi, H.; Setayeshfar, B.; Sadat, M.; Farshidianfar, A.; Mahvan, A.; Asadi, M. Experimental and numerical analysis of the thermo-hydraulic performance of a cross-flow air-to-gas capsule-type plate heat exchanger. Appl. Therm. Eng. 2024, 236, 121900. [Google Scholar] [CrossRef]
  31. Dąbrowski, L.; Wasilczuk, M.; Lewandowski, S. Field tests of a thrust bearing of a pump-turbine—Analysis of the time of hydrostatic pump operation on bearing properties—In Polish. Tribologia. 2002, 181, 185–200. [Google Scholar]
  32. Najar, F.A.; Harmain, G.A. Novel approach towards thrust bearing pad cooling. In Gas Turbine India Conference; American Society of Mechanical Engineers: New Delhi, India, 2014; Volume 49644, p. V001T06A004. [Google Scholar]
  33. Najar, F.A.; Harmain, G.A. Thermal effects for conventional and water-cooled thrust bearing using finite difference method: Comparative analysis. Int. J. Precis. Technol. 2015, 5, 14–26. [Google Scholar] [CrossRef]
  34. Bhat, J.A.; Harmain, G.A.; Najar, F.A. Alleviating thermal challenges in hydrodynamic bearings: A novel approach through thrust bearing pads with embedded cooling circuitry and deep recess. Tribol. Int. 2024, 194, 109438. [Google Scholar] [CrossRef]
  35. Cengel, Y.A.; Afshin, J.G. Heat and Mass Transfer: Fundamentals and Applications, 6th ed.; Chapter 1 Introduction and Basics Concepts; McGraw-Hill Education: New York, NY, USA, 2020. [Google Scholar]
  36. Jamali, R.; Sohani, A.; Hemmatpour, K.; Behrang, M.; Ghobeity, A. Experimental study of pressure pulsation in a large-scale hydropower plant with Francis turbine units and a common penstock. Energy Convers. Manag. X 2022, 16, 100308. [Google Scholar] [CrossRef]
Figure 1. (a) Thrust bearing pad and STHEs location, (b) pads, (c) original STHE.
Water 17 00795 g001
Figure 2. 3D model of the original (left) and the newly installed (right) thrust bearing.
Water 17 00795 g002
Figure 3. Newly installed external type TBCS with PTHEs.
Water 17 00795 g003
Figure 4. Diagram of thrust bearing cooling system.
Water 17 00795 g004
Figure 5. (a) Variation of cooling rate depending on time at different oil circulation flow rates and constant water flow rate; (b) variation of average cooling rate depending on oil circulation flow rates.
Water 17 00795 g005
Figure 6. Variation of oil temperature difference depending on oil circulation flow rate.
Water 17 00795 g006
Figure 7. Variation of APT depending on oil circulation flow rate.
Water 17 00795 g007
Table 1. List of sensors.
Sensor Type Location of the Sensor Number
Pressure gaugeCooling water system-main inlet1
Pressure gaugeGenerator air cooler-main inlet1
Pressure gaugeGenerator air cooler-main outlet1
Pressure gaugeCooling water system-thrust bearing main outlet1
Temperature sensorGenerator air cooler-main inlet1
Temperature sensorGenerator air cooler-main outlet1
Temperature sensorCooling water system-thrust bearing main outlet1
Temperature sensorGenerator air cooler radiators-cooling water outlets6
(1 per radiator)
Temperature sensorGenerator cooling system radiators-air inlet and outlet12
Temperature sensorNew heat exchangers-main oil inlet1
Temperature sensorNew heat exchangers-main oil outlet1
Temperature sensorOriginal heat exchangers-oil inlets2
Temperature sensorOriginal heat exchangers-oil outlets2
Temperature sensorThrust bearing pads10
(1 per pad)
FlowmeterNew cooling system-oil main inlet1
FlowmeterNew cooling system-water main inlet1
FlowmeterOriginal cooling system-water main inlet1
Table 2. Second stage test conditions and results.
No.Pave
(MW)
V ˙ w a t e r
(L/min)
V ˙ o i l
(L/min)
Toil,in
(°C)
Toil,out
(°C)
∆T
(°C)
Q ˙
(kW)
Tave,pad
(°C)
Tmax,wind
(°C)
1145.9660111025.533.58.1244.574.895.3
2146.1620111025.733.78245.774.995.7
3150.1608111025.633.78.1240.975.299.6
4580111025.833.87.2243.475.499.8
5580119525.832.97.2238.475.2100.2
6580141125.632.16.3245.574.6100.2
Pave—Average unit load, V ˙ w a t e r —Water flow rate, V ˙ o i l —Oil flow rate, Toil,in—Oil inlet temperature, Toil,out—Oil outlet temperature, ∆T—Oil temperature difference, Q ˙ —Cooling rate, Tave,pad—APT, Tmax,wind—Maximum winding temperature.
Table 3. Third stage test conditions and results.
NamePave
(MW)
V ˙ w a t e r
(L/min)
Toil,in
(°C)
Toil,out
(°C)
∆T
(°C)
Q ˙
(kW)
Tave,pad
(°C)
Tmax,wind
(°C)
New14466022.629.16.5244.573.495.2
Orj.131726.534.07.5247.575.196.5
Pave—Average unit load, V ˙ w a t e r —Water flow rate, Toil,in—Oil inlet temperature, Toil,out—Oil outlet temperature, ∆T—Oil temperature difference, Q ˙ —Cooling rate, Tave,pad—APT, Tmax,wind—Maximum winding temperature.
Table 4. Uncertainty analysis calculation parameters and results.
V ˙ o i l Q ˙ ω
L/min kW kW%
1411252.6±1.41±0.0056
1353267.7±1.35±0.0051
1302275.4±1.30±0.0048
1195255.1±1.20±0.0047
1110263.2±1.11±0.0042
998263.1±1.11±0.0038
V ˙ o i l —Oil flow rate, Q ˙ —Cooling rate, ω—Uncertainty, %ω—Percentage of uncertainty.
Disclaimer/Publisher’s Note: The statements, opinions and data contained in all publications are solely those of the individual author(s) and contributor(s) and not of MDPI and/or the editor(s). MDPI and/or the editor(s) disclaim responsibility for any injury to people or property resulting from any ideas, methods, instructions or products referred to in the content.

