


Analyzing the Source of Sulfate in Karst Groundwater Based on a Bayesian Stable Isotope Mixing Model: A Case Study of Xujiagou Spring Area, Northern China

Abstract
1. Introduction
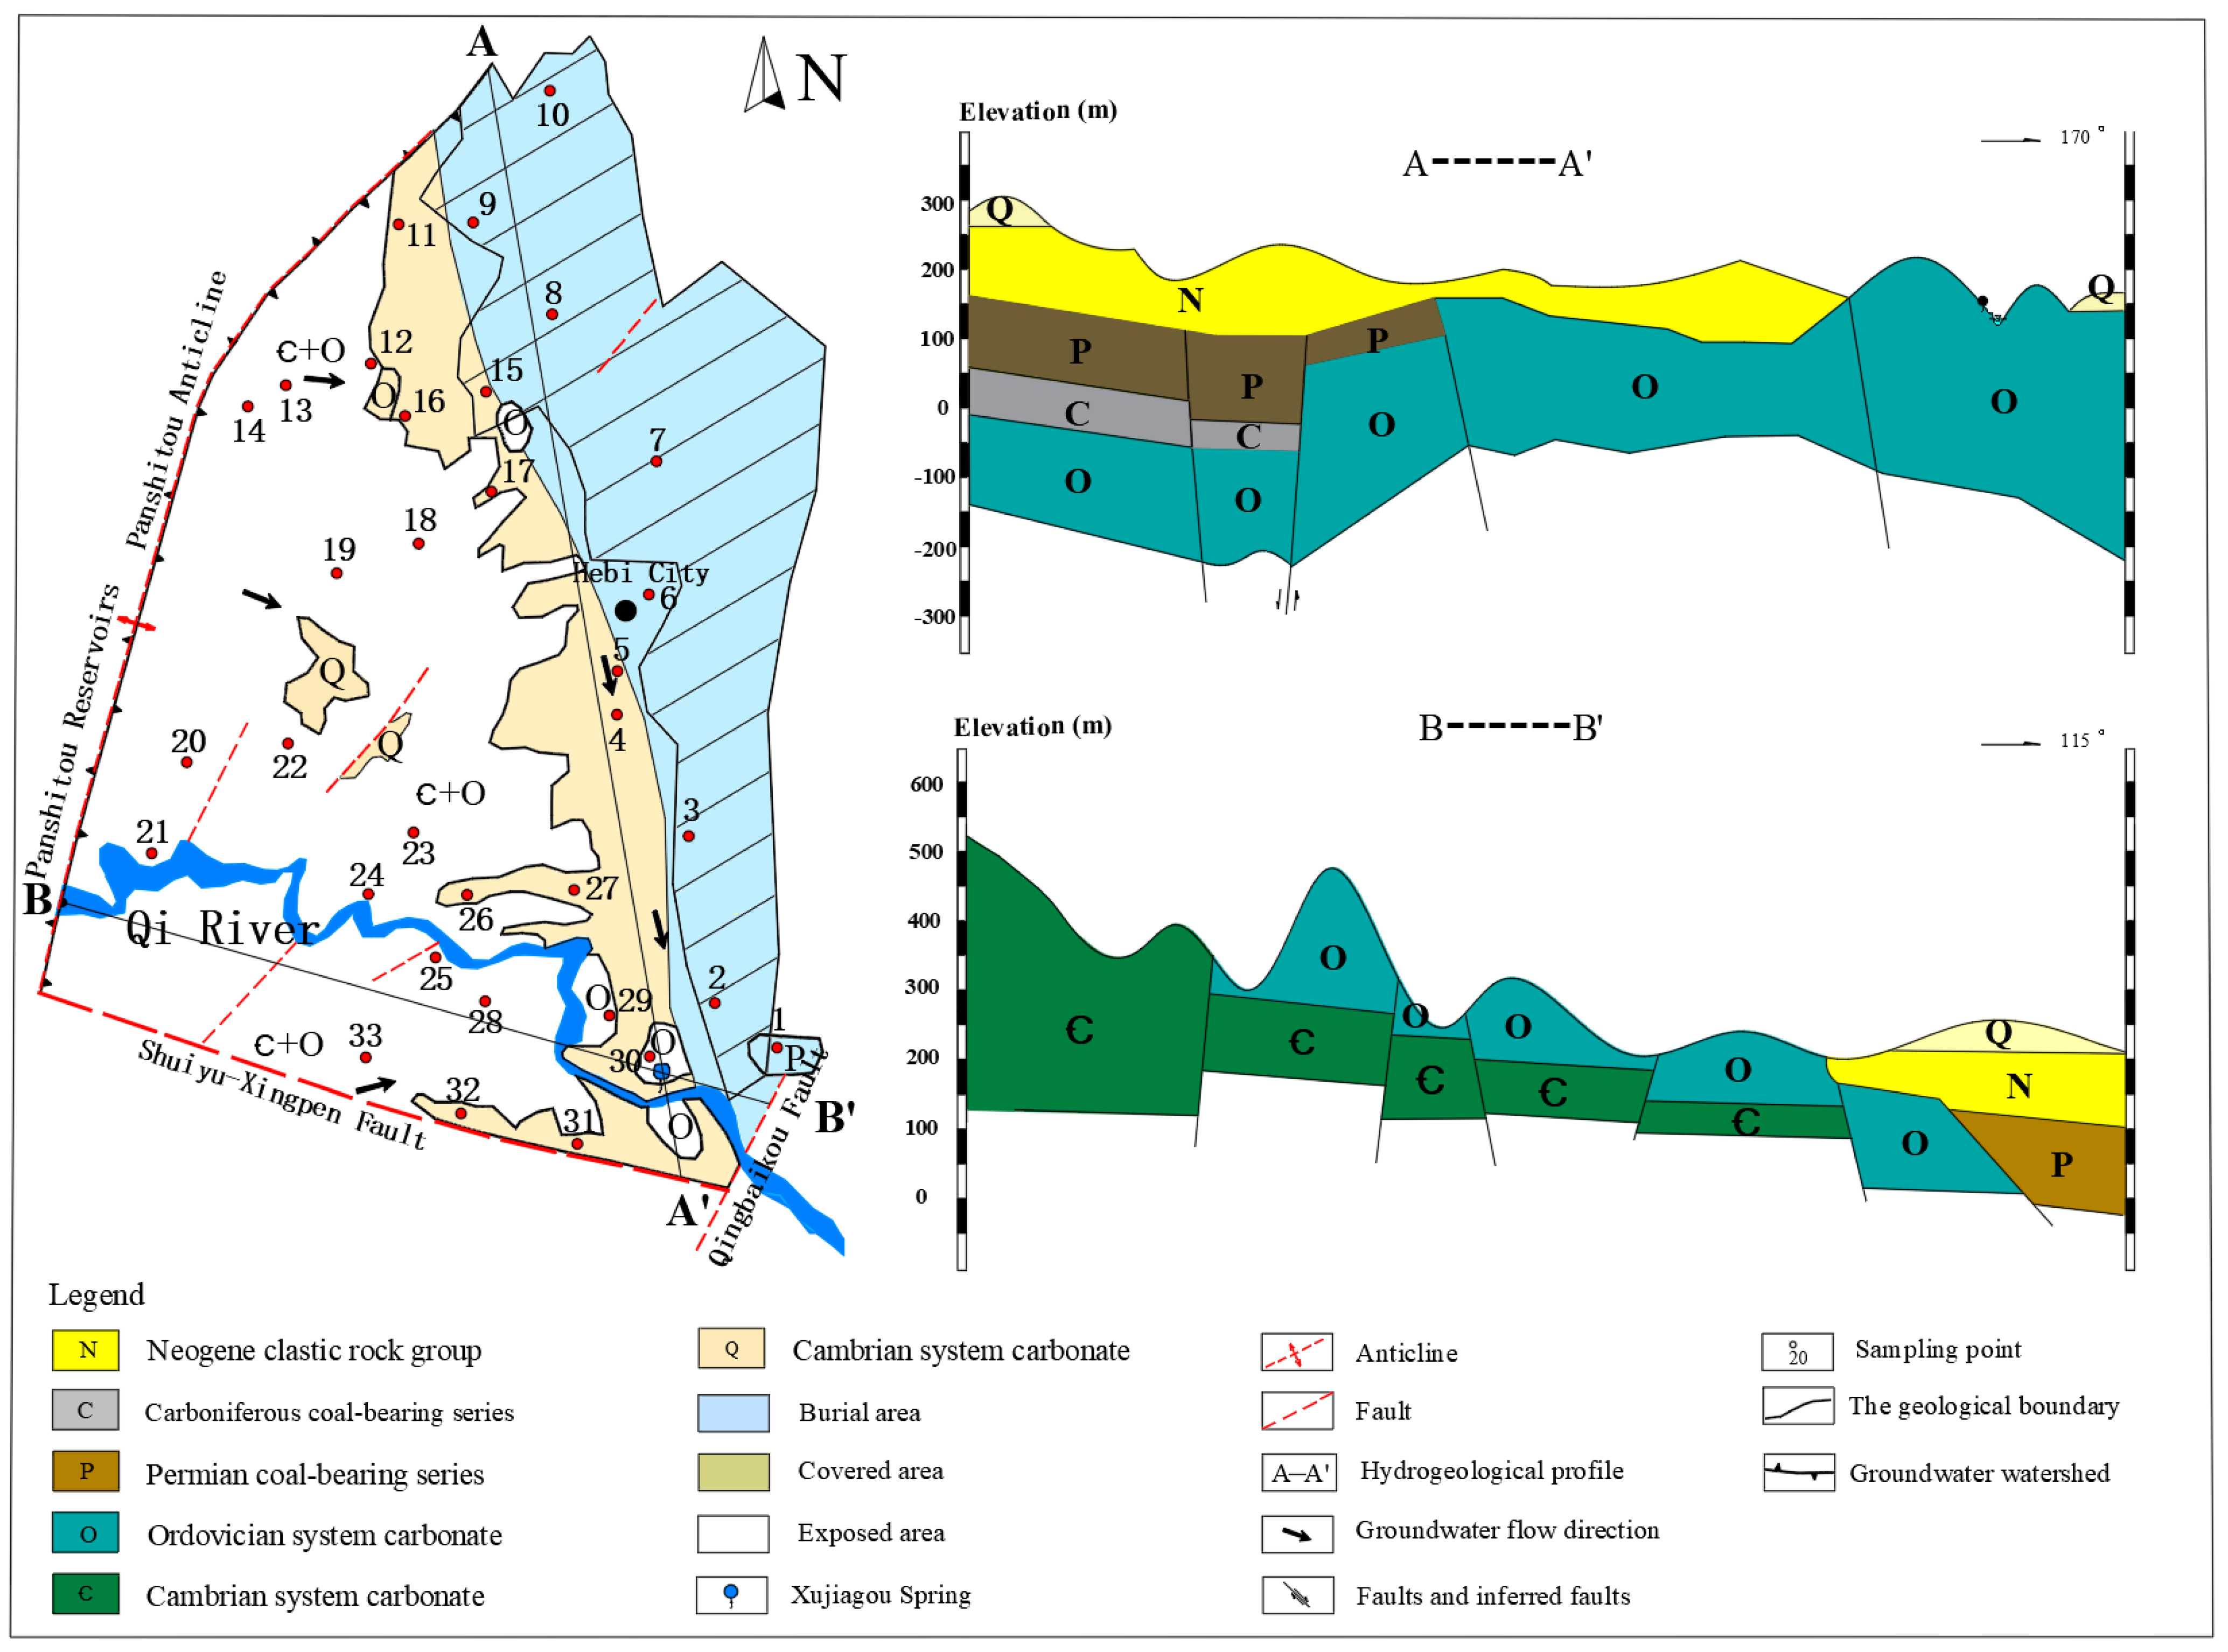
2. Study Area
3. Materials and Methods
3.1. Sample Collection and Testing
3.2. Research Methodology
4. Results
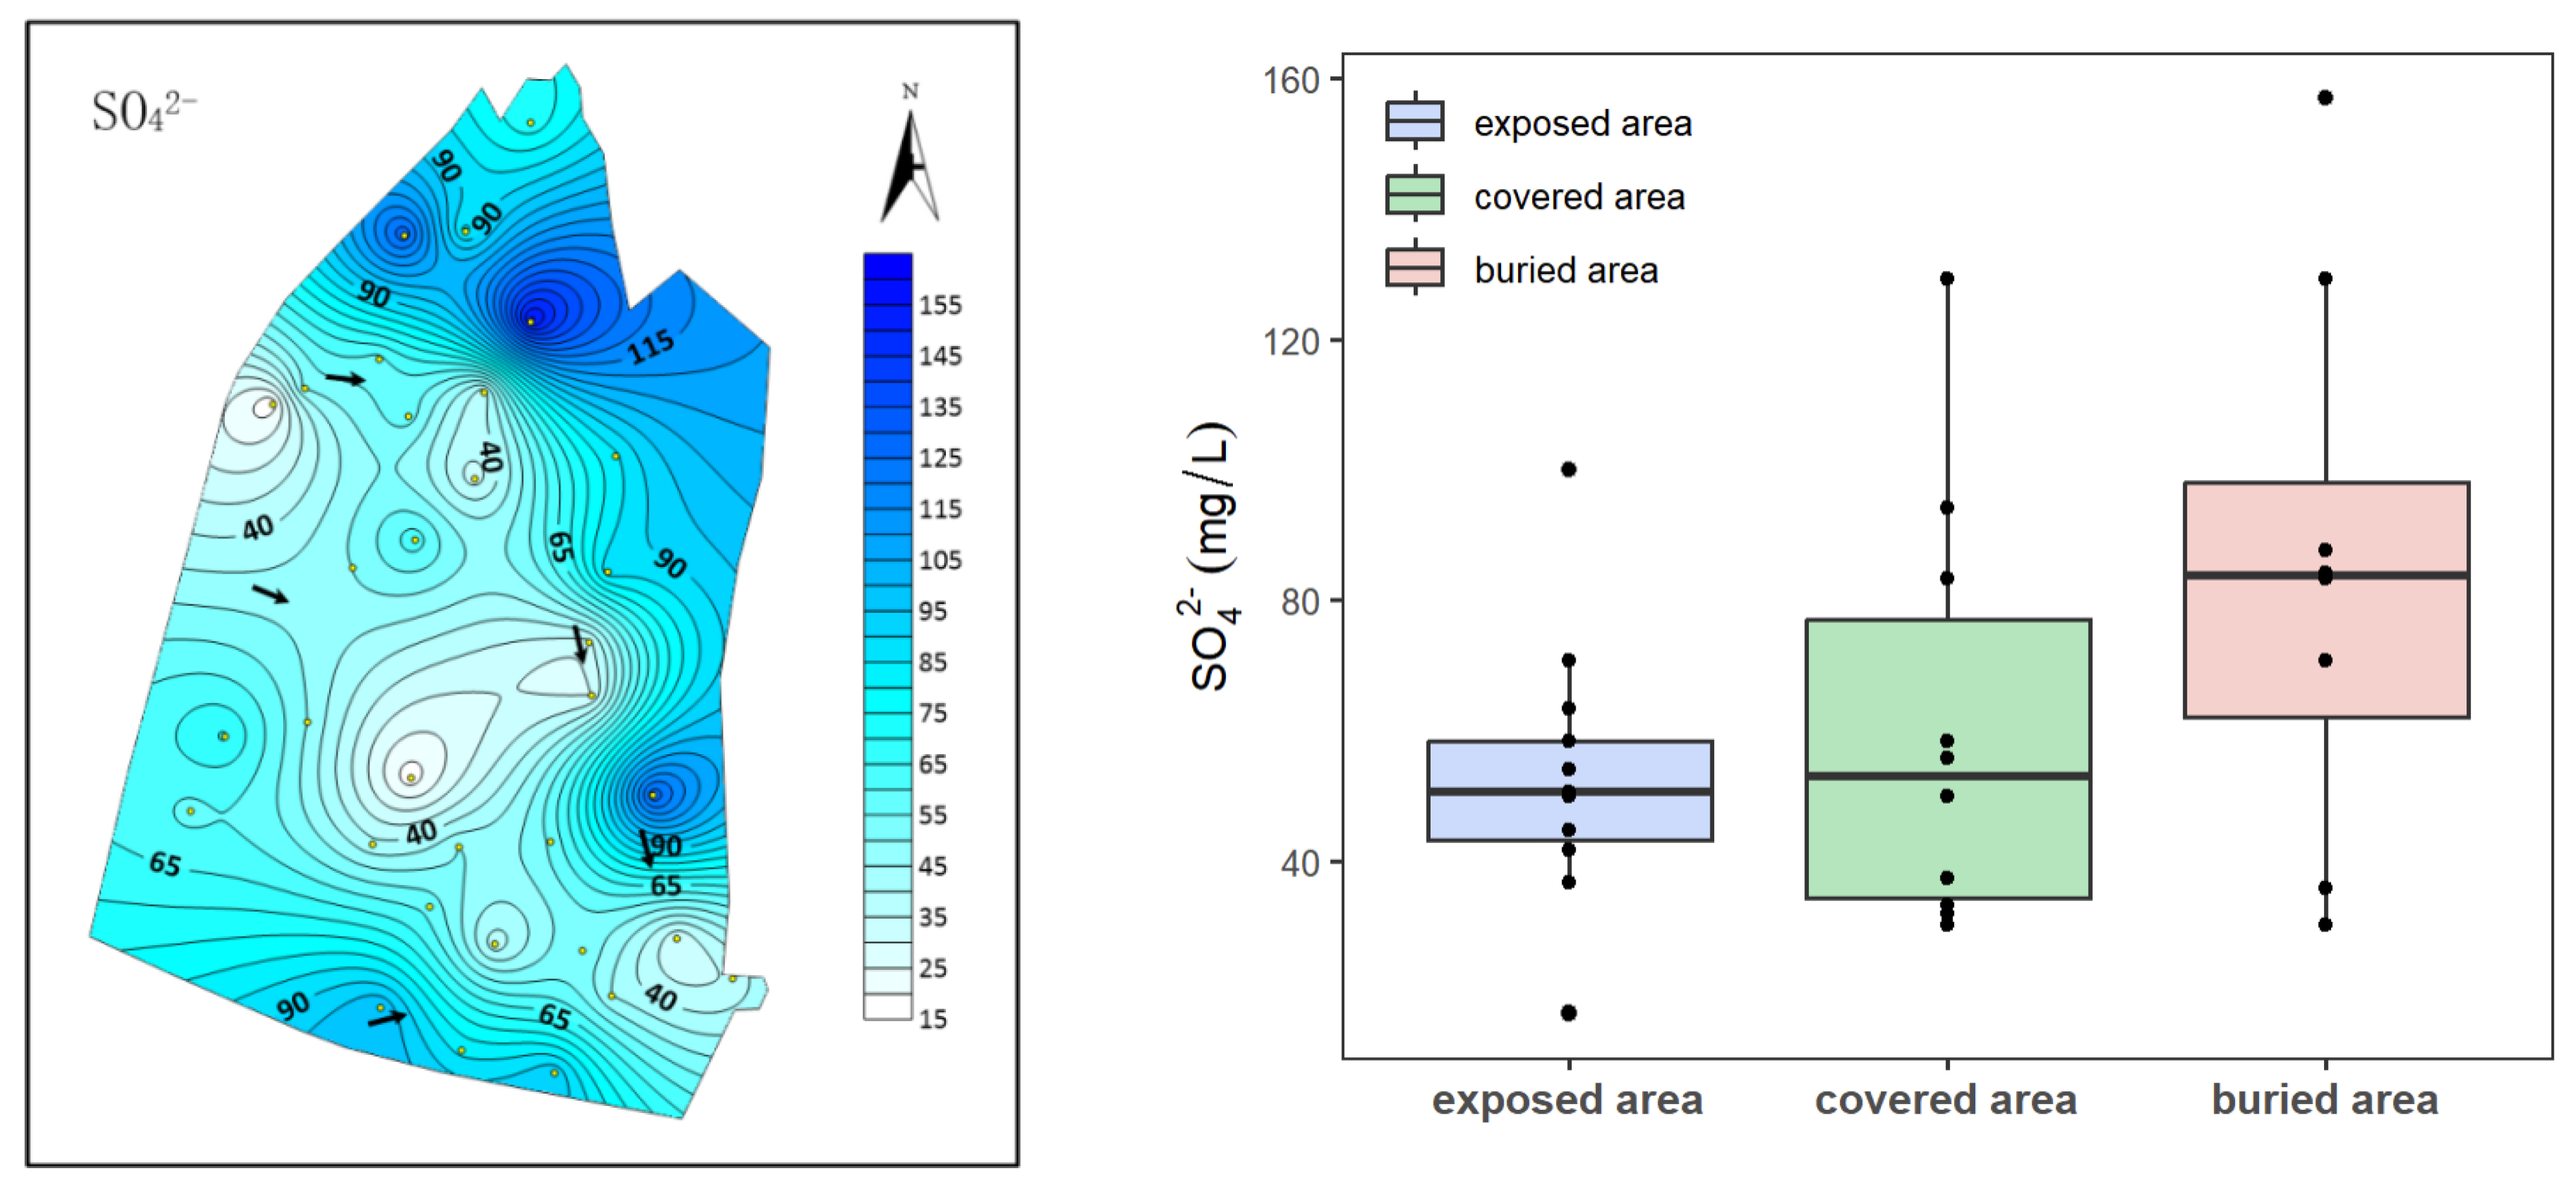
4.1. Characteristics of Sulfate Distribution in Karst Groundwater
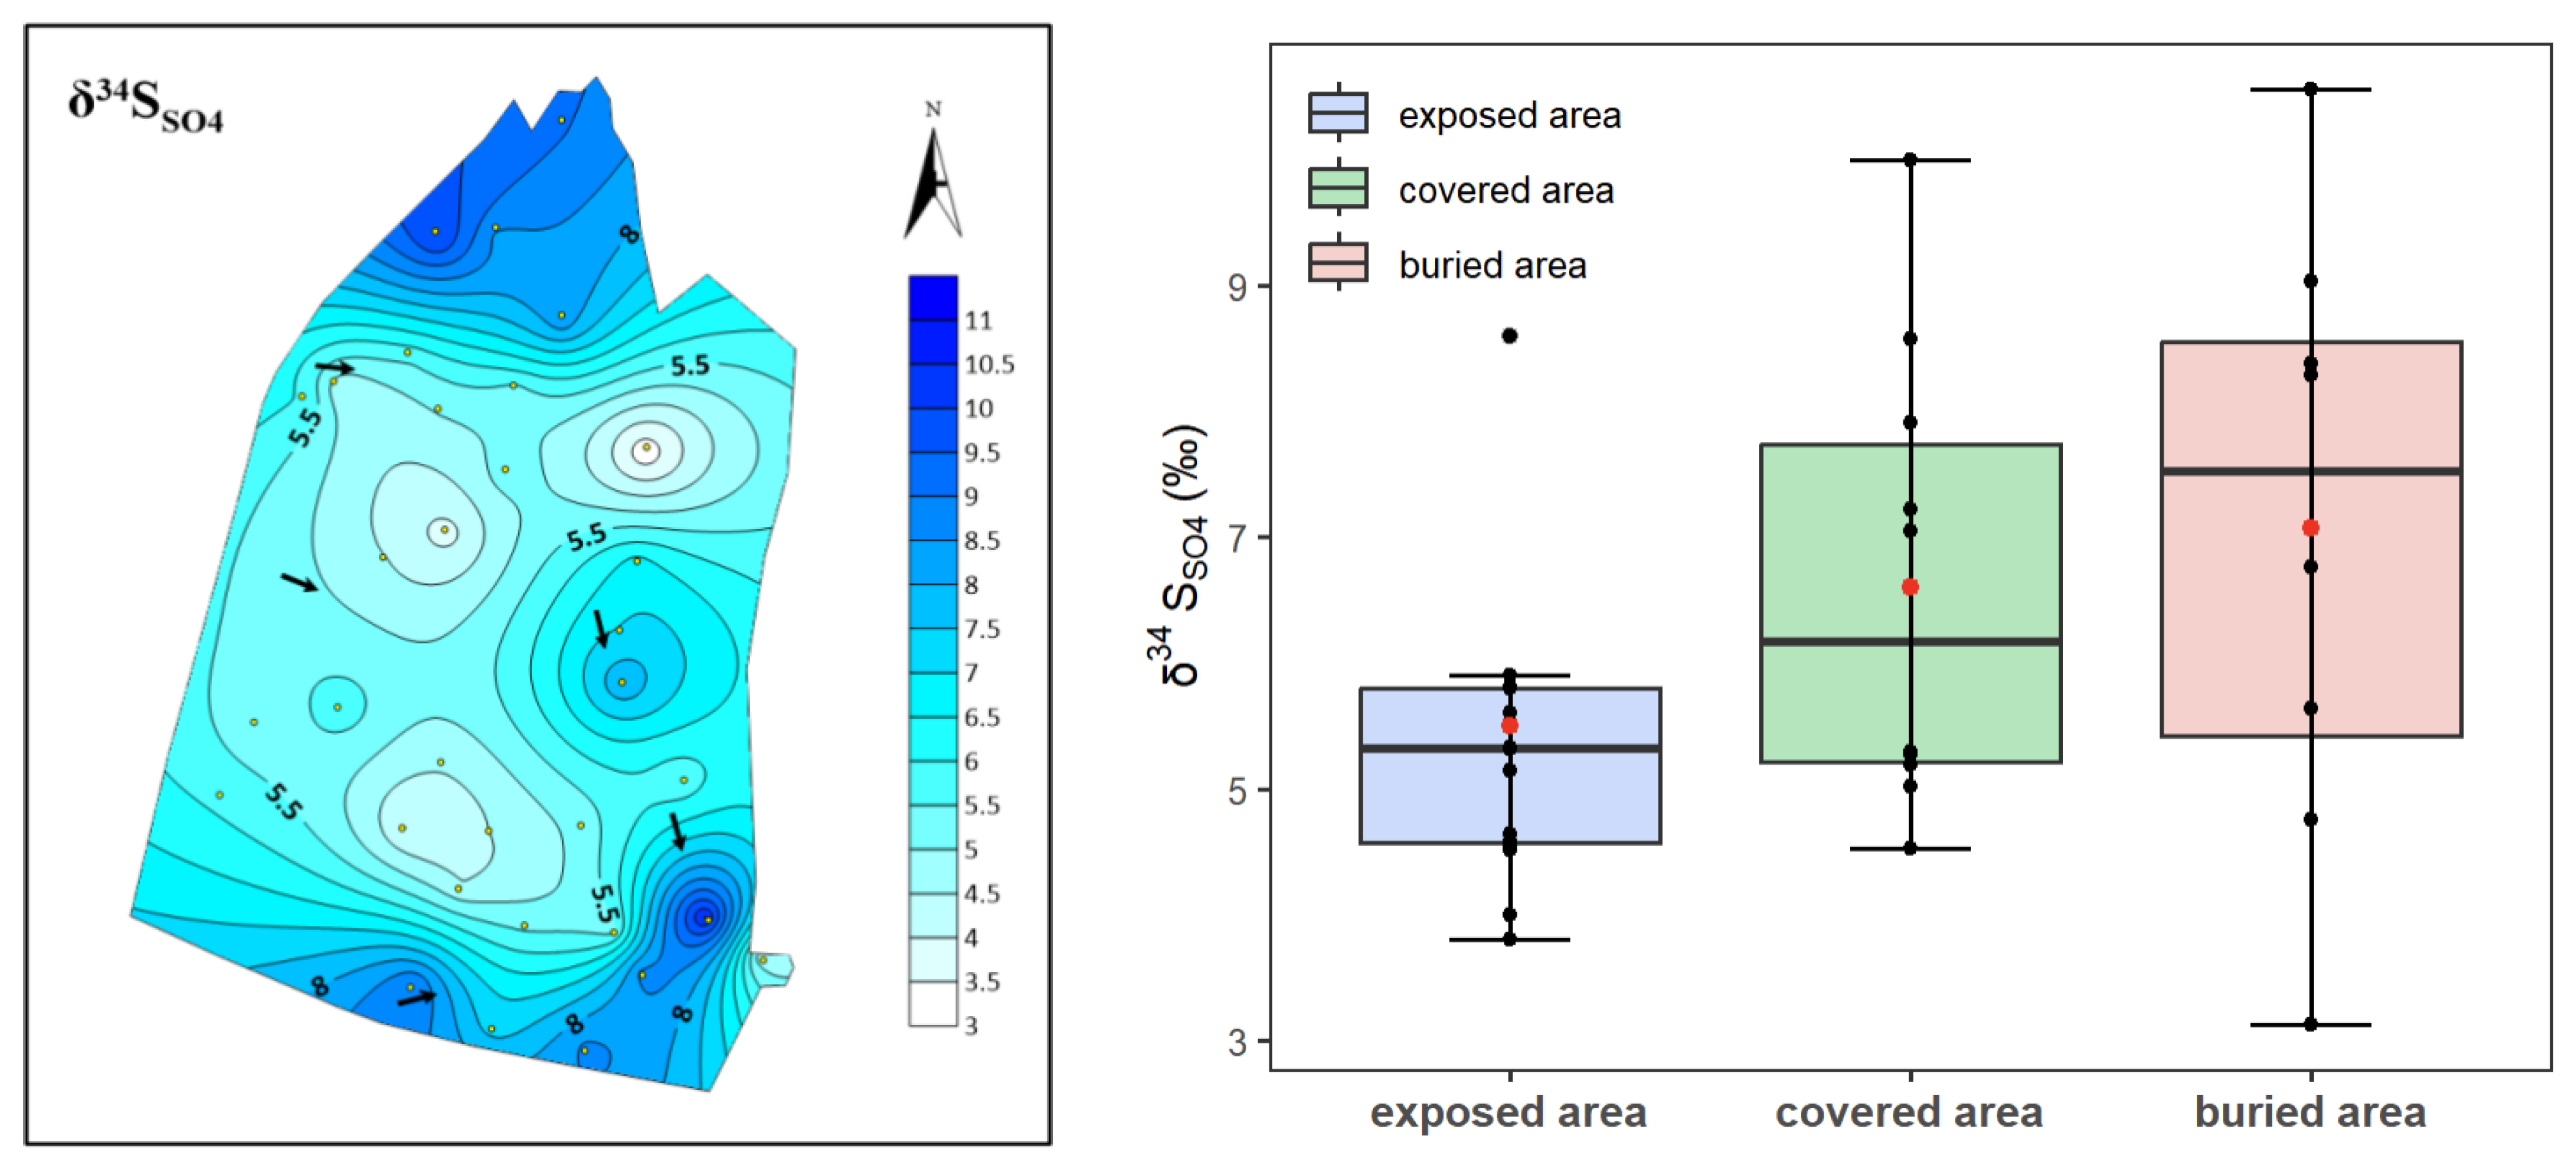
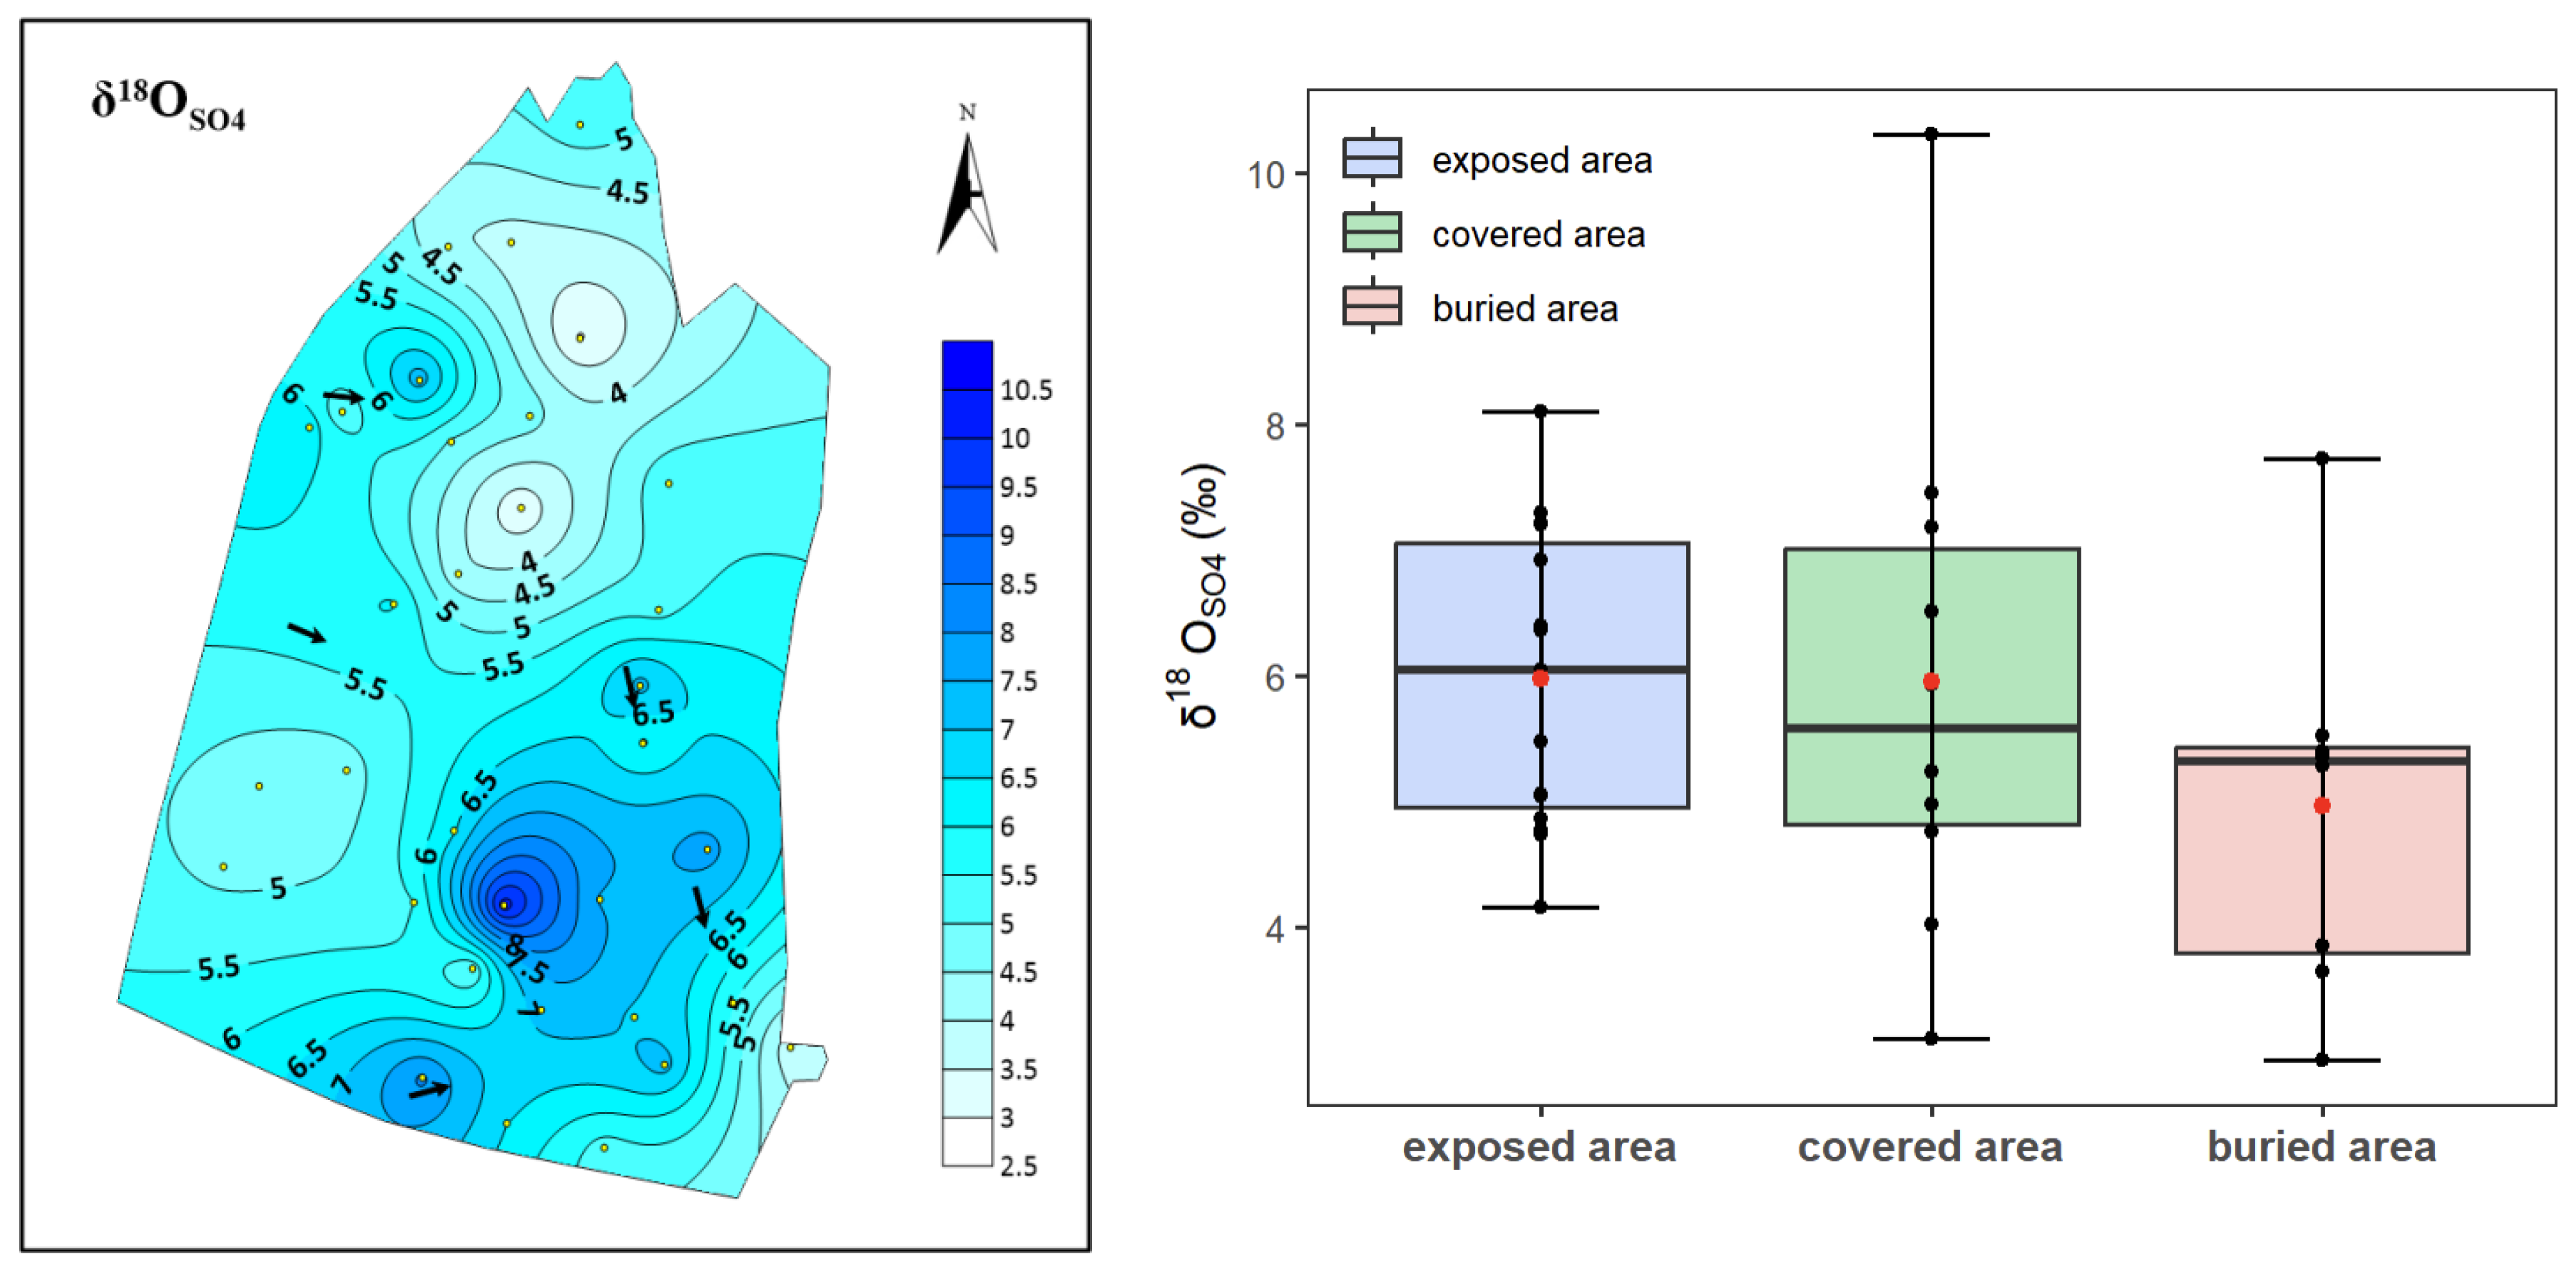
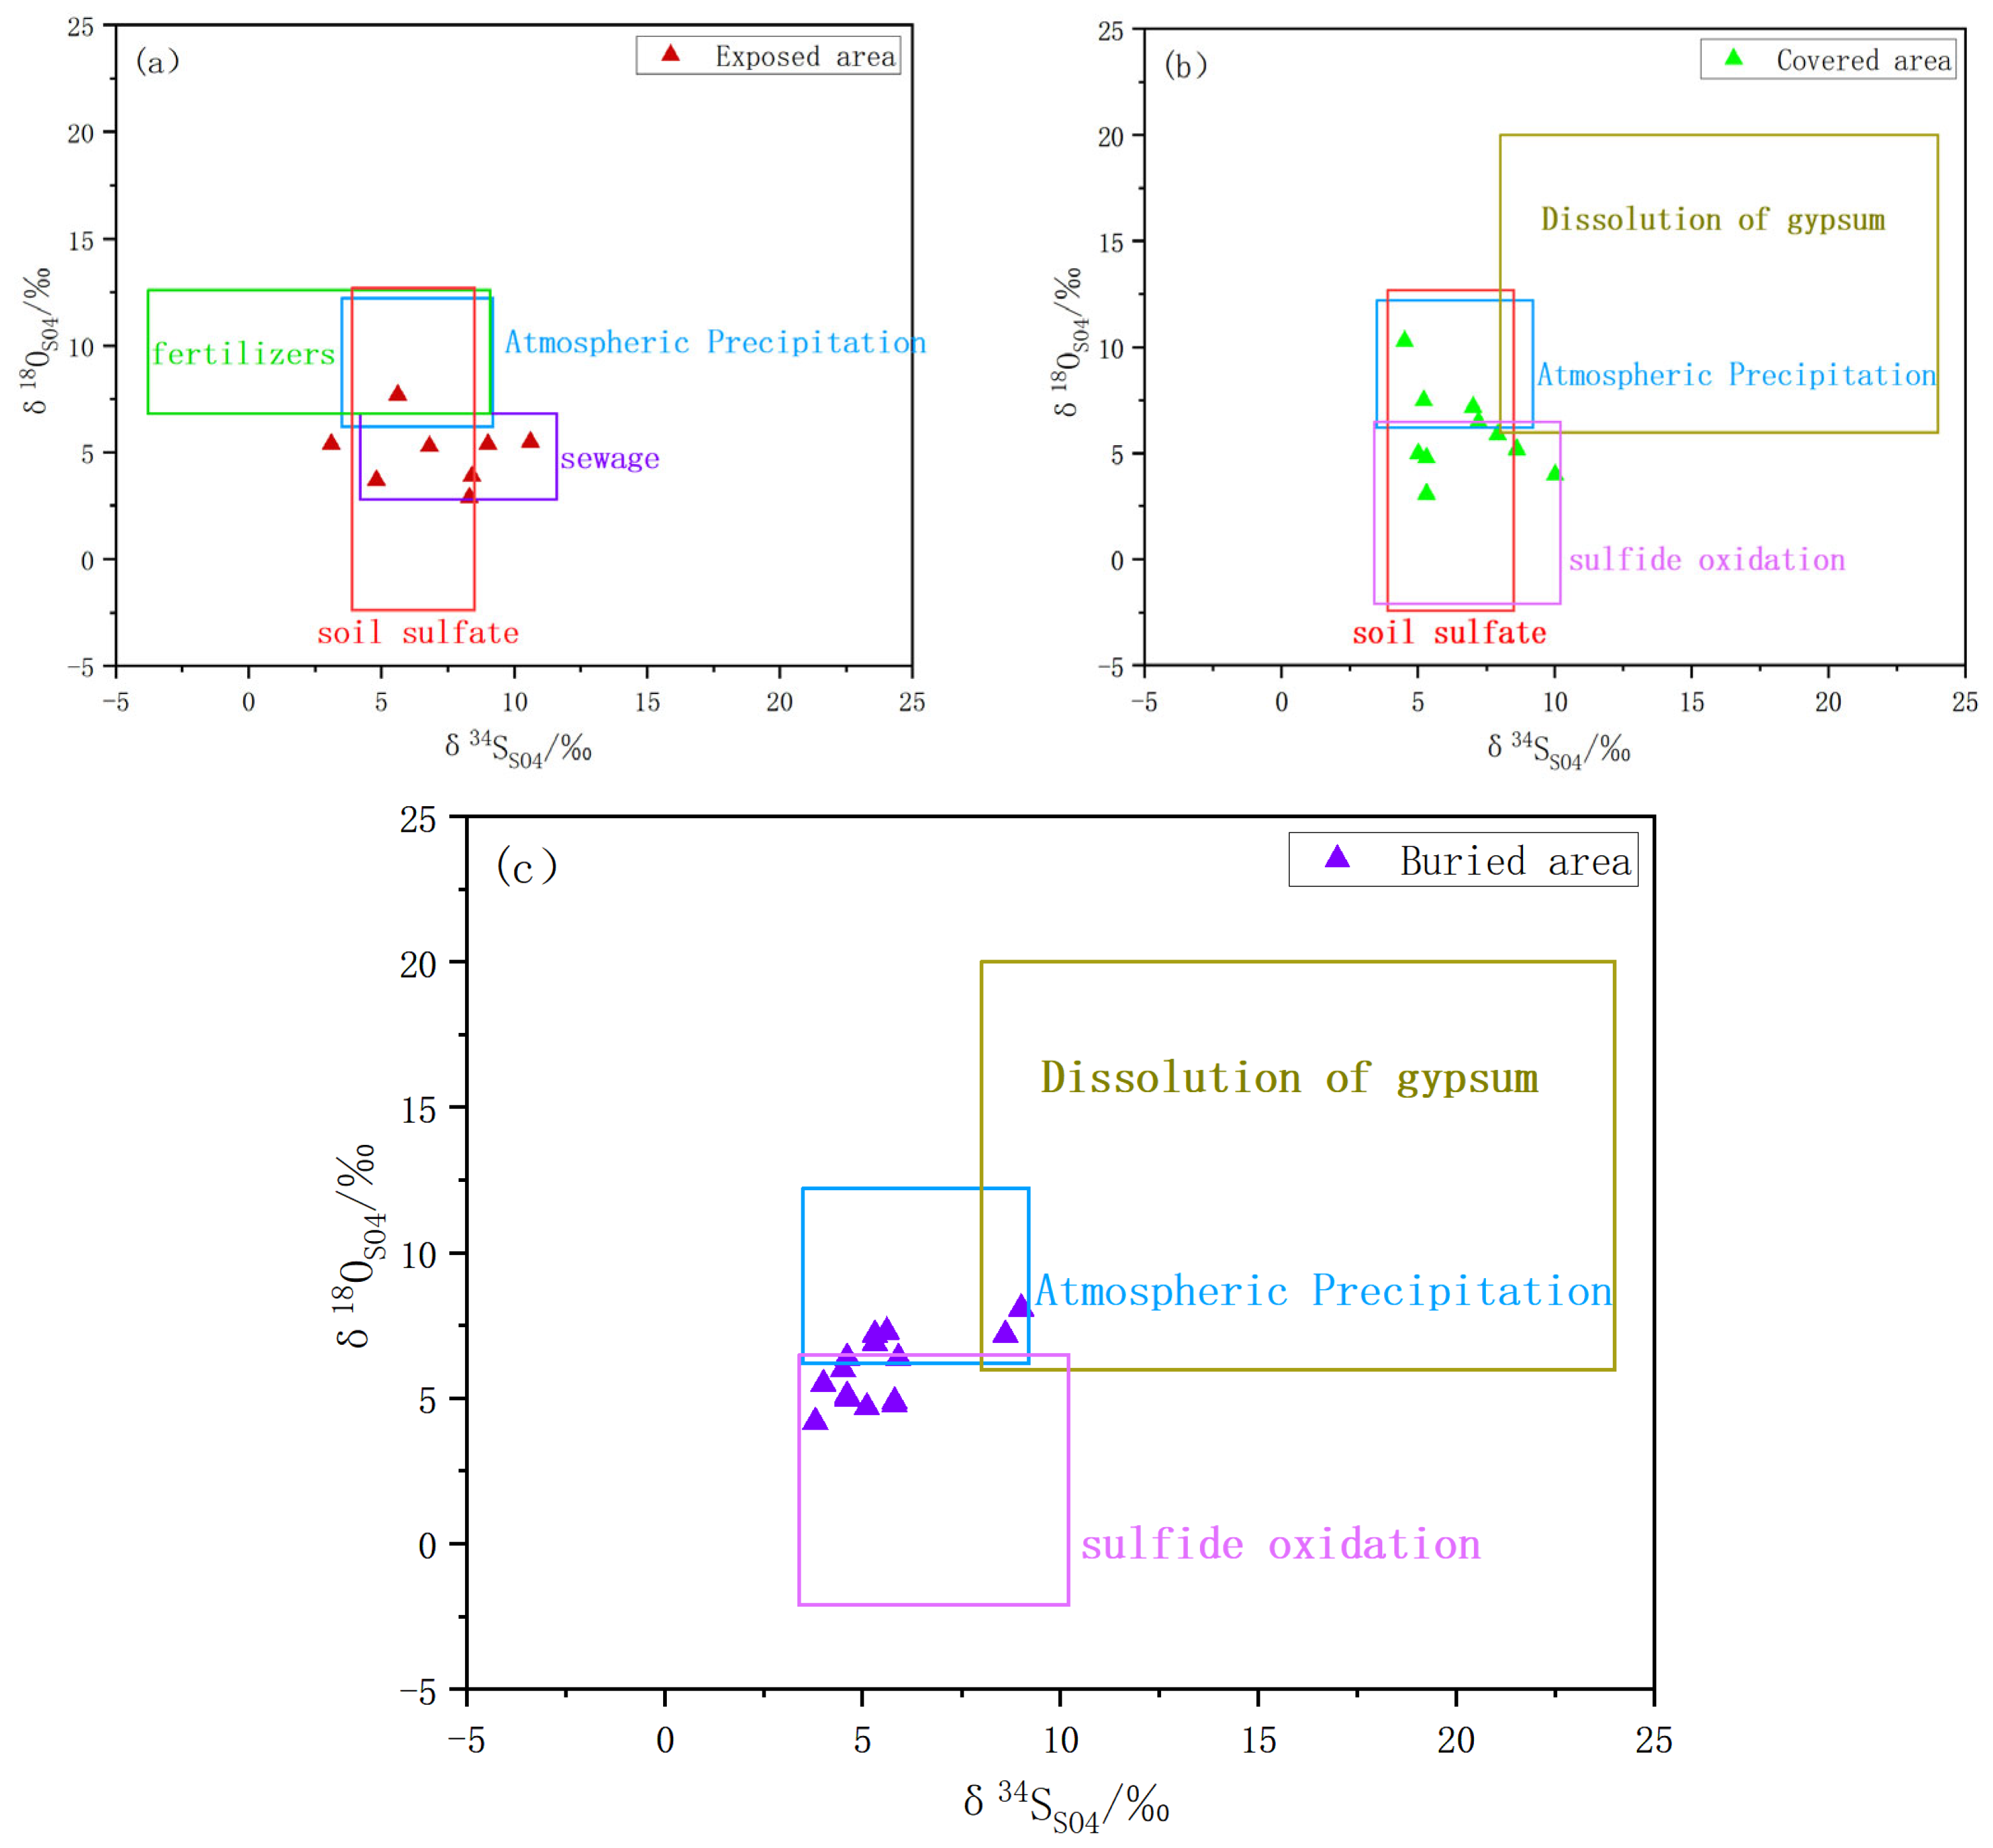
4.2. Sulfur–Oxygen Isotope Characterization
5. Discussion
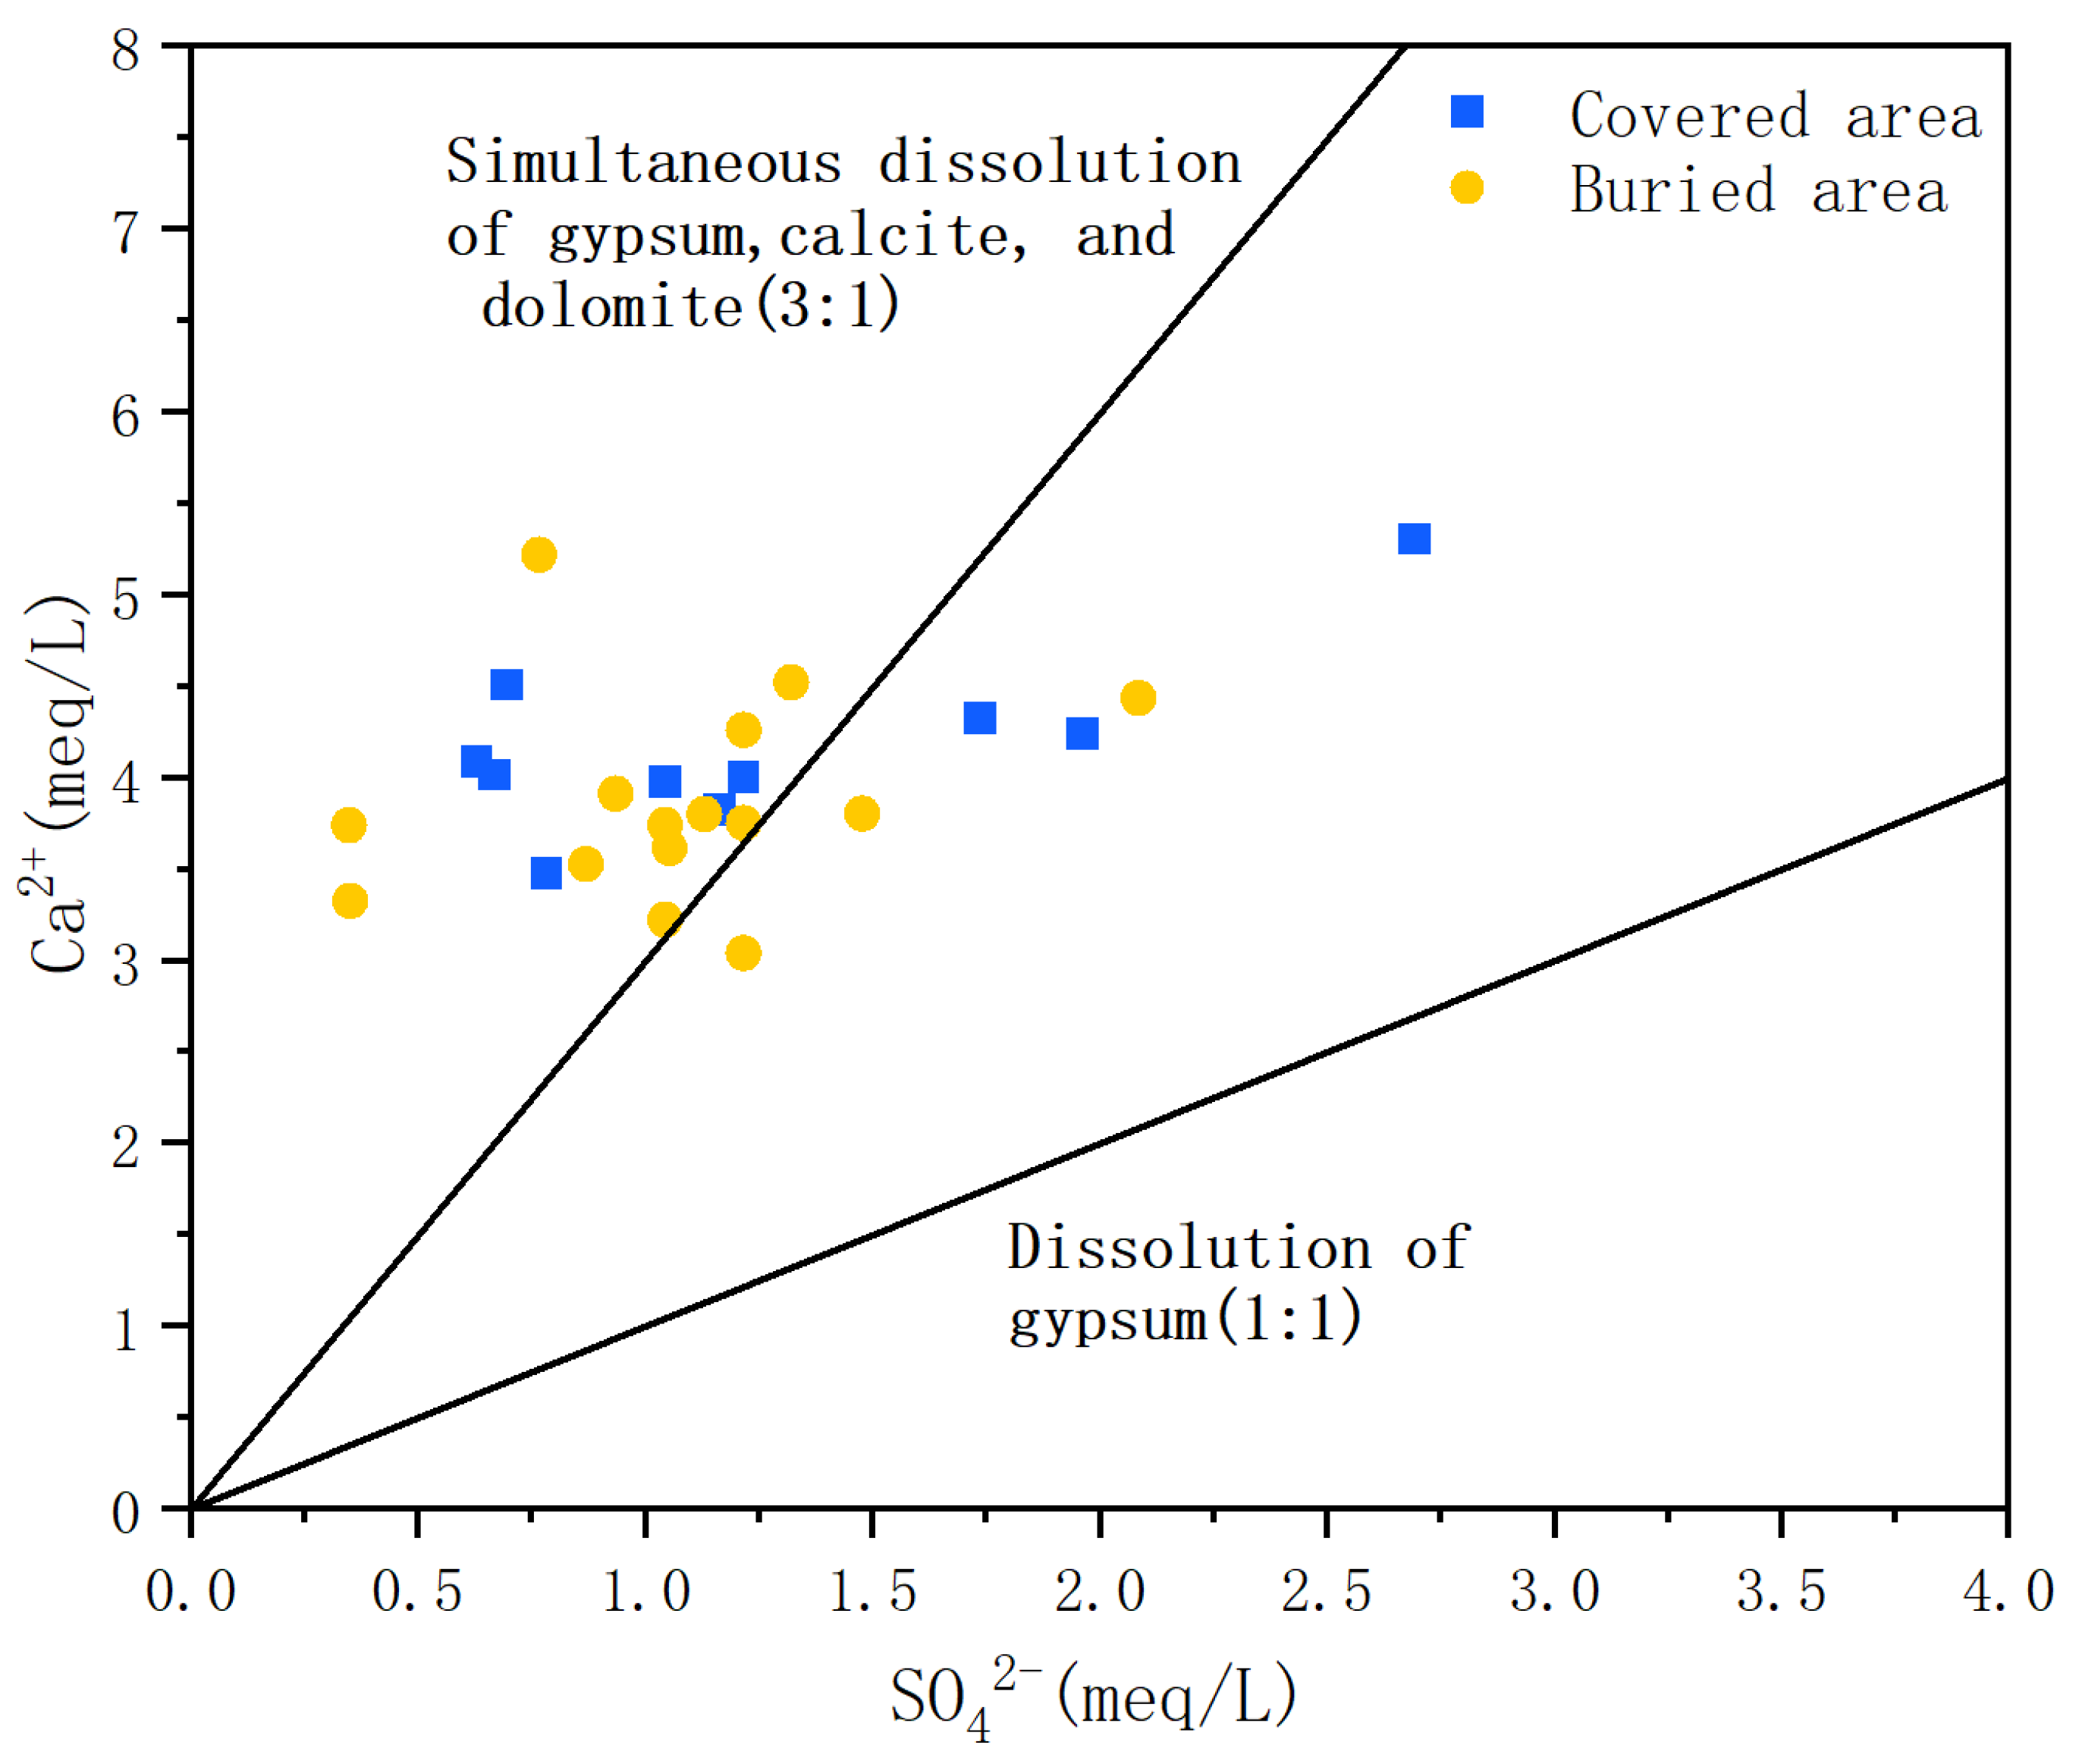
5.1. The Source of SO42− in Spring Water

| δ34SSO4 | δ18OSO4 | Based on | |||||
|---|---|---|---|---|---|---|---|
| Source | Range/‰ | Mean/‰ | Standard Deviation/‰ | Range/‰ | Mean/‰ | Standard Deviation/‰ | |
| atmospheric precipitation | 3.5–9.2 | 5.9 | 1.8 | 6.2–12.2 | 9.3 | 1.6 | [26] |
| sulfide oxidation | 3.4–10.2 | 6.6 | 1.8 | −2.1–6.5 | 3 | 4 | [27] |
| dissolution of gypsum | 8–24 | 10 | / | 6–20 | 13.5 | / | [32] |
| sewage | 4.2–11.6 | 8.7 | 2.4 | 2.8–6.8 | 10.8 | 2.3 | [26] |
| fertilizers | −3.8–9.1 | 4.9 | 6.7 | 6.8–12.6 | 12.6 | 3.3 | [26] |
| soil sulfate | 3.9–8.5 | 5.6 | 1.8 | −2.4–12.7 | 7 | 5.5 | [26] |
5.2. Quantitative Identification of SO42− Sources in the Spring Area
5.3. Patterns of Sulfur Transport and Transformation in Karst Water in the Mountain Front
6. Conclusions
- (1)
- The sulfate content of karst groundwater ranges between 16.68 and 156.84 mg/L, with an average value of 62.22 mg/L. Sulfate (SO42−) concentrations increase gradually from the exposed area to the buried area. This pattern is attributed to the oxidation of sulfides enriched in the Carboniferous–Permian strata, a common phenomenon in groundwater across northern karst area.
- (2)
- The δ34SSO4 values show an increasing trend from the exposed area to the covered and buried areas, mirroring the trend in sulfate content. In contrast, δ18OSO4 values remain similar across the three regions and are consistent with the characteristic values of atmospheric precipitation in northern China.
- (3)
- Sulfate in the study area primarily derives from sulfide oxidation, atmospheric precipitation, soil sulfate, chemical fertilizer, sewage, and gypsum dissolution, with source contributions varying across different areas. In the covered area, sulfate mainly derives from atmospheric precipitation, sulfide oxidation, soil sulfate, and gypsum dissolution, with an average contribution of 16.5%, 58.7%, 15.9%, and 8.9%, respectively. In the buried area, sulfate derived from atmospheric precipitation, sulfide oxidation, and gypsum dissolution, with an average contribution of 11.6%, 78.5%, and 9.9%, respectively. Contributions from atmospheric precipitation, dissolved soil sulfate, fertilizer, and sewage sources decrease as groundwater transitions from exposed to deeper buried environments. Conversely, contributions from dissolved sulfide and dissolved gypsum sources increase from the covered to the deeply buried area, influenced by variations in regional recharge conditions, burial settings, and groundwater flow patterns.
Author Contributions
Funding
Data Availability Statement
Acknowledgments
Conflicts of Interest
References
- Zhang, Z.J.; Fei, Y.H.; Guo, C.Y.; Shen, J.M.; Qian, Y.; Li, Y.; Zhao, X. Regional Groundwater Pollution Assessment in the North China Plain. J. Jilin Univ. (Earth Sci. Ed.) 2012, 42, 1456–1461. [Google Scholar]
- Torres-Martínez, J.A.; Mora, A.; Mahlknecht, J.; Kaown, D.; Barceló, D. Determining Nitrate and Sulfate Pollution Sources and Transformations in a Coastal Aquifer Impacted by Seawater Intrusion—A Multi-Isotopic Approach Combined with Self-Organizing Maps and a Bayesian Mixing Model. Sci. Total Environ. 2021, 786, 147312. [Google Scholar] [CrossRef]
- Miao, Z.; Carroll, K.C.; Brusseau, M.L. Characterization and Quantification of Groundwater Sulfate Sources at a Mining Site in an Arid Climate: The Monument Valley Site in Arizona, USA. J. Hydrol. 2013, 504, 207–215. [Google Scholar] [CrossRef] [PubMed]
- Pu, J.; Wang, S.; Zhang, L. Combining Hydrochemistry and Isotopes to Unravel Sulfate Sources in Karst Groundwater: A Case Study from Southwest China. Sci. Total Environ. 2021, 786, 147312. [Google Scholar]
- Geurts, J.J.; Sarneel, J.M.; Willers, B.J.; Roelofs, J.G.; Verhoeven, J.T.; Lamers, L.P. Interacting Effects of Sulfate Pollution, Sulphide Toxicity and Eutrophication on Vegetation Development in Fens: A Mesocosm Experiment. Environ. Pollut. 2009, 157, 2072–2081. [Google Scholar] [CrossRef]
- Leslie, D.; Lyons, W. Variations in Dissolved Nitrate, Chloride, and Sulfate in Precipitation, Reservoir, and Tap Waters, Columbus, Ohio. Int. J. Environ. Res. Public Health 2018, 15, 1752. [Google Scholar] [CrossRef]
- Torres-Martínez, J.A.; Mora, A.; Knappett, P.S.; Ornelas-Soto, N.; Mahlknecht, J. Tracking nitrate and sulfate sources in groundwater of an urbanized valley using a multi-tracer approach combined with a Bayesian isotope mixing model. Water Res. 2020, 182, 115962. [Google Scholar] [CrossRef]
- Zhang, Y.; Li, S.; Liu, J. Contrasting Sulfate Sources in Karst Groundwater of Northern and Southern China: Insights from Isotopic and Geochemical Proxies. Hydrol. Process. 2021, 35, e14197. [Google Scholar]
- Jiang, C.L.; Cheng, L.L.; Li, C.; Zheng, L.G. A Hydrochemical and Multi-Isotopic Study of Groundwater Sulfate Origin and Contribution in the Coal Mining Area. Ecotoxicol. Environ. Saf. 2022, 248, 114286. [Google Scholar] [CrossRef]
- Zhang, Q.Q.; Wang, H.W.; Lu, C. Tracing Sulfate Origin and Transformation in an Area with Multiple Sources of Pollution in Northern China by Using Environmental Isotopes and Bayesian Isotope Mixing Model. Environ. Pollut. 2020, 265, 115105. [Google Scholar] [CrossRef]
- Ren, C.B.; Zhang, Q.Q. Groundwater Chemical Characteristics and Controlling Factors in a Region of Northern China with Intensive Human Activity. Int. J. Environ. Res. Public Health 2020, 17, 9126. [Google Scholar] [CrossRef] [PubMed]
- Li, X.; Zhang, C.; Qi, H. Sulfur and Oxygen Isotope Constraints on Sulfate Sources and Biogeochemical Cycling in a Karst-Dominated Watershed. Appl. Geochem. 2020, 123, 104778. [Google Scholar]
- Guo, F.; Jiang, G.H.; Kang, Z.Q. Comparative Study on Carbon Sink Effects of Typical Subtropical Karst Water Systems. Carsologica Sin. 2011, 30, 403–409. [Google Scholar]
- Tostevin, R.; Clarkson, M.O.; Pogge von Strandmann, P.A.E. Triple Sulfur Isotope Constraints on the Origin of Sulfate in Contaminated Groundwater. Environ. Sci. Technol. 2019, 53, 10061–10070. [Google Scholar]
- Balci, N.; Shanks, W.C.; Mayer, B.; Mandernack, K.W. Oxygen and Sulfur Isotope Systematics of Sulfate Produced by Bacterial and Abiotic Oxidation of Pyrite. Geochim. Cosmochim. Acta 2007, 71, 3796–3811. [Google Scholar] [CrossRef]
- Krouse, H.R.; Mayer, B. Sulphur and Oxygen Isotopes in Sulphate: Applications in Contaminant Source Discrimination. Geoscience 2000, 15, 195–231. [Google Scholar]
- Meng, L.Q.; Nie, Z.L.; Wang, Z.; Liu, X.Q. Hydrogeochemical Characteristics and Sources of Sulfate in Groundwater of Shiyang River Basin. Heilongjiang Sci. 2022, 13, 7–10. [Google Scholar]
- Lin, Y.; Cao, F.L.; Wu, Y.Z.; Ren, H.X.; Jia, F.J. Analysis of Groundwater Hydrogeochemical Characteristics of Typical Karst Spring Basins in Northern China: A Case Study of Xujiagou Spring Basin in Hebi. Earth Environ. 2020, 48, 294–306. [Google Scholar]
- Mao, H.R.; Wang, C.Y.; Qu, S.; Liao, F.; Wang, G.C.; Shi, Z. Source and Evolution of Sulfate in the Multi-Layer Groundwater System in an Abandoned Mine—Insight from Stable Isotopes and Bayesian Isotope Mixing Model. Sci. Total Environ. 2023, 859 Pt 2, 160368. [Google Scholar] [CrossRef]
- Zheng, L.G.; Chen, X.; Dong, X.L.; Wei, X.P.; Jiang, C.; Tang, Q. Using δ34S-SO4 and δ18O-SO4 to Trace the Sources of Sulfate in Different Types of Surface Water from the Linhuan Coal-Mining Subsidence Area of Huaibei, China. Ecotoxicol. Environ. Saf. 2019, 181, 231–240. [Google Scholar] [CrossRef]
- Jin, L.; Han, D.; Song, X. Bayesian Mixing Models Coupled with δ34S and δ18O Isotopes for Source Apportionment of Sulfate in Groundwater: A Case Study in a Coal-Mining Karst Region. J. Hydrol. 2023, 617, 128945. [Google Scholar]
- Jia, F.J. Characteristics of Trace Elements in Karst Water in the Xujiagou Spring Basin and Health Risk Assessment. Master’s Thesis, Henan Polytechnic University, Jiaozuo, China, 2021. [Google Scholar]
- Parnell, A.C.; Inger, R.; Bearhop, S.; Jackson, A.L. Source partitioning using stable isotopes: Coping with too much variation. PLoS ONE 2010, 5, e9672. [Google Scholar] [CrossRef] [PubMed]
- Zhang, D.; Huang, X.Y.; Li, C.J. Sulfur and Oxygen Isotopes Trace the Sources of Sulfate in the Yellow River and Tributary River Waters. Adv. Water Sci. 2013, 24, 418–426. [Google Scholar]
- Zhang, Y.; Zhang, Q.Y.; Li, F.D.; Zhang, X.; Bi, Z.L.; Zhang, Q. Source Identification of Nitrate Contamination of Groundwater in Yellow River Irrigation Districts Using Stable Isotopes and Bayesian Model. Chin. J. Eco-Agric. 2019, 27, 484–493. [Google Scholar]
- Canfield, D.E. Isotope fractionation by natural populations of sulfate-reducing bacteria. Geochim. Cosmochim. Acta 2001, 65, 1117–1124. [Google Scholar] [CrossRef]
- Zhang, D.; Li, X.D.; Zhao, Z.Q.; Liu, C.Q. Using Dual Isotopic Data to Track the Sources and Behaviors of Dissolved Sulfate in the Western North China Plain. Appl. Geochem. 2015, 52, 43–56. [Google Scholar] [CrossRef]
- Hu, X.B.; Fang, J.C.; Zhai, H.W.; Zhang, K.; Ma, Y.M.; Jin, J.H.; Gao, X.B. Application of Sulfur and Oxygen Isotopes in Identifying the Source of Sulfate in Karst Water from Xin’an Spring Area. Bull. Geol. Sci. Technol. 2022, 41, 333–340. [Google Scholar]
- Lin, Y.; Xiong, H.M.; Wu, Y.Z.; Zhan, Y.H.; Zhang, B.H.; Wu, P.; Jin, Y. Source Analysis of Groundwater Sulfate in Inclined Plain in Front of Taihang Mountain. Environ. Sci. Technol. 2023, 46, 144–151. [Google Scholar]
- Lin, Y.; Tang, D.Z.; Wu, Y.Z.; Xiong, H.M.; Zhang, H.Y.; Liu, Y.; Jin, Y. Sulfur Isotope Characteristics of Karst Groundwater in Xujiagou Spring Area and Its Sources. J. Arid Land Resour. Environ. 2022, 36, 158–165. [Google Scholar]
- Wu, Y.Z.; Pan, C.F.; Lin, Y.; Cao, F.L.; Wu, Z.J. Hydrogeochemical Characteristics and Its Reverse Simulation of Ordovician Limestone Groundwater in Hebi Mining Area. J. Water Resour. Water Eng. 2018, 29, 25–32. [Google Scholar]
- Wang, Y.J.; Hu, Y.Y.; Shen, J.F.; Qu, K.; Yin, N.; Yu, H.J.; Ma, G.G. S and Pb Isotopic Compositions of the Beiminghe Iron Deposit in the Southern Taihang Mountains and Their Implications for the Source of Ore-Forming Materials. Geoscience 2011, 25, 846–852. [Google Scholar]
- Otero, N.; Soler, A.; Canals, A. Fertilizer-Derived Sulfate in Groundwater: An Isotopic Study in NE Spain. Appl. Geochem. 2008, 23, 2577–2588. [Google Scholar]
- Gao, X.B.; Wang, W.Z.; Hou, B.J.; Gao, L.B.; Zhang, J.Y.; Zhang, S.T.; Li, C.C.; Jiang, C.F. Analysis of Karst Groundwater Pollution in Northern China. Carsologica Sin. 2020, 39, 287–298. [Google Scholar]


| Sampling Point Information | pH | EC | T | TDS | Sulfate | K+ | Na+ | Ca2+ | Mg2+ | Cl− | SO42− | HCO3− | NO3− | ||
|---|---|---|---|---|---|---|---|---|---|---|---|---|---|---|---|
| Location | Occurrence Environment | μS/cm | °C | mg/L | δ34SSO4 (VCDT) | δ18OSO4 (VSMOW) | mg/L | ||||||||
| 1 | buried area | 7.65 | 543.00 | 25.2 | 352.40 | 4.8 | 3.7 | 1.35 | 12.80 | 82.28 | 17.94 | 18.36 | 35.85 | 323.3 | 0.78 |
| 2 | buried area | 7.66 | 569.00 | 24 | 348.40 | 10.6 | 5.5 | 1.69 | 9.50 | 80.26 | 18.99 | 24.82 | 30.35 | 329.2 | 1.06 |
| 3 | buried area | 7.69 | 728.00 | 22.4 | 492.30 | 5.6 | 7.7 | 0.52 | 15.24 | 118.28 | 17.94 | 54.72 | 129.24 | 287.4 | 0.79 |
| 4 | covered area | 7.74 | 624.00 | 22.4 | 342.10 | 7.9 | 5.9 | 1.39 | 15.38 | 81.76 | 20.21 | 25.45 | 30.19 | 329.2 | 0.78 |
| 5 | covered area | 7.55 | 636.00 | 26.9 | 391.30 | 7.0 | 7.2 | 1.22 | 12.35 | 90.16 | 20.05 | 42.54 | 33.35 | 343.2 | 0.99 |
| 6 | buried area | 7.53 | 810.00 | 26.1 | 512.80 | 6.8 | 5.3 | 12.30 | 13.63 | 107.85 | 21.10 | 77.99 | 87.55 | 371.2 | 4.76 |
| 7 | buried area | 7.96 | 791.00 | 25.5 | 421.80 | 3.1 | 5.4 | 0.30 | 13.64 | 112.20 | 14.88 | 57.81 | 84.23 | 255.4 | 4.44 |
| 8 | buried area | 7.95 | 920.00 | 25.7 | 834.30 | 8.3 | 2.9 | 3.48 | 32.25 | 183.02 | 34.82 | 99.26 | 156.84 | 409.1 | 4.02 |
| 9 | buried area | 8.11 | 604.00 | 22.8 | 372.30 | 8.4 | 3.9 | 0.80 | 16.60 | 78.28 | 21.10 | 35.45 | 83.38 | 253.4 | 0.94 |
| 10 | buried area | 7.86 | 605.00 | 24.3 | 346.20 | 9.0 | 5.4 | 0.86 | 6.11 | 78.28 | 18.99 | 35.45 | 70.87 | 251.4 | 0.76 |
| 11 | covered area | 7.94 | 738.00 | 27 | 461.50 | 10.0 | 4.0 | 0.70 | 13.18 | 106.11 | 26.38 | 18.36 | 129.24 | 315.3 | 1.35 |
| 12 | exposed area | 8.10 | 596.00 | 23.5 | 336.10 | 5.6 | 7.3 | 0.64 | 10.78 | 85.23 | 12.66 | 24.82 | 58.37 | 267.3 | 1.33 |
| 13 | exposed area | 8.26 | 507.00 | 25.4 | 314.20 | 4.6 | 5.1 | 3.05 | 14.44 | 72.32 | 17.94 | 19.27 | 50.53 | 253.4 | 0.96 |
| 14 | exposed area | 8.22 | 525.00 | 26.7 | 284.40 | 5.9 | 6.4 | 0.81 | 10.95 | 74.80 | 7.39 | 24.82 | 16.68 | 257.9 | 0.98 |
| 15 | covered area | 8.39 | 578.00 | 27.5 | 315.50 | 5.3 | 4.8 | 1.16 | 7.80 | 69.58 | 17.94 | 42.54 | 37.52 | 257.9 | 1.90 |
| 16 | covered area | 8.30 | 579.00 | 25.6 | 335.50 | 5.0 | 5.0 | 0.50 | 17.40 | 80.02 | 15.50 | 31.91 | 58.37 | 243.6 | 1.27 |
| 17 | covered area | 8.51 | 540.00 | 26.6 | 331.20 | 5.3 | 3.1 | 1.17 | 18.40 | 80.36 | 15.83 | 35.45 | 32.05 | 275.5 | 1.87 |
| 18 | exposed area | 8.57 | 697.00 | 28.3 | 419.80 | 3.8 | 4.2 | 0.61 | 12.61 | 90.45 | 27.43 | 63.81 | 63.38 | 299.4 | 3.48 |
| 19 | exposed area | 8.59 | 339.00 | 27.1 | 308.60 | 4.5 | 6.0 | 1.70 | 10.43 | 64.47 | 19.50 | 55.45 | 50.03 | 187.2 | 1.39 |
| 20 | exposed area | 8.62 | 552.00 | 25.7 | 358.90 | 5.1 | 4.7 | 3.12 | 7.09 | 76.10 | 23.21 | 42.54 | 70.87 | 251.5 | 2.61 |
| 21 | exposed area | 8.59 | 427.00 | 25.6 | 324.50 | 5.8 | 4.9 | 1.20 | 10.58 | 60.84 | 21.10 | 35.45 | 58.37 | 255.4 | 1.88 |
| 22 | exposed area | 8.43 | 522.00 | 24.2 | 344.60 | 5.8 | 4.8 | 0.58 | 11.11 | 74.80 | 20.05 | 28.36 | 50.03 | 299.4 | 1.32 |
| 23 | exposed area | 8.46 | 540.00 | 23.8 | 387.30 | 4.6 | 6.4 | 0.48 | 10.42 | 66.54 | 16.88 | 35.45 | 16.81 | 258.3 | 1.40 |
| 24 | exposed area | 8.34 | 522.00 | 26.8 | 294.10 | 4.0 | 5.5 | 0.42 | 9.68 | 70.54 | 10.88 | 21.27 | 41.69 | 259.3 | 0.91 |
| 25 | exposed area | 8.40 | 503.00 | 24.5 | 366.40 | 4.6 | 5.0 | 0.80 | 10.42 | 75.02 | 24.27 | 24.91 | 58.37 | 305.3 | 0.94 |
| 26 | covered area | 8.56 | 500.00 | 25.6 | 317.80 | 4.5 | 10.3 | 0.73 | 15.05 | 79.54 | 16.77 | 26.00 | 50.03 | 239.5 | 1.64 |
| 27 | covered area | 8.46 | 527.00 | 25.2 | 343.40 | 5.2 | 7.5 | 0.54 | 10.31 | 76.54 | 18.99 | 32.54 | 55.87 | 277.3 | 1.88 |
| 28 | exposed area | 8.42 | 757.00 | 26.4 | 403.90 | 5.3 | 7.2 | 0.63 | 14.53 | 104.37 | 18.55 | 35.45 | 36.76 | 375.2 | 3.00 |
| 29 | exposed area | 7.90 | 572.00 | 23.2 | 331.00 | 5.3 | 6.9 | 1.11 | 10.54 | 76.06 | 18.99 | 35.45 | 54.20 | 249.4 | 1.93 |
| 30 | exposed area | 8.61 | 553.00 | 16.8 | 353.60 | 8.6 | 7.2 | 0.90 | 12.64 | 78.28 | 19.72 | 35.45 | 44.85 | 303.5 | 1.42 |
| 31 | covered area | 8.84 | 600.00 | 28 | 372.60 | 8.6 | 5.2 | 1.38 | 10.42 | 84.79 | 20.66 | 28.36 | 94.20 | 245.5 | 1.67 |
| 32 | covered area | 8.69 | 614.00 | 28 | 393.50 | 7.2 | 6.5 | 1.19 | 13.29 | 86.54 | 25.49 | 28.36 | 83.38 | 290.4 | 1.98 |
| 33 | exposed area | 8.66 | 692.00 | 27.1 | 461.40 | 9.0 | 8.1 | 0.96 | 5.99 | 88.71 | 36.60 | 28.36 | 100.06 | 359.4 | 1.46 |
| Source | Exposed Area | Covered Area | Burial Area |
|---|---|---|---|
| Mean ± Standard Deviation (%) | |||
| precipitation | 19.6 ± 5.1 | 16.5 ± 5.3 | 11.6 ± 3 |
| sulfide oxidation | / | 58.7 ± 10.3 | 78.5 ± 8.2 |
| dissolution of gypsum | / | 8.9 ± 2.3 | 9.9 ± 2.8 |
| soil sulfate | 63.5 ± 7.3 | 15.9 ± 3.3 | / |
| fertilizers | 9.4 ± 2.7 | / | / |
| sewage | 7.5 ± 2.2 | / | / |
Disclaimer/Publisher’s Note: The statements, opinions and data contained in all publications are solely those of the individual author(s) and contributor(s) and not of MDPI and/or the editor(s). MDPI and/or the editor(s) disclaim responsibility for any injury to people or property resulting from any ideas, methods, instructions or products referred to in the content. |
© 2025 by the authors. Licensee MDPI, Basel, Switzerland. This article is an open access article distributed under the terms and conditions of the Creative Commons Attribution (CC BY) license (https://creativecommons.org/licenses/by/4.0/).
Share and Cite
Lin, Y.; Wang, Y.; Wu, Y.; Xu, B. Analyzing the Source of Sulfate in Karst Groundwater Based on a Bayesian Stable Isotope Mixing Model: A Case Study of Xujiagou Spring Area, Northern China. Water 2025, 17, 794. https://doi.org/10.3390/w17060794
Lin Y, Wang Y, Wu Y, Xu B. Analyzing the Source of Sulfate in Karst Groundwater Based on a Bayesian Stable Isotope Mixing Model: A Case Study of Xujiagou Spring Area, Northern China. Water. 2025; 17(6):794. https://doi.org/10.3390/w17060794
Chicago/Turabian StyleLin, Yun, Yiyang Wang, Yazun Wu, and Boyang Xu. 2025. "Analyzing the Source of Sulfate in Karst Groundwater Based on a Bayesian Stable Isotope Mixing Model: A Case Study of Xujiagou Spring Area, Northern China" Water 17, no. 6: 794. https://doi.org/10.3390/w17060794
APA StyleLin, Y., Wang, Y., Wu, Y., & Xu, B. (2025). Analyzing the Source of Sulfate in Karst Groundwater Based on a Bayesian Stable Isotope Mixing Model: A Case Study of Xujiagou Spring Area, Northern China. Water, 17(6), 794. https://doi.org/10.3390/w17060794