Review

Water Reuse—Retrospective Study on Sustainable Future Prospects

1
School of Sustainable Engineering and the Built Environment, Arizona State University, Tempe, AZ 85287, USA
2
Water and Environmental Technology Center, Arizona State University, Tempe, AZ 85287, USA
3
Research Center for Water Environment Technology, Graduate School of Engineering, The University of Tokyo, Tokyo 113-8654, Japan
4
Graduate School of Integrated Science and Technology, Nagasaki University, Nagasaki 852-8521, Japan
5
Innovation Center Yokogawa Electric Corporation, Tokyo 180-8750, Japan
6
Department of Civil and Environmental Engineering, Graduate School of Engineering, Tohoku University, Sendai 980-8579, Japan
7
Department of Urban Engineering, The University of Tokyo, Tokyo 113-8654, Japan
*
Author to whom correspondence should be addressed.
Water 2025, 17(6), 789; https://doi.org/10.3390/w17060789
Submission received: 14 December 2024 / Revised: 26 February 2025 / Accepted: 4 March 2025 / Published: 10 March 2025
(This article belongs to the Section Wastewater Treatment and Reuse)

Abstract

:
In recent decades, societies and economies across the globe have started to show signs of stress associated with water shortages. Meeting the sustainability benchmarks in arid and semi-arid regions has caused water reuse to be considered a viable alternate source to augment the existing water supply resources. Water reuse, resource recovery, and recycling are extensions of the concept of a circular economy that has been practiced in other fields. Globally, the U.S. has played a leadership role in the development of guidance and regulations for various water reuse applications. Other countries and organizations have also developed similar programs. This paper aims to propose a review of the existing literature and provide a broader perspective of water reuse focusing on the most pressing issues such as direct potable reuse with the backdrop of viral pathogens and perfluorinated compounds. The global history of statutory developments to regulate the selected contaminants has also been discussed by covering the recent advancement in water reuse applications. Technological developments and regulatory trends are chronicled in the context of emerging contaminants linked with an imminent social, industrial, and agricultural prospectus. The proposed high viral log removal credit for water reuse is a challenging task especially at regular intervals; therefore, the treatment requirements must be verified to ensure public safety. The extreme persistence of PFAS, their tendency for buildup in biotic systems, and their removal is another challenging task which requires development of cost effective and efficient technologies. Disparity in the financial and technological capabilities of regional or internal stakeholders of shared watershed or aquifer is a bottleneck in tangible advancements in this area. The role of public–private partnerships in addressing the impending water sustainability challenges is discussed as a model for future direction in funding, managing, and public acceptance.

1. Background

Water recycling is a natural phenomenon occurring on earth throughout the ages, supporting evolution of ecosystems across global ecology. Water recycling is a phenomenon underlying the role reuse has played in sustained supply overtime. It also serves as a clue for meeting sustainability goals. Natural water cycles can take thousands of years to complete their passages through oceans, the atmosphere, and earth aquifers [1,2]. However, in artificially created water recycling, the average cycle time is reduced by several orders of magnitude to meet the rapidly rising water demands for agriculture, urban consumption, and industrial operations [3]. Historically, water reuse practices are established upon three principles: (1) appropriate treatment of wastewater to meet strictly application-specific water quality requirements, (2) safeguarding public health, and (3) gaining public acceptance. This review is written with the objective of presenting a concise history of water reuse and chronological advancements in various water reuse application scenarios. It provides a snapshot of the recent technological advancement with a narrow focus on regulated contaminants and regulatory updates in the context of emerging challenges. In recent years, one of the main focuses of regulatory agencies has been on developing contaminant removal guidelines for water reuse applications, especially potable reuse. This review summarizes the most recent developments in this area, providing a perspective on the future of water reuse.

1.1. History of Water Reuse in the Americas, Arizona, and Japan

The beneficial use of domestic waste, both liquid and solid, is not a new concept. Ancient civilizations in Egypt, Persia, the Indus Valley, Mesopotamia, Crete, China, and other oriental regions have been using residential wastewater for crop irrigation. Those communities used channels and pipes to carry residential wastewater away from dwelling areas into lakes and rivers. The first documented evidence of wastewater sanitization comes from Mesopotamia around 3500 BC, and treatment occurred in the Indus Civilization in 2500 BC. During the Middle Ages, the disposal of wastewater emerged as a pressing public health issue and social nuisance matter. This is evidenced by the fact that at least 25% of the population died due to waterborne diseases such as cholera and plague [4]. These challenges inspired the gradual process of innovation, starting in the form of Chinampas (floating gardens) more than thousands of years ago in the Americas [5,6]. These systems were able to provide food security to approximately 2 million people in Tenochtitlan during Medieval times and are still part of a food production system catering to the needs of Mexico City’s population. Chinampas is recognized as a UNESCO World Heritage Site [7].
Management of the large quantities of wastewater produced by municipalities and industries has been and continues to be a major challenge of human civilizations. In ancient Persia, wastewater from the Persepolis palaces and storm water from the surrounding areas were directed by clay pipes or carved rocks to nearby agriculture fields [8]. In the United States, the very first community sewers were constructed in the 1800s for stormwater collection. There is a long history of developing systems for wastewater disposal. It had been a source of waterway pollution until the passage and implementation of the Clean Water Act in 1972 [9] that regulated the discharge of pollutants into the waters of the United States.

Prospectus

The rapid evolution of urban centers with a parallel growth of peri-urban industrial zones has resulted in challenges such as the different spectrum of organic contaminants in wastewater associated with these developments. In this context, a major challenge is to protect source waters and maintain a sustainable supply with an appropriate water quality at an affordable water price. Under these stresses, the expansion of water reuse is the only viable solution for sustaining the current development rates in urban, industrial, and agriculture sectors. Water reuse can be classified into two main categories: non-potable water reuse and potable water reuse, which can be further divided into two sub-categories (planned potable reuse and unplanned (de facto) potable reuse (Table 1)).
In the recent past, developments in decision making science and rapid detection technologies have helped in addressing the challenges of wastewater management and public health issues [10]. These technological and scientific advancements have enabled the industry of today to treat large volumes of wastewater for direct and indirect reuse.

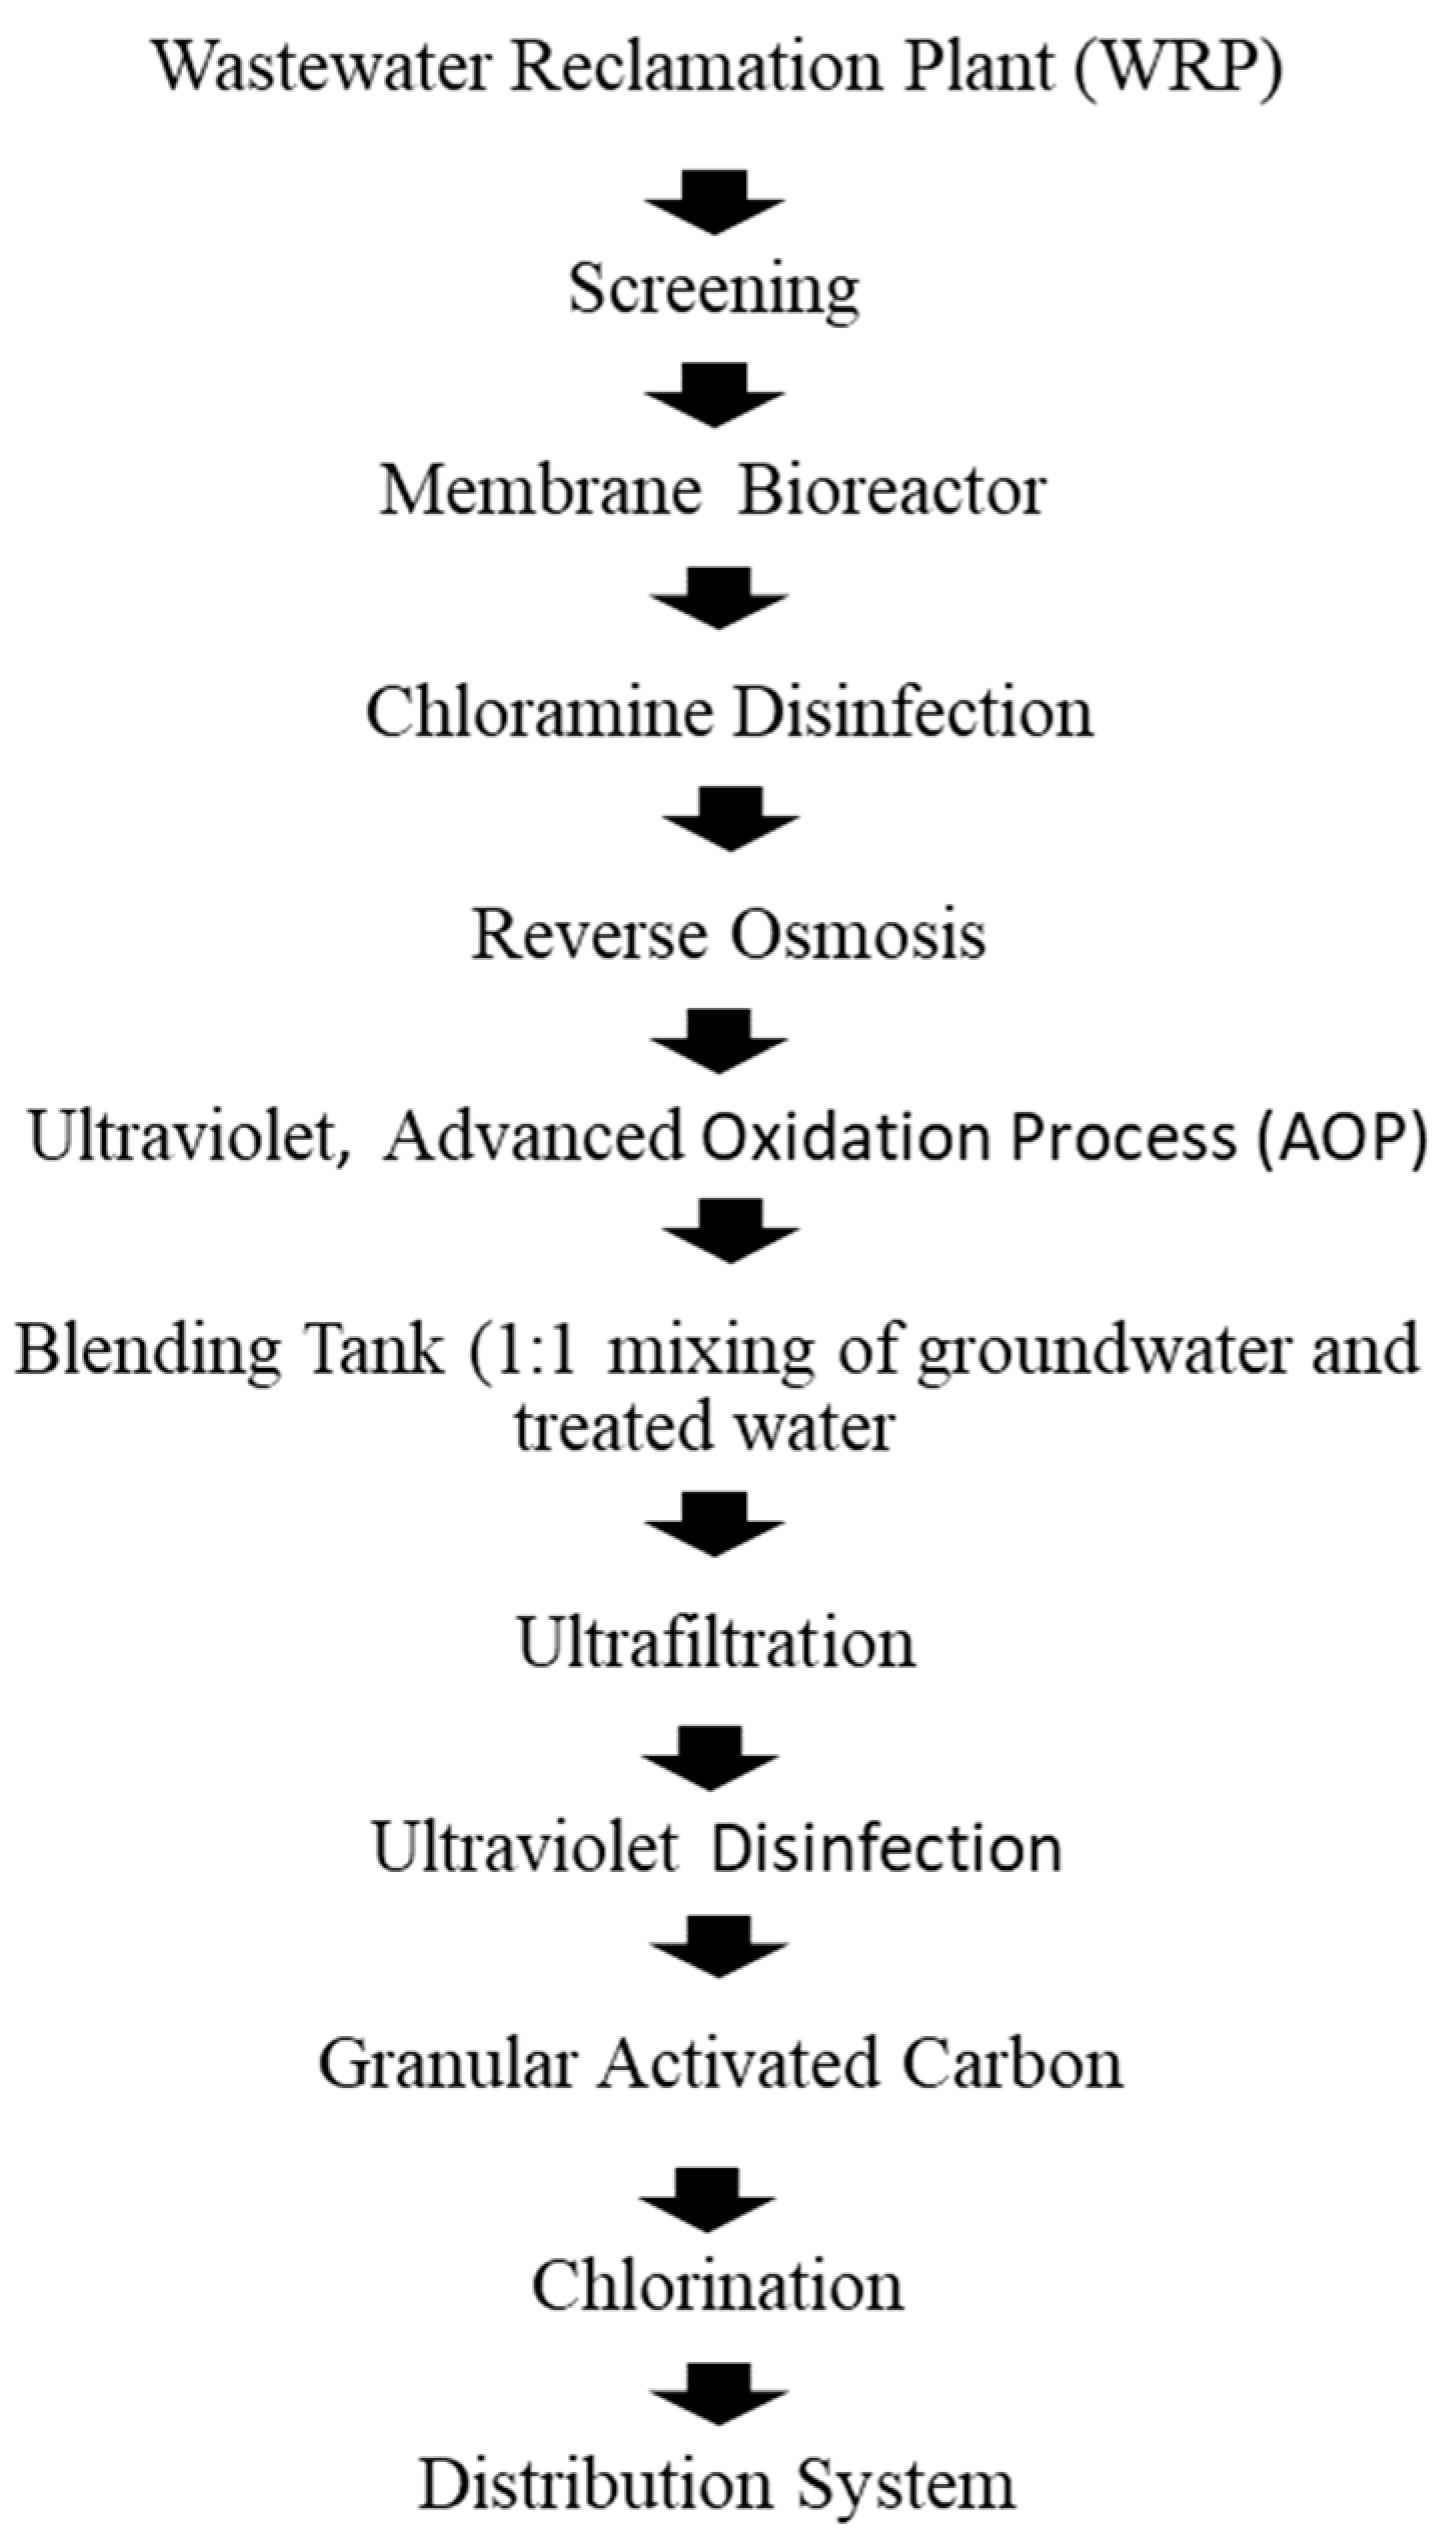
1.2. Reclamation Technologies

Reclaimed water has many uses in various sectors including industrial, agricultural irrigation, aquifer recharge, and use as potable drinking water. Guidelines or regulatory standards have been developed for each of these applications, mandating a combination of technologies that can produce the appropriate quality at an economically viable price. In principle, high-end technologies (intended for tertiary treatment) require the pretreatment of wastewater, which removes coarse and fine solids and uses biological activities for organic matter digestion.
The design aspects and selection of technology at traditional wastewater treatment plants are decided based on the influent quality, flow rates, effluent quality required for the intended reuse application, and contaminant mitigation targets. These contaminants include a broad range of organic molecules (size and shape), which can consist of more than 500 contaminants of emerging concern (CECs) and many different types of pathogens. The contaminants found in wastewater can range from recalcitrant to amenable to one or more technologies. The potable water reuse facilities are designed to augment drinking water supplies. The treatment train includes conventional processes to produce high-quality effluents amenable to additional advanced processes used in drinking water treatment plants.
The acute drought conditions are forcing the water industry to consider indirect potable water reuse (IPR) in their strategic planning. One of the largest and longest-operated IPR facilities in the world is the Advanced Water Treatment (AWT) Plant in the city of Scottsdale, Arizona, USA. The AWT Plant treats up to 20 million gallons of water a day, resulting in more than 1.7 billion gallons of purified recycled water being injected into the groundwater aquifer annually. During its 20 years of operation, the AWT Plant has recharged more than 70 billion gallons of highly purified water into the central Arizona aquifer for drinking water banking. The AWT Plant takes tertiary effluent from the city’s conventional water reclamation plant and further treats it through ozonation, ultrafiltration, reverse osmosis (RO), and ultraviolet (UV) disinfection [11]. The water from AWT Plant is being provided to 23 golf courses in north Scottsdale through a public–private partnership known as the Reclaimed Water Distribution System (RWDS). Through an agreement, golf clubs have invested more than $52 million for capital improvements to the system and the expansion of the AWT Plant to improve the quality of water being delivered. This arrangement between local golf courses and the city’s government set a precedent for other communities planning for sustainable water management.
Another noteworthy example of IPR is the groundwater replenishment system in Orange County, CA, USA, which employs microfiltration, reverse osmosis (RO), and advanced oxidation processes (AOPs) in their treatment train. The facility started operation in 2008 as the largest and the most technologically advanced potable reuse facility in the world [12].
The first two direct potable reuse (DPR) facilities built in the U.S. are Cloudcroft, New Mexico, and Big Spring, Texas, both of which use RO and AOPs [12]. The DPR facility at Cloudcroft uses a membrane bioreactor (MBR) to process its treated wastewater followed by disinfection. The disinfected water is stored and passes through RO and is again disinfected using UV. The treated water is stored in a reservoir, then blended with groundwater in a 1:1 ratio, and again treated with ultrafiltration, UV disinfection, and granular activated carbon (GAC), which is then pumped into the drinking water distribution system. The reclaimed water that had not been blended with groundwater is used for forest firefighting, construction, and road maintenance. The treatment train used at Cloudcroft for treating wastewater for DPR application is depicted in Figure 1 [13]. Briefly, wastewater is treated to effluent standards and then blended with groundwater from nearby wells. Further treatment takes place to achieve drinking water quality standards. The average water use in Cloudcroft is between 160,000 and 180,000 million gallons per day (MGD).
Groundwater is perceived to be clean because layers of the earth’s crust naturally filter out biotic and abiotic particulate matter [14,15]. Natural and anthropogenic chemicals and microbial contaminants have been known to be transported through the earth’s crust and reach groundwater [16,17,18]. Pathogens present in groundwater should be considered in the planning for the DPR projects involving blending groundwater with reclaimed water.
Water reuse has been practiced in the U.S. since the mid-last century. The states with major reuse program include California (48% of the total reuse projects in the US), Florida (23%), Texas (16%), Colorado (8%), Hawaii (1%), New Mexico (1%), Arizona (1%), and Washington (1%). These states have been leaders in the scientific research and legislative efforts to promote safe water reuse, with more than 760 water reuse projects [19,20].
Understandably, the early focus of the research and legislative efforts has been on non-potable or indirect potable reuse. However, stressors like climate change and expanded droughts have gradually shifted this focus to other areas such as different forms of potable reuse. During his governorship, Arnold Schwarzenegger signed a bill requiring the California Department of Public Health (CDPH) to investigate the feasibility of developing uniform water recycling criteria for DPR in 2016. The signing of that bill has resulted in increased interest in DPR, prompting the Water Environment Research Foundation and WateReuse California to launch a fundraising campaign for DPR research, resulting in $4 million in funds. Water reuse application in specific areas is discussed in the following sections.

1.3. Groundwater Recharge

The increasing groundwater depletion ratio presents an alarming scenario, requiring global efforts to conserve and recharge groundwater. According to an estimate, 2150 gigatons of groundwater were withdrawn between 1993 and 2010 worldwide [20,21], which is enough to raise sea level by more than 6.24 mm. When groundwater withdrawal exceeds the natural groundwater recharge for long times, it results in persistent groundwater depletion, a condition requiring artificial groundwater recharge.
Groundwater recharge is a practice in which a lithological matrix is used to store surplus surface water to supplement groundwater. There are 37 major aquifers in the world spread across 52 countries: 13 in Africa, 10 in Asia, 5 in North America, 3 in South America, 4 in Europe, and 2 in Australia [22,23]. Factors such as population growth, climate change, and industrial growth are threatening the sustainability of these water reserves. There are many regional transboundary agreements or treaties to address regional water resources challenges [24]. However, there is a need for revisions of these treaties and the development of frameworks to ensure the sustainability of aquifers at the global level. The authors of this manuscript suggest developing a credit-based system to account for the regional water recharge efforts. Such efforts are needed in the context of the global trend of mega urban development projects in water stressed areas located close to the transboundary aquifers. An example of such project is NEOM, located in the northwest of Saudi Arabia close to the borders of Egypt, Israel, and Jordan. All the countries are facing their own water security and sustainability challenges. Similar examples can be found in other regions. Municipal water providers in such regions are one of the major stakeholders of sustainable management water resources. Therefore, proactively coordinated efforts by water utilities in such areas can help in the formation of a coalition that can play a role in the peaceful and equitable management of water resources.

1.4. Groundwater Management

Groundwater represents approximately 30% of the total freshwater available on planet Earth and it supplies approximately half of the world’s drinking water supplies. Globally, it is among the most extracted materials from Earth. According to a recent study, 57% (21/37) of the major groundwater aquifers in the world have already reached sustainability tipping points due to rapid water withdrawal [25]. The rapid depletion of aquifer water reserves in Arizona was identified many decades ago and authorities were able to proactively develop an active management plan for the state, protecting and replenishing groundwater remains a critical priority for Arizona.
The state of Arizona experienced a major expansion of irrigated agriculture between 1940 and 1953. This boom in irrigated agriculture resulted in an unprecedented increase in the groundwater extraction rates, causing the groundwater levels to decline to alarming levels and a cession of year-round stream flows in many riparian areas of Arizona. Half a century ago, the overdraft of groundwater in central Arizona was estimated to be 2.5 million acre-feet annually. This resulted in substantial land subsidence and a lowering of aquifer levels by 300 to 400 feet in some areas of Arizona. Realizing the need for the proactive management of groundwater, the Arizona Water Banking Authority (AWBA) was established in 1996 to oversee the managed aquifer recharge efforts. The authority has used soil aquifer recharge operations to store nearly 5600 million cubic meters of surface water from the Colorado River.
During the same period, the population of Arizona, especially central Arizona, had grown at a rate of five times the national average. This rapid population growth came with the realization that Arizona has a limited supply of groundwater. This realization resulted in the significant diversification of water resources used by the Arizona Municipal Water Users Association (AMWUA). Currently, AMWUA cities derive 40% of their water from the Central Arizona Project (CAP) [Colorado River], more than 50% from the Salt River Project (SRP) [Salt and Verde Rivers], 9% from reclaimed water, and only 2% from groundwater.
During the last couple of decades, a significant decline in the reliance on groundwater, especially in central and southern Arizona, has been achieved by adopting innovative measures to conserve and store available water in aquifers. The Groundwater Management Act has been instrumental in these efforts to ensure that the state is ready to meet future growth challenges in a sustainable manner.

1.5. Agriculture/Irrigation

Domestic wastewater for irrigation is nothing new, as it was practiced in the Bronze Age (ca. 3200–1100 BC). This practice has been documented in Mesopotamian, Indus Valley, and Minoan civilizations [26]. Wastewater use for increased crop production in Scotland has been documented as far back as 1650. In modern times, the two primary uses of treated wastewater have been irrigation for agriculture and landscaping (e.g., parks and golf courses). However, the reuse of treated reclaimed water for agricultural irrigation is a market-driven practice, especially in the context of the scarcity of water resources in arid areas. The two critical aspects of water reuse from urban wastewater, especially for agricultural irrigation are as follows: (1) the technologies available to produce treated water from wastewater, focusing on the removal of contaminants (discussed elsewhere in this review), and (2) the legislations and standards regarding the reuse of wastewater in agriculture, as summarized in Table 2.
The public health and environmental risks of water reuse practices required relevant regulatory agencies to develop guidelines and regulations for the safe use of reclaimed water for various agronomic practices. Many countries and international organizations, such as the World Health Organization (WHO) and the Food and Agriculture Organization (FAO), have been actively involved for years in the development of regulations to reuse treated wastewater for irrigation purposes. In 2020, the European Union (EU) released regulations specifying the minimum requirements for water quality and monitoring and provisions for risk management for the safe use of reclaimed water in integrated water management (Table 2).
In 2020, the U.S. EPA in collaboration with other federal, state, and local stakeholders released the National Water Reuse Action Plan: Collaborative Implementation (Version 1). This Action Plan specifies 37 actions across 11 strategic themes and identifies action leaders, partners, implementation milestones, and target completion dates for each specific action. The regulation of irrigation water quality in the U.S. is governed by the Food and Drug Administration (FDA) under the Food Safety Modernization Act (FSMA) signed into law by President Obama in 2011. The irrigation water quality is covered under Subpart E of the FSMA—Produce Safety Rule. This proposed rule relies on systems-based pre-harvest agricultural water assessments to be used for hazard identification and risk management decision making. In general, the rule provisions are similar to the standard of drinking water, and it still needs to be finalized by the U.S. FDA. In July 2022, the FDA issued a supplemental notice of proposed rulemaking (SNPRM) to the agricultural water proposed rule to extend the compliance dates for the proposed pre-harvest agricultural water provisions with a proposed compliance date in 2025.

2. Legal and Regulatory Landscape

The Clean Water Act of 1972 and Safe Drinking Water Act of 1974 provide a foundation for states to develop regulation to oversee water reuse as it fit their conditions, and the U.S. EPA does not require or restrict any type of water reuse.

2.1. National and Regional Regulations

Globally, efforts have been made over the years to develop guidelines and directives for the safe reuse of treated wastewater. In 1973, the WHO issued the first water reuse guidelines which were revised in 1989 and 2006. Similarly, the Food and Agriculture Organization (FAO) issued its first water reuse guidelines in 1987 and revised them in 1999. Countries like Australia, Mexico, Iran, Egypt, Tunisia, Jordan, Palestine, Pakistan, Oman, China, Kuwait, Israel, Saudi Arabia, France, Cyprus, Spain, Greece, Portugal, and Italy have their own water reuse guidelines, which are mainly formulated based on the U.S.’s and the FAO’s frameworks. More recently, the European Union (EU) has issued water reuse guidelines that were published in 2020 and became applicable 26 June 2023. Based on practical and operational challenges, countries operating water reuse programs can be categorized in small geographically coherent countries (Israel and Singapore) and the large countries (U.S., Australia, China, Pakistan, and Saudi Arabia). Israel has one of the most well-recognized water-reuse programs globally. It is mostly focused on the use of recycled water for food crop irrigation as it is widely accepted by both farmers and the public. In Israel, direct or indirect potable reuse is not a major component in the national water reuse plan, as the direct potable reuse of water is considered a big risk for a small country such as Israel [27]. In the following sections, recent developments in water reuse efforts in the geographically large and diverse countries like the U.S. and Japan are presented.
In the US, different ecological zones are characterized by different challenges in water security, sustainability, and resilience areas, which determine the level and scope of water reuse. In the U.S., reuse applications are classified into nine categories and many states have developed their own regulations or guidelines for different applications. The states which have developed water reuse regulations for specific applications are summarized in Table 3; however, many states are actively working on their reuse regulations and upcoming changes to state laws or policies may not be reflected here.
In Japan, the use of reclaimed water for landscapes began in the Tamagawa Josui Restoration Project in 1984. Tamagawa Josui was originally constructed in the 17th century to transport fresh water from the Tama River to the Tokyo area. The Tamagawa Josui played a crucial role in providing a reliable water source for agriculture, industrial activities, and domestic use in the region. Additionally, it served as a water conveyance system until the relocation of the water purification plant in downtown Tokyo in 1965. Following this, the channel ceased to be utilized and gradually desiccated. To restore the picturesque landscape, highly treated wastewater was subsequently introduced. The water quality standards for reclaimed water were established by the Ministry of Land, Infrastructure, Transport and Tourism in 2005. In addition to conventional biological treatment, sand filtration or more advanced treatment processes are required. In addition to landscape water, standards have been set for toilet flushing water, gardening water, and recreational water. These standards mandate the use of chlorine disinfection except for landscapes, where coliform bacteria should not be detected in 100 milliliters.
At the global level, the growing pressures on the availability of water resources have pushed communities to explore potable reuse applications. Therefore, concerted efforts have been made to develop guidelines for direct potable reuse. These efforts have been summarized in the following section.

2.2. Direct Potable Reuse

Planned indirect portable reuse efforts commenced in the early 1960s and the earliest schemes included Montebello Forebay (Pico Rivera, CA, USA), the New Goreangab Plant (Windhoek, Namibia), Water Factory 21 (Orange County, CA, USA), and the Upper Occoquan Service Authority (Fairfax County, VA, USA). The very first legislative effort that paved the way for direct potable reuse was initiated by the state of Virginia by the development of the Policy for Wastewater Treatment and Water Quality Management in the Occoquan Watershed in 1972. This is commonly known as the “Occoquan Policy”, which mandated a new framework for planned potable reuse. The decision paved the way for the first full-scale plant of treated wastewater for the purpose of supplementing a surface water supply and helped in the establishment of pioneering treatment standards for the water reclamation facilities in the USA. The successful development of potable reuse programs has been demonstrated in Windhoek (Namibia), Emalahleni (Mpumalanga, South Africa), Big Spring (TX, USA), Laguna Madre (TX, USA), and Singapore.
Among the pioneering technical works in this area include the reports published by the American Water Works Association titled “Potable Reuse 101: An innovative and sustainable water supply solution” [29], and the “Framework for potable reuse” [30]. In 2017, the EPA issued the Potable Reuse Compendium, which outline the key scientific, technical, and policy considerations regarding this practice. This Compendium was a supplement to the US EPA Guidelines for Water Reuse issued in 2012.
The Arizona Department of Environmental Quality (AZDEQ) has begun a rulemaking process to revise the administrative code regarding direct potable reuse. While direct potable reuse is currently allowed under state regulations, this rulemaking will provide additional regulatory specificity to allow for the development of such projects. A draft rule was published in November of 2023 and the final rule is expected in 2024.
The California State Water Resources Control Board’s (SWRCB) Division of Drinking Water is in the process of developing uniform water recycling criteria for direct potable reuse. SWRCB was mandated to complete this process by 31 December 2023. Currently, it is in the process of developing risk-based water quality standards for the onsite treatment and reuse of non-potable water for non-potable end uses in multifamily residential, commercial, and mixed-use buildings.
The Colorado Department of Public Health and Environment (CDPHE) has developed a direct potable reuse rule as part of the Colorado Primary Drinking Water Regulations (Regulation 11). This rule is effective as of 14 January 2023. The New Mexico Environmental Department (NMED) has drafted both ASR/IPR and DPR Guidance, and the NMED was expected to finalize the draft DPR Guidance in 2022; however, still, there are no specific regulations for potable reuse.
The Washington Department of Health is considering adopting a new rule to establish water quality standards for onsite non-potable water reuse. This includes the onsite treatment and use of wastewater from all domestic fixtures, gray water, rainwater, stormwater, foundation drainage, and A/C condensate.

3. Emerging Contaminants

Microbial pathogens have emerged as a public health concern in water reuse applications. However, regulatory agencies have mainly focused on viral removal efficacy requirements to ensure safe water reuse. In addition, there is a long list of chemicals that are considered significant public health concerns for water reuse applications. PFAS is on the top of lists emphasized by regulatory agencies in recent years. Accordingly, this review is focused on these two groups of contaminants.
Potable reuse (both direct and indirect) generally involves advanced treatment of wastewater for the removal of microbiological and chemical contaminants to levels which are deemed below the risk threshold. The critical difference between DPR and IPR is the use of environmental buffers in IPR to reduce the risk associated with contaminants. This risk reduction is attributed to factors such as natural attenuation, dilution, blending and time to respond to treatment failure, and the reduction in negative public perceptions. The emerging concerns among the microbiological and chemical contaminants are viral pathogens and per and poly-fluoroalkyl substances (PFAS) which are discussed below. Recently, microplastics have been listed among the significant water contaminants [31]. However, scientific work on this group of contaminants is in the nascent stage, and they are not regulated. Therefore, they are not included in this review.

3.1. Pathogens

Microbial contaminants are a genuine concern in water reuse practices. Among pathogens, viruses are generally considered more resistant to environmental conditions and treatment technologies, including filtration and disinfection [32]. This can be due to their small size and special structural features. Therefore, a significant amount of research efforts has been exerted to identify viral indicators suitable for water quality monitoring. Somatic and F-specific coliphages have been used as viral indicators of pathogenic viruses for many years. Their use as viral indicators was promoted due to their similarity in shape, size, and replication mechanisms with the human viruses [33,34]. In addition, coliphages used as viral indicators have been recognized by regulatory authorities for different applications including reclaimed water, biosolids, and groundwater [33,34,35,36]. However, their ability to replicate in the environment and the lack of a clear correlation to human viruses’ concentrations have been contentious issues in their wide acceptance [37]. More recently, pepper mottle virus (PMMoV) and crAssphage have also been suggested as potential viral indicators/surrogates [38,39,40].
From a practical perspective, it has been suggested to select reference pathogens that can be used to determine the performance targets for microbial removal (log10 reductions), since it is impractical to set performance targets for all waterborne pathogens. Typically, reference pathogens are selected to represent broader microbial groups such as bacteria, viruses, and protozoa [41,42,43]. The first group of reference pathogens selected for water reuse and drinking water were Campylobacter for bacteria, rotavirus for viruses, and Cryptosporidium for protozoa [42,43,44]. These were also suggested as reference-pathogens for the drinking water systems.
Originally, rotavirus was selected as a reference pathogen for pathogenic enteric viruses as it represents a major viral gastroenteritis risk with a relatively high infectivity rate compared to other waterborne viruses [45,46]. In addition, adenoviruses are consistently detected in high numbers in untreated wastewater, and they are known for greater resistance to water treatment. Another enteric virus commonly detected in sewage is norovirus. The concentration and prevalence of these three viruses (rotavirus, norovirus, and adenovirus) in untreated wastewater could be similar [43,47].
Wastewater surveillance programs started due to the SARS-CoV-2 pandemic have resulted in an extensive amount of wastewater data that can help develop plans for reference pathogens; however, not many data are available on the value of SARS-CoV-2 as a process indicator.
The U.S. EPA guidelines do not include any specific viral indicators in their recommendations for water quality monitoring [45]. However, regarding indirect potable reuse for surface spreading or direct injection, the USEPA guidelines state that log10 removal credits for viruses can be based on challenge tests (spiking) or the sum of log10 removal credits allowed for individual treatment processes, although monitoring for viruses is not required. Different states are in the process of developing their water reuse including direct potable reuse regulations (Table 4).

3.2. Log-Reduction Monitoring Implementation in OCWD

Pathogenic microorganisms are present in wastewater effluents and need to be reduced by a considerable order of magnitude before being reused as potable. Regulators credit different water treatment processes with log-reduction values (LRVs). These LRVs must be verified at regular intervals or in real-time monitoring to document that any loss of treatment efficacy can be corrected promptly. The Advanced Water Purification Facility (AWPF) by the Orange County Water District (OCWD) purifies wastewater effluents and monitors for compliance with the Groundwater Replenishment System (GWRS) permit and alignment with the California Regional Water Quality Control Board (RWQCB). The GWRS permit by RWQCB was revised until 2022 [48].
According to the GWRS in 2022, the OCWD complied with pathogenic microorganism reduction requirements for low-pressure membranes consisting of microfiltration (MF) and ultrafiltration (UF), RO, and UV/AOP at the AWPF; in addition, underground retention time as an environmental buffer is considered [49]. No pathogen credits are claimed for the secondary biological treatment.
In the case of MF and UF, the process integrity is monitored via daily pressure decay testing (PDT) to receive pathogen log-reduction credits for Giardia cysts and Cryptosporidium oocysts. No credit for the reduction in the enteric virus is attributed to the process. A combination of online turbidity measurement and daily pressure decay test (PDT) results are used to show compliance with pathogen removal requirements [50]. The critical control points and critical limits designated for turbidity in the effluent and PDT establish the criteria that enable the process to demonstrate at least a 4-log reduction in Giardia cysts and Cryptosporidium oocysts. If a log reduction result based on the PDT calculation for an individual MF and UF process is less than 4-log, the affected process is taken out of service until the process can comply with the 4-log reduction requirement. Monthly reports are submitted to the Division of Drinking Water (DDW) in the California State Water Resources Control Board.
The RO process receives a nominal pathogen log-reduction credit of 2-log each for Giardia cysts, Cryptosporidium oocysts, and enteric virus, based on total organic carbon (TOC) monitoring. Online TOC analyzers continuously monitor the RO feed and product to determine the actual daily credit achieved. Minimum, maximum, and average results are recorded daily along with the calculated average percent daily TOC removal. Monthly reports are submitted to DDW and the RWQCB documenting the daily pathogen log reduction values achieved by the RO process. The RO process performance for pathogen reduction is measured using TOC removal. DDW has approved this methodology that uses online TOC as a surrogate for RO membrane integrity and pathogen reduction.
The UV/AOP process continuously monitors UV transmittance and UV train power levels at the feed as well as calculated UV dose and electrical energy dose (EED) at the ballast reactor. The pathogen reduction credits achieved by the UV/AOP process are based on these critical control points with the approval of DDW. The process receives up to 6-log pathogen log-reduction credits each for Giardia cysts, Cryptosporidium oocysts, and enteric virus. The online UV transmittance analyzer and ballast power level are used to verify the 6-log pathogen removal. By continuously monitoring the UV/AOP feed, a UV transmittance at 254 nanometers of at least 95% combined with a minimum UV power level of 74 kW per train ensures that a minimum EED of 0.23 kWh/kgal achieves the required 6-log pathogen reduction.
In addition, GWRS provides at least a 4-log reduction in viruses after surface spreading and direct injection daily virus LRV credit of 4-log. The groundwater injection operation complies with the GWRS permit requirements for the underground retention time, based on the 1-log virus reduction credit per month of underground retention time allowed by the Title 22 Water Recycling Criteria for groundwater recharge [50].

3.3. Per- and Poly-Fluoroalkyl Substances (PFAS)

Water reuse challenges cannot be holistically addressed without mentioning CECs due to the negative public perception of potable reuse projects. Among the major CECs such as N-nitrosamines, per- and poly-fluoroalkyl substances (PFAS), and hormones and other endocrine disrupting compounds [51], PFAS, so-called forever chemicals, have gained significant attention because the USEPA announced the final National Primary Drinking Water Regulation (NPDWR) for six PFAS in April 2024. The extreme persistence of PFAS and their tendency for buildup in the environment and biotic systems [52,53] warrant special consideration of these chemicals in water reuse planning for potable reuse and crop irrigation. PFAS is a group of manmade chemicals used in many consumer products and industrial processes since the 1950s. Although their use in everyday products has been monitored, they persist in the terrestrial and aquatic environments. For example, the median level of total targeted PFAS is 9500 ng/kg in fish caught from rivers and streams across the U.S. This highlights the gravity of PFAS contamination in aquatic environments. The primary focus of water reuse is reclamation of municipal and industrial wastewater. According to a recent study, the total average concentrations of PFAS in the influent of industrial wastewater samples ranged between 674 and 847 ng/L, and effluent samples ranged between 662 and 1143 ng/L [54]. Between 2013 and 2020, the national mean of PFOAs in wastewater treatment plant (WWTPs) effluents was 8.4 ± 0.4 ng/L [55]. The conventional wastewater treatment trains are generally inefficient in removing PFAS; however, many advanced technologies used for the wastewater reclamation process have been shown to be efficacious under different conditions, as discussed in the following sub-sections.
The protection of the public’s health from PFAS-containing wastewater is most relevant to potable water reuse applications because highly purified recycled water is indirectly or directly transported to drinking water treatment plants. In general, the sufficient removal of PFAS in water can be successfully achieved by advanced water treatment processes such as RO, granular activated carbon (GAC), and ion exchange (IEX) resins [56,57,58,59]. Among them, the RO process has been deployed in almost all recent advanced WWTPs for potable water reuse. These WWTPs comprise microfiltration, RO, and advanced oxidation (e.g., UV & H2O2 addition) which are recommended against microbial and chemical contaminants [58,60]. Although several other potential technologies are available for PFAS removal (e.g., chemical oxidation and plasma treatment) [61], this sub-section highlights the potential of practical wastewater treatment technologies and the challenges surrounding PFAS removal by these technologies in potable water reuse.
(i)
Treatment Technologies (High-Pressure Membrane Processes): Reverse Osmosis and Nanofiltration
Water treatment using brackish RO membranes is a reliable wastewater treatment process that can readily achieve >99% PFAS removal [62], including short-chain PFHxA (314 g/mol) and long-chain PFOS (MW = 500 g/mol), regardless of membrane selections (Table 5). The high removal is attributed to the size exclusion mechanism; PFAS molecules with molecular weights of >200 g/mol do not pass through the small free-volume holes of the RO membrane (RO’s molecular weight cut-off is approximately 100 g/mol). In fact, a RO process at a full-scale advanced WWTP was able to reduce PFAS concentrations (1–18 ng/L) to below their detection limits (Figure 2) [51]. Significant challenges associated with PFAS removal lie in managing the residual in RO concentrate. Most RO processes in potable water reuse are operated at a recovery of approximately 85% [63], and PFAS concentrations can increase by 6–7 folds from the RO feed (i.e., secondary or tertiary wastewater effluent) to the RO concentrate. Although many wastewater treatment plants located in the coastal areas are designed to discharge the RO concentrate into the deep ocean directly, several other cases discharge the RO concentrate to the receiving waterways after nutrient reduction [64], which can increase PFAS concentrations in the water environment. In these cases, the post-treatment of RO concentrates using adsorption-based successful processes such as GAC or IEX may be needed. However, the RO concentrate contains high concentrations of constituents (e.g., dissolved organic matter). This induces fast PFAS breakthroughs and frequent replacement/regeneration, which leads to the increased operation cost of potable water reuse.
Perfluorobutanoic acid (PFBA), Perfluorodecanoic acid (PFDA), Perfluorobehtanoic acid (PFHpA), Perfluorohexanesulfonic acid (PFHxs), Perfluorononanoic acid (PFNA), Perfluorooctanoic acid (PFOA), Perfluorooctane sulfonate (PFOS), and Perfluorononanoic acid (PFPnA) are used.
Nanofiltration (NF) with a molecular weight cut-off of 200–300 g/mol is an alternative high-pressure membrane technology that can separate PFAS in wastewater at lower energy consumption rates than RO. Most NF membranes in the literature show >90% PFAS removal (Table 6). Some PFAS molecules (molecular weight = 200–700 g/mol) are only slightly larger than NF’s pore sizes; thus, separation mechanisms other than the size exclusion (i.e., electrostatic repulsion and hydrophobic interactions) can highly influence their rejection. Therefore, NF membrane selection and adjustment of the solution matrix (e.g., feed pH and temperature) will be critical to ensure their sufficient removal. Significant challenges for adopting NF in potable water reuse include the rare uses of NF membranes for municipal water treatment, unlike RO membranes; NF has been rarely used for municipal wastewater recycling (there are only several cases for full-scale drinking water applications in the world [68], and there are no previous cases for potable reuse). Moreover, NF treatment has its concentrate management issues as RO concentrate. Despite the many challenges, the NF process has a high potential for separating PFAS in wastewater.
(ii)
Treatment Technologies (Adsorption Processes): GAC and IEX
GAC and IEX processes have been successfully adopted as powerful PFAS remediation technologies in water treatment. With a microporous structure, GAC has been extensively utilized to remove long-chain PFAS such as PFOAs and PFOSs for water purification purposes, mainly drinking water applications. For example, GAC (Bituminous coal) can achieve a mean of >94% removal of 14 PFAS, including PFOAs and PFOSs, in wastewater effluents over 90 d [72]. When the adsorption sites of GAC for any organics, including PFAS, are saturated, GAC can be reused through thermal reactivation at high temperature (e.g., 500–800 °C). The major potential issues surrounding GAC in potable reuse include the competition of adsorption sites with other constituents in wastewater. The adsorption site competition reduces the capacity of GAC for PFAS removal, ultimately leading to a rapid breakthrough through the column [73]. Further, wastewater contains high concentrations of organics (e.g., humic acid-like substances) and inorganics, leading to a considerably high frequency of reactivation processes. Although GAC can be employed after the process that removes most organics (e.g., RO and NF), these high-pressure membrane processes can also effectively remove PFAS. As a result, GAC in wastewater treatment may be best suited for polishing the recycled water at the end of the train.
The IEX process can also remove PFAS molecules in water. Anion exchange resins (AERs) have a positive surface charge on their surface; thus, they can remove negatively charged PFAS at the environmental pH. PFAS removal by AERs is generally superior to GAC on a normalized bed volume basis, particularly for short-chained ones [74], and their PFAS removal continues until the breakthrough occurs with adsorption site saturations. Some AERs have been designed explicitly for PFAS removal (e.g., Purolite A592E) [56]. However, AERs are generally more expensive than GAC. Further, they cannot be readily regenerated on-site; their cleaning protocols include solvent (e.g., methanol), sodium chloride solutions, or caustic sodium hydroxide solution [75]. As a result, they are likely disposed of through landfill or incineration. Although AERs have more potential to selectively adsorb PFAS than GACs, the adsorption sites can be readily occupied with other organics, inducing frequent replacements. Therefore, like GAC, AERs may be more suited to polishing the recycled water at the end of the train.

4. Contaminants Removal and Performance Monitoring Technologies

4.1. Hard Senor

The primary focus of WWTP operations is the removal of contaminants by the implementation of mechanical, biological, and chemical treatment processes. The major pollutants in wastewater include microorganisms, degradable organic substances, other organic compounds, biogenic elements (i.e., nitrogen and phosphorus), refractive and toxic substances, heavy metals, and other inorganic compounds. Since wastewater may have a broad range of different pollutants, the determination of each is impossible or very expensive. Therefore, not all pollutants found in wastewater are determined during the wastewater treatment and reclamation processes.
Some of the most helpful pollution indices for the assessment of a negative impact on the environment are the amount of consumed oxygen (O2) as COD (chemical oxygen demand) or BOD (biochemical oxygen demand) or the amount of carbon dioxide (CO2) generated as TOC (total organic carbon) and TSS (Total Suspended Solids) as a general pollution indicator. These indicative pollution indices are routinely determined across wastewater treatment trains
In recent years, a variety of sensors have been used for the real-time determination of these indicative pollution indices throughout the treatment processes and the major manufacturer of these sensors are Hach (CO, USA), YSI (OH, USA), Eureka Water Probes (TX, USA), Badger Meter (WI, USA), and Hydrolab (Straszyn, Poland). Biosensor-based technologies for microbial detection will be the next big innovation. Digital water technology industries are predicted to be over $2 billion in 2030. This is an extensive prospect for many areas encompassing the global market for creating an efficient and optimized system of wastewater treatment and distribution.
(i)
Sensors for Physical Properties
The following sensors are commonly used in wastewater treatment plants for the real-time monitoring of water quality and treatment performance: pH sensor, oxidation reduction potential (ORP) sensor, conductivity sensor, alkalinity sensor, turbidity sensors, dissolved oxygen sensor, and biochemical oxygen demand sensor.
(ii)
Sensors for Microbial Detection
Wastewater treatment infrastructure provides conditions favorable for the growth and survival of various microorganisms. A broad range of both pathogenic and non-pathogenic microorganisms are detected in wastewater treatment plants. The ratio of pathogenic and nonpathogenic microorganisms depends upon the sources of wastewater. For example, wastewater from domestic and healthcare facilities is expected to have a greater number of pathogenic microorganisms compared to industrial wastewater. Microorganisms are difficult to completely remove during WWT processes; therefore, wastewater reuse intrinsically carries higher public health risks. In this context, rapid and sensitive methods are required for the routine monitoring of microbial pathogens at different stages of WWTPs. The techniques available for the detection of microorganisms include culture-based, immunological, and molecular-based methods. The methods are relatively slow, labor intensive, and cumbersome and do not provide real-time information. Therefore, these methods are incapable of providing information in a timely manner to make appropriate and well-timed adjustments in the treatment processes. Microbial detection sensors have been reported for the rapid detection of bacterial pathogens [76,77]. The reliability of microbial detection sensors is a critical factor in their field implementation. Therefore, a strategy has been reported for the appropriate use of biosensors to collect reliable data on microbial concentration in treated waters [77]. Online sensor-based microbial detection provides an opportunity for rapid and onsite measurements of the levels of pathogens in treated waters.

4.2. Soft Sensors

To monitor the efficiency of pathogen reduction during wastewater reclamation process, it would be desirable to measure the pathogen concentrations before and after each process. However, the post-process pathogen concentrations are often below the quantification limit, making it difficult to accurately assess pathogen inactivation efficiency [78].
One option to achieve the real-time monitoring of pathogen reduction efficiency is to employ the soft sensor approach. For example, the applied disinfection intensity (such as chlorine or ozone dosage, ultraviolet intensity, and contact time) would be available for estimating the extent of virus inactivation because of their direct relevance to pathogen inactivation efficiency. However, disinfectants can be easily consumed by certain water contaminants, and ultraviolet radiation can decay before reaching pathogens due to the presence of other substances in the water. Therefore, the pathogen inactivation efficiency is also influenced by water quality in addition to the disinfection intensity. If it is possible to accurately predict pathogen inactivation efficiency using the disinfection intensity and water quality, it would be possible to monitor the pathogen inactivation efficacy without directly measuring pathogen concentration in water [79]. This is called a soft sensor system, in which a target phenomenon is monitored using mathematical models with related but indirect parameters, which would enable a convenient and appropriate assurance of microbiological safety, including viruses, in wastewater treatment plants [80].
When constructing a model to predict pathogen inactivation efficiency using disinfection intensity and water quality as explanatory variables, “predictive microbiology” must be known, which has been established in the field of food microbiology. Predictive microbiology is a research field [81] that involves the dynamic modeling of growth and inactivation of microorganisms contaminating food during disinfection and storage. It has experienced sustained development, driven by a strong demand in the food industry to prevent foodborne illnesses. Currently, there are freely available web-based calculation software tools like ComBase [82] that facilitate predictive microbiology studies.
“Predictive microbiology” is indispensable for the application of Hazard Analysis and Critical Control Points (HACCP), which was initially conceived by NASA during the Apollo program for the hygiene management of space food and has since expanded into various fields. HACCP, in essence, ensures the quality of a product not solely based on post-production inspection results but by monitoring whether the intended processing steps are properly executed (preferably in real-time) during the production stage. This framework takes into consideration the time required for microbiological testing of sampled products, which can take up to a day for culture-based methods or even approximately half a day for genetic testing. By determining the required disinfection level and storage conditions based on model calculations of microbial growth and inactivation profiles, HACCP aims to prevent microbial contamination of food by continuously monitoring these conditions (such as temperature and time) at critical control points (CCPs).
The World Health Organization (WHO) has employed HACCP in the Water Safety Plan (WSP) [83] and Sanitation Safety Planning (SSP) [84]. However, the effective application of predictive microbiology in WSP and SSP has been questioned [85] due to the extent of variability in water qualities and the treatment duration (longer contact time with disinfectants or exposure time to ultraviolet radiation). Consequently, the presence of organic/inorganic substances, which exist at significantly higher concentrations than pathogens in wastewater, continuously interacts with various chemical reactions during disinfection processes, thereby influencing the disinfection efficacy. Hence, for HACCP to fulfill its intended effectiveness in the WSP and SSP, the establishment of an academic program specifically focusing on this area. The term “Environmental Predictive Microbiology” corresponds to such a field, in which the construction of pathogen disinfection and inactivation models is aimed that can be applied under various environmental conditions. If it becomes possible to develop pathogen disinfection models that can accommodate water quality variations, it would be feasible to obtain critical control values, such as dosage rates of disinfectants or contact times, to be monitored at CCPs. Previous reports have focused on virus inactivation models using free chlorine [86], total chlorine [87], ozone [79], and pathogen inactivation models in solid waste derived from feces [88].

4.3. Industrial Wastewater Reuse

The industrial sector is responsible for approximately 25% of wastewater produced globally [19,20]. With time, the share of industrial wastewater production is increasing. Therefore, it is imperative to implement better wastewater treatment and reuse initiatives to achieve sustainability goals. Traditionally, the term “net-zero” has been used by industries to develop technologies capable of meeting climate change challenges such as curbing greenhouse gas emissions. However, in recent years there has been a wave of net-zero pledges that focus on water conservation because a 40% shortfall in freshwater resources is predicted by 2030 [89]. Sometimes, these pledges are referred to as “water positive”, focusing on increasing the efficacy of water-intensive processes requiring more water to be put back into a geographic area where a company operates than the water they take out. Such “water positive” pledges have been made by companies like British Petroleum (BP), Facebook (currently Meta), and Gap in their direct operations in the coming years. PepsiCo is another company that has announced such a pledge by planning to replenish more than 100% of water used at all high-water-risk sites by 2030 while reducing 50% of water use simultaneously.

5. Wastewater Reuse in Semiconductor Industry

The semiconductor industry is among those that consume significant amounts of water, necessitating substantial initiatives for water reuse, conservation, and recycling. The increasing adoption of water reuse mirrors a broader movement toward sustainability and resource preservation across multiple sectors [90]. Many major semiconductor companies such as the Intel Corporation, the Taiwan Semiconductor Manufacturing Company (TSMC), and Samsung Semiconductor have implemented water reuse strategies [90]. For instance, Samsung Semiconductor employs activated carbon filtering, acid-base neutralization, coagulating sedimentation, and RO systems to treat their acidic, alkaline, and fluoric wastewater. The reclaimed water is then utilized for cooling towers, gas treatment facilities, and landscaping purposes [90]. These initiatives are aimed at mitigating water-related risks and reducing the industry’s environmental impact. However, the implementation of water reuse in semiconductor manufacturing presents a series of formidable technical challenges that demand innovative solutions for efficient and sustainable operations.
Ensuring the required level of water purity at different stages of the manufacturing process is a significant hurdle. Semiconductors are highly sensitive to impurities, making even trace contaminants in water detrimental to the manufacturing process. Additionally, particles suspended in water can lead to defects in semiconductor products, necessitating stringent control measures to maintain product quality. The complexity of the semiconductor manufacturing process, involving various chemical reactions, further complicates matters. Chemical reactions can result in the formation of byproducts, residues, and alterations in water quality and composition, posing a challenge in managing these intricate chemical interactions within recycled water. Real-time monitoring and consistent maintenance of water quality are imperative. Therefore, the development of robust monitoring and control systems becomes crucial to ensuring product quality. One potential solution involves diverting recycled water for non-critical processes or cooling applications instead of employing it directly in semiconductor manufacturing [91,92].
Water treatment and purification for reuse involve energy-intensive processes, including filtration, RO, and UV treatment. The challenge lies in balancing the energy consumption of these processes with the environmental benefits of water reuse. Moreover, if membrane-based filtration methods are employed, fouling of membranes due to organic and inorganic materials can compromise filtration efficiency [93]. Addressing this issue requires the development of effective fouling prevention and cleaning strategies.
Designing and optimizing the reuse infrastructure for large-scale operations presents additional hurdles. Scaling up water reuse systems while maintaining consistent water quality and availability is a complex task. Corrosion-resistant materials must be carefully chosen and compatibility must be ensured with the infrastructure and equipment, considering that recycled water may have different chemical properties compared to fresh water. These disparities can lead to potential corrosion and material compatibility issues, underscoring the importance of meticulous material selection.
Implementing advanced water treatment and recycling systems necessitates a significant upfront investment. Semiconductor manufacturers face the challenge of balancing these initial costs with long-term operational savings and environmental benefits, making strategic financial decisions critical to the success of water reuse initiatives. Furthermore, the semiconductor industry operates under stringent regulatory standards, particularly concerning water quality and environmental impact. Ensuring that recycled water meets these standards and obtaining the necessary permits poses regulatory challenges.
To overcome these multifaceted challenges, a comprehensive approach is required. This approach involves the integration of advanced water treatment technologies, process optimization, materials science expertise, and the implementation of data monitoring and control systems. Collaboration between semiconductor manufacturers, water treatment experts, and regulatory bodies is essential to develop innovative solutions and ensure the successful implementation of water reuse strategies in the semiconductor industry.

6. Conclusions

The current scenario of population growth and climate change is going to impact sustained water availability in future, forcing aggressive water reuse practices. Successful operation of water reuse projects across different communities is a big challenge. The real challenge lies in the task of developing public education and outreach programs to achieve wider public support and acceptance for direct or indirect potable reuse applications. This can be accomplished by public involvement including regular site tours along with social media campaigns for public education regarding the effectiveness of treatments and the regulatory requirements for public health protection. The USA and Singapore have been the flag bearers for decades in realizing water reuse concepts and public outreach. Moreover, these countries have led efforts in developing standards and guidelines for treating wastewater for potable and non-potable reuse. In the U.S., the state of California has played a leading role in the regulation and technology assessment for reuse applications. These regulations have been widely adopted by different cities and state agencies.
This review article covers the treatment technologies and the regulations that provide solutions and guidelines for the adequate provision of reclaimed water. However, innovations are needed in the efficacious and cost-effective removal technologies for viral pathogens and PFAS to the levels deemed safe for human consumption. Further, the management of concentrate (from membrane processes) and regeneration waste disposal (from ion exchange) is one of the primary challenges for achieving sustainable water reuse because the wastes could contain high concentrations of pathogens and PFAS. The technical challenges of water reuse applications can certainly be addressed using an array of innovative treatment technologies. However, dwindling public funds limits the actionable measures for tangible improvement by adopting available cutting-edge technologies. Under the prevailing circumstances, public–private partnerships at the global level are a viable option for upgradation of water infrastructures. The implementation of advanced technologies as well as pertinent regulations is an imminent future need, and targeted public outreach can expedite the actualization of water reuse practices.

Author Contributions

Conceptualization, M.A., A.A., D.S. and H.K.; information collection M.A., A.A., M.K., T.F., Y.M., D.S. and H.K.; information curation M.A., A.A., M.K., T.F., Y.M., D.S. and H.K.; information analyses and verification M.A., A.A., M.K., T.F., Y.M., D.S. and H.K.; writing—original draft, M.A., A.A., M.K., T.F., Y.M., D.S. and H.K.; writing—review and editing M.A., A.A., M.K., T.F., Y.M., D.S. and H.K.; project administration, M.A.; funding acquisition, M.A. All authors have read and agreed to the published version of the manuscript.

Funding

This research received no external funding.

Data Availability Statement

Data will be made available on request.

Acknowledgments

The work was supported in part by the Water and Environmental Technology (WET) Center at Arizona State University, Tempe, Arizona.

Conflicts of Interest

Author Yasuhiro Matsui was employed by the company Yokogawa Electric Corporation. All authors declare that the research was conducted in the absence of any commercial or financial relationships that could be construed as a potential conflict of interest.

References

  1. Ekwurzel, B.; Schlosser, P.; Smethie, W.M., Jr.; Plummer, L.N.; Busenberg, E.; Michel, R.L.; Weppernig, R.; Stute, M. Dating of shallow groundwater: Comparison of the transient tracers 3H/3He, chlorofluorocarbons and 85Kr. Water Resour. Res. 1994, 30, 1693–1708. [Google Scholar] [CrossRef]
  2. USGS. Groundwater Age. 2019. Available online: https://www.usgs.gov/mission-areas/water-resources/science/groundwater-age\ (accessed on 8 August 2023).
  3. McMahon, P.B.; Plummer, L.N.; Böhlke, J.K.; Shapiro SDHinkle, S.R. A comparison of recharge rates in aquifers of the United States based on groundwater-age data. Hydrogeol. J. 2011, 19, 779–800. [Google Scholar] [CrossRef]
  4. Schladweiler, J.C. Tracking Down the Roots of Our Sanitary Sewers. Historian: Arizona Water and Pollution Control Association (WEF, Section—AWWA) (Phoenix, AZ). 2002. Available online: http://www.sewerhistory.org/time-lines/tracking-down-the-roots-of-our-sanitary-sewers (accessed on 8 August 2023).
  5. Smith, M. The aztec silent majority: William, T. Sanders and the study of the aztec peasantry. In Arqueología Mesoamericana: Homenaje a William; Sanders, T., Mastache, A.G., Parsons, J.R., Santley, R.S., Serra Puche, M.C., Eds.; Instituto Nacional de Antropología e Historia: Mexico City, Mexico, 1996; Volume 1, pp. 375–386. [Google Scholar]
  6. Villalonga, G.A. Hydraulic Imperialist from Aztecs in the Mexico Valley. Water Technol. 2007, 27, 78–91. (In Spanish) [Google Scholar]
  7. UNESCO. World Heritage Convention. World Heritage Office (INAH) Mexico’s National Commission for UNESCO (CONALMEX) Puebla 95. 2004. Available online: https://whc.unesco.org/en/tentativelists/1968/ (accessed on 8 August 2023).
  8. Barshan, M. Rocks, Clay and Bricks, Water in Persepolis, Burned City and Bam; Oragh Publisher: Tehran, Iran, 2011. [Google Scholar]
  9. USEPA. Summary of the Clean Water Act. 2023. Available online: https://www.epa.gov/laws-regulations/history-clean-water-act (accessed on 14 May 2024).
  10. Angelakis, A.N.; Asano, T.; Bahri, A.; Jimenez, B.E.; Tchobanoglous, G. Water Reuse: From Ancient to Modern Times and the Future. Front. Environ. Sci. 2018, 6, 26. [Google Scholar] [CrossRef]
  11. McGuire, M.J. The Chlorine Revolution: Water Disinfection and the Fight to Save Lives; American Water Works Association: Denver, CO, USA, 2013. [Google Scholar]
  12. Tchobanoglous, G.; Leverenz, H.; Nellor MMCrook, J. Direct Potable Reuse: A Path Forward; WateReuse Research Foundation: Alexandria, VA, USA, 2011. [Google Scholar]
  13. Davis, M.L. 2019. Direct and Indirect Potable Reuse. In Water and Wastewater Engineering: Design Principles and Practice, 2nd ed.; McGraw-Hill Education. Government of Canada: New York, NY, USA, 2017; pp. 1237–1252. [Google Scholar]
  14. Available online: https://www.canada.ca/en/environment-climate-change/services/water-overview/pollution-causes-effects/groundwater-contamination.html (accessed on 5 July 2024).
  15. McBurnett, L.R.; Holt, N.T.; Alum, A.; Abbaszadegan, M. Legionella—A threat to groundwater: Pathogen transport in recharge basin. Sci. Total Environ. 2018, 621, 1485–1490. [Google Scholar] [CrossRef]
  16. Abbaszadegan, M.; LeChevallier, M.; Gerba, C.P. Occurrence of viruses in US groundwaters. J.-Am. Water Work. Assoc. 2003, 95, 107–120. [Google Scholar] [CrossRef]
  17. Borchardt, M.A.; Bertz, P.D.; Spencer, S.K.; Battigelli, D.A. Incidence of enteric viruses in groundwater from household wells in Wisconsin. Appl. Environ. Microbiol. 2003, 69, 1172–1180. [Google Scholar] [CrossRef]
  18. Locas, A.; Barthe, C.; Barbeau, B.; Carrière, A.; Payment, P. Virus occurrence in municipal groundwater sources in Quebec, Canada. Can. J. Microbiol. 2007, 53, 688–694. [Google Scholar] [CrossRef]
  19. Bluefield Research. Looking Beyond Drought, 17 States Invest in Water Reuse as a Long-Term Supply Strategy. 2017. Available online: https://www.bluefieldresearch.com/ns/looking-beyond-drought-17-states-invest-water-reuse/ (accessed on 9 August 2023).
  20. Wada, Y.; van Beek, L.P.H.; van Kempen, C.M.; Reckman, J.W.T.M.; Vasak, S.; Bierkens, M.F.P. Global depletion of groundwater resources. Geophys. Res. Lett. 2010, 37, L20402. [Google Scholar] [CrossRef]
  21. Seo, K.W.; Ryu, D.; Eom, J.; Jeon, T.; Kim, J.S.; Youm, K. Drift of Earth’s pole confirms groundwater depletion as a significant contributor to global sea level rise 1993–2010. Geophys. Res. Lett. 2023, 50, e2023GL103509. [Google Scholar] [CrossRef]
  22. Jasechko, S.; Seybold, H.; Perrone, D. Rapid groundwater decline and some cases of recovery in aquifers globally. Nature 2024, 625, 715–721. [Google Scholar] [PubMed]
  23. Van der Gun, J. Large Aquifer Systems Around the World; The Groundwater Project: Guelph, ON, Canada, 2022. [Google Scholar] [CrossRef]
  24. Hussein, H.; Poplawsky, M.; Mohapatra, T. The political context of change in transboundary freshwater agreements. Environ. Sci. Policy 2023, 149, 103572. [Google Scholar] [CrossRef]
  25. Richey, A.S.; Thomas, B.F.; Lo, M.H.; Reager, J.T.; Famiglietti, J.S.; Voss, K.; Swenson, S.; Rodell, M. Quantifying renewable groundwater stress with GRACE. Water Resour. Res. 2015, 51, 5217–5238. [Google Scholar] [CrossRef]
  26. Angelakis, A.N.; Snyder, S.A. Wastewater Treatment and Reuse: Past, Present, and Future. Water 2015, 7, 4887–4895. [Google Scholar] [CrossRef]
  27. Sneegas, G.; Seghezzo, L.; Brannstrom, C.; Jepson, W.; Eckstein, G. Do not put all your eggs in one basket: Social perspectives on desalination and water recycling in Israel. Water Policy 2022, 24, 1772–1795. [Google Scholar] [CrossRef]
  28. USEPA. Water Reuse Regulations and Guidelines. Available online: https://www.epa.gov/waterreuse/maps-states-water-reuse-regulations-or-guidelines (accessed on 23 March 2024).
  29. Gerling, A. Potable Reuse 101: An Innovative and Sustainable Water Supply Solution; American Water Works Association: Denver, CO, USA, 2016. [Google Scholar]
  30. Tchobanoglous, G.; Cotruvo, J.; Crook, J.; McDonald, E.; Olivieri, A.; Salveson, A.; Trussell, R.S. Framework for Direct Potable Reuse; WateReuse Research Foundation: Alexandria, VA, USA, 2015. [Google Scholar]
  31. Padervand, M.; Lichtfouse, E.; Robert, D. Removal of microplastics from the environment. A review. Environ. Chem. Lett. 2020, 18, 807–828. [Google Scholar] [CrossRef]
  32. Abbaszadegan, M.; Monteiro, P.; Nwachuku, N.; Alum, A.; Ryu, H. Removal of adenovirus, calicivirus, and bacteriophages by conventional drinking water treatment. J. Environ. Sci. Health Part A 2008, 43, 171–177. [Google Scholar] [CrossRef]
  33. Grabow, W. Bacteriophages: Update on application as models for viruses in water. Water SA 2001, 27, 251–268. [Google Scholar] [CrossRef]
  34. Jofre, J. Indicators of waterborne viruses. In Human Viruses in Water; Bosch, A., Ed.; Perspectives in Medical Virology, 17; Elsevier Science: Amsterdam, The Netherlands, 2007. [Google Scholar]
  35. QEPA. Queensland Water Recycling Guidelines; WaterWise; Queensland Environmental Protection Agency: Brisbane, Australia, 2005. [Google Scholar]
  36. NHMRC-NRMMC. Australian Drinking Water Guidelines; Natural Resource Management Ministerial Council, National Health and Medical Research Council: Canberra, Australia, 2011.
  37. DEC. Western Australian Guidelines for Biosolids Management; Department of Environment and Conservation: Perth, Australia, 2012. [Google Scholar]
  38. USEPA. National Primary Drinking Water Regulations: Groundwater Rule; Final Rule. 40 CFR, Federal Register; The Daily Journal of the United States Government: Washington, DC, USA, 2006; Volume 71.
  39. Jofre, J.; Lucena, F.; Blanch, A.R.; Muniesa, M. Coliphages as Model Organisms in the Characterization and Management of Water Resources. Water 2016, 8, 199. [Google Scholar] [CrossRef]
  40. Arts, P.J.; Kelly, J.D.; Midgley, C.M.; Anglin, K.; Lu, S.; Abedi, G.R.; Andino, R.; Bakker, K.M.; Banman, B.; Boehm, A.B.; et al. Longitudinal and quantitative fecal shedding dynamics of SARS-CoV-2, pepper mild mottle virus, and crAssphage. mSphere 2023, 8, e0013223. [Google Scholar] [CrossRef]
  41. Park, G.W.; Ng, T.F.F.; Freeland, A.L.; Marconi, V.C.; Boom, J.A.; Staat, M.A.; Montmayeur, A.M.; Browne, H.; Narayanan, J.; Payne, D.C.; et al. CrAssphage as a Novel Tool to Detect Human Fecal Contamination on Environmental Surfaces and Hands. Emerg. Infect. Dis. 2020, 26, 1731–1739. [Google Scholar] [CrossRef]
  42. Kitajima, M.; Sassi, H.P.; Torrey, J.R. Pepper mild mottle virus as a water quality indicator. NPI Clean Water 2018, 1, 19. [Google Scholar] [CrossRef]
  43. NRMMC-EPHC-AHMC. Australian Guidelines for Water Recycling: Managing Health and Environmental Risks: Phase 1. National Water Quality Management Strategy; Natural Resource Management Ministerial Council, Environment Protection and Heritage Council, Australian Health Ministers’ Conference: Canberra, Australia, 2006. [Google Scholar]
  44. WHO. Guidelines for the Safe Use of Wastewater, Excreta and Greywater; World Health Organization: Geneva, Switzerland, 2006; Volume 2, Wastewater Use in Agriculture. [Google Scholar]
  45. USEPA. Guidelines for Water Reuse; (EPA/600/R-12/618); United States Environmental Protection Agency: Washington, DC, USA, 2012.
  46. Havelaar, A.; Melse, J. Quantifying Public Health Risk in the WHO Guidelines for Drinking-Water Quality: A Burden of Disease Approach; WHO: Geneva, Switzerland, 2003. [Google Scholar]
  47. Ryu, H.; Addor, Y.; Brinkman, N.E.; Ware, M.W.; Boczek, L.; Hoelle, J.; Villegas, E.N. Understanding microbial loads in wastewater treatment works as source water for water reuse. Water 2021, 13, 1452. [Google Scholar] [CrossRef] [PubMed]
  48. California Regional Water Quality Control Board. Groundwater Replenishment System 2022 Annual Report. 2022. Available online: https://www.waterboards.ca.gov/santaana/board_decisions/adopted_orders/orders/2022/r8-2022-0002.pdf (accessed on 15 May 2024).
  49. Orange County Water District, Groundwater Replenishment System. Annual Report (2022). 2022. Available online: https://www.ocwd.com/wp-content/uploads/2022-GWRS-Annual-Report.pdf (accessed on 6 August 2023).
  50. State Water Resources Control Board 2018. The 2018 California Integrated Report Is Available on the State Water Board’s Website. Available online: https://www.waterboards.ca.gov/water_issues/programs/water_quality_assessment/2018_integrated_report.html (accessed on 15 May 2024).
  51. Steinle-Darling, E.; Salveson, A.; Sutherland, J.; Dickenson, E.; Hokanson, D.; Trussell, S.; Stanford, B. Direct Potable Reuse Monitoring: Testing Water Quality in a Municipal Wastewater Effluent Treated to Drinking Water Standards, Texas Water Development. 2016. Available online: https://www.twdb.texas.gov/publications/reports/contracted_reports/doc/1348321632_vol1.pdf (accessed on 6 August 2023).
  52. Ghisi, R.; Vamerali, T.; Manzetti, S. Accumulation of perfluorinated alkyl substances (PFAS) in agricultural plants: A review. Environ. Res. 2019, 169, 326–341. [Google Scholar] [CrossRef]
  53. Davis, M.J.B.; Evich, M.G.; Goodrow, S.M.; Washington, J.W. Environmental Fate of Cl-PFPECAs: Accumulation of Novel and Legacy Perfluoroalkyl Compounds in Real-World Vegetation and Subsoils. Environ. Sci. Technol. 2023, 57, 8994–9004. [Google Scholar] [CrossRef]
  54. Barisci, S.; Suri, R. Occurrence and Removal of Poly/Perfluoroalkyl Substances (PFAS) in Municipal and Industrial Wastewater Treatment Plants. Water Sci. Technol. 2021, 84, 3442–3468. [Google Scholar] [CrossRef] [PubMed]
  55. Thompson, K.A.; Mortazavian, S.; Gonzalez, D.J.; Bott, C.; Hooper, J.; Schaefer, C.E.; Dickenson, E.R. Poly- and Perfluoroalkyl Substances in Municipal Wastewater Treatment Plants in the United States: Seasonal Patterns and Meta-Analysis of Long-Term Trends and Average Concentrations. ACS EST Water 2022, 2, 690–700. [Google Scholar] [CrossRef]
  56. Dixit, F.; Dutta, R.; Barbeau, B.; Berube, P.; Mohseni, M. PFAS removal by ion exchange resins: A review. Chemosphere 2021, 272, 129777. [Google Scholar] [CrossRef]
  57. Lee, T.; Speth TFNadagouda, M.N. High-pressure membrane filtration processes for separation of Per- and polyfluoroalkyl substances (PFAS). Chem. Eng. J. 2022, 431, 134023. [Google Scholar] [CrossRef]
  58. Liu, C.; Zhao, X.; Faria, A.F.; Deliz Quiñones, K.Y.; Zhang, C.; He, Q.; Ma, J.; Shen, Y.; Zhi, Y. Evaluating the efficiency of nanofiltration and reverse osmosis membrane processes for the removal of per- and polyfluoroalkyl substances from water: A critical review. Sep. Purif. Technol. 2022, 302, 122161. [Google Scholar] [CrossRef]
  59. Murray, C.C.; Marshall, R.E.; Liu, C.J.; Vatankhah HBellona, C.L. PFAS treatment with granular activated carbon and ion exchange resin: Comparing chain length, empty bed contact time, and cost. J. Water Process Eng. 2021, 44, 102342. [Google Scholar] [CrossRef]
  60. WHO. Potable Reuse: Guidance for Producing Safe Drinking Water; World Health Organization: Geneva, Switzerland, 2017. [Google Scholar]
  61. Verma, S.; Varma, R.S.; Nadagouda, M.N. Remediation and mineralization processes for per- and polyfluoroalkyl substances (PFAS) in water: A review. Sci. Total Environ. 2021, 794, 148987. [Google Scholar] [CrossRef] [PubMed]
  62. Mastropietro, T.F.; Bruno, R.; Pardo, E.; Armentano, D. Reverse osmosis and nanofiltration membranes for highly efficient PFASs removal: Overview, challenges and future perspectives. Dalton Trans. 2021, 50, 5398–5410. [Google Scholar] [CrossRef]
  63. Fujioka, T.; Khan, S.J.; Poussade, Y.; Drewes, J.E.; Nghiem, L.D. N-nitrosamine removal by reverse osmosis for indirect potable water reuse—A critical review based on observations from laboratory-, pilot- and full-scale studies. Sep. Purif. Technol. 2012, 98, 503–515. [Google Scholar] [CrossRef]
  64. Solley, D.; Gronow, C.; Tait, S.; Bates JBuchanan, A. Managing the reverse osmosis concentrate from the Western Corridor Recycled Water Scheme. Water Pract. Technol. 2010, 5, 18. [Google Scholar] [CrossRef]
  65. Tang, C.Y.; Fu, Q.S.; Criddle, C.S.; Leckie, J.O. Effect of Flux (Transmembrane Pressure) and Membrane Properties on Fouling and Rejection of Reverse Osmosis and Nanofiltration Membranes Treating Perfluorooctane Sulfonate Containing Wastewater. Environ. Sci. Technol. 2007, 41, 2008–2014. [Google Scholar] [CrossRef]
  66. Tang, C.Y.; Fu, Q.S.; Robertson, A.P.; Criddle CSLeckie, J.O. Use of Reverse Osmosis Membranes to Remove Perfluorooctane Sulfonate (PFOS) from Semiconductor Wastewater. Environ. Sci. Technol. 2006, 40, 7343–7349. [Google Scholar] [CrossRef] [PubMed]
  67. Soriano, Á.; Gorri, D.; Urtiaga, A. Selection of High Flux Membrane for the Effective Removal of Short-Chain Perfluorocarboxylic Acids. Ind. Eng. Chem. Res. 2019, 58, 3329–3338. [Google Scholar] [CrossRef]
  68. Cyna, B.; Chagneau, G.; Bablon, G.; Tanghe, N. Two years of nanofiltration at the Méry-sur-Oise plant, France. Desalination 2002, 147, 69–75. [Google Scholar] [CrossRef]
  69. Boo, C.; Wang, Y.; Zucker, I.; Choo, Y.; Osuji, C.O.; Elimelech, M. High Performance Nanofiltration Membrane for Effective Removal of Perfluoroalkyl Substances at High Water Recovery. Environ. Sci. Technol. 2018, 52, 7279–7288. [Google Scholar] [CrossRef]
  70. Hang, X.; Chen, X.; Luo, J.; Cao, W.; Wan, Y. Removal and recovery of perfluorooctanoate from wastewater by nanofiltration. Sep. Purif. Technol. 2015, 145, 120–129. [Google Scholar] [CrossRef]
  71. Toure, H.; Anwar Sadmani, A.H.M. Nanofiltration of perfluorooctanoic acid and perfluorooctane sulfonic acid as a function of water matrix properties. Water Supply 2019, 19, 2199–2205. [Google Scholar] [CrossRef]
  72. Rostvall, A.; Zhang, W.; Dürig, W.; Renman, G.; Wiberg, K.; Ahrens, L.; Gago-Ferrero, P. Removal of pharmaceuticals, perfluoroalkyl substances and other micropollutants from wastewater using lignite, Xylit, sand, granular activated carbon (GAC) and GAC+Polonite® in column tests—Role of physicochemical properties. Water Res. 2018, 137, 97–106. [Google Scholar] [CrossRef]
  73. Zeidabadi, F.A.; Esfahani, E.B.; Mohseni, M. Effects of water matrix on per- and poly-fluoroalkyl substances (PFAS) treatment: Physical-separation and degradation processes—A review. J. Hazard. Mater. Adv. 2023, 10, 100322. [Google Scholar] [CrossRef]
  74. Chow, S.J.; Croll, H.C.; Ojeda, N.; Klamerus, J.; Capelle, R.; Oppenheimer, J.; Jacangelo, J.G.; Schwab, K.J.; Prasse, C. Comparative investigation of PFAS adsorption onto activated carbon and anion exchange resins during long-term operation of a pilot treatment plant. Water Res. 2022, 226, 119198. [Google Scholar] [CrossRef]
  75. Dixit, F.; Barbeau, B.; Mostafavi, S.G.; Mohseni, M. PFAS and DOM removal using an organic scavenger and PFAS-specific resin: Trade-off between regeneration and faster kinetics. Sci. Total Environ. 2021, 754, 142107. [Google Scholar] [CrossRef] [PubMed]
  76. Mohamad, E.; Alum, A.; Abbaszadegan, M. Biochemical signature assay for use in a biosensor platform to detect bacteria in drinking water biofilms. J. Environ. Sci. Health Part A 2013, 48, 925–932. [Google Scholar]
  77. Hesari, N.; Alum, A.; Elzein, M.; Abbaszadegan, M. A biosensor platform for rapid detection of E. coli in drinking water. Enzym. Microb. Technol. 2015, 83, 22–28. [Google Scholar] [CrossRef]
  78. Kato, T.; Miura, T.; Okabe, S.; Sano, D. Bayesian modeling of enteric virus density in wastewater using left-censored data. Food Environ. Virol. 2013, 5, 185–193. [Google Scholar] [CrossRef]
  79. Kadoya, S.S.; Nishimura, O.; Kato, H.; Sano, D. Predictive water virology using regularized regression analyses for projecting virus inactivation efficiency in ozone disinfection. Water Res. X 2021, 11, 100093. [Google Scholar] [CrossRef]
  80. Ching, P.M.L.; So, H.Y.; Morck, T. Advances in soft sensors for wastewater treatment plants: A systematic review. J. Water Process Eng. 2021, 44, 102367. [Google Scholar] [CrossRef]
  81. McMeekin, T.; Olley, J.; Ratkowsky, D.; Corkrey, R.; Ross, T. Predictive microbiology theory and application: Is it all about rates? Food Control 2013, 29, 290–299. [Google Scholar] [CrossRef]
  82. Baranyi, J.; Tamplin, M.L. ComBase: A common dataset on microbial responses to food environments. J. Food Prot. 2004, 67, 1967–1971. [Google Scholar] [CrossRef] [PubMed]
  83. WHO. Water Safety Plan Manual: Step-by-Step Risk Management for Drinking-Water Suppliers, 2nd ed.; WHO: Geneva, Switzerland, 2023; Available online: https://www.who.int/publications/i/item/9789240067691 (accessed on 6 August 2023).
  84. WHO. Sanitation Safety Planning: Manual for Safe Use and Disposal of Wastewater Greywater and Excreta. 2015. Available online: https://apps.who.int/iris/handle/10665/171753 (accessed on 6 August 2023).
  85. Cornu, M.; Billoir, E.; Bergis, H.; Beaufort, A.; Zuliani, V. Modeling microbial competition in food: Application to the behavior of Listeria monocytogenes and lactic acid flora in pork meat products. Food Microbiol. 2011, 28, 639–647. [Google Scholar] [CrossRef] [PubMed]
  86. Kadoya, S.S.; Nishimura, O.; Kato, H.; Sano, D. Predictive water virology: Hierarchical Bayesian modeling for estimating virus inactivation curve. Water 2019, 11, 2187. [Google Scholar] [CrossRef]
  87. Kadoya, S.S.; Nishimura, O.; Kato, H.; Sano, D. Regularized regression analysis for the prediction of virus inactivation efficiency by chloramine disinfection. Environ. Sci. Water Res. Technol. 2020, 6, 3341. [Google Scholar] [CrossRef]
  88. Oishi, W.; Kadoya, S.; Nishimura, O.; Rose, B.J.; Sano, D. Hierarchical Bayesian modeling for predictive environmental microbiology toward a safe use of human excreta: Systematic review and meta-analysis. J. Environ. Manag. 2021, 284, 112088. [Google Scholar] [CrossRef]
  89. OECD. Forward-Looking Scenarios of Climate Finance Provided and Mobilised by Developed Countries in 2021–2025: Technical Note, Climate Finance and the USD 100 Billion Goal; OECD Publishing: Paris, France, 2021. [Google Scholar] [CrossRef]
  90. Wang, Q.; Huang, N.; Cai, H.; Chen, X.; Wu, Y. Water strategies and practices for sustainable development in the semiconductor industry. Water Cycle 2023, 4, 12–16. [Google Scholar] [CrossRef]
  91. You, S.H.; Tseng, D.H.; Guo, G.L. A case study on the wastewater reclamation and reuse in the semiconductor industry. Resour. Conserv. Recycl. 2001, 32, 73–81. [Google Scholar] [CrossRef]
  92. Eng, C.Y.; Yan, D.; Withanage, N.; Liang, Q.; Zhou, Y. Wastewater treatment and recycle from a semiconductor industry: A demo-plant study. Water Pract. Technol. 2019, 14, 371–379. [Google Scholar] [CrossRef]
  93. Huang, C.J.; Yang, B.M.; Chen, K.S.; Chang, C.C.; Kao, C.M. Application of membrane technology on semiconductor wastewater reclamation: A pilot-scale study. Desalination 2011, 278, 203–210. [Google Scholar] [CrossRef]
Figure 1. Flow diagram of water treatment processes employed at the direct potable reuse (DPR) facility in the city of Cloudcroft, NM, USA.
Water 17 00789 g001
Figure 2. PFAS removal through reverse osmosis (RO) treatment at the 7700 m3/d (1.7 MGD) Raw Water Production Facility in Big Spring (TX, USA): PFAS concentrations in the influent of raw water production facility (filtered and disinfected secondary effluent), RO feed (microfiltration effluent), and RO permeate (adapted from [51]. The permeate from RO system had PFAS concentrations below their detection limits.
Water 17 00789 g002
Table 1. Water reuse categories with related examples with potable and non-potable applications.
Non-Potable ReusePotable Reuse
Planned Potable ReuseUn-Planned (de facto) Potable Reuse
IndirectDirectIndirect
• Agriculture
• Parks, roadways, and sports fields
• Fire suppression
• Construction
• Dust control
• Industry
• Power plants and refineries
• Toilet flushing
• Replenishment of lakes, reservoirs, and aquifers
GWRS: percolation basins in Anaheim
filter through sand and gravel before returning to the drinking water system
Windhoek, Namibia, since 1968
CRMWD Texas, Started operation in April 2013
Other
• Brownwood, Texas,
• Wichita Falls
Trinity River—treated wastewater from Dallas/Fort Worth is delivered to Lake Livingston, the main drinking water source for Houston
Table 2. Reuse water quality standards for various irrigation applications.
US EPA 2012WHO 2016EU 2020
Parameter/CategoryABABABCD
E. coli (CFU/100 mL)--1000-10100100010,000
Fecal coliforms (CFU/100 mL)0200------
BOD5 (mg/L)1030--10252525
TSS (mg/L)-30--10353535
Turbidity (NTU)2---5---
Intestinal nematodes (eggs/L)--111111
Notes: A—crops consumed raw and edible parts in direct contact with the reclaimed water; B—food crops and non-food crops—all irrigation methods; C—drip irrigation or other methods without direct contact with the edible part; and D—seeded crops.
Table 3. State of water reuse regulations or guidelines in the United States.
Categories of Reuse Applications—Based on End UseU.S States That Have Developed Regulations or Guidelines for the Respective End Use Category
Agriculture Reuse WA, OR, CA, ID, MT, NV, AZ, UT, WY, CO, NM, NE, OK, TX, MN, IN, AL, GA, FL, NC, VA, PA, MD, DE, NJ, RI, MA, HI
Environmental Restoration Reuse WA, MT, ID, NV, FL, NC, PA, MA
Impoundments Reuse WA, OR, CA, NV, MT, UT, AZ, NM, TX, PA, MA, HI
Industry Reuse OR, CA, NV, UT, HI, MN, WI, GA, FL, VA, PA, RI, MA, NJ, MD
Landscaping Reuse WA, OR, CA, NV, ID, MT, WY, UT, AZ, NM, CO, SD, OK, TX, MN, IA, WI, IN, OH, PA, VA, MD, DE, NJ, RI. NH, MA, SC, GA, AL, FL
Consumption by Livestock Reuse OR, AZ, NM, HI, OK, VA
Centralized Non-Potable Reuse WA, OR, CA, NV, ID, MT, UT, AZ, NM, CO, OK, TX, MN, WI, GA, VA, PA, VT, MA, HI
Onsite Non-Potable Reuse OR, CA, NM, CO, TX, OK, MN, WI, OH, GA, FL, HI
Potable Reuse WA, OR, CA, NV, MT, CO, NM, TX, OK, OH, PA, MA, VA, NC, FL
Notes: Source: Based on the U.S. EPA water reuse regulations and guidelines. https://www.epa.gov/waterreuse/maps-states-water-reuse-regulations-or-guidelines (accessed 23 March 2024) [28].
Table 4. Log reduction values (LRV) requirements of pathogen for DPR in different states.
Agency Pathogen
Enteric VirusCryptosporidiumGiardia
NWRI 2013 12109 (Salmonella)
California for IPR Using Groundwater Replenishment121010
California Water Board draft 161110
California Water Board 2021201514
Texas (Big Spring Project)85.56
Texas Commission on Environmental Quality (TCEQ) 20142.2 × 1073 × 1057 × 107
Altamonte Springs, Florida (2018)11.2 (Genome)
5.8 (Culture)
3.94.2
Note: the values in this table are based on Quotative Microbial Risk Assessment. Safety factors are added to the values. The state of California allows the removal of less than 20 logs for less than 24 h and not less than 16 logs in any case. NWRI: National Water Research Institute.
Table 5. PFAS removal by brackish RO membrane treatment.
RO ModelPFHxA Removal [%]PFOS Removal [%]References
LFC3 >99.0[65]
ESPA3 >99.0[65]
BW30 >99.0[66]
BW30>99.0 [67]
XLE>99.0 [67]
Table 6. PFAS removal by NF membrane treatment (solution pH = 6.0–7.0).
NF ModelPFHxA Removal [%]PFOA Removal [%]PFOS Removal [%]Reference
NF27095.0–99.990.0–99.090.0–99.0[65,67,69]
NF90>99.0>98.0n.a.[67,70]
NE70n.a.7965[71]
Note: n.a.: not available.
Disclaimer/Publisher’s Note: The statements, opinions and data contained in all publications are solely those of the individual author(s) and contributor(s) and not of MDPI and/or the editor(s). MDPI and/or the editor(s) disclaim responsibility for any injury to people or property resulting from any ideas, methods, instructions or products referred to in the content.

