Article

Analysis of the Effect of Sea Surface Temperature on Sea Ice Concentration in the Laptev Sea for the Years 2004–2023

by
Chenyao Zhang
1,2,3,
Ziyu Zhang
1,2,3,
Peng Qi
4,*,
Yiding Zhang
1,2,3,* and
Changlei Dai
1,2,3
1
School of Hydraulic and Electric Power, Heilongjiang University, Harbin 150080, China
2
Institute of Groundwater in Cold Region, Heilongjiang University, Harbin 150080, China
3
International Joint Laboratory of Hydrology and Hydraulic Engineering in Cold Regions of Heilongjiang Province, Harbin 150080, China
4
State Key Laboratory of Black Soils Conservation and Utilization, Northeast Institute of Geography and Agroecology, Chinese Academy of Sciences, No. 4888, Shengbei Street, Changchun 130102, China
*
Authors to whom correspondence should be addressed.
Water 2025, 17(5), 769; https://doi.org/10.3390/w17050769
Submission received: 10 January 2025 / Revised: 24 February 2025 / Accepted: 3 March 2025 / Published: 6 March 2025

Abstract

:
The Laptev Sea, as a marginal sea and a key source of sea ice for the Arctic Ocean, has a profound influence on the dynamic processes of sea ice evolution. Under a 2 °C global warming scenario, the accelerated ablation of Arctic sea ice is projected to greatly impact Arctic warming. The ocean regulates global climate through its interactions with the atmosphere, where sea surface temperature (SST) serves as a crucial parameter in exchanging energy, momentum, and gases. SST is also a key driver of sea ice concentration (SIC). In this paper, we analyze the spatiotemporal variability of SST and SIC, along with their interrelationships in the Laptev Sea, using daily optimum interpolation SST datasets from NCEI and daily SIC datasets from the University of Bremen for the period 2004–2023. The results show that: (1) Seasonal variations are observed in the influence of SST on SIC. SIC exhibited a decreasing trend in both summer and fall with pronounced interannual variability as ice conditions shifted from heavy to light. (2) The highest monthly averages of SST and SIC were in July and September, respectively, while the lowest values occurred in August and November. (3) The most pronounced trends for SST and SIC appeared both in summer, with rates of +0.154 °C/year and −0.095%/year, respectively. Additionally, a pronounced inverse relationship was observed between SST and SIC across the majority of the Laptev Sea with correlation coefficients ranging from −1 to 0.83.

1. Introduction

The Laptev Sea, one of the seven marginal seas of the Arctic Ocean, covers a total area of approximately 6,700,000 km2. Remarkably, nearly 70% of its shelf has a water depth no greater than 20 m. While its average depth is 578 m, the sea’s deepest point reaches 3385 m [1]. In recent decades, climate change has gradually reduced the extent and thickness of sea ice, creating favorable conditions for navigation through the Northeast Passage (NEP) [2]. The NEP begins in the North Atlantic Ocean and traverses the Barents Sea, Kara Sea, Laptev Sea, East Siberian Sea, and Bering Sea. It is currently about 40% shorter than the Suez Canal Route (SCR), saving approximately 10 days of sailing time and dramatically reducing shipping costs [3,4,5]. The Laptev Sea is a crucial area for ships navigating in the NEP and is one of the primary ice sources in the Arctic Ocean. It serves as a fundamental component in maintaining the stability of sea ice throughout the region [6]. Sea ice acts as a key driver in reducing the impacts of climate change, greatly influencing the exchange of heat, momentum, and gases at the ocean–atmosphere interface [7,8]. The movement of sea ice impacts processes such as ice advection, outflow, thickness redistribution, and the assembly of icebergs and pressure ridges resulting from ice deformation [9]. Over the past two decades, near-surface air temperatures in the Arctic have risen at approximately twice the rate of the global average [10]. If global warming reaches 2 °C, the absence of Arctic sea ice is expected to substantially warm the Arctic and cause climate and weather anomalies beyond the region [11]. Furthermore, the continued rise in surface air temperatures has accelerated sea ice melting, leading to a progressive decline in sea ice concentration and an upward trend in ocean heat content [12,13,14]. The decline in sea ice concentration activates the ice–albedo feedback mechanism. With larger areas of open water exposed to sunlight, the Arctic absorbs more solar energy, leading to a decrease in surface reflectivity (albedo). This amplifies the warming of the ocean surface, further accelerating sea ice retreat [15].
Sea ice concentration (SIC) represents the spatial distribution of sea ice and serves as a critical indicator of the Arctic ice–ocean–atmosphere system. It encapsulates the interplay of both dynamic and thermodynamic processes within this interconnected system [16]. It indicates the extent of sea ice expansion and is numerically equal to the percentage of the area covered by sea ice relative to the total sea area. When the SIC value is 1, it means all pixel grid points are covered with sea ice, while a value of 0 means the seawater completely covers the pixel grid points [17]. SIC is a vital parameter for studying the Arctic sea ice area, spatial distribution, transport processes, and flow field characteristics [18,19,20]. It holds critical importance for navigational safety, climate modeling, and offshore predictions and is an important environmental indicator of climate change in the Arctic [21,22]. Sea ice melting is a multifarious physical process influenced by temperature, heat flux magnitude, solar radiation, ocean heat flow, and water transport [23,24]. Sea surface temperature (SST) is a vital oceanic parameter that regulates the exchange of energy, momentum, and gases at the interface between the ocean and atmosphere. It notably influences sea ice melting processes and serves as a critical factor governing SIC [25]. Designated as one of the “essential climate variables” by the World Meteorological Organization (WMO), it is extensively used in climate monitoring, assessment, and modeling. Additionally, it plays a vital role in research related to environmental protection, agriculture, and industry, making it essential for understanding climate change [26,27].
Lately, a growing body of research has targeted investigating the linkage between Arctic sea ice and climate anomalies together with the complex mechanisms behind sea ice reduction. Evidence suggests that the overall temperature of Arctic sea areas and sea ice surfaces has increased by approximately 4.5 °C between 1982 and 2021 [28]. The mean annual SST of the Arctic Ocean during the period 1982–2018 was 1.32 ± 1.5 °C, with a general rise in temperature of about 0.036 ± 0.03 °C/year. Notably, the Laptev Sea experienced a temperature increase of approximately −0.01–0.01 °C/year [29]. Due to the warming, it was found that the transport rate across this sea tended to increase as SIC decreased. This was observed while analyzing changes and trends in sea ice outflow using satellite observations of sea ice drift and SIC data in the Laptev Sea in the timeframe of 1992 to 2011 [30]. Additionally, by combining SIC data with wind and temperature field data from NCEP-DOE between 2002 and 2011, it was found that sea ice in this area showed a decreasing trend in summer and fall. There was notable interannual variability, with the ice clearing shifting from heavy to light [1]. Moreover, researchers investigating the drivers of interannual variations in salinity and temperature in this area found that SST changes with the intensity of the latitudinal wind component, influencing the spatial variations in SIC [31].
The spatiotemporal patterns and dynamics of sea ice variability in the Laptev Sea have been extensively studied. However, the strength of the interaction between SIC and various thermal and dynamical factors needs further exploration. This paper analyzes the spatiotemporal distribution of SST and SIC and their correlation in the Laptev Sea from 2004 to 2023 using daily SST and SIC data. This research aims to provide a reference for projecting sea ice changes in the Arctic and establish a theoretical foundation for the strategic planning of Arctic shipping routes.

2. Study Area

According to the International Hydrographic Organization’s definition of the Laptev Sea boundaries, the western side is bordered by the Taymyr Peninsula and the Severnaya Zemlya archipelago, including Komsomolets, October Revolution, and Bolshevik islands, adjacent to the Kara Sea. On the eastern side, it is connected to the East Siberian Sea through the New Siberian Islands, including Kotelny and Lyakhovsky. Its northern boundary extends from the Arctic Cape to 79°N, 139°E, facing the Arctic Ocean directly (Figure 1) [1]. The Laptev Sea is situated at the terminus of the Arctic Transpolar Current (ATC), a key source of ice production in the Arctic Ocean. Unlike other marginal seas, the total area of sea ice in the Laptev Sea constantly fluctuates on account of the frequent formation and disappearance of interglacial lakes during winter [32]. During summer, a substantial amount of sea ice flows daily from the Laptev Sea into the central Arctic Ocean, compensating for ice lost to the Arctic Penetrating Current. In winter, a narrow strip of open water at the northern edge of the Laptev Sea, known as the Circumpolar Flaw Leads, becomes a major site for new ice formation. Persistent offshore winds drive this process [33], contributing 2.6% of the Arctic Ocean’s sea ice.
The Fram Strait serves as the principal route for sea ice to be transported out of the Arctic Ocean [34,35]. A substantial portion of the ice exported via this route is believed to originate from the remote Siberian shelf seas located on the far side of the Arctic Basin [36]. The Laptev Sea, located on the Siberian shelf, serves as a critical region for sea ice formation and export [37,38]. Observations indicate that up to 20% of the ice flowing through the Fram Strait annually is rooted in the Laptev Sea [39]. Therefore, researching sea ice variations in the Laptev Sea can offer valuable insights into the sea ice dynamics of the Arctic Ocean.

3. Data Sources and Methods

3.1. Data Sources

3.1.1. Sea Surface Temperature

The SST data are sourced from the Daily Optimum Interpolation Sea Surface Temperature dataset (DOISST) Version 2.1 dataset, which features a spatial resolution of 0.25° × 0.25°, available from NCEI (https://www.ncei.noaa.gov/, accessed on 23 August 2024). It has supplied daily global SST data since September 1981 and has been widely used in studies focusing on SST in the Arctic and the Pacific [40]. OISST Version 2.1 offers comprehensive global data on a regular grid, with SST measured in °C. It combines data from multiple sources, correcting for sensor bias and platform differences, and interpolates to fill any missing data [41,42]. The DOISST v2.1 observations show a bias of −0.07 °C for the global ocean. Specifically, the bias is −0.04 °C as opposed to Argo buoy observations and −0.01 °C versus the High Resolution SST (GHRSST) Multi-Product Ensemble [27]. This paper analyzes variations in SST in the Laptev Sea using data from 2004 to 2023.

3.1.2. Sea Ice Concentration

The SIC data utilized in this paper are sourced from the daily sea ice concentration dataset provided by the Institute of Environmental Physics at the University of Bremen in Germany (https://seaice.uni-bremen.de/data, accessed on 23 August 2024). The data ranges from 0% to 100% with an absolute error of 5.7% when SIC is at 100%; this error decreases as SIC increases. These data are developed through the ARTIST Sea Ice (ASI) algorithm using AMSR-E level 1A data from NASA’s Aqua satellite and AMSR2 level 1B data from the JAXA GCOM-W1 satellite. The dataset is presented on a standardized polar latitude/longitude grid, providing daily SIC information from 2002 to the present with a high spatial resolution of 3.125 km × 3.125 km [43,44]. In this paper, we analyze the correlation between SIC and SST in the Laptev Sea using daily SIC data from 2004 to 2023. However, SIC data from May to June 2012 and November to December 2011 are missing due to sensor failure.

3.2. Methods

3.2.1. Raster Data Resampling

When working with raster data of varying resolutions, it is essential to use resampling methods to standardize the resolution for consistent spatial positioning and numerical information of the image elements. Common resampling techniques include nearest neighbor interpolation, bilinear interpolation, and cubic convolution interpolation. To ensure consistency between the SST and SIC datasets, we applied the nearest neighbor interpolation method to reproject both datasets onto a unified spatial grid with a resolution of 0.1 km × 0.1 km. The spatial reference coordinate system used for this process was the North Pole Lambert Azimuthal Equal Area projection in the ArcGIS. Additionally, a mask extraction tool was employed to further refine and standardize the spatial alignment of the data points, ensuring accurate and consistent spatial positioning across the two datasets. The annual, seasonal, and average values per month of SST and SIC were computed by using the formula as follows:
X ¯ n = i = 1 n x i n
In this context, X ¯ n refers to the monthly mean, n denotes the number of days in the month, and x i represents the daily value. Using daily data, the values at a specific coordinate in the study area are summed for each day of the month and then divided by the number of days in the month to obtain the monthly average for that coordinate. The regional distribution of the monthly mean can be obtained by averaging the daily SST and SIC for the month [45,46]. Similarly, this calculation can be used to determine the annual and quarterly means.

3.2.2. Linear Regression Analysis

This paper uses the linear regression method to calculate the trends of SST and SIC, which can be expressed by the linear regression equation:
y = a x + b
b = i = 1 n x i x ¯ y i y ¯ i = 1 n x i x ¯ 2 = i = 1 n x i y i n x y ¯ i = 1 n x i 2 n x ¯ 2 ,   a = y ¯ b x ¯
x ¯ = i = 1 n x i n ,   y ¯ = i = 1 n y i n
In this context, the independent variable x represents time while the dependent variable y can be either SST or SIC. The parameter a is a constant and b is the regression coefficient. Additionally, x ¯ denotes the mean of x, y ¯ denotes the mean of y, and n represents the number of values.

3.2.3. Correlation Analysis

The relationship between SST and SIC was quantified using Pearson’s correlation coefficient. The formula was calculated as follows:
r = x i x ¯ y i y ¯ i = 1 n x i x ¯ 2 i = 1 n y i y ¯ 2
In this equation, r is the correlation coefficient, ranging from −1 to 1. A value in the interval [−1, 0] indicates a negative correlation between the two factors while a value in [0, 1] signifies a positive correlation. When r = 0, there is no statistically significant correlation between them (p < 0.01). Additionally, the closer the value of r is to 1, the stronger the correlation. In this context, x i represents the SST at different times and y i represents the SIC at different times. x ¯ is the average of x and y ¯ is the average of y.

4. Results and Analysis

4.1. Spatiotemporal Variation in SST and Sea Ice

In this paper, the seasons are defined as follows: spring spans from March to May, summer from June to August, fall from September to November, and winter from December to February. There is a clear spatial difference between SST and SIC. For the years of 2004–2023, the interannual variation in SST indicates that the overall warming trend was not statistically significant (p < 0.01) (Figure 2), with an annual mean SST of 0.452 °C and a trend of +0.068 °C/year (Table 1). The average temperatures for winter, spring, summer, and fall were 0.352 °C, 0.308 °C, 0.645 °C, and 0.503 °C, respectively. The warming trend was most pronounced in summer at about +0.154 °C/year and in fall at about 0.130 °C/year. In spring, the average temperature increased by about +0.035 °C/year while in winter, the warming trend increased by about +0.040 °C/year (Table 1). The annual average SIC was approximately 70.01%, with a decreasing trend of about −1.297%/year (Table 2). The average SIC for winter, spring, summer, and fall were 95.59%, 99.56%, 41.34%, and 50.56%, respectively. The SIC decrease was greater in summer and fall, which were −0.095% and −0.082%, respectively (Table 2).
As shown in Figure 2, the seasonal variability of SST is more pronounced in summer (June to August) and fall (September to November), whereas it is less evident in winter (December to February) and spring (March to May). Among these, SST exhibits the greatest variation during summer. Therefore, we plotted the spatial distribution of summer SST in the Laptev Sea from 2004 to 2023 (Figure 3). Figure 3 reveals a statistically significant increasing trend in SST, with more pronounced temperature changes typically occurring in the central part of the sea (p < 0.01).
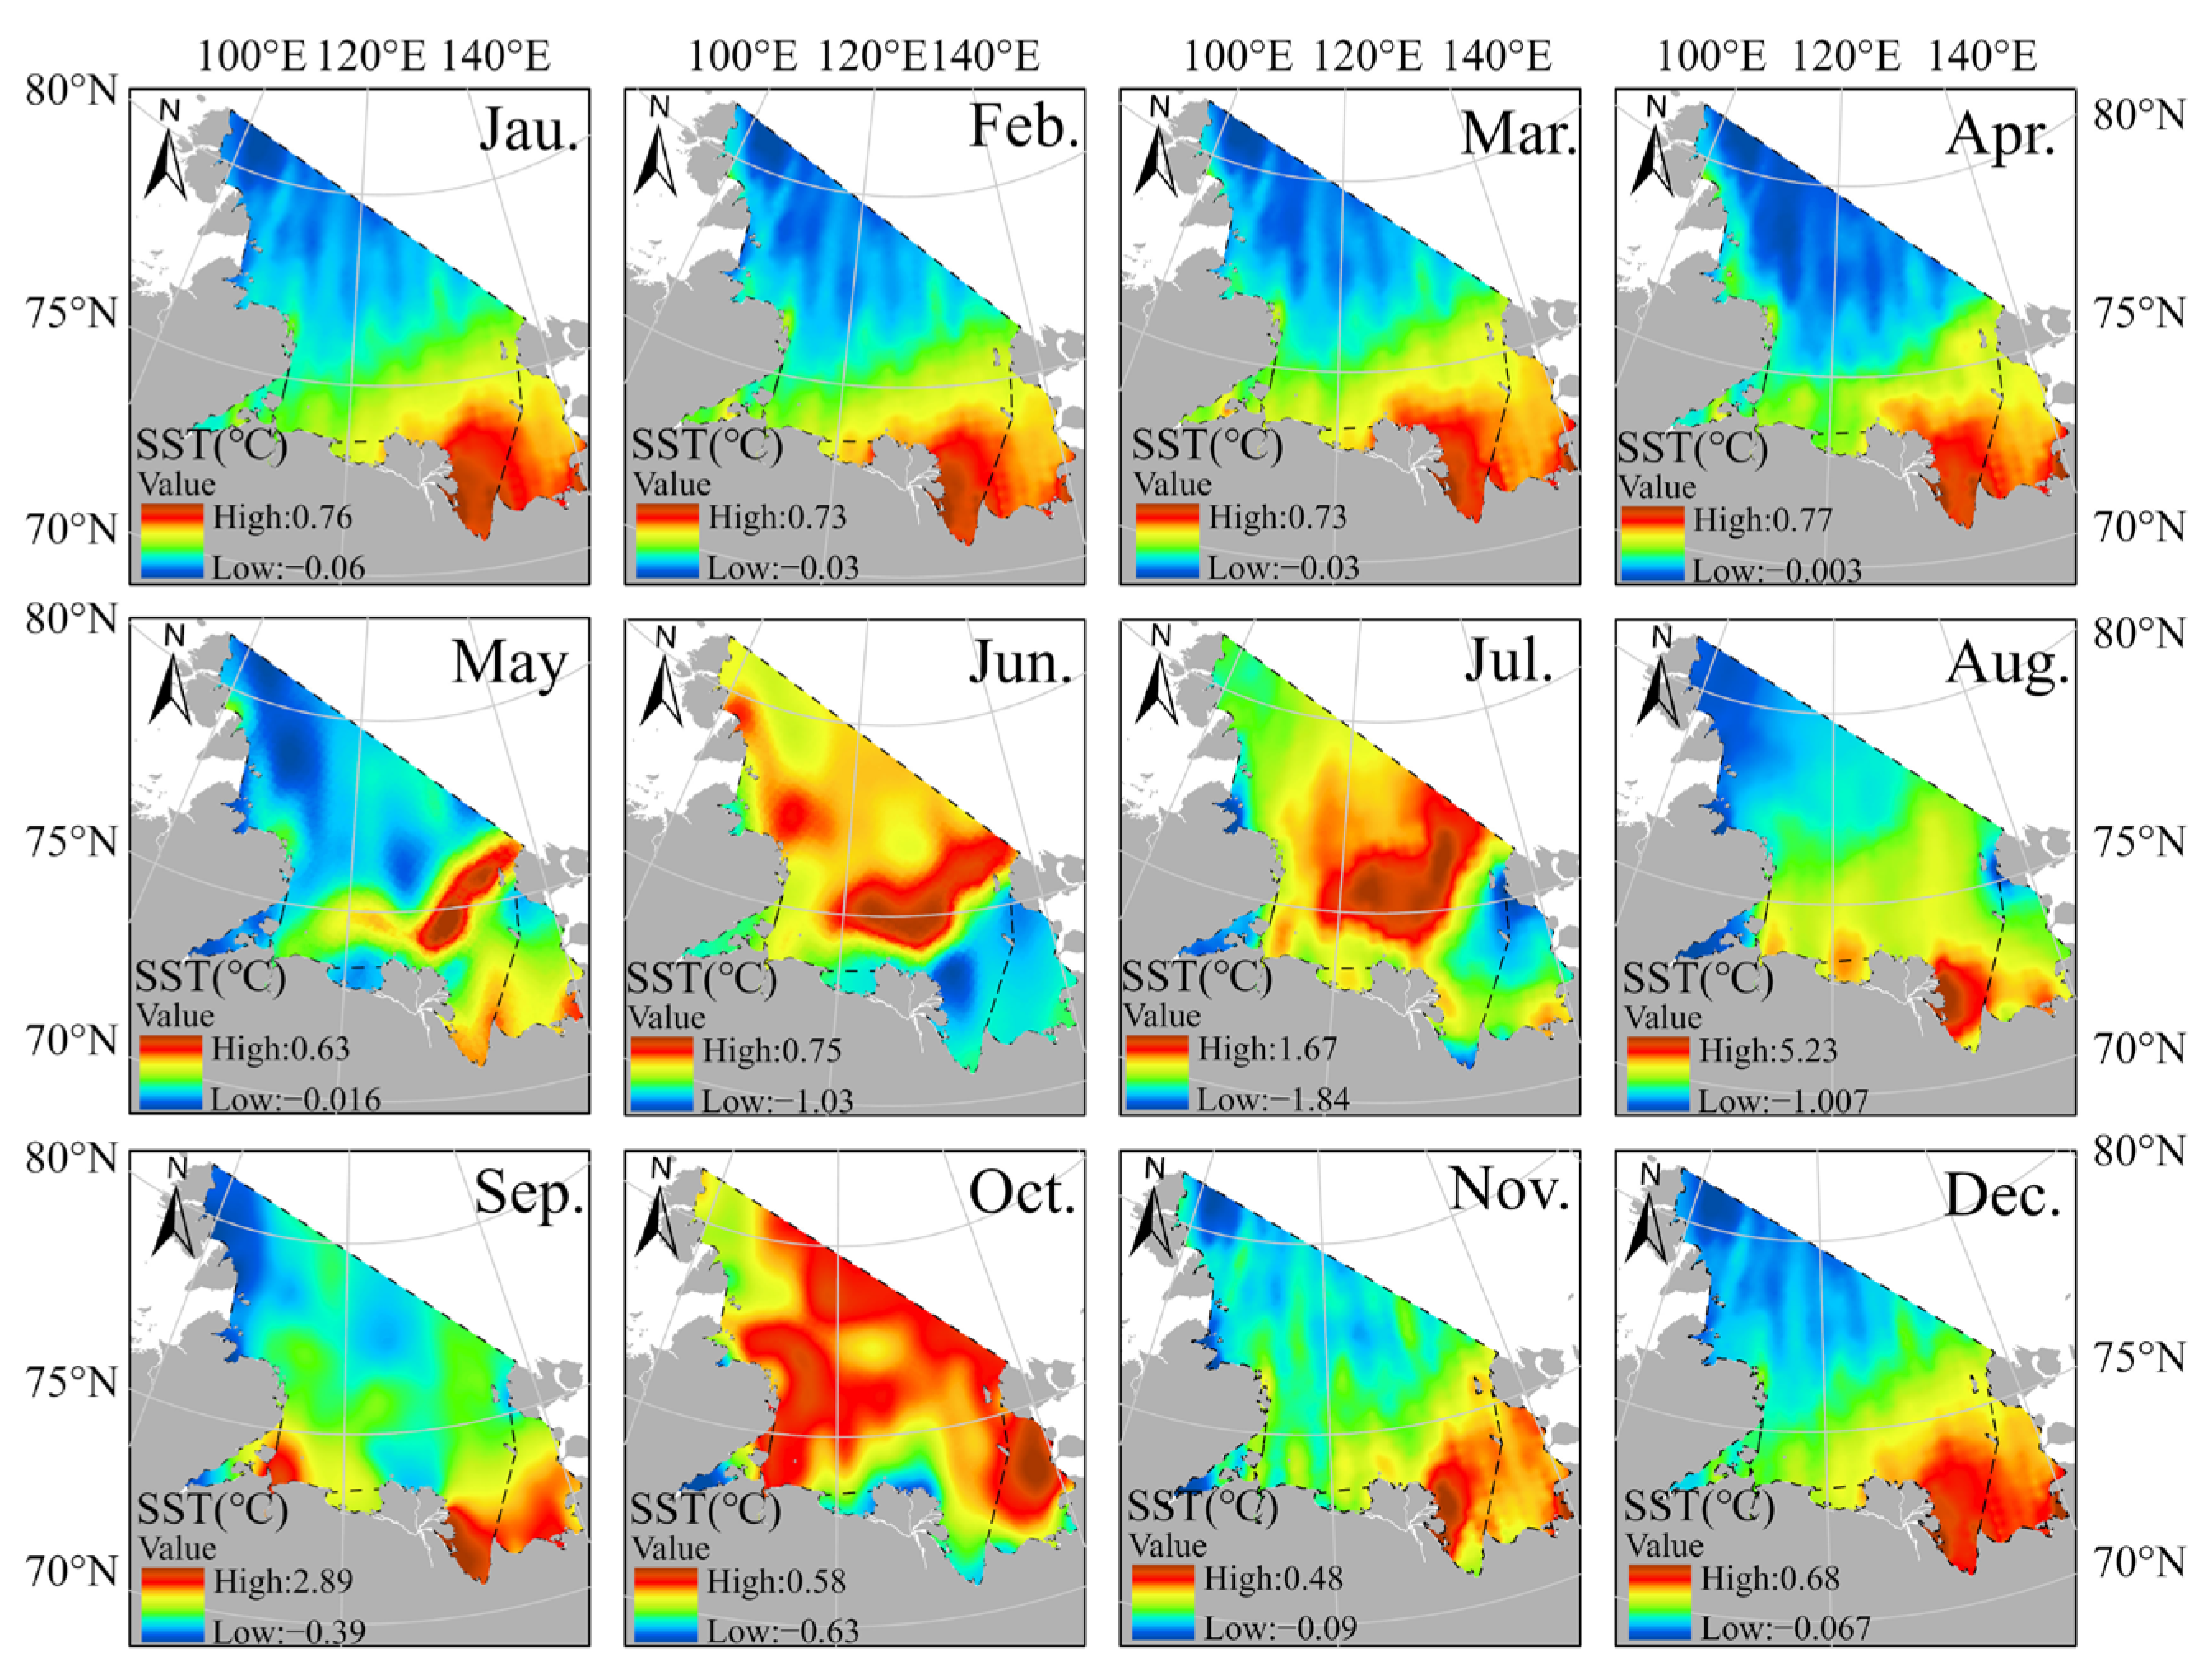
On a monthly scale, the SST showed the largest temperature differences from late summer to early fall (July to September), with the fastest warming from June to July. Minimum temperature values were lower from October to January, with the lowest SST in November at around 0.48 °C, while the highest maximum temperatures occurred from July to September, peaking in August at approximately 5.23 °C (Figure 4). As shown in Figure 5, summer (June to August) and fall (September to November) showed lower SIC, while winter (December to February) and spring (March to May) had higher values. The SIC was below 90% from August to September, reaching its lowest at about 62.58% in September, and exceeded 90% in the other months, peaking at about 99.69% in December (Figure 5).

4.2. Correlation Between SST and SIC

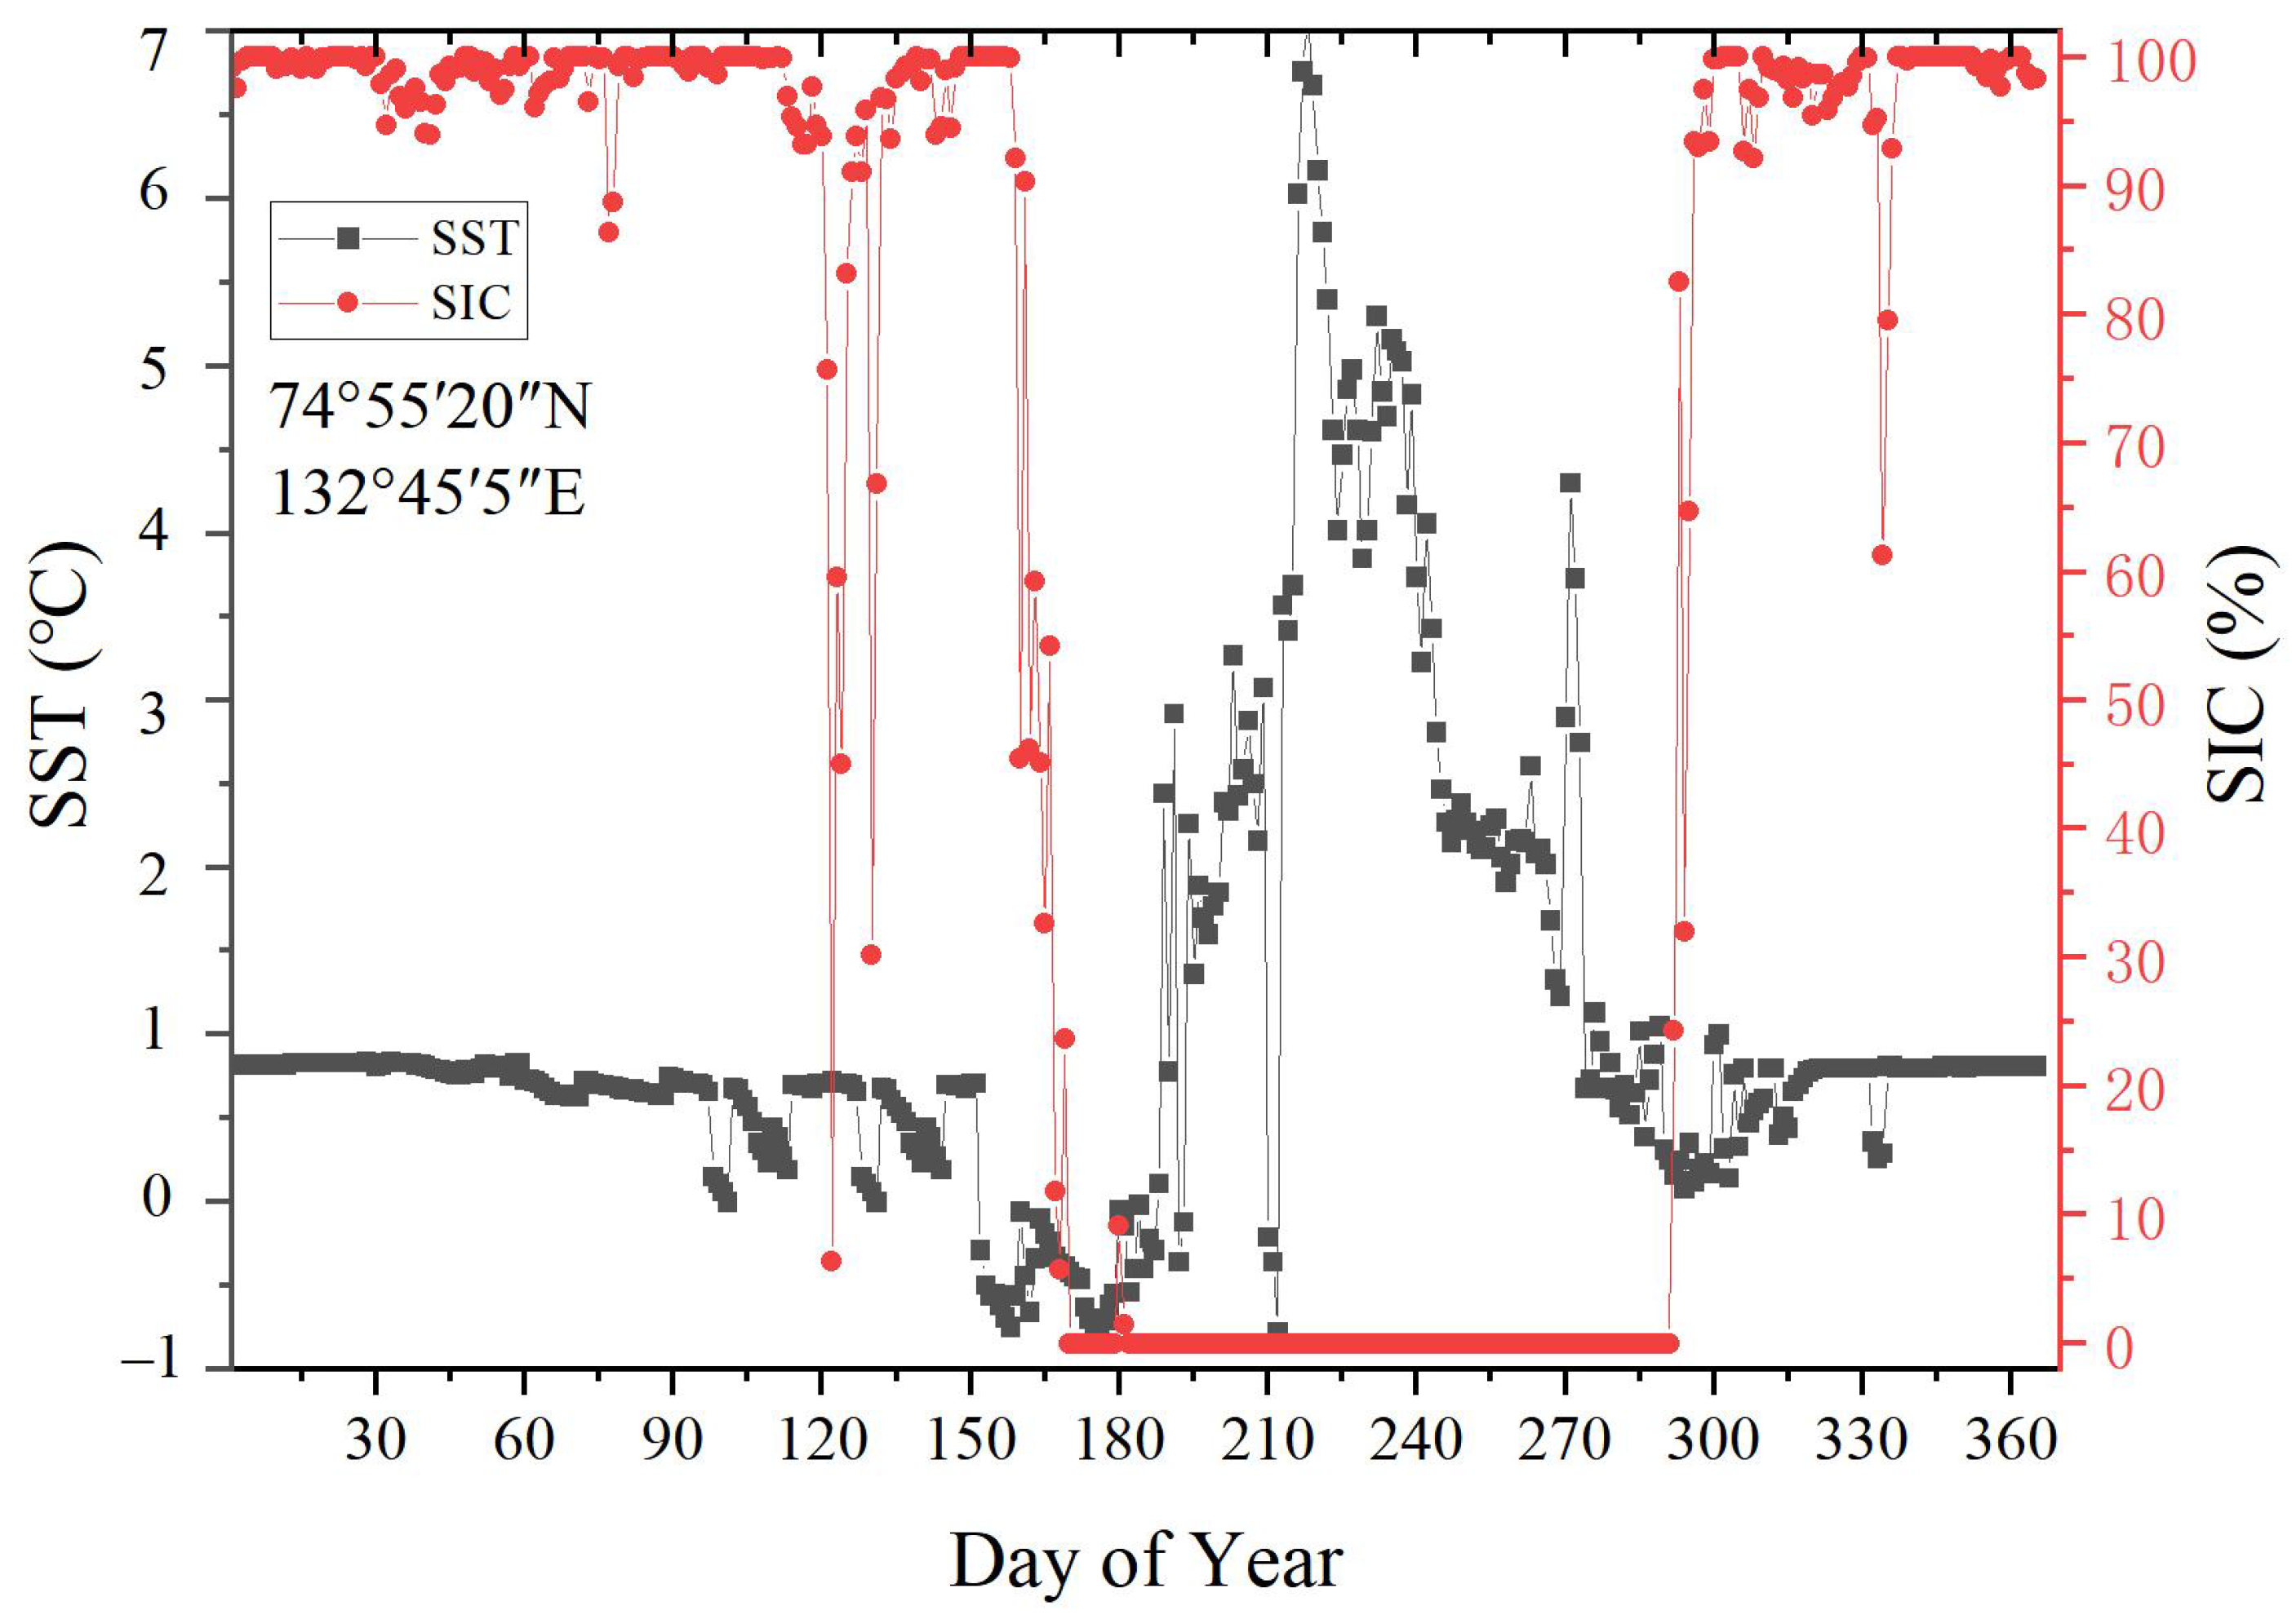
Within the image element, SIC indicates the fraction of the area covered by sea ice, whereas SST refers to the sea surface temperature of the ice-free region. The same spot can differently represent both SST and SIC. The Laptev Sea, a relatively enclosed area in the Northeast Passage, includes a selected coordinate (74°55′20″ N, 132°45′5″ E) within the study area. Figure 6 displays the changes in SST and SIC at each time point in 2023. From March to May, prior to the summer sea ice melt season, the variations in SIC and SST remain relatively small and are not statistically significant (p < 0.01). Starting in June, as the sea ice approaches the melting phase, SST shows a statistically significant increase while SIC undergoes a marked decrease until the sea ice completely melts (p < 0.01). Approximately two months later, SST begins to decline and sea ice starts to refreeze, transitioning into the winter season, with complete freezing occurring by November.
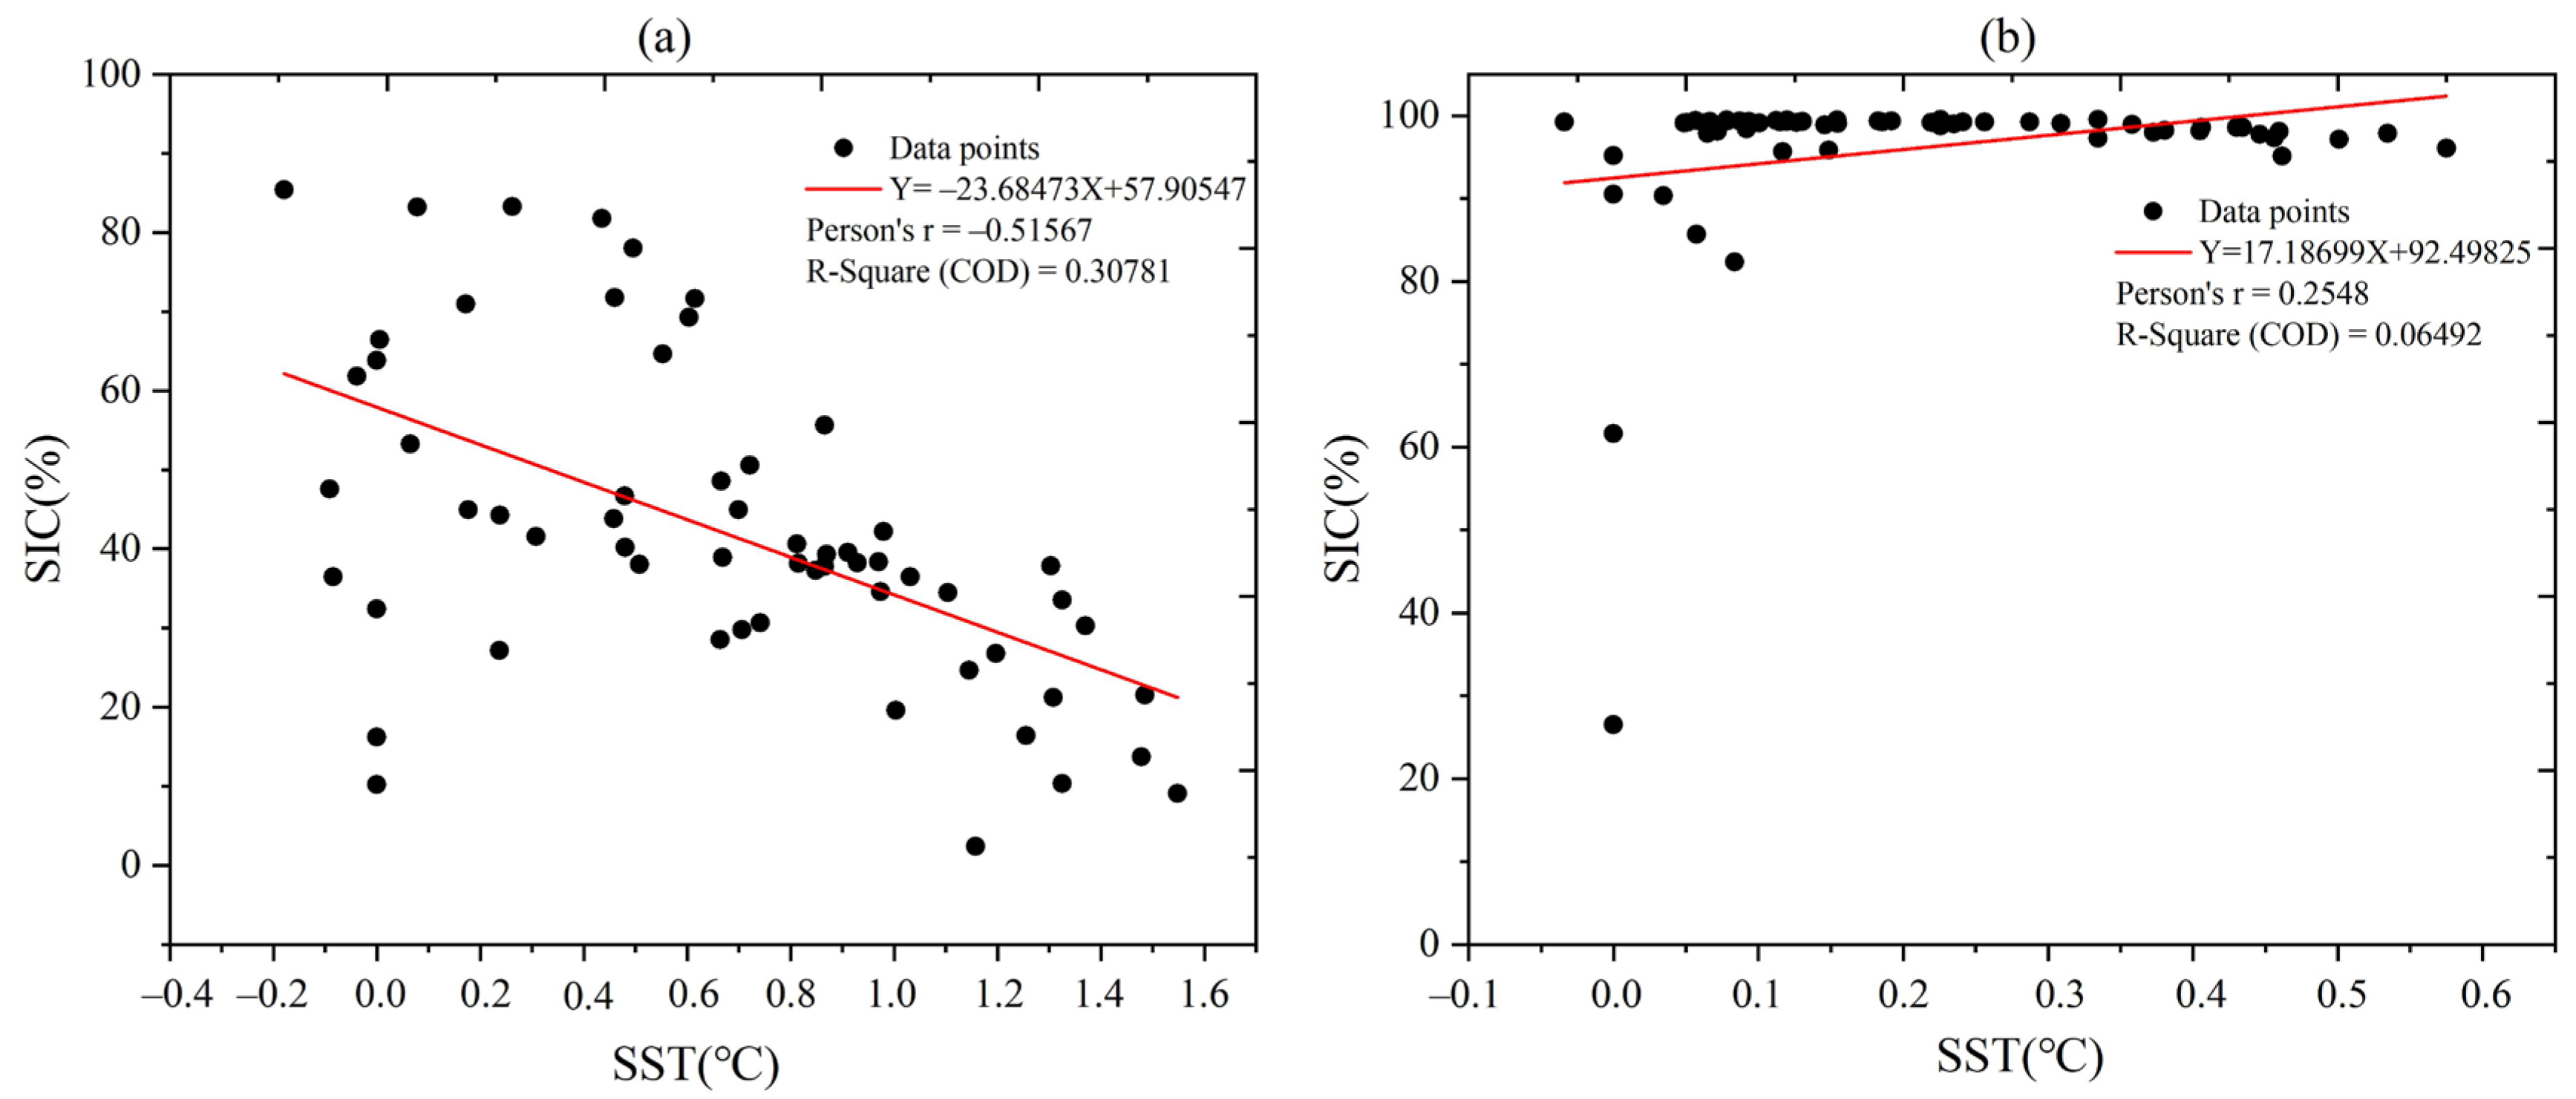
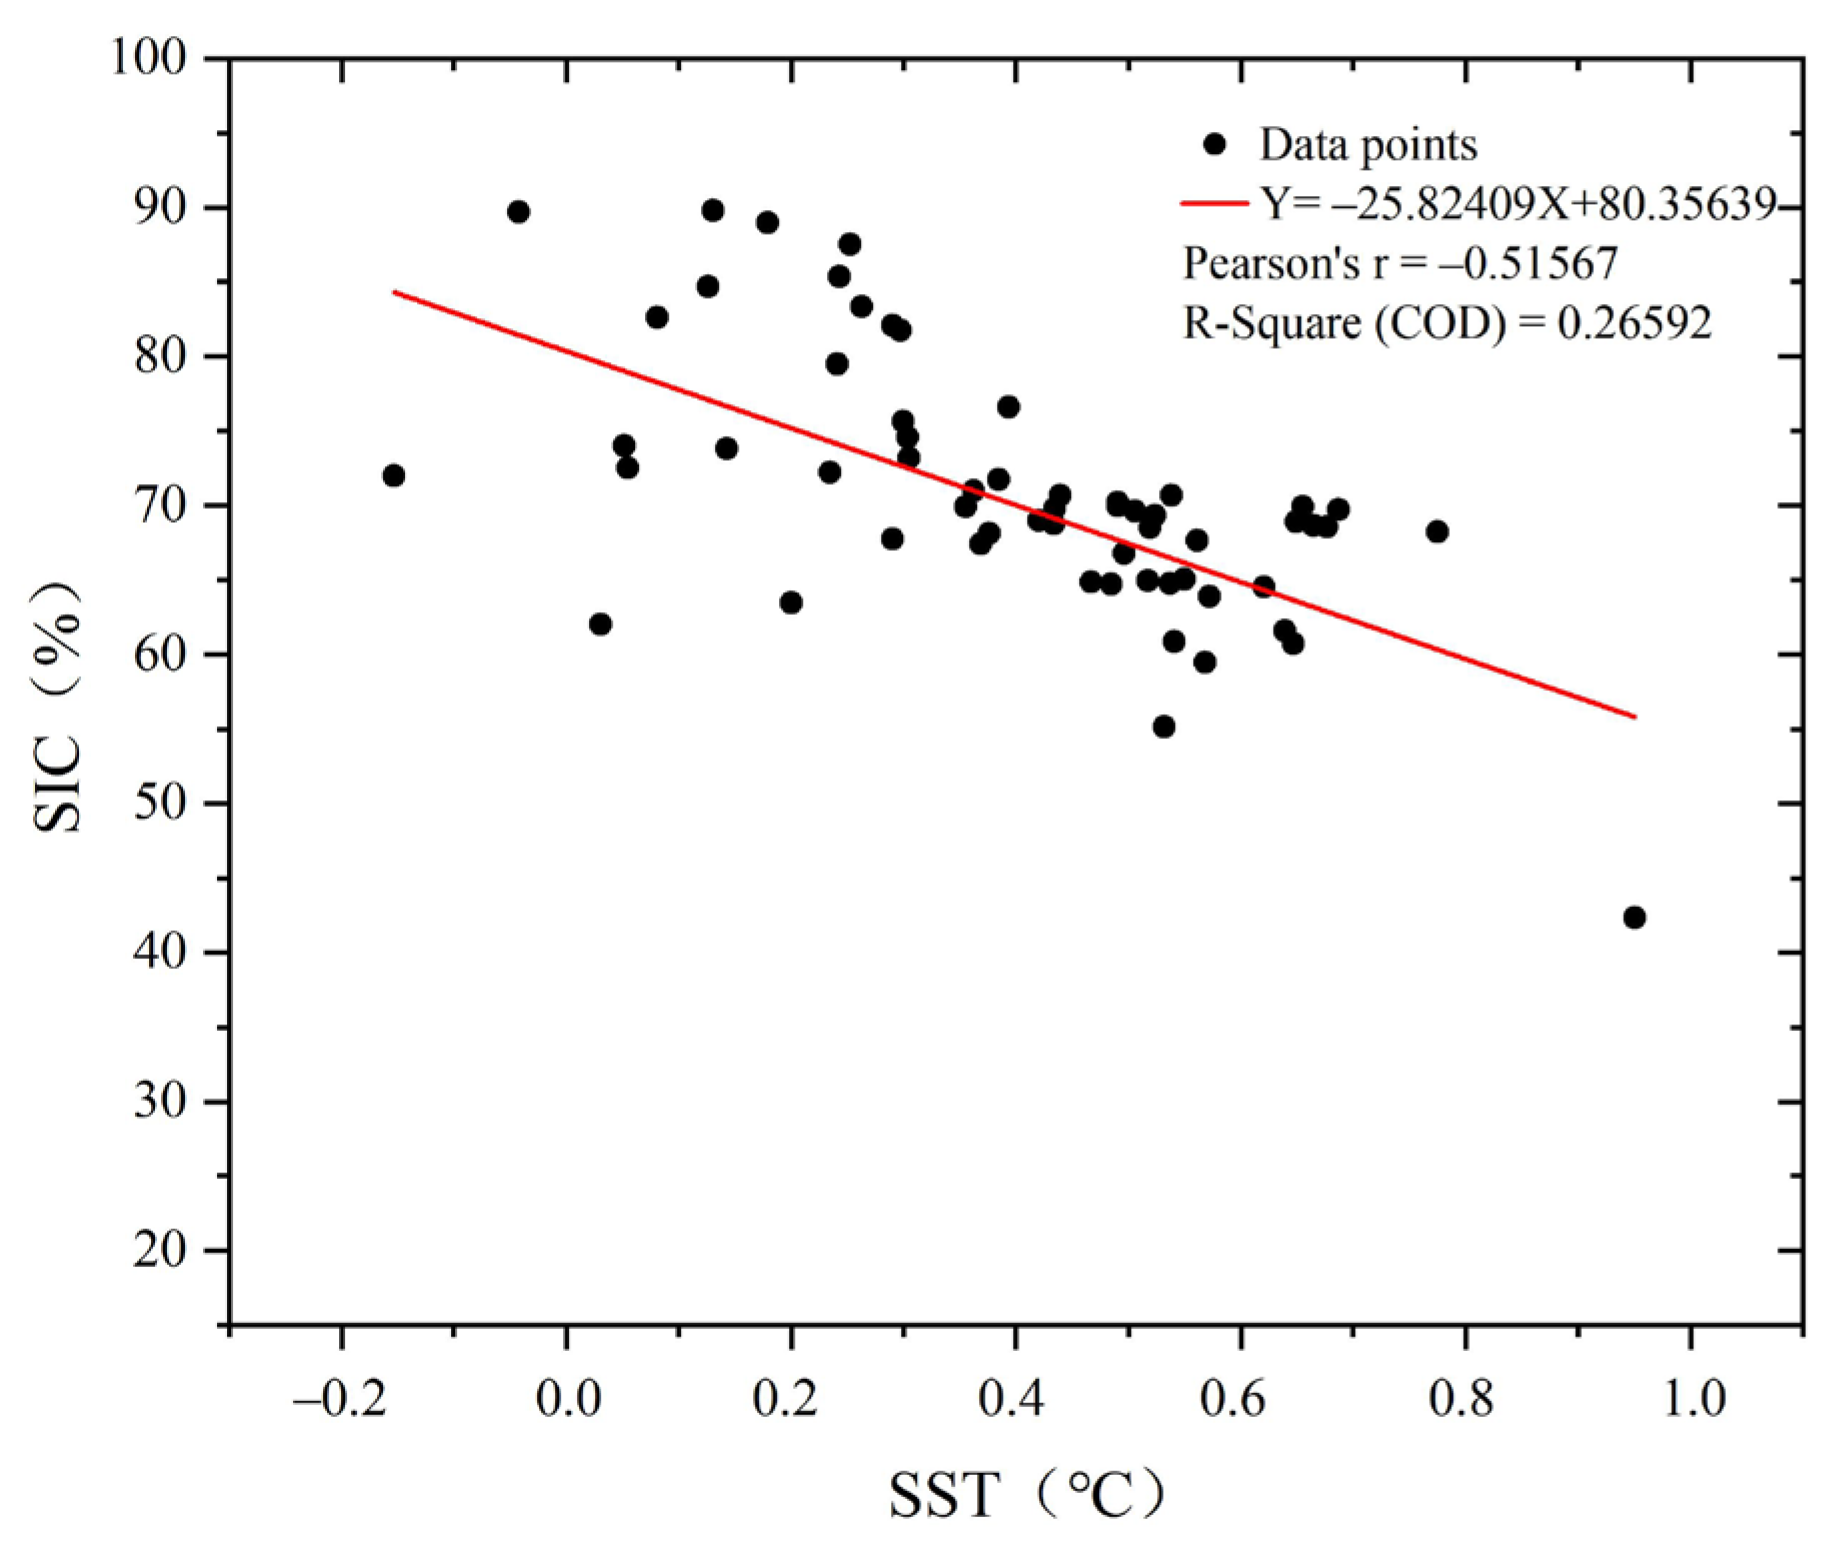
From the above analysis, it can be seen that the changes in SST and SIC are more obvious in summer and fall and the changes in spring and winter are smaller. In order to explore the correlation between SST and SIC, and whether there are seasonal differences in the impact of SST on SIC, we standardized the resolution of the two raster datasets to 0.1 km × 0.1 km. The average values of SST and SIC in summer and winter and the annual average values were calculated by the resampling method. Subsequently, the grid point conversion tool was used to extract 60 data points where SST and SIC existed in the study area at the same time for linear correlation analysis. The results are shown in Figure 7 and Figure 8, respectively. It is evident from Figure 7 that the influence of SST on SIC varies seasonally. The increase in SST in summer wields a considerable impact on accelerating the melting of sea ice and the decrease in SST in winter promotes the increase in SIC values. As shown in Figure 8, SST is a crucial variable influencing SIC and there is a negative correlation between the two.
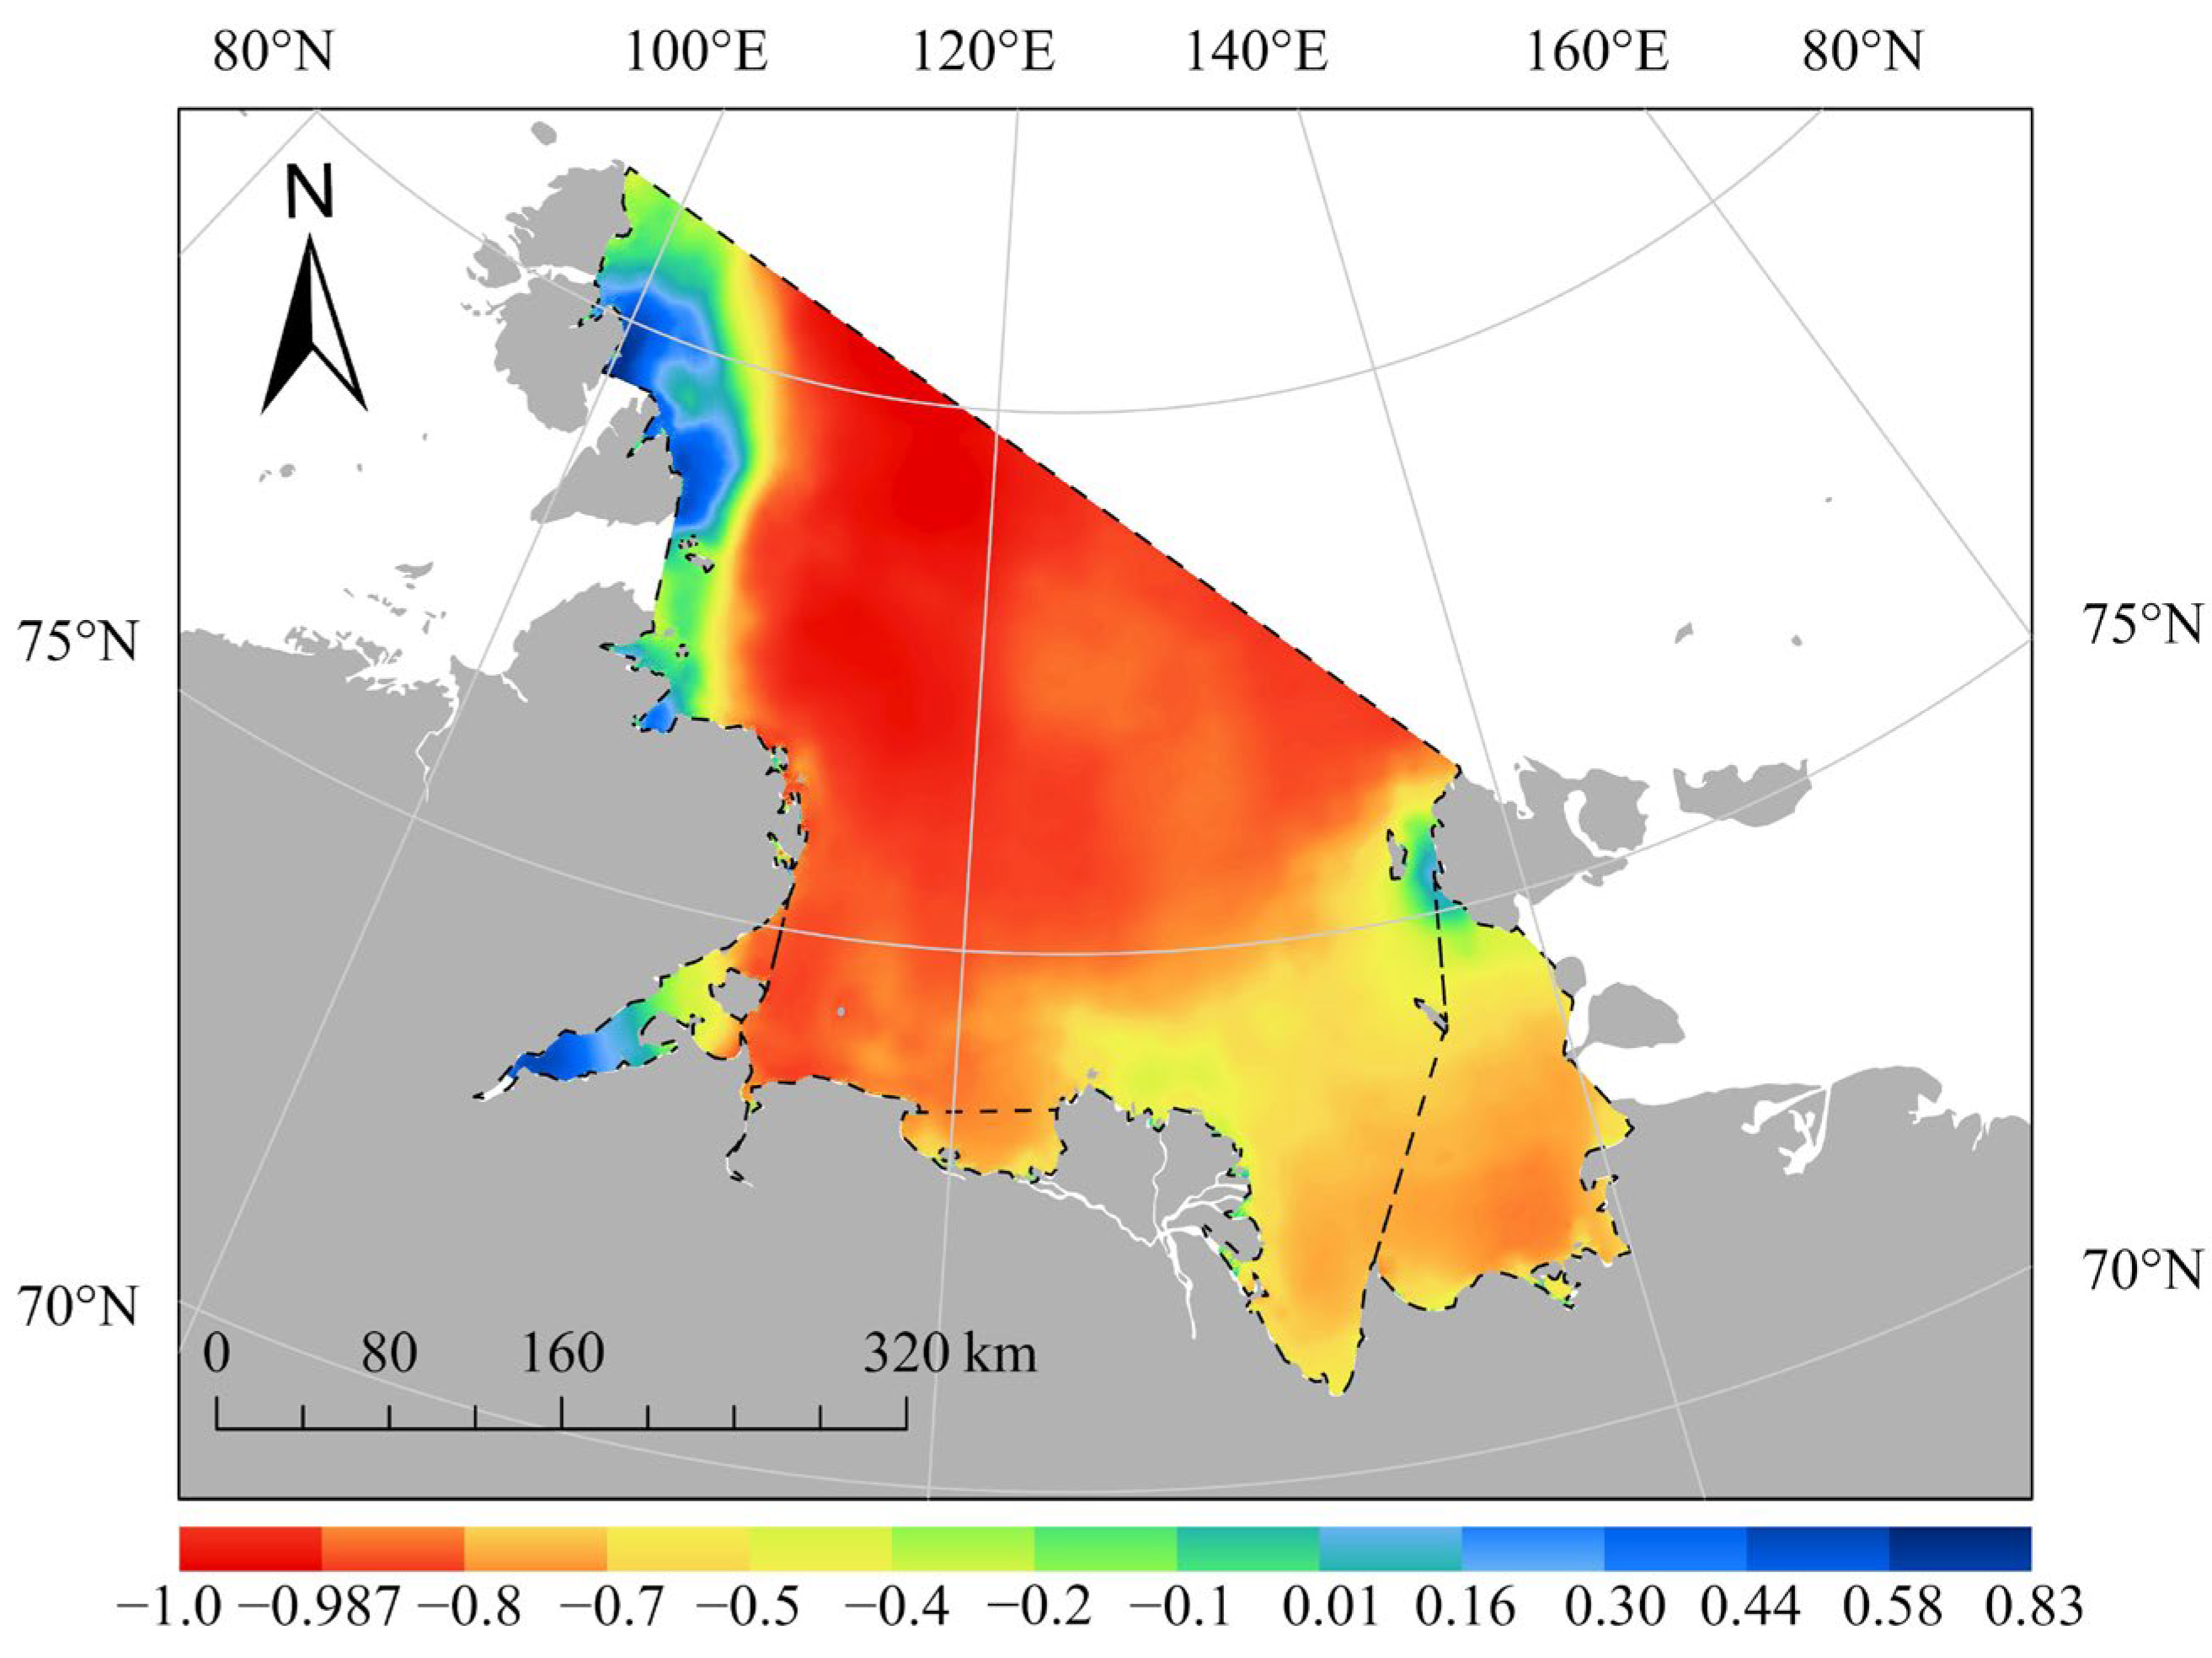
The geographical pattern of the correlation coefficients between SIC and SST in the Laptev Sea for the years 2004–2023 is shown in Figure 9. A statistical analysis demonstrated a statistically significant negative correlation between SST and SIC in the Laptev Sea over the period 2004–2023 (p < 0.01). The correlation coefficients ranged from −1 to 0.83, with the relationship predominantly characterized by negative values. In most areas of the Laptev Sea, SST and SIC showed negative correlations while positive correlations were primarily scattered along coastal regions
The analysis indicates a bidirectional interaction between sea ice melt and increases in SST, particularly during summer and fall, where elevated SST can delay fall freeze-up. This leads to thinner sea ice, making it more susceptible to melting in the subsequent summer, which in turn exacerbates SST increases. Moreover, with rising air temperatures and ongoing sea ice melt, SIC values are anticipated to experience further declines in the following summer. These results reveal a strong association between SST and SIC, indicating that SST could function as a reliable parameter for predicting sea ice dynamics.

5. Discussion

5.1. Seasonal Dynamics and Negative Correlation Between SST and SIC

From the discussion above, we can conclude that there is a statistically significant (p < 0.01) negative correlation between SST and SIC in the Laptev Sea, as depicted in the linear regression results shown in Figure 8. This finding aligns well with previous studies on the Arctic Ocean in recent decades. Between 1982 and 2018, various studies documented a general warming trend in the Arctic Ocean [29]. Additionally, some researchers have analyzed nearly two decades of relevant data and found that SST is a key driving factor for SIC. They discovered a statistically significant negative correlation between Arctic SST and SIC (p < 0.01) [25]. From Figure 4 and Figure 5, it is evident that SST shows a statistically significant increase in summer and fall but changes are less apparent in winter and spring, aligning with the SIC trend (p < 0.01). This aligns with previous studies, which reported enhanced transport rates during summer and elevated ice export in late winter, contributing to the thinning of the ice cover [30]. As illustrated by the variations in the monthly mean SIC in Figure 5, sea ice in the Laptev Sea typically begins to melt in late June each year, reaching its minimum extent around mid-September. After this, the sea ice enters a freezing period, achieving complete coverage by the end of October. The melting period lasts nearly three months while the freezing period takes about one and a half months. Although the durations vary slightly each year, the melting period is typically twice as long as the freezing period. These results are consistent with previous studies suggesting that the average total sea-ice volume flux in the Laptev Sea is lower in fall compared to winter [6].

5.2. Trends of the Sea Ice Extent in Laptev Sea over the Last 20 Years

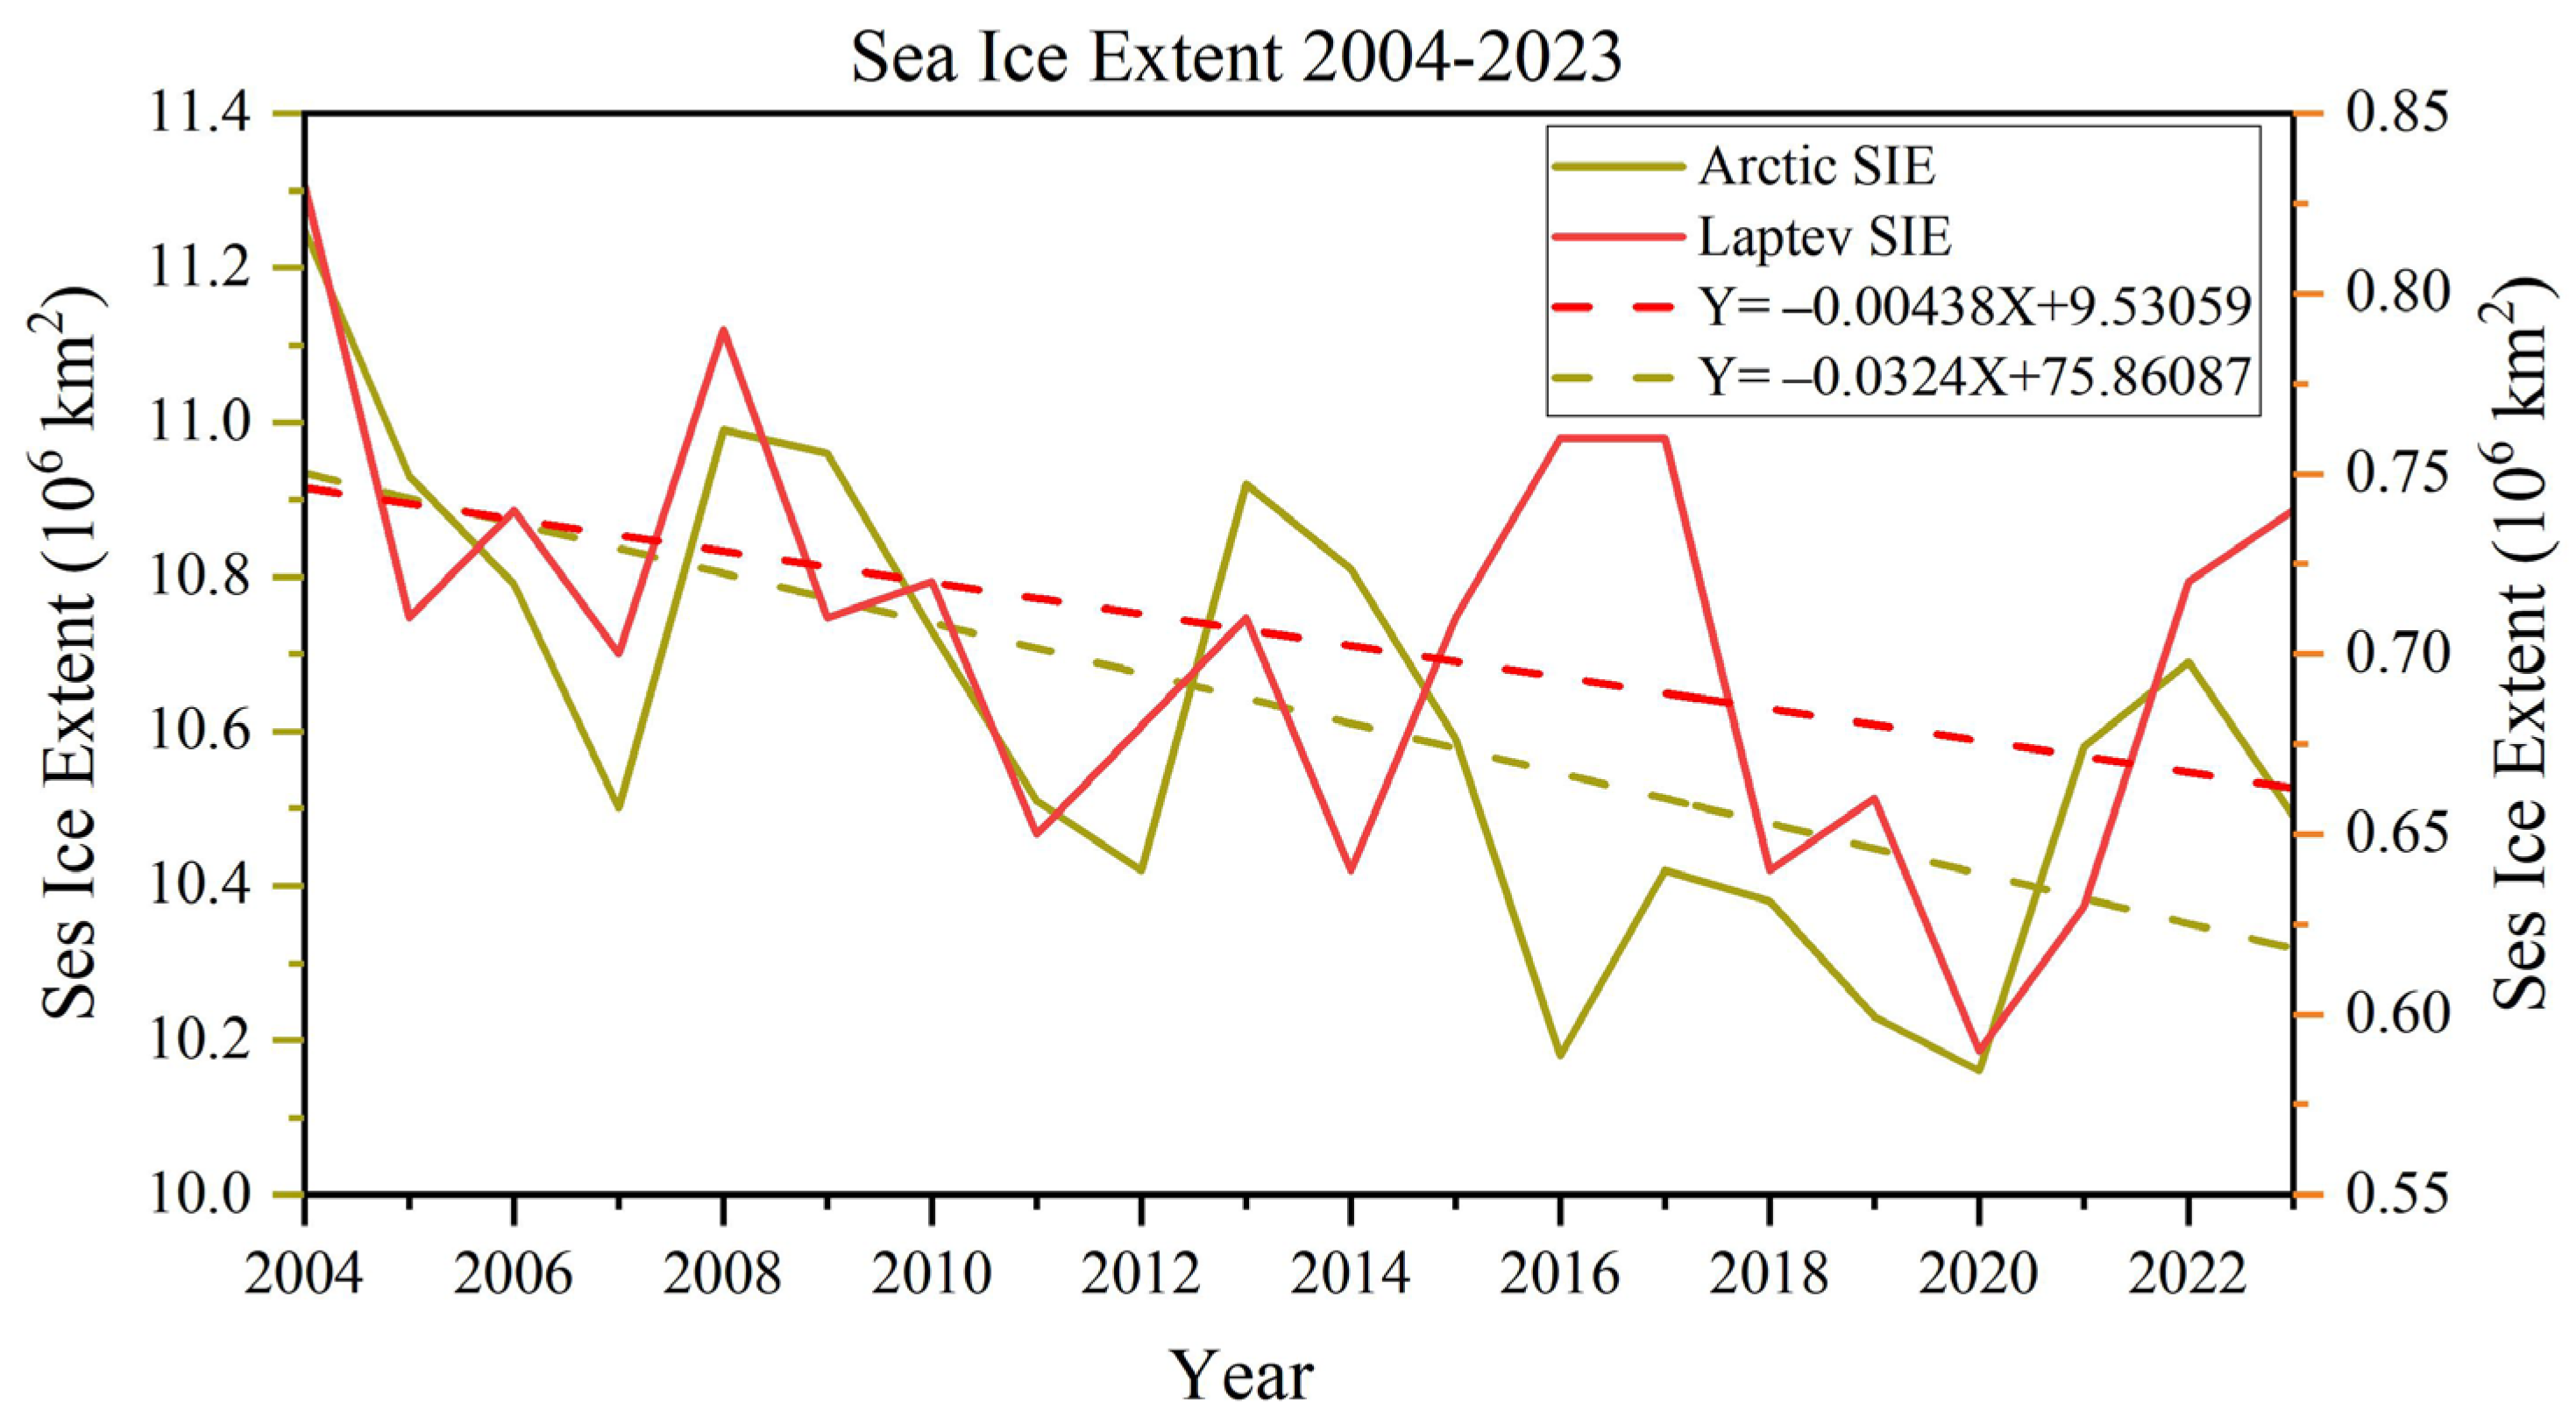
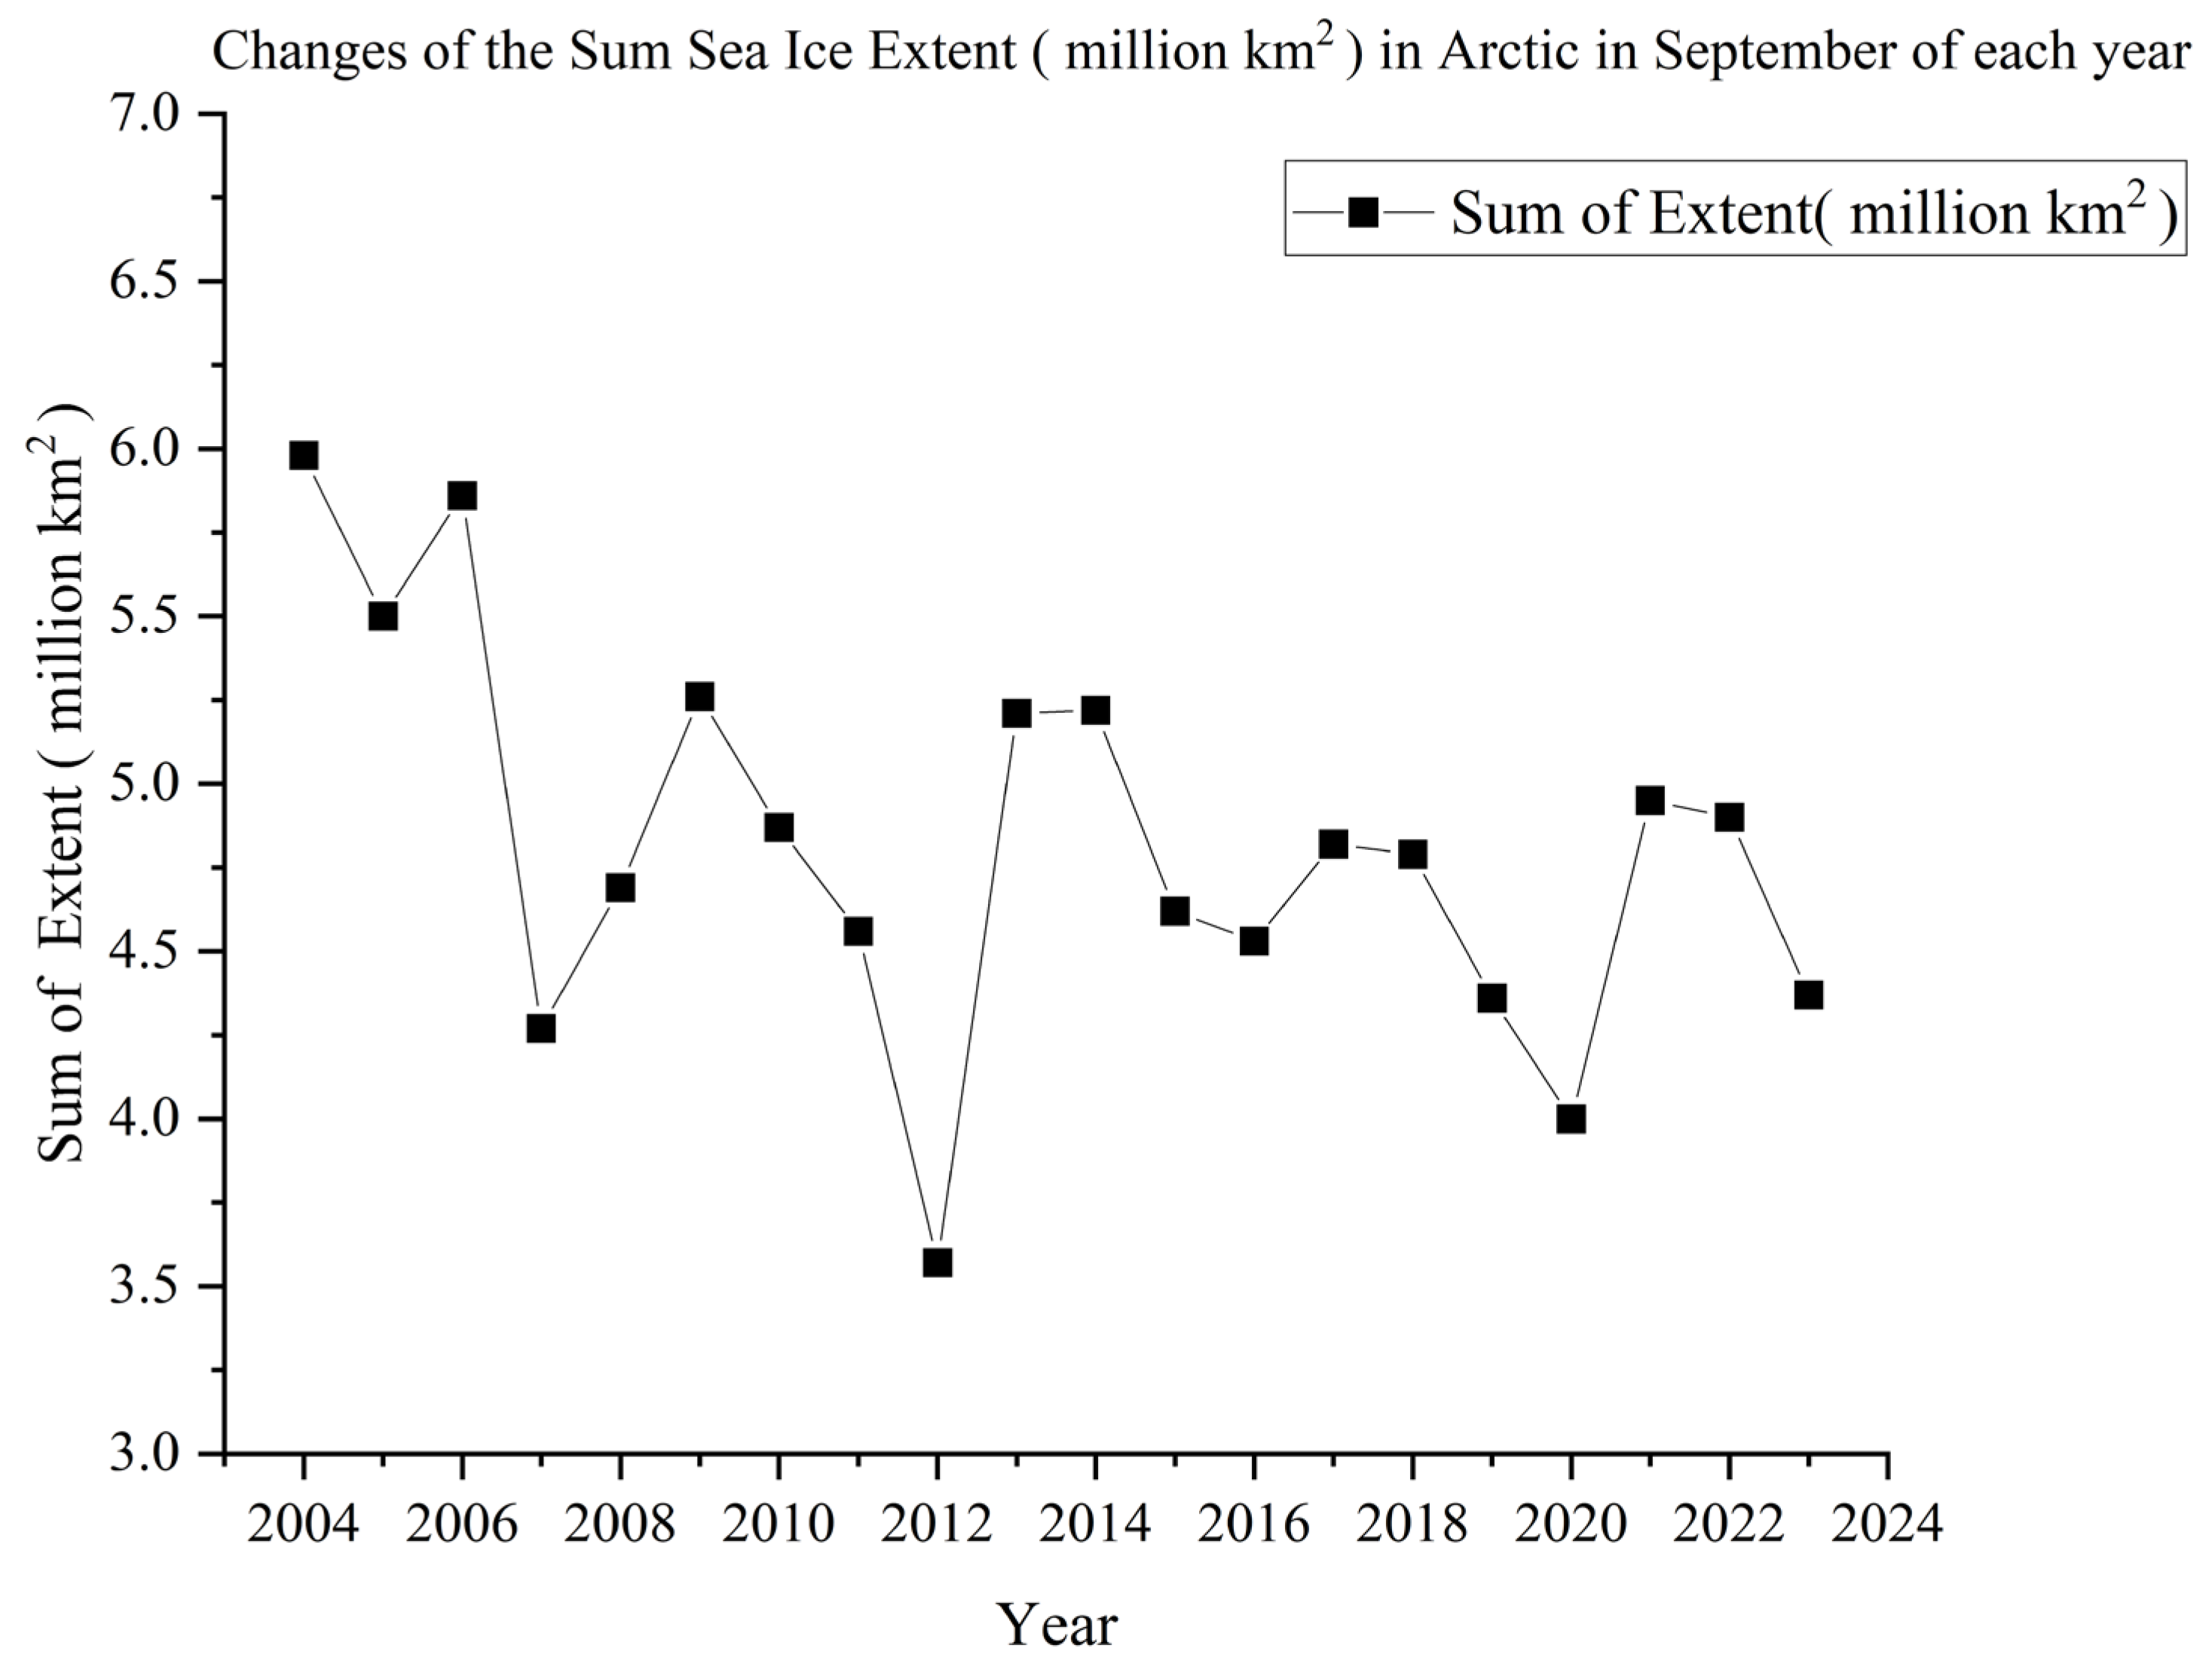
As stated by the International Snow and Ice Data Center, Sea Ice Extent (SIE) is interpreted as the area where the SIC exceeds 15%. Over the course of the last 20 years, the Arctic region and the Laptev Sea have exhibited a statistically significant declining trend in SIE (Figure 10) (p < 0.01). On a monthly scale, as illustrated in Figure 11, the Arctic SIE attains its peak in February and March, while reaching its bottom in September. The detailed data for SIE in September can be found in Figure 12. This monthly trend in SIC aligns with the results presented in Figure 5 of this paper. Arctic sea ice exhibits seasonal cycles of melting and refreezing, leading to annual fluctuations in SIC. In contrast, for multiyear ice, the SIC remains high, often reaching nearly 100% even during summer [47]. In September, the summer melting ends and the winter freezing has not begun yet. Sea ice that remains frozen until September and transforms into multiyear ice. This aligns with previous studies on multiyear variations of sea ice in the Laptev Sea, which identified a strong relationship between ice conditions and the duration of ice melt [1].

5.3. Causes of Spatiotemporal Sea Ice Changes

During the previous two decades, the SIC of the Laptev Sea has undergone a rapid decrease in sea ice at a rate of −1.297%/year (Table 2). The most statistically significant decrease occurs in the summer at −0.095%/year (p < 0.01), highlighting notable differences in the annual and seasonal rates of SIC (Table 2). The decline of Arctic sea ice during the boreal summer influences atmospheric temperatures, leading to amplification in the boreal winter, and has ultimately resulted in increased sea-ice loss over the course of the past 20 years (Figure 11). Arctic sea ice cover and its marginal seas are primarily influenced by heat exchange processes between the ocean and the atmosphere [48,49]. The key surface currents impacting Arctic sea ice include the anticyclonic Beaufort Gyre, the Laptev Sea Gyre, the cyclonic East Siberian circulation, and the Transpolar Drift Stream, which traverses the center of the Arctic [50]. These circulation patterns impact the distribution of sea ice concentration by affecting ice movement, fragmentation, ridge formation, and the morphology of interice polynyas. The Beaufort and Laptev gyres are in balance with each other and their interactions promote the transport of sea ice within the Laptev Sea region [51]. When the extent of the Beaufort Gyre expands, the area of the Laptev Gyre correspondingly shrinks. Sea ice entering vertical ocean currents primarily originates from the Chukchi Sea, Laptev Sea, and East Siberian Sea and is subsequently transported out of the Arctic Ocean through the Fram Strait, resulting in a decline in sea ice volume within the Laptev Sea. Conversely, when the Beaufort Gyre weakens, the Laptev Gyre intensifies, allowing more multiyear ice from the western Arctic Ocean to enter the ocean currents, which may increase the outflow of multiyear ice, resulting in a growth in sea ice volume within the Laptev Sea [17].

5.4. Internal Mechanisms Driving the Interaction Between SST and SIC

As illustrated in Figure 7, the influence of SST on SIC exhibits notable seasonal variability between summer and winter. During summer, SST typically serves as the primary driver of SIC ablation. The increase in SST will weaken the albedo feedback mechanism of sea ice and work together with solar radiation to accelerate sea ice melting [52]. In winter, SST affects the formation of sea ice through a slower heat exchange process [53]. The driving mechanisms of the interaction between SST and SIC include atmospheric forcing, ocean circulation, and other factors. Atmospheric forcing can intensify Arctic warming, causing sea surface temperatures to rise, thereby indirectly affecting the reduction in sea ice. Recent studies utilizing high-resolution coupled models to investigate the dynamic interactions between Arctic ocean currents and sea ice have revealed an increase in heat transport from the Atlantic to the Arctic Ocean, which is expected to influence the distribution patterns of SST and SIC across different regions of the Arctic Ocean [54].

5.5. Practical Application Significance

Over the past few decades, the accelerated retreat of sea ice has led to notable improvements in navigational conditions along Arctic sea routes. In contrast to the Suez Canal, the Northeast Passage (NEP) has a much shorter route, resulting in substantial savings in transportation time and costs [3,4]. SIC represents a critical factor influencing Arctic ship navigation and has been extensively utilized in research examining the effects of sea ice on vessel speed [55]. Ships need accurate information on SIC for safety when sailing through the Northeast Passage. As one of the four major sea areas of the Northeast Passage, the Laptev Sea can provide a reference for the navigability of ships in the Northeast Passage. In addition, studies have shown that climate change can affect the development of marine fisheries through factors such as rising sea temperatures, ocean acidification, and alterations in oceanic currents [56]. Therefore, the rise in SST in this sea area in recent years can also promote the development of marine fisheries.

5.6. Study Limitations

SIC is a crucial parameter influencing the spatial distribution and movement of sea ice, affected by various thermal factors. This study lacks the exploration of how other factors such as near-surface wind field, temperature change, or precipitation distribution specifically affect SST and SIC as well as the potential driving mechanism behind the relationship between SST and SIC. Additionally, the two datasets used in this paper differ in spatial and temporal resolution, which may introduce errors when selecting empirical formulas for modeling operations.

6. Conclusions

Using the Daily Optimum Interpolation SST dataset from NCEI and daily SIC data from the University of Bremen, changes in SST and SIC in the Laptev Sea from 2004 to 2023 were analyzed along with their correlation. The conclusions are as follows:
(1)
There is a clear spatial difference between SST and SIC. The monthly average SST in the Laptev Sea peaks at 5.23 °C in August and drops to a minimum of 0.48 °C in November. SIC reaches a maximum of 99.69% in December and a minimum of 62.58% in September, following the summer melt. The trend of interannual SST variability indicates an overall warming, though is not statistically significant (p < 0.01) at about +0.064 °C/year (Table 1), while the average annual SIC shows a statistically significant downward trend (p < 0.01), decreasing by about −1.297%/year (Table 2). The most notable trends in SST and SIC occur both in summer, with changes of +0.154 °C/year and −0.095%/year, respectively.
(2)
SST is the key factor influencing SIC and there was a strong negative correlation between SST and SIC in most areas of the Laptev Sea, with correlation coefficients ranging from −1 to 0.83. Sea ice melt interacts with increasing SST, particularly in summer and fall. The rise in SST can delay the fall freeze-up, resulting in thinner sea ice, which is more prone to melting in summer. This further contributes to the increase in SST.
(3)
Seasonal variations are observed in the influence of SST on SIC. The increase in SST in summer has a notable effect on accelerating the melting of sea ice and the decrease in SST in winter promotes the increase in SIC values. And from 2004 to 2023, the Laptev Sea’s sea ice concentration has shown a decreasing trend in summer and fall, with statistically significant interannual variability shifting from heavier to lighter ice conditions (p < 0.01).

Author Contributions

Conceptualization, C.Z. and P.Q.; methodology, C.Z. and P.Q.; software, C.Z. and Z.Z.; validation, C.Z., P.Q., Z.Z. and Y.Z.; formal analysis, P.Q. and C.D.; investigation, Z.Z. and Y.Z.; resources, C.D.; data curation, C.Z. and Z.Z.; writing—original draft preparation, C.Z.; writing—review and editing, P.Q. and C.D.; visualization, C.Z. and Z.Z.; funding acquisition, C.D. All authors have read and agreed to the published version of the manuscript.

Funding

This research was funded by Yunnan Key Laboratory of International Rivers and Transboundary Eco-Security, grant number 2022KF03.

Data Availability Statement

The sea surface temperature data OISST Version 2.1 is from the National Centers for Environmental Information (NCEI, https://www.ncei.noaa.gov/, accessed on 23 August 2024), the sea ice concentration data are from the University of Bremen (https://seaice.uni-bremen.de/data, accessed on 23 August 2024), and the sea ice extent data are from the U.S. National Ice Center (USNIC, https://usicecenter.gov/Products/, accessed on 23 August 2024).

Conflicts of Interest

The authors declare no conflicts of interest.

References

  1. Yao, W.; Zhao, J. Study on Multiyear Variations of Sea Ice in the Laptev Sea of the Arctic Ocean. Polar Stud. 2013, 25, 218–225. [Google Scholar]
  2. Parkinson, C.L.; Cavalieri, D.J. Antarctic sea ice variability and trends, 1979–2010. Cryosphere 2012, 6, 871–880. [Google Scholar] [CrossRef]
  3. Zeng, Q.; Lu, T.; Lin, K.-C.; Yuen, K.F.; Li, K.X. The competitiveness of Arctic shipping over Suez Canal and China-Europe railway. Transp. Policy 2020, 86, 34–43. [Google Scholar] [CrossRef]
  4. Schøyen, H.; Bråthen, S. The Northern Sea Route versus the Suez Canal: Cases from bulk shipping. J. Transp. Geogr. 2011, 19, 977–983. [Google Scholar] [CrossRef]
  5. Eguíluz, V.M.; Fernández-Gracia, J.; Irigoien, X.; Duarte, C.M. A quantitative assessment of Arctic shipping in 2010–2014. Sci. Rep. 2016, 6, 30682. [Google Scholar] [CrossRef]
  6. Bi, H.; Huang, H.; Fu, M.; Fu, T.; Zhou, X.; Xu, X. Estimating sea-ice volume flux out of the Laptev Sea using multiple satellite observations. Polar Res. 2016, 35, 225. [Google Scholar] [CrossRef]
  7. Muilwijk, M.; Hattermann, T.; Martin, T.; Granskog, M.A. Future sea ice weakening amplifies wind-driven trends in surface stress and Arctic Ocean spin-up. Nat. Commun. 2024, 15, 6889. [Google Scholar] [CrossRef]
  8. Ravindran, S.; Pant, V.; Mitra, A.K.; Kumar, A. Spatio-temporal variability of sea-ice and ocean parameters over the Arctic Ocean in response to a warming climate. Polar Sci. 2021, 30, 100721. [Google Scholar] [CrossRef]
  9. Zhang, F.; Pang, X.; Lei, R.; Zhai, M.; Zhao, X.; Cai, Q. Arctic sea ice motion change and response to atmospheric forcing between 1979 and 2019. Int. J. Climatol. 2021, 42, 1854–1876. [Google Scholar] [CrossRef]
  10. Yu, L.; Zhong, S.; Vihma, T.; Sun, B. Attribution of late summer early autumn Arctic sea ice decline in recent decades. npj Clim. Atmos. Sci. 2021, 4, 3. [Google Scholar] [CrossRef]
  11. Ye, K.; Woollings, T.; Sparrow, S.N. Dynamic and Thermodynamic Control of the Response of Winter Climate and Extreme Weather to Projected Arctic Sea-Ice Loss. Geophys. Res. Lett. 2024, 51, e2024GL109271. [Google Scholar] [CrossRef]
  12. Bliss, A.C.; Steele, M.; Peng, G.; Meier, W.N.; Dickinson, S. Regional variability of Arctic sea ice seasonal change climate indicators from a passive microwave climate data record. Environ. Res. Lett. 2019, 14, 045003. [Google Scholar] [CrossRef]
  13. Kumar, A.; Yadav, J.; Mohan, R. Global warming leading to alarming recession of the Arctic sea-ice cover: Insights from remote sensing observations and model reanalysis. Heliyon 2020, 6, e04355. [Google Scholar] [CrossRef]
  14. Cheng, L.; Abraham, J.; Zhu, J.; Trenberth, K.E.; Fasullo, J.; Boyer, T.; Locarnini, R.; Zhang, B.; Yu, F.; Wan, L.; et al. Record-Setting Ocean Warmth Continued in 2019. Adv. Atmos. Sci. 2020, 37, 137–142. [Google Scholar] [CrossRef]
  15. Letterly, A.; Key, J.; Liu, Y. Arctic climate: Changes in sea ice extent outweigh changes in snow cover. Cryosphere 2018, 12, 3373–3382. [Google Scholar] [CrossRef]
  16. Sandven, S.; Spreen, G.; Heygster, G.; Girard-Ardhuin, F.; Farrell, S.L.; Dierking, W.; Allard, R.A. Sea Ice Remote Sensing—Recent Developments in Methods and Climate Data Sets. Surv. Geophys. 2023, 44, 1653–1689. [Google Scholar] [CrossRef]
  17. Qu, L. Temporal and Spatial Characteristics Ofarctic Sea Ice Concentration and Extent and Its Response to Thermal and Dynamic Factors. Ph.D. Thesis, Guangdong Ocean University, Zhanjiang, China, 2023. [Google Scholar]
  18. Zhang, L.; Li, T. Physical Processes Responsible for the Interannual Variability of Sea Ice Concentration in Arctic in Boreal Autumn since 1979. J. Meteorol. Res. 2017, 31, 468–475. [Google Scholar] [CrossRef]
  19. Zhao, J.; BARBER, D.; Zhang, S.; Yang, Q.; Wang, X.; Xie, H. Record Low Sea-Ice Concentration in the Central Arctic during Summer 2010. Adv. Atmos. Sci. 2018, 35, 106–115. [Google Scholar] [CrossRef]
  20. Sen, L.; Bin, Z.; Shi, L. Polar sea ice concentration retrieval based on FY-3C microwave radiation imager data. Acta Oceanol. Sin. 2020, 42, 113–122. [Google Scholar]
  21. Wu, Z.; Wang, X.; Wang, X. An improved ARTSIST sea ice algorithm based on 19 GHz modified 91 GHz. Acta Oceanol. Sin. 2019, 38, 93–99. [Google Scholar] [CrossRef]
  22. Wu, D.; Tian, W.; Lang, X.; Mao, W.; Zhang, J. Statistical Modeling of Arctic Sea Ice Concentrations for Northern Sea Route Shipping. Appl. Sci. 2023, 13, 4374. [Google Scholar] [CrossRef]
  23. Screen, J.A.; Deser, C.; Smith, D.M.; Zhang, X.; Blackport, R.; Kushner, P.J.; Oudar, T.; McCusker, K.E.; Sun, L. Consistency and discrepancy in the atmospheric response to Arctic sea-ice loss across climate models. Nat. Geosci. 2018, 11, 155–163. [Google Scholar] [CrossRef]
  24. Webster, M.; Gerland, S.; Holland, M.; Hunke, E.; Kwok, R.; Lecomte, O.; Massom, R.; Perovich, D.; Sturm, M. Snow in the changing sea-ice systems. Nat. Clim. Chang. 2018, 8, 946–953. [Google Scholar] [CrossRef]
  25. Yang, M.; Qiu, Y.; Huang, L.; Cheng, M.; Chen, J.; Cheng, B.; Jiang, Z. Changes in Sea Surface Temperature and Sea Ice Concentration in the Arctic Ocean over the Past Two Decades. Remote Sens. 2023, 15, 1095. [Google Scholar] [CrossRef]
  26. Yi, D.L.; Fan, K.; He, S.; Wang, P. Sea-ice-loss slowdown modulates the sea surface salinification in the Kara–Laptev Seas since the 2008 summer. Environ. Res. Lett. 2024, 19, 084022. [Google Scholar] [CrossRef]
  27. Huang, B.; Liu, C.; Freeman, E.; Graham, G.; Smith, T.; Zhang, H.-M. Assessment and Intercomparison of NOAA Daily Optimum Interpolation Sea Surface Temperature (DOISST) Version 2.1. J. Clim. 2021, 34, 7421–7441. [Google Scholar] [CrossRef]
  28. Nielsen-Englyst, P.; Hoyer, J.L.; Kolbe, W.M.; Dybkjaer, G.; Lavergne, T.; Tonboe, R.T.; Skarpalezos, S.; Karagali, I. A combined sea and sea-ice surface temperature climate dataset of the Arctic, 1982-2021. Remote Sens. Environ. 2023, 284, 113331. [Google Scholar] [CrossRef]
  29. Carvalho, K.S.; Wang, S. Sea surface temperature variability in the Arctic Ocean and its marginal seas in a changing climate: Patterns and mechanisms. Glob. Planet. Chang. 2020, 193, 103265. [Google Scholar] [CrossRef]
  30. Krumpen, T.; Janout, M.; Hodges, K.I.; Gerdes, R.; Girard-Ardhuin, F.; Hoelemann, J.A.; Willmes, S. Variability and trends in Laptev Sea ice outflow between 1992–2011. Cryosphere 2013, 7, 349–363. [Google Scholar] [CrossRef]
  31. Hudson, P.A.; Martin, A.C.H.; Josey, S.A.; Marzocchi, A.; Angeloudis, A. Drivers of Laptev Sea interannual variability in salinity and temperature. Ocean Sci. 2024, 20, 341–367. [Google Scholar] [CrossRef]
  32. Dmitrenko, I.; Tyshko, K.; Kirillov, S.; Eicken, H.; Holemann, J.; Kassens, H. Impact of flaw polynyas on the hydrography of the Laptev Sea. Glob. Planet. Chang. 2005, 48, 9–27. [Google Scholar] [CrossRef]
  33. Dethleff, D.; Nürnberg, D.; Groth, E. East siberian arctic region expedition ’92: The Laptev Sea-its importance for Arctic sea ice formation and transpolar sediment flux. Berichte Zur Polarforsch. 1993, 120, 3–37. [Google Scholar]
  34. Torgny, V. Fram Strait ice fluxes and atmospheric circulation: 1950–2000. J. Clim. 2001, 14, 3508–3517. [Google Scholar]
  35. Kwok, R. Annual cycles of multiyear sea ice coverage of the Arctic Ocean: 1999–2003. J. Geophys. Res. Ocean. 2004, 109, C11004. [Google Scholar] [CrossRef]
  36. Dethleff, D.; Loewe, P.; Kleine, E. The Laptev Sea flaw lead-detailed investigation on ice formation and export during 1991/1992 winter season. Cold Reg. Sci. Technol. 1998, 27, 225–243. [Google Scholar] [CrossRef]
  37. Kwok, R. Recent changes in Arctic Ocean sea ice motion associated with the North Atlantic Oscillation. Geophys. Res. Lett. 2000, 27, 775–778. [Google Scholar] [CrossRef]
  38. Krumpen, T.; Hölemann, J.A.; Willmes, S.; Morales Maqueda, M.A.; Busche, T.; Dmitrenko, I.A.; Gerdes, R.; Haas, C.; Heinemann, G.; Hendricks, S.; et al. Sea ice production and water mass modification in the eastern Laptev Sea. J. Geophys. Res. 2011, 116, C05014. [Google Scholar] [CrossRef]
  39. Pfirman, S.L.; Colony, R.; Nürnberg, D.; Eicken, H.; Rigor, I. Reconstructing the origin and trajectory of drifting Arctic sea ice. J. Geophys. Res. Ocean. 1997, 102, 12575–12586. [Google Scholar] [CrossRef]
  40. Reynolds, R.W.; Smith, T.M.; Liu, C.; Chelton, D.B.; Casey, K.S.; Schlax, M.G. Daily high-resolution-blended analyses for sea surface temperature. J. Clim. 2007, 20, 5473–5496. [Google Scholar] [CrossRef]
  41. Banzon, V.; Smith, T.M.; Chin, T.M.; Liu, C.; Hankins, W. A long-term record of blended satellite and in situ sea-surface temperature for climate monitoring, modeling and environmental studies. Earth Syst. Sci. Data 2016, 8, 165–176. [Google Scholar] [CrossRef]
  42. Banzon, V.; Smith, T.M.; Steele, M.; Huang, B.; Zhang, H.-M. Improved Estimation of Proxy Sea Surface Temperature in the Arctic. J. Atmos. Ocean. Technol. 2020, 37, 341–349. [Google Scholar] [CrossRef]
  43. Spreen, G.; Kaleschke, L.; Heygster, G. Sea ice remote sensing using AMSR-E 89-GHz channels. J. Geophys. Res. Ocean. 2008, 113, C02S03. [Google Scholar] [CrossRef]
  44. Iwamoto, K.; Ohshima, K.I.; Tamura, T.; Nihashi, S. Estimation of thin ice thickness from AMSR-E data in the Chukchi Sea. Int. J. Remote Sens. 2013, 34, 468–489. [Google Scholar] [CrossRef]
  45. Kodaira, T.; Waseda, T.; Nose, T.; Inoue, J. Record high Pacific Arctic seawater temperatures and delayed sea ice advance in response to episodic atmospheric blocking. Sci. Rep. 2020, 10, 20830. [Google Scholar] [CrossRef]
  46. Saracoglu, F.A.; Aydogan, B.; Ayat, B.; Saracoglu, K.E. Spatial and Seasonal Variability of Long-Term Sea Surface Temperature Trends in Aegean and Levantine Basins. Pure Appl. Geophys. 2021, 178, 3769–3791. [Google Scholar] [CrossRef]
  47. Zhao, L.; Yang, D.; Zhong, R.; Yin, X. Interannual, Seasonal, and Monthly Variability of Sea Surface Temperature Fronts in Offshore China from 1982–2021. Remote Sens. 2022, 14, 5336. [Google Scholar] [CrossRef]
  48. Comiso, J.C.; Parkinson, C.L.; Gersten, R.; Stock, L. Accelerated decline in the Arctic Sea ice cover. Geophys. Res. Lett. 2008, 35, L01703. [Google Scholar] [CrossRef]
  49. Screen, J.A.; Simmonds, I. The central role of diminishing sea ice in recent Arctic temperature amplification. Nature 2010, 464, 1334–1337. [Google Scholar] [CrossRef]
  50. Guemas, V.; Blanchard-Wrigglesworth, E.; Chevallier, M.; Day, J.J.; Déqué, M.; Doblas-Reyes, F.J.; Fučkar, N.S.; Germe, A.; Hawkins, E.; Keeley, S.; et al. A review on Arctic sea-ice predictability and prediction on seasonal to decadal time-scales. Q. J. R. Meteorol. Soc. 2014, 142, 546–561. [Google Scholar] [CrossRef]
  51. Proshutinsky, A.Y.; Johnson, M.A. Two circulation regimes of the wind-driven Arctic Ocean. J. Geophys. Res. Ocean. 1997, 102, 12493–12514. [Google Scholar] [CrossRef]
  52. Stroeve, J.C.; Crawford, A.D.; Stammerjohn, S. Using timing of ice retreat to predict timing of fall freeze-up in the Arctic. Geophys. Res. Lett. 2016, 43, 6332–6340. [Google Scholar] [CrossRef]
  53. Onarheim, I.H.; Eldevik, T.; Smedsrud, L.H.; Stroeve, J.C. Seasonal and Regional Manifestation of Arctic Sea Ice Loss. J. Clim. 2018, 31, 4917–4932. [Google Scholar] [CrossRef]
  54. Huang, J.; Zhang, X.; Zhang, Q.; Lin, Y.; Hao, M.; Luo, Y.; Zhao, Z.; Yao, Y.; Chen, X.; Wang, L.; et al. Recently amplified arctic warming has contributed to a continual global warming trend. Nat. Clim. Change 2017, 7, 875–879. [Google Scholar] [CrossRef]
  55. Shu, Y.; Cui, H.; Song, L.; Gan, L.; Xu, S.; Wu, J.; Zheng, C. Influence of sea ice on ship routes and speed along the Arctic Northeast Passage. Ocean Coast. Manag. 2024, 256, 107320. [Google Scholar] [CrossRef]
  56. Xu, Y.; Krafft, T.; Martens, P. The interaction between climate change and marine fisheries: Review, challenges, and gaps. Ocean Coast. Manag. 2024, 259, 107479. [Google Scholar] [CrossRef]
Figure 1. Geographic location of the Laptev Sea, modified from the International Institute for Law of the Sea Studies (IILSS, https://iilss.net/about-laptev-sea-facts-and-maps/, accessed on 23 August 2024). The dashed line represents the boundaries of it.
Water 17 00769 g001
Figure 2. Showing the changes in SST for 2004–2023 of the Laptev Sea: (a) annual; (b) seasonal. (a) The purple line indicates a linear trend in SST (regression statistics: R2 = 0.60216; equation: y = 0.06631x−133.06848). All correlation coefficients demonstrate statistical significance at the 0.01 level (p < 0.01). (b) The changes across spring, summer, fall, and winter are represented by black, yellow, blue, and green lines, respectively.
Water 17 00769 g002
Figure 3. Summer SST (June to August) in the Laptev Sea for the years 2004–2023.
Water 17 00769 g003
Figure 4. The monthly average SST in the Laptev Sea for the years 2004–2023.
Water 17 00769 g004
Figure 5. The monthly average SIC in the Laptev Sea for the years 2004–2023.
Water 17 00769 g005
Figure 6. Variation in SST and SIC in the Laptev Sea in 2023. The black line with rectangles represents SST, while the red line with circles represents SIC.
Water 17 00769 g006
Figure 7. Linear regression analysis of the average summer (a) and winter (b) SIC on SST for the years 2004 to 2023. All correlation coefficients demonstrate statistical significance at the 0.01 level (p < 0.01).
Water 17 00769 g007
Figure 8. Linear regression analysis of the average annual SIC on SST for the years 2004 to 2023. All correlation coefficients demonstrate statistical significance at the 0.01 level (p < 0.01).
Water 17 00769 g008
Figure 9. Spatial distribution of the correlation coefficients between SIC and SST in the Laptev Sea for the years 2004–2023.
Water 17 00769 g009
Figure 10. The timeseries plot representing annual SIE in the Arctic region and Laptev for the years 2004–2023.
Water 17 00769 g010
Figure 11. The trends of the SIE by month in the Arctic for the years 2004–2023.
Water 17 00769 g011
Figure 12. The trends of the SIE in September in the Arctic for the years 2004–2023.
Water 17 00769 g012
Table 1. SST characteristics of the Laptev Sea across various temporal scales.
StatisticsInterannual SST CharacteristicsSeasonal SST Characteristics
SpringSummerFallWinter
Mean (°C)0.4520.3080.6450.5030.352
Trend (°C/year)+0.068+0.035+0.154+0.130+0.040
Max SST (°C)1.3801.1123.2871.7770.882
Min SST (°C)−0.511−0.107−1.354−0.838−0.717
Table 2. SIC characteristics of the Laptev Sea at different temporal scales.
StatisticsInterannual SIC CharacteristicsSeasonal SIC Characteristics
SpringSummerFallWinter
Mean (%)70.0199.5641.3450.5695.59
Trend (%/year)−1.297−0.012−0.095−0.082−0.001
Max SIC (%)95.9599.2288.7382.6299.64
Disclaimer/Publisher’s Note: The statements, opinions and data contained in all publications are solely those of the individual author(s) and contributor(s) and not of MDPI and/or the editor(s). MDPI and/or the editor(s) disclaim responsibility for any injury to people or property resulting from any ideas, methods, instructions or products referred to in the content.