Article

Assessment and Validation of Shallow Groundwater Vulnerability to Contamination Based on Fuzzy Logic and DRASTIC Method for Sustainable Groundwater Management in Southeast Hungary

1
Department of Geoinformatics, Physical and Environmental Geography, University of Szeged, Szeged Egyetem Str. 2-6, H-6722 Szeged, Hungary
2
LISA Laboratory, Ecole Nationale des Sciences Appliques, Hassan First University of Settat, Berrechid 26100, Morocco
*
Author to whom correspondence should be addressed.
Supervision.
Water 2025, 17(5), 739; https://doi.org/10.3390/w17050739
Submission received: 9 January 2025 / Revised: 28 February 2025 / Accepted: 28 February 2025 / Published: 3 March 2025

Abstract

:
A hierarchical fuzzy inference system (FIS) integrated with the DRASTIC model is applied in this study to enhance the assessment of shallow groundwater vulnerability in southeast Hungary, a region characterized by extensive agriculture and industrial growth. Traditional groundwater vulnerability models often struggle with parameter imprecision and uncertainty, affecting their reliability. To address these limitations, fuzzy logic was incorporated to refine the classification of vulnerability zones. The hierarchical FIS incorporates the seven DRASTIC parameters: depth to the water table, net recharge, aquifer media, soil media, topography, vadose zone impact, and hydraulic conductivity, assigning flexible ratings through fuzzy membership functions. The model classifies the fuzzy groundwater vulnerability index (FGWVI) into low, moderate, and high categories, revealing that 63.9% of the study area is highly susceptible to contamination, particularly in regions with shallow water tables and sandy soils. Validation was conducted using nitrate (NO3) concentrations and electrical conductivity (EC) measurements from 46 agricultural wells to assess the correlation between predicted vulnerability zones and actual groundwater quality indicators. The correlation analysis revealed a moderately strong positive relationship between FGWVI and both NO3 (R2 = 0.4785) and EC (R2 = 0.528), supporting the model’s ability to identify high-risk contamination zones. This study highlights the effectiveness of the fuzzy-enhanced DRASTIC model in evaluating aquifer vulnerability and provides crucial insights to assist policymakers in identifying pollution sources and developing strategies to mitigate groundwater contamination, thereby alleviating the stress on this critical resource.

1. Introduction

Groundwater is a vital source of fresh water for industrial, agricultural, and domestic purposes across various regions worldwide. It is the largest reserve of liquid fresh water on Earth [1] and is traditionally less vulnerable to contamination than surface water. However, the increasing reliance on groundwater has led to overexploitation, compromising both its quantity and quality in many regions [2]. Urbanization and industrialization are increasingly threatening this critical resource [3], exacerbating the rates of waste and industrial effluent discharge, which overwhelm the natural purification capacity of the environment [4]. Given the escalating global pressure from anthropogenic activities and climate change, coupled with the intricate nature of groundwater systems, integrated multidisciplinary approaches are crucial for addressing the scientific challenges associated with water resources [5,6]. These approaches incorporate various groundwater quality and vulnerability assessment methods and are informed by a comprehensive understanding of regional and local geological conditions [7,8].
Aquifer vulnerability can be assessed using various methodologies with different complexities, computational demands, and data requirements [9]. The DRASTIC model, a prominent index method, effectively simplifies complex hydrogeological settings into an accessible index format and is widely adopted to evaluate vulnerability in different parts of the world [10,11]. Nonetheless, the inherent subjectivity of the data availability and/or the variability in hydrogeological characteristics across different regions require modifications to the DRASTIC model to enhance its accuracy, as evidenced by global studies on its adaptations [12,13,14,15,16,17,18,19]. These studies affirm that the improved DRASTIC method enable dependable evaluation of groundwater vulnerability. However, one significant limitation of this model is its static input parameter ratings; any changes in these parameters do not correspondingly alter the model output. Moreover, despite the need for a comprehensive set of input data for a thorough assessment of groundwater vulnerability, the data available for DRASTIC are often limited or compromised by the use of substandard measurement technologies [20]. Addressing this limitation requires modifications to the DRASTIC framework, including tailored parameter adjustments and the incorporation of methods to handle input uncertainty [16,21]. One promising approach is the application of fuzzy logic (FL) techniques, which allow for continuous, nuanced classifications of vulnerability rather than rigid categorical boundaries [22,23,24,25,26,27,28].
In recent years, the hierarchical fuzzy inference system (FIS) has emerged as an effective tool for enhancing the traditional methods. Unlike previous studies focusing on point predictions of aquifer vulnerability, hierarchical FIS addresses uncertainties inherent in hydrogeological data. This approach not only reduces subjectivity but also provides a more realistic and flexible vulnerability index. Previous studies have demonstrated the superior performance of hierarchical FIS compared to traditional methods in predicting groundwater contamination risk. Ref. [29] used a hierarchical fuzzy system (HFS) model to address the limitation of the DRASTIC method in managing uncertainties by dynamically adjusting the parameter ratings. The HFS model incorporates the DRASTIC parameters and uses fuzzy logic to provide continuous, nuanced vulnerability indices. In their assessment of Ranchi District, India, the authors found that the HFS model yielded higher accuracy in vulnerability predictions, as indicated by a stronger correlation (R2 = 0.621) with the observed nitrate concentration data compared to the traditional DRASTIC model (R2 = 0.481). The study highlights the HFS model’s capacity to better represent groundwater contamination risks. Ref. [30] refined groundwater vulnerability assessments by developing a hierarchical fuzzy inference model (HFIM) and applying it in Cuddalore District, India. The HFIM incorporated standard DRASTIC parameters within a GIS framework, enhancing adaptability and responsiveness to data changes. A comparison with the traditional DRASTIC model showed the HFIM’s superior performance, classifying vulnerability into seven nuanced categories, as opposed to DRASTIC’s five. Model validation using nitrate concentration data revealed a stronger correlation in the HFIM (R2 = 0.704) versus DRASTIC (R2 = 0.60), with the HFIM displaying a smoother transition across vulnerability categories. These studies underscore the potential of FL-based models to address the limitations of traditional DRASTIC applications, particularly in handling subjectivity and uncertainty.
Building on these advancements, this study introduces an adaptation called the fuzzy-enhanced DRASTIC method, which integrates FL into the traditional DRASTIC method, by employing hierarchical fuzzy inference systems (FISs) that enable dynamic adjustments to parameter ratings. This adaptation leverages expert’ knowledge and site-specific data to define fuzzy membership functions, allowing for a more nuanced representation of each parameter’s impact on groundwater vulnerability. The proposed approach maintains the conventional DRASTIC weighting factors to preserve the model’s original structure and ensure comparability with previous studies. This hybrid approach combines the strengths of the DRASTIC framework with the flexibility of fuzzy logic, providing a more refined vulnerability index without altering the fundamental principles of the original method. Unlike conventional DRASTIC, which relies on static parameter ratings that fail to capture real-world uncertainties, hierarchical FIS dynamically adjusts parameter ratings using fuzzy membership functions. This approach effectively manages input data uncertainties and provides a continuous and more nuanced vulnerability index. The hierarchical structure of the FIS allows for better integration of the seven key DRASTIC parameters, reducing subjectivity and improving the model’s accuracy. This adaptation ensures a more realistic representation of groundwater vulnerability, making it a valuable tool for regions where data limitations and environmental variability present significant challenges [31,32].
Southeast Hungary, the focus of this study, is a region characterized by high agricultural activity and increasing industrial development, which place significant pressure on its groundwater resources. Related studies within the study area cover analyses of changing groundwater levels [33], the impact of different surface covers on groundwater uptake [34], and assessments of groundwater quality and quantity [35]. The complex hydrogeological conditions and the growing risk of contamination highlight the need for advanced assessment methodologies that can inform decision-making and policy development. By applying the fuzzy-enhanced DRASTIC model, this study provides regional authorities with a practical tool for identifying high-risk areas and includes critical insights for sustainable water resource management in the region. The collective expertise and experience of the authors of the current study in conducting research within the study area and the broader Great Hungarian Plain (GHP) constitute a robust knowledge base. Such knowledge is instrumental in developing an FL-based approach to enhance the parameters used in the DRASTIC model. The subsequent sections detail the key principles of fuzzy theory that are applied in this context.

2. Methodology

The core principle of groundwater vulnerability assessment involves creating maps that delineate areas susceptible to contamination, thus highlighting their spatial distribution. Achieving a precise vulnerability index typically necessitates a dense array of accurate field data, which often contrasts with the practical availability of such data. To address these challenges, this study employs a hierarchical fuzzy inference system (FIS) integrated with the DRASTIC model to address the imprecision and uncertainty inherent in input parameter ratings. This methodology enhances the robustness of vulnerability evaluations by incorporating flexible and dynamic ratings through fuzzy membership functions, ensuring a more reliable representation of groundwater contamination risks. Figure 1 presents a comprehensive flowchart of the proposed methodology, and each step is detailed in the subsequent subsections.

2.1. Introduction of Study Area

The area featured in this study located at coordinates 46°20′–47°00′ N and 20°00′–21°00′ E (Figure 2), is part of the GHP, Hungary, within the Carpathian Basin, East-Central Europe (19.38–22.86° E and 46.18–48.32° N), and covers an area of 8690 km2. The climate of this area straddles the humid oceanic and humid continental zones, featuring more variable temperatures than the former and more extreme temperatures than the latter, with an average annual temperature of approximately 12.7 °C. This is about 2.5 °C above the typical for this latitude, influenced positively by the Atlantic Ocean and Mediterranean Sea [36]. The Tisza river, Hungary’s second major river [37], bisects the study region and delineates two distinctly different soil types: loose sandy soils and variable soils with finer texture. Along the riverbanks, the predominant soil types are clay and clayey loam, which have low permeability, resulting in minimal infiltration. To the west of the Tisza River, the terrain is primarily sandy, interspersed with occasional areas of sandy loam, and a smaller region to the northwest is dominated by loam soils. The study area’s southeast section is largely composed of loam soils interspersed with areas of clayey loam. The region has an average elevation of approximately 100 m above Baltic Sea level (MASL), and a topographic slope of under 2%, characterizing it as a predominantly flat, fertile plain. Agriculture forms the economic backbone of this region, with over 65% of the land devoted to the cultivation of maize, sunflower, wheat, onions, and fruits [38]. The first three are dominant on loessy areas while fruits and vegetables are typical on sand, with these relying heavily on groundwater for irrigation, consuming approximately 42 million m3 of groundwater annually [34,36]. The intensive use of fertilizers and pesticides poses a significant risk of groundwater contamination. Additionally, this area is particularly prone to severe, prolonged droughts, which exacerbate groundwater depletion and affect the groundwater table dynamics [39,40].
Given its status as one of Hungary’s most productive agricultural areas and its critical role in national food production [33], the chosen study area exemplifies the challenges of balancing agricultural productivity with sustainable water management. Assessing the vulnerability of aquifers to contamination thus emerges as a vital strategy for enabling policymakers to implement effective management measures to mitigate groundwater contamination risks while also addressing the socio-economic demands of the region [41].
Nitrate is selected as the primary indicator pollutant for calibrating the fuzzy-enhanced DRASTIC model due to its hazardous characteristics and its prevalence as a significant contaminant across the study area. Additionally, electrical conductivity (EC) is incorporated as a supplementary validation metric to assess the model’s performance, as it reflects the total concentration of dissolved ions in groundwater, often indicating contamination from anthropogenic sources. The analysis involves measuring nitrate concentrations and EC levels in 46 monitoring wells distributed throughout the region. Figure 2 illustrates the study area and the geographical distribution of these sampling points.

2.2. DRASTIC Model

DRASTIC is a systematic approach designed by the United States Environmental Protection Agency [42] to assess groundwater vulnerability through an index and rating system. This method involves integrating seven critical hydrogeological settings that are intrinsic to the sensitivity of an aquifer to potential contaminants. These indexes are the depth to the water table (D), net recharge (R), aquifer type (A), soil media (S), topography (T), impact of the vadose zone (I), and hydraulic conductivity (C). Each parameter is rated on a scale of 1 to 10 and assigned a corresponding weight of 1–5 based on its effect on the overall groundwater vulnerability. A vulnerability index Vi (Equation (1)) is computed for each pixel or unit grid cell within the study area using a weighted linear combination of these parameters, as shown in Equation (1).
V i = i = 1 7 W i R i ,
where Wi and Ri represent the weight and rating, respectively, assigned to the parameter i. Vi is the intrinsic vulnerability score, capturing the composite effect of the hydrogeological setting on the potential movement of contaminants. This index does not consider the specific land use or the chemical properties of contaminants, focusing instead on the intrinsic properties of the aquifer system [11]. Given its cost-effectiveness, simplicity, and reliance on readily available data, DRASTIC is widely used to evaluate the vulnerability of groundwater resources [10].

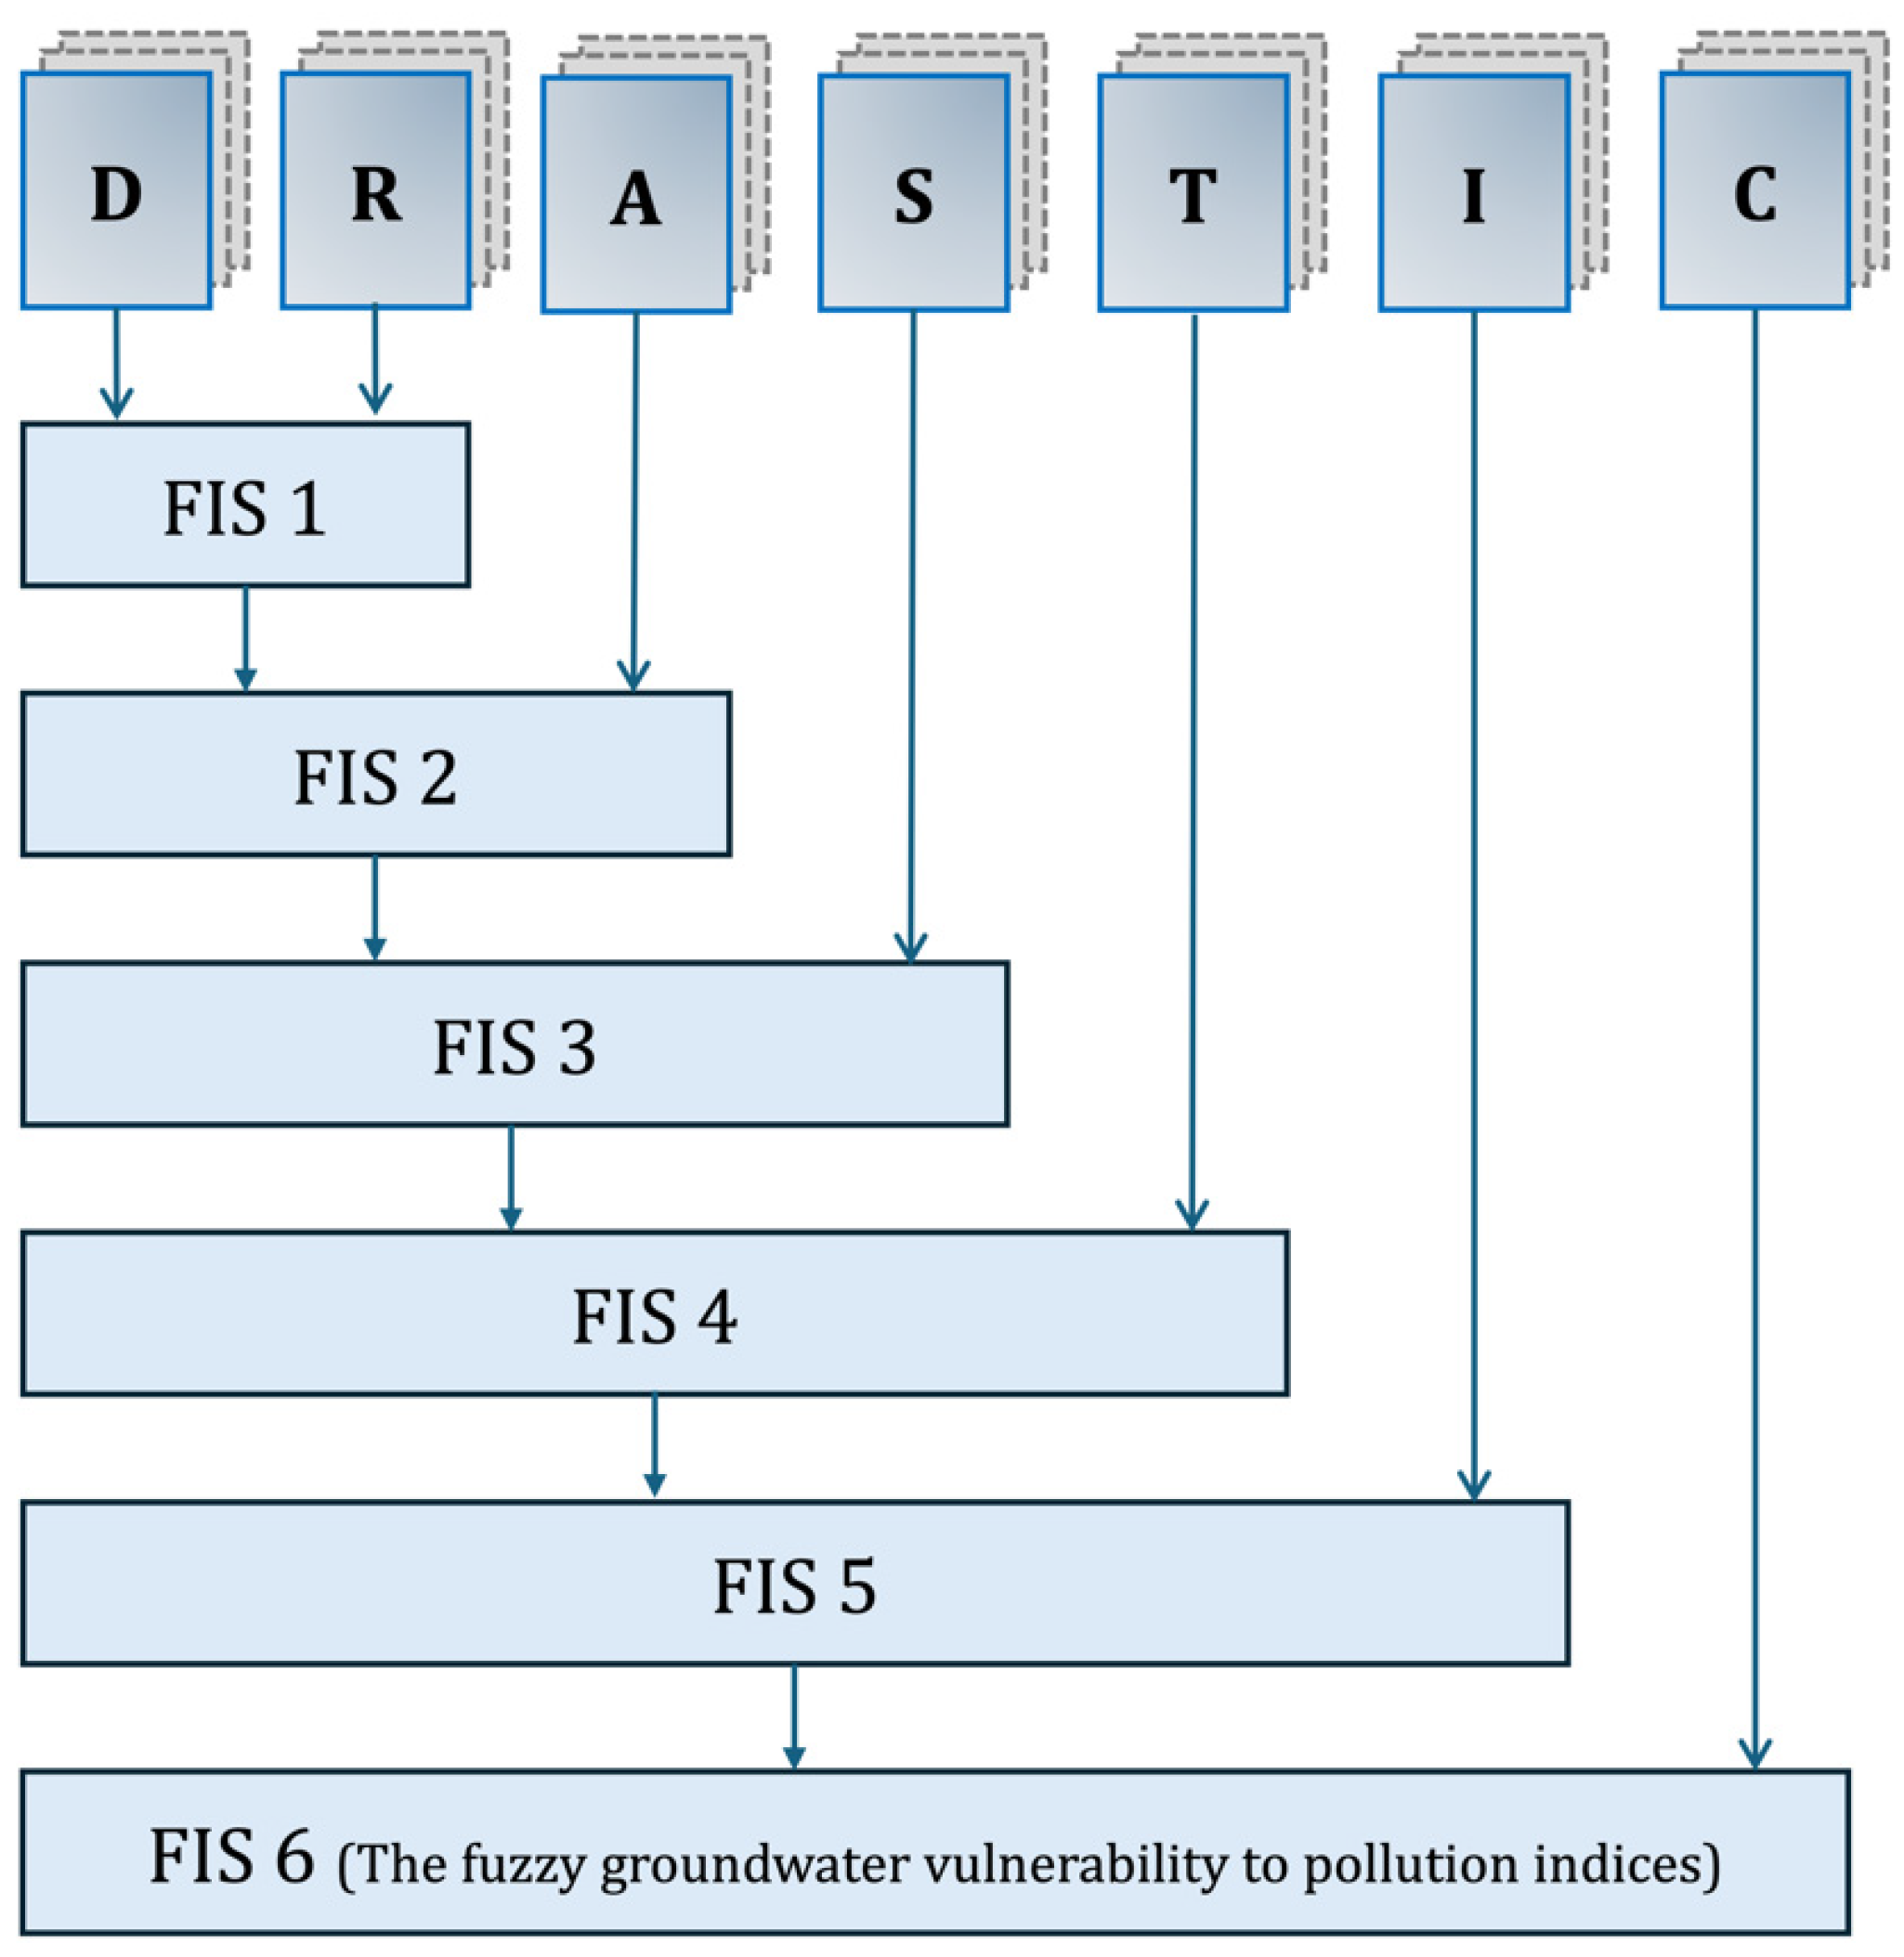
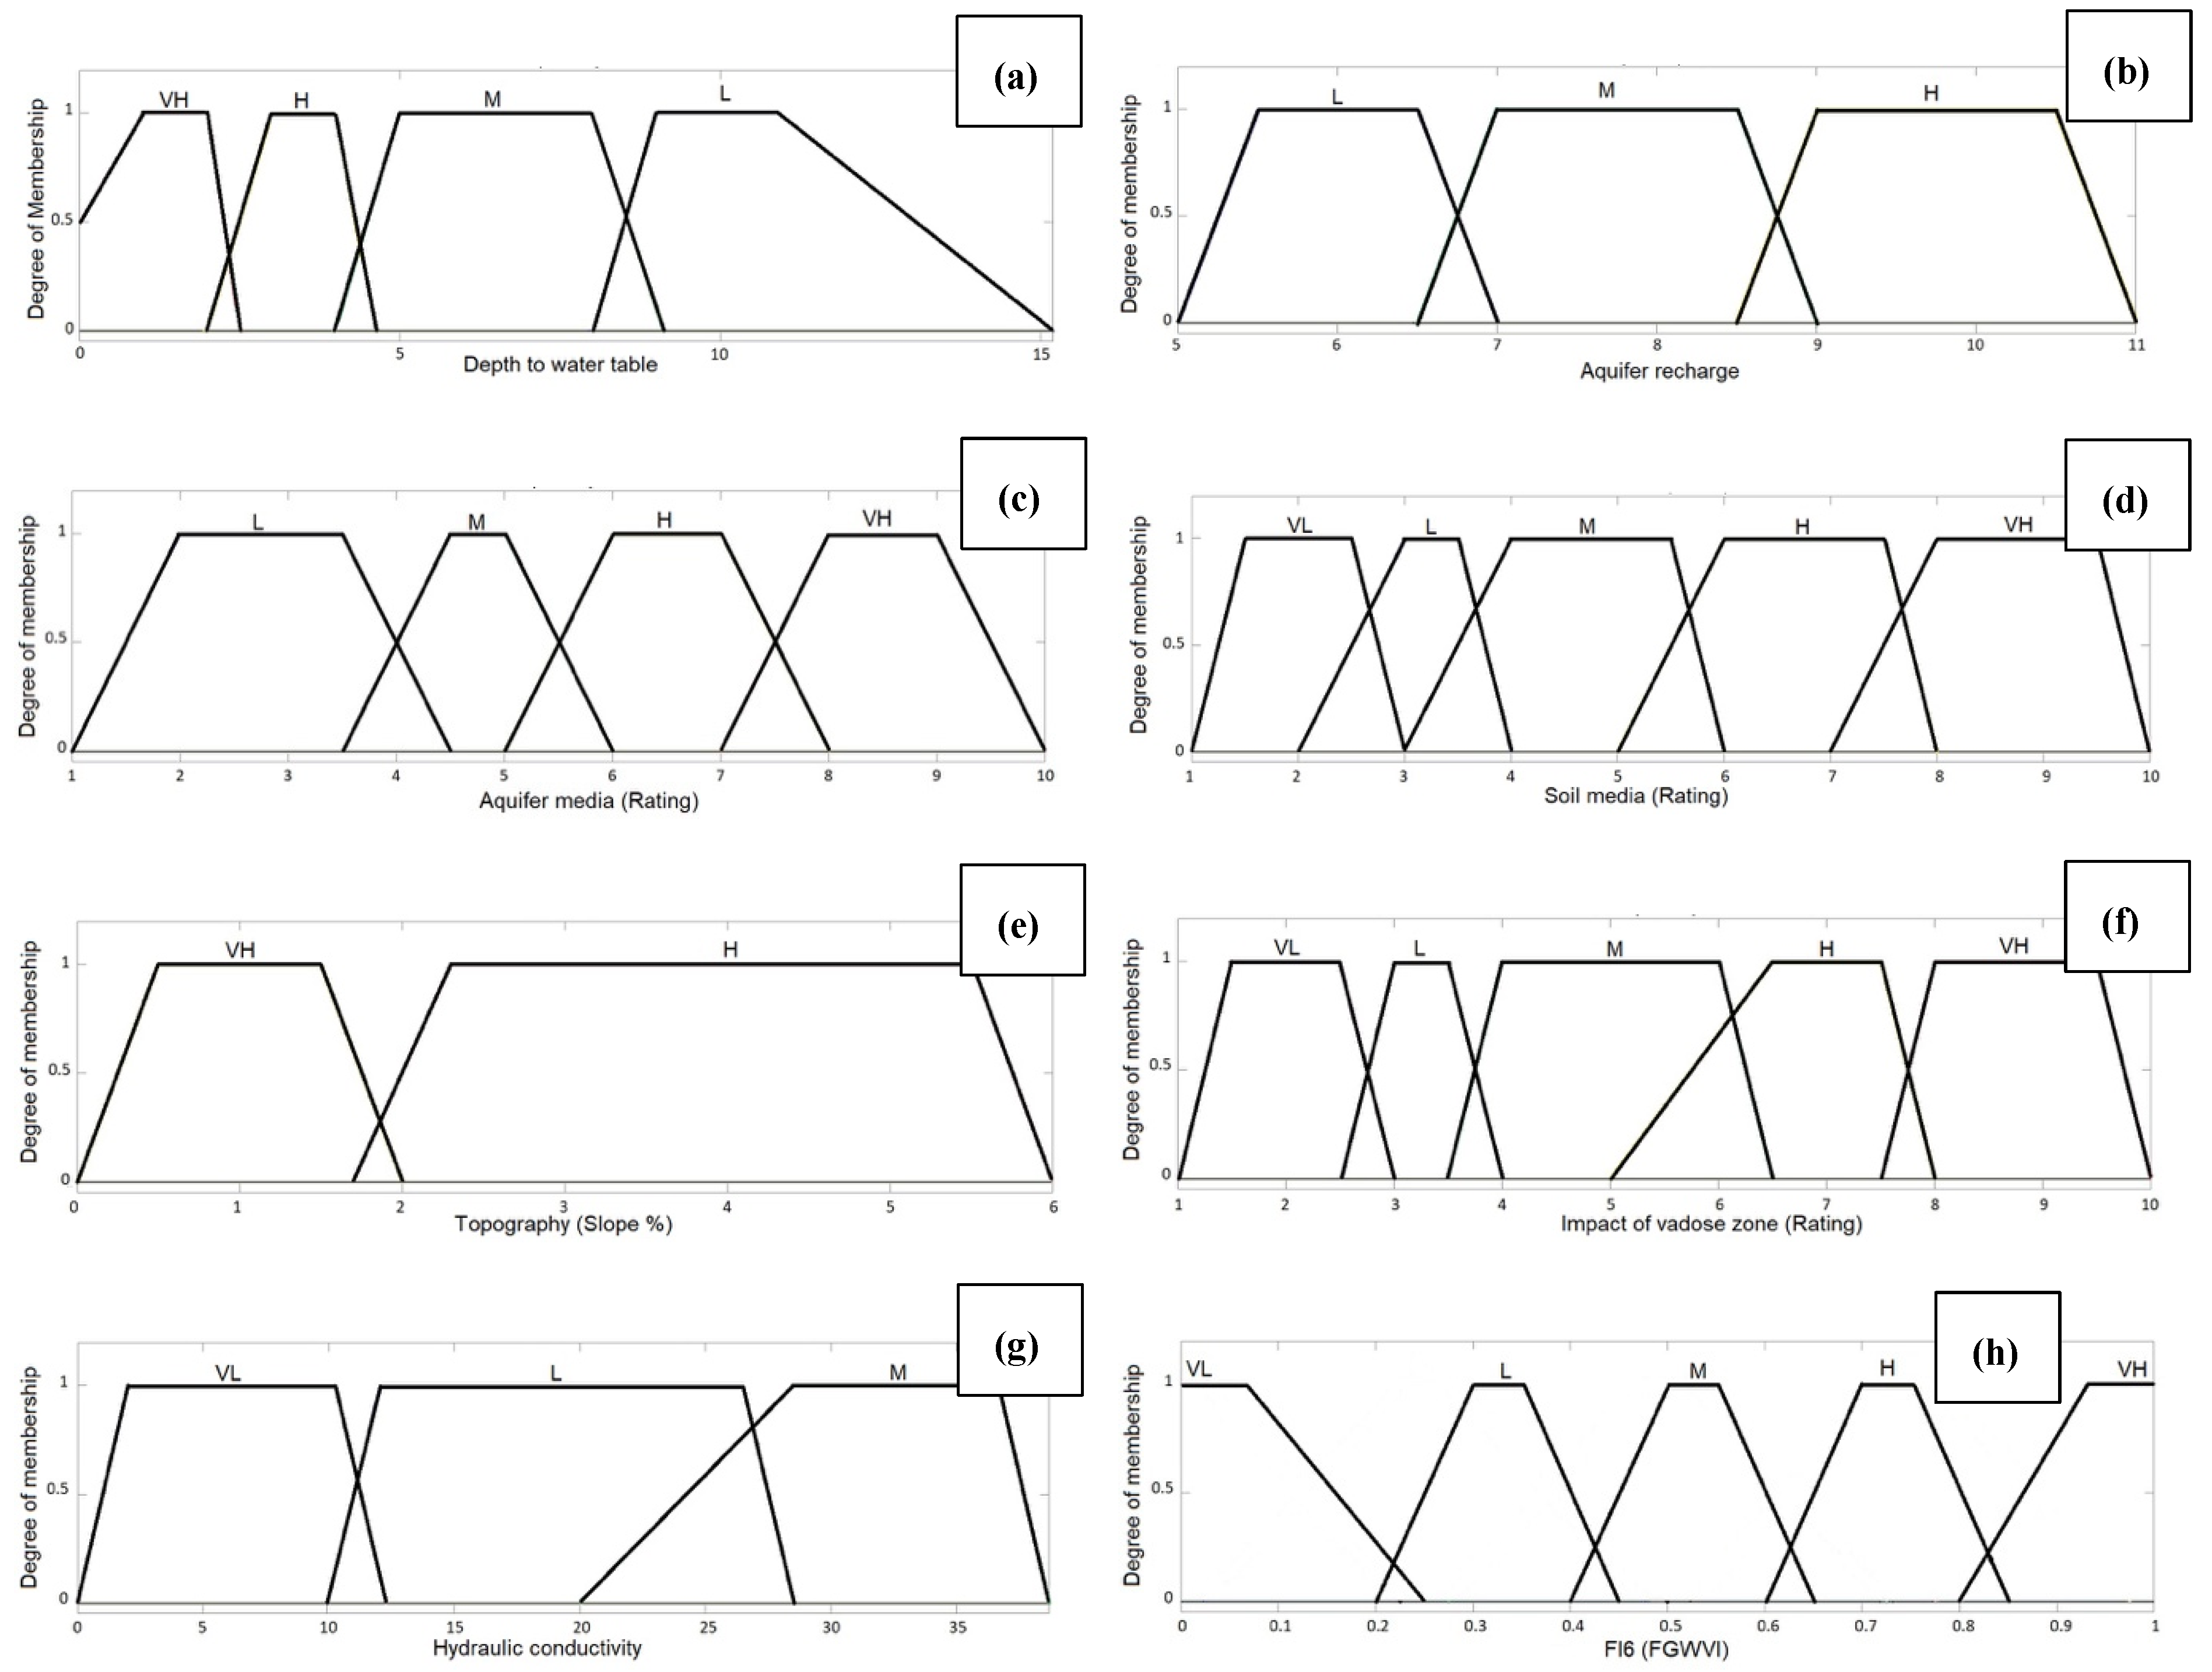
2.3. Hierarchical Fuzzy Inference System (FIS)

The integration of FL into the DRASTIC approach to groundwater vulnerability assessment is a significant advancement in addressing the inherent uncertainties and subjectivities associated with the traditional DRASTIC method [43]. Unlike conventional approaches, which often rely on fixed parameter ratings, the FL technique enhances the precision of assessments by providing continuous outputs that capture nuances in parameter interactions. This capability is particularly critical for complex groundwater systems influenced by multiple, interdependent variables.
The FL technique employs a structured process comprising fuzzification, rule base development, inference engine operation, and defuzzification (Figure 3). A challenge in applying FL to model with multiple parameters is the extensive set of rules required for accurate modeling [25,29]. Additionally, previous researchers primarily used single-layer fuzzy systems [26,44,45], which, while effective, often struggled to balance accuracy with computational efficiency. Building upon these efforts and addressing the abovementioned limitation, the present study aims to organize the DRASTIC parameters into a hierarchical structure, as depicted in Figure 4. This configuration outlines the hierarchical FIS model used to assess the potential of groundwater pollution. The model consists of six FISs (FIS1 through FIS6), with the output of one level serving as the input of the next. For example, the parameters depth to the water table (D) and net recharge (R) are combined to establish the first level of the hierarchy. The results of this level are then integrated with the aquifer media (A) parameter to form the second level, and this process continues sequentially. The parameters used in this hierarchical model align with those in the conventional DRASTIC model for groundwater vulnerability assessment. This structured approach substantially reduces the rule base size and computational demands, and the hierarchical FIS offers a more efficient and scalable alternative to single-layer fuzzy systems, making it particularly suitable for groundwater vulnerability assessments in data-scarce or complex hydrogeological settings [30].
In the application of this refined methodology, MATLAB R 2019 is utilized to develop the FIS. During fuzzification, parametric values are converted into linguistic variables and, assigns them, membership functions MFs (triangular, Gaussian, trapezoidal, sigmoidal, or cubic). In this study, the trapezoidal membership function is employed (Figure 5); this function is chosen for its simplicity and computational efficiency, which contribute to its reliability in capturing parameter variability [29]. Defined by four parameters—a, b, c, and d—the trapezoidal MF allows for nuanced representation of parameter ranges, as shown in Equation (2). Table 1 presents the parameters and their corresponding MFs. This table provides accurate values across a diverse array of parameter subcategories, ensuring simplicity and convenience. This format is appropriate for managing multiple input points effectively.
μ A ( x ) = 0 ,   ( x < a )   o r   ( x > d ) x a b a ,   ( a     x     b ) 1 ,   ( b     x     c ) d x d c ,   ( c     x     d )
where
  • a is the starting point of the trapezoid where the membership value starts to increase from 0.
  • b is the point where the membership function reaches a value of 1, starting the flat “top” of the trapezoid.
  • c is the point where the flat “top” of the trapezoid ends and the membership value starts to decrease.
  • d is the ending point of the trapezoid where the membership function value returns to 0.
For x < a or x > d, the membership value α(x) = 0, indicating that x is outside the trapezoid.
For axb, the membership value increases linearly from 0 to 1 as x moves from a to b.
For bxc, the membership value α(x) = 1, indicating the plateau or “top” of the trapezoid, where x is fully in the fuzzy set.
For cxd, the membership value decreases linearly from 1 to 0 as x moves from c to d.
The following phase entails constructing the conditional segment by establishing a rule that links the input parameters with the outputs analyzed by the inference engine. MATLAB supports two types of inference engines: Mamdani and Sugeno. The Mamdani inference engine is selected in this study due to its superior capability to handle human inputs and its highly interpretable results [46]. This engine operates on IF–THEN rules, integrating OR/AND operators to connect the input and output parameters. The final step in this process is translating the fuzzy output values back into precise real-world values.
The subsequent sections detail the operational hierarchy of the FIS, demonstrate the integration of the hydrogeological parameters (from the depth to the water table to hydraulic conductivity), ultimately assessing the vulnerability of groundwater in specific districts. This hierarchical FL approach presents a sophisticated framework designed to enhance the accuracy and applicability of groundwater vulnerability assessments.

2.3.1. FIS1: Groundwater Depth vs. Recharge Rate

The initial component of our hierarchical FIS, FIS1, evaluates the relationship between groundwater depth (D) and net recharge (R), two critical hydrogeological parameters that significantly influence groundwater vulnerability to contamination. Groundwater depth (D) governs the leaching process, determining the time needed by contaminants to travel from the soil surface to the aquifer, thereby affecting vulnerability [7]. Aquifers with shallow water tables are highly susceptible to contamination via diffusion, as they often have reduced natural attenuation [47]. In the spring of 2022, water-table depths measured at 383 well locations (Figure 2) were interpolated using the kriging method in ArcGIS 10.8, revealing depths of 1.1–10.9 m below ground level (mbgl) (Figure 6a). These values were subsequently categorized into four vulnerability ranges—low, moderate, high, and very high—each represented by a specific MF, as illustrated in Figure 5a.
Aquifer recharge rate (R) quantifies the water infiltrating the soil to replenish the aquifer, serving as a primary conduit for contaminant movement, thereby influencing dilution and dispersion. The Piscopo method is adopted to calculate the recharge rate index, incorporating the land slope, annual rainfall, and soil permeability [48], shown in Table 2 after applying Equation (3). Derived from the ASTER digital elevation model (DEM) data with a spatial resolution of 5 m × 5 m, the land slope in nearly all (99.9%) of the study area is less than 2%, resulting in a uniform slope rating of 4. The annual rainfall data collected from nine local stations in 2021 average 326 mm, leading to a rainfall rating of 1. Soil permeability is assessed through a comprehensive soil survey (0–40 cm depth) conducted within the study area [49], and the soil types across the study area are classified from very low to high permeability based on the United States Department of Agriculture System (1994). The soil classifications, coupled with the physical characteristics of the region—predominantly clay and clayey loam soils along the east side of the Tisza River and sandy to loamy soils to the west and southeast—were used to finalize the recharge indices detailed in Table 2, emphasizing the impact of soil permeability on recharge dynamics.
Recharge index (Ri) = rainfall factor + land slope factor + soil permeability factor.
Figure 5b demonstrates the MFs applied to the net recharge (R) parameter in the hierarchical FIS, specifically FIS1. This parameter is segmented into three distinct ranges, each corresponding to one of the three MFs. For the outputs of FIS1, five MFs are designated. The total number of operational rules for this layer is calculated by multiplying the four MFs for depth to the water table by the three MFs for the recharge rate, yielding a total of 12 rules. These rules are comprehensively listed in Table 3, which provides a detailed framework of the operational logic for FIS1. These rules include the following:
* Rule 1: If the depth to the water table is low (L) and the recharge rate is low (L), then the output for FIS1 is very low (VL).
* Rule 2: If the depth to the water table is low (L) and the recharge rate is moderate (M), then the FIS1 classification is low (L).
* …
* Rule 9: If the depth to the water table is high (H) and the recharge rate is high (H), then the FIS1 output is very high (VH).

2.3.2. FIS2: FIS1 vs. Aquifer Media

In the construction of the second FIS (FIS2), the FIS1 output serves as an input alongside the aquifer media parameter. FIS1 is characterized by five distinct MFs: very low (VL), low (L), moderate (M), high (H), and very high (VH). The aquifer media parameter is classified into four MFs: low (L), moderate (M), high (H), and VH. This arrangement results in a comprehensive rule base consisting of 20 unique rules, derived from the product of the FIS1 and aquifer media MFs (5 × 4). The specific rules governing FIS2 are detailed in Table 3.
The aquifer media layer, pivotal in defining the contaminant attenuation capacities of the saturated zone, is characterized by its physical and hydraulic properties [50]. This layer is delineated based on the lithological profiles obtained from the 383 wells within the study site (Figure 2); primary components, such as fine to medium-grained sand, clay, and sandy silts, are identified (Figure 6c). These soil textures are quantitatively transformed into fuzzy sets on a scale of 1–10, reflecting their influences on groundwater vulnerability. Sandy sediments, noted for their high porosity, enhance contaminant percolation, thereby increasing vulnerability. Conversely, aquifers composed of clay and sandy silts, which exhibit small to medium voids, present reduced vulnerability to contamination. Accordingly, areas with sand and gravel sediments are assigned MFs of high to very high, whereas semi-consolidated sediments are classified as moderate. Silty clay/clayey sediments, associated with minimal percolation potential, are categorized as low. Figure 5c illustrates the MFs applied to the aquifer media, providing a visual representation of this categorization.

2.3.3. FIS3: FIS2 vs. Soil Media

The FIS2 outputs are integrated with the soil media parameter to form the basis of FIS3. In preparation for FIS3, the FIS2 outputs are reclassified into five classes: VL, low (L), moderate (M), high (H), and VH. Soil media, the uppermost layer of the Earth’s crust, are the initial media through which contaminants are transferred below the surface [32]. This layer’s data are from a detailed report on soil conditions and irrigation potentials within the study site [49]. Loam is prevalent in the eastern section of the groundwater basin, whereas sand and sandy loam are more common in the western parts, near the Tisza River. Clay and clay loam soils, covering approximately one-sixth of the area, are interspersed in small patches along and to the south of the Tisza River (Figure 6d). These soil types are transformed into a fuzzy set scale of 1–10, and MFs are assigned based on their permeability and infiltration capabilities. Figure 5d depicts the MFs assigned to each soil type, categorized into five levels: VH, high (H), moderate (M), low (L), and VL.

2.3.4. FIS4: FIS3 vs. Topography

In the development of FIS4 within our hierarchical FIS, the FIS3 outputs are integrated with the topography parameter. The topography of the region refers to the impact of the land surface on the contaminant leaching mechanism [12]. In general, this parameter significantly influences runoff rates, determining whether contaminants are transported across or retained on the land surface to potentially infiltrate the groundwater system [51]. For this analysis, the topography of the study area is extracted from DEM data with a 5 × 5 m resolution and converted into slope percentages using the 3D Analyst tool in ArcGIS 10.6.1.
The slope across of the groundwater basin varies between 0% and 2%, which encompasses approximately 99.9% of the area, while a narrow zone toward the southern part near the Serbian borders exhibited slopes up to 4% (Figure 6e). Based on these findings, two MFs—VH and high (H)—are assigned to represent the slope classes. Figure 5e illustrates the MFs assigned to the topography parameter. As with the other FISs, the FIS3 membership functions are reclassified into five distinct classes to align with this integration: VL, L, M, H, and VH. The 10 rules generated for this inference system are listed in Table 3.

2.3.5. FIS5: FIS4 vs. Impact of Vadose Zone

In the formulation of the fifth FIS (FIS5), the FIS4 outputs are integrated with the impact of the vadose zone parameter, enhancing the understanding of contaminant transport from the soil surface to the aquifer. The vadose zone, which lies between the ground surface and the water table, plays a crucial role as a conduit for contaminants [52]. Its physical properties, such as porosity and permeability, are pivotal in governing the movement of contaminants and significantly enhance the zone’s capacity for natural attenuation of these substances [53].
Figure 6f presents the characterization of the vadose zone within the study area, which is determined using the lithological data collected from the 383 wells (Figure 2). The vadose zone materials are then assigned MFs based on their potential influence on contamination pathways: sand and gravel, which are highly permeable, are categorized as very high; sand/sandy silt formations are high; mixtures of sand and silty clay are moderate; silty clay is low; and clay is VL. Figure 5f displays the MFs assigned to the impact of the vadose zone, with each type quantified on a scale of 1–10 based on its influence on groundwater vulnerability.
FIS5, thus, operates with two input parameters, each categorized into five MFs. The rules that govern this FIS are comprehensive and tailored to reflect the intricate interactions between the vadose zone’s characteristics and the topographic features processed in FIS4. These rules are systematically detailed in Table 3.

2.3.6. FIS6: FIS5 vs. Hydraulic Conductivity

FIS6 represents the culmination of the hierarchical FIS designed to evaluate groundwater vulnerability to pollution. This final system integrates the FIS5 outputs with the hydraulic conductivity parameter. This layer quantifies the aquifer’s ability to transmit water, which is crucial for understanding the migration pathways of contaminants through the aquifer [54]. Assuming that contaminants move parallel to the movement of groundwater [55], this parameter provides a direct measure of potential contaminant dispersal from the point of infiltration to further regions of the aquifer.
The data for this layer are obtained from [56]. The hydraulic conductivity of the study area is approximately 4.18–38.72 m/day (Figure 6g). These values are categorized into three distinct groups, each corresponding to a specific MF that reflects the varying conductivity level. These classifications are visualized in Figure 5g, and the Figure 5h further display the MFs utilized in FIS6, encapsulating the final input synthesis for predicting groundwater vulnerability accurately. The rules generated for this FIS are listed in Table 3.

2.4. Model Validation

The validation of aquifer vulnerability assessment methodologies remains a significant challenge due to the absence of a universally standard validation approach [8,55]. To enhance confidence in the vulnerability assessment, researchers commonly compare model predictions with data for common contaminants measured directly from field samples [47].
In this study, groundwater vulnerability to pollution is quantitatively assessed using the fuzzy-enhanced DRASTIC model. Validation is conducted through a comparative analysis between the fuzzy-enhanced DRASTIC model’s predicted vulnerability zones and electrical conductivity (EC) in groundwater, as well as nitrate (NO3) concentrations from 46 agricultural wells across the study area. These wells are georeferenced using global positioning system technology to obtain precise location data (Figure 1). The model’s performance was evaluated by calculating the coefficient of determination (R2) between the observed EC values and the predicted spatial distribution of vulnerable areas generated by the hierarchical fuzzy inference system (FIS) model, as well as the correlation between NO3 concentrations and the corresponding vulnerability predictions. This correlation analysis is performed to verify the fuzzy-enhanced DRASTIC model’s effectiveness in capturing the nuances of groundwater vulnerability in southeast Hungary.
EC serves as a key hydro-chemical parameter reflecting groundwater contamination potential, providing an additional validation metric to complement nitrate analysis. Given its generally low natural presence in groundwater, elevated levels of nitrate often signify contamination from agricultural fertilizers or wastewater, making it a reliable indicator of anthropogenic influence [14]. By integrating both EC and NO3 as contamination indicators, this study strengthens the reliability of model validation, ensuring a more robust assessment of groundwater vulnerability in southeast Hungary.

3. Results

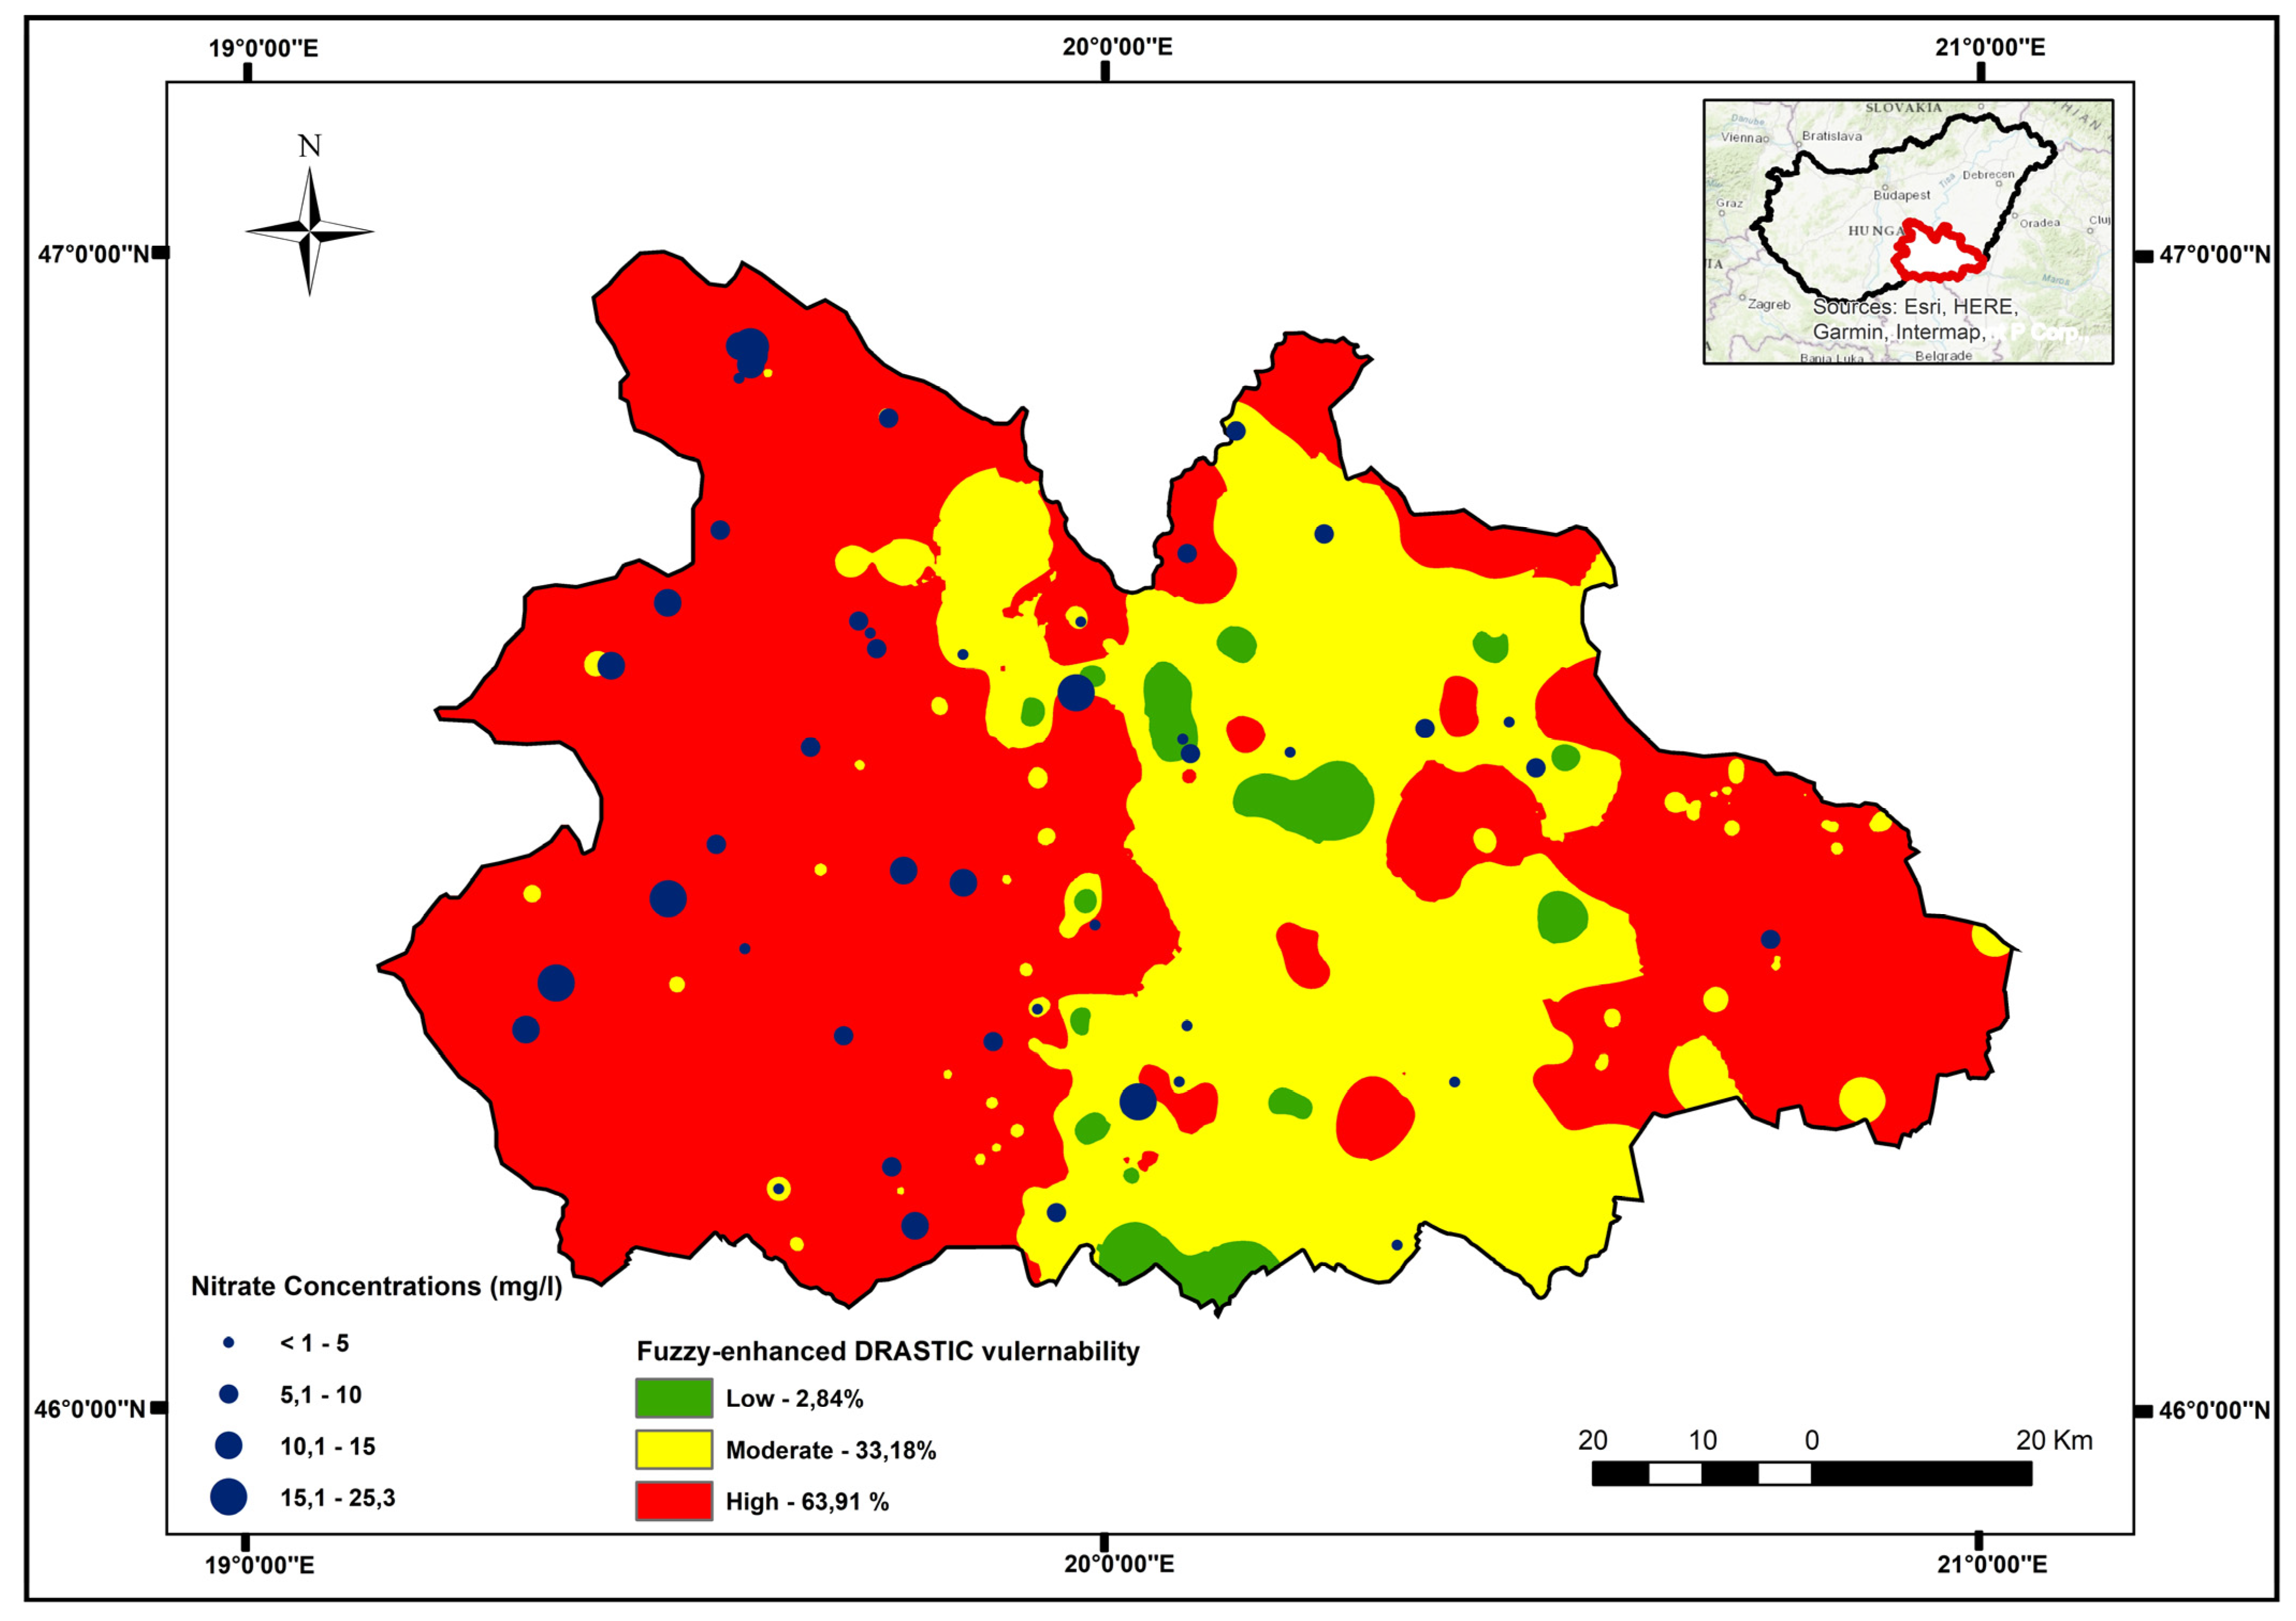
3.1. Fuzzy-Enhanced DRASTIC Model

The use of the hierarchical FIS in this study, incorporating the seven DRASTIC parameters, significantly refines the assessment of groundwater vulnerability by mitigating the imprecision and subjectivity inherent in traditional vulnerability mapping approaches. The final output of this system, FIS6, is defuzzified and transformed into a fuzzy groundwater vulnerability index (FGWVI), which is subsequently mapped and classified across the study area. This classification delineates the region into three vulnerability categories—low, moderate, and high—through quantile classification, effectively differentiating zones based on their susceptibility to contamination. The model outputs indicate that the FGWVI range from 0.25 to 0.75. This range is reclassified into three classes using the Jenks natural break method. The three classes and their corresponding ranges are low (0.25–0.45), moderate (0.45–0.55), and high (0.55–0.75). A higher vulnerability index indicates a greater potential for surface contaminants to reach the water table, highlighting areas at risk, whereas a lower index suggests regions where groundwater is comparatively protected from surface contamination.
The resulting vulnerability map, as depicted in Figure 7, indicates that approximately 5561 km2 or 64% of the study area has high vulnerability, indicating a substantial potential for surface contaminants to penetrate the water table. These high-vulnerability zones are predominantly in the western region of the study area, where water tables range from 1.1 to 4.6 mbgl. These zones also feature high recharge rates and consist mainly of unconsolidated sediments, enhancing their contamination risk. Additionally, patches in the southeast part of the study area display high vulnerability due to the presence of sand and sandy loam soils, which exacerbate the contamination risk, marking these zones as critical points for groundwater protection efforts.
In contrast, regions along and to the east of the Tisza River are identified with moderate vulnerability, covering about 2883 km2 or 33.2% of the area. These zones are characterized by clay/clayey loam and silty clay soils, which possess low permeability and substantially reduce infiltration rates. The relatively low recharge rate in these areas diminishes the likelihood of contaminant infiltration, resulting in the moderate vulnerability classification. Only a small fraction (2.8%) of the area exhibits low vulnerability, suggesting robust natural barriers against contamination.
This detailed, nuanced mapping of groundwater vulnerability facilitated by the advanced fuzzy-enhanced DRASTIC method underscores the heterogeneity of the region’s hydrogeological characteristics. The findings provide a crucial foundation for targeted groundwater management and contamination prevention strategies in southeast Hungary, aimed at safeguarding water quality and ensuring sustainable water resource management.

3.2. Validation of the Model

The hierarchical FIS model’s groundwater vulnerability map is validated by correlating the FGWVI outputs with nitrate (NO3) concentrations and electrical conductivity (EC) measurements from 46 agricultural wells across the study area. Both NO3 and EC were selected as key indicators for validation, as nitrate serves as a direct marker of anthropogenic contamination, while EC reflects the overall dissolved ionic content, which can indicate pollution from agricultural and industrial sources. The EC and nitrate levels obtained from a few sampling points and the well database of the Lower Tisza Region Water Directorate of Szeged, Hungary. The nitrate concentrations in these samples range from less than 1 mg/L to 25.3 mg/L, while the EC values range between 649 µS/cm to 7400 µS/cm.
The correlation analysis results, depicted in Figure 8, yield an R2 value of 0.4785 for NO3 concentrations, indicating a moderately strong positive correlation. This underscores the model’s capability to predict high-contamination-risk areas reasonably based on their vulnerability scores. This correlation, although lower than the ideal range for high validation confidence (0.85–0.95) [57], still demonstrates a significant association. Similarly, the correlation between FGWVI and EC measurements produced an R2 value of 0.528, demonstrating an even stronger relationship than nitrate alone. This result highlights the relevance of EC as a secondary validation parameter, as it encapsulates the cumulative effects of dissolved solids and potential contamination sources.
Thus, the model can reasonably predict regions at greater risk of contamination based on their vulnerability scores. The graph also demonstrates a gradual escalation in vulnerability index (FGWVI scores) corresponding with increasing NO3 and EC values, further affirming the model’s effectiveness in pinpointing potential contamination hotspots. Although the correlation is lower than optimal, it indicates a significant relationship, suggesting the model’s utility in regional groundwater vulnerability assessment. This process not only validates the effectiveness of the hierarchical FIS model but also identifies opportunities for further refinement to enhance its predictive precision

4. Discussion

This research presents a pioneering effort in advancing groundwater vulnerability assessment in southeast Hungary through the integration of FL with the traditional DRASTIC model. The adoption of a hierarchical fuzzy inference system (FIS) to manage uncertainties in the hydrogeological parameters has led to a more refined and accurate representation of groundwater vulnerability. The complexity of groundwater systems, influenced by various interacting factors such as geological conditions, and aquifer properties, poses challenges for traditional models. The standard DRASTIC method often fails to fully capture this environmental variability due to their reliance on static parameter ratings, which overlook the non-linear interactions and real-world complexities of these systems [47]. In contrast, the hierarchical FIS allows for dynamic adjustment of parameter ratings, reducing subjectivity and improving the interpretability of the results.
The resulting vulnerability map, derived from the hierarchical FIS effectively delineates the study region into zones with high, moderate, and low susceptibility to contamination. It is important to emphasize that vulnerability classifications are relative and lack specific units of measurement. Therefore, areas categorized as having low vulnerability are not entirely free from the risk of groundwater contamination; rather, they are comparatively less susceptible to such threats than areas designated as highly vulnerable. The fuzzy-enhanced DRASTIC model indicates that 63.9% of the study area is classified as highly vulnerable to groundwater contamination, particularly in areas with shallow water tables, sandy soils, and high recharge rates—primarily in the western part of the study area. This is a significant increase compared to the 33% high-vulnerability classification obtained by [56] using the traditional DRASTIC method in the same region revealed. This disparity underscores the enhanced sensitivity of the FL approach to environmental variability and the potential inaccuracies in traditional models that rely on static parameter inputs.
One of the key strengths of the hierarchical FIS is its ability to handle the imprecision inherent in environmental data. The traditional DRASTIC method assigns fixed ratings to parameters, which may not reflect real-world variations. By contrast, the fuzzy-enhanced DRASTIC model applies fuzzy membership functions to each parameter, allowing for gradual transitions between vulnerability classes. This flexibility has improved the model’s accuracy, particularly in distinguishing between moderate and high vulnerability zones, thereby providing a more nuanced classification of groundwater susceptibility.
The validation of the fuzzy-enhanced DRASTIC model was conducted using nitrate (NO3) concentrations and electrical conductivity (EC) measurements obtained from 46 monitoring wells. The correlation analysis revealed a moderately strong positive relationship between the fuzzy groundwater vulnerability index (FGWVI) and observed nitrate concentrations, with a coefficient of determination (R2 = 0.4785). A stronger correlation was observed between FGWVI and EC, yielding an R2 value of 0.528. Although these R2 values are below the ideal range (0.85–0.95) for high validation confidence, they mark a clear improvement over the application of the traditional DRASTIC model within the same study region conducted by [56], which yielded R2 = 0.36, when nitrate concentration was used as a pollution indicator. These moderately strong correlations further confirm the fuzzy-enhanced model’s suitability for regional groundwater vulnerability assessments and underscore the importance of integrating additional high-resolution datasets, such as land use and climatic variables, for future refinements.
The adaptability of the hierarchical FIS lies in its ability to integrate site-specific hydrogeological characteristics and handle the inherent variability across diverse regions [27]. Unlike the traditional DRASTIC model, which relies on fixed parameter ratings, the hierarchical FIS model allows for dynamic adjustments based on localized data and expert knowledge, making it suitable for diverse hydrogeological contexts. By leveraging fuzzy membership functions, the hierarchical FIS can accommodate non-linear relationships between parameters, enabling a nuanced representation of groundwater vulnerability even in complex or data-scarce regions [28,58]. This adaptability enables its application to regions with varying hydrogeological characteristics. Such flexibility underscores the potential of the hierarchical FIS framework to be generalized and applied to other regions, facilitating robust groundwater vulnerability assessments that are tailored to the unique environmental and hydrogeological contexts of different areas [59].
However, while the hierarchical FIS enhances the traditional DRASTIC model, certain limitations must be acknowledged. The implementation of fuzzy logic requires expert knowledge and subjective judgment in defining fuzzy membership functions and rule bases, which can introduce potential biases. Additionally, the model’s accuracy is highly dependent on the quality and availability of input data. In regions with limited hydrogeological datasets or the absence of high-resolution land use/land cover (LULC) information, the reliability of the vulnerability map may be compromised, as critical factors influencing groundwater contamination are not fully captured [60]. The spatial resolution of validation data is another constraint in this study. Although nitrate (NO3) and electrical conductivity (EC) measurements from 46 monitoring wells provided a reasonable basis for model validation, this sampling density may not fully capture the spatial variability in contamination levels, particularly in a heterogeneous aquifer system. Moreover, the computational complexity of hierarchical FIS models can pose challenges for real-time applications and require significant computational resources compared to simpler index-based models. Addressing these limitations will be essential for further improving the model’s robustness and expanding its applicability.
The findings of this study emphasize the importance of adopting advanced models that incorporate fuzzy logic to manage data uncertainty. This approach is particularly critical in regions with complex hydrogeological settings and limited high-resolution data. The moderately strong correlations observed between the FGWVI and both nitrate concentrations and EC further validate the applicability of the model for practical groundwater management, offering policymakers a reliable tool for identifying high-risk areas and guiding protection efforts.

5. Conclusions

This study is elaborated to assess the integration of FL with the GIS-based DRASTIC method to evaluate shallow-groundwater vulnerability in southeast Hungary. The research involved selecting, processing, and structuring key DRASTIC parameters into a hierarchical fuzzy inference system (FIS), providing a more refined and flexible approach to groundwater vulnerability mapping. The fuzzy-enhanced DRASTIC model addresses the limitations of traditional method, particularly the rigid assignment of static parameter ratings, by incorporating fuzzy membership functions that allow for dynamic parameter adjustments based on localized conditions and expert knowledge.
The resulting vulnerability map delineates that 63.9% of the study area is highly prone to groundwater contamination, predominantly in regions with shallow water tables, sandy soils, and high recharge rates. These critical areas, mainly concentrated in the western and southeastern parts of the study area, face increased risks from anthropogenic activities, particularly agricultural practices. The correlation analysis showed a moderately strong positive relationship between the fuzzy groundwater vulnerability index (FGWVI) and both nitrate concentrations (R2 = 0.4785) and electrical conductivity (R2 = 0.528), confirming the model’s reliability for identifying high-risk contamination zones. These findings underscore the potential of the fuzzy-enhanced DRASTIC model as a valuable tool for groundwater vulnerability assessments in regions with complex or data-scarce hydrogeological conditions.
Despite this fact, certain limitations remained. The hierarchical FIS framework requires expert knowledge for the definition of fuzzy rules and membership functions, which may introduce subjectivity. The computational complexity of the fuzzy-enhanced DRASTIC model may also pose challenges for real-time applications in large-scale assessments. Moreover, this study highlights the importance of incorporating land use and anthropogenic factors in future vulnerability assessments, particularly in regions like southeast Hungary, where agricultural activities play a significant role in groundwater contamination.
The classification of 97% of the study area as having moderate to high vulnerability calls for immediate action from policymakers to implement targeted groundwater management strategies. Such efforts should include implementing region-level qualitative and quantitative groundwater monitoring programs, particularly in high-vulnerability zones, which will enhance the planning, development, and protection of groundwater resources. This can be achieved through real-time monitoring systems that collect and store multi-sensor data on environmental parameters such as temperature, pH, dissolved oxygen (DO), and electrical conductivity (EC), enabling better control of pollution sources and mitigating the risks of overexploitation or aquifer degradation. The integration of a vulnerability assessment with such monitoring programs would support proactive decision-making and resource management. Moreover, promoting sustainable agricultural practices, such as precision fertilization and controlled irrigation, should also be encouraged to reduce nitrate leaching into groundwater, minimizing contamination risks and preserving water quality.
This paper highlights the need for ongoing model enhancement and validation to ensure accurate and reliable groundwater vulnerability assessments. Future research should focus on integrating high-resolution land use/cover (LULC) data and climatic variables to capture the full spectrum of influences on groundwater vulnerability. The application of advanced machine learning techniques will further enhance the model’s predictive power and adaptability. Longitudinal studies on groundwater vulnerability would help capture temporal variations and provide a more comprehensive understanding of how climate change and land-use practices influence aquifer susceptibility. Furthermore, expanding this approach to other regions with distinct hydrogeological settings will allow for broader generalization, comparative analyses, and improved model robustness. Such efforts will be essential for refining groundwater management practices to respond effectively to evolving environmental challenges, thereby ensuring the sustainability and protection of water resources amid growing ecological pressures.

Author Contributions

A.F. (Abdelouahed Fannakh): Conceptualization, investigation, data analysis, methodology development, creation and development of vulnerability maps using the Fuzzy-enhanced DRASTIC model in ArcGIS 10.8, and writing the original draft. M.F.: Development and application of the fuzzy logic system using MATLAB R 2019. B.K.: Supervision, critical review, manuscript editing, and proofreading. A.F. (Andrea Farsang). All authors have read and agreed to the published version of the manuscript.

Funding

This research did not receive any specific grant from funding agencies in the public, commercial, or not-for-profit sectors.

Data Availability Statement

The data supporting the findings of this study are available from the corresponding author upon reasonable request.

Acknowledgments

The authors acknowledge Lower Tisza Region Water Directorate of Szeged, Hungary, Department of Geoinformatics, Physical and Environmental Geography, University of Szeged, Hungary, for various levels of support when conducting this study.

Conflicts of Interest

The authors declare that this manuscript has not been published elsewhere and is not under consideration by another journal. All authors have approved the manuscript and agree with its submission to the MDPI journal Water. The authors declare that they have no known competing financial interests or personal relationships that could have appeared to influence the work reported in this paper.

Abbreviations

The following abbreviations are used in this manuscript:
DEMDigital Elevation Model
FGWVIFuzzy Groundwater Vulnerability Index
FISFuzzy Inference System
FLFuzzy Logic
GHPGreat Hungarian Plain
GISGeographic Information System
MFMembership Function
VHVery High
HHigh
MModerate
LLow
VLVery Low

References

  1. Denizman, C. Land use changes and groundwater quality in Florida. Appl. Water Sci. 2018, 8, 134. [Google Scholar] [CrossRef]
  2. Sukmawati Rukmana, B.T.; Bargawa, W.S.; Cahyadi, T.A. Assessment of Groundwater Vulnerability Using GOD Method. IOP Conf. Ser. Earth Environ. Sci. 2020, 477, 012020. [Google Scholar] [CrossRef]
  3. Li, P.; Karunanidhi, D.; Subramani, T.; Srinivasamoorthy, K. Sources and Consequences of Groundwater Contamination. Arch. Environ. Contam. Toxicol. 2021, 80, 1–10. [Google Scholar] [CrossRef] [PubMed]
  4. Ghouili, N.; Jarraya-Horriche, F.; Hamzaoui-Azaza, F.; Zaghrarni, M.F.; Ribeiro, L.; Zammouri, M. Groundwater vulnerability mapping using the Susceptibility Index (SI) method: Case study of Takelsa aquifer, Northeastern Tunisia. J. Afr. Earth Sci. 2021, 173, 104035. [Google Scholar] [CrossRef]
  5. Raisa, S.S.; Sarkar, S.K.; Sadiq, M.A. Advancing groundwater vulnerability assessment in Bangladesh: A comprehensive machine learning approach. Groundw. Sustain. Dev. 2024, 25, 101128. [Google Scholar] [CrossRef]
  6. Bordbar, M.; Rezaie, F.; Bateni, S.M.; Jun, C.; Kim, D.; Busico, G.; Moghaddam, H.K.; Paryani, S.; Panahi, M.; Valipour, M. Global Review of Modification, Optimization, and Improvement Models for Aquifer Vulnerability Assessment in the Era of Climate Change. Curr. Clim. Chang. Rep. 2023, 9, 45–67. [Google Scholar] [CrossRef]
  7. Jain, H. Groundwater vulnerability and risk mitigation: A comprehensive review of the techniques and applications. Groundw. Sustain. Dev. 2023, 22, 100968. [Google Scholar] [CrossRef]
  8. Zhang, Q.; Shan, Q.; Chen, F.; Liu, J.; Yuan, Y. Groundwater Vulnerability Assessment and Protection Strategy in the Coastal Area of China: A GIS-Based DRASTIC Model Approach. Appl. Sci. 2023, 13, 10781. [Google Scholar] [CrossRef]
  9. Goyal, D.; Haritash, A.K.; Singh, S.K. A comprehensive review of groundwater vulnerability assessment using index-based, modelling and coupling methods. J. Environ. Manag. 2021, 296, 113161. [Google Scholar] [CrossRef]
  10. Barbulescu, A. Assessing groundwater vulnerability: DRASTIC and DRASTIC-like methods: A review. Water 2020, 12, 1356. [Google Scholar] [CrossRef]
  11. Rama, F.; Busico, G.; Arumi, J.L.; Kazakis, N.; Colombani, N.; Marfella, L.; Hirata, R.; Kruse, E.E.; Sweeney, P.; Mastrocicco, M. Assessment of intrinsic aquifer vulnerability at continental scale through a critical application of the drastic framework: The case of South America. Sci. Total Environ. 2022, 823, 153748. [Google Scholar] [CrossRef] [PubMed]
  12. Nguyen, A.H.; Tat, V.M.H. Groundwater pollution vulnerability assessment using a modified DRASTIC model in Ho Chi Minh City, Vietnam. Irrig. Drain. 2024, 73, 1453–1469. [Google Scholar] [CrossRef]
  13. Baki, A.M.; Ghavami, S.M. A modified DRASTIC model for groundwater vulnerability assessment using connecting path and analytic hierarchy process methods. Environ. Sci. Pollut. Res. 2023, 30, 111270–111283. [Google Scholar] [CrossRef] [PubMed]
  14. Kirlas, M.C.; Karpouzos, D.K.; Georgiou, P.E.; Katsifarakis, K.L. A comparative study of groundwater vulnerability methods in a porous aquifer in Greece. Appl. Water Sci. 2022, 12, 16. [Google Scholar] [CrossRef]
  15. Noori, R.; Ghahremanzadeh, H.; Kløve, B.; Adamowski, J.F.; Baghvand, A. Modified-DRASTIC, modified-SINTACS and SI methods for groundwater vulnerability assessment in the southern Tehran aquifer. J. Environ. Sci. Health Part A Tox. Hazard. Subst. Environ. Eng. 2019, 54, 89–100. [Google Scholar] [CrossRef]
  16. Jenifer, M.A.; Jha, M.K. Comparative evaluation of GIS-based models for mapping aquifer vulnerability in hard-rock terrains. Environ. Earth Sci. 2018, 77, 7821. [Google Scholar] [CrossRef]
  17. Neshat, A.; Pradhan, B.; Pirasteh, S.; Shafri, H.Z.M. Estimating groundwater vulnerability to pollution using a modified DRASTIC model in the Kerman agricultural area, Iran. Environ. Earth Sci. 2014, 71, 3119–3131. [Google Scholar] [CrossRef]
  18. Sener, E.; Davraz, A. Assessment of groundwater vulnerability based on a modified DRASTIC model, GIS and an analytic hierarchy process (AHP) method: The case of Egirdir Lake basin (Isparta, Turkey). Hydrogeol. J. 2013, 21, 701–714. [Google Scholar] [CrossRef]
  19. Javadi, S.; Kavehkar, N.; Mousavizadeh, M.H.; Mohammadi, K. Modification of DRASTIC model to map groundwater vulnerability to pollution using nitrate measurements in agricultural areas. J. Agric. Sci. Technol. 2011, 13, 239–249. [Google Scholar]
  20. Taghavi, N.; Niven, R.K.; Kramer, M.; Paull, D.J. Comparison of DRASTIC and DRASTICL groundwater vulnerability assessments of the Burdekin Basin, Queensland, Australia. Sci. Total Environ. 2023, 858, 159945. [Google Scholar] [CrossRef]
  21. Mfonka, E.H.; Ngoupayou, Z.N.; Ndjigui, P.D.; Kpoumie, A.; Zammouri, M.; Ngouh, A.N.; Mouncherou, O.F.; Rakotondrabe, F.; Rasolomanana, F. A GIS-based DRASTIC and GOD models for assessing alterites aquifer of three experimental watersheds in Foumban (Western-Cameroon). Groundw. Sustain. Dev. 2018, 7, 250–264. [Google Scholar] [CrossRef]
  22. Das, B.; Pal, S.C. Assessment of groundwater vulnerability to over-exploitation using MCDA, AHP, fuzzy logic and novel ensemble models: A case study of Goghat-I and II blocks of West Bengal, India. Environ. Earth Sci. 2020, 79, 8843. [Google Scholar] [CrossRef]
  23. Dixon, B. Applicability of neuro-fuzzy techniques in predicting ground-water vulnerability: A GIS-based sensitivity analysis. J. Hydrol. 2005, 309, 17–38. [Google Scholar] [CrossRef]
  24. Duhalde, D.J.; Arumí, J.L.; Oyarzún, R.A.; Rivera, D.A. Fuzzy-based assessment of groundwater intrinsic vulnerability of a volcanic aquifer in the Chilean Andean Valley. Environ. Monit. Assess. 2018, 190, 6758. [Google Scholar] [CrossRef]
  25. Jafari, S.M.; Nikoo, M.R. Developing a fuzzy optimization model for groundwater risk assessment based on improved DRASTIC method. Environ. Earth Sci. 2019, 78, 8090. [Google Scholar] [CrossRef]
  26. Nobre, R.C.M.; Rotunno Filho, O.C.; Mansur, W.J.; Nobre, M.M.M.; Cosenza, C.A.N. Groundwater vulnerability and risk mapping using GIS, modeling and a fuzzy logic tool. J. Contam. Hydrol. 2007, 94, 277–292. [Google Scholar] [CrossRef]
  27. Saranya, T.; Saravanan, S. A comparative analysis on groundwater vulnerability models—Fuzzy DRASTIC and fuzzy DRASTIC-L. Environ. Sci. Pollut. Res. 2022, 29, 86005–86019. [Google Scholar] [CrossRef]
  28. Nourani, V.; Maleki, S.; Najafi, H.; Baghanam, A.H. A fuzzy logic-based approach for groundwater vulnerability assessment. Environ. Sci. Pollut. Res. 2023, 31, 18010–18029, in press. [Google Scholar] [CrossRef]
  29. Iqbal, J.; Pathak, G.; Gorai, A.K. Development of hierarchical fuzzy model for groundwater vulnerability to pollution assessment. Arab. J. Geosci. 2015, 8, 2713–2728. [Google Scholar] [CrossRef]
  30. Saranya, T.; Saravanan, S. Evolution of a hybrid approach for groundwater vulnerability assessment using hierarchical fuzzy-DRASTIC models in the Cuddalore Region, India. Environ. Earth Sci. 2021, 80, 9479. [Google Scholar] [CrossRef]
  31. Dhanya, C.T.; Kumar, D.N. Data Mining for Evolving Fuzzy Association Rules for Predicting Monsoon Rainfall of India. J. Intell. Syst. 2009, 18, 193. [Google Scholar] [CrossRef]
  32. Khan, Q.; Liaqat, M.U.; Mohamed, M.M. A comparative assessment of modeling groundwater vulnerability using DRASTIC method from GIS and a novel classification method using machine learning classifiers. Geocarto Int. 2022, 37, 5832–5850. [Google Scholar] [CrossRef]
  33. Pinke, Z.; Decsi, B.; Kozma, Z.; Vári, Á.; Lövei, G.L. A spatially explicit analysis of wheat and maize yield sensitivity to changing groundwater levels in Hungary, 1961–2010. Sci. Total Environ. 2020, 715, 136555. [Google Scholar] [CrossRef] [PubMed]
  34. Gribovszki, Z.; Kalicz, P.; Balog, K.; Szabó, A.; Tóth, T.; Csáfordi, P.; Metwaly, M.; Szalai, S. Groundwater uptake of different surface cover and its consequences in great Hungarian plain. Ecol. Process. 2017, 6, 106. [Google Scholar] [CrossRef]
  35. Barreto, S.; Bártfai, B.; Engloner, A.; Liptay, Á.Z.; Madarász, T.; Vargha, M. Water in Hungary; Status overview for the National Water Programme of the Hungarian Academy of Sciences: Budapest, Hungary, 2017. [Google Scholar]
  36. Mezősi, G. The Physical Geography of Hungary; Springer: Cham, Switzerland, 2017. [Google Scholar] [CrossRef]
  37. ICPDR—International Commission for the Protection of the Danube River. Journey to a Balanced Tisza Basin. An Introduction to the Integrated Tisza River Basin Management Plan. 2011. Available online: https://www.icpdr.org/sites/default/files/Tisa_04082011.pdf (accessed on 23 October 2024).
  38. National Water Directorate General of Hungary—OFV. MÁSODIK FELÜLVIZSGÁLATA MAGYARORSZÁG VÍZGYŰJTŐ—GAZDÁLKODÁSI TERVE—2021 TERVEZET, Budapest, Hungary. 2021. Available online: https://vizeink.hu/wp-content/uploads/2021/05/VGT3_II_Vitaanyag.pdf (accessed on 23 October 2024).
  39. Szöllősi-Nagy, A. On climate change, hydrological extremes and water security in a globalized world. Sci. Secur. 2022, 2, 504–509. [Google Scholar] [CrossRef]
  40. Rossi, L.; Wens, M.; De Moel, H.; Cotti, D.; Siemons, A.-S.S.; Hagenlocher, M.; Van Loon, A.; Maetens, W.; Masante, D.; Toreti, A.; et al. European Drought Risk Atlas; Publications Office of the European Union: Luxembourg, 2023. [Google Scholar] [CrossRef]
  41. Demiroǧlu, M.; Dowd, J. The utility of vulnerability maps and GIS in groundwater management: A case study. Turkish J. Earth Sci. 2014, 23, 80–90. [Google Scholar] [CrossRef]
  42. Aller, L.; Bennett, T.; Lehr, J.H.; Petty, R.J.; Hackett, G. DRASTIC: A Standardized Method for Evaluating Ground Water Pollution Potential Using Hydrogeologic Settings; NWWA/EPA-600/2-87-035; US Environmental Protection Agency: Washington, DC, USA, 1987. [Google Scholar]
  43. Tahmassebipoor, N.; Rahmati, O.; Noormohamadi, F.; Lee, S. Spatial analysis of groundwater potential using weights-of-evidence and evidential belief function models and remote sensing. Arab. J. Geosci. 2016, 9, 79. [Google Scholar] [CrossRef]
  44. Gesim, N.A.; Okazaki, T. Assessment of groundwater vulnerability to pollution using DRASTIC model and fuzzy logic in Herat City, Afghanistan. Int. J. Adv. Comput. Sci. Appl. 2018, 9, 181–188. [Google Scholar] [CrossRef]
  45. Rezaei, F.; Safavi, H.R.; Ahmadi, A. Groundwater vulnerability assessment using fuzzy logic: A case study in the Zayandehrood aquifers, Iran. Environ. Manag. 2013, 51, 267–277. [Google Scholar] [CrossRef]
  46. Selvaraj, A.; Saravanan, S.; Jennifer, J.J. Mamdani fuzzy-based decision support system for prediction of groundwater quality: An application of soft computing in water resources. Environ. Sci. Pollut. Res. 2020, 27, 25535–25552. [Google Scholar] [CrossRef]
  47. Fannakh, A.; Farsang, A. DRASTIC, GOD, and SI approaches for assessing groundwater vulnerability to pollution: A review. Environ. Sci. Eur. 2022, 34, 77. [Google Scholar] [CrossRef]
  48. Piscopo, G. Groundwater Vulnerability Map Explanatory Notes: Castlereagh Catchment; Tech. Rep.; NSW Department of Land and Water Conservation: Parramatta, NSW, Australia, 2001; pp. 1–35. [Google Scholar]
  49. Farsang, A.; Károly, B.; Boudewijn, V.L. Az Öntözés Talajtani Feltételei, Lehetőségei és Körülményei az Ativizig Működési Területén—Soil Conditions, Possibilities and Circumstances of Irrigation in Ativizig’s Operating Area; Technical Report; K&K Mérnöki Iroda Kft.: Csongrád, Hungary, 2017. [Google Scholar]
  50. Oroji, B. Groundwater vulnerability assessment with using GIS in Hamadan–Bahar plain, Iran. Appl. Water Sci. 2019, 9, 1082. [Google Scholar] [CrossRef]
  51. Tomer, T.; Katyal, D.; Joshi, V. Sensitivity analysis of groundwater vulnerability using DRASTIC method: A case study of National Capital Territory, Delhi, India. Groundw. Sustain. Dev. 2019, 9, 100271. [Google Scholar] [CrossRef]
  52. Dizaji, A.R.; Hosseini, S.A.; Rezaverdinejad, V.; Sharafati, A. Groundwater contamination vulnerability assessment using DRASTIC method, GSA, and uncertainty analysis. Arab. J. Geosci. 2020, 13, 5650. [Google Scholar] [CrossRef]
  53. Jesiya, N.P.; Gopinath, G. A Customized Fuzzy-AHP-GIS-based DRASTIC-L model for intrinsic groundwater vulnerability assessment of urban and peri-urban phreatic aquifer clusters. Groundw. Sustain. Dev. 2019, 8, 654–666. [Google Scholar] [CrossRef]
  54. Cashman, P.M.; Preene, M. Groundwater Lowering in Construction: A Practical Guide to Dewatering. Environ. Eng. Geosci. 2021, 20, 406–407. [Google Scholar] [CrossRef]
  55. Hasan, M.; Islam, M.A.; Hasan, M.A.; Alam, M.J.; Peas, M.H. Groundwater vulnerability assessment in Savar Upazila of Dhaka District, Bangladesh—A GIS-based DRASTIC modeling. Groundw. Sustain. Dev. 2019, 9, 100220. [Google Scholar] [CrossRef]
  56. Fannakh, A.; Károly, B.; Farsang, A.; Ben Ali, M. Evaluation of index-overlay methods for assessing shallow groundwater vulnerability in southeast Hungary. Appl. Water Sci. (In press)
  57. Kvålseth, T.O. Cautionary Note about R2. Am. Stat. 1985, 39, 279–285. [Google Scholar] [CrossRef]
  58. Nadiri, A.A.; Sedghi, Z.; Khatibi, R.; Gharekhani, M. Mapping vulnerability of multiple aquifers using multiple models and fuzzy logic to objectively derive model structures. Sci. Total Environ. 2017, 593, 75–90. [Google Scholar] [CrossRef]
  59. Afshar, A.; Mariño, M.A.; Ebtehaj, M.; Moosavi, J. Rule-Based Fuzzy System for Assessing Groundwater Vulnerability. J. Environ. Eng. 2007, 133, 532–540. [Google Scholar] [CrossRef]
  60. Podgorski, J.; Kracht, O.; Araguas-Araguas, L.; Terzer-Wassmuth, S.; Miller, J.; Straub, R.; Kipfer, R.; Berg, M. Groundwater vulnerability to pollution in Africa’s Sahel region. Nat. Sustain. 2024, 7, 558–567. [Google Scholar] [CrossRef]
Figure 1. Flowchart of proposed methodology.
Water 17 00739 g001
Figure 2. Location of study area.
Water 17 00739 g002
Figure 3. Fuzzy logic system.
Water 17 00739 g003
Figure 4. Structure of hierarchical FL model for prediction of groundwater vulnerability to potential pollution.
Water 17 00739 g004
Figure 5. MFs of each parameter: (a) depth to water table, (b) net recharge, (c) aquifer media, (d) soil media, (e) topography, (f) impact of vadose zone, (g) hydraulic conductivity, and (h) groundwater vulnerability index.
Water 17 00739 g005
Figure 6. Spatial distributions of parameters describing groundwater vulnerability to contamination in the study area: (a) depth to the water table (mgbl), (b) recharge rate (Piscopo method), (c) aquifer media, (d) soil media, (e) topography (slope%), (f) impact of vadose zone, and (g) hydraulic conductivity (m/day).
Water 17 00739 g006
Figure 7. Interpolated groundwater vulnerability index from hierarchical FIS model outputs.
Water 17 00739 g007
Figure 8. R2 values of FGWVI against measured EC and nitrate concentrations.
Water 17 00739 g008
Table 1. Parameters and corresponding MFs [42].
DRASTIC ParametersFuzzy Membership Function
LayersAttribute valuesCategory
Depth to groundwater table (mbs *)<1.5Very highMF1
1.5–4.6HighMF2
4.6–9.1ModerateMF3
9.1–15.2LowMF4
>15.2Very Low
Aquifer RechargeSee Table 2See Table 2
Aquifer mediaSand and gravelVery highMF1, MF2
Massive sandstoneHighMF3
Metamorphic/igneousModerateMF4, MF5
Soil mediaSandVery highMF1
Sandy loamHighMF2
Loamy sandModerateMF3
Sandy clay/clay loam/sandy clay loamLowMF4
ClayVery lowMF5
Topography (slope, %)<2%Very highMF1
2–6%HighMF2
Impact of vadose zoneSand and gravelVery highMF1
Sand/sandy siltHighMF2
Sand and silty with clayModerateMF3
Silty ClayLowMF4
ClayVery lowMF5
Hydraulic conductivity (m/day)>81.5Very highMF1
40.8–81.5HighMF2
28.5–40.8ModerateMF3
12.3–28.5LowMF4
4.1–12.3Very lowMF5
Note(s): * mbs: meters below surface.
Table 2. Aquifer recharge ratings according to the Piscopo (2001) method.
Slope (%)Rainfall (mm)Soil Permeability (cm/s)Net Recharge
RangeRatingRangeRatingRangeRatingRangeRating
<24<5001High511–1310
2–103500–7002Mod–high49–118
10–332700–8503Moderate37–95
>331>8504Slow25–73
Very slow13–51
Table 3. Rule bases for six FISs.
FIS1
THEN FIS1 IF Aquifer recharge
AND depth to water table LMH
LVLLM
MLMH
HMMVH
VHMHVH
FIS2
THEN FIS2 IF Aquifer type
AND FIS1 LMHVH
VLVLLMM
LVLLMM
MLMHH
HMMVHVH
VHMHVHVH
FIS3
THEN FIS3 IF Soil media
AND FIS2 VLLMHVH
VLVLVLLMM
LVLVLLMM
MLLMHH
HMMMVHVH
VHMMHVHVH
FIS4
THEN FIS4 IF Topography (slope)
AND FIS3 HVH
VLMM
LMM
MMH
HVHVH
VHVHVH
FIS5
THEN FIS5 IF Impact of vadose zone
AND FIS4 VLLMHVH
VLVLVLLMM
LVLVLLMH
MLLMHH
HMMHVHVH
VHMMHVHVH
FIS6
THEN FIS6 IF Hydraulic conductivity
AND FIS5 VLLM
VLVLVLL
LVLVLL
MLLM
HLMH
VHMMH
Note(s): VL: very low; L: low; M: moderate; H: high; VH: very high.
Disclaimer/Publisher’s Note: The statements, opinions and data contained in all publications are solely those of the individual author(s) and contributor(s) and not of MDPI and/or the editor(s). MDPI and/or the editor(s) disclaim responsibility for any injury to people or property resulting from any ideas, methods, instructions or products referred to in the content.

