1. Introduction
Expansive soil is a type of soil with a high clay content, containing hydrophilic clay minerals such as montmorillonite and kaolinite. A significant interaction exists between expansive soil and pore water, exhibiting characteristics such as water-absorbing expansion and water-losing shrinkage [
1,
2]. Engineering geological issues in expansive land areas are often associated with the interaction of pore water, such as slope instability, foundation uplift, and ground settlement, which result from the migration of water in soil pores [
3]. Both natural deposits and artificial landfills consist of various components, and the solid skeleton of this medium carries a residual charge, exhibiting electrical properties [
4], for example, in saturated clay soils, where the skeleton consists of mineral components with different charges, and the pore water contains various ions with differing valences. As a multi-phase and multi-component porous material, geotechnical media exhibit complex chemical–mechanical coupling effects and engineering mechanical behavior under the influence of a hydrochemical environment. The higher the clay content in the soil, the more pronounced the interaction between soil particles and pore water becomes. In the Ekofisk area of the North Sea, a large submarine oil field was discovered, but seawater recharge did not prevent the seabed surface settlement but accelerated the seabed settlement [
5,
6,
7]. Studies have shown [
6,
8] that the reason for the above treatment failure is that the strong electrochemical interaction between seawater and chalk has not been fully considered, resulting in the weakening of the chalk in the oil reservoir. Many similar engineering examples cause geological disasters due to changes in pore solution concentration or composition [
9,
10,
11,
12,
13]. Therefore, it is particularly important to study the water-holding characteristics of rock and soil media underwater chemistry [
14,
15].
The soil–water characteristic curve (SWCC) usually describes the water-holding properties of soil. SWCC represents the relationship between suction and soil water content/saturation, playing a crucial role in the mechanics of unsaturated soils. The seepage, strength, and deformation of unsaturated soils are closely related to it [
10,
16,
17,
18,
19,
20,
21]. The total suction of unsaturated soil consists of two components: matrix suction and osmotic suction. When the concentration of pore salt solution in the soil is very low, the influence of osmotic suction is often negligible, and the total suction is approximately equal to matrix suction. However, as long as there is a solute in the pore water of the soil, osmotic suction will exist, particularly when the concentration of pore salt solution is high. In this case, the pore salt solution will affect the total suction by influencing osmotic suction [
22,
23]. Xu et al. [
24] indicated that osmotic suction in salt solutions increases the effective stress of soil. Under the same vertical overburden pressure, the higher the concentration of the salt solution, the smaller the void ratio. Pulat et al. [
25] studied the variation in suction in soils in contact with salt solutions (NaCl, CaCl
2, and natural seawater) and distilled water. They found that bentonite samples exhibited the highest values of total suction in the presence of seawater, while kaolin and zeolite samples showed the highest values in the presence of NaCl solution. He et al. [
26] conducted water retention tests on GMZ bentonite with varying salt contents under confined conditions. The results showed that at low suction (less than 38 MPa), the water retention capacity increased with increasing salt content, whereas at high suction (greater than 38 MPa), the effect was negligible.
Currently, there is extensive research on the water-holding characteristics of expansive soil. Niu et al. [
27] investigated the effects of initial dry density, wet–dry cycles, and freeze–thaw cycles on the water characteristics of expansive soils. Puppala et al. [
28] compared the SWCC curves of expansive soil by measuring both indoor and outdoor suction. Liu et al. [
29] studied the influence of dry and wet conditions on the soil–water characteristic curves of expansive soil. The results showed that as the number of wet–dry cycles increased, the saturated water content, air intake value, and residual water content of fractured expansive soil all decreased. Furthermore, the SWCC of expansive soil exhibited a distinct double peak phenomenon after the third dry-wet cycle. Most scholars have considered factors such as initial dry density, initial moisture content, wet–dry cycles, freeze–thaw cycles, and others as influencing the water-holding capacity of expansive soils. However, the effect of salt solution concentration on this capacity has seldom been addressed. It is well known that the concentration of salt solution affects the infiltration suction of soil; therefore, the effect of salt solution concentration on the water-holding capacity of expansive soils is significant.
Most of the aforementioned research on expansive soils is limited to the macroscopic level, and studies investigating the effects of chemical action on the microstructure of expansive soils are relatively scarce. This paper investigates Ningming expansive soil as the research subject and conducts experimental studies on the effects of varying concentrations of NaCl solution on the water-holding characteristics of expansive soil. The soil–water characteristic curve of expansive soil over the full suction range was obtained using the pressure plate method to explore and compare the influence of soil water-holding characteristics and air entry values under different pore solution concentrations. The pore structure and pore size distribution characteristics of expansive soils under varying pore solution concentrations were examined using mercury intrusion porosimetry. The microstructure of expansive soil under chemical action was examined using scanning electron microscopy. Additionally, the Brooks–Corey (BC) model and van Genuchten (VG) model were employed to fit the measured data, and the soil air entry values were derived from both the fitted curves and the measured method. The differences between the soil air entry values derived from the two methods, as well as the influence of these values under varying pore solution concentrations, were discussed and compared. This research provides an important theoretical foundation for addressing related engineering problems.
2. Test Materials and Methods
2.1. Test Material
The expansive soil used in this test was collected from the southeast suburb of Ningming County, Guangxi Zhuang Autonomous Region, at a depth of 2.0–2.4 m (to minimize the presence of impurities). The soil samples were light gray, wet, and plastic, exhibiting undeveloped cracks and strong viscosity. The particle size distribution is shown in
Figure 1 (soil particle grading curve). As shown in
Figure 1, the content of clay particles (<0.002 mm) in expansive soil is relatively high, accounting for 58% of the total. The physical property indices are shown in
Table 1, and
Table 2 illustrates the ionic content of Ningming expansive soil. The liquid limit is 56.96%, the free expansion rate is 63.5%, classifying it as medium expansive soil, and the main exchange cations are calcium and magnesium ions. The clay minerals in Ningming’s expansive soil were analyzed using X-ray diffraction. The illite–montmorillonite mixed layer constituted 73%, illite 8%, kaolinite 15%, and chlorite 4%.
Initially, 2 kg of air-dried expansive soil was sieved through a 2 mm mesh and immersed in 2 L of distilled water (approximately 1.5 times the liquid limit). The mixture was stirred thoroughly, soaked for 24 h, and then restirred before being transferred to a remodeling saturation device (16 cm diameter × 18 cm height). Permeable stones were placed on both the upper and lower surfaces, and a graded overlying pressure of 20 kPa was applied for static consolidation over 4 days. During consolidation, a constant-flow pump was used to maintain saturation. After settlement stabilization, the soil sample was extracted, trimmed using a sharp-edged ring knife (61.8 mm diameter × 20 mm height), and then analyzed for water content. Dry density and void ratio parameters were calculated to ensure an initial dry density of approximately 1.25 g/cm3. The trimmed ring knife specimen was placed into a custom-designed leaching cell. A solution was introduced through the cell’s central inlet and allowed to permeate the sample for a period of 7–10 days. Beginning on the sixth day, the effluent conductivity was measured daily until it reached the target concentration solution. The specimen was removed, and excess moisture was wiped off the ring knife. A vernier caliper was used to measure the height of the specimen. Since the specimen adhered tightly to the ring knife, its diameter was assumed to be equivalent to the inner diameter of the ring knife for volume calculation. Final parameters, including volumetric water content and saturation, were calculated from these measurements.
2.2. Soil–Water Characteristic Tests Under Different NaCl Concentrations
The pressure plate test used the pressure film meter produced by the American Soilmoisture Company (Goleta, CA, USA). The instrument and device are shown in
Figure 2; the air entry value of the clay plate is 1500 kPa.
The soil–water characteristic curve of Ningming’s expansive soil under hydro-chemical conditions was obtained using the pressure plate method. The concentrations of NaCl were set to 0, 0.01, 0.1, and 0.5 mol/L. The air entry value of the clay plate was 1500 kPa. The suction path was 10 → 20 → 30 → 50 → 80 → 120 → 200 → 300 → 490 → 930 kPa, with the requirement that the clay plate must be in a saturated state and free of bubbles beneath it. During the test, the ambient temperature was controlled at 20 °C ± 1 °C, and the suction equilibrium for each stage required approximately 7–10 days. After the pressure equilibrium at each stage, the sample was weighed using an analytical balance with an accuracy of 0.01 g. Since expansive soil shrinks during dehumidification, it is necessary to measure its diameter and height using vernier calipers after each stage of suction equilibrium and then convert these measurements to volume. After the final stage of suction is applied, the soil sample is dried, weighed, and the results are compared.
2.3. Mercury Intrusion Porosimetry
The mercury injection test is based on the capillary phenomenon, assuming that the pores in the soil are cylindrical, and the pore size distribution in the soil is based on the fact that non-infiltrating liquid will not flow into the solid pores in the absence of pressure, according to Washburn formula [
30], that is
where
p(
d) for external pressure (Pa);
Ts is the surface tension of mercury (0.48 N/m);
d is the diameter of the pore cylinder of the soil sample (m);
θ is the contact angle between mercury and the solid material (take 140°). The mercury injection instrument uses different levels of pressure to press mercury into the pores of the soil mass and obtains the mercury intake under each level of pressure after equilibrium. The pore distribution results can be obtained by calculating the radius according to Formula (1).
The mercury injection porosimeter (Micromeritics AutoPore IV, Norcross, GA, USA) used in this study, is used to measure and analyze the pore size, total pore volume, area, density, and other properties of bulk or powder objects, as shown in
Figure 3. The pressure range is divided into high- and low-pressure ranges, with the low-pressure range from 4 to 207 kPa. The high-pressure range is 207~413,700 kPa, and the aperture range that can be measured is 5 nm–360,000 nm.
The concentrations of NaCl used in this test were 0, 0.05, 0.1, and 0.5 mol/L, respectively. The prepared sample was cut into 10 × 10 × 10 mm soil cubes using a fret saw. It was then carefully placed into a plexiglass tube using tweezers, which was subsequently placed into the liquid nitrogen tank. The water in the pores is rapidly cooled to −196 °C, transforming into amorphous ice (cooling time is approximately 15 min), and then the soil sample is quickly placed into a freeze-dryer, where it is pumped at a temperature of −50 °C and a pressure below 20 Pa (almost vacuum) for 48 h, allowing the amorphous ice to sublimate and leaving the soil sample dry and undisturbed. The original pores of the soil sample are well preserved.
2.4. Scanning Electron Microscope Test
When the sample is scanned by the electron beam in a scanning electron microscope, different types of imaging signals are generated, including X-rays, backscattered electrons, and secondary electrons. The scanning electron microscope primarily uses secondary electron imaging signals to observe the surface morphology of the sample. The detector receives the surface image of the sample, amplified by secondary electrons, and sends it to the picture tube via video amplification. The brightness of the picture tube is adjusted to obtain the surface topography of the amplified sample, and the representative image is selected according to the specific requirements.
To study the influence of changes in hydrochemical conditions on the size, shape, and arrangement of expanded soil particles, aggregates, and micro-pores in Ningming, combined with the analysis of mercury injection test results, scanning electron microscopy was selected for microstructure analysis, and the sample preparation method described in
Section 2.3 was adopted.
Due to the limitations of the test instruments and the particularity of rock and soil materials, the following points should be considered when preparing the soil sample for scanning electron microscopy: First, to accurately reflect the initial appearance of the soil sample, its structure should be disturbed as little as possible during preparation. To avoid damage to the probe and electron gun of the scanning electron microscope and to ensure the proper vacuum conditions in the system, clean and dry soil samples must be used. To prevent image distortion, the sample used in scanning electron microscopy should have good electrical conductivity. This means that the surface of the soil sample should be coated with an electrically conductive layer prior to the test.
The specific test procedure is shown below:
- (1)
Similar to the mercury compression test, the prepared soil samples are first cut using a paper cutter coated with liquid nitrogen. The samples should not be too large so as to avoid disturbing the soil structure.
- (2)
The specimen was frozen in the liquid nitrogen container (Beijing Boyikang Experimental Instrument Co., Ltd., Beijing, China) for 15 min, then removed and quickly placed into the freeze-dryer for vacuum drying.
- (3)
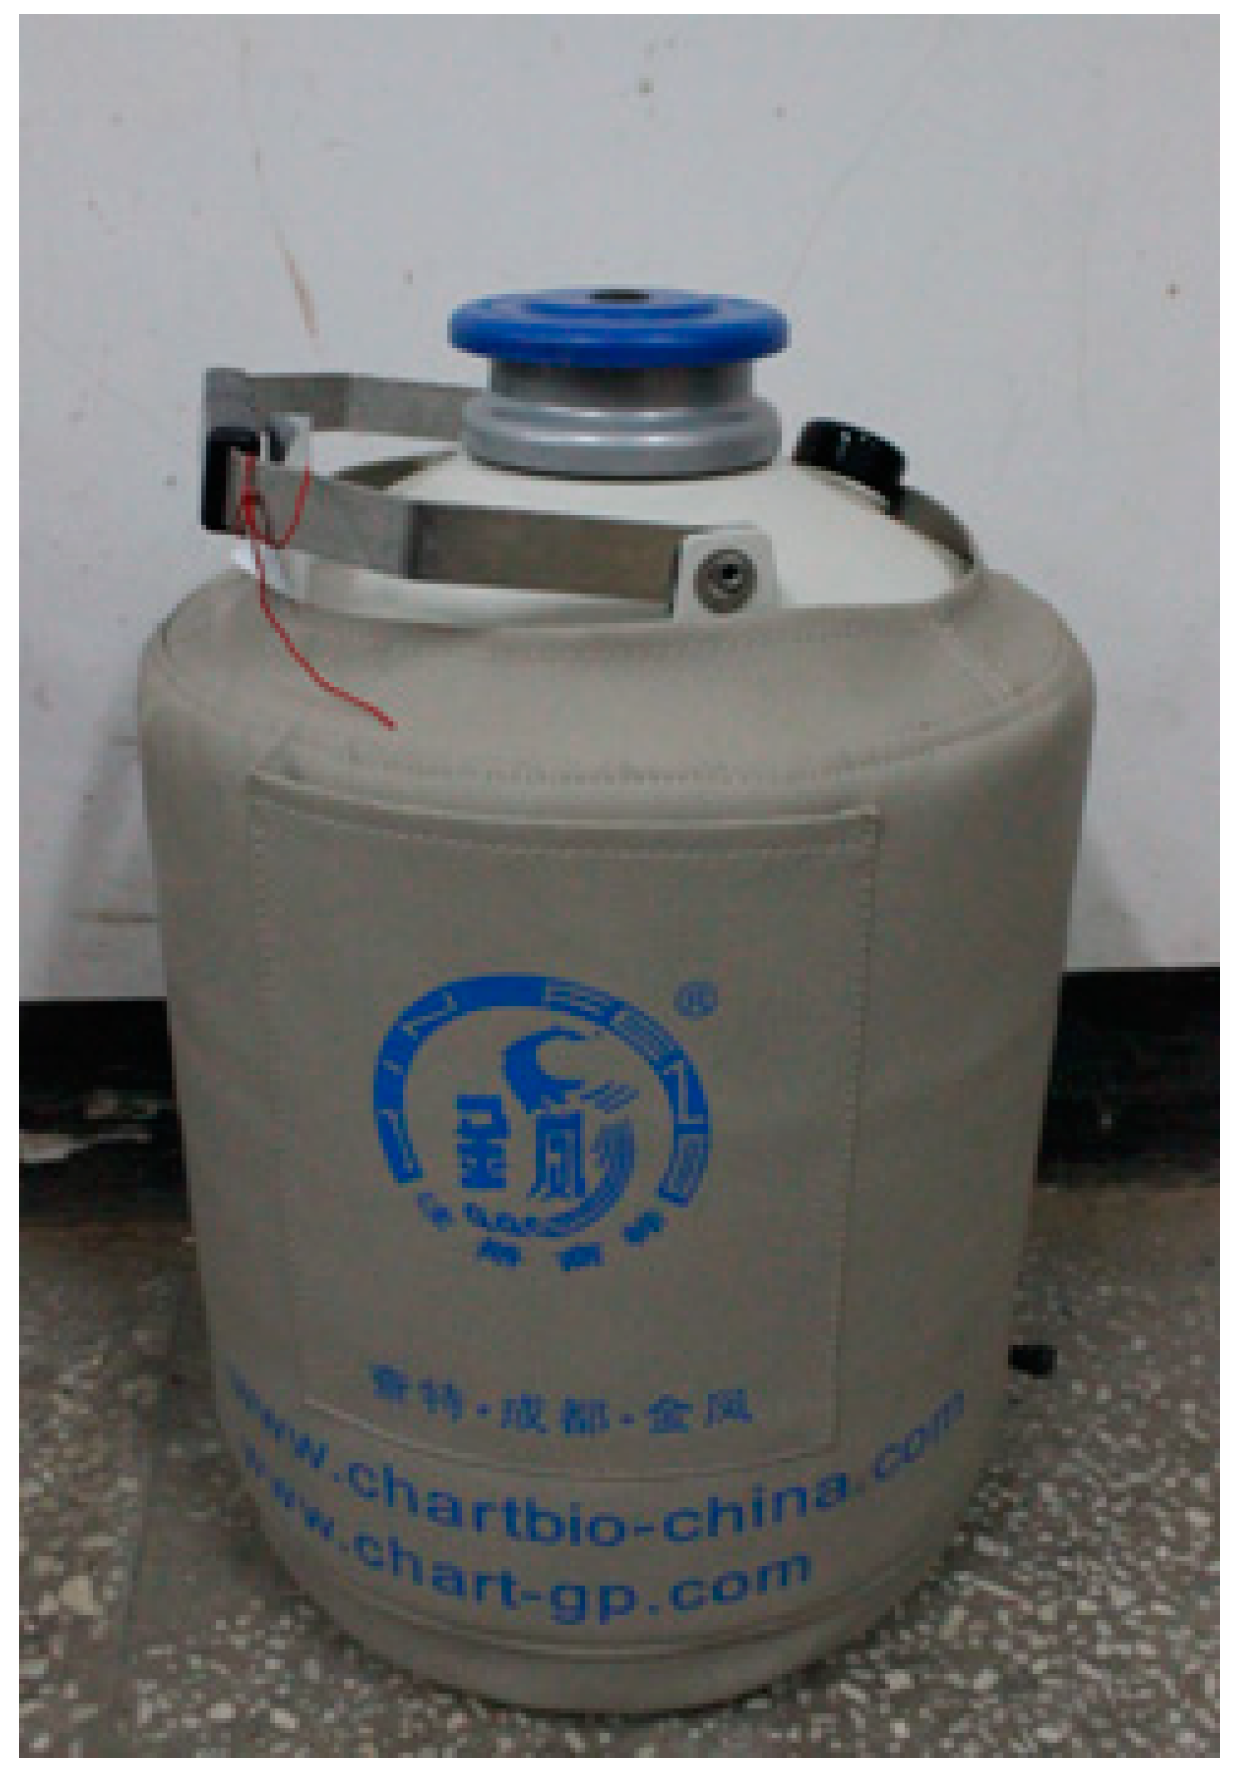
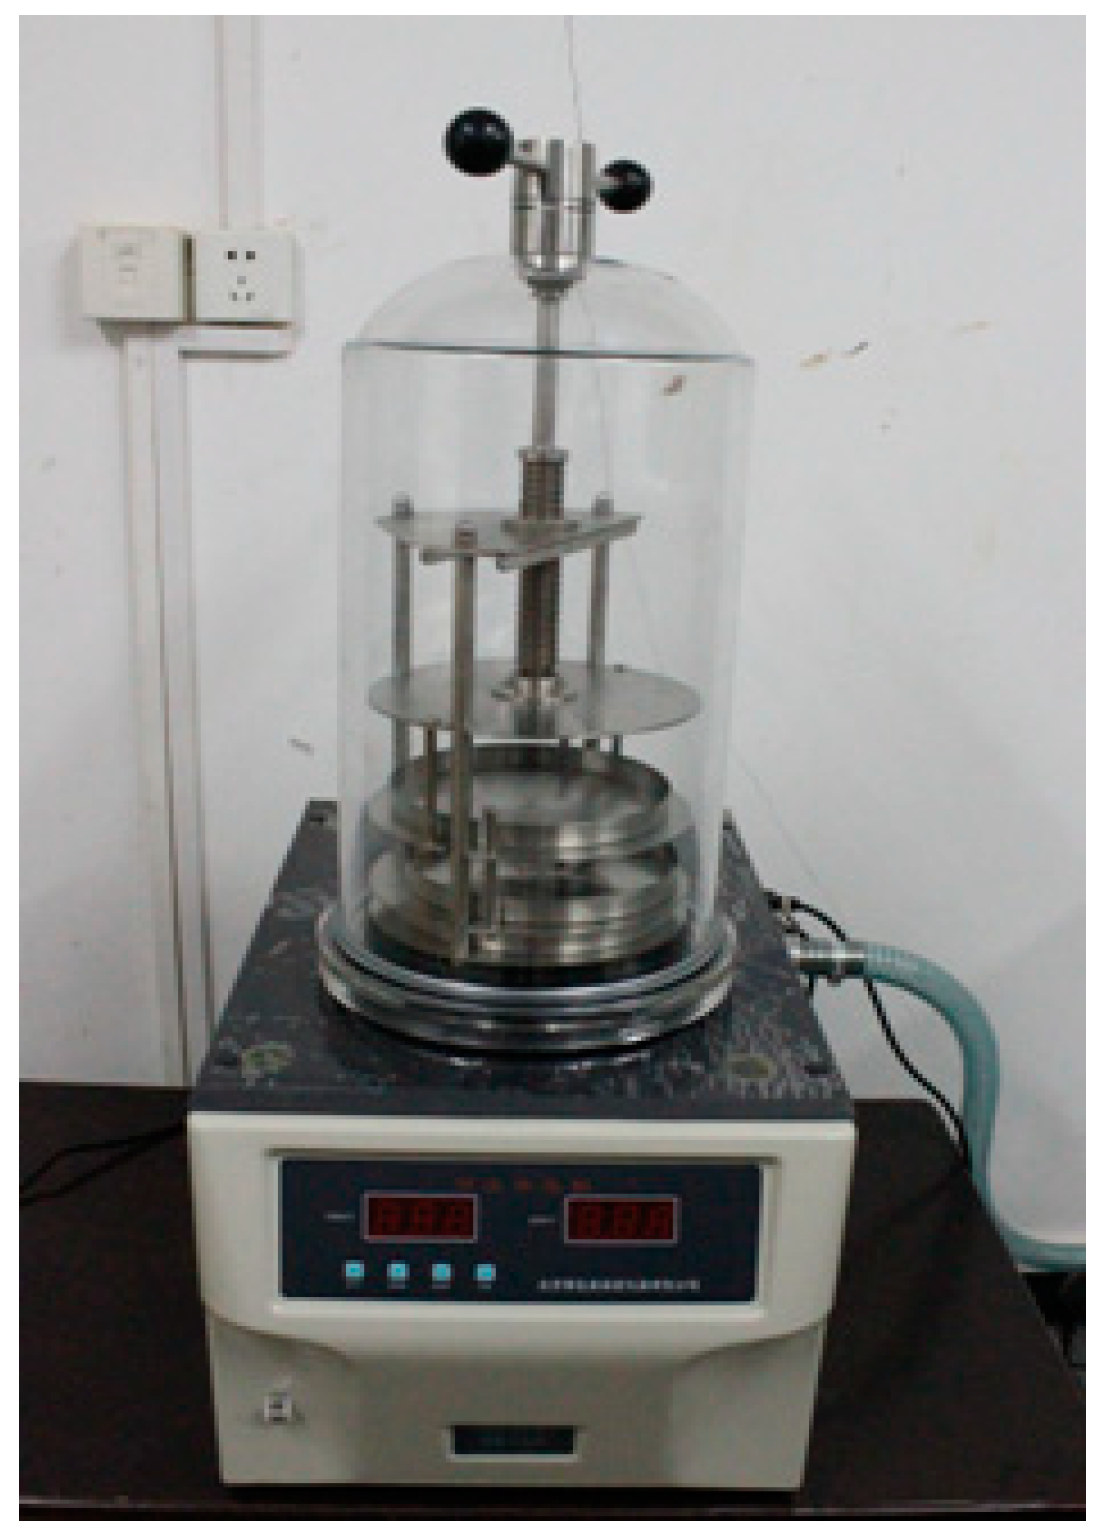
The liquid nitrogen container is shown in
Figure 4, and the freeze-dryer was manufactured by Beijing Bo Medical Kang Experimental Instrument (Beijing, China) (
Figure 5).
- (4)
A gold film was sprayed using a vacuum evaporation coater, and the specimen was placed in a high-vacuum electron microscope chamber for observation and imaging.
- (5)
Scanning electron microscope images were pre-processed with denoising, histogram equalization, and histogram specification. Image processing was performed using a computer specialized in image analysis to obtain images of the arrangement of swelling soil particles, cementation structures, and related data.
3. Results and Discussion
3.1. Soil–Water Characteristics Test Results Under Different NaCl Concentrations
Figure 6 shows the soil–water characteristic curve of the pre-consolidated Ningming expansive soil sample in the low-suction section, under different NaCl solution concentrations, measured by the pressure plate method. The initial dry density of the sample was 1.25 g/cm
3. It can be observed from
Figure 6 that as the suction increases, the soil water content decreases. Meanwhile, under the same suction level, the soil’s water-holding capacity increases with the increase in NaCl concentration.
The initial water content of the sample shows that the water content of the pore solution gradually increases from 0 mol/L to 0.5 mol/L. This may be due to the following reasons: The addition of salt alters the chemical balance of the original soil matrix and generates osmotic suction, thereby affecting the water retention of the soil. When the pore water becomes a NaCl solution, changes in density cannot be ignored under the same conditions. As seen in
Figure 2, the water-holding curve shifts upward with increasing concentration, and the three curves for concentrations between 0 and 0.1 mol/L are close to each other. When the pore solution reaches 0.5 mol/L, the curve shifts the most. According to the classical chemical potential formula,
where
is the chemical potential of pure water, and
is the mole fraction of water in solution
It can be clearly seen that
.
As can be seen from the above equation, when the pore water in the soil mass is replaced by pure water in the NaCl solution, the chemical potential of the original water will be reduced. In addition to the influence of the chemical potential of the solute, the impact of the electric effect should also be considered.
Due to the negative charge on the surface of soil particles, the exchangeable cations in the solution are attracted to the particle surface, where they undergo a series of physicochemical reactions, including adsorption, dissociation, and homocrystalline replacement. After filtering the sample, as the concentration of NaCl increases, the concentration of pore solution in the soil also increases, leading to a greater number of exchangeable cations. More cations are then moved to the surface of the soil particles until a new equilibrium state is reached. This series of physicochemical effects leads to a reduction in the chemical potential energy of the soil pore water, and the soil suction reflects the energy state of the pore water—specifically, the reduction in chemical potential energy. Therefore, as the pore solution concentration increases, the suction force of expansive soil will also increase.
3.2. Mercury Intrusion Pore Test Results
Although the initial dry density of the control target is 1.25 g/cm
3 and the corresponding pore ratio is 1.19, there will inevitably be estimation errors during sample cutting and leaching. The test pore solutions with concentrations of 0 mol/L, 0.05 mol/L, 0.1 mol/L, and 0.5 mol/L correspond to pore ratios of 1.21, 1.19, 1.23, and 1.21. To ensure the accuracy of mercury injection data, according to the mercury volume per unit mass of the sample and the volume of solid particles (numerically equal to the soil-specific gravity value, see
Table 1), the void ratio of the sample was calculated:
where
is the specific gravity of soil,
is the volume of the sample into mercury per gram (g/cm
3), and
is the residual moisture content of the cold-dried soil sample during the mercury compression test, taken as 0 in this test.
Table 3 shows the measured and calculated values of the void ratio.
The void ratio, calculated from the measured sample mass, water content, and volume during sample preparation, is comparable to the pore volume calculated from mercury intrusion. Based on the void ratio of the soil, the NaCl solution in different pores does not significantly alter the total pore volume of the soil.
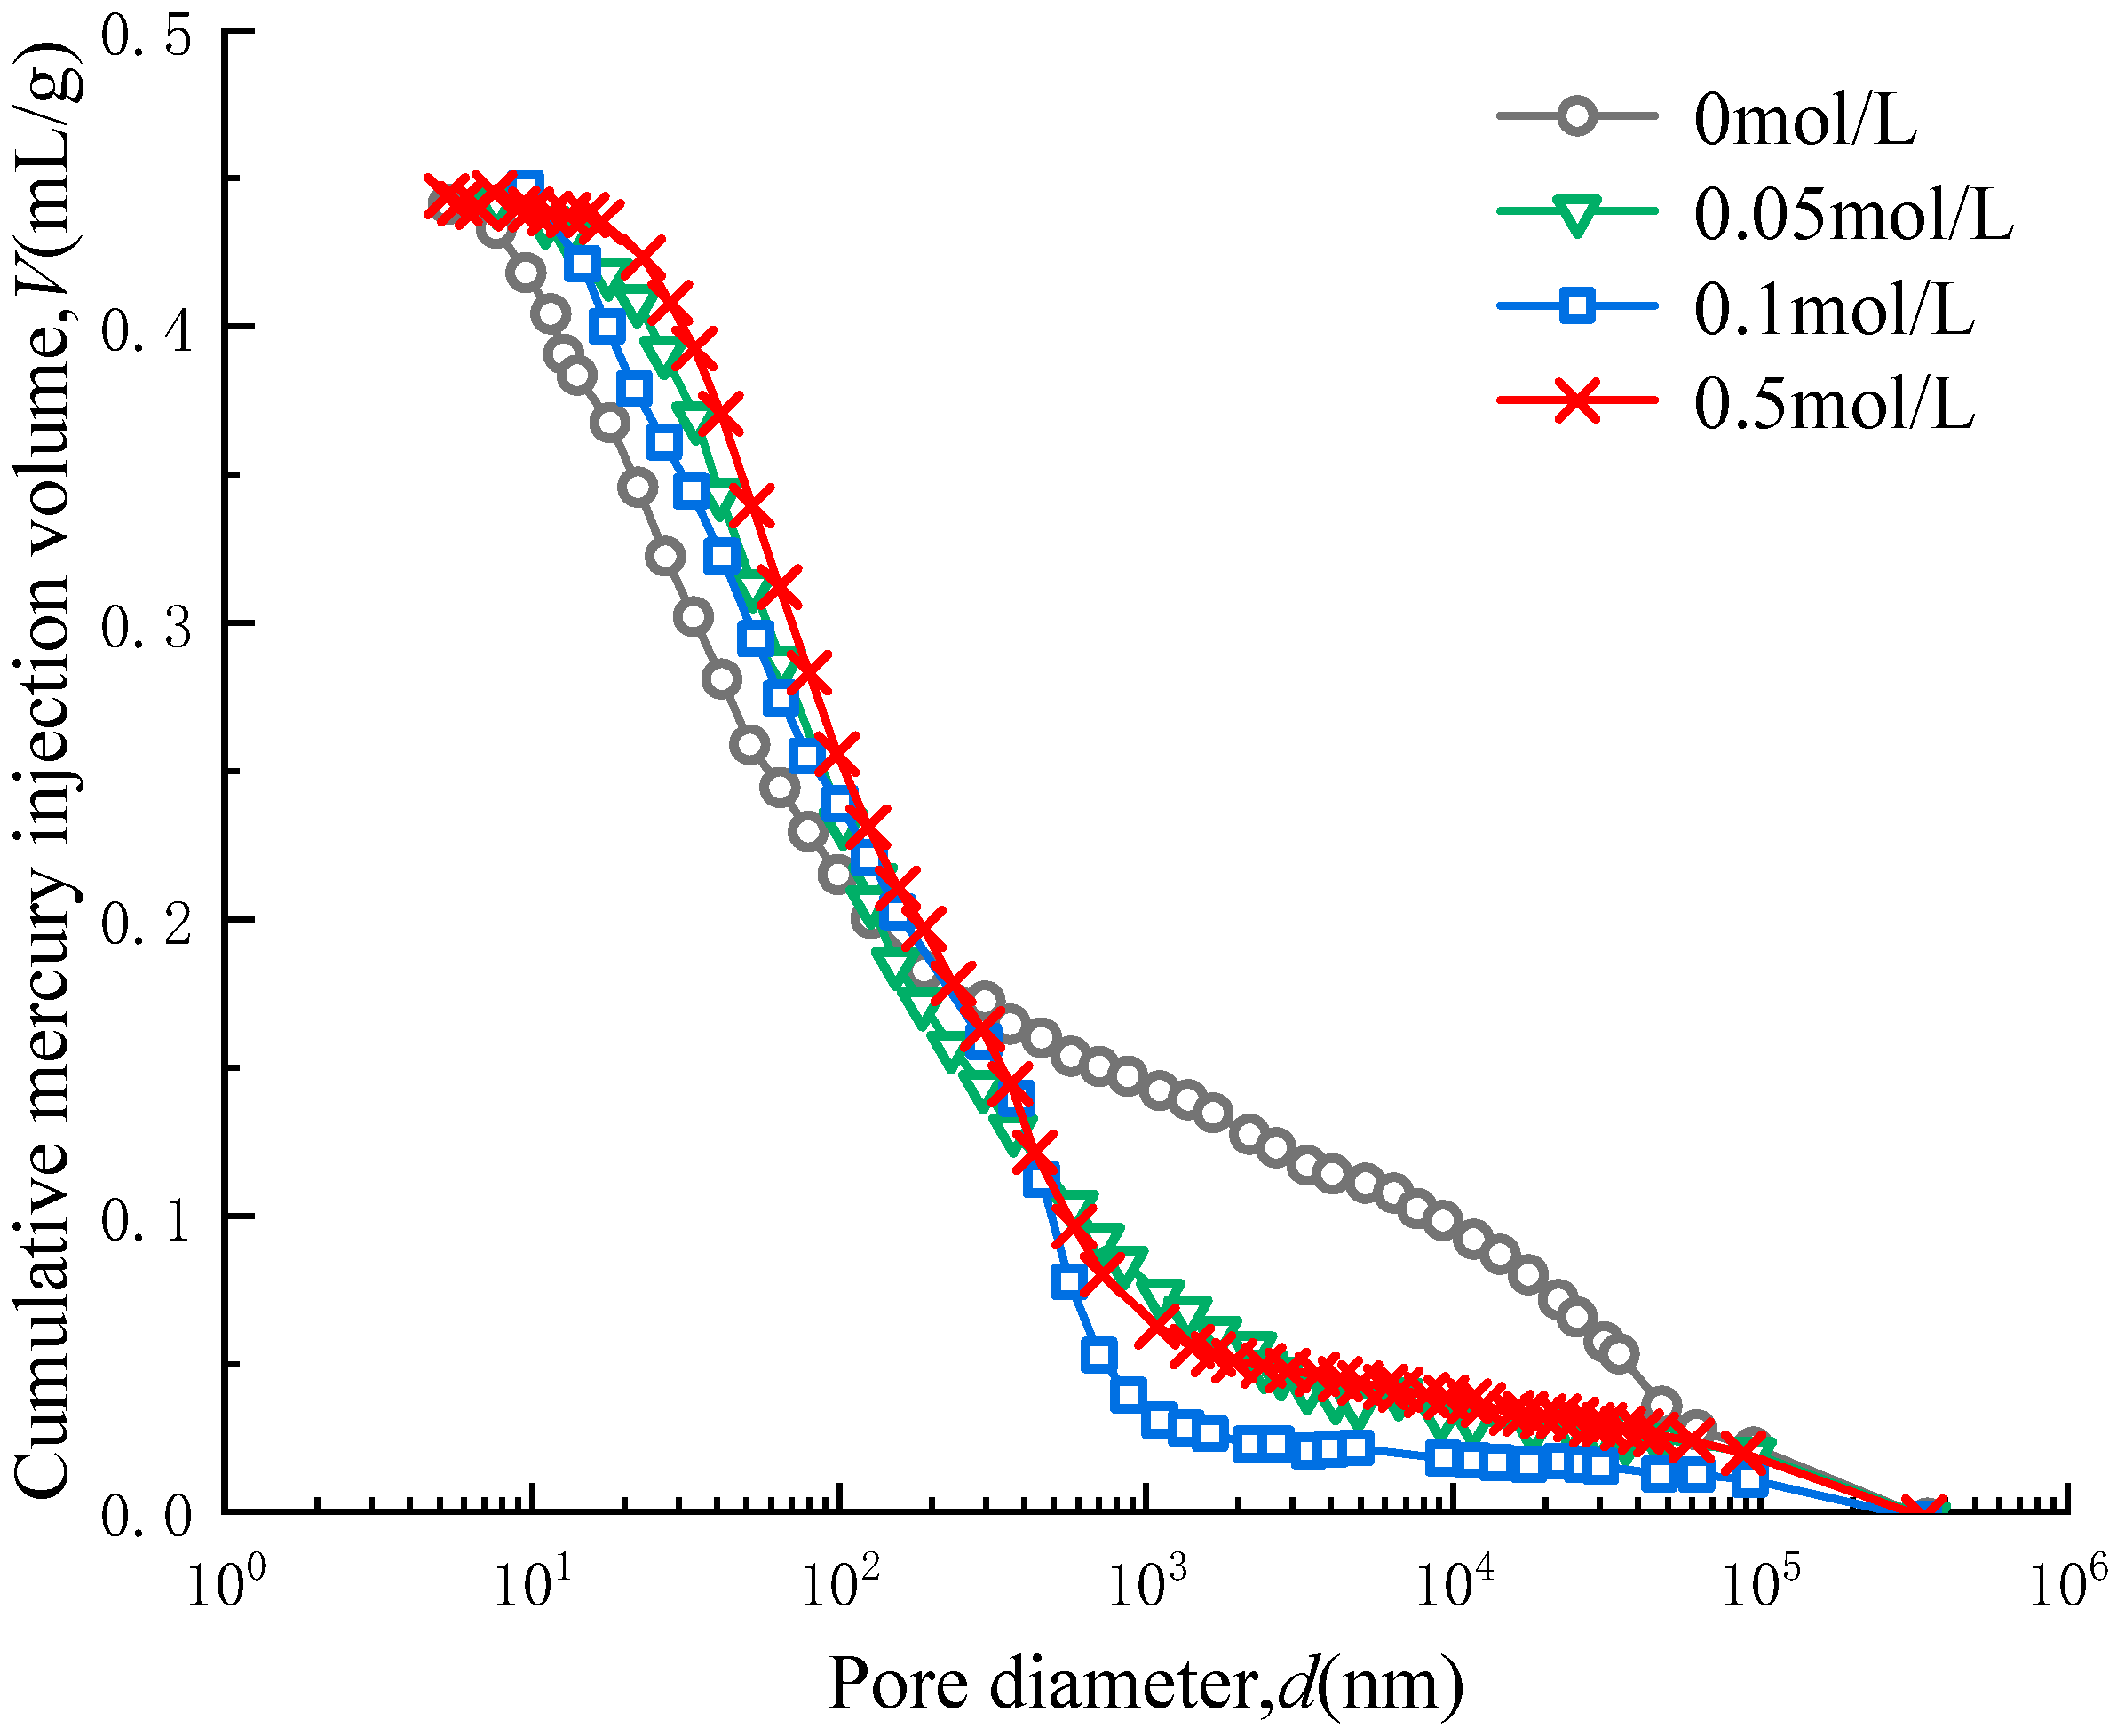
Figure 7 illustrates the relationship between the cumulative mercury injection volume and pore diameter of the pre-consolidated sample at four NaCl concentration gradients, showing two distinct increasing segments at 0 mol/L. Two less pronounced increases are observed at 0.05 mol/L and 0.1 mol/L. A relatively clear increase is observed at 0.5 mol/L. The pore sizes of the four samples were primarily distributed between 5 and 10
3 nm. Delage et al. [
31] employed scanning electron microscopy and mercury injection porosimetry to reveal the presence of inter-agglomerate and intra-aggregate pores in clay. This classification indicates that the pores in the pre-consolidated expanded Ningming soil sample predominantly exist as intergranular pores. This may be attributed to the high initial water content of the sample (1.5 times the liquid limit) and the application of equilibrium pre-consolidation stress after the sample is prepared into a slurry. When the initial water content of soil particles is high, agglomeration is not favored, resulting in a more uniform sample distribution.
Figure 8 illustrates the relationship between pore distribution density and pore diameter of the sample, which primarily reflects the number of pores at each given diameter value. As shown in the figure, the sample corresponding to 0 mol/L exhibits a clear bimodal pore structure, with pores primarily distributed in two intervals: 5–10
2 nm and 10
4–10
5 nm. This indicates that, at this concentration, the pores consist of both intergranular and intragranular pores. Additionally, it can be observed that, at a pore solution concentration of 0 mol/L, the intake value is lower compared to those of sodium chloride and other concentration solutions. As the concentration increases, when the pore solution concentration reaches 0.05 mol/L, the sample’s pore structure transitions to a unimodal configuration, with pores primarily distributed in the 5–10
3 nm range, indicating the presence of intergranular pores. At a pore solution concentration of 0.1 mol/L, the pores are primarily distributed in the 5–10
3 nm range. Compared to the 0.05 mol/L concentration, where the solute concentration is doubled, the pore size within the 5–10
2 nm range decreases. In the 10
2–10
3 nm pore size range, the quantity increases. As the pore solution concentration increases, the soil sample reaches another equilibrium: the quantity of pores in the 10
2–10
3 nm range decreases, while the pore size in the 5–10
2 nm range increases slightly.
The observed phenomenon may be attributed to the increase in the concentration of the salt solution, which introduces more cations. This leads to the generation of an osmotic suction difference between the interior and exterior of the crystal layers, and this difference intensifies as the salt concentration increases. Under the influence of this osmotic suction difference, more water molecules are drawn into the interlayer pores. As the number of water molecules increases, montmorillonite undergoes hydration, causing the larger pores to crack or collapse, resulting in the formation of numerous smaller pores. Consequently, the number of large pores decreases, while the number of small pores increases.
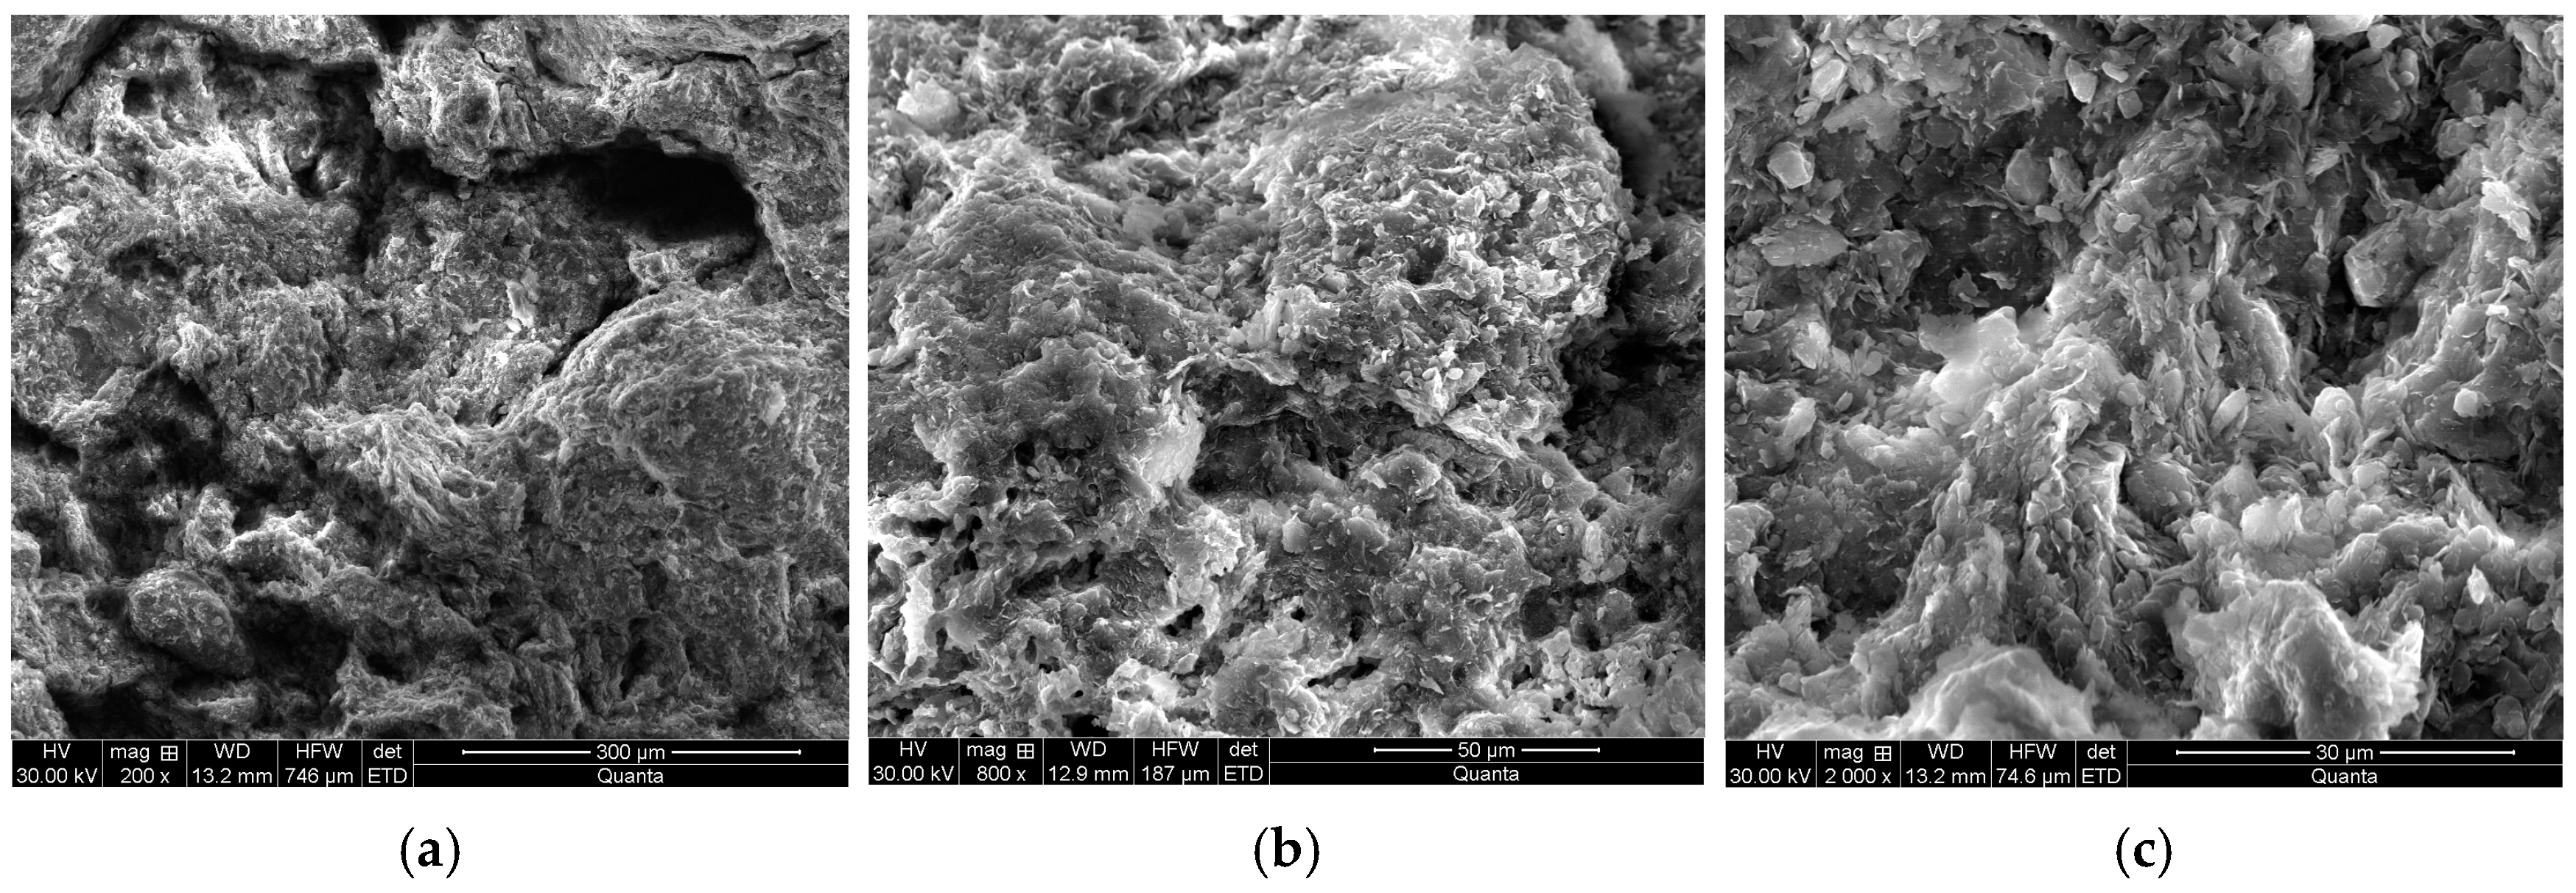
3.3. Results of Scanning Electron Microscopy
The test results are shown in
Figure 9,
Figure 10,
Figure 11 and
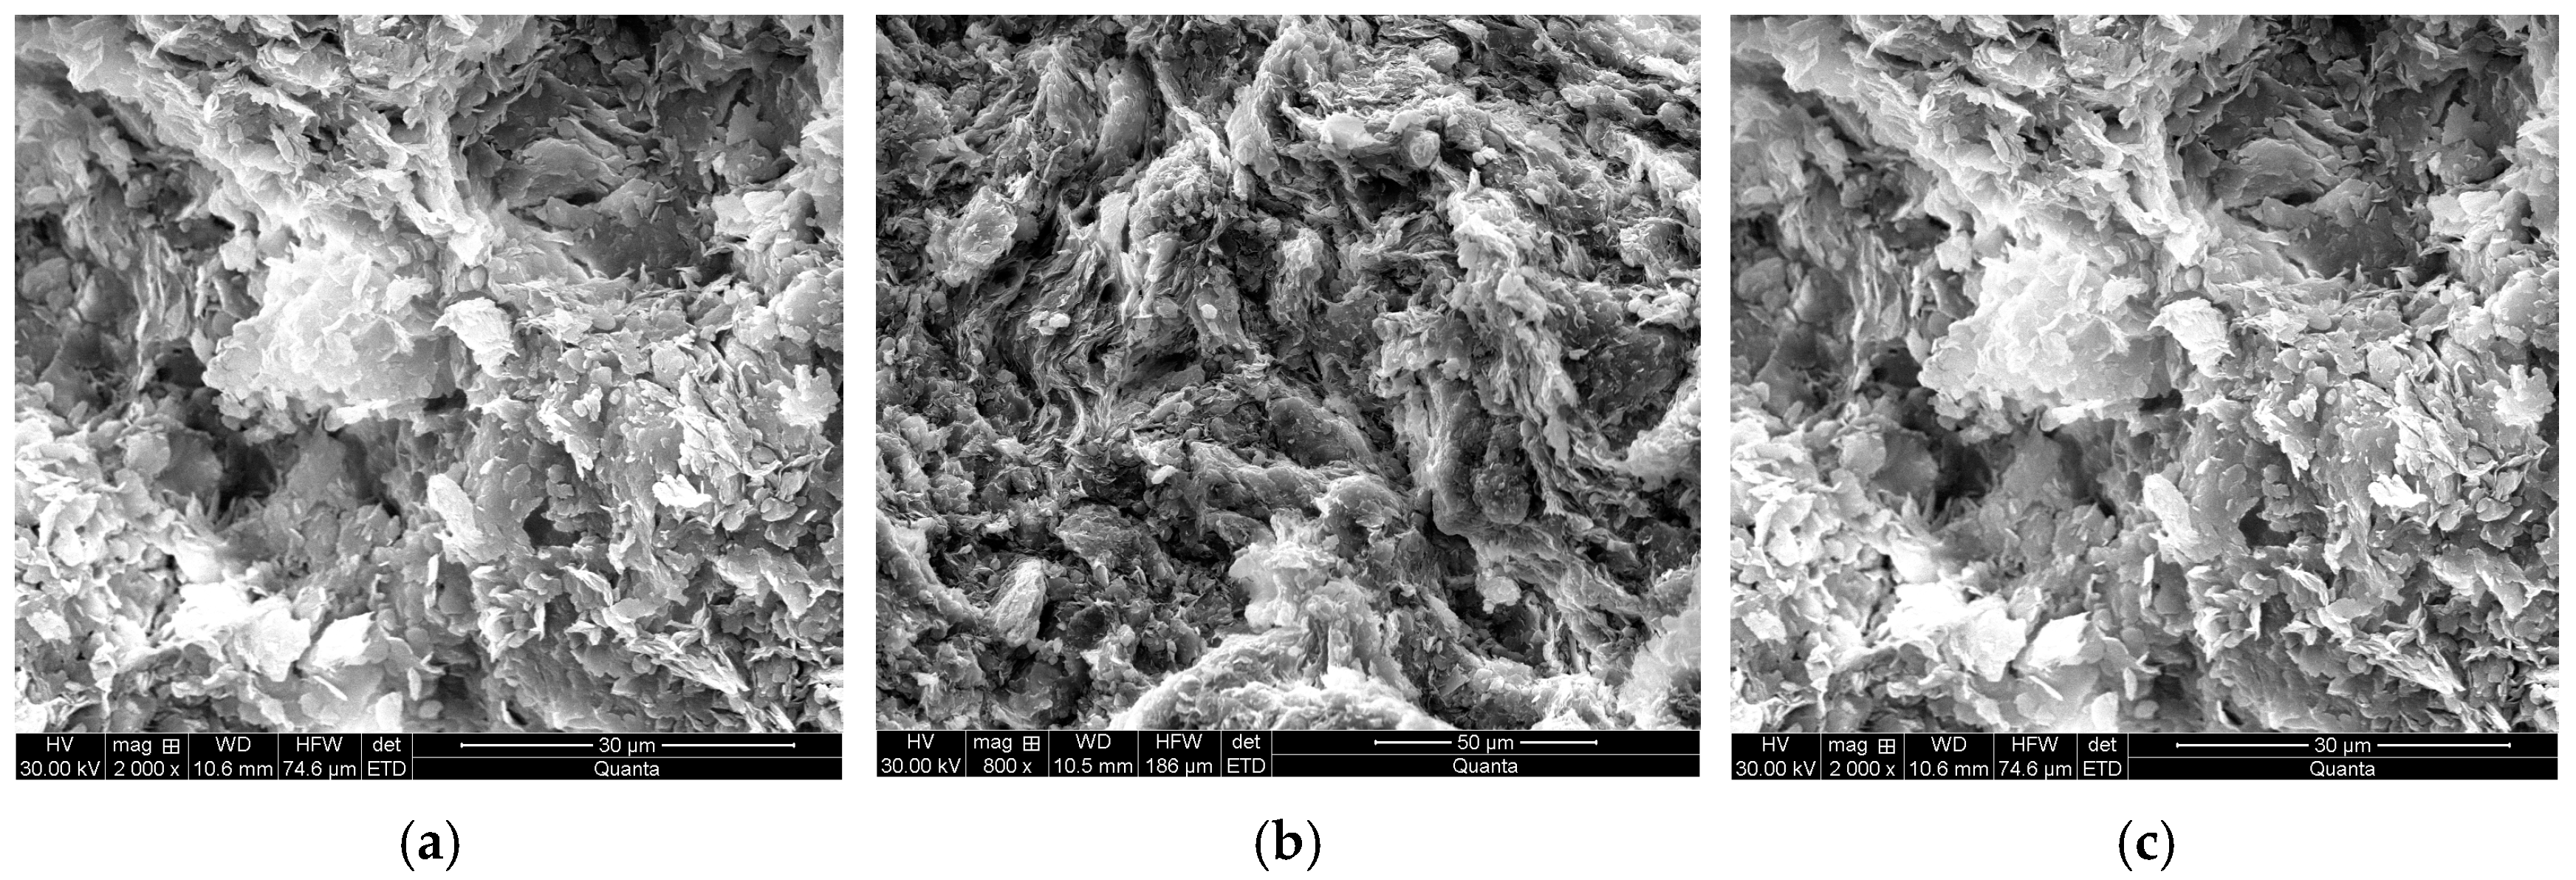
Figure 12. Through comparative analysis, it can be found that under the 200-fold scanning electron microscope, the sample particles saturated with pre-consolidated Ningming expansive soil under the condition of distilled water contain more crosses, they are more loosely arranged, and the pores between the particles are relatively small, but the granular details of the soil particles cannot be completely distinguished. However, when the pore solution gradually increases, the density of the soil sample changes to a certain extent, which changes the arrangement of the soil particles, and there is a certain depth of holes between the particles. The possible reason is that the soil sample is broken apart in the laboratory to form a certain angle, which may not form a hole in the soil; on the contrary, the clay particles around the hole are more compact. The arrangement between the slices is more parallel, and it is more obvious at the magnification of 2000 times.
Lin et al. [
32] conducted SEM tests on the compacted samples of Ningming expansive soil under different initial dry densities. He argued that for compacted soils, the internal structure of the soil sample is matrix-like, as shown in
Figure 12. Under different sample preparation methods, the agglomeration volume of the compacted samples and the pre-consolidated samples decreased. This is because the pre-consolidated sample is pre-consolidated after being stirred into a slurry shape with a higher water content (1.5 times the liquid limit), which arranges soil particles to be more uniform and the stratification more obvious, which also verifies that the water-holding capacity of the pre-consolidated sample is higher than that of the compacted sample at the same dry density, and the air intake value is larger. This structure has large pores and increases with the increase in gravity. The pores in the soil are divided into intergranular pores, intra-granular pores, and isolated pores, among which the content of intergranular pores is dominant in the soil, which mainly exists in the aggregate, is widely distributed, and has intergranular pores with good connectivity. The intergranular pores play a crucial role in the physical and mechanical properties of the soil.
4. Soil–Water Characteristic Curve Model
The soil–water characteristic of soils are usually described by soil–water characteristic curves, which provide the relationship between suction and water content. The soil–water characteristic curve can be used to assess many characteristics of unsaturated soil, such as deformation characteristics, permeability characteristics, strength characteristics, etc. [
33]. However, direct measurement by experiment is often complicated and time-consuming. To overcome these shortcomings, many scholars have put forward the soil–water characteristic curve model.
At present, the commonly used water-holding models are the BC model (Brooks–Corey 1964) [
34], VG (van Genuchten 1980) [
35], and FX model (Fredlund and Xing 1994) [
36]. The functional form of the BC model is relatively simple, while the VG model has a wider suction range and can better describe the actual shape of soil–water characteristic curves. The VG model and FX model have the best fitting effect on multiple types of soil, but the FX model has more parameters and is relatively complex compared with the previous two models. Therefore, in this paper, the BC model, which is commonly used and relatively simple, and the VG model with a good fitting effect for many types of soil are selected, and EXCEL software (2020) is used to fit the soil–water characteristic curves obtained by the tests.
Figure 13 shows the fitting curves of BC model, and
Table 4 illustrates the fitting parameters. The fitting result of the BC model is good, which is in good agreement with the test data, and the R
2 is above 98.7%. The fitted curve is expressed by suction and volume moisture content. The air entry values corresponding to 0 mol/L, 0.01 mol/L, 0.1 mol/L, and 0.5 mol/L are 22.3 kPa, 25.6 kPa, 32.8 kPa, and 52.1 kPa, respectively. The soil air entry values are relatively reliable after fitting, and the soil air entry values increase with the increase in pore solution concentration and enhanced water retention.
Figure 14 shows the fitting curves of the VG model, and
Table 5 illustrates the fitting parameters. The fitting result of the VG model is good, which is in good agreement with the test data, R
2 is above 99%, and the fitted curve is expressed by suction and volume moisture content. The air entry values corresponding to 0 mol/L, 0.01 mol/L, 0.1 mol/L, and 0.5 mol/L are 21.6 kPa, 25.6 kPa, 41.5 kPa, and 51.8 kPa, respectively. The soil air entry values are relatively reliable after fitting, and the soil air entry values increase with the increase in pore solution concentration and enhanced water retention.
By comparing the BC and VG models, the fitting effect of both models can meet the requirements. Therefore, it is suggested to take the average value of soil air entry obtained after fitting the BC and VG models as the corresponding air entry value after changing the pore solution concentration of pre-consolidated Ningming expansive soil. The entry air values corresponding to 0 mol/L, 0.01 mol/L, 0.1 mol/L, and 0.5 mol/L were 22.0 kPa, 25.6 kPa, 37.2 kPa, and 52.0 kPa, respectively, which were very close to the test data.


