Abstract
Groundwater serves as a vital water source in Zhanjiang City. This study analyzed the chemical components of 35 samples to understand the hydrochemical characteristics and evolution mechanism of groundwater in Zhanjiang City. A comprehensive analysis was conducted using statistical methods, including the use of Piper trilinear diagrams, the Gibbs method, ion ratios, and other techniques, to investigate the sources and control factors of the main ions in groundwater in the area. The findings reveal that all the groundwater is freshwater, with the main cations and anions being Na+ and HCO3−, respectively. Shallow water is mainly of the Cl•SO4 mixed cation type, followed by the HCO3•ClNa•Ca type. Middle and deep pore water is mainly of the HCO3Na type, followed by the HCO3Na•Mg type and HCO3Na•Ca type. The hydrochemical classifications of pore and fissure water are Cl•HCO3Mg•Na type and Cl•HCO3Na type water. The primary hydrogeochemical process is water–rock interaction, particularly the dissolution of silicate minerals. Additionally, evaporation and concentration contribute significantly to the chemical composition of shallow water, and ion exchange is also an important hydrogeochemical process affecting middle and deep pore water. Shallow water commonly contains nitrates, with 37.5% of shallow water showing contamination with NO3−. This study aims to provide insights into the development and utilization of local water resources.
1. Introduction
Groundwater is essential for daily human activities, industrial processes, industry, and agricultural production. With the development of urban construction and industrial and agricultural production, human activities have caused a certain degree of pollution of groundwater, and the chemical composition of groundwater has also changed accordingly. Groundwater quality has deteriorated, seriously threatening people’s health and safety while also causing damage to the ecological environment [1,2]. Therefore, understanding the hydrogeochemical characteristics of groundwater is crucial for environmental protection and effective and rational water resource management.
Research on the hydrogeochemical characteristics of groundwater has always been a hot topic of hydrogeology worldwide. Many scholars have proposed some methods for investigating hydrochemical problems, such as the use of Piper trilinear diagrams, Gibbs diagrams, the ion ratio method, the saturation index, isotope tracing, spatial analysis [3], multivariate statistical analysis [4,5,6,7,8,9,10], machine learning approaches based on decision trees [11,12,13], etc. Numerous applied studies have proven that these methods are highly effective for studying the chemical characteristics and genesis of groundwater [14,15,16,17,18,19].
Zhanjiang City, situated at the southwestern tip of Guangdong Province, is one of China’s three major peninsulas, with a population of approximately 1.36 million. As industrial sectors in Zhanjiang continue to develop and upgrade, the sustainable development of groundwater resources is vital for the region’s future. Previous research has shown that the groundwater resources in Zhanjiang City are more abundant than surface water [20], and groundwater is the primary water supply resource for both people’s lives and industry–agriculture production. Changes in groundwater quality and hydrochemical composition have profound implications for the development of Zhanjiang City. In recent years, research on groundwater in Zhanjiang City has mainly focused on the hydrochemical analysis of local small areas or single-layer aquifers [21,22,23,24,25]. Although these studies provide valuable insights, they often overlook the hydrochemical characteristics of multiple aquifers. Therefore, systematic investigations are needed to examine these characteristics across different aquifers.
In view of this, this article comprehensively uses statistical methods, a Gibbs model, a Piper trilinear diagram, the ion ratio, and other analyses to investigate the hydrochemical characteristics of groundwater in Zhanjiang City’s urban area. This study aims to uncover the interaction mechanisms between groundwater and its external environment, providing theoretical support and a scientific foundation for the sustainable development of groundwater resources in Zhanjiang City.
2. Materials and Methods
2.1. Study Area
Zhanjiang City is situated in the southwestern part of Guangdong Province, characterized by a typical subtropical and tropical monsoon climate. The average annual temperature is 23.1 °C, with annual precipitation ranging from 1400 to 1800 mm. Precipitation is mainly concentrated from May to September each year. Local droughts often occur from January to March, with distinct dry and wet seasons. At the same time, the evaporation rate is high, and in some areas, it even exceeds rainfall.
The study area lies within the western Guangdong volcanic activity sub-belt, formed during the Himalayan magmatic period, in the Leiqiong volcanic eruption basin. The stratigraphic development is relatively complete, spanning from the Lower Paleozoic to the Cenozoic. Groundwater in this region consists mainly of two types: pore water in unconsolidated rocks and fracture water in volcanic rocks [26]. Fracture water is primarily found in the olivine basalt and volcanic breccia of the Shizhengling Formation (Q2s), while pore water mainly exists in the sand and gravel of the Zhanjiang Formation (Q1z) and the fine sand and gravel-bearing coarse sandstone of the Xiayang Formation (N2x). Pore water can be further divided into shallow (0–30 m) and middle (50–200 m) pore water [24] (Figure 1). In this study, deep groundwater is defined as water at depths greater than 200 m. Common minerals found in pore water include quartz, calcite, kaolinite, etc. [21], while feldspar is the predominant mineral in pore and fissure water. Minerals such as kaolinite, calcite, gypsum, and montmorillonite also appear [21,24]. Shallow water in Zhanjiang City mainly receives atmospheric precipitation recharge, as well as surface water infiltration recharge. The water level of medium and deep confined aquifers is generally lower than that of shallow aquifers. Shallow aquifer water infiltrates vertically through weakly permeable layers and volcanic craters, driven by gravity, and serves as a significant source of recharge for confined water, as shown in Figure 2.
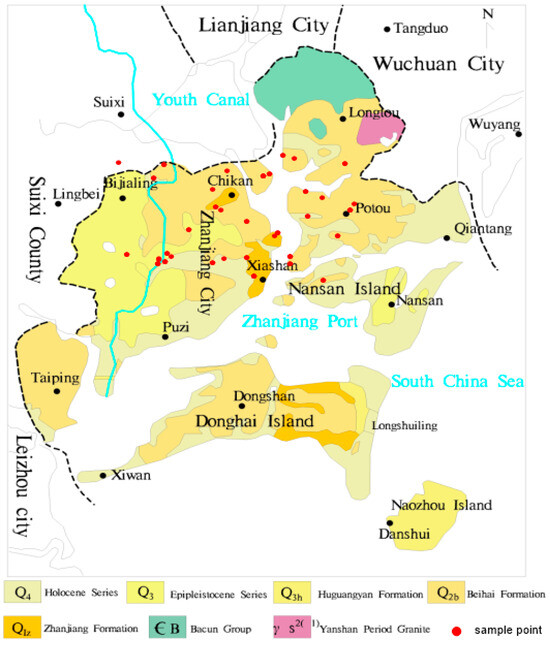
Figure 1.
The study area and sample distribution.
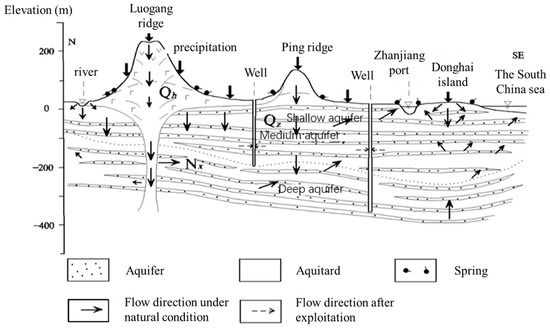
Figure 2.
Typical hydrogeological profile of the study area.
2.2. Sample Collection and Analysis
From July to August 2015, 35 groundwater samples were collected using a low-speed submersible pump, and parameters such as temperature (±0.1 °C) and dissolved oxygen (±0.1 mg/L) were measured using a portable multimeter in Zhanjiang City (Figure 1). This included 17 samples of shallow water, 16 samples of medium-deep pore water, and 2 samples of fissure water. Groundwater samples were collected only after all indicators stabilized. Before sampling, rinse the sampling container three times and strictly prevent air bubbles from entering during the sealing process. The samples were analyzed for major ions using standard laboratory techniques at the Guangdong Geological Experimental Testing Center. Total Dissolved Solids (TDS, ±5 mg/L) were measured using the oven drying method, while chloride (0.5 mg/L), sulfate (±1.0 mg/L), and nitrate (±0.5 mg/L) ions were analyzed via ion chromatography (ICS-5000 model, Thermo Fisher Scientific, Waltham, MA, USA). Potassium ions (±1.0 mg/L), sodium ions (±0.5 mg/L), calcium ions (±0.5 mg/L), and magnesium ions (±0.5 mg/L) were determined using flame atomic absorption spectrophotometry (contraAA300 model, Analytik Jena, Jena, Germany), and bicarbonate ions (±5 mg/L) were determined by titration. The summatory of the main species in mg/L was calculated to assess the total ionic strength of the samples, distinct from the Fixed Residue.
2.3. Methodology
2.3.1. Clustering Method
Multivariate statistical analyses are essential for deriving meaningful insights from large datasets related to the hydrogeochemical characteristics of groundwater. In a multi-indicator evaluation system, each indicator often has different magnitudes and units due to their unique nature. Using raw data can amplify the impact of indicators with higher values while diminishing the importance of those with lower values. Therefore, to maintain the integrity and reliability of the results, it is crucial to standardize the original data. Z-score standardization was applied in this process. The mean and variance of each variable were calculated initially:
where p denotes the number of parameters and n denotes the number of groundwater samples. Then, the following transformation was performed:
The standardized data has a standard deviation of 1 for each variable, making it dimensionally independent.
Hierarchical cluster analysis (HCA) was then conducted on the standardized data to identify different chemical types of water and explore the sources of chemical elements. In this study, IBM SPSS Statistics V22.0 (https://www.ibm.com/support/pages/spss-statistics-220-available-download, accessed on 29 October 2024) was used to perform the HCA using the Ward method, which is based on analysis of variance. An accurate classification should result in a lower within-class sum of squares of deviations and a higher between-class sum of squares of deviations.
2.3.2. Hydro-Geochemistry Analysis Methods
The Piper trilinear diagram is employed to analyze the hydrochemical types of groundwater, while methods such as the Gibbs model and ion ratio are used to investigate the origins of hydrochemical processes.
2.3.3. Geochemical Modeling
The Mineral Saturation Index (SI) is a widely used metric that describes the dissolved and precipitated states of various minerals in groundwater. By utilizing chemical thermodynamics calculations, we can gain insights into the behavior of different mineral phases in groundwater, enhancing our understanding of water–rock interactions [26]. In this study, these values were calculated using the following Equation (4) with PHREEQC 3.6.2 software [27]:
where IAP denotes the ionic activity product, and K represents the equilibrium constant for the relevant minerals. Here, an SI of 0 indicates equilibrium, an SI greater than 0 indicates saturation, and an SI less than 0 indicates unsaturation.
3. Results and Discussion
3.1. Basic Statistical Characteristics
The groundwater analysis results (Table 1) indicated that the pH levels ranged from neutral to slightly alkaline, characterized by a low coefficient of variation, which suggests consistency among the samples. The TDS value does not exceed 1000 mg/L, all of which is freshwater. The average value shows pore and fissure water > shallow water > middle and deep pore water. There are significant differences in the concentration changes of key cations and anions across different groundwater types, among which Na+ and HCO3− are the dominant cations and anions. Except for HCO3−, the mass concentration of other ions shows shallow water > middle and deep pore water. The mass concentration of NO3− in shallow water is 0.2~50.00 mg/L, averaging 21.39 mg/L. Nitrates are frequently detected in shallow water, and their highest concentrations are primarily located in the coastal regions of Zhanjiang City, which are located in the plains and plateaus with good supply conditions and are easily affected by human activities.

Table 1.
Overall features of groundwater quality indicators. (unit: mg/L).
The concentration of major cations in shallow water, in descending order, is Ca2+ > Na+ > Mg2+ > K+. For anions, the order is Cl− > SO42− > HCO3− > NO3−. This pattern is consistent in middle and deep pore water, suggesting a strong correlation in the sources of these ions between the two types of groundwater. In pore and fissure water, the cation concentration follows the order Na+ > Mg2+ > Ca2+ > K+, while the anion concentration order is Cl− > HCO3− > NO3− > SO42−. Furthermore, the C.V. of the hydrochemical parameters of the pore and fissure waters are less than 1, indicating a relatively uniform spatial distribution. This may be due to the rapid water turnover in the environment where the pore and fissure waters are located, resulting in weak water–rock interactions. In particular, the rapid water movement may have reduced the contact time between water and rock, thereby reducing the intensity and frequency of chemical reactions.
In our study of the characteristics of the overall distribution of groundwater chemistry, we identified a number of outliers. The maximum values of K+, Ca2+, HCO3−, and TDS all occurred in Tantoupoxia Village, Xiashan District, Zhanjiang City, which is a shallow water point. The K+ anomaly may be related to agricultural fertilization (potassium fertilizer) during the wet season, while Ca2+ and HCO3− may result from the dissolution of carbonate and silicate rocks. The maximum value of Na+ appears in the coastal area of Tiaoshun Island in Chikan District, Zhanjiang City, which is a mid to deep pore water point with a burial depth of groundwater greater than 200 m. At the same time, the Cl−and TDS contents are relatively high, likely due to the recharge effect of deep-sealed saline water in Tiaoshun Island. Shallow water is buried shallowly, and its hydrochemical composition is easily disturbed by human activities. However, the connectivity between middle and deep pore water and shallow water is indirectly affected, resulting in alterations in the groundwater environment and complex interactions between water and rock. This is an important reason for the uneven distribution of hydrochemical components between shallow and middle-deep layers.
3.2. Characteristics of Hydrochemical Types
The Piper trilinear diagram (Figure 3) shows that the hydrochemical types of shallow water are primarily Cl•SO4 mixed cation type, accounting for 37.5%, and HCO3•ClNa•Ca type, accounting for 25%. Shallow water is primarily located in the groundwater flow discharge zone, and the hydrochemical zoning is not obvious, reflecting the complex interplay of geological and anthropogenic factors. The middle and deep pore water is mainly composed of HCO3Na type water, accounting for 25.93%, followed by HCO3Na•Mg type and HCO3Na•Ca type water, each accounting for 14.81%. The Na+ content increases significantly along the groundwater flow direction, and the HCO3Na•Mg type transforms into the HCO3Na•Ca type and HCO3Na type, showing a transition from inland to coastal areas. The hydrochemical types of pore and fissure water are Cl•HCO3Mg•Na and Cl•HCO3Na types, with Cl− increasing along the direction of groundwater flow, suggesting a significant role of evaporite dissolution in these deeper formations. NO3−, as a minor component in groundwater, has a low background value (less than 1 mg/L) under natural conditions and is generally not included in the naming of hydrochemical types [27]. Three samples (accounting for 37.5%) of shallow water have NO3− concentrations exceeding 20 mg/L, with NO3− milligram equivalent percentages all exceeding 25%, indicating nitrate-type water. The NO3− concentration of this type of water is greatly affected by human activities [28].
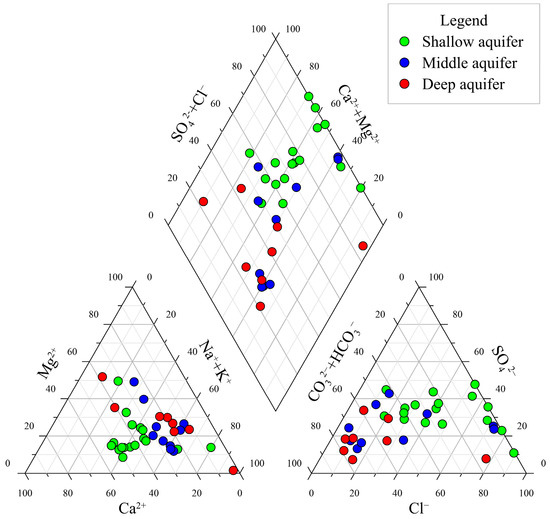
Figure 3.
Piper graph of groundwater.
3.3. Correlation Analysis of Hydrogeochemical Indexes
The correlation coefficients of Spearman’s rank, which assesses the monotonic relationship between parameter pairs, are visually presented in Table 2. The correlation between Na+ content and Cl−, HCO3−, and TDS is particularly strong, with correlation coefficients of 0.992, 0.969, and 0.908, respectively. These high correlation values suggest the influence of marine sources and/or the weathering of evaporite minerals. Similarly, possibly undergoing Na+ and K+ cation exchange, the correlation analysis showed that the correlation between K+ content and Ca2+, SO42−, and HCO3− is notably high; the relation coefficients are 0.762, 0.694, and 0.663, respectively. Furthermore, the strong correlation of 0.97 between Ca2+ and SO42− suggests that sulfate weathering is a major source of these ions.
Table 2.
The Spearman’s rank correlation between pairs of parameters.
Interestingly, K+ and Ca2+ show strong correlations with SO42−, while their correlations with Cl− are weaker. This trend is likely due to the significant introduction of sulfuric acid in the mining region, which dissolves various minerals in the confined aquifer. This suggests that the water’s chemical composition at the observation sites is heavily impacted by mining activities, highlighting a strong link between water chemistry and mining operations.
3.4. Hierarchical Clustering Method
To analysize the spatial distribution characteristics of hydrochemistry, the water samples with similar hydrochemical characteristics are grouped into the same category by the cluster analysis method. For this reason, the Q-type clustering method is used, and the variables are six common anions and cations: Na+ + K+, Ca2+, Mg2+, HCO3−, Cl−, SO42−, and TDS (mg/L). The results of the clustering are presented in Figure 4. As shown, when the distance between groups is 4, the classification effect is better, and the sampling points are divided into six categories.
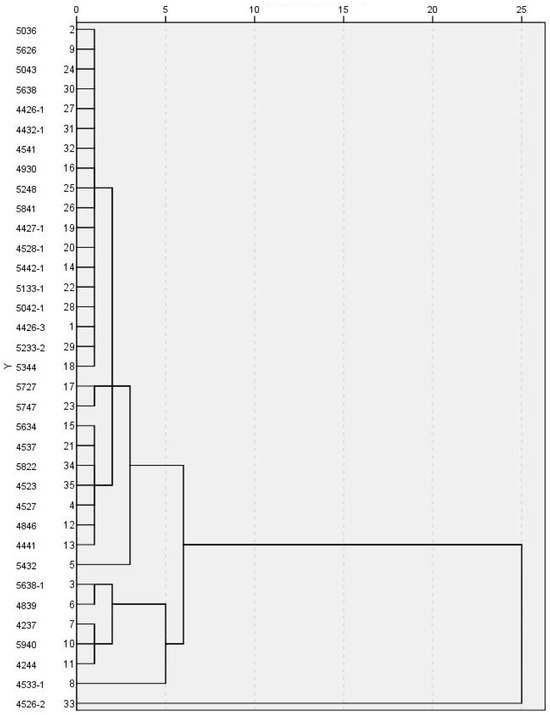
Figure 4.
Hierarchical clustering pedigree diagram.
The first type is a total of 28 samples represented by Nos. 5036, 5727, 5634, and 5432, including all intermediate aquifer water samples, 87.5% deep water samples, and some shallow water samples, mainly HCO3Na and Cl•HCO3Mg•Na. Considering that these samples are less affected by human factors, the water quality is relatively simple. The second type is a total of five water samples represented by No.5638-1 and 4237, all of which are shallow water, and the water quality type is HCO3•ClNa•Ca. The third type of sample is No. 4533-1, and the water quality type is HCO3•SO4Na•Ca, which may originate from the dissolution of SO42− sulphate minerals or microbial metabolic activities. The fourth sample type is No. 4533-1, 4526-2, and the water quality type is Cl•Na, which is thought to be strongly affected by seawater intrusion.
3.5. Analysis of the Formation Mechanism of Hydrochemistry
The hydrochemical patterns observed in the study area are closely linked to local environmental conditions. From Table 1, the high TDS values in some shallow aquifer samples are likely due to evaporation in areas with a shallow water table. The presence of NO3− in some samples is indicative of agricultural and industrial pollution, particularly in areas with intensive agricultural activities and mining sites. These findings underscore the significance of taking local environmental conditions into account when interpreting groundwater chemistry, indicating that the mechanisms behind the formation of groundwater chemistry require further exploration.
3.5.1. Rock Weathering Process
The Gibbs diagram and Gaillardet diagrams are commonly used for surface waters but can also provide valuable insights into groundwater geochemical processes [29]. In our study, we used these diagrams to understand the sources of major ions and the influence of water–rock interactions. From Gibbs figure (Figure 5), one notices that the majority of water samples’ Na+/(Na+ + Ca2+) ratios are plotted in the central region of the figure, with a few distributed outside the box. The Na+/(Na+ + Ca2+) values of shallow water and mid to deep pore water have a wide range and scattered distribution, especially in some water samples with a ratio greater than 0.7. This indicates the influence of cation exchange on hydrogeochemical composition. The majority of Cl−/(Cl− + HCO3−) values are concentrated in the region below 0.5. Similarly, some shallow water and mid to deep pore water samples have Cl−/(Cl− + HCO3−) values greater than 0.5, indicating a certain influence of evaporative concentration.
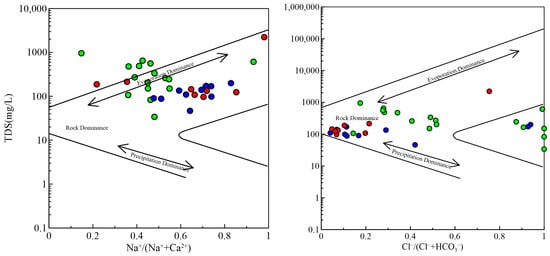
Figure 5.
Gibbs diagrams of groundwater samples. The symbol is the same as Figure 3.
The molar concentration ratios of Mg2+/Na+, HCO3−/Na+, and Ca2+/Na+ produced by the weathering of evaporated salts, silicates, and carbonate minerals vary significantly and are commonly used to determine the source of ions [30]. According to Figure 6, the majority of samples cluster around the terminal components of silicate minerals, indicating that silicate mineral weathering is the predominant process influencing the hydrogeochemical characteristics of the area. This is consistent with the geological background of the study area, where silicate minerals are abundant. The weathering of carbonate minerals also contributed to the hydrochemical composition, particularly in middle and deep pore water. Evaporative concentration was identified as a significant process in shallow water, influencing the concentrations of Na+ and Cl−. The interaction between water and rock, including cation exchange, played a crucial role in shaping the hydrochemical characteristics. Overall, most groundwater samples were affected by weathering, and many ions originated from the breakdown of silicate minerals.
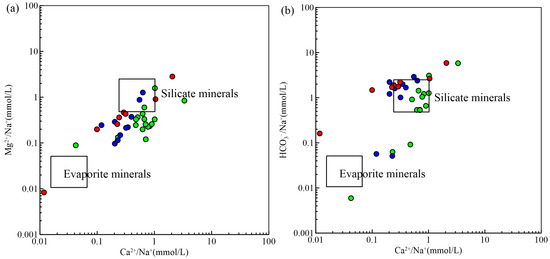
Figure 6.
Diagrams for groundwater samples for (a) Mg2+/Na+ and Ca2+/Na+ and (b) HCO3−/Na+ and Ca2+/Na+. The symbol is the same as Figure 3.
3.5.2. Filtration Effect
The essential minerals in the research area are feldspar, quartz, and clay minerals, followed by calcite, gypsum, dolomite, etc. We utilized PHREEQC to calculate the saturation index (SI) of key minerals to assess their dissolution and precipitation states in groundwater. A positive SI indicates supersaturation, a negative SI suggests undersaturation, and an SI equaling zero signifies equilibrium. As shown in Figure 7, gypsum will dissolve in the groundwater, while calcite and dolomite are basically in a dissolved state in the pore and fissure water. Most of them are in an unsaturated dissolved state in the pore water, and some have precipitated. The lack of a clear pattern in SI with increasing TDS values suggests that calcite, dolomite, and gypsum are not the primary sources of ions in the groundwater. Due to the absence of SiO2 components in this sampling, it is impossible to determine the dissolution precipitation state of silicate minerals. However, referencing data from the Lingbei area of Zhanjiang City, silicate mineral weathering is predominantly in the early stages, with pore and fissure water showing a strong capacity to dissolve silicate minerals compared to pore water [24].
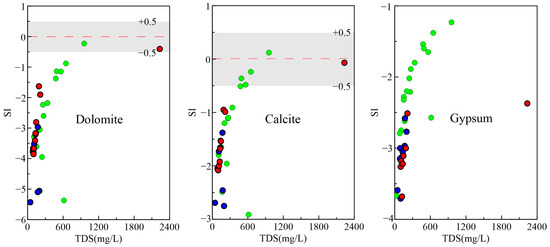
Figure 7.
Relationship between TDS and SI of common minerals in groundwater. The symbol is the same as Figure 3.
Generally, the ratio of various new ion components generated by the interaction between water and rock in groundwater is widely used in the study of many hydrogeochemical problems, which can indicate the leaching effect of water bodies [31]. γ(Na+ + K+)/γCl− serves as an indicator of silicate rock dissolution’s impact on groundwater. Figure 8 indicates that a large number of the groundwater samples exhibit a ratio of γ(Na+ + K+)/γCl− >1, implying a minimal impact from oceanic, atmospheric precipitation and suggesting that the breakdown of silicate minerals, including potassium feldspar and sodium feldspar, is the primary source of excess Na+ and K+. Cation exchange may also contribute to Na+ enrichment.
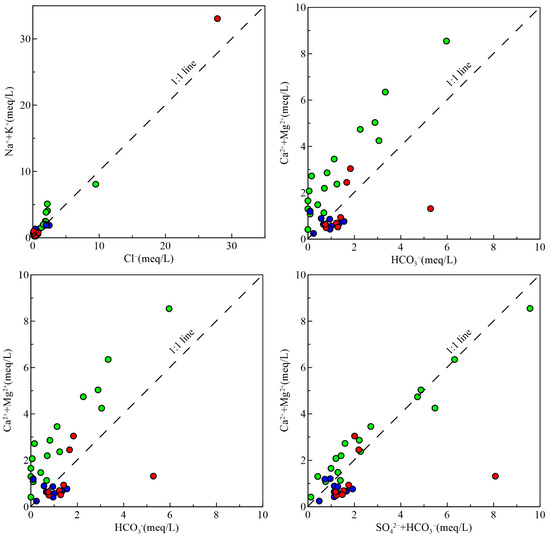
Figure 8.
Major ion ratios of groundwater samples. The symbol is the same as Figure 3.
The relationship between γ(Ca2+ + Mg2+)/γHCO3− and γ(Ca2+ + Mg2+)/γ (HCO3− + SO42−) can further reflect the sources of Ca2+, Mg2+, HCO3−, and SO42− in groundwater [32]. The ratio of Ca2+ + Mg2+/HCO3− in shallow water and fissure water samples is basically over 1, showing excessive Ca2+ and Mg2+, indicating that Ca2+ or Mg2+ also has other sources of calcium and magnesium minerals. Almost all samples of shallow water have a distribution of γ(Ca2+ + Mg2+)/γ(HCO3− + SO42−) close to the 1:1 line, suggesting that the hydrochemical properties of groundwater are affected by the concurrent dissolution of silicate and carbonate minerals. In addition, evaporite minerals (such as gypsum) may also be an important source of SO42− in shallow water [33], and the unsaturated state of gypsum in groundwater also proves this. In addition, human activities could also result in an increase in SO42−. The ratio of γ(Ca2+ + Mg2+)/γ(HC3− + SO42−) and (Ca2+ + Mg2+)/HCO3− in most samples of middle and deep pore water is above 1:1, indicating the dominant role of silicate dissolution or cation exchange, leading to a decrease in Ca2+ content.
γ(Cl− + SO42−)/γ(HCO3−) can indicate the dissolution status of evaporite and carbonate rocks [34]. Shallow water and fissure water, primarily above the 1:1 contour line, show a significant influence of evaporite rock dissolution on their chemical composition. In contrast, middle and deep pore water, mostly below the 1:1 line, suggests a greater contribution of carbonate rock dissolution to the ion content in water.
3.5.3. Evaporative Concentration and Ion Exchange
The influence of groundwater evaporation in Zhanjiang City is significant up to a depth of 4.5 m [35], while deep pore water, situated over 30 m deep, is minimally affected. The possible reason for the high Cl−/(Cl− + HCO3−) ratio in Figure 9 is the hydraulic connection between shallow and deep pore water. Shallow water, significantly impacted by human activities, replenishes deep pore water, increasing Cl− content and exhibiting evaporation and concentration characteristics. The burial depth of shallow water is relatively shallow. According to observation data from 2015, the average burial depth of shallow water is 3.95 m, and it is mainly distributed in the discharge area and nearby, with conditions for evaporation and concentration. CAI−I and CAI−II are used to assess the cation exchange reactions in the groundwater.
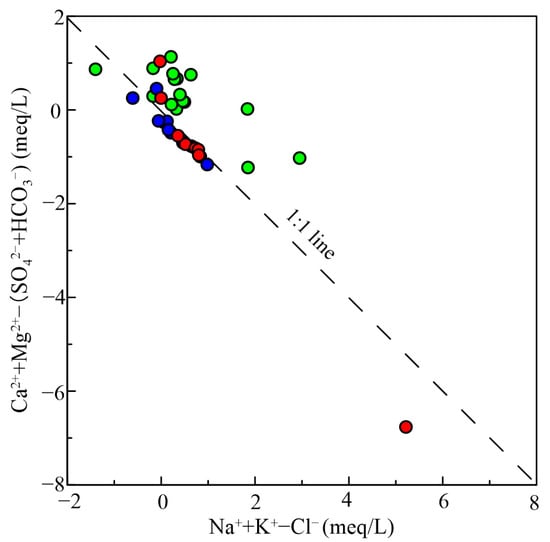
Figure 9.
Comparison between observed and simulated datum of the observation well W1. The symbol is the same as Figure 3.
The study area’s aquifer contains abundant clay minerals, including kaolinite and montmorillonite, with fine particles and strong adsorption capacity of the rock and soil, providing conditions for ion exchange. The milligram equivalent concentration ratio of (Ca2+ + Mg2+) − (HCO3− + SO42−) to Na+ + K+ − Cl− is close to −1 [36], which can verify whether cation exchange is significant [26]. As shown in Figure 7, most samples follow a line with a gradient of −1, while some samples deviate slightly from this line. The chlor alkali index can further identify the direction and degree of ion exchange. When CAI−I and CAI−II are both less than zero, it indicates a positive cation exchange reaction, that is, an increase in Na+ and a decrease in Ca2+ and Mg2+ in groundwater. Conversely, when both are positive values, it shows a reverse cation exchange reaction, that is, an increase in Ca2+ and Mg2+ and a decrease in Na+ in groundwater [37,38]. The majority of samples with CAI−I and CAI−II values below 0, accounting for 82.05% of the total samples, suggest that the groundwater in the study area mainly undergoes positive cation exchange. Among them, ion exchange is particularly evident in the middle and deep pore water, with 88.89% of the samples exhibiting positive alkali exchange. The average value of Na+/Cl− in the middle and deep pore water is 12.46, which is much higher than other types of groundwater. This also shows that ion exchange plays a crucial role in altering the chemical composition of the middle and deep pore water, consistent with previous speculation. In addition, the Gibbs plot shows that the Na+/(Na+ + Ca2+) ratio exceeds the box, which also confirms this point. The samples of shallow water and fissure water account for 75% and 50%, respectively, and the cation exchange effect is not significant.
3.5.4. Impact of Human Activities
The hydrochemical composition of groundwater is not only controlled by natural processes but also influenced by human activities [39]. Industrial development in Zhanjiang City, particularly in steel, petrochemicals, and papermaking, can pollute groundwater through untreated discharge. The urban area’s dense population contributes to domestic pollution, with wastewater and waste discharge increasing. Pesticides and fertilizers are used in rice fields, often near civilian wells. As a result of the shallow depth of the water level in civilian wells (generally 3–5 m deep or 0.5–3 m deep), pesticide and fertilizer components can easily seep into the ground and flow into the wells, polluting groundwater. Zhanjiang City has multiple coastal islands with winding coastlines and developed saltwater aquaculture. The aquaculture wastewater discharged on site will pollute groundwater through surface infiltration, pipeline leakage, and other pathways. The “three wastes”, agricultural fertilization and breeding, and sewage generated from domestic wastewater directly or indirectly pollute groundwater, altering the hydrochemical composition and quality of groundwater, and are also important sources of NO3− (Figure 10). The average NO3− content in shallow water is 21.39 mg/L. Based on the “Groundwater Quality Standards” (GB/T14848-2017) [40], there are three samples with NO3− content exceeding 20 mg/L, all of which are distributed in shallow water with good connectivity to the outside world. Among them, two samples are located in rural areas with industrial impact.
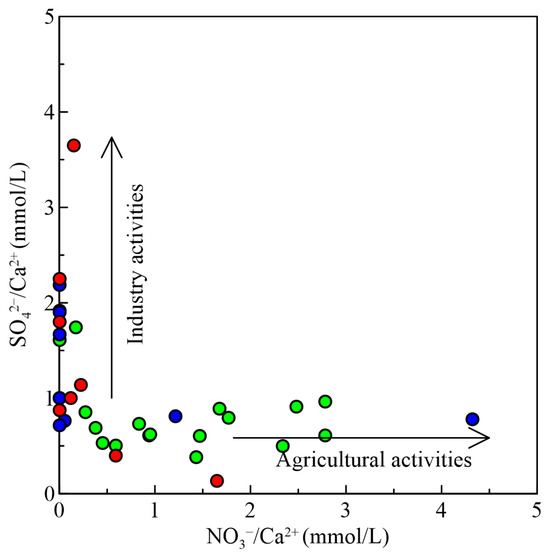
Figure 10.
Relationship between SO42−/Ca2+ and NO3−/Ca2+ in groundwater samples. The symbol is the same as Figure 3.
Long-term extraction of groundwater has resulted in the creation of a depression cone, causing a continuous decrease in water levels, especially in confined middle and deep layers. According to incomplete statistics, the water level elevation of observation wells in the study area decreased by 0.49–13.64 m in 2018 compared to 2004. As the funnel expands, it amplifies the groundwater level disparity between the shallow and deep aquifers while accelerating the flow of shallow sewage within conduits such as weak permeable layers, volcanic vents, and “skylights” with missing aquitards to the underlying aquifer, profoundly changing the hydrochemical environment of the middle and deep water layers.
In coastal areas, where groundwater levels are lower than sea level, seawater intrusion occurs, increasing Cl− content and involving cation exchange where Na+ replaces Ca2+. High-level saltwater aquaculture leakage can cause groundwater salinization, affecting irrigation and drinking water functions and impacting residents’ lives.
4. Conclusions
This article study employs Piper diagrams, Gibbs diagrams, and ion ratio analysis to investigate the chemical properties and influencing factors of groundwater in Zhanjiang City. The essential conclusions are as follows:
- (1)
- Groundwater chemical type and ionic characteristics: The dominant cations and anions in the research area are Na+ and HCO3−, respectively. Shallow water is mainly of Cl•SO4 mixed type, followed by HCO3•ClNa•Ca type, which is influenced by various hydrogeochemical processes and human activities. The hydrochemical types are complex and diverse, with unclear zoning. The middle and deep pore water is mainly composed of HCO3Na type water, followed by HCO3Na•Mg type and HCO3Na•Ca type water, with a significant increase in Na+ content along the groundwater flow direction. The hydrochemical types of pore and fissure water are Cl•HCO3Mg•Na type and Cl•HCO3Na type water. Three samples of shallow water exhibit nitrate-type water, whose NO3− concentration is greatly affected by human activities.
- (2)
- Water–rock interactions and human impact: According to Gibbs, rock leaching predominantly affects the hydrochemical composition of groundwater samples. The proportion of major ions further reveals that the dissolution of silicate minerals and evaporite minerals (such as gypsum) are important in the groundwater chemistry affecting the study area. Cluster analyses further revealed the spatial distribution features of groundwater chemical types, indicating similarities and differences between groundwater samples and suggesting common controlling factors. In addition, the chemical composition of intermediate and deep groundwater is influenced by carbonate mineral dissolution and cation exchange processes. Shallow water and fissure water are to some extent controlled by the dissolution of evaporite minerals, and evaporative concentration contributes significantly to the chemical composition of shallow water.
- (3)
- Groundwater management and optimization of mining practices: Shallow water NO3− is commonly present in the research area, mainly sourced from “three wastes”: agricultural fertilization and breeding and domestic sewage. Human activities have a relatively minor impact on the chemical composition of pore and fissure water. However, the well-developed pore and fissure system in volcanic rocks allows human activities to easily influence the chemical composition of these waters. Additionally, pore water receives lateral recharge from pore and fissure water. Therefore, it is more important to focus on prevention and control. The impact of industrial and mining activities on shallow water is significant, while agricultural activities and domestic sewage cannot be ignored, and the ways and degrees of their impact are complex. The middle and deep pore water is mainly affected by industrial and mining activities. Meanwhile, as groundwater extraction continues, shallow and deep water levels drop.
- (4)
- Perceived threats to groundwater quality: The generally low TDS values indicate that most groundwater samples are of good quality. However, the presence of NO3− in some shallow aquifer samples suggests potential contamination from agricultural and industrial activities. Elevated nitrate levels indicate the use of fertilizers and animal waste in agricultural areas, as well as contributions from mining and industrial zones, particularly in regions with high evaporation rates. To effectively manage groundwater quality, it is essential to monitor additional parameters related to specific human activities, such as heavy metals (Pb, Cd, Hg), organic pollutants (pesticides, volatile organic compounds), and microbial indicators (total coliforms, fecal coliforms). Regular monitoring of these parameters, along with NO3−, will provide a comprehensive understanding of groundwater quality and help guide effective groundwater quality management.
In summary, the results highlight the importance of understanding groundwater chemical processes for effective groundwater quality management and optimization of mining practices. Groundwater mining causes water level changes, seawater intrusion, and high salinity aquaculture leaks, which affect the lives and production of local people. Therefore, comprehending these hydrogeochemical processes is essential for efficient groundwater management and improving mining practices.
Author Contributions
Conceptualization Y.W. and Z.L.; methodology and statistical analysis, J.W. and D.X.; samples collection, L.Z., Y.T. and Y.W.; writing—original draft preparation, Y.W. and J.W.; writing—data analysis and editing, Z.L., J.W. and J.Y. All authors have read and agreed to the published version of the manuscript.
Funding
This research was funded by the project “Monitoring and evaluation of water resources survey in Guangdong Province (0835-220Z52801991)”.
Data Availability Statement
The data used in this study are available upon reasonable request from the first author or corresponding authors.
Conflicts of Interest
The authors declare no conflicts of interest.
References
- Wu, Y.; Luo, Z.; Luo, W.; Ma, T.; Wang, Y. Analysis of the Impact of Urbanization on Shallow Groundwater in Guiyang Region. Saf. Environ. Eng. 2017, 24, 44–58. [Google Scholar]
- Kun, L.; Xing, L.; Jing, L. Analysis of hydrochemical characteristics of groundwater in the Han River zone of the Jianghan Plain. Saf. Environ. Eng. 2020, 27, 1–9+16. [Google Scholar]
- Luan, F.J.; Zhou, J.L.; Jia, R.L.; Lu, C.X.; Bai, M.; Liang, H.T. Groundwater hydrochemical characteristics and genesis in the Balikun Yiwu Basin, Xinjiang. Environ. Chem. 2017, 36, 380–389. [Google Scholar]
- Hu, Y.; Zhang, F.; Niu, Z.; Dong, Z.; Liu, G.; Gao, L. Hydro-chemical characteristics of groundwater in centralized drinking water sources and its quality assessment in northern Anhui Province. J. Univ. Sci. Technol. China 2014, 44, 913–920, 925. [Google Scholar]
- Sun, C.; Chen, R.; Zhang, Z.; Li, W.; Chen, W. Temporal and spatial variation of hydrochemical characteristics of shallow groundwater in Shanxi Province. Arid. Land Geogr. 2018, 41, 314–324. [Google Scholar]
- Huang, G.; Liu, C.; Sun, J.; Zhang, M.; Jing, J.; Li, L. A regional scale investigation on factors controlling the groundwater chemistry of various aquifers in a rapidly urbanized area: A case study of the Pearl River Delta. Sci. Total Environ. 2018, 625, 510–518. [Google Scholar] [CrossRef]
- Zhang, Y.; Xu, M.; Li, X.; Qi, J.; Zhang, Q.; Guo, J.; Yu, L.; Zhao, R. Hydrochemical Characteristics and Multivariate Statistical Analysis of Natural Water System: A Case Study in Kangding County, Southwestern China. Water 2018, 10, 80. [Google Scholar] [CrossRef]
- Bam, E.K.P.; Bansah, S. Groundwater chemistry and isotopes reveal vulnerability of granitic aquifer in the White Volta River watershed, West Africa. Appl. Geochem. 2020, 119, 104662. [Google Scholar] [CrossRef]
- Ruiz-Pico, Á.; Pérez-Cuenca, Á.; Serrano-Agila, R.; Maza-Criollo, D.; Leiva-Piedra, J.; Salazar-Campos, J. Hydrochemical characterization of groundwater in the Loja Basin (Ecuador). Appl. Geochem. 2019, 104, 1–9. [Google Scholar] [CrossRef]
- Barzegar, R.; Asghari Moghaddam, A.; Tziritis, E.; Adamowski, J.; Bou Nassar, J.; Noori, M.; Aalami, M.T.; Kazemian, N. Exploring the hydrogeochemical evolution of cold and thermal waters in the Sarein-Nir area, Iran using stable isotopes (δ18O and δD), geothermometry and multivariate statistical approaches. Geothermics 2020, 85, 101815. [Google Scholar] [CrossRef]
- Singh, C.K.; Kumar, A.; Shashtri, S.; Kumar, A.; Kumar, P.; Mallick, J. Multivariate statistical analysis and geochemical modeling for geochemical assessment of groundwater of Delhi, India. J. Geochem. Explor. 2017, 175, 59–71. [Google Scholar] [CrossRef]
- Kazakis, N.; Mattas, C.; Pavlou, A.; Patrikaki, O.; Voudouris, K. Multivariate statistical analysis for the assessment of groundwater quality under different hydrogeological regimes. Environ. Earth Sci. 2017, 76, 349. [Google Scholar] [CrossRef]
- Bindal, S.; Singh, C.K. Predicting groundwater arsenic contamination: Regions at risk in highest populated state of India. Water Res. 2019, 159, 65–76. [Google Scholar] [CrossRef] [PubMed]
- Zhang, B.; Li, M.; Li, W.; Zhengwen, J.; Khan, U.; Wang, L.; Wang, F.-Y. Machine learning strategies for lithostratigraphic classification based on geochemical sampling data—A case study in area of Chahanwusu River, Qinghai Province, China. J. Cent. South Univ. 2021, 28, 1422–1447. [Google Scholar] [CrossRef]
- He, S.F.; Cheng, Y.C.; Xie, H.; An, Y.Q.; Jiang, C.L.; Zheng, L. Hydrochemical characteristics and genesis analysis of limestone groundwater in Panxie mining area. Energy Environ. Prot. 2020, 34, 37–43. [Google Scholar]
- Rong, Z.; Zhongmei, W.; Xiangyang, Z. Analysis of hydrochemical characteristics and influencing factors of karst groundwater in Yangchang River Basin. Saf. Environ. Eng. 2019, 26, 15–20. [Google Scholar]
- Romshoo, S.A.; Dar, R.A.; Murtaza, K.O.; Rashid, I.; Dar, F.A. Hydrochemical characterization and pollution assessment of groundwater in Jammu Siwaliks, India. Environ. Monit. Assess. 2017, 189, 122. [Google Scholar] [CrossRef]
- Tang, J.P.; Zhang, Q.; Hu, Y.; Zhang, Y.; Nie, B.W. Groundwater Chemical Characteristics and Analysis of Their Controlling Factors in an Alluvial Fan of Jianjiang River. Huan Jing Ke Xue = Huanjing Kexue 2019, 40, 3089–3098. [Google Scholar]
- El Alfy, M.; Lashin, A.; Abdalla, F.; Al-Bassam, A. Assessing the hydrogeochemical processes affecting groundwater pollution in arid areas using an integration of geochemical equilibrium and multivariate statistical techniques. Environ. Pollut. 2017, 229, 760–770. [Google Scholar] [CrossRef]
- Jing, L. Characteristics and Potential Assessment of Groundwater Resources in Leizhou Peninsula. East China Geol. 2018, 39, 299–304. [Google Scholar]
- Jinmei, Y.; Xun, Z.; Juan, L.; Wenyu, D.; Hong, K.X. Hydrogeochemical characteristics and evolution simulation of groundwater in basalts on the Leizhou Peninsula, Guangdong China. Geol. Bull. China 2007, 26, 323–344. [Google Scholar]
- Xiangqing, H.; Huayang, G.; Jianfei, L.; Shunzhi, Z.; Yi, P. Changes in chemical elements of groundwater along the coast of East China Island in Leizhou Bay and the status of water quality. Proc. Water Resour. Water Eng. 2013, 24, 59–65. [Google Scholar]
- Yanyan, L. Groundwater Chemistry and Availability in Typical Coastal Areas of Zhanjiang City and Hainan Island; South China University of Technology: Guangzhou, China, 2016. [Google Scholar]
- Hongxin, Z.; Ya, W.; Yunyu, L.; Wen, C.; Huaiqing, L. Hydrogeochemical characteristics of groundwater in Lingbei area of Zhanjiang City. Environ. Sci. 2020, 41, 4924–4935. [Google Scholar]
- Min, Z.; Ke, P.; Jun, H.; Xinwen, Z.; Shuangxi, C.; Fengmei, L. Study on groundwater environmental characteristics in eastern Zhanjiang City. Undergr. Water 2018, 40, 17–20+116. [Google Scholar]
- Wangqiong, Z. Optimal design of underground water monitoring network in Zhanjiang City. Saf. Environ. Eng. 2017, 24, 95–99. [Google Scholar]
- Lei, L.; Jiangtao, H.; Cong, P.; Zhenguo, W.; Lei, W. Study on visual background values of subsurface components: A case study of Liujiang basin. Front. Geosci. 2018, 25, 267–275. [Google Scholar]
- Xiaoli, L.; Jingtao, L.; Zhantao, H.; Liang, Z.; Yuxi, Z. Geochemical Characteristics and Driving Factors of NO3- Type Groundwater in the Rapidly Urbanizing Pearl River Delta. Environ. Sci. 2021, 42, 4761–4771. [Google Scholar]
- Gibbs, R.J. Mechanisms controlling world water chemistry. Science 1970, 170, 1088–1090. [Google Scholar] [CrossRef]
- Songtao, L.; Dong, Z.; Yuhong, L.; Jinmei, Y.; Shuang, Z.; Yongtao, W.; Xingyu, H.; Zhongyi, Z.; Wei, Y.; Baojun, J. River Source and Control Factors of Hydrochemical Composition in Yiluo River Basin. Huanjing Sci. 2020, 41, 1184–1196. [Google Scholar]
- Jiaqi, C.; Xianyue, L.; Haibin, S.; Yanan, S.; Haijun, A.; Jinping, X. Evolution characteristics and formation mechanism of groundwater chemistry in Hetao irrigation area. Huanjing Sci. 2020, 41, 4011–4020. [Google Scholar]
- Li, C.; Gao, X.; Wang, Y. Hydrogeochemistry of high-fluoride groundwater at Yuncheng Basin, northern China. Sci. Total Environ. 2015, 508, 155–165. [Google Scholar] [CrossRef] [PubMed]
- Wang, L.; Dong, Y.; Xu, Z.; Qiao, X. Hydrochemical and isotopic characteristics of groundwater in the northeastern Tennger Desert, northern China. Hydrogeol. J. 2017, 25, 2363–2375. [Google Scholar] [CrossRef]
- Huiya, L.; Qi, F.; Lijuan, C.; Yu, Z.; Huaide, Y. Chemical characteristics and evolution driving mechanism of groundwater in Minqin oasis irrigation area. Res. Arid. Zone 2017, 34, 733–740. [Google Scholar]
- Hanzhong, W. Study on Groundwater Cycle and Rational Exploitation and Utilization in Zhanjiang City; China University of Geosciences: Wuhan, China, 2013. [Google Scholar]
- Bello, M.; Ketchemen-Tandia, B.; Nlend, B.; Huneau, F.; Fouepe, A.; Fantong, W.Y.; Boum-Nkot, S.N.; Garel, E.; Celle-Jeanton, H. Shallow groundwater quality evolution after 20years of exploitation in the southern Lake Chad: Hydrochemistry and stable isotopes survey in the far north of Cameroon. Environ. Earth Sci. 2019, 78, 1–19. [Google Scholar] [CrossRef]
- Zhang, J.W.; Liang, X.; Jin, M.G.; Ma, T.; Mindeng, Y.; Ma, B. Identifying the groundwater flow systems in a condensed river-network interfluve between the Han River and Yangtze River (China) using hydrogeochemical indicators. Hydrogeol. J. 2019, 27, 1–16. [Google Scholar] [CrossRef]
- Worrall, F.; Howden, N.J.K.; Burt, T.P. Evidence for nitrogen accumulation: The total nitrogen budget of the terrestrial biosphere of a lowland agricultural catchment. Biogeochemistry 2015, 123, 411–428. [Google Scholar] [CrossRef]
- Tao, Z.; Jin, H.; Jingjie, L.; Yuetin, C.; Lei, G.; Jinwei, L.; Chao, B.; Yuemei, C. Chemical characteristics and controlling factors of groundwater in the Hamatong River Basin. Environ. Sci. 2018, 39, 4981–4989. [Google Scholar]
- GB/T 14848-2017; Groundwater Quality Standard. China Standards Press: Beijing, China, 2017.
Disclaimer/Publisher’s Note: The statements, opinions and data contained in all publications are solely those of the individual author(s) and contributor(s) and not of MDPI and/or the editor(s). MDPI and/or the editor(s) disclaim responsibility for any injury to people or property resulting from any ideas, methods, instructions or products referred to in the content. |
© 2025 by the authors. Licensee MDPI, Basel, Switzerland. This article is an open access article distributed under the terms and conditions of the Creative Commons Attribution (CC BY) license (https://creativecommons.org/licenses/by/4.0/).