Article

A Risk Assessment of Water Inrush in Deep Mining in Metal Mines Based on the Coupling Methods of the Analytic Hierarchy Process and Entropy Weight Method: A Case Study of the Huize Lead–Zinc Mine in Northeastern Yunnan, China

1
Yunnan Chihong Zn & Ge Co., Ltd., Qujing 655000, China
2
North China Engineering Investigation Institute Co., Ltd., Shijiazhuang 050021, China
3
Technology Innovation Center for Groundwater Disaster Prevention and Control Engineering for Metal Mines Ministry of Natural Resources, Shijiazhuang 050021, China
4
School of Urban Geology and Engineering, Hebei GEO University, Shijiazhuang 050031, China
5
Key Laboratory of Intelligent Detection and Equipment for Underground Space of Beijing-Tianjin-Hebei Urban Agglomeration, Shijiazhuang 050031, China
6
Hebei Technology Innovation Center for Intelligent Development and Control of Underground Built Environment, Shijiazhuang 050031, China
*
Author to whom correspondence should be addressed.
Water 2025, 17(5), 643; https://doi.org/10.3390/w17050643
Submission received: 11 January 2025 / Revised: 14 February 2025 / Accepted: 21 February 2025 / Published: 22 February 2025
(This article belongs to the Section Hydrogeology)

Abstract

:
Deep mining in metal mines faces more and more complex geological conditions, such as “three highs and one disturbance” (high ground stress, high permeability, high temperature, and mining-induced disturbance), which can easily trigger water inrush disasters and seriously affect the safety and efficiency of deep mining. This paper focuses on the deep hydrogeological structural characteristics of the Huize lead–zinc mine. Firstly, two main factors affecting the production safety of the mining area, namely the water source and water channel of the mine, were analyzed. Based on this analysis, nine factors were determined as indicators for the risk assessment of water inrush, including the water head difference, water-bearing capacity, permeability coefficient, aquifer thickness, water pressure, fault type, fault scale, fault water conductivity, and karst zoning characteristics. Then, a water inrush risk assessment model for the deep mine was constructed, and the weights of the individual factors were determined using the analytic hierarchy process (AHP) and entropy weight method (EWM). Combined with the multi-factor spatial fitting function of the GIS, a zoning map of the risk assessment of water inrush was developed. The results showed that the aquifer groups of the Permian Liangshan Formation and the Carboniferous Maping Formation (P1l + C3m) were relatively safe, whereas the karst fissure aquifer of the Qixia–Maokou Formation (P1q + m) posed a high risk of water inrush, necessitating advanced exploration and water drainage in the area. These findings provide guidance for water control measures in the Huize lead–zinc mine and offer valuable insights into the prediction and prevention of mine water hazards associated with ore body mining in karst aquifers.

1. Introduction

China has become the world’s largest producer of lead and zinc, accounting for over 40% of global output. The largest deposits in China are found in the Yunnan–Sichuan–Guizhou lead–zinc triangle in southwest China [1]. These lead–zinc deposits are mainly composed of Carboniferous and Devonian carbonate formations and belong to karst aquifers with complex hydrogeological conditions. As mine development and construction gradually deepen and mining depth increases, some development systems have been pushed lower than the minimum base level of erosion, leading to a significant increase in pit water inflow, high head pressure of the surrounding rock, and complicated hydrogeological conditions in mining areas. High-pressure groundwater may induce a series of problems, such as the increase in sudden engineering disasters and serious accidents, the deterioration of the working environment, and hindrance to the improvement in production capacity and the full recovery of mineral resources. Therefore, to ensure the safe and efficient mining of deep resources, it is urgent to evaluate the risk of water inrush in lead–zinc mines from the perspective of deep hydrogeological structure theory.
The risk assessment of water inrush prior to the process of deep mining is an important link in mine safety production [2,3,4,5,6]. Many scholars have applied model experiments, numerical simulations, and mathematical methods to the risk assessment of water inrush in mines [7,8,9]. Wu et al. [10,11] and Zeng et al. [12] introduced the “three-map dual prediction method” for assessing the risk of roof water inrush. Li et al. [13] proposed a vulnerability index method combining the GIS (geographic information system) with mathematical methods. Niu et al. [14] utilized the linear weighting method to develop an improved water inrush coefficient model for assessing the risk of water inrush from the coal seam floor. With the more complex hydrogeological conditions, the greater number of factors that need to be considered, and both qualitative and quantitative factors, various comprehensive evaluation methods, as well as methods for determining weights, are also widely used [15,16,17,18]. Ju and Hu [19] combined the principal component analysis (PCA) method and gray situation decision method to study the water inrush risk in the Xieqiao coal mine. Zhang et al. [20] established a BP neural network model based on PCA and a depth confidence network to assess the risk of water inrush in an actual working face. Li et al. [21] proposed a novel water inrush risk index evaluation model based on PCA, and criteria importance through the inter-criteria correlation and a technique for order preference by similarity to an ideal solution, and evaluated the water inrush risk of coal mining associated with confined water in the Xinyugou coal mine. Hu et al. [22] combined the AHP and EWM to build a water inrush prediction model to assess the risk of water inrush at a certain working face in the Qiuji coal mine. Li and Sui [23] proposed the method of evaluating the risk of floor water inrush using principal component logistic regression analysis and an improved analytic hierarchy process to validate a case study at the Yangcheng coal mine.
The above methods have indeed made certain contributions to evaluating water inrush in coal mines, yet they are seldom applied in metal mines. Since metal deposits are typically found in karst formations, the geological and hydrogeological characteristics of these formations are more intricate than those of normal formations [24,25,26,27], which make the risk assessment of water inrush in metal mines more challenging. The application of Monte Carlo (MC) simulations for evaluating risk assessment performance was demonstrated in [28,29]. Yuan et al. [30,31] systematically identified the main disaster risk caused by water inrush faced by deep mining at the Maoping lead–zinc mine and carried out a quantitative evaluation of water inrush risk after fusing multi-source geological data through the constructed AHP evaluation model. Sun et al. [32] built an AHP-EWM-coupled comprehensive evaluation model of water inrush risk, which took into account seven water inrush evaluation indexes, and this provides a valuable reference for the formulation of water control schemes in deep mining. Li et al. [33] used a water abundance evaluation method based on the improved fuzzy analytic hierarchy process and EWM to solve the problem of unclear water abundance in karst aquifers in deep ore body mining.
Due to the complicated geological structure and well-developed karst aquifers in the Huize lead–zinc mine, deep mining faces a complex mining environment characterized by high pressure and significant water inrush risks, posing a serious threat to mining safety. Based on the characteristics of the deep hydrogeological structure of the Huize lead–zinc mine, an evaluation factor system for water inrush was subsequently established, integrating multi-source information from the mine. The AHP and EWM were then applied to determine the subjective weight and objective weight, respectively. The risk zones of water inrush were identified by combining these weights with the corresponding evaluation factors. The results offer valuable support for the prediction and prevention of mine water hazards of ore body mining in a karst aquifer.

2. Geological Background

The Huize lead–zinc mine is located in Qujing, Yunnan, China (Figure 1a). This area has undergone multiple stages of geological tectonic movements, and the NS (north–south)-trending faults are extremely developed. The major faults in the mining area are primarily the Kuangshanchang thrust fault, Dongtou fault, and F5 fault, followed by the fault fracture zone, as shown in Figure 1b. Due to their weak water permeability, the Kuangshanchang thrust fault and Dongtou fault fracture zone can be regarded as relatively impermeable faults. The F5 fault has a certain degree of water-richness and water-conductivity. Although the fault fracture zone often contains a certain amount of groundwater, its communication with the periphery is poor, and the development scale is limited. After being exposed at a depth of 1274 m, it is basically drained within a short period of time, having little impact on the water filling of the deposit.
The exposed strata in the mining area are shown in Table 1. It is noted that the exposed strata are mainly limestone and dolomite, which are controlled by topographic factors and have strong karst development. The strongest karst development strata are the Qixia–Maokou Formation (P1q + m) and Carboniferous Datang Formation (C1d), which are mainly characterized by a large dissolved trough, dissolved trench, stone bud, depression, and funnel. The Devonian Zaige Formation (D3zg), Carboniferous Baizuo Formation (C1b) and Carboniferous Weining Formation (C2w) are medium karst formations. The main development of the groove is a groove, hole, small groove, spherical stone bud, and so on. The remaining Carboniferous Maping Formation (C3m) and Sinian Dengying Formation (Z2dn), as well as the Doushantuo Formation (Z2d), are weak rock karst developments due to poor water permeability. The Lower Carboniferous Baizuo Formation (C1b) is the main host rocks for lead and zinc in the mining area. The occurrence of the ore body is basically the same as that of the surrounding rock, the strike is 5~25°, the inclination is 60~70°, and the ore body is like a sac, flat column, and vein. The strike length of the ore body is about 800~1600 m, the vertical extension is more than 800~1100 m, and the thickness of the ore body varies between 0.7 and ~40 m.
The deep underground aquifers of the Huize lead–zinc mine consists of three karst fissure aquifers and two relative aquifuges, and the mining of the underground water system is shaped like a “sandwich”, as shown in Figure 2. The direct water-filling aquifer is the Carboniferous and Devonian karst fissure aquifers with weak to moderate water-bearing capacities. According to the results of pumping tests conducted in boreholes, the minimum and maximum unit water inflow rates of this aquifer are 0.025 L/s·m and 0.238 L/s·m, respectively. The permeability coefficients vary from a minimum of 0.0175 m/d to a maximum of 0.067 m/d. Permian Qixia–Maokou karst fissure aquifers exhibit moderate water abundance overall, with a locally stronger water abundance and higher water pressure. During drilling operations conducted in the middle section, the water inflow rate of this aquifer was revealed to be merely 0.79 m³/h, while the head pressure reached as high as 1.40 MPa. The Sinian karst fissure exhibits a moderate water abundance overall and possesses high-water-pressure characteristics. According to the results of borehole drainage tests, the unit water inflow rate of this aquifer is 0.222 L/s·m, with an average permeability coefficient of 0.067 m/d. And the head pressure reaches approximately 1.28 MPa. In addition, the main aquifuges in the mining area include the Permian Liangshan and Carboniferous Maping formations and the Devonian Haikou and Cambrian Qiongzhusi formations. Affected by tectonic action, the water-bearing zone of the structural fissure in the NW direction may make the three aquifers have a certain connection.
The lowest elevation of exploration depth in the mining area is 894 m, which is below the lowest base level of erosion. The normal water inflow at the level of 1094~524 m in the mine plant is 28,669~32,616 m3/d. To ensure production safety, the method of dewatering and leaving a safe pillar against water-inrush is adopted to ensure production safety. With the continuous deepening of mining operations downwards, the head pressure of the surrounding rock of the ore body and the water inflow of the mine increase significantly, which not only requires considerable drainage costs, but also greatly worsens the underground working environment and increases the risk of water inrush disasters.

3. Methods

3.1. AHP

The AHP is a practical multi-criteria decision-making method that serves as an analytic tool for addressing complex problems involving multiple interrelated objectives, even when prioritizing them is challenging. This method enables the determination of the weight of each criterion through the comparison of their relative significance and appropriateness. The specific steps are as follows:
The first step is to establish a hierarchical structure model. This involves transforming the decision-making problem into a hierarchical structure and establishing the hierarchical levels of the goal. Typically, this structure is divided into several hierarchical levels including the target level, criterion level, and indicator level. The target level is the top-most level and represents the overall objective or goal of the decision-making process. The criterion level contains the various factors or criteria that are relevant to achieving the goal defined in the target level. These criteria should be comprehensive and cover all important aspects of the decision-making problem. The indicator level is an optional level that can be used to further break down the criteria into more specific indicators or sub-factors. This level helps in refining the evaluation and making it more detailed.
The second step is to build a decision judgment matrix. According to the regional engineering geological conditions and expert opinions, to determine the importance of each factor related to the target layer, a nine-point scale (1–9) is adopted for comparison, as shown in Table 2, where 1 indicates equal importance, 3 indicates slight importance, 5 indicates moderate importance, 7 indicates strong importance, 9 indicates extreme importance, and 2, 4, 6, and 8 indicate intermediate values. The elements in the judgment matrix represent the results of pairwise comparisons.
The third step is to determine the weight of each criterion by calculating the principal eigenvector of the matrix and the corresponding normalized eigenvalue. Firstly, normalization is carried out on the matrix built in the second step. Normalization involves dividing each element in the matrix by the sum of the elements in its respective column. This results in a new matrix where each column sums to 1. Then, the average of each row in the normalized matrix is calculated. This will give a vector of weights for each criterion. The vector obtained in the previous step may not sum to 1, so it needs to be normalized again. This is performed by dividing each element in the vector by the sum of all elements in the vector. The resulting vector is the final weight vector, representing the relative importance of each criterion.
The fourth step is to calculate the consistency of the results. To ensure the accuracy of the obtained weights, it is necessary to evaluate the consistency of the n-order matrix by calculating the consistency ratio (CR), which is computed using Equation (1).
C R = ( λ max n ) / ( n 1 ) R I
where λmax is the largest principal eigenvalue of the matrix and n is the order of the matrix. RI is the random matrix corresponding to the matrix order, which is listed in Table 3. When CR < 0.1, it is considered that the constructed matrix is reasonable; otherwise, appropriate correction should be made.

3.2. EWM

The EWM is an objective weighting method. The principle of the EWM is to determine the objective weight according to the variability in the factors. The variation degree of an index inversely correlates with its information content. The smaller the variation degree of the factor, the less information it reflects, resulting in a smaller information entropy and a greater weight in the system. There are three general steps involved in the EWM, which are described below.
The first step is to construct the evaluation matrix. It is assumed that m evaluation objects and n evaluation factors constitute the original data matrix X.
X = ( x i j ) m × n   ( i = 1 , 2 , m ;   j = 1 , 2 , n )
where xij is the evaluation value of the j-th evaluation factor under the i-th evaluation object.
The second step is to obtain the standard value of each evaluation factor for the corresponding evaluation objects using Equation (3).
p i j = x i j i = 1 n x i j
The third step involves calculating the entropy Ej by Equation (4).
E j = 1 ln ( m ) i = 1 n p i j ln ( p i j )
Subsequently, the entropy weight of the evaluation factors is calculated using Equation (5).
w j = ( 1 E j ) j = 1 m ( 1 E j )
where wj is the objective weight of each evaluation factor.

3.3. AHP-EWM Comprehensive Weights

The AHP evaluation model derives the subjective weight of the evaluation factors, whereas the EWM evaluation model determines objective weight. To avoid deviations arising from individual calculations, the combined weighting method is employed to comprehensively analyze the weights obtained by both the AHP and EWM. The weight value combines the advantages of both the AHP and EWM, providing a more precise alignment with the actual situation.
The comprehensive weight can be calculated using Equation (6).
W j = w 1 j w 2 j j = 1 n w 1 j w 2 j
where Wj represents the comprehensive weight of the j-th evaluation factor; w1j represents the subjective weight of the j-th evaluation factor derived from the AHP; and w2j represents the objective weight of the j-th evaluation factor derived from the EWM.

3.4. Determination of Water Inrush Evaluation Factors

The selection of evaluation factors is the first and crucial step for the risk assessment of water inrush in deep mining, as factors serve as the informational carriers for calculating the weight of evaluation objects.
According to the data of the study area, the 1274 m level of the mining plant is located deep within the mine, with its surface water bodies situated approximately 3300 m away from the mining plant, exhibiting no direct hydraulic connection with the karst fissure waters of the mining plant. Analysis of the relationship curve between water inflow dynamics in the mine pit and precipitation over the years reveals that inter-annual variations in precipitation have minimal impacts on groundwater dynamics. Therefore, the selection of factors for water inrush evaluation primarily considered aquifer factors, rock factors, and structural factors.
The water inrush risk assessment was taken as the target layer of the hierarchical structure. The core of water filling conditions in mining areas can be summarized in two aspects, the water source and water channel, which were defined as the criterion layer. Aquifer factors, such as the water head difference, water-bearing capacity, permeability coefficient, aquifer thickness, and water pressure, are the main reasons leading to water inrush and were the primary concern in the risk assessment. The water head difference between karst fissure aquifers in the indirect roof of the ore deposit and the direct aquifer is a key factor threatening the safety of mines. The greater the water head difference, the more intense the water head pressure exerted on the aquifer, thereby increasing the probability of water inrush disasters. In the deep mining of the Huize lead–zinc mine, there exist three carbonate karst fissure aquifers with extremely uneven water-richness. The water-bearing capacity directly correlates with the amount of water that will burst out during water inrush. Additionally, the permeability coefficient and aquifer thickness are important factors that cannot be ignored in influencing the aquifer water-richness. High water pressure is a prerequisite for water inrush, and an increase in water pressure will promote the initiation and propagation of fissures, further exacerbating the instability of surrounding rocks, and increase the difficulty of the prevention, control, and treatment of water inrush disasters.
Based on the water inrush cases observed in surrounding mining areas, the majority of water inrush incidents occur in the vicinity of fault structures. This indicates a close correlation between the water-conducting properties of faults and water inrush in mineral deposits, often being the primary factor determining whether water inrush will occur in a mineral deposit. In addition, most of the aquifers in mining areas are karst fissure aquifers, and the degree of karst development directly affects the water conductivity of these aquifers. Therefore, the water channel factors set included the fault type, fault scale, fault water conductivity, and karst zoning characteristics. Thus, the hierarchical structure model is shown in Figure 3.

3.5. Quantification of the Evaluation Factor

Given the substantial variability in hydrogeological conditions across different mining regions, a standardized classification system specifically tailored for water inrush risk assessment has yet to be established. Currently, most classifications rely on the analysis and interpretation of field data collected from individual mining areas [34]. Based on the actual exploration data from the Huize mine, the grading standards of each evaluation index are shown in Table 4. The distribution range of each evaluation factor is divided into four grades, I, II, III, and IV, and the risk level increases in order.
(1) Water head difference. The greater the head difference, the greater the head pressure on the aquifer, and the higher the possibility of water inrush. Figure 4a shows thematic layer maps of the water head difference between the aquifer and the aquifuge. Note that the direct aquifers of the Permian Qixia–Maokou Formation and Sinian system are strong aquifers with a high water head. The overlying Liangshan Formation and Maping Formation have better water barrier effects, resulting in a large difference in water head. Once the overlying aquifuge is pierced, the risk of water inrush of the ore beds will be greatly increased.
(2) Water-bearing capacity. The aquifers are affected by formation lithology, structure, recharge source, and other factors, and the water-bearing capacity of the aquifer is extremely uneven, as shown in Figure 4b. The red area is the Permian Qixia–Maokou Formation (P1q + m), which indicates a higher risk level. The green area is the relative water barrier group composed of the Permian Liangshan Formation and the Carboniferous Maping Formation (P1l + C3m), which would prevent the karst fissure water of the P1q+m Formation from overlying the ore beds. The yellow area is the Carboniferous Weining Formation, Baizuo Formation, Datang Formation, and Devonian Zaige Formation (C1b + C1d + C2w + D3zg), which constitute a karst fissure aquifer with good water permeability and strong water-bearing capacity.
(3) Hydraulic conductivity. Hydraulic conductivity is a quantitative indicator of the rock’s ability to permit water. Figure 4c shows a thematic map of hydraulic conductivity. The hydraulic conductivity of the Sinian karst fissure aquifer is large. The hydraulic conductivity in Carboniferous Devonian aquifers gradually decreases with depth, which reflects the gradual weakening of permeability of deep aquifers in ore beds.
(4) Aquifer thickness. Figure 4d shows a thematic map of the thickness of the aquifer, which is an inverse factor for safe mining. The Permian Qixia–Maokou Formation (P1q + m) is the main aquifer in the mining area. The yellow area is mainly composed of the rock layer of the Carboniferous Weining Formation, Baizuo Formation, Datang Formation, and Devonian Zaige Formation (C1b + C1d + C2w + D3zg), which is the direct water-filling aquifer of the deposit. The thickness of the two aquifers in the mine is 240~406 m. These two aquifers are the main aquifers in the mine area, and due to their large thickness, the probability of water inrush is high.
(5) Water pressure. The high water pressure in underground engineering will cause water inrush, as the rise in water pressure in the rock mass will cause fracture initiation and expansion. In addition, high water pressure will migrate and widen the water inrush channel, and increase the instability of the surrounding rock and the difficulty of water inrush prevention and control. According to data on the water pressure obtained from the drilling dewatering test, thematic maps of the specific water pressure are shown in Figure 4e.
(6) Fault type. Faults can be classified into three types: normal faults, reverse faults, and strike-slip faults. Normal faults are formed due to tensile forces and gravitational effects, and they are generally water-conducting faults. Reverse faults are formed by horizontal compression and are typically water-resisting faults. And large strike-slip faults are often accompanied by intense zones of fragmentation, brecciation, or mylonitization. There are numerous NW-trending faults exposed in the 1274 m middle section of the mine area. These faults are mainly torsional and tension-torsional, and their development is extremely uneven in the strike direction and vertical direction. Figure 4f shows the risk grading map of fault types according to the effluent condition. The red area, located near the F5, F9, and F10 faults in the middle section of 1274, indicates that the nearby area (red area) has a high risk and is potentially susceptible to water inrush.
(7) Fault scale: The scale of the fault significantly influences the regional geological conditions, and also has a considerable impact on water inrush in mining areas. Quantitative analysis is carried out using the size of the fault offset. Figure 4g shows the thematic map of fault scale. In the red area, there is a large fault with a fault distance greater than 2 m, which extends to the depth of the mining area.
(8) Fault water conductivity. Based on occurrences of water inrush in mineral deposits, the water conductivity of faults is closely related to the water inrush in the ore beds and often becomes the main factor determining whether water inrush will occur in the ore beds. The thematic map of fault water conductivity is shown in Figure 4h. Note that the red area is the convergence zone of multiple faults. In this convergence zone, the strata are relatively fractured, and the faults are interconnected, resulting in strong water conductivity, and thus the probability of water inrush is relatively high. Conversely, the green area has less fault development and represents a lower risk zone.
(9) Karst zoning characteristics. Most aquifers in mining areas are karst fissure aquifers, and the degree of karst development will affect the water conductivity of the aquifers. The saturation index (SI) was used to grade the degree of karst development. Typically, the more negative the value of SI, the more intense the karst development. Based on the hydro-chemical data analysis of the mining area, the values of SI from the aquifer samples range from 0.02 to −1.26. The thematic map of karst zoning characteristics is shown in Figure 4i. The red area indicates a hazardous zone with a significantly negative SI value, signifying strong karst development. This hazardous zone is located near the excavation roadway, posing a high risk of potential water inrush.

4. Results and Discussion

4.1. Subjective Weight Calculation Based on AHP

According to the established hierarchical structure, the judgment matrix is constructed and the consistency test is carried out. The corresponding weight values under each hierarchical structure can be obtained through calculation, as shown in Table 5. In the criterion layer of the hierarchical structure model, the weights of water source B1 and water channel B2 are the same, reflecting that the influence of water inrush source and channel on water inrush is equally important. In index layer C, the weights for the water head difference (C1), water-bearing capacity (C2), hydraulic conductivity (C3), aquifer thickness (C4), and water pressure (C5) are 0.18605, 0.05525, 0.10435, 0.09085, and 0.0635, respectively. Additionally, the calculated weights for fault type (C6), fault scale (C7), fault water conductivity (C8), and karst zoning (C9) are 0.17035, 0.14325, 0.08515, and 0.1013, respectively. The order of importance is C1 > C6 > C7 > C3 > C9 > C4 > C8 > C5 > C2. Note that the water head difference, fault type, and fault scale are the three most important indicators that influence the risk of water inrush in mines.

4.2. Objective Weight Calculation Based on EWM

The entropy weight is calculated by the EWM based on the data collected from the study area. The calculation results for the study area are shown in Figure 5. The weights for various factors are as follows: water head difference C1 (0.0875), water-bearing capacity C2 (0.1379), hydraulic conductivity C3 (0.1047), aquifer thickness C4 (0.1221), water pressure C5 (0.1225), fault type C6 (0.1024), fault scale C7 (0.0996), fault water conductivity C8 (0.1132), and karst zoning C9 (0.1101). The results indicate that the range of entropy weight is from 0.0875 to 0.1379. The smallest entropy weight is the water head difference C1, and the largest entropy weight is water-bearing capacity C2.

4.3. Comprehensive Weight Determination

The comprehensive weights calculated by Equation (6) are shown in Table 6. The factors that most significantly influence the risk of water inrush in mines are the fault type, water head difference, and fault scale. These results are largely consistent with the subjective evaluation results of the AHP.

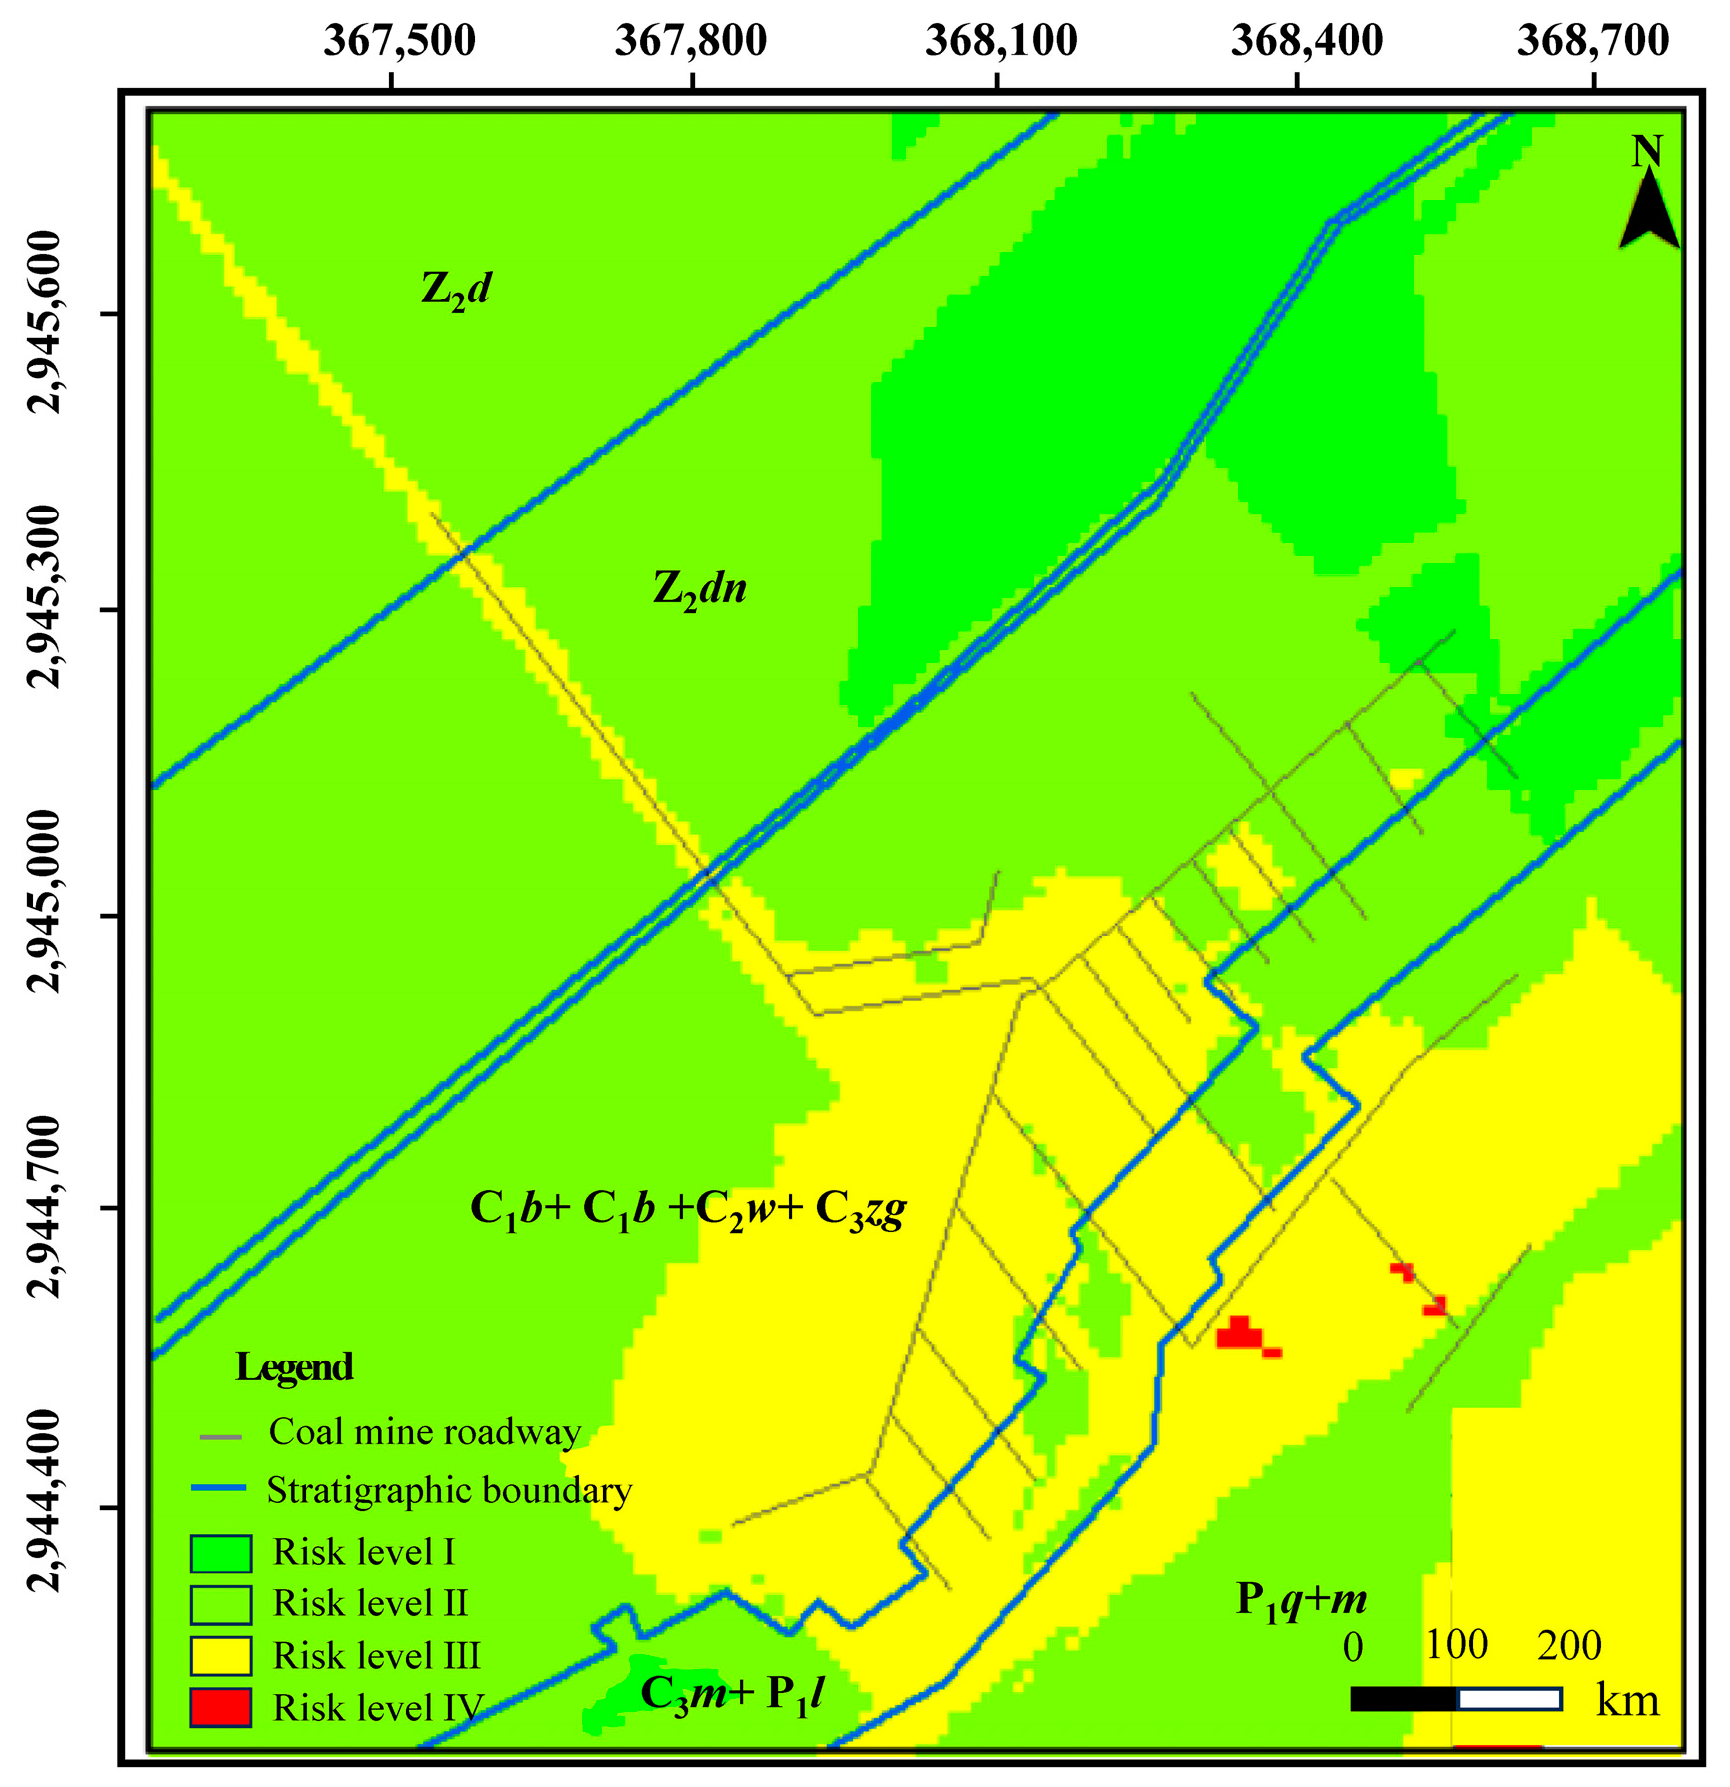
4.4. Water Inrush Risk Assessment

Based on the thematic maps, the attribute data pertaining to the weights are added to the attribute table according to the weight value of AHP-EWM. Superposition analysis was performed on all factors and their weights, and Figure 6 shows the zoning map of the risk assessment of water inrush in deep mining at the Huize lead–zinc mine. The level of risk is categorized into four grades, namely I, II, III, and IV, with the risk increasing successively.
Note that the aquifers of the Permian Liangshan Formation and the Carboniferous Maping Formation (P1l + C3m) are relatively safer than other areas, due to the strong lithology of the rocks, weak water-bearing capacity, slightly lower water pressure, and their role as relative aquitards. However, the intense fault development within these rock layers has led to a decrease in safety in multiple locations. The karst fissure aquifer of the Qixia–Maokou Formation (P1q + m) in the Permian System is considered to have a high risk of water inrush due to its strong water-bearing capacity, weak lithology strength, and significant water head difference.
For Grade I areas, due to the presence of indirect aquifers with relatively weak water recharge sources (or possibly being aquitards), coupled with minimal fault development and strong drainage capacity within the region, the likelihood of water inrush or sudden water bursts is low. Water inrush or sudden water bursts are unlikely to occur, or the gushing water can be promptly drained away. Grade IV areas are characterized by moderately to highly complex hydrogeological conditions, featuring karst fissure aquifers that serve as the direct water-recharging aquifers for ore deposits. These areas experience high water head pressure and are high-water-bearing aquifers, coupled with strong fault connectivity and large fault widths, which make them highly susceptible to water inrush. When the drainage capacity is insufficient in promptly removing the groundwater, it can pose great danger to life and property. Therefore, further exploration engineering should be conducted in the Grade IV area to ascertain the spatial distribution of the fractured water-bearing zone. Based on this understanding, a curtain grouting method would be employed. The pre-grouting reinforcement measures would ensure the safe execution of underground development projects and thereby effectively prevent the occurrence of water inrush accidents. Additionally, considering the randomness and unpredictability of mine water inrush, the principle of “explore first if in doubt, excavation follows exploration” should be followed to ensure the safe production of the mine.
The assessment of water inrush risk should be considered the geological and mining conditions, the parameters of mining operations, and other potential factors or statuses that may lead to mine water inrush during coal mine excavation. However, after a detailed analysis of geological and hydrogeological characteristics of the Huize lead–zine mine, and tectonic development, aquifers are identified as the primary controlling factors influencing the risk of water inrush. Given that the Huize Lead–zinc Mine employs backfill mining, the impact of mining-induced disturbances on the risk of water inrush is relatively minor. Therefore, the influence of mining-induced disturbances was not considered in the current study, which we will consider in the future.

5. Conclusions

(1) After a thorough analysis of geological, structural, and hydrogeological characteristics of the Huize lead–zine mine, potential water inrush hazards during mining at the 1274 m mid-section were identified from two aspects, water recharge sources and water conductivity conditions, and then the hierarchical evaluation model was established, with nine indicators for evaluating mining risk zones. These indicators include the water head difference, water-bearing capacity, hydraulic conductivity, aquifer thickness, water pressure, fault type, fault scale, fault water conductivity, and karst zoning.
(2) The subjective and objective weights of evaluation factors were calculated by the AHP and EWM. Moreover, the comprehensive weights of evaluation factors were determined. The results indicated that the fault type, water head difference, and fault scale were the three most significant indicators influencing the risk of water inrush in mines, with corresponding comprehensive weights of 0.1643, 0.1533, and 0.1343, respectively.
(3) The risk zoning of water inrush in Huize lead–zinc mines was classified into four zones based on the GIS. The karst fissure aquifer within the Qixia–Maokou Formation (P1q + m) in the Permian System was considered to have a high risk of water inrush, necessitating specialized exploration measures and grouting treatments in the subsequent phases. The evaluation results can provide guidance on water control measures or dewatering during the mining of lead–zinc ore bodies.

Author Contributions

Conceptualization, writing—original draft preparation, R.X.; methodology, H.W.; validation, T.H.; formal analysis, data curation, B.H.; supervision, S.Y.; project administration, J.W. and Z.R. All authors have read and agreed to the published version of the manuscript.

Funding

This work was supported by the Foundation of the Science Research Project of Hebei Education Department (BJ2025131) and the National Pre-Research Foundation of Hebei GEO University (KY2025QN04).

Data Availability Statement

Data are contained within the article.

Acknowledgments

The authors express their gratitude to the anonymous reviewers for their detailed comments and suggestions, which have greatly enhanced the quality of this paper.

Conflicts of Interest

Ronghui Xia, Ticai Hu, Baosheng Huang and Zhouhong Ren were employed by Yunnan Chihong Zn & Ge Co., Ltd. Hongliang Wang and Jianguo Wang were employed by North China Engineering Investigation Institute Co., Ltd. The remaining authors declare no conflicts of interest.

References

  1. Huang, H.; Chen, Z.H.; Wang, T.; Zhou, G.M.; Martin, J.B.; Zhang, L.; Meng, X.M. Origins and mixing contributions of deep warm groundwater in a carbonate hosted ore deposit, Sichuan-Yunnan-Guizhou Pb-Zn triangle, southwestern China. J. Hydrol. 2020, 590, 125400. [Google Scholar] [CrossRef]
  2. Wang, Y.; Yang, W.; Li, M.; Liu, X. Risk assessment of floor water inrush in coal mines based on secondary fuzzy comprehensive evaluation. Int. J. Rock. Mech. Min. 2012, 52, 50–55. [Google Scholar] [CrossRef]
  3. Gu, Q.; Huang, Z.; Li, S.; Zeng, W.; Zhao, K. An approach for water-inrush risk assessment of deep coal seam mining: A case study in Xinlongzhuang coal mine. Environ. Sci. Pollut. R 2020, 27, 43163–43176. [Google Scholar] [CrossRef] [PubMed]
  4. Li, X.; Sun, Y.J.; Xu, Z.M.; Chen, G. Water sources classification and inrush hazard assessment approach in coal mining. Coal Eng. 2023, 55, 108–115. [Google Scholar] [CrossRef]
  5. Yuan, S.C.; Sui, W.H.; Han, G.L.; Duan, W.Q. An optimized combination of mine water control, treatment, utilization, reinjection for environmentally sustainable mining: A case study. Mine Water Environ. 2022, 41, 828–839. [Google Scholar] [CrossRef]
  6. Mahato, M.K.; Singh, P.K.; Singh, A.K.; Tiwari, A.K. Assessment of hydrogeochemical processes and mine water suitability fodomestic, irrigation, and industrial purposes in east Bokaro coal-field, India. Mine Water Environ. 2018, 37, 493–504. [Google Scholar] [CrossRef]
  7. Wang, Q.; Zhang, Y.J.; Cui, D.L.; Feng, G.R.; Du, Y.L.; Zhang, S.; Cheng, H.J.; Zhang, Z.J. Effect of indenter angle on bearing performance of coal and accompanying rocks under point load and characterization of mechanical parameters. Energy Sci. Eng. 2025, 13, 374–391. [Google Scholar] [CrossRef]
  8. San Cristóbal, J.R. Multi criteria decision making in the selection of a renewable energy project in Spain: The Vikor method. Renew. Energ. 2011, 36, 498–502. [Google Scholar] [CrossRef]
  9. Agnieszka, T.; Sylwia, W.W.; Adam, W. Risk Assessment Methods in Mining Industry-A Systematic Review. Appl. Sci. 2020, 10, 5172. [Google Scholar] [CrossRef]
  10. Wu, Q.; Huang, X.; Dong, D.; Yin, Z.; Li, J.; Hong, Y.; Zhang, H. Three maps–two predictions method to evaluate water bursting conditions on roof coal. J. China Coal Soc. 2000, 25, 62–67. [Google Scholar] [CrossRef]
  11. Wu, Q.; Liu, Y.; Zhou, W.; Li, B.; Zhao, B.; Liu, S.; Sun, W.; Zeng, Y. Evaluation of water inrush vulnerability from aquifers overlying coal seams in the menkeqing coal mine, China. Mine Water Environ. 2015, 34, 258–269. [Google Scholar] [CrossRef]
  12. Zeng, Y.; Wu, Q.; Liu, S.; Zhai, Y.; Lian, H.; Zhang, W. Evaluation of a coal seam roof water inrush: Case study in the Wangjialing coal mine, China. Mine Water Environ. 2018, 37, 174–184. [Google Scholar] [CrossRef]
  13. Li, B.; Wu, Q.; Duan, X.Q.; Chen, M.Y. Risk analysis model of water inrush through the seam floor based on set pair analysis. Mine Water Environ. 2017, 37, 281–287. [Google Scholar] [CrossRef]
  14. Niu, H.G.; Wei, J.C.; Yin, H.Y.; Xie, D.L.; Zhang, W.J. An improved model to predict the water-inrush risk from an Ordovician limestone aquifer under coal seams: A case study of the Longgu coal mine in China. Carbonate Evaporite 2020, 35, 73. [Google Scholar] [CrossRef]
  15. Xue, J.K.; Shi, L.; Wang, H.; Ji, Z.K.; Shang, H.B.; Xu, F.; Zhao, H.H.; Luo, A.K. Water abundance evaluation of a burnt rock aquifer using the AHP and entropy weight method: A case study in the Yongxin coal mine, China. Environ. Earth Sci. 2021, 80, 417. [Google Scholar] [CrossRef]
  16. Wu, Q.; Li, B.; Chen, Y. Vulnerability assessment of groundwater inrush from underlying aquifers based on variable weight model and its application. Water Resour. Manag. 2016, 30, 3331–3345. [Google Scholar] [CrossRef]
  17. Yang, P.; Yang, W.; Nie, Y.; Saleem, F.; Lu, F.; Ma, R.; Li, R. Predicting the height of the water- conducting fractured zone based on a multiple regression model and information entropy in the Northern Ordos Basin, China. Mine Water Environ. 2021, 41, 225–236. [Google Scholar] [CrossRef]
  18. Zhang, S.; Zhang, D.S.; Feng, G.R.; Chi, M.B. Modelling method of heterogeneous rock mass and DEM investigation of seepage characteristics. Geomech. Geophys. Geo-Energy Geo-Resour. 2024, 10, 46. [Google Scholar] [CrossRef]
  19. Ju, Q.D.; Hu, Y.B. Source identification of mine water inrush based on principal component analysis and grey situation decision. Environ. Earth Sci. 2021, 80, 157. [Google Scholar] [CrossRef]
  20. Zhang, Y.; Tang, S.F.; Shi, K. Risk assessment of coal mine water inrush based on PCA-DBN. Sci. Rep. 2022, 12, 1370. [Google Scholar] [CrossRef] [PubMed]
  21. Li, Q.; Lu, C.J.; Zhao, H. Risk assessment of floor water inrush based on TOPSIS combined weighting model: A case study in a coal mine, China. Earth Sci. Inform. 2023, 16, 565–578. [Google Scholar] [CrossRef]
  22. Hu, Y.B.; Li, W.P.; Wang, Q.Q.; Liu, S.L.; Wang, Z.K. Evaluation of water inrush risk from coal seam floors with an AHP-EWM algorithm and GIS. Environ. Geol. 2019, 78, 290. [Google Scholar] [CrossRef]
  23. Li, Q.; Sui, W.H. Risk evaluation of mine-water inrush based on principal component logistic regression analysis and an improved analytic hierarchy process. Hydrogeol. J. 2021, 29, 1299–1311. [Google Scholar] [CrossRef]
  24. Shi, L.Q.; Qu, X.Y.; Han, J.; Qu, W.; Gao, W.F.; Qin, D.X.; Liu, H.S. Multi-model fusion for assessing risk of inrush of limestone karst water through mine floor. J. China Coal Soc. 2019, 44, 2484–2493. [Google Scholar] [CrossRef]
  25. Yang, Q.; Liu, W.H.; Zhang, J.; Wang, J.; Zhang, X.J. Formation of Pb-Zn deposits in the Sichuan-Yunnan-Guizhou triangle linked to the Youjiang foreland basin: Evidence from Rb-Sr age and in situ sulfur isotope analysis of the Maoping Pb-Zn deposit in northeastern Yunnan Province, southeast China. Ore Geol. Rev. 2019, 107, 780–800. [Google Scholar] [CrossRef]
  26. Li, S.C.; Zhou, Z.Q.; Li, L.P.; Xu, Z.H.; Zhang, Q.Q.; Shi, S.S. Risk assessment of water inrush in karst tunnels based on attribute synthetic evaluation system. Tunn. Undergr. Space Technol. 2013, 38, 50–58. [Google Scholar] [CrossRef]
  27. Lorette, G.; Lastennet, R.; Peyraube, N.; Denis, A. Groundwater flow characterization in a multilayered karst aquifer on the edge of a sedimentary basin in western France. J. Hydrol. 2018, 566, 137–149. [Google Scholar] [CrossRef]
  28. Freitas, S.; De Tomi, G.; Marin, T.; Rocha, M.M. Simulation-based risk quantification: A reconciliation-based performance analysis. Min. Technol. 2017, 126, 96–103. [Google Scholar] [CrossRef]
  29. Torikian, H.; Kumral, M. Analyzing reproduction of correlations in Monte Carlo simulations: Application to mine project valuation. Georisk 2014, 8, 235–249. [Google Scholar] [CrossRef]
  30. Yuan, S.C.; Han, G.L.; Liu, D.J.; Zhang, A.W. Multicriteria risk assessment of water inrush in underground mines with large-scale curtain grouting: A mine disaster risk reduction strategy. Geomat. Nat. Hazards Risk 2024, 15, 2409200. [Google Scholar] [CrossRef]
  31. Yuan, S.C.; Li, Q.; Sun, B.T.; Han, G.L. Hazard identification and risk assessment of water inrush in deep mining of metal mines: A case study of Maoping lead-zinc mine in Northeast Yunnan, China. J. Eng. Geol. 2023, 31, 1668–1679. [Google Scholar] [CrossRef]
  32. Sun, B.T. Study on the risk assessment of water inrush of karst deep mines in Northeast Yunnan, China. China Min. 2023, 32, 440–446. [Google Scholar] [CrossRef]
  33. Li, Q.; Sui, W.H.; Sun, B.T.; Dong, L.L.; Yu, S.B. Application of TOPSIS water abundance comprehensive evaluation method for karst aquifers in a lead zinc mine, China. Earth Sci. Inform. 2022, 15, 397–411. [Google Scholar] [CrossRef]
  34. Smith, J.; Johnson, A. Hydrogeological Variability in Mining Regions: Implications for Water Inrush Risk Assessment. J. Min. Geol. 2015, 51, 123–138. [Google Scholar]
Figure 1. (a) Location map of the study area. (b) Schematic geological map of study area.
Water 17 00643 g001
Figure 2. Schematic hydrogeological map of study area.
Water 17 00643 g002
Figure 3. Hierarchical structure of evaluation factors.
Water 17 00643 g003
Figure 4. Thematic maps of evaluation factors: (a) water head difference; (b) water-bearing capacity; (c) hydraulic conductivity; (d) aquifer thickness; (e) water pressure; (f) fault type; (g) fault scale; (h) fault water conductivity; (i) karst zoning.
Water 17 00643 g004
Figure 5. Distribution of weight of evaluation factors based on EWM.
Water 17 00643 g005
Figure 6. Zoning map of the risk assessment of water inrush in deep mining.
Water 17 00643 g006
Table 1. Geological stratigraphy in the Huize lead–zinc mine.
ErathemSystemSeriesFormationSymbolThickness
(m)
Lithology
CenozoicQuaternary Q0–71.75Blocks of stone, weathered clay
Paleozoic PermianUpperEmeishan P2β600–800Dense blocky basalts and almond basalts form mutual rhythms
LowerQixia–MaokouP1q + m450–600The upper part is bedded silty limestone with a small amount of dolomite, containing chert nodules and dolomite clumks, and the lower part is thick bedded limestone and oolitic limestone with dolomite.
Liangshan P1l21.2–49.5Thin- to intermediate-grained quartz sandstone
Carboniferous UpperMaping C3m22.5–78.2The lower part of the limestone is composed of argillaceous shale, the middle part is medium to thick bedded limestone, the upper part is medium to thick bedded bioclastic limestone, and the top part is gray pisolitic limestone
Middle Weining C2w10–69Sand-clastic sparry limestone, oolitic limestone, dolomitic limestone
Lower Baizuo C1b35–89Middle silty limestone, dolomitic limestone
Datang C1d27–41The shale is composed of ferruginous quartz sandstone, purplish red mudstone, and argillaceous limestone
Devonian Upper Zaige D3zg200–365Dolomite, siliceous dolomite, microsilty dolomite, micrite
Middle Haikou D2h4.6–106.5Siltstone
Cambrian Lower Qiongzhusi 1q0–98.5Microbedded to mid-level carbonaceous shale, siltstone, and arkose
ProterozoicSinian Upper DengyingZ2dn>70Middle to massive powdery dolomite
Doushantuo Z2d>100Cataclastic porphyritic micrite powdery dolomite, carbonaceous dolomite, micrite dolomite
Table 2. Scales of judgment matrices 1 to 9 and their implications.
ScaleImplication
1Both factors are of equal importance in comparison
3The former factor is slightly more important than the latter
5Compared with the two factors, the former factor is strongly more important than the latter
7Compared with the two factors, the former factor is very strongly more important than the latter
9Compared with the two factors, the former factor is extremely more important than the latter
2, 4, 6, 8The median of the above adjacency judgments
Table 3. Relationship between random index values with the order of the matrix.
n1234567891011
RI000.580.91.121.241.321.411.451.491.51
Table 4. Quantitative standard of evaluation index.
Evaluation indexRisk Grade Evaluation Criteria
IIIIIIIV
Head difference (m)<150150~200200~250>250
Water-bearing capacityExtremely weakWeakIntermediateGood
Hydraulic conductivity (m/d)<0.0570.057~0.110.11~0.18>0.18
Aquifer thickness (m)Aquiclude<300300~400>400
Water pressure (MPa)<0.40.4~0.60.6~0.8>0.8
Fault typeNo water MoistDrippingDrenching
Fault scale (m)00~11~2>2
Fault water conductivity (bar/point)0123
Karst zoning (SI)>-0.45−0.58~−0.45−0.65~−0.58<−0.65
Table 5. Weights of evaluation indicators based on AHP.
Criterion LayerIndex LayerComprehensive Weight
ItemWeightItemWeight
Water source
B1
0.5Water head difference C10.37210.18605
Water-bearing capacity C20.11050.05525
Hydraulic conductivity C30.20870.10435
Aquifer thickness C40.18170.09085
Water pressure C50.12700.0635
Water channel
B2
0.5Fault type C60.34070.17035
Fault scale C70.28650.14325
Fault water conductivity C80.17030.08515
Karst zoning C90.20260.1013
Table 6. Comprehensive weight determination.
Evaluation FactorComprehensive Weight
Water head difference C10.1533
Water-bearing capacity C20.0717
Hydraulic conductivity C30.1209
Aquifer thickness C40.1045
Water pressure value C50.0732
Fault type C60.1643
Fault scale C70.1343
Fault water conductivity C80.0908
Karst zoning C90.1050
Disclaimer/Publisher’s Note: The statements, opinions and data contained in all publications are solely those of the individual author(s) and contributor(s) and not of MDPI and/or the editor(s). MDPI and/or the editor(s) disclaim responsibility for any injury to people or property resulting from any ideas, methods, instructions or products referred to in the content.

