Article

Pb2+ Adsorption, Performance, and Response Surface Optimization of Hydroxyapatite Nanowire Sodium Alginate Aerogel (HSA)

1
Guangxi Key Laboratory of Theory and Technology for Environmental Pollution Control, Guilin University of Technology, Guilin 541006, China
2
Engineering Research Center of Watershed Protection and Green Development, Guilin University of Technology, Guilin 541006, China
3
Guangxi Engineering Research Center of Comprehensive Treatment for Agricultural Non-Point Source Pollution, Guilin University of Technology, Guilin 541006, China
4
Modern Industry College of Ecology and Environmental Protection, Guilin University of Technology, Guilin 541006, China
5
Collaborative Innovation Center for Water Pollution Control and Water Safety in Karst Area, Guilin University of Technology, Guilin 541006, China
6
Beijing Xincheng Yulu Environmental Protection Technology Limited Company, Beijing 101113, China
*
Author to whom correspondence should be addressed.
Water 2025, 17(5), 631; https://doi.org/10.3390/w17050631
Submission received: 12 January 2025 / Revised: 18 February 2025 / Accepted: 20 February 2025 / Published: 21 February 2025
(This article belongs to the Special Issue Advanced Adsorption Technology for Water and Wastewater Treatment)

Abstract

:
A novel composite biomass aerogel adsorbent (HSA) was prepared by dual physical and chemical cross-linking using sodium alginate (SA) as an organic biomass template and hydroxyapatite nanowires (HAPNWs) as an inorganic biomass skeleton. The structure of the HSA was characterized by scanning electron microscopy (SEM), X-ray powder diffractometry (XRD), Fourier transformed infrared spectroscopy (FTIR), and stress testing. One-factor experiments were conducted focusing on adsorption conditions at a Pb ion concentration of 300 mg/L, and the adsorption conditions were optimized using the response surface method. The optimal conditions obtained by numerical optimization using Design-Expert 13 were as follows: pH of 7.23, adsorption temperature of 35.42 °C, and adsorption time of 1050.73 min; the optimal adsorption capacity was 278.874 mg/g. To further reveal the adsorption mechanism of HSA, its adsorption model and kinetics were analyzed. Adsorption was most consistent with the Langmuir isothermal adsorption model, while the kinetics were most consistent with the pseudo-secondary kinetic model. R2 reached 0.9986, indicating a mono-molecular layer of adsorption by heat, while the main adsorption mechanism was chemisorption.

1. Introduction

With the rapid development of modern industry, environmental pollution is becoming increasingly serious. Heavy metal pollution in water bodies is difficult to remove; as such, heavy metals easily accumulate in plants and animals, resulting in irreversible harm and a serious environmental problem [1,2,3]. Highly toxic heavy metals commonly have good water solubility and bioconcentration [4]. Lead (Pb) poses direct and indirect hazards to human health when it enters water bodies; Pb pollution in water bodies mainly originates from industrial wastewater discharged from Pb-acid batteries, the printing industry, and the mining and metal smelting industries [5,6,7]. It is easily enriched in the food chain, causing serious damage to ecosystems and posing a potential threat to human health [8]. Over the past 50 years, more than 8 million tons of Pb have been released into the environment [9]. Pb is hematotoxic, neurotoxic, immunotoxic, and cytotoxic, and once it enters the human body, it can cause long-term damage to human organs and tissues. When the Pb content in drinking water reaches 0.03 mg/L, it can result in poisoning and long-lasting damage to nerves, bones, and key organs (e.g., brain, liver). It leads to abnormal changes in the structure of nerve cells, resulting in a series of symptoms such as motor disorders, memory loss, and learning disabilities. It also causes diseases such as interstitial fibrosis, renal vascular sclerosis, hypertension, and gout, and lowers immunity [10]. Therefore, addressing Pb pollution has become a necessary research focus [11,12].
Currently, the main Pb treatment methods, including ion exchange, electroflocculation, and membrane osmosis, involve complex and cumbersome processes and high cost; moreover, the efficacy of low-concentration wastewater treatment is poor [13,14,15,16,17,18]. In contrast, adsorption has become a major method for heavy metal water and wastewater treatment owing to its ease of operation, cost-effectiveness, and high treatment capacity [19,20]. In particular, adsorption provides an ideal way to remove Pb(II) from water; however, traditional adsorbents struggle to adapt to the many different adsorption environments. Therefore, there is a critical need to develop new Pb(II) adsorbents (e.g., aerogels) with simultaneous environmental friendliness, excellent adsorption properties, and high mechanical strength.
Biomass aerogels, which offer advantages such as high biocompatibility, have become a research hotspot. Many such adsorbents have been developed; among them, adsorbents using sodium alginate (SA) offer good resource utilization. SA is a natural polymer extracted from brown algae, and consists of α-L-guluronic acid (G-unit) and β-D-mannuronic acid (M-unit) connected to each other in a disordered manner. SA can complex with divalent ions (Ca2+, Ba2+, etc.) to form a unique ‘eggshell’ three-dimensional structure that is able to adsorb heavy metals. This structure is also non-toxic, biocompatible, economic (with a low acquisition cost), and exhibits adjustable surface properties [21]. However, such structures also suffer from poor durability (owing to high biodegradability and an inhomogeneous structure prone to collapse), poor mechanical strength, and low rigidity, which largely limit large-scale application in the field of heavy metal adsorption. Therefore, the selection of new adsorbent materials for doping and blending with SA is of great significance for improving the adsorption capacity and rate of SA aerogels [22,23].
The mechanical properties of a material can be enhanced by composite two-dimensional toughness materials [24], and the presence of functional groups such as hydroxyl and carboxyl groups on the surface of SA provides excellent adsorption of heavy metal ions [25]. Tao et al. prepared magnetic chitosan/SA gel balls (MCSB) using an SA hydrogel as the substrate; the theoretical maximum adsorption of Cu(II) could reach 124.53 mg/g under optimal conditions [26]. Zhang et al. [27] prepared a silica (SiO2)/SA-xanthan gum composite adsorbent with Si–O–Si groups, which showed a maximum adsorption capacity (qm) of 18.9 mg·g−1 for Pb(II). Therefore, the utilization of active sites, the mechanical strength, and the adsorption performance of lead ions can be improved by modifying sodium alginate.
Hydroxyapatite (HA), which is comprised of Ca, P, O, and H elements, is the main inorganic component of vertebrate bones and teeth [28,29]; it can be obtained by calcining animal bones, plants, shells, and mineral sources, and can also be prepared by solid-phase reactions. HA is widely used in environmental remediation as an adsorbent for treating heavy metal wastewater owing to its excellent biocompatibility, ion exchange, thermal stability, good acid–base properties, porosity, non-toxicity, low cost, and low solubility [13]. However, the inherent tiny size and agglomeration characteristics of HA make it difficult to recycle. Moreover, agglomeration leads to mutual masking of the adsorption sites on its surface, which hinders its adsorption capacity. The synthesis of HA nanowires (HAPNWs) offers a solution to address these issues. HAPNWs, a two-dimensional form of HA, have excellent acid–base active sites owing to their high specific surface area. The surfaces of HAPNWs are loaded with abundant hydroxyl functional groups and possess excellent flexibility, which can effectively embed HAPNWs into other adsorbent materials [14]. This can provide more binding sites for heavy metal ions and a skeletal structure to enhance the mechanical properties of the adsorbent.
In this study, with the aim of developing modified green adsorbent materials, HAPNWs were successfully embedded into an SA matrix. This structure is capable of chelating heavy metals via physicochemical double cross-linking, forming a continuous and dense inorganic biomass skeleton. HAPNW/HSA was prepared and characterized by scanning electron microscopy (SEM), X-ray powder diffractometry (XRD), Fourier transformed infrared spectroscopy (FTIR), and stress testing. In addition, the effects of different factors (e.g., solution pH, temperature, etc.) on the adsorption of Pb(II) by the aerogel were investigated, and adsorption thermodynamics, adsorption kinetics, and different adsorption isothermal models were determined to explore the mechanism of Pb(II) adsorption by HAPNW/HSA.

2. Materials and Methods

2.1. Experimental Reagents

Analytically pure SA was purchased from Sigma-Aldrich Corporation, St. Louis, Missouri, USA. Analytically pure anhydrous ethanol was purchased from Shanghai Macklin Biochemical Technology Co., Ltd., Shanghai, China. Analytical pure sodium hydroxide was obtained from Tianjin Kemiou Chemical Reagent Co., Ltd., Tianjin, China. Analytically pure, concentrated hydrochloric acid was purchased from Sinopharm Group Chemical Reagent Co., Ltd., Shanghai, China. Analytically pure anhydrous calcium chloride (CaCl2) and NaH2PO4·2H2O were purchased from Tianjin Best Chemical Co., Ltd., Tianjin, China. Standard solution Pb was purchased from Guobiao (Beijing) Testing & Certification Co., Ltd., Beijing, China. Analytically pure oleic acid was purchased from Shanghai Aladdin Biochemical Technology Co., Ltd., Shanghai, China. The resistivity of ultrapure water was 18 × 106 Ω·cm.

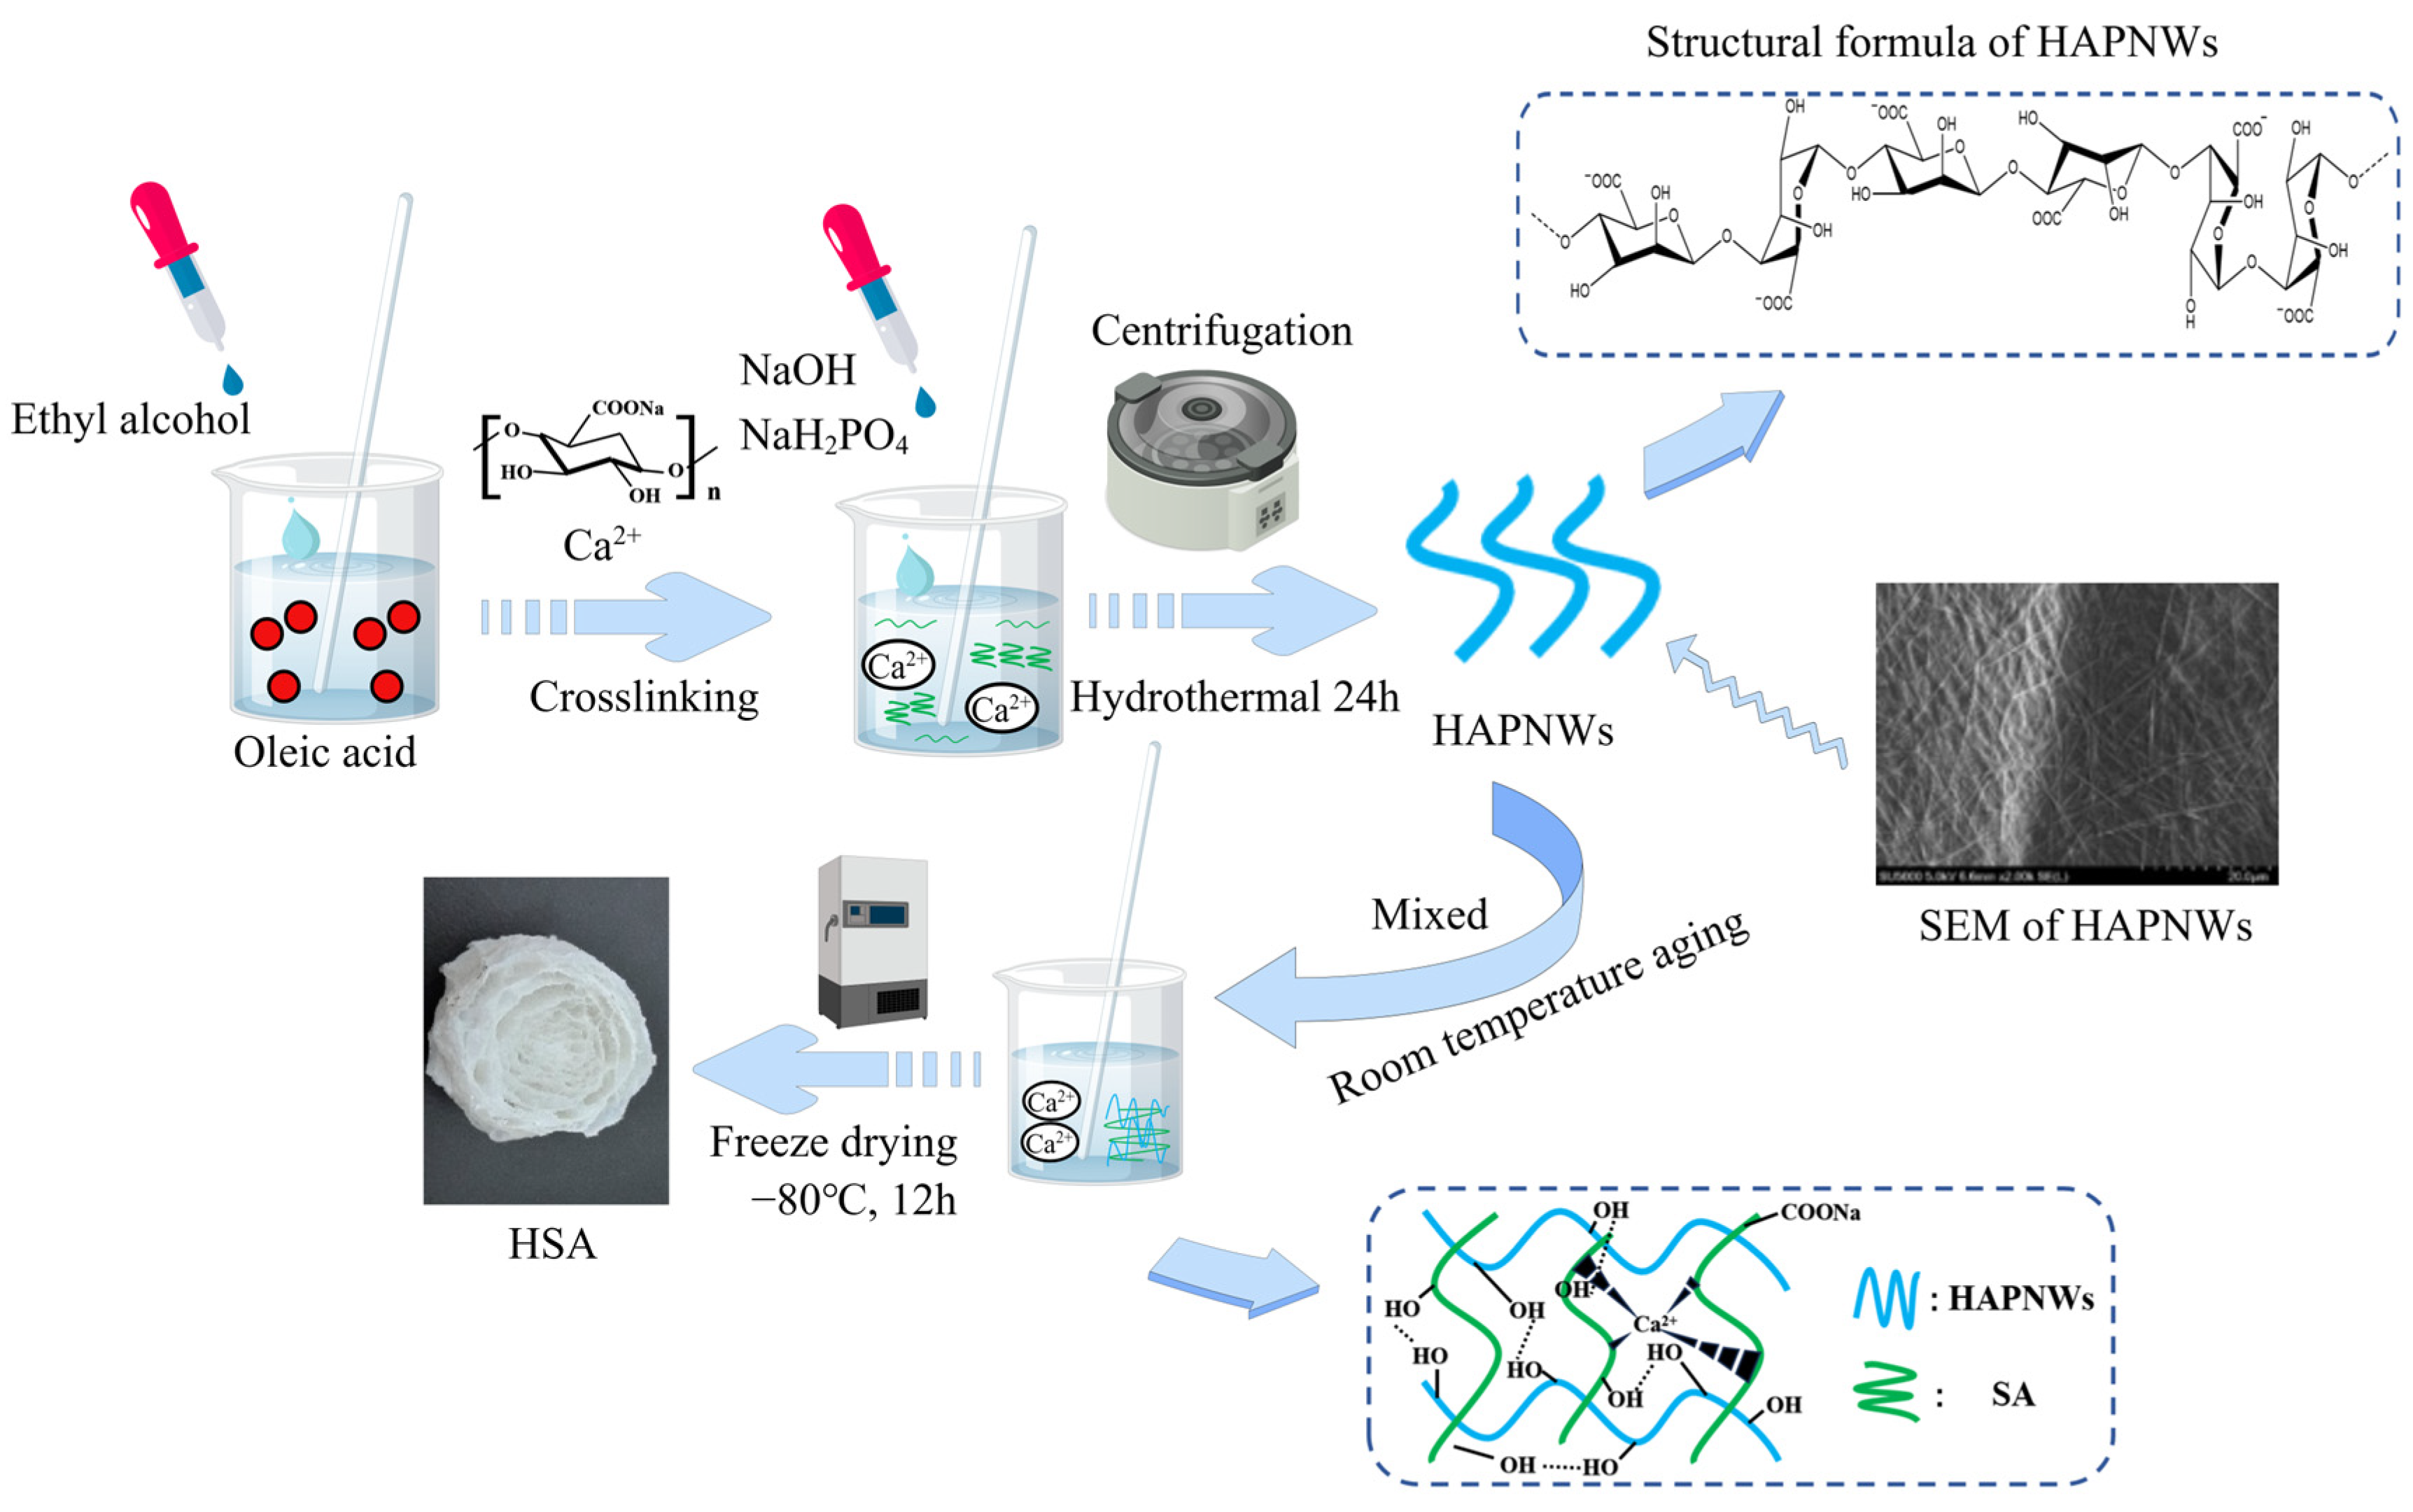
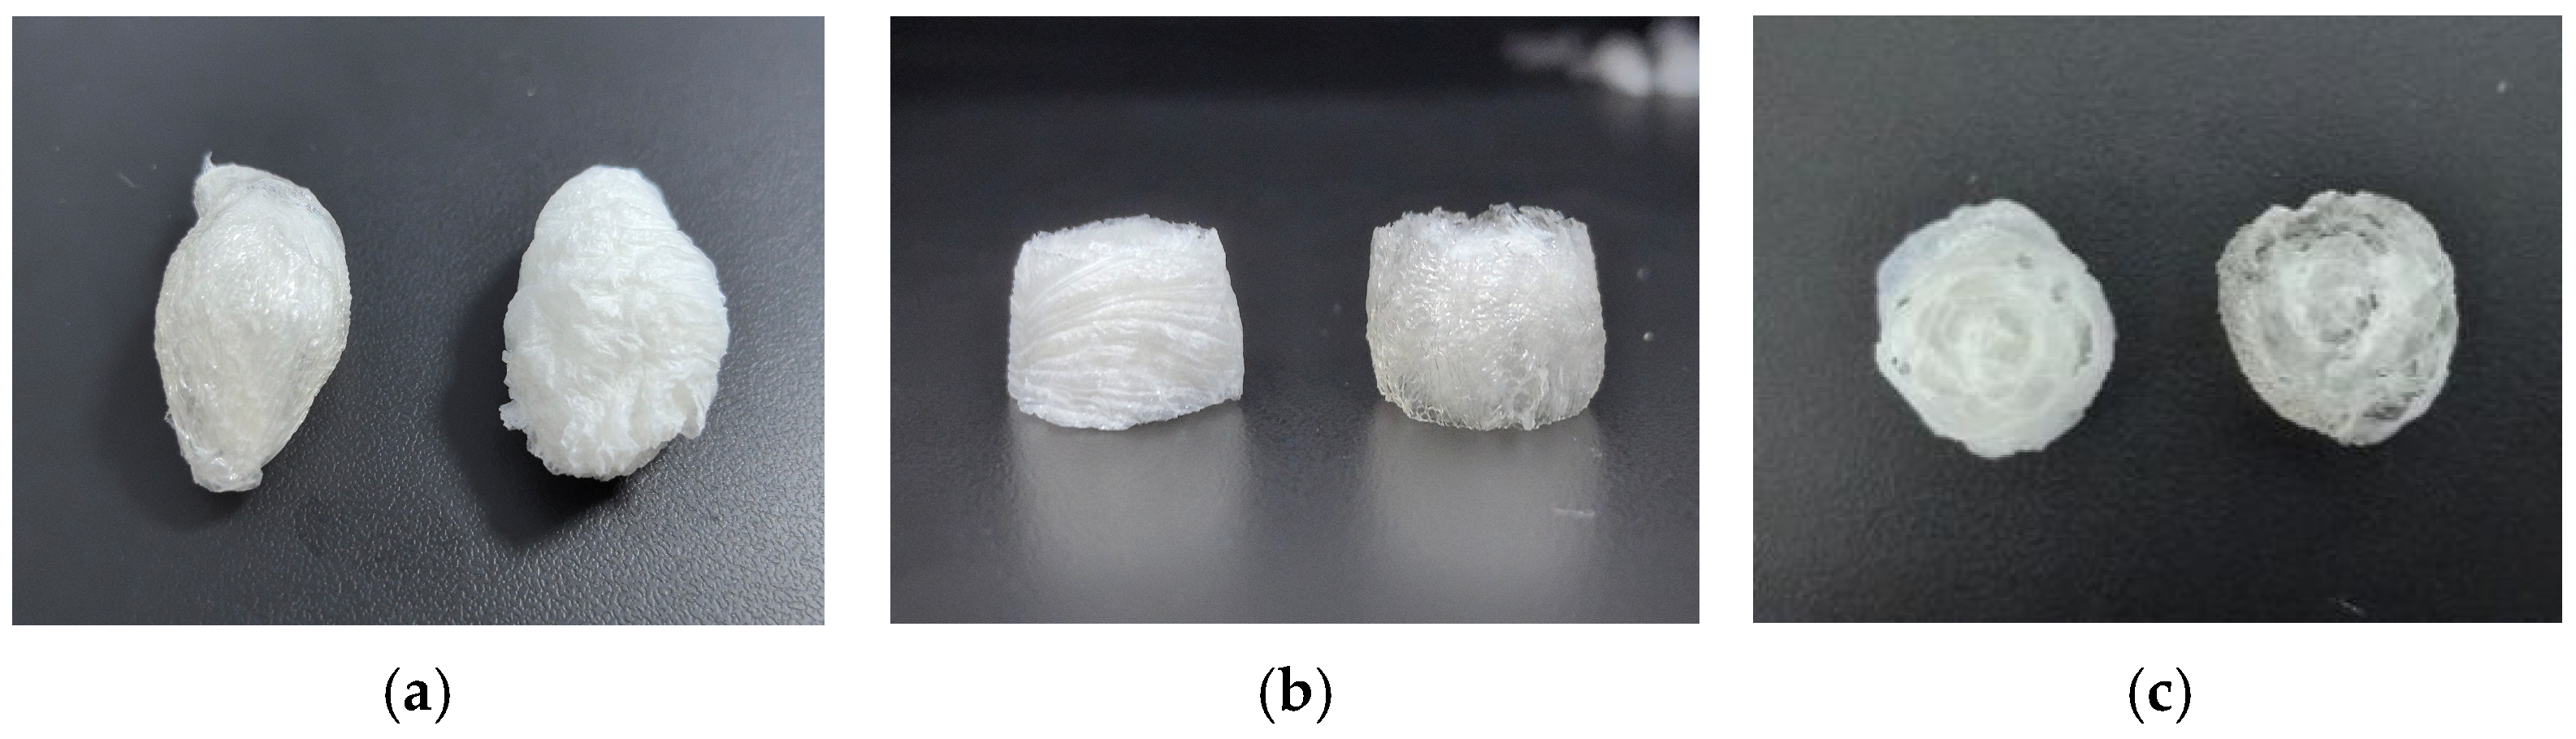
2.2. HSA Preparation

HAPNW slurry was synthesized using an improved hot solvent method [15]. The specific synthesis scheme was as follows: NaOH (0.9 g), CaCl2 (0.33 g), and NaH2PO4·2H2O (0.435 g) were dissolved together in 15 mL of deionized water before the hydrothermal treatment; oleic acid (10 mL) and anhydrous ethanol (15 mL) were evenly mixed using the hydrothermal method and then added into the above mixture of deionized water and medication (total 40 mL). HAPNW slurry was obtained by centrifugation of NaOH, anhydrous ethanol, and water for 24 h after hydrothermal reaction at 180 °C, 2 Mpa. The prepared HAPNWs slurry (2 g) was fully dispersed in deionized water (40 mL). SA (0.5 g) was added to the dispersion solution (40 mL) until the mixture was thick and uniform, and a CaCl2 solution (0.05 mol/L, 40 mL) was slowly added to the mixture along the wall. After aging at room temperature for 3 h, a solid hydrogel was obtained. We speculate that it is absorbed in the form of Pb-O ions and transformed into metallic Pb. The hydrogel was pre-frozen at −80 °C for 12 h and freeze-dried to obtain the composite biomass aerogel (HSA). Pure SA aerogel prepared without HAPNWs was recorded as SAA. The schematic diagram of HSA preparation is shown in Figure 1.

2.3. Adsorption Testing

The effects of temperature, time, and pH on the adsorption capacity of HSA were studied. We added 20 mg of HAPNWs into 20 mL Pb2+ solution, adjusted the contact time and initial Pb2+ concentration, and performed isothermal adsorption for 240 min under oscillating conditions (150 rpm, 35 °C, pH = 7). The solution was analyzed using inductively coupled plasma emission spectrometry (ICP–OES) to determine the concentration of Pb2+ in the solution before and after adsorption. The adsorption capacity was then calculated as follows:
q e = V × ( C 0 C e ) m
where qe is the adsorption capacity of the HAPNWs (mg/g), C0 is the initial mass concentration of the Pb2+ solution (mg/L), Ce is the mass concentration of the Pb2+ solution at adsorption equilibrium (mg/L), V is the volume (L) of the Pb2+ solution, and m is the HAPNW mass (g).
The pH of the Pb2+ solution was set to 5, 6, 7, 8, 9, or 10. The adsorption time was set to 1, 10, 20, 35, 105, 120, 250, 350, 500, 625, 700, 800, 900, 1000, 1200, 1250, 1500, 2000, or 2250 min. The adsorption pH was set to 5, 6, or 7. The adsorption isotherms for different combinations of conditions were determined by fitting the Langmuir and Freundlich adsorption isotherm models, as follows:
Q e = Q m K L C e 1 + K L C e
lg Q e = lg K F + 1 n lg C e
where Qe (mg/g) is the Pb2+ adsorption capacity at equilibrium state, Qm (mg/g) is the maximum adsorption capacity, KL is the Langmuir constant, KF is the Freundlich constant, and 1/n is the characteristic constant of the adsorption strength.
The results were fitted using pseudo-first-order and pseudo-second-order adsorption kinetic models to explore the adsorption kinetics, as follows:
ln ( Q e Q t ) = ln Q e K 1 t
t Q t = t Q e + 1 k 2 Q e 2

2.4. Response Surface Optimization Experiment

Design Expert 13 [30] was used for experimental optimization design and data analysis. Based on the previous experiments, the approximate optimal adsorption condition range was determined, and 17 sets of experiments with different combinations of the 3 factors and 3 levels were designed for practical use. The Box–Behnken model (BBD) was used to optimize the factors affecting HSA adsorption (adsorption temperature, pH, and adsorption time) and to explore interactions between single factors. Experimental data were subjected to statistical analysis using analysis of variance (ANOVA). The experimental data were fitted to a second-order polynomial model as follows:
γ = β 0 + i = 1 n β i x i + i = 1 n β i i x i 2 + i j n β i j x i x i + ε
where γ is the predicted response; β0 is a constant coefficient; βi, βii, and βij represent the regression coefficients of the linear term, interaction term, and square term of the model, respectively; xi and xj are independent factors; ε is the random error of the model. The fitting of the quadratic polynomial model was determined by R2, and the significance of the model was determined by the p-value and F-value.

2.5. Aerogel Characterization

The phase compositions and crystal structures of the HAPNW, HSA, SAA, and HSA + Pb were characterized by XRD (X’pert3 Powder, Malvern Panalytical, Worcestershire, UK) under the following conditions: Cu Kα target, tube voltage of 40 kV, current of 40 mA, and 2θ = 10°–90°. The types of functional groups in the HAPNW, HSA, SAA, and HSA + Pb were analyzed using a Spectral Fourier transform infrared spectrometer (Spectroscopy 3, Perkin Elmer Company, Waltham, USA). Four different samples were ground and mixed with KBr after drying at 150 °C at a mass ratio of 1:100. The correct amount of powder was mixed in a tablet mold and pressed into a transparent sheet. The removed slices were scanned five times using an infrared spectrometer with a resolution of 4 cm−1 in the range of 50–4000 cm−1. The types and contents of the functional groups were compared and analyzed according to the detected spectra. Scanning electron microscopy (SEM; SU5000, Hitachi, Tokyo, Japan) was used for morphological observation and analysis. The working voltage was 30 kV, the working current 70 μA, and the working distance 4.13 mm. A high-true-space working mode was adopted.
HSA and SAA had different appearances, as shown in Figure 2a. Therefore, for stress testing, HSA and SAA cylinders with heights of approximately 2 cm and transverse radii of approximately 1 cm (Figure 2b,c) were intercepted for the pressure test to ensure that the forces acting on the two materials were similar. The specific test steps were to place them on a universal test machine for the compression experiment and record the pressure. After 50% compression, the height after rebound was measured, and the rebound capacity was calculated.

3. Result and Discussion

3.1. Characterization Analysis

3.1.1. SEM Analysis

SEM macro- and micrographs of HSA and SAA samples are shown in Figure 3. Figure 3d–f shows HSA without HAPNW, where the surface is rough but uniform owing to ionic cross-linking of the SA gel in the CaCl2 solution (0.05 mol/L). Furthermore, brittle fractures are observed. From Figure 3f, the surface of SAA also contained many fine pores; however, the pores were shallow and discontinuous, and not suitable for efficient adsorption. Figure 2c and Figure 3a–c show HSA with HAPNW. From a cross section (Figure 2c), the internal structure was a porous honeycomb, and was tighter than that of SAA. HAPNWs were evenly distributed in the SA aerogel. Compared with SAA, the HAPNW/HSA had a rougher surface with more obvious folds (Figure 3a), highlighting the advantages of in situ modification over surface modification.

3.1.2. Crystal Pattern Analysis

The XRD patterns are shown in Figure 4. The XRD peaks of HAPNWs at diffraction angles (2θ) of 10.8°, 28.9°, 31.7°, 32.9°, and 39.7° were attributed to the (100), (210), (211), (300), and (130) crystal phases of HA (Ca5(PO4)3(OH) [16]. The file number of the reference standard map was PDF#04-010-6315, the crystal system was hexagonal, and the space group was P63/m (176). The crystal phases spacing of the sample diffraction peak map was essentially the same as that of the standard map. In addition, there were no other unattributed crystal peaks, indicating that the HAPNWs contained only hydroxyapatite. The diffraction peaks were consistent with the high crystallinity and large crystal size of HA.
The XRD pattern of SAA had a broad peak at a diffraction angle (2θ) of ~21.1° and a typical amorphous XRD diffraction peak, but no obvious crystallization peaks, indicating very low crystallinity, which is consistent with the morphology of SAA gel. In the XRD pattern of HSA, crystallization peaks occurred at 2θ of 31.7° and 32.9°, corresponding to the (211) and (300) crystal phases of HA; a broad peak at 21.1° corresponded to a characteristic peak of SAA gel, indicating that the SAA gel and HA had been successfully merged. Compared with SAA, the XRD peaks of the HSA were smaller, which is because the loaded HA had higher crystallinity and a larger grain size. Compared with HAPNW, the XRD pattern of HSA had a wider diffraction peak because the SA gel loaded on the sample reduced the crystallinity of the material. The average grain size of the material decreased, and some of the characteristic peaks of HA disappeared. This was because, compared with HAPNW, there was a smaller amount of HA in HSA, and the diffraction peaks of some crystal phases of HA were weakened owing to coating by the SAA gel. In addition to the characteristic SA gel and HA peaks, Pb diffraction peaks appeared at diffraction angles of approximately 36.1°, 46.9°, and 56.7°, corresponding to the (101), (102), and (110) crystal phases of Pb, respectively. With reference to the standard atlas file number PDF#01-073-7078 (metallic Pb), the hexagonal crystal system and space group P63/mmc (194) indicate that the sample contained Pb. HSA + Pb shared the same structure as HSA after loading Pb, indicating that the sample had a strong ability to adsorb Pb, and that the structure of the sample did not change significantly after adsorption.

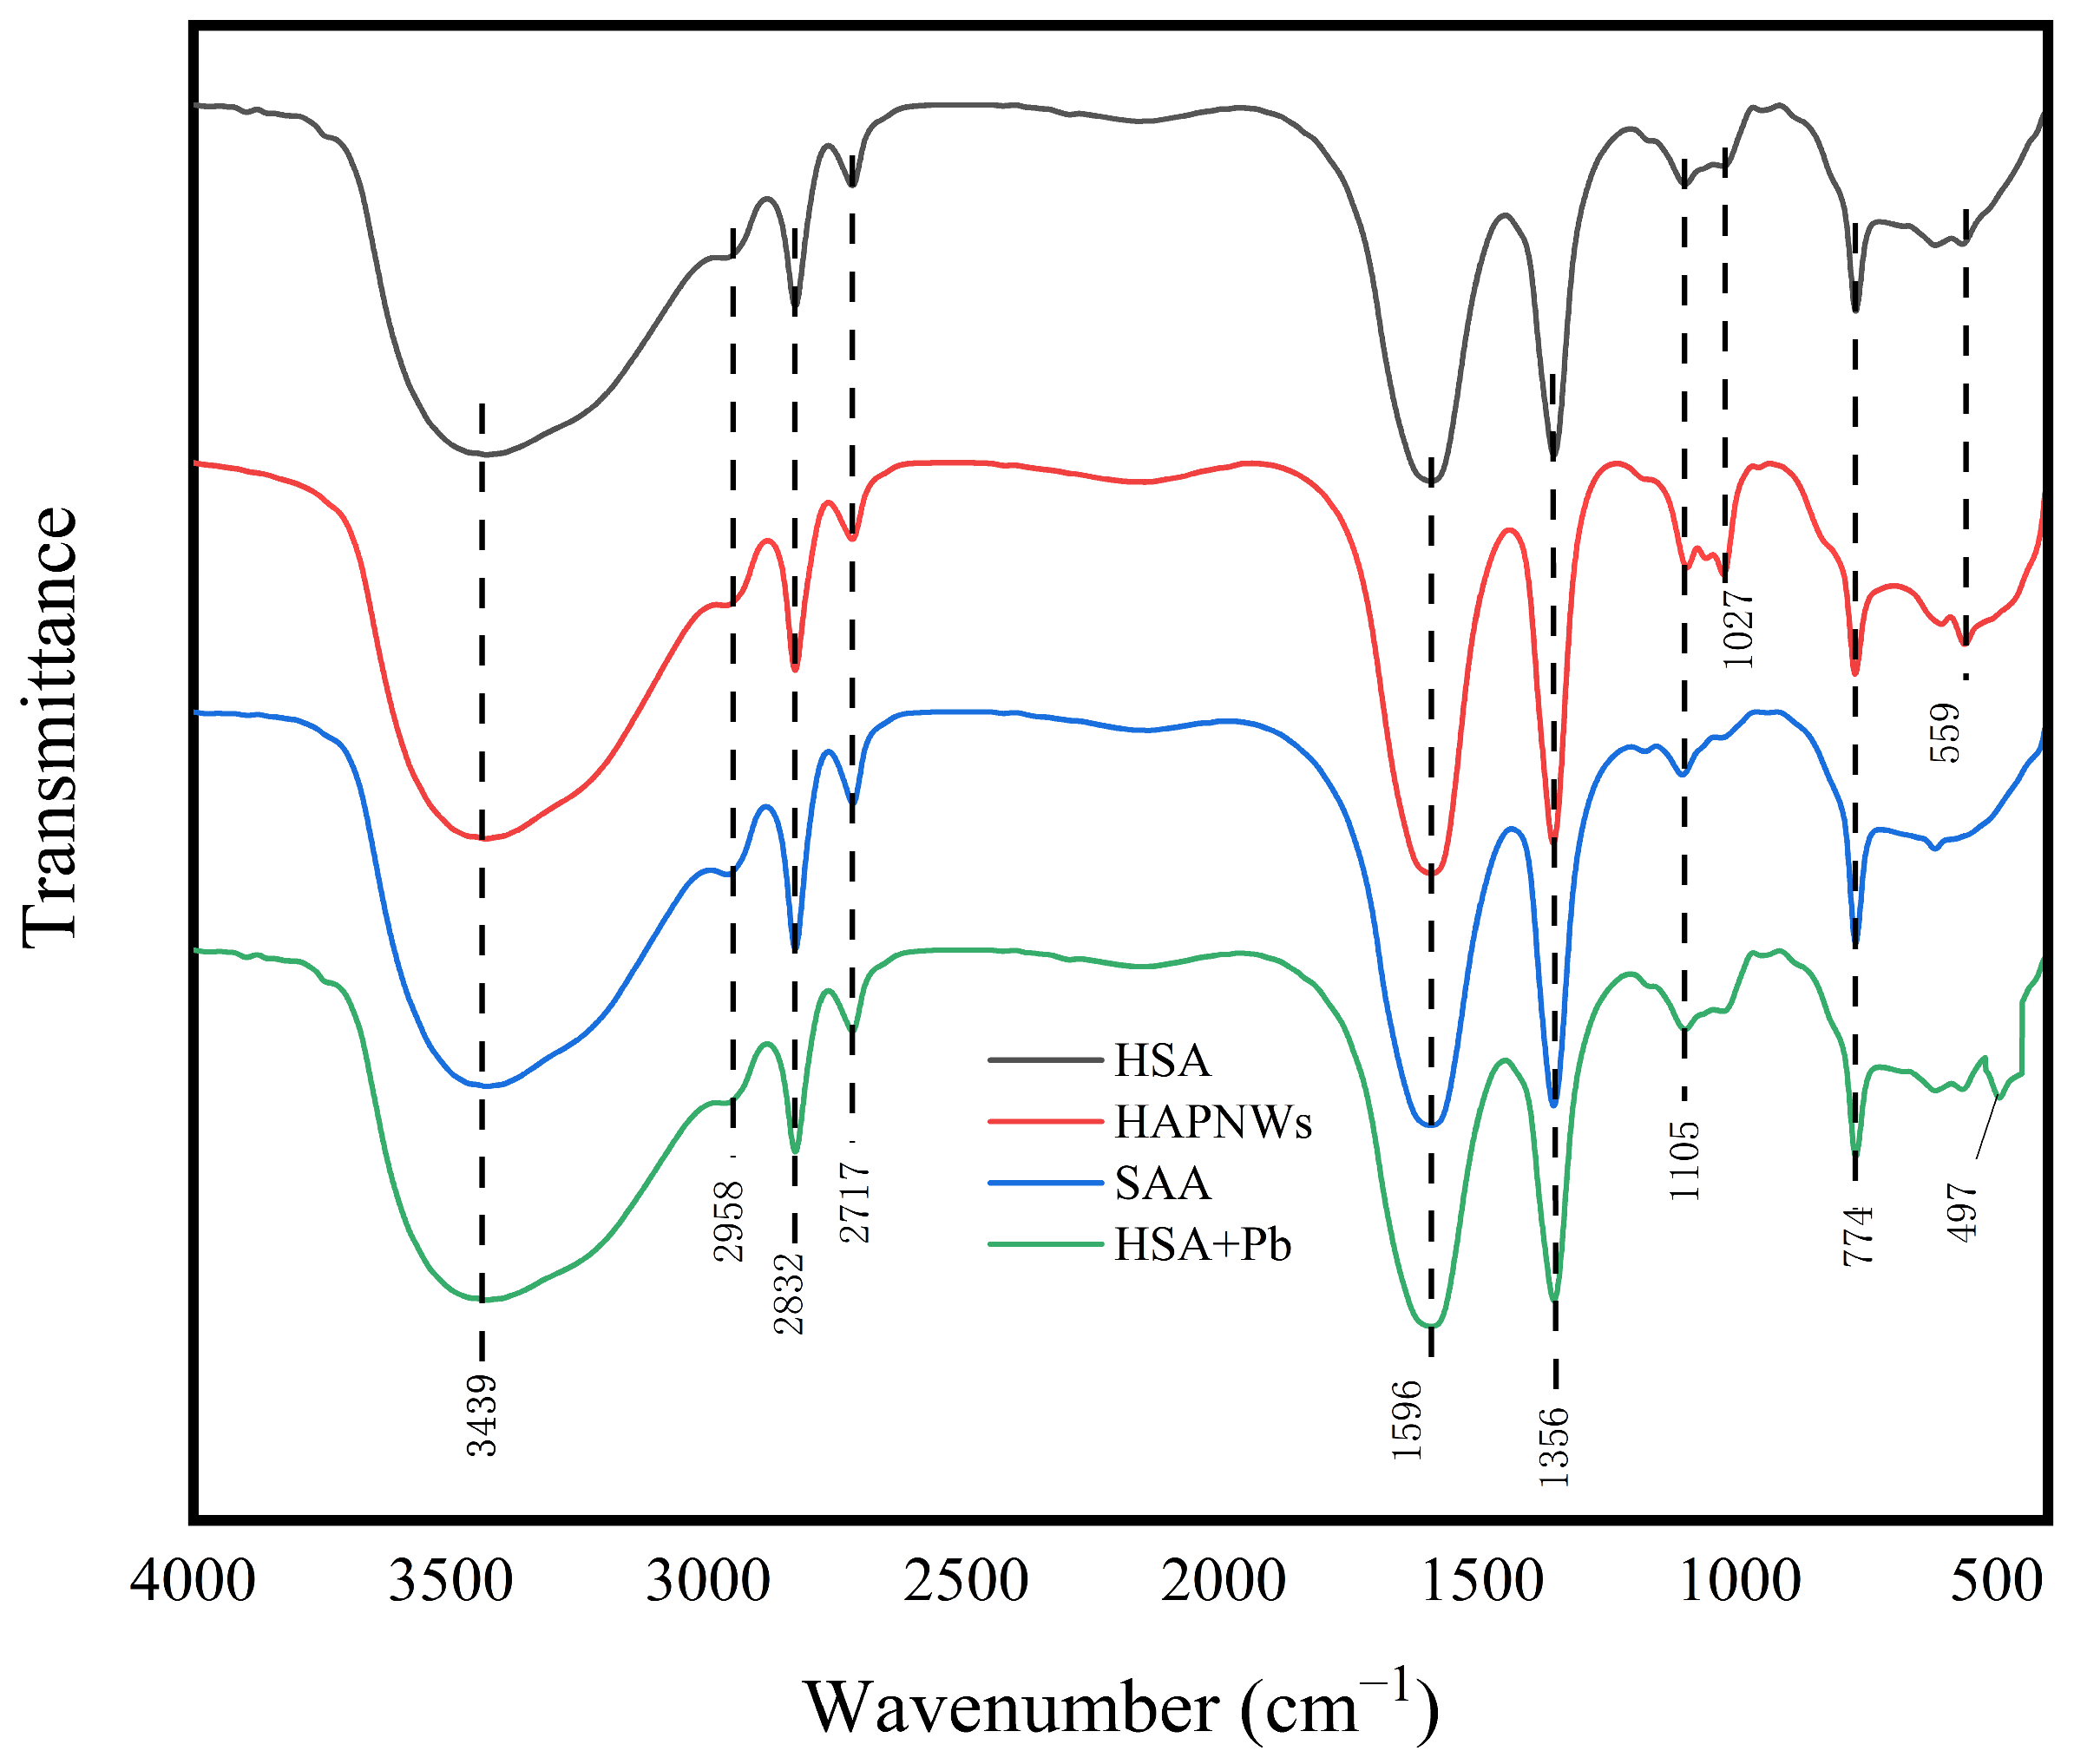
3.1.3. Infrared Functional Group Analysis

In the infrared spectrum of SAA (Figure 5), the broad peaks at 3439 cm−1 corresponded to hydroxy –OH stretching vibration; the 2958 and 2832 cm−1 peaks belonged to the C–H antisymmetric stretching vibration and symmetric stretching vibration peaks in the methylene group, respectively; the 1596 cm−1 peak corresponded to the stretching vibration of C=O in the carboxyl group; and a bifold frequency peak appeared at 2717 cm−1 [31]. The peak at 1356 cm−1 was the C–H bending vibration peak in the saturated hydrocarbon group; the peak at 1105 cm−1 was the C–O stretching vibration peak; the peak at 774 cm−1 was the C–H out-of-plane rocking vibration in the long-chain hydrocarbon group on the ring. In the infrared spectrum for HAPNW, the wide broad at 3439 cm−1 corresponded to the hydroxy –OH stretching vibration. The positions of the other characteristic peaks remain unchanged, but a new characteristic peak appeared at 1027 cm−1, which was attributed to the stretching vibration of P–O in the phosphate group; the peak at 559 cm−1 was caused by the bending vibration of O–P–O in HA and is the characteristic peak of HAPNWs [32]. The HSA sample was a mixture of two materials, and the infrared spectrum did not change significantly before and after mixing; no new characteristic peaks appeared, and the expansion vibration peak of P–O in the phosphate group at 1027 cm−1 was retained, indicating that SA with the addition of HAPNWs was successfully synthesized. The absorption peaks of HAPNWs at 565 and 604 cm−1 corresponded to the deformation vibration of PO43−, and the absorption peak at 1033 cm−1 corresponded to the stretching vibration of POPO43−; meanwhile, the obvious PO43− vibration peaks of HSA also appeared near 564, 603, and 1034 cm−1, indicating that HAPNWs were effectively embedded in the material. After the adsorption of Pb by HSA, a new characteristic peak appeared at 497 cm−1, which was attributed to the bending vibration peak of Pb–O, indicating that the hydroxyl group in HSA was coordinated with Pb and that a coordination reaction occurred [33].

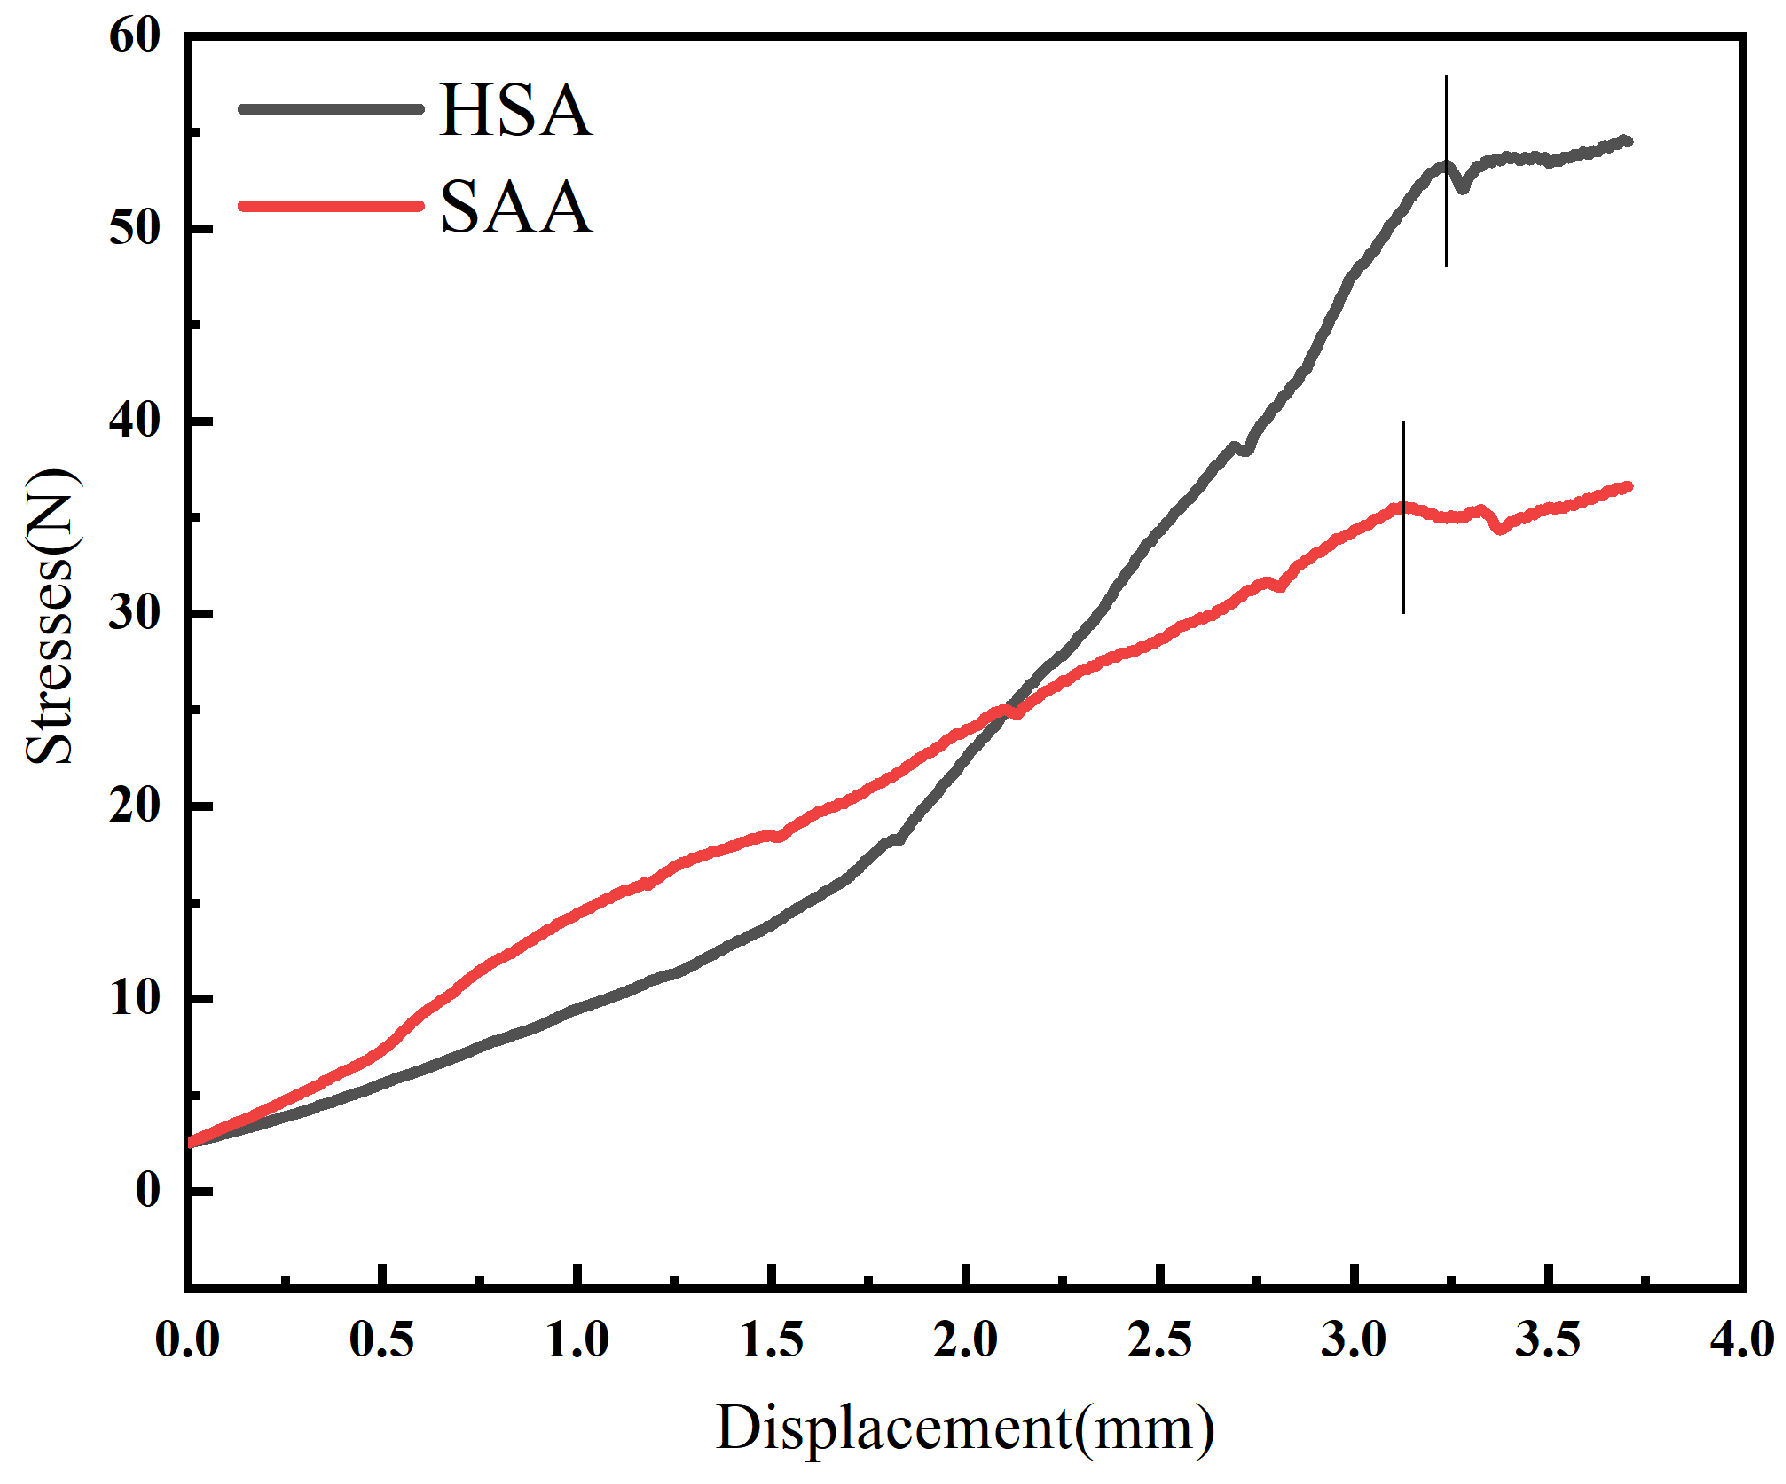
3.1.4. Mechanical Pressure Test Analysis

The compressive capacities of SAA and HSA were tested using a universal testing machine to evaluate their mechanical strength. In the stress test (Figure 6), the peak stress–strain curve of HSA was relatively smooth at the beginning, and the compressive resistance of HSA was not as good as that of SAA. When the strain was 2.2 mm, the stresses of both reached the same value of 25 N, and there was a slight oscillation near the peak strength. After compression by 3.128 mm, SAA fracture occurred under a pressure of 35.574 N and reached the peak value. The HSA was compressed by 3.238 mm at 53.293 N before breaking and reaching its peak value. Its pressure resistance was 1.498 times that of SAA, and the pressure curve showed that HSA was more ductile than SAA while resisting pressure. According to the material cross section shown in Figure 2c, the internal structure of HSA was denser and more compact than that of SAA, indicating that HAPNWs provide mechanical strength, and play a role in supporting and connecting as a ductile skeleton.
Together, the SEM, FTIR, and XRD results show that HAPNWs provide Ca2+ that can cluster with SA, while the abundant hydroxyl groups on their surface form hydrogen bonds with SA. SEM results show that the HSA structure is a porous honeycomb with a tighter internal structure than SAA, with a rougher surface and more pronounced wrinkles, and a dense and dispersed HAPNWs skeleton can be observed; The FTIR results showed that the hydroxyl group in the HSA material coordinated with Pb and a coordinated reaction occurred. The XRD results showed that the crystal peaks with diffraction angles (2θ) of about 31.7° and 32.9° corresponded to the diffraction peaks of hydroxyapatite (211) and (300) crystal phases, and the peak with diffraction angle of about 21.1° corresponded to the characteristic peak of SAA gel, indicating that the HSA materials containing SAA gel and hydroxyapatite had been successfully prepared.
Physically, HAPNWs are a two-dimensional material with high toughness. The embedded skeletal structure enhances the mechanical strength of the material. In summary, embedding of this inorganic biomass skeleton solves the problems of low strength, brittleness, and non-durability of traditional bio-adsorbent materials, and further enhances their service life and recyclability in practical applications.

3.2. Factors Affecting Adsorption Experiments
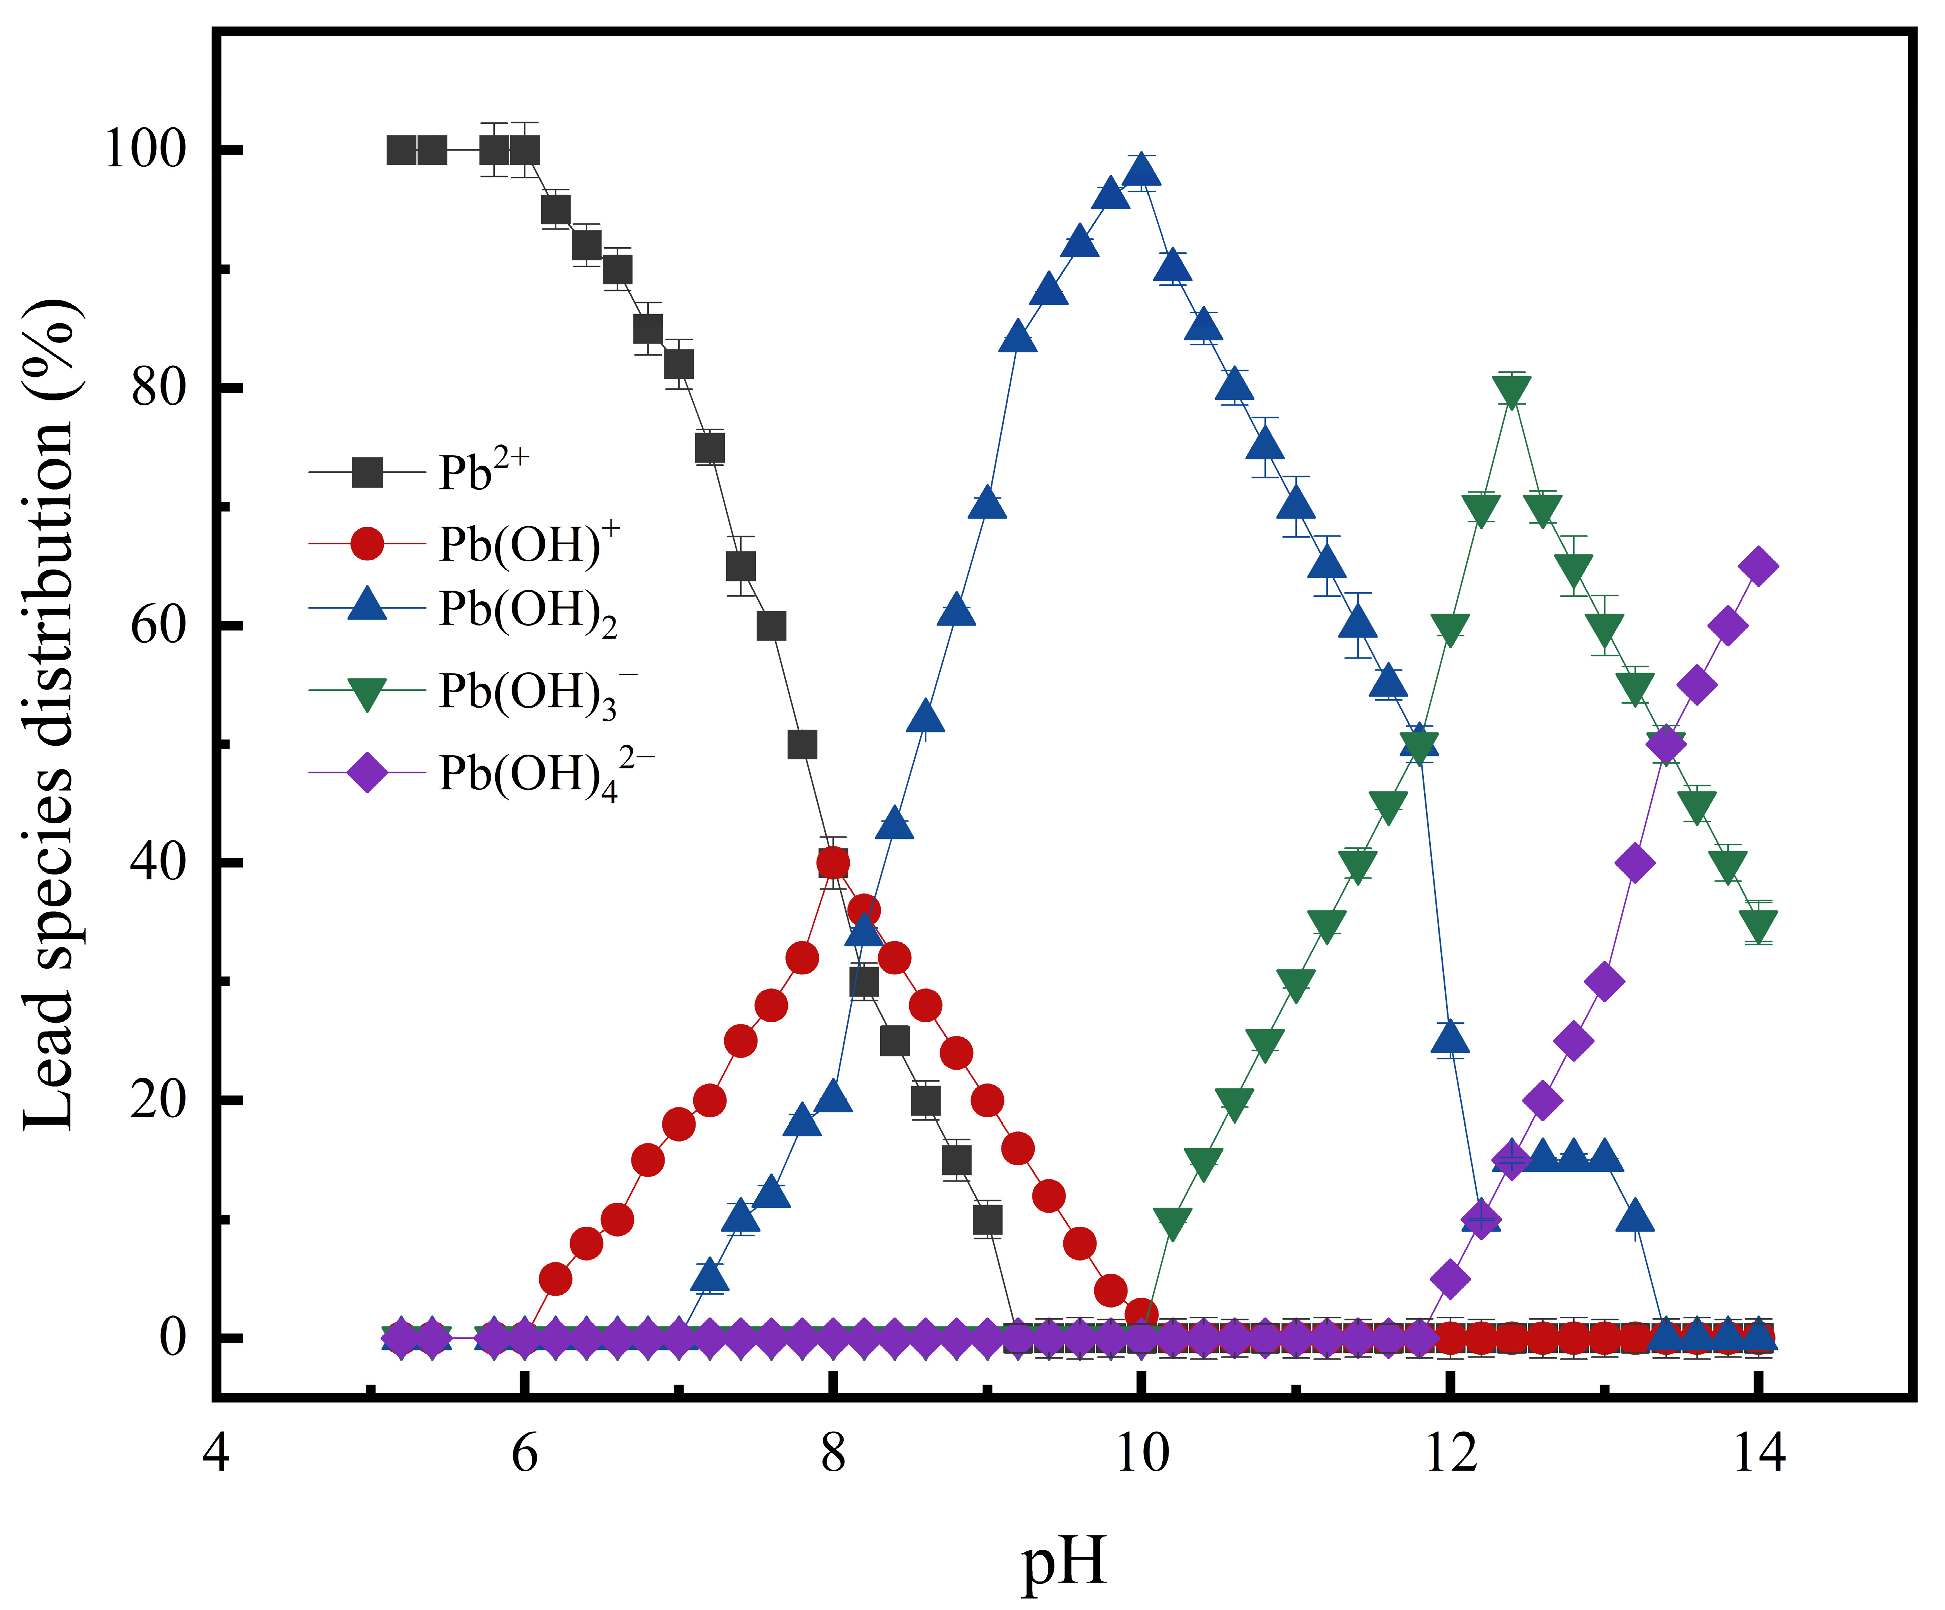
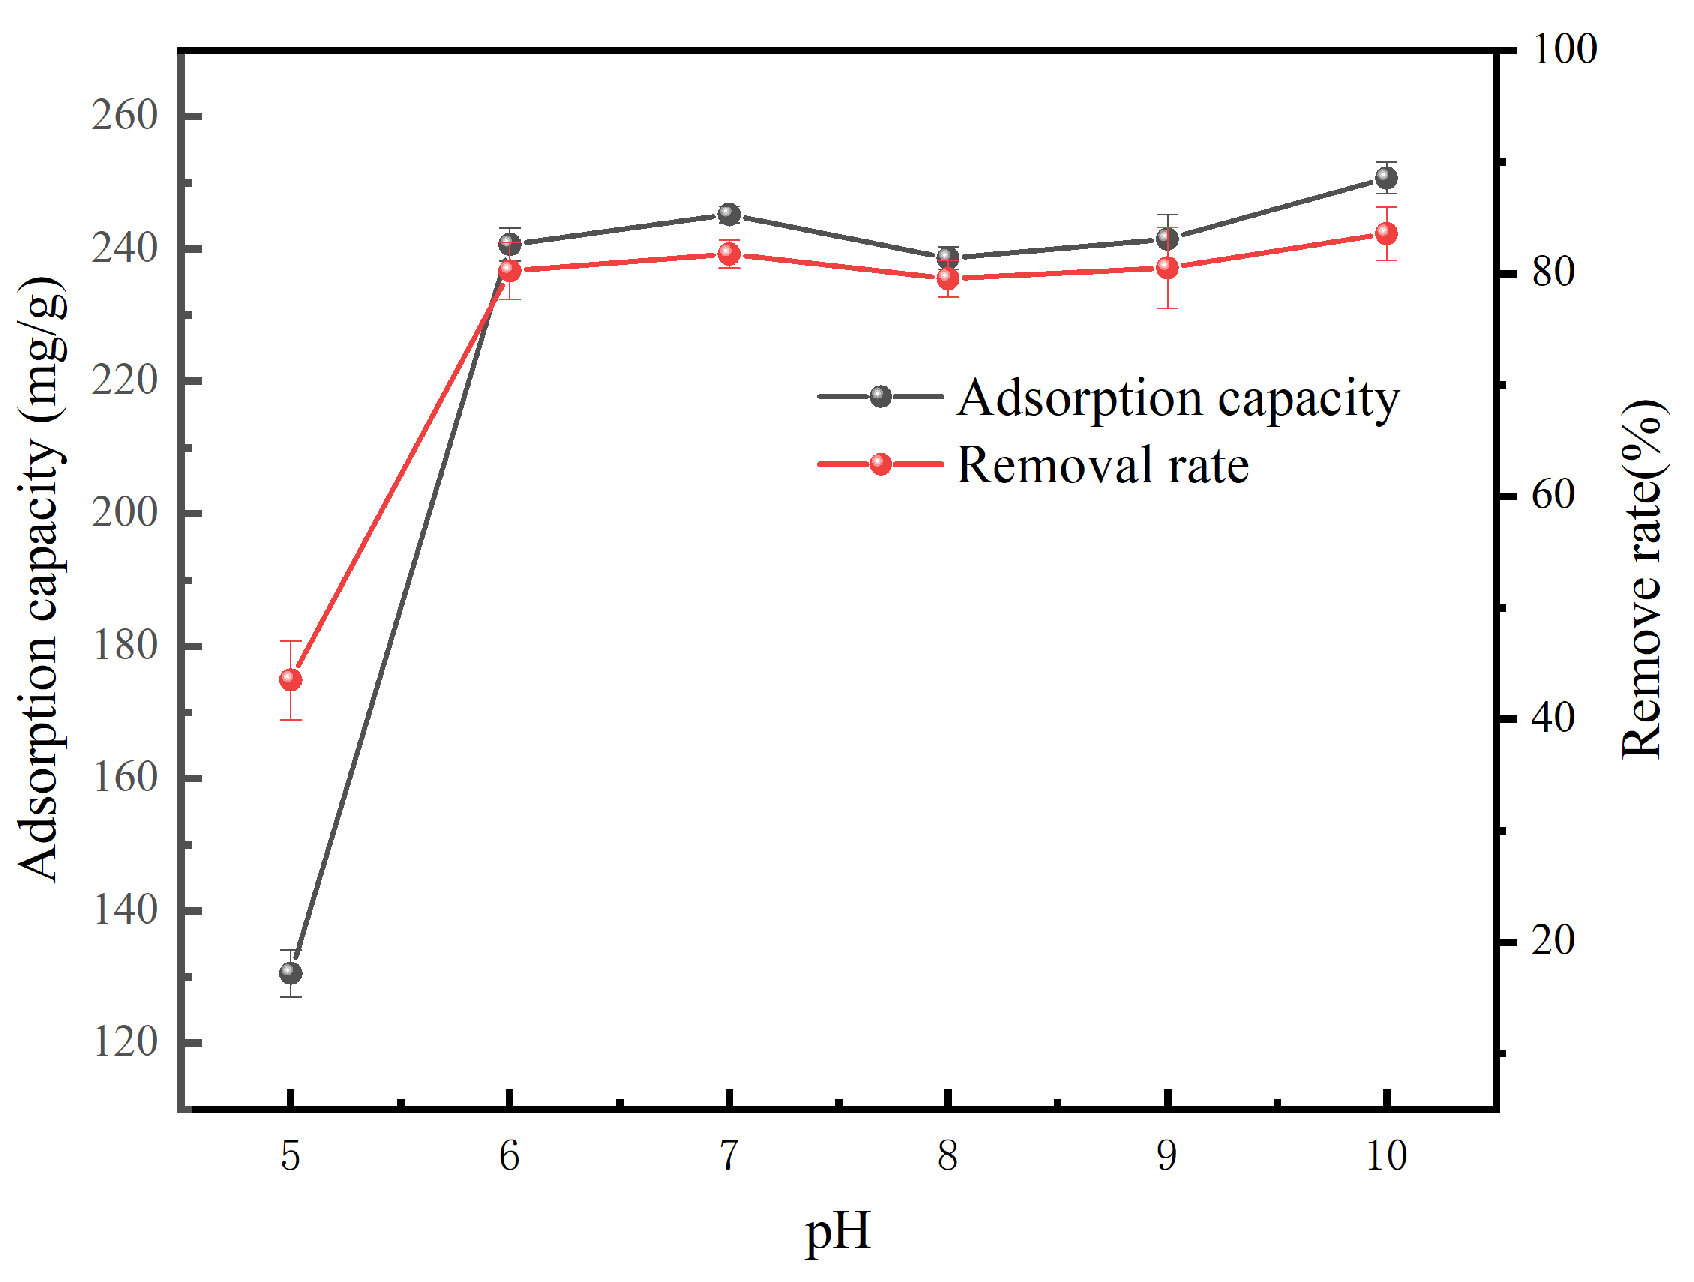
3.2.1. Effect of pH

The initial pH of the solution affects the form of Pb and charge on the surface of the adsorbent and is one of the important parameters affecting Pb removal. As shown in Figure 7, Pb was mainly present in the form of Pb2+, Pb(OH)+, Pb(OH)2, Pb(OH)3, and Pb(OH)42−, when simulated at different pH conditions (pH range was 5–10; analyzed using the Visula MINTEQ 3.1 software); when pH < 10, Pb was mainly present in the form of Pb2+. A 20 mL Pb(NO3)2 solution with an initial mass concentration of 300 mg/L was added to each of the five conical flasks to adjust the pH of the solution, 0.2 g of HSA was added, and the solutions were placed in a rotary constant-temperature gas-bath oscillator for 48 h at 25 °C and 150 r/min. The concentration of the Pb before and after adsorption was determined and the adsorption amount of HSA was calculated.
As shown in Figure 8, the experimental data showed that the adsorption of Pb2+ by HSA increased from 130.52 to 240.68 mg/g, and the removal rate increased to 80.22% when the pH increased from 5 to 6. At this time, there was a certain electrostatic repulsion between HSA and Pb2+, and H+ competed for the adsorption active site with Pb2+ [34], making it difficult for Pb2+ to be adsorbed by HSA. At pH < 6, Pb existed mainly in the ionic state. Beyond pH 6, electrostatic repulsion gradually decreased, and the adsorption capacity of HSA for Pb2+ increased. When the pH was 6–10, the removal ability increased slowly with increasing pH, possibly owing to saturation of the active sites on the surface of HSA, while the combination of Pb2+ with OH to generate Pb(OH)2 achieved the purpose of removing Pb2+. The adsorption of HSA increased gradually from pH 6 to 9, and reached its maximum (250.72 mg/g) when the pH reached 10. The adsorption of HSA decreased drastically as the pH increased from 10 to 14, and there was almost no adsorption capacity at all. HSA showed the best adsorption performance between pH 6 and 8, indicating that the adsorbent was most likely to adsorb Pb(OH)+ at pH < 10, and was less likely to adsorb Pb(OH)2, Pb(OH)3, and Pb(OH)42−.

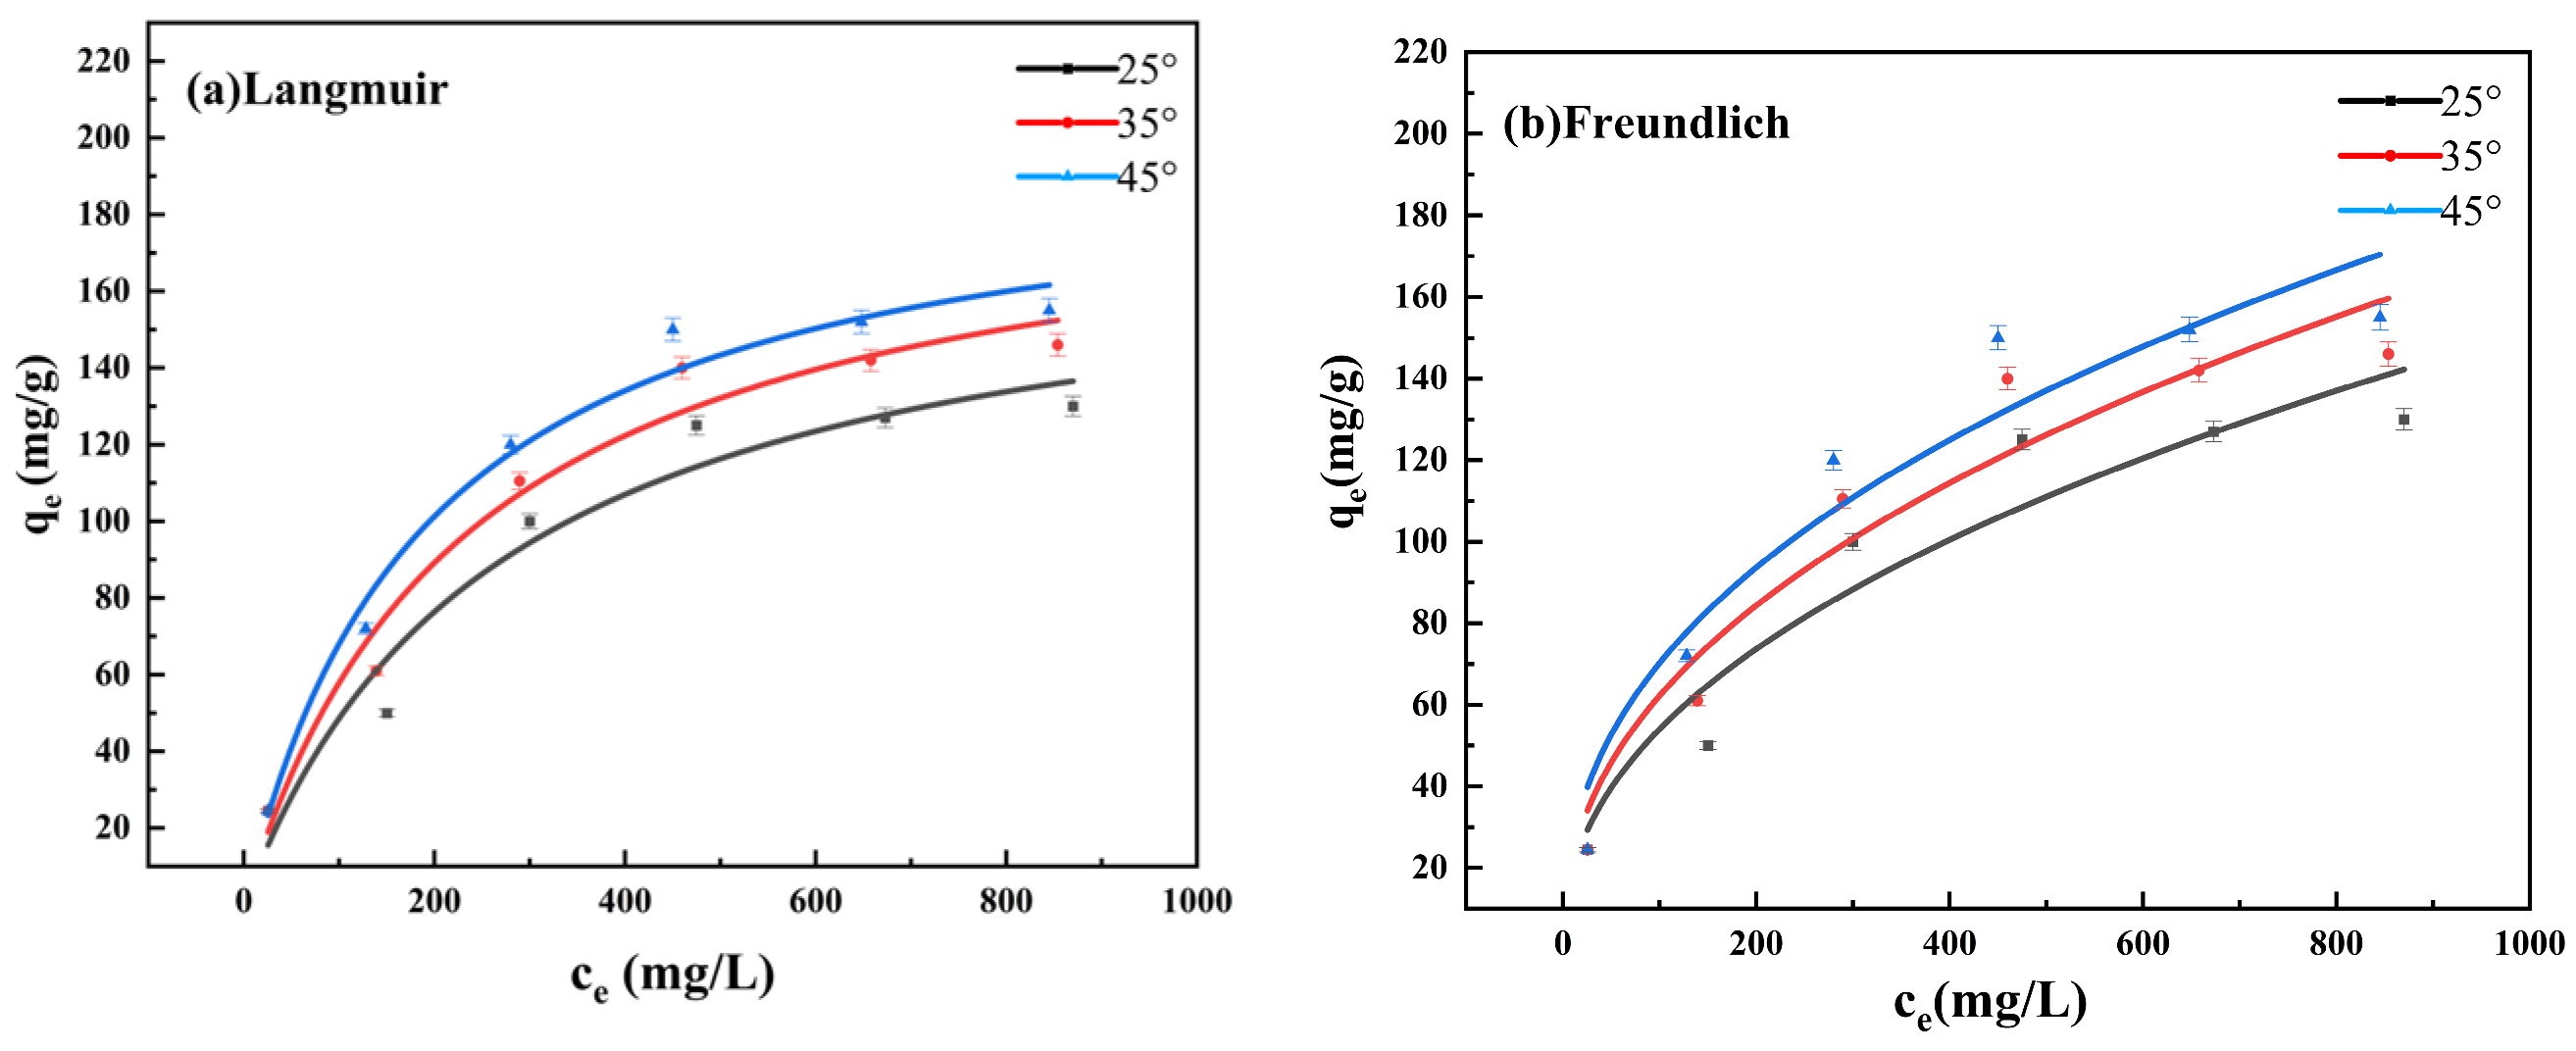
3.2.2. Effects of Concentration and Adsorption Isotherm Analysis

In each of the 18 conical flasks, 20 mL of Pb2+ solution, with different initial concentrations and pH = 7, was mixed with 0.2 g of HSA and shaken at 25 °C, 35 °C, or 45 °C for 48 h. The concentration of Pb2+ before and after adsorption was determined, and the amount of Pb adsorbed was calculated. The adsorption of heavy metals by adsorbents is largely determined by the initial concentration of heavy metals, which can determine the mass transfer efficiency of pollutants between the solid–liquid phase [35]. As shown in Figure 9, the removal pattern of Pb2+ was consistent at all three temperatures when the initial concentration of Pb2+ increased from 50 to 1000 mg/L. The adsorption capacity increased from 24.48 mg/g (25 °C), 24.52 mg/g (35 °C), and 24.64 mg/g (45 °C) to 130 mg/g (25 °C), 146 mg/g (35 °C), and 155 mg/g (45 °C), respectively. The increased concentration difference between the pollutant and adsorbent was a source of greater mass transfer power, promoting the migration of more Pb2+ to the surface of the HSA.
The adsorption amount of HSA also increased with increasing temperature, but decreased at 45 °C, likely because of changes in the physical and chemical properties of the HSA. Isothermal adsorption characterization was used to determine the adsorption process and thermodynamic equilibrium relationship between Pb2+ and HSA under constant temperature conditions, as well as to explore the mechanism and capacity of HSA to adsorb Pb2+. The Langmuir and Freundlich models were used to fit the experimental data; isothermally fitted curves of the adsorption of Pb2+ by HSA (Langmuir and Freundlich) are shown in Figure 9a,b, and the parameters in the adsorption isotherm fitting are listed in Table 1. The fitting results for the Langmuir model exhibited superior R2 values, indicating that the entire adsorption process is based on monolayer adsorption on a uniform surface [36].

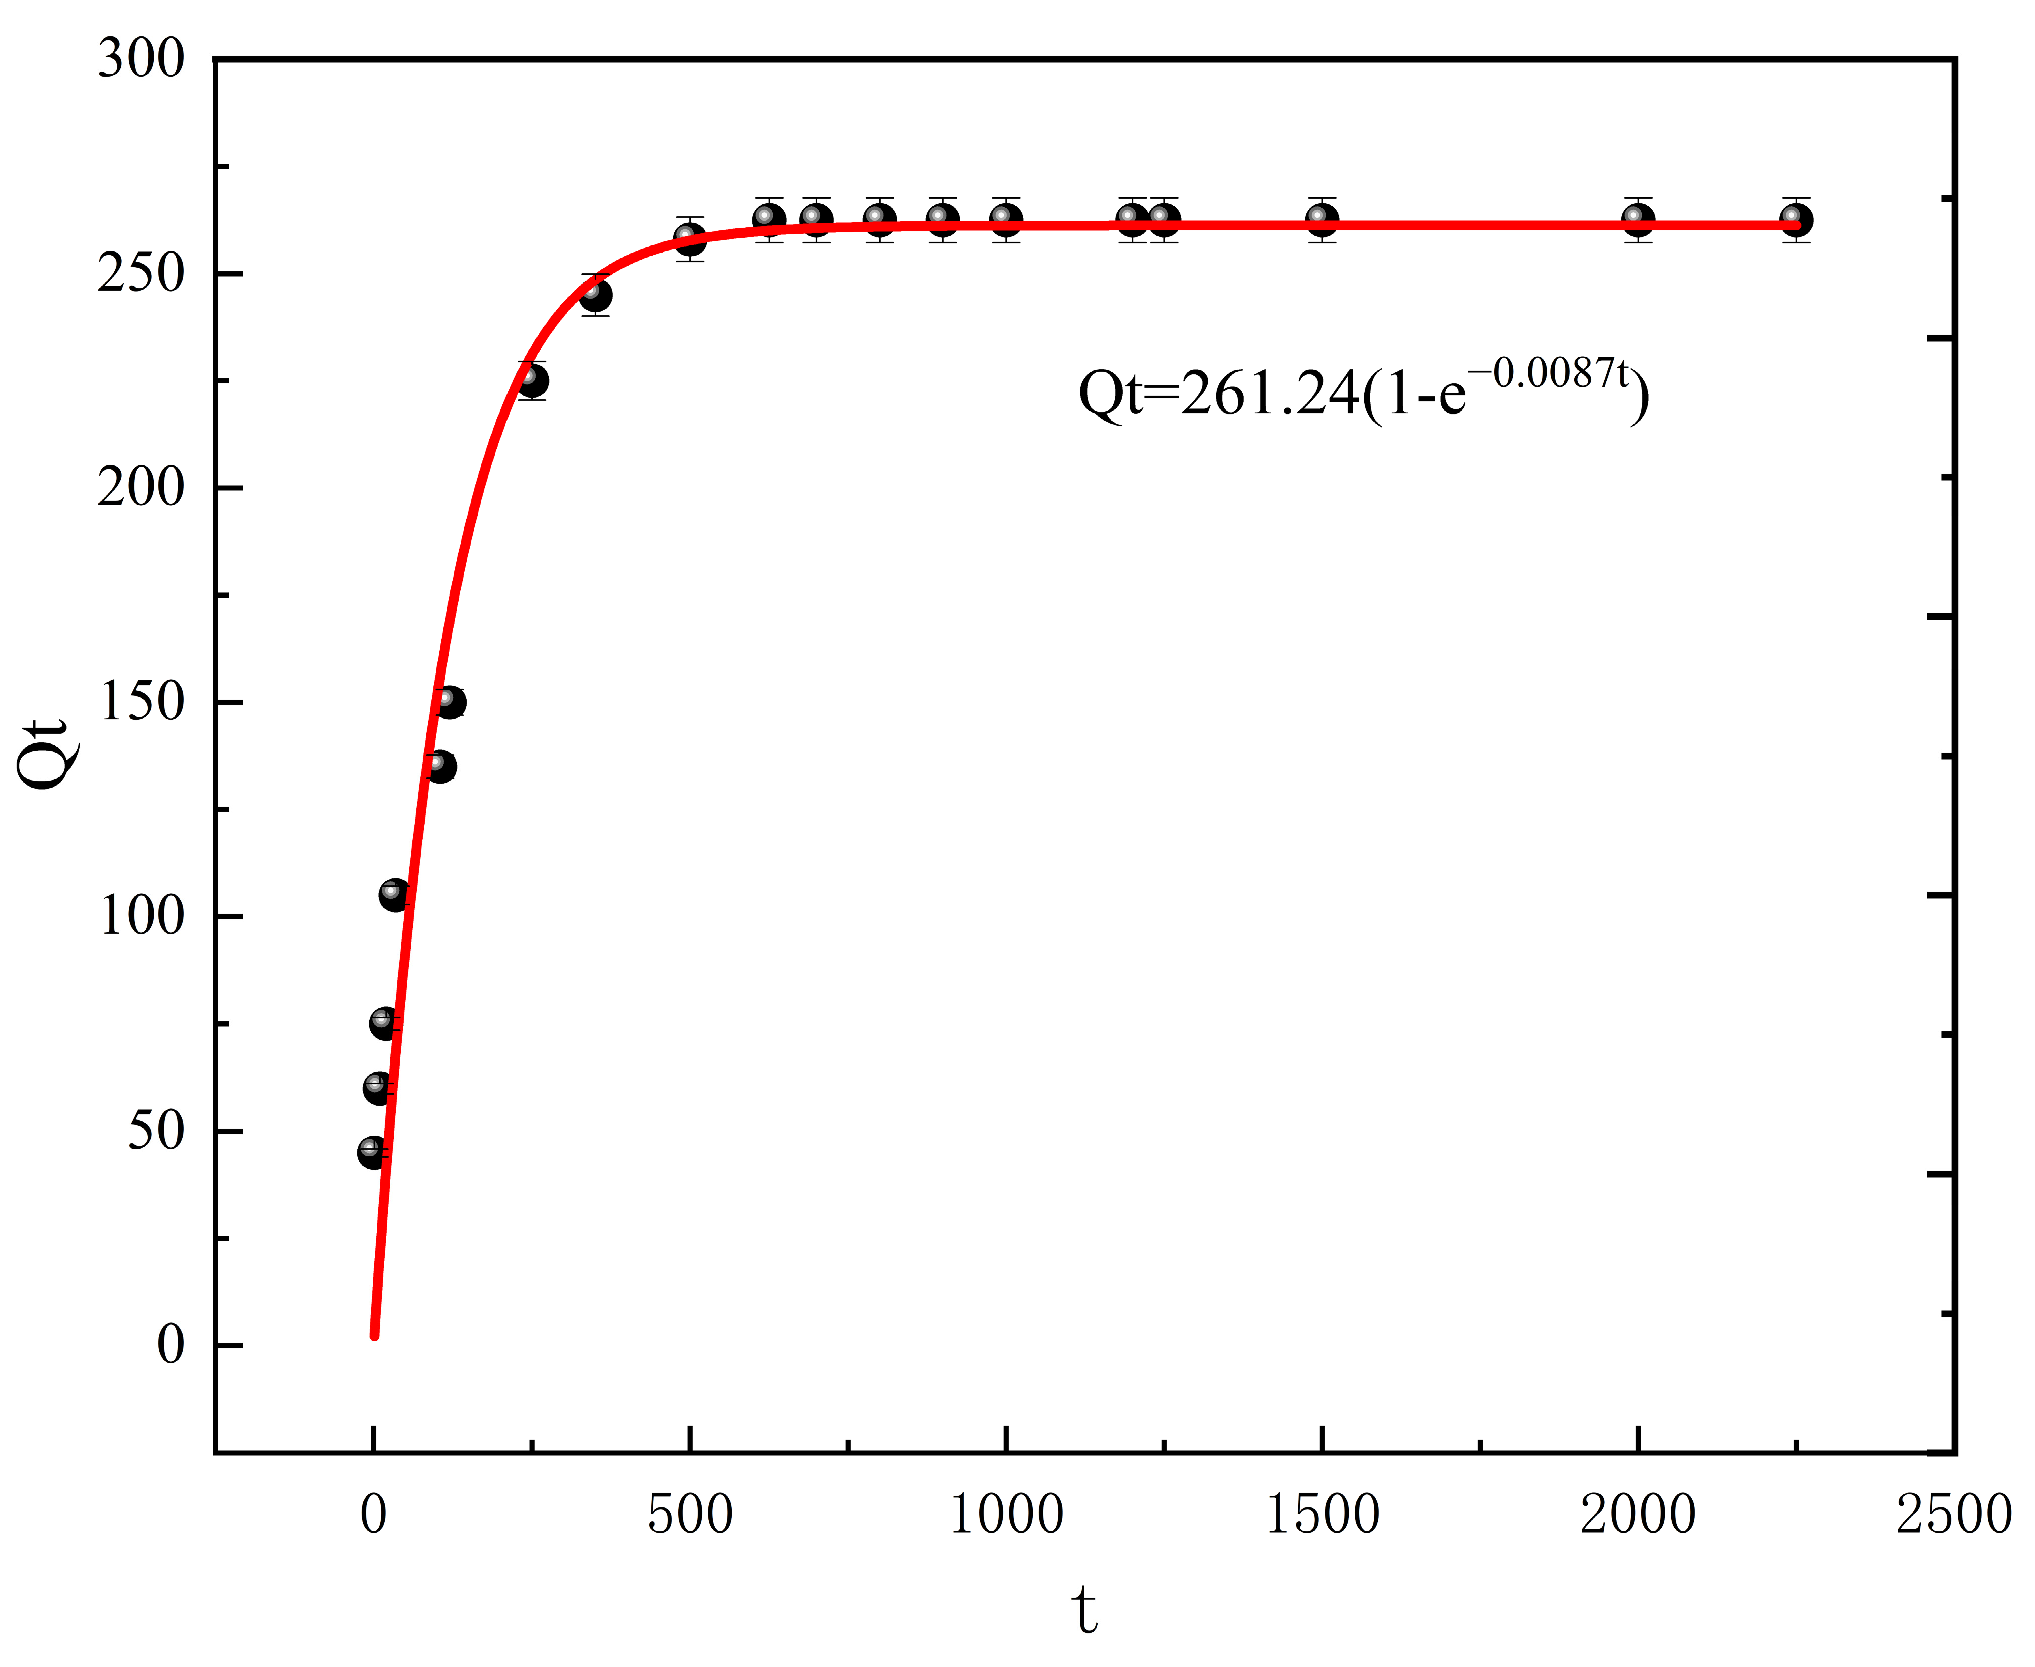
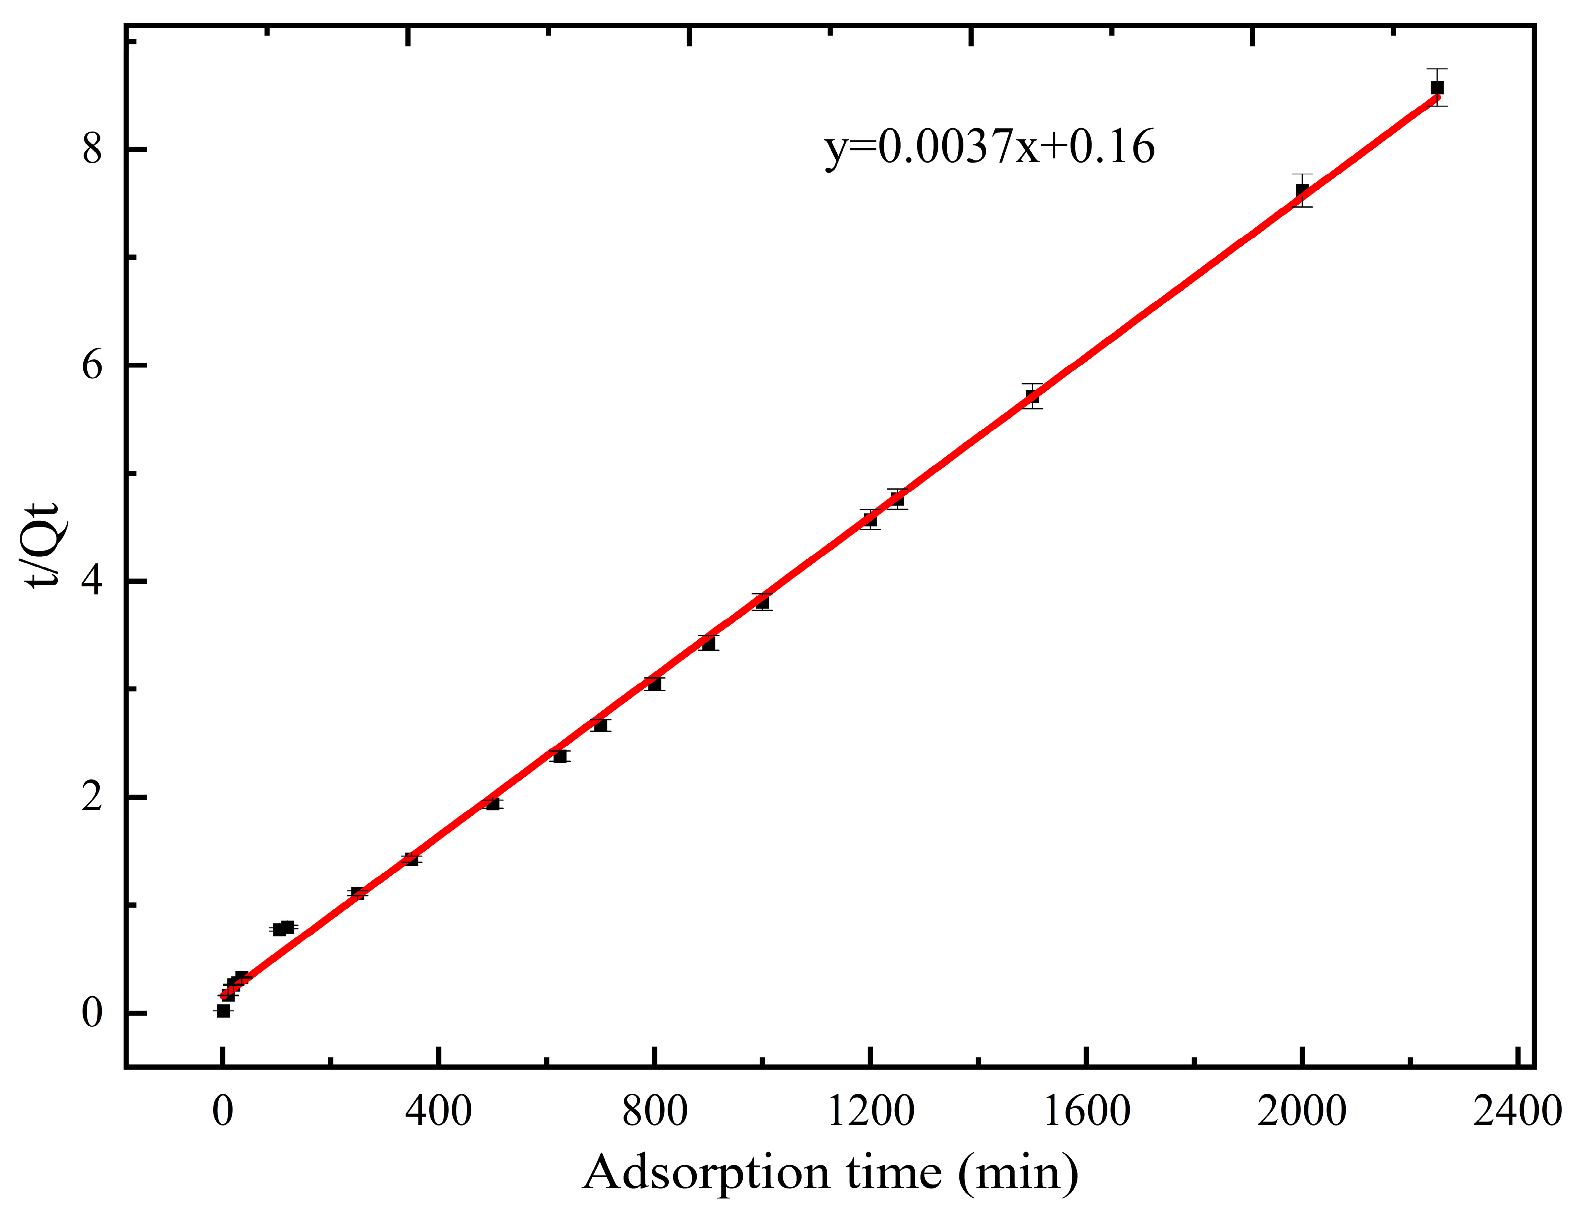
3.2.3. Effect of Time and Adsorption Kinetics

In each of the 19 conical flasks, we combined 20 mL of Pb2+ solution (initial mass concentration of 300 mg/L and pH = 6) with 0.3 g of HSA powder. The concentration of Pb2+ after adsorption was determined by ICP–OES after 1, 10, 20, 35, 105, 120, 250, 350, 500, 625, 700, 800, 900, 1000, 1200, 1250, 1500, 2000, and 2250 min (Figure 10). The adsorption amount of HSA gradually increased with increasing adsorption time. Between 1 and 500 min, the adsorption amount increased rapidly from 30.53 to 258.36 mg/g, and there were a large number of effective adsorption active sites on the surface of the HSA. There was a large difference between the concentration of Pb2+ on the surface of HSA and that in solution, and so the mass transfer power was strong. Between 500 and 2250 min, the adsorbed amount increased slowly and reached saturation at 625 min [37]. Thus, the number of active sites in the adsorbent bound to Pb2+ decreased.
Figure 11 and Figure 12 show fitting analyses of the pseudo-primary and pseudo-secondary adsorption kinetic models of HSA for Pb2+, respectively; the fitting results are shown in Table 2. From a single R2, the pseudo-secondary adsorption kinetic model had the best fit (R2 = 0.9986), whereas that of the R2 of the pseudo-secondary adsorption kinetic model was only 0.9444. The adsorption of Pb2+ by HSA was consistent with the pseudo-secondary adsorption kinetic model, and the adsorption process was mainly controlled by chemisorption.

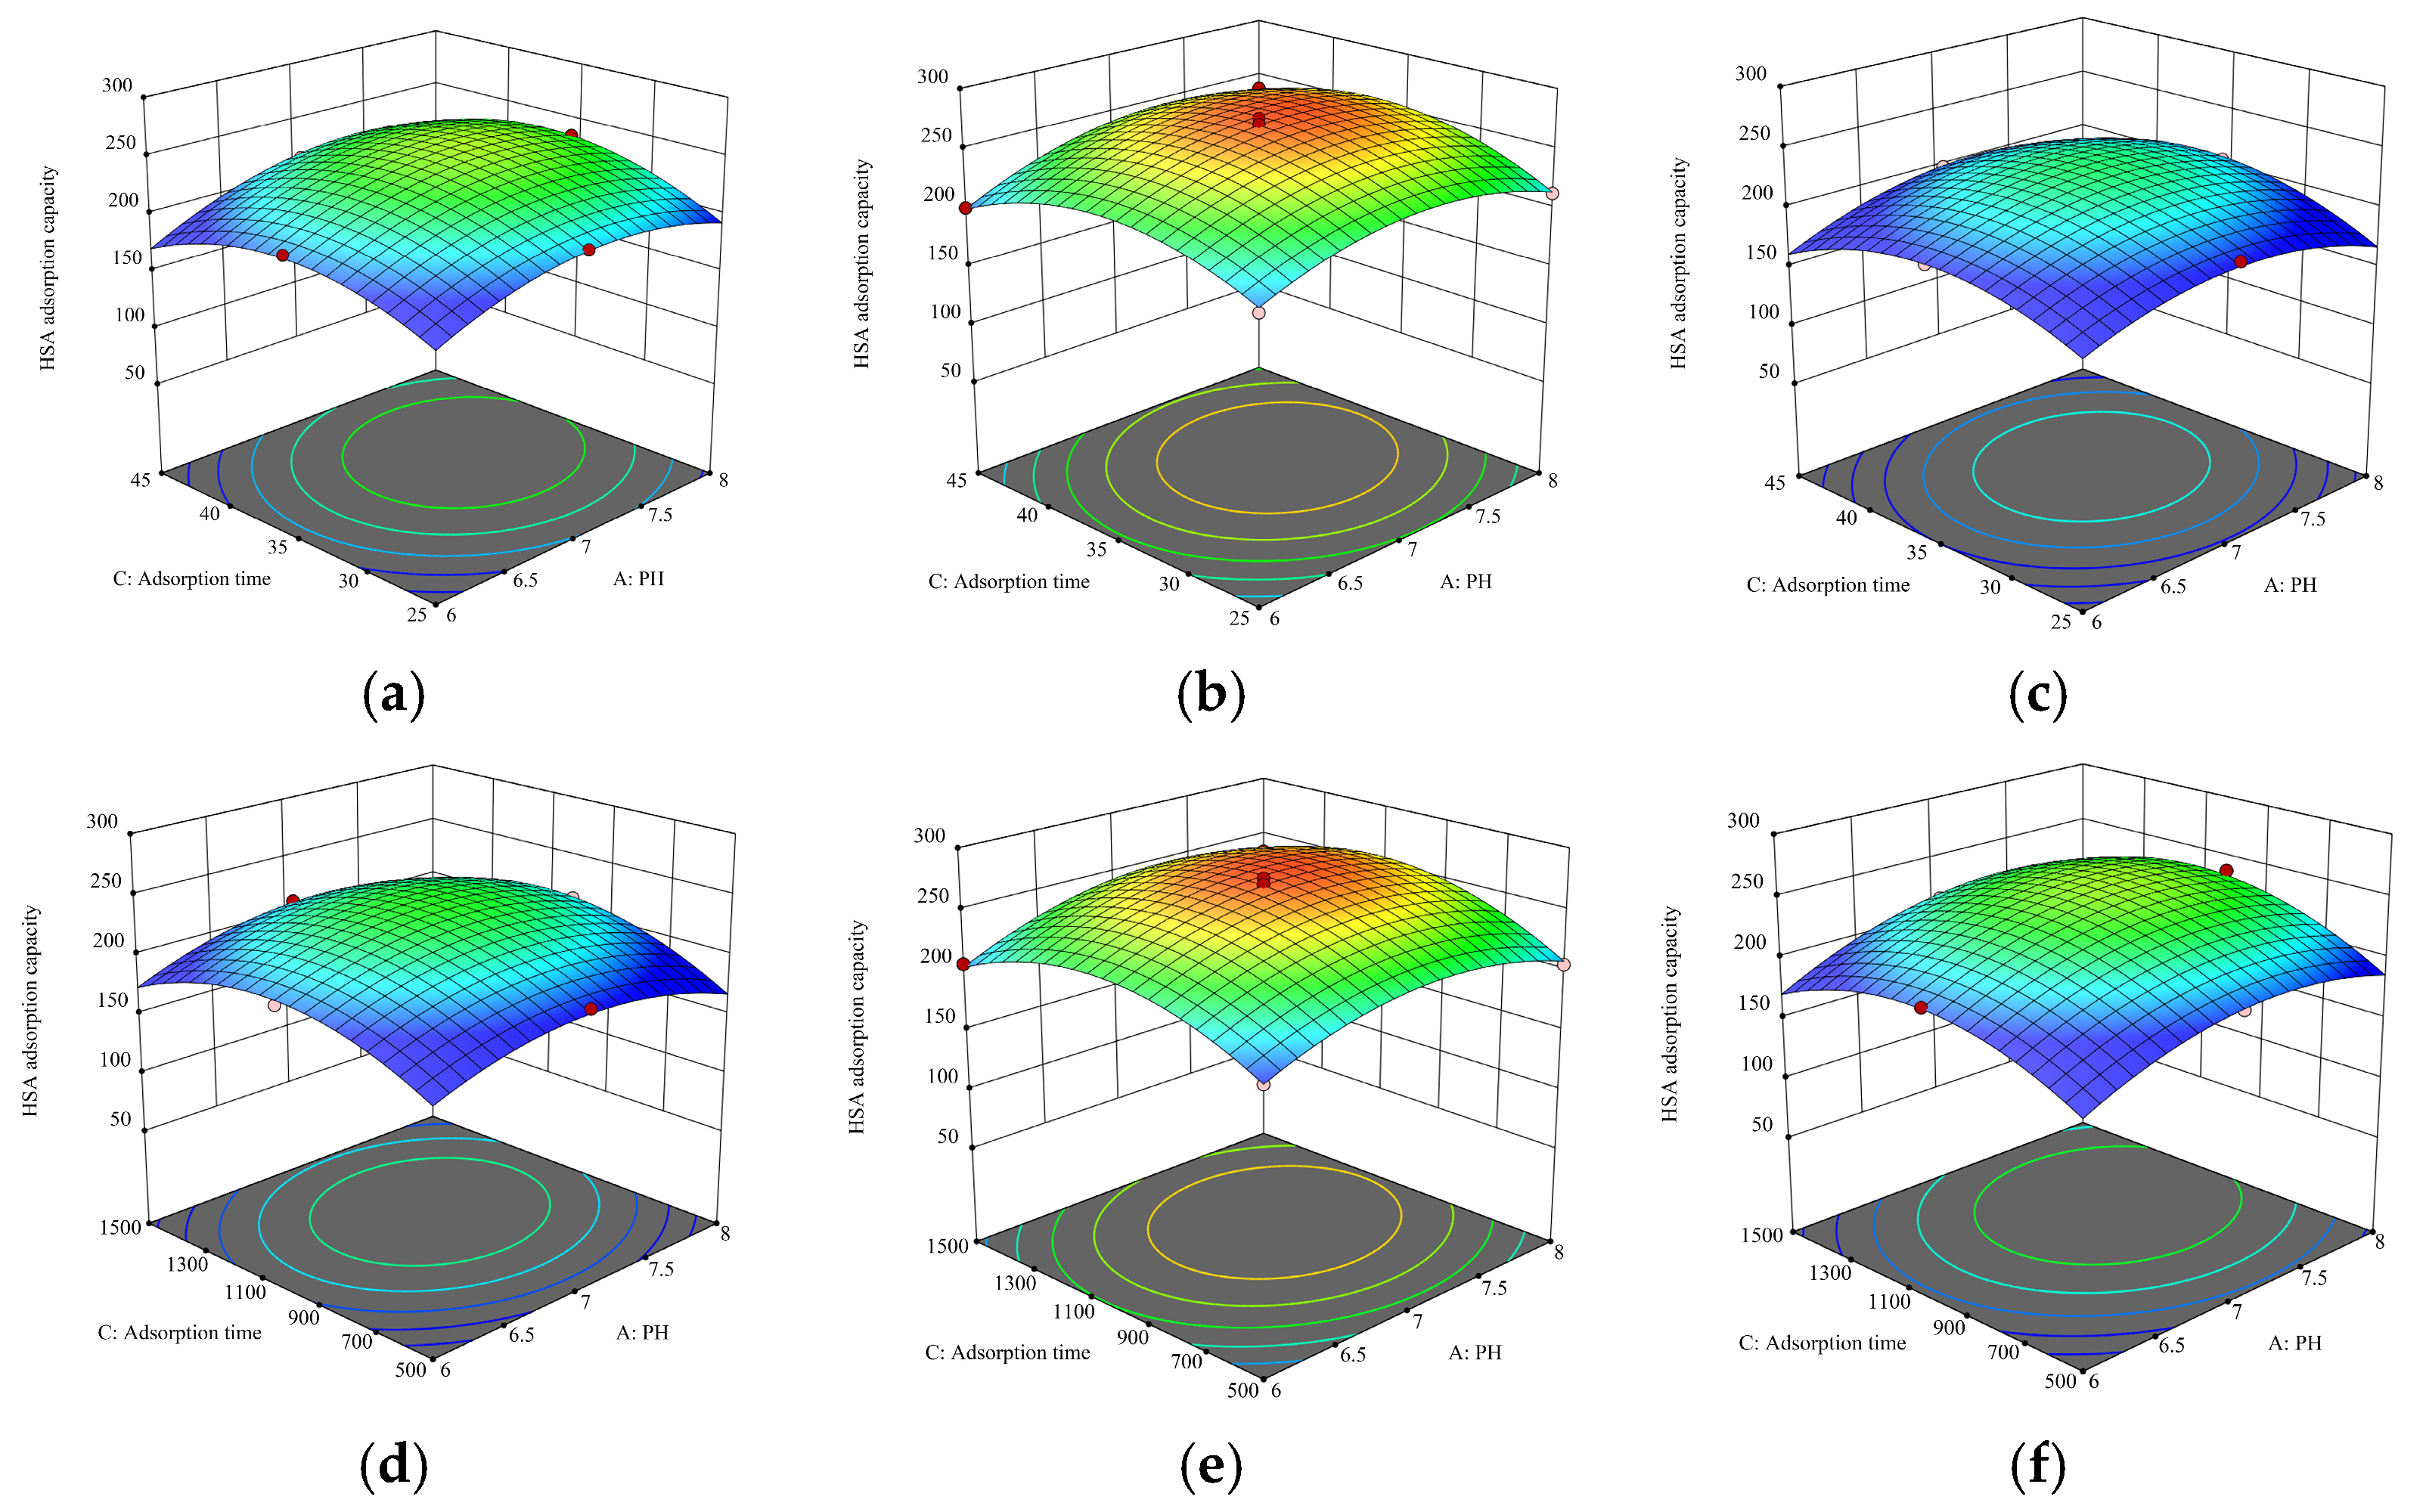
3.3. Optimization of HSA Adsorption Conditions Using Response Surface Methodology

3.3.1. Experimental Model Fitting

For the response surface method, we used Box–Behnken in the Design-Expert 13 software to design the experimental factors and levels. The experimental values of the response surface optimization conditions are shown in Table 3; among the 17 experimental points, the first 12 are analytical factorization points, and the independent variables were taken at the three-dimensional vertices composed of A, B, and C. Three important factors, namely pH (A), temperature (B), and adsorption time (C), were examined to investigate the factors affecting the adsorption of Pb2+ by HSA. The experimental arrangement is shown in Table 4, and the model variance results are shown in Table 5.
Multivariate regression was fitted to the data in Table 4 using the Design-Expert software; a quadratic multinomial regression model of HSA adsorption Q on A, B, and C was obtained as follows:
Q = 269.68 + 11.27A + 8.71C + 5.88AB + 4.50AC + 0.4985BC − 25.90A2 − 30.94B2 − 33.72C2
where Q is the amount of adsorbed HSA, A is the pH of the solution, B is the temperature, and C is the adsorption time. The F-value of the HSA adsorption model was 74.31, which indicated that the model was significant. The correlation coefficient R2 of the model was 0.9896, indicating that the model could explain 98.96% of the variation of the response value, which was a better fit than with the actual experiments. The CV% of the model (the coefficient of variation of Y) was very low (2.08), indicating that the model had a very high degree of reliability. The signal-to-noise ratio of the model was 21.1981 (which was much larger than 4) and the corrected correlation coefficient was 0.9763, which differs from the pre-correction correlation coefficient, confirming that the model has a high degree of reliability. Regression equation coefficient significance test table was shown in Table 6. Overall, the model was well fitted with small experimental errors and could be used to analyze and predict changes in the HSA adsorption Q.

3.3.2. Analysis of Response Surface Results

Figure 13a–c shows the response surface and contour projections of the effects of temperature and pH on the adsorption amount of HSA. The curvature of the surface formed by the effect of temperature and pH on the adsorption amount of HSA varied; when adsorption time was constant, the adsorption amount of HSA increased and then decreased with increasing pH. The response surface was steeper in the temperature direction, indicating that the effect of temperature was greater than that of pH. The HSA adsorption amount was higher for an adsorption time of 1000 min compared with that for adsorption times of 500 and 1500 min. Figure 13d–f shows the response surfaces of the effect of adsorption time and pH on the adsorption amount of HSA as well as the contour projection plots. When the pH was constant, the adsorption amount Q increased and then decreased with increasing adsorption time. The response surface changed gently in the direction of pH, indicating that the effect of adsorption time was greater than that of pH. The adsorption amount of HSA at an adsorption temperature of 35 °C was higher than that at adsorption temperatures of 25 °C and 45 °C. Figure 13g–i shows the response surface as well as the contour projection of the effect of adsorption time and temperature together on the HSA adsorption amount. For a constant temperature, with increasing adsorption time, HSA adsorption first increased and then decreased. In summary, both adsorption time and temperature had significant effects on HSA adsorption, while the amount of HSA adsorbed was higher at pH 7 than it was at pH 6 or pH 8.

3.3.3. Validation of Results

The maximum HSA adsorption amount was calculated from the response surface model. The optimal conditions, obtained by numerical optimization using Design-Expert 13, were pH of 7.23, temperature of 35.42 °C, and adsorption time of 1050.73 min; at these conditions, the maximum HSA adsorption amount was predicted to be 275.652 mg/g. To verify the accuracy of the proposed optimization conditions, five sets of parallel experiments were performed. The HSA adsorption amount was 278.4 mg/g under the optimal conditions, which was close to the predicted value, confirming that the response surface optimization model was highly reliable and could be used to optimize the experimental conditions of this system.

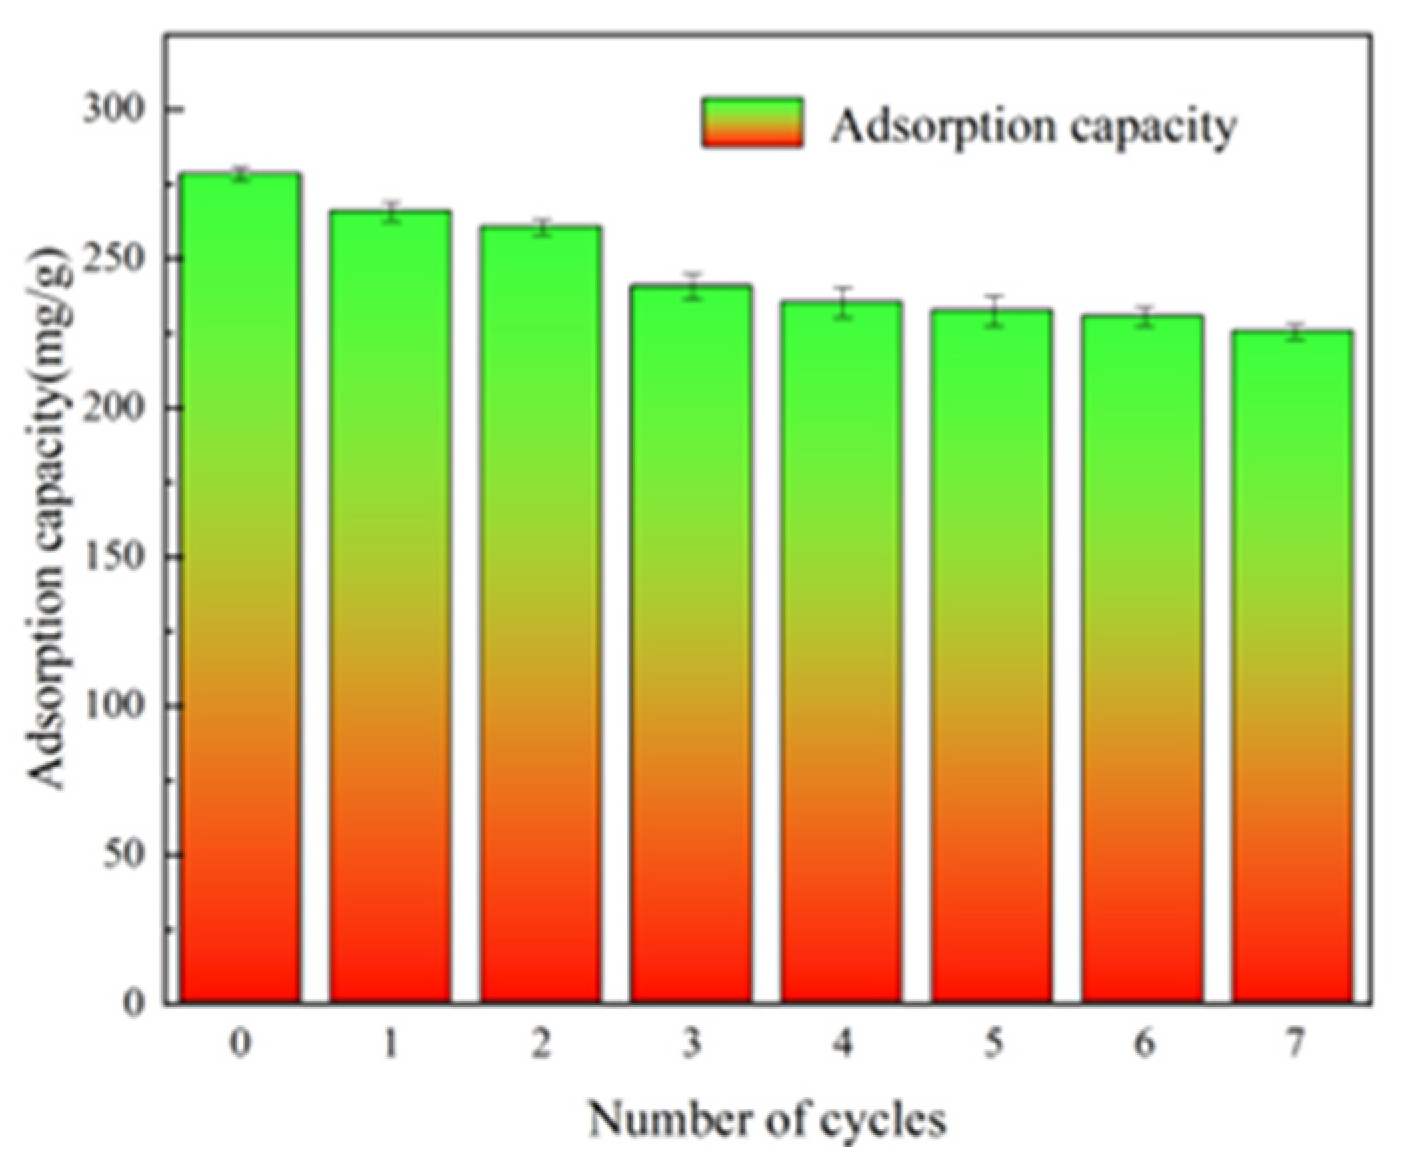
3.3.4. Reuse Efficiency of Adsorbent

The influence curve of HSA adsorbent recycling times on adsorption capacity is shown in Figure 14. With the increase of recycling times of HSA materials, the adsorption capacity of HSA for Pb2+ gradually decreased. After seven times of reuse, the adsorption capacity of 0.3 g HSA for Pb2+ decreased from 278.4 mg/g to 225.5 mg/g. This is because the adsorbed Pb2+ cannot be completely washed out in the washing process, but the retention rate of adsorption capacity is still maintained at 81%, indicating that HSA adsorbent has good reusability.

3.3.5. Mechanism Speculation

SEM showed that the microstructure of HSA changed significantly after adsorption, and a part of the Pb2+ was captured by ion exchange. XRD characterization showed that the diffraction peak of the XRD diffraction pattern of HSA was finer, the crystallinity of the material was improved by loading hydroxyapatite, and the diffraction peak of Pb appeared at diffraction angles of about 36.1°, 46.9° and 56.7°, which shows Pb2+ exists in HSA as a low crystalline compound or complex. The FTIR test showed that a new characteristic peak appeared at 497 cm−1 after adsorption, which was attributed to the bending vibration peak of Pb–O. The hydroxyl group in HSA material coordinated with Pb. Combined with the effect of pH, the whole adsorption process conformed to Langmuir and Freundlich kinetic models. It was concluded that the adsorption of Pb2+ on HSA was a multi molecular physicochemical adsorption mechanism based on ion exchange and surface complexation.

3.3.6. A Comparison of the Used Sorbent Material with Other Studies

A comparison of the used sorbent material with other studies that have been reported in the literature is shown in Table 7.

4. Conclusions

The adsorption conditions of HSA on Pb2+ in 300 mg/L Pb2+ aqueous solution were investigated using a one-way experimental system; the optimal adsorption conditions were pH of 7.23, adsorption temperature of 35.42 °C, and adsorption time of 1050.73 min. The adsorption was most consistent with the Langmuir isothermal adsorption model and the adsorption process was mainly controlled by a chemisorption mechanism. SEM images confirmed that HAPNWs were successfully and effectively embedded in the aerogel material; XRD showed that the structure of HSA loaded with Pb was still the same as that of HSA, indicating that the sample had a strong adsorption capacity for Pb, and that the structure did not significantly change after adsorption. FTIR demonstrated that the hydroxyl group in the HSA material coordinated with Pb and a coordination reaction occurred. Mechanical testing showed that HAPNWs provide a certain degree of toughness for the preparation of HSA synthetic materials, and play an important supporting and connecting role as a tough skeleton.

Author Contributions

Conceptualization, Z.Y. and W.C.; methodology, R.L. and W.C.; formal analysis, Z.Z. (Zilin Zhang) and W.C.; investigation, Z.Z. (Zilin Zhou) and W.C.; resources, L.X.; data curation, G.C. and W.C.; writing—original draft, W.C. and L.X.; writing—review and editing, L.X. and W.C.; visualization, W.C. and L.X.; supervision, L.X.; project administration, L.X.; funding acquisition, W.C. All authors have read and agreed to the published version of the manuscript.

Funding

This research was funded by the Research funds of The Guangxi Key Laboratory of Theory and Technology for Environmental Pollution Control (guikeneng 2301Z003).

Data Availability Statement

The data that support the findings of this study are available from the corresponding author upon reasonable request.

Conflicts of Interest

Author Renliu was employed by the Beijing Xincheng Yulu Environmental Protection Technology Limited Company. The remaining authors declare that the research was conducted in the absence of any commercial or financial relationships that could be construed as a potential conflict of interest.

References

  1. Zhang, S.; Han, X.; Cai, H.; Wu, X.; Yuan, Y.; Zhang, Y. Aramid nanofibers/WS2 nanosheets co-assembled aerogels for efficient and stable Pb (II) adsorption in harsh environments. Chem. Eng. J. 2022, 450, 138268. [Google Scholar] [CrossRef]
  2. Luo, J.; Fan, C.; Zhou, X. Functionalized graphene oxide/carboxymethyl chitosan composite aerogels with strong compressive strength for water purification. J. Appl. Polym. Sci. 2021, 138, e50065. [Google Scholar] [CrossRef]
  3. Rizk, H.E.; Imam, D.M.; Attallah, M.F. Potential Fast and Promising Separation for Valuable Ions of Biomedical Interest. Russ. J. Appl. Chem. 2023, 96, 385–394. [Google Scholar] [CrossRef]
  4. Liao, J.; Ru, X.; Xie, B.; Zhang, W.; Wu, H.; Wu, C.; Wei, C. Multi-phase distribution and comprehensive ecological risk assessment of heavy metal pollutants in a river affected by acid mine drainage. Ecotoxicol. Environ. Saf. 2017, 141, 75–84. [Google Scholar] [CrossRef] [PubMed]
  5. Benhalima, L.; Amri, S.; Bensouilah, M.; Ouzrout, R. Heavy Metal Resistance AND Metallothionein Induction in Bacteria Isolated from Seybouse River, Algeria. Appl. Ecol. Environ. Res. 2020, 18, 1721–1737. [Google Scholar] [CrossRef]
  6. Edokpayi, J.N.; Odiyo, J.O.; Msagati, T.A.M.; Popoola, E.O. A Novel Approach for the Removal of Lead (II) Ion from Wastewater Using Mucilaginous Leaves of Diceriocaryum eriocarpum Plant. Sustainability 2015, 7, 14026–14041. [Google Scholar] [CrossRef]
  7. Li, L.P.; Zhang, Y.Q.; Ippolito, J.A.; Xing, W.Q.; Qiu, K.Y.; Yang, H. Lead smelting effects heavy metal concentrations in soils, wheat, and potentially humans. Environ. Pollut. 2020, 257, 113641. [Google Scholar] [CrossRef]
  8. Zheng, X.Y.; Guo, C.M.; Lv, Z.J.; Jiang, H.J.; Li, S.Y.; Lu, Y.; Zhang, Z. From animal to cell model: Pyroptosis targeted-fibrosis is a novel mechanism of lead-induced testicular toxicity. Food. Chem. Toxicol. 2023, 178, 113886. [Google Scholar] [CrossRef]
  9. Abdel-Raheem, K.H.M.; Khalil, M.M.; Abdelhady, A.A.; Tan, L. Anthropogenic-induced environmental and ecological changes in the Nile Delta over the past half-century. Sci. Total. Environ. 2024, 926, 171941. [Google Scholar] [CrossRef]
  10. Vellingiri, B.; Suriyanarayanan, A.; Selvaraj, P.; Abraham, K.S.; Pasha, M.Y.; Winster, H.; Gopalakrishnan, A.V.; Singaravelu, G.; Reddy, J.K.; Ayyadurai, N.; et al. Role of heavy metals (copper (Cu), arsenic (As), cadmium (Cd), iron (Fe) and lithium (Li)) induced neurotoxicity. Chemosphere 2022, 301, 134625. [Google Scholar] [CrossRef]
  11. Zare, E.N.; Motahari, A.; Sillanpää, M. Nanoadsorbents based on conducting polymer nanocomposites with main focus on polyaniline and its derivatives for removal of heavy metal ions/dyes: A review. Enviro. Res. 2018, 162, 173–195. [Google Scholar] [CrossRef]
  12. Hasanpour, M.; Hatami, M. Application of three dimensional porous aerogels as adsorbent for removal of heavy metal ions from water/wastewater: A review study. Adv. Colloid. Interfac. 2020, 284, 102247. [Google Scholar] [CrossRef] [PubMed]
  13. Ibrahim, M.; Labaki, M.; Giraudon, J.-M.; Lamonier, J.-F. Hydroxyapatite, a multifunctional material for air, water and soil pollution control: A review. J. Hazard. Mater. 2020, 383, 121139. [Google Scholar] [CrossRef] [PubMed]
  14. Yan, Y.; Lu, L.; Li, Y.; Han, W.; Gao, A.; Zhao, S.; Cui, J.; Zhang, G. Robust and Multifunctional 3D Graphene-Based Aerogels Reinforced by Hydroxyapatite Nanowires for Highly Efficient Organic Solvent Adsorption and Fluoride Removal. Acs. Appl. Mater. Inter. 2022, 14, 25385–25396. [Google Scholar] [CrossRef] [PubMed]
  15. Jiang, Y.-Y.; Zhu, Y.-J.; Chen, F.; Wu, J. Solvothermal synthesis of submillimeter ultralong hydroxyapatite nanowires using a calcium oleate precursor in a series of monohydroxy alcohols. Ceram. Int. 2015, 41, 6098–6102. [Google Scholar] [CrossRef]
  16. Guo, W.; Liu, J.; Zhang, P.; Song, L.; Wang, X.; Hu, Y. Multi-functional hydroxyapatite/polyvinyl alcohol composite aerogels with self-cleaning, superior fire resistance and low thermal conductivity. Compos. Sci. Technol. 2018, 158, 128–136. [Google Scholar] [CrossRef]
  17. Gao, C.; Wang, X.-L.; An, Q.-D.; Xiao, Z.-Y.; Zhai, S.-R. Synergistic preparation of modified alginate aerogel with melamine/chitosan for efficiently selective adsorption of lead ions. Carbohyd. Polym. 2021, 256, 117564. [Google Scholar] [CrossRef]
  18. Rong, N.N.; Chen, C.C.; Ouyang, K.W.; Zhang, K.J.; Wang, X.R.; Xu, Z.Y. Adsorption characteristics of directional cellulose nanofiber/chitosan/montmorillonite aerogel as adsorbent for wastewater treatment. Sep. Purif. Technol. 2021, 274, 119120. [Google Scholar] [CrossRef]
  19. Chai, W.S.; Cheun, J.Y.; Kumar, P.S.; Mubashir, M.; Majeed, Z.; Banat, F.; Ho, S.H.; Show, P.L. A review on conventional and novel materials towards heavy metal adsorption in wastewater treatment application. J. Clean. Prod. 2021, 296, 126589. [Google Scholar] [CrossRef]
  20. Fedotov, P.S.; Dzhenloda, R.K.; Dampilova, B.V.; Doroshkevich, S.G.; Karandashev, V.K. Unexpected behavior of Zn, Cd, Cu, and Pb in soils contaminated by ore processing after 70 years of burial. Environ. Chem. Lett. 2018, 16, 637–645. [Google Scholar] [CrossRef]
  21. Wang, J.L.; Chen, C. Biosorbents for heavy metals removal and their future. Biotechnol. Adv. 2009, 27, 195–226. [Google Scholar] [CrossRef] [PubMed]
  22. Yang, J.S.; Xie, Y.J.; He, W. Research progress on chemical modification of alginate: A review. Carbohyd. Polym. 2011, 84, 33–39. [Google Scholar] [CrossRef]
  23. Guo, T.; Pei, Y.; Tang, K.Y.; He, X.C.; Huang, J.B.; Wang, F. Mechanical and drug release properties of alginate beads reinforced with cellulose. J. Appl. Polym. Sci. 2017, 134, 44495. [Google Scholar] [CrossRef]
  24. Xu, L.; Chen, H.; Zheng, P.; Zheng, H.; Chen, Z.; Liu, Z.; Li, P.; Zhao, X.; Peng, Q.; He, X. Lightweight and Mechanically Robust MXene/Polyimide/Silver Nanowire Composite Aerogels for Flexible Piezoresistive Sensors. Acs. Appl. Nano. Mater. 2023, 6, 19098–19107. [Google Scholar] [CrossRef]
  25. Gao, X.; Guo, C.; Hao, J.; Zhao, Z.; Long, H.; Li, M. Adsorption of heavy metal ions by sodium alginate based adsorbent-a review and new perspectives. Int. J. Biol. Macromol. 2020, 164, 4423–4434. [Google Scholar] [CrossRef]
  26. Tao, H.-C.; Li, S.; Zhang, L.-J.; Chen, Y.-Z.; Deng, L.-P. Magnetic chitosan/sodium alginate gel bead as a novel composite adsorbent for Cu(II) removal from aqueous solution. Environ. Geochem. Health. 2019, 41, 297–308. [Google Scholar] [CrossRef]
  27. Zhang, S.; Xu, F.; Wang, Y.F.; Zhang, W.Z.; Peng, X.L.; Pepe, F. Silica modified calcium alginate-xanthan gum hybrid bead composites for the removal and recovery of Pb (II) from aqueous solution. Chem. Eng. J. 2013, 234, 33–42. [Google Scholar] [CrossRef]
  28. Attallah, M.F.; Youssef, M.A.; Imam, D.M. Preparation of novel nano composite materialsfrom biomass waste and their sorptive characteristics for certain radionuclides. Radiochim. Acta 2020, 108, 137–149. [Google Scholar] [CrossRef]
  29. Imam, D.M.; Youssef, M.A.; Attallah, M.F. Promising framework of nanocomposite materials: Synthesis and radio-lanthanides labeling for nuclear medicine application. J. Radioanal. Nucl. Chem. 2020, 323, 749–761. [Google Scholar] [CrossRef]
  30. Solomon Chuka, N.; Adanma Uzoma, O.; Echezona Nnaemeka, O.; Arinze Everest, C.; Godknows Chibueze, I. The effect of flux composition on tensile strength of re-engineered E308H-16 electrode. Adv. Mech. Eng. 2022, 14, 1–9. [Google Scholar] [CrossRef]
  31. Mohammed, A.; Rivers, A.; Stuckey, D.C.; Ward, K. Alginate extraction from Sargassum seaweed in the Caribbean region: Optimization using response surface methodology. Carbohyd. Polym. 2020, 245, 116419. [Google Scholar] [CrossRef] [PubMed]
  32. Kato, H.; Nishikawa, O.; Matsui, T.; Honma, S.; Kokado, H. Fourier transform infrared spectroscopy study of dopants of polypyrrole. J. Phys. Chem. 1991, 95, 6011–6014. [Google Scholar] [CrossRef]
  33. Xu, Q.; Jiang, L. Infrared spectra of the M(NO)n(M = Sn, Pb; n=1,2) and PbNOmolecules. Inorg. Chem. 2006, 45, 8648–8654. [Google Scholar] [CrossRef] [PubMed]
  34. Neeli, S.T.; Ramsurn, H.; Ng, C.Y.; Wang, Y.; Lu, J. Removal of Cr (VI), As (V), Cu (II), and Pb (II) using cellulose biochar supported iron nanoparticles: A kinetic and mechanistic study. J. Environ. Chem. Eng. 2020, 8, 103886. [Google Scholar] [CrossRef]
  35. Wang, S.-J.; Bu, H.; Chen, H.-J.; Hu, T.; Chen, W.-Z.; Wu, J.-H.; Hu, H.-J.; Lin, M.-Z.; Li, Y.; Jiang, G.-B. Floatable magnetic aerogel based on alkaline residue used for the convenient removal of heavy metals from wastewater. Chem. Eng. J. 2020, 399, 125760. [Google Scholar] [CrossRef]
  36. Wang, M.; Wang, Z.; Zhou, X.; Li, S. Efficient Removal of Heavy Metal Ions in Wastewater by Using a Novel Alginate-EDTA Hybrid Aerogel. Appl. Sci. 2019, 9, 547. [Google Scholar] [CrossRef]
  37. Huang, Y.; Wang, Z. Preparation of composite aerogels based on sodium alginate, and its application in removal of Pb2+and Cu2+ from water. Int. J. Biol. Macromol. 2018, 107, 741–747. [Google Scholar] [CrossRef]
  38. Jiao, C.; Xiong, P.; Tao, J.; Xu, S.; Zhang, D.; Lin, H.; Chen, Y. Sodium alginate/graphene oxide aerogel with enhanced strength-toughness and its heavy metal adsorption study. Int. J. Biol. Macromol. 2016, 83, 133–141. [Google Scholar] [CrossRef]
  39. Deze, E.G.; Papageorgiou, S.K.; Favvas, E.P.; Katsaros, F.K. Porous alginate aerogel beads for effective and rapid heavy metal sorption from aqueous solutions: Effect of porosity in Cu2+ and Cd2+ ion sorption. Chem. Eng. J. 2012, 209, 537–546. [Google Scholar] [CrossRef]
  40. Pan, L.; Wang, Z.; Yang, Q.; Huang, R. Efficient Removal of Lead, Copper and Cadmium Ions from Water by a Porous Calcium Alginate/Graphene Oxide Composite Aerogel. Nanomaterials 2018, 8, 957. [Google Scholar] [CrossRef]
  41. Wang, M.; Yang, Q.; Zhao, X.; Wang, Z. Highly efficient removal of copper ions from water by using a novel alginate-polyethyleneimine hybrid aerogel. Int. J. Biol. Macromol. 2019, 138, 1079–1086. [Google Scholar] [CrossRef] [PubMed]
  42. Zhang, Y.; Wu, L.; Deng, H.; Qiao, N.; Zhang, D.; Lin, H.; Chen, Y. Modified graphene oxide composite aerogels for enhanced adsorption behavior to heavy metal ions. J. Environ. Chem. Eng. 2021, 9, 106008. [Google Scholar] [CrossRef]
  43. Feng, Y.; Wang, H.; Xu, J.; Du, X.; Cheng, X.; Du, Z.; Wang, H. Fabrication of MXene/PEI functionalized sodium alginate aerogel and its excellent adsorption behavior for Cr (VI) and Congo Red from aqueous solution. J. Hazard. Mater. 2021, 416, 125777. [Google Scholar] [CrossRef] [PubMed]
  44. Eun, S.; Ryu, J.; Kim, H.; Hong, H.-J.; Kim, S. Simultaneous removal of radioactive cesium and strontium from seawater using a highly efficient Prussian blue-embedded alginate aerogel. J. Environ. Manag. 2021, 297, 113389. [Google Scholar] [CrossRef]
  45. Shi, T.; Xie, Z.; Zhu, Z.; Shi, W.; Liu, Y.; Liu, M. Highly efficient and selective adsorption of heavy metal ions by hydrazide-modified sodium alginate. Carbohyd. Polym. 2022, 276, 118797. [Google Scholar] [CrossRef]
  46. Li, S.; Yang, S.; Chen, L.; Hao, X.; Tao, E.; Li, Y. Pore size adjustment of sodium alginate-based composite aerogel spheres by zirconia for efficient selective removal of Cu (II). Chem. Eng. J. 2023, 464, 142547. [Google Scholar] [CrossRef]
  47. Su, H.; Qiu, W.; Deng, T.; Zheng, X.; Wang, H.; Wen, P. Fabrication of physically multi-crosslinked sodium alginate/carboxylated-chitosan/montmorillonite-base aerogel modified by polyethyleneimine for the efficient adsorption of organic dye and Cu (II) contaminants. Sep. Purif. Technol. 2024, 330, 125321. [Google Scholar] [CrossRef]
Figure 1. Schematic diagram of HSA preparation.
Water 17 00631 g001
Figure 2. Photographs of HSA and SAA. (a) Original morphology of HSA and SAA; (b) HSA and SAA morphology of a cylinder with a height of ~2 cm and a transversal radius of ~1 cm; (c) top view of HSA and SAA cylinders (height of ~2 cm, transversal radius of ~1 cm).
Water 17 00631 g002
Figure 3. SEM images of HSA with and without HAPNW. (a) HSA with HAPNWs (100× magnification); (b) HSA with HAPNWs (300× magnification); (c) HSA with HAPNWs (2000× magnification); (d) HSA without HAPNWs (100× magnification); (e) HSA without HAPNWs (300× magnification); (f) HSA without HAPNWs (2000× magnification).
Water 17 00631 g003
Figure 4. XRD analyses of HAPNWS, HSA, SAA, and HSA + Pb.
Water 17 00631 g004
Figure 5. FTIR spectra of HAPNWS, HSA, SAA, and HSA + Pb.
Water 17 00631 g005
Figure 6. SAA and HSA mechanical test performance.
Water 17 00631 g006
Figure 7. Ionic forms of Pb under different pH conditions.
Water 17 00631 g007
Figure 8. Effect of pH on the adsorption of HSA.
Water 17 00631 g008
Figure 9. Isothermal fitting of Pb2+ adsorption by HSA.
Water 17 00631 g009
Figure 10. Effect of time on Pb adsorption by HSA.
Water 17 00631 g010
Figure 11. Pseudo-primary adsorption kinetic modeling of HSA.
Water 17 00631 g011
Figure 12. Pseudo-secondary adsorption kinetic modeling of HSA.
Water 17 00631 g012
Figure 13. Effects of different factor interaction conditions on the adsorption of Pb2+ by HSA. (a) Adsorption time = 500 min; (b) adsorption time = 1000 min; (c) adsorption time = 1500 min; (d) T = 25 °C; (e) T = 35 °C; (f) T = 45 °C; (g) pH = 6; (h) pH = 7; (i) pH = 8.
Water 17 00631 g013aWater 17 00631 g013b
Figure 14. The influence of the number of cycles of adsorbent use on the adsorption capacity.
Water 17 00631 g014
Table 1. Fitting parameters of Langmuir and Freundlich equations to HSA adsorption isotherms.
Model and ParameterLangmuirFreundlich
Q e   =   Q m K L C e 1   +   K L C e lg Q e   =   lg K F 1 n lg C e
TKLQmR2KF1/nR2
25 °C0.0037178.510.94196.88340.44740.9014
35 °C0.0042194.600.96688.21410.43960.9153
45 °C0.0052198.240.980110.36590.41550.9109
Table 2. Kinetic model fitting parameters for lead adsorption by HSA.
Model and ParameterPseudo-Primary Adsorption Kinetic ModelPseudo-Secondary Adsorption Kinetic Model
ln ( Q e     Q t )   =   ln Q e     K 1 t t Q t   =   t Q e   +   1 k 2 Q e 2
TK1QeR2K2QeR2
Value0.0087261.240.94440.0001270.270.9986
Table 3. Box-Behnken response surface analysis factor level table.
SymbolicConsiderationsUnit Level
Low ValueHigh Value
ApH/68
BTemperature°C2545
CAdsorption timemin5001500
Table 4. HSA adsorption response surface experimental design and results.
Serial NumberA
(pH)
B
(Temperature/°C)
C
(Adsorption Time/min)
Q
(HAS Adsorption/mg·g−1)
16451000200.854
2635500194.523
36351500205.751
48351500234.581
5725500196.654
68451000237.852
77251500210.288
88251000213.052
9835500205.354
10745500198.752
117451500214.380
126251000199.582
137351000263.524
147351000268.254
157351000270.698
167351000275.652
177351000270.257
Table 5. Regression model ANOVA table.
SourceSum of SquaresdfMean SquareF-Valuep-Value
Model14,964.2591662.6974.31<0.0001significant
A1015.4011015.4045.380.0003
B130.101130.105.810.0467
C607.561607.5627.150.0012
AB138.391138.396.180.0418
AC80.99180.993.620.0988
BC0.994010.99400.04440.8391
A22825.3612825.36126.27<0.0001
B24030.1114030.11180.11<0.0001
C24787.7114787.71213.96<0.0001
Residual156.63722.38
Lack of Fit79.67326.561.380.3699not significant
Pure Error76.96419.24
Cor Total15,120.8916
C.V.% = 2.08% R2 = 0.9896 Adjusted R2 = 0.9763
Table 6. Regression equation coefficient significance test table.
FactorCoefficient EstimateDfStandard Error95% CI Low95% CI HighVIF
Intercept269.6892.12264.67274.681
A11.2711.677.3115.221
B4.0311.670.07817.991
C8.7111.674.7612.671
AB5.8812.370.289211.471
AC4.5012.37−1.0910.091
BC0.498512.37−5.096.091
A2−25.9012.31−31.36−20.451.01
B2−30.9412.31−36.39−25.491.01
C2−33.7212.31−39.17−28.271.01
Table 7. A comparison of the used sorbent material with other studies.
MaterialModified MaterialsPollutantpHTimeTemperatureAdsorbent DosagePollutant ConcentrationAdsorption CapacityReferences
Hydroxyapatite nanowire sodium alginate aerogel (HSA)HAPNWsPb(II)6.0–8.0500~1500 min25~45 °C0.3 g, 20 mL1000 mg/L278.4 mg/gThis study
Magnetic sodium alginate–alkaline residue aerogel (Fe3O4/SA-AR)5 wt% alkaline residue solution, Fe3O4Cd (II)5.024 h25 °C0.3 g, 50 mL20 mg/L38.8 mg/g[35]
Calcium alginate-disodium ethylenediaminetetra-acetate dihydrate hybrid aerogel (Alg-EDTA)EDC (0.2 g), NHS (0.06 g), and EDA (0.05 g)Cd (II)4.0–6.56 h25 °C100 mg Alg-EDTA, 50 mL1.5 mM177.3 mg/g[36]
Ethylenediamine-modified calcium alginate aerogel (ECAA)EthylenediaminePb(II)4.57 h25 °C50 mg ECAA/50 mL1.5 mmol/L219.3 mg/g[37]
Ethylenediamine-modified calcium alginate aerogel (ECAA)EthylenediamineCu(II)4.57 h25 °C50 mg ECAA/50 mL1.5 mmol/L87.8 mg/g[37]
Sodium alginate/graphene oxide with GO content of 4 wt% (SAGO-4)Graphite, CaCO3, and D-glucono-ɑ-lactoneCu(II)5.03 h30 °Cmonolithic SAGO aerogel with GO content of 4 wt%500 mg/L98 mg/g[38]
Sodium alginate/graphene oxide with GO content of 4 wt% (SAGO-4)Graphite, CaCO3, and D-glucono-ɑ-lactonePb(II)6.04 h30monolithic SAGO aerogel with GO content of 4 wt%500 mg/L267.4 mg/g[38]
Calcium alginate porous aerogel beadssc-CO2Cu(II)4.56 h25 °C0.1 g/100 mL100 mL CuSO4·5H2O and 3CdSO4·8H2O126.82 mg/g[39]
Calcium alginate porous aerogel beadssc-CO2Cd (II)4.56 h25 °C0.1 g/100 mL100 mL CuSO4·5H2O and 3CdSO4·8H2O244.55 mg/g[39]
Enhanced strength-toughness alginate composite fiberPolystyrene colloidal particles, graphene oxidePb(II)3.0–7.040 min25 °C50 mg/50 mL1.5 mM Pb2+368.2 mg/g[40]
Enhanced strength-toughness alginate composite fiberPolystyrene colloidal particles, graphene oxideCu(II)3.0–7.040 min25 °C50 mg/50 mL1.5 mM Cu2+98.1 mg/g[40]
Enhanced strength-toughness alginate composite fiberPolystyrene colloidal particles, graphene oxideCd(II)3.0–7.040 min25~60 °C50 mg/50 mL1.5 mM Cd2+183.6 mg/g[40]
Alginate/melamine/chitosan aerogelChitosan and melaminePb(II)5.5100 min298 K20 mg/20 mL100 mg/L Pb(NO3)21331.6 mg/g[17]
Alginate-polyethyleneimine hybrid aerogel (Alg-PEI)PolyethyleneimineCu(II)4.040 h25 °C100 mg/50 mL0.1 mM Cu2+214.4 mg/g[41]
Sodium alginate, graphene oxide and β-cyclodextrin (SA/GO-βCD)β-Cyclodextrin, Graphene oxideCu(II)6.04 h30 °C1 g/L400 mg/L Cu2+198.18 mg/g[42]
Sodium alginate, graphene oxide and β-cyclodextrin (SA/GO-βCD)β-Cyclodextrin, graphene oxideCu(II)6.04 h30 °C1 g/L400 mg/L Cu2+243.91 mg/g[42]
MXene/PEI modified sodium alginate aerogel (MPA)Polyethyleneimine, amino functionalized Ti3C2TxCr(VI)2.03 h318 K10 mg/50 mL500 mg/L Cr(VI)550.3 mg/g[43]
Prussian blue-embedded alginate aerogelPrussian blueHg2+6.05 h298.15 K50 mg0.499 mmol/L Hg2+8.633 mmol/g[44]
Prussian blue-embedded alginate aerogelPrussian blueSr2+6.512 h25 °C4 mg/150 mLNa+: 12,000 mg/L, K+: 400 mg/L, Ca2+: 400 mg/L, Mg2+: 1200 mg/L24.1 mg/g[44]
Dialdehyde sodium alginate grafted adipic acid dihydrazide (DSA-AAD@Ca2+)Dialdehyde sodium alginate, grafted adipic acid dihydrazidePb(II)5.05 h298.15 K50 mgPb2+: 0.483 mmol/L1.968 mmol/g[45]
Dialdehyde sodium alginate grafted adipic acid dihydrazide (DSA-AAD@Ca2+)Dialdehyde sodium alginate, grafted adipic acid dihydrazideCd(II)5.05 h298.15 K50 mgCd2+: 0.889 mmol/L5.062 mmol/g[45]
Dialdehyde sodium alginate grafted adipic acid dihydrazide (DSA-AAD@Ca2+)Dialdehyde sodium alginate, grafted adipic acid dihydrazideCu(II)5.05 h298.15 K50 mgCu2+: 1.573 mmol/L4.068 mmol/g[45]
Grapheneoxide–zirconium oxide/sodium alginate (GZS)GO nanosheets, sodium alginate, ZrO2Cu(II)6.01.5 h60 °C0.3 g/132.57 mg/g[46]
Sodium alginate/carboxylated chitosan/montmorillonite (MSC-P)polyethyleneimine (PEI)Cu(II)2.0~6.012 h25 °C0.5 g/L100 mg/L Cu(II)203.99 mg/g[47]
Disclaimer/Publisher’s Note: The statements, opinions and data contained in all publications are solely those of the individual author(s) and contributor(s) and not of MDPI and/or the editor(s). MDPI and/or the editor(s) disclaim responsibility for any injury to people or property resulting from any ideas, methods, instructions or products referred to in the content.

