
An Analysis of Multi-Coal Seam Mining Impacting Aquifer Water Based on Self-Organizational Maps


Abstract
1. Introduction
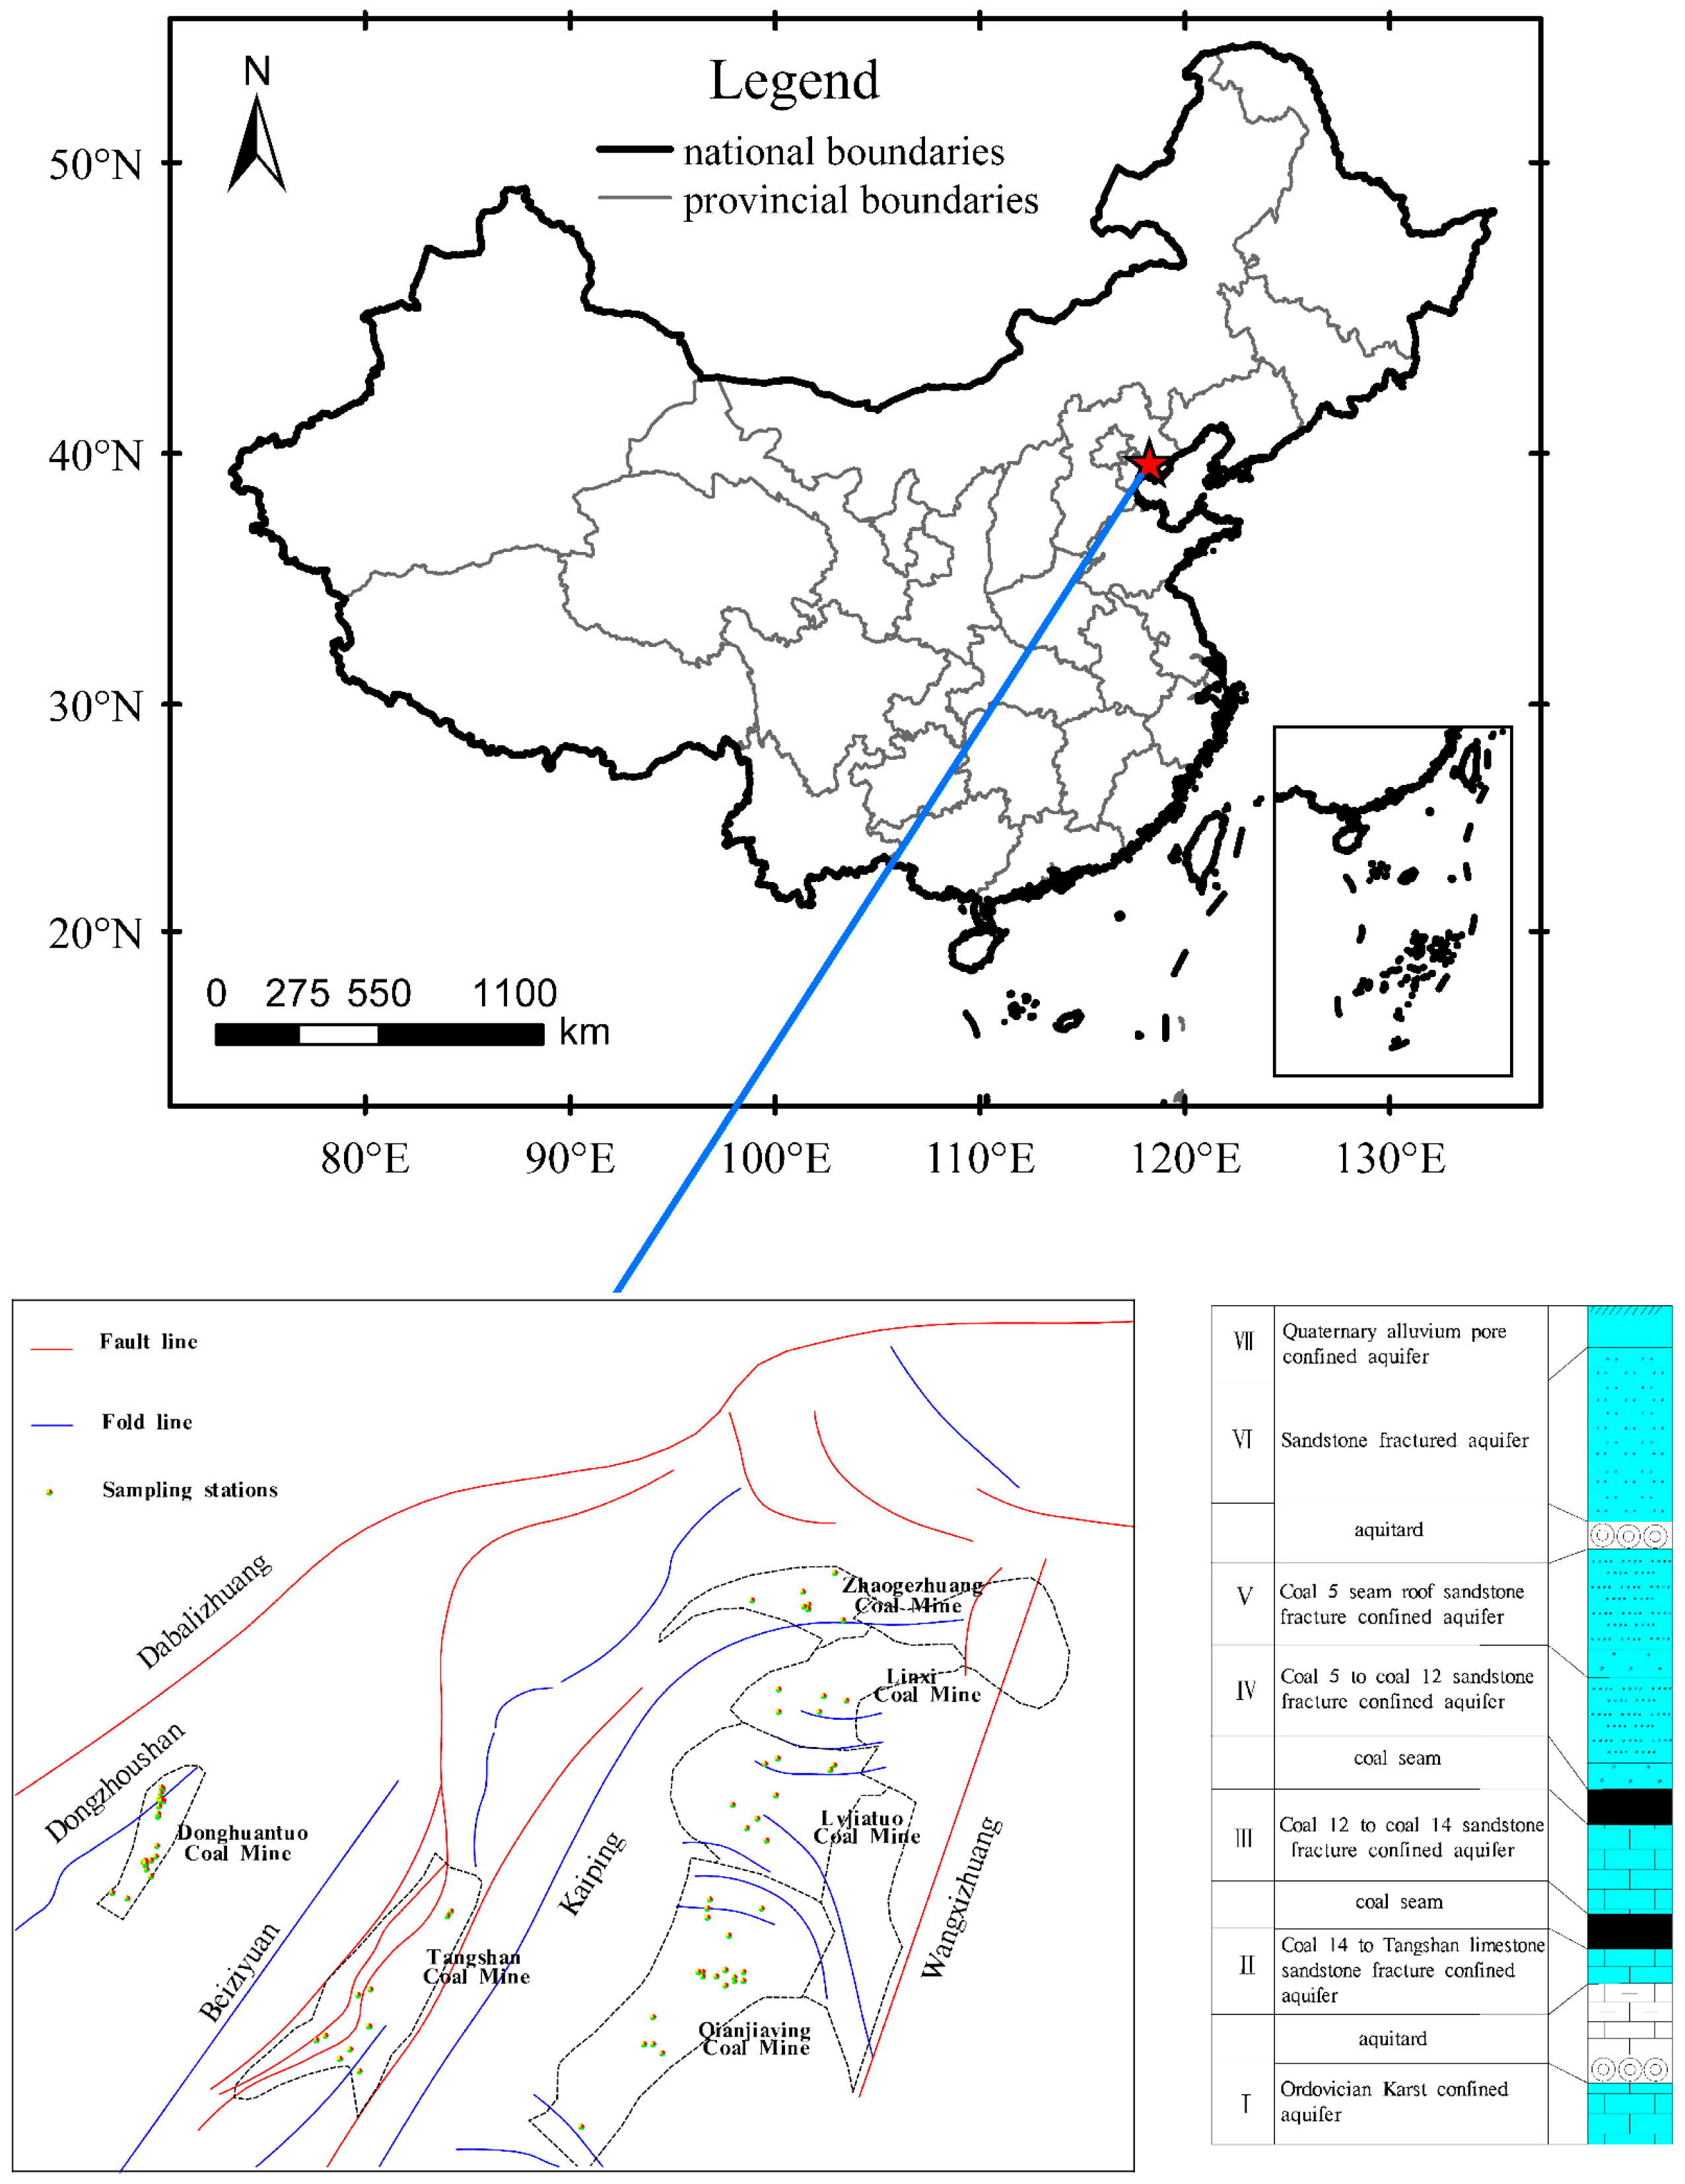
2. Study Area
3. Materials and Methods
3.1. Sampling and Testing
3.2. Multivariate Statistical Analysis
3.3. Modeling of Hydrogeochemical Reactions
4. Results and Discussions
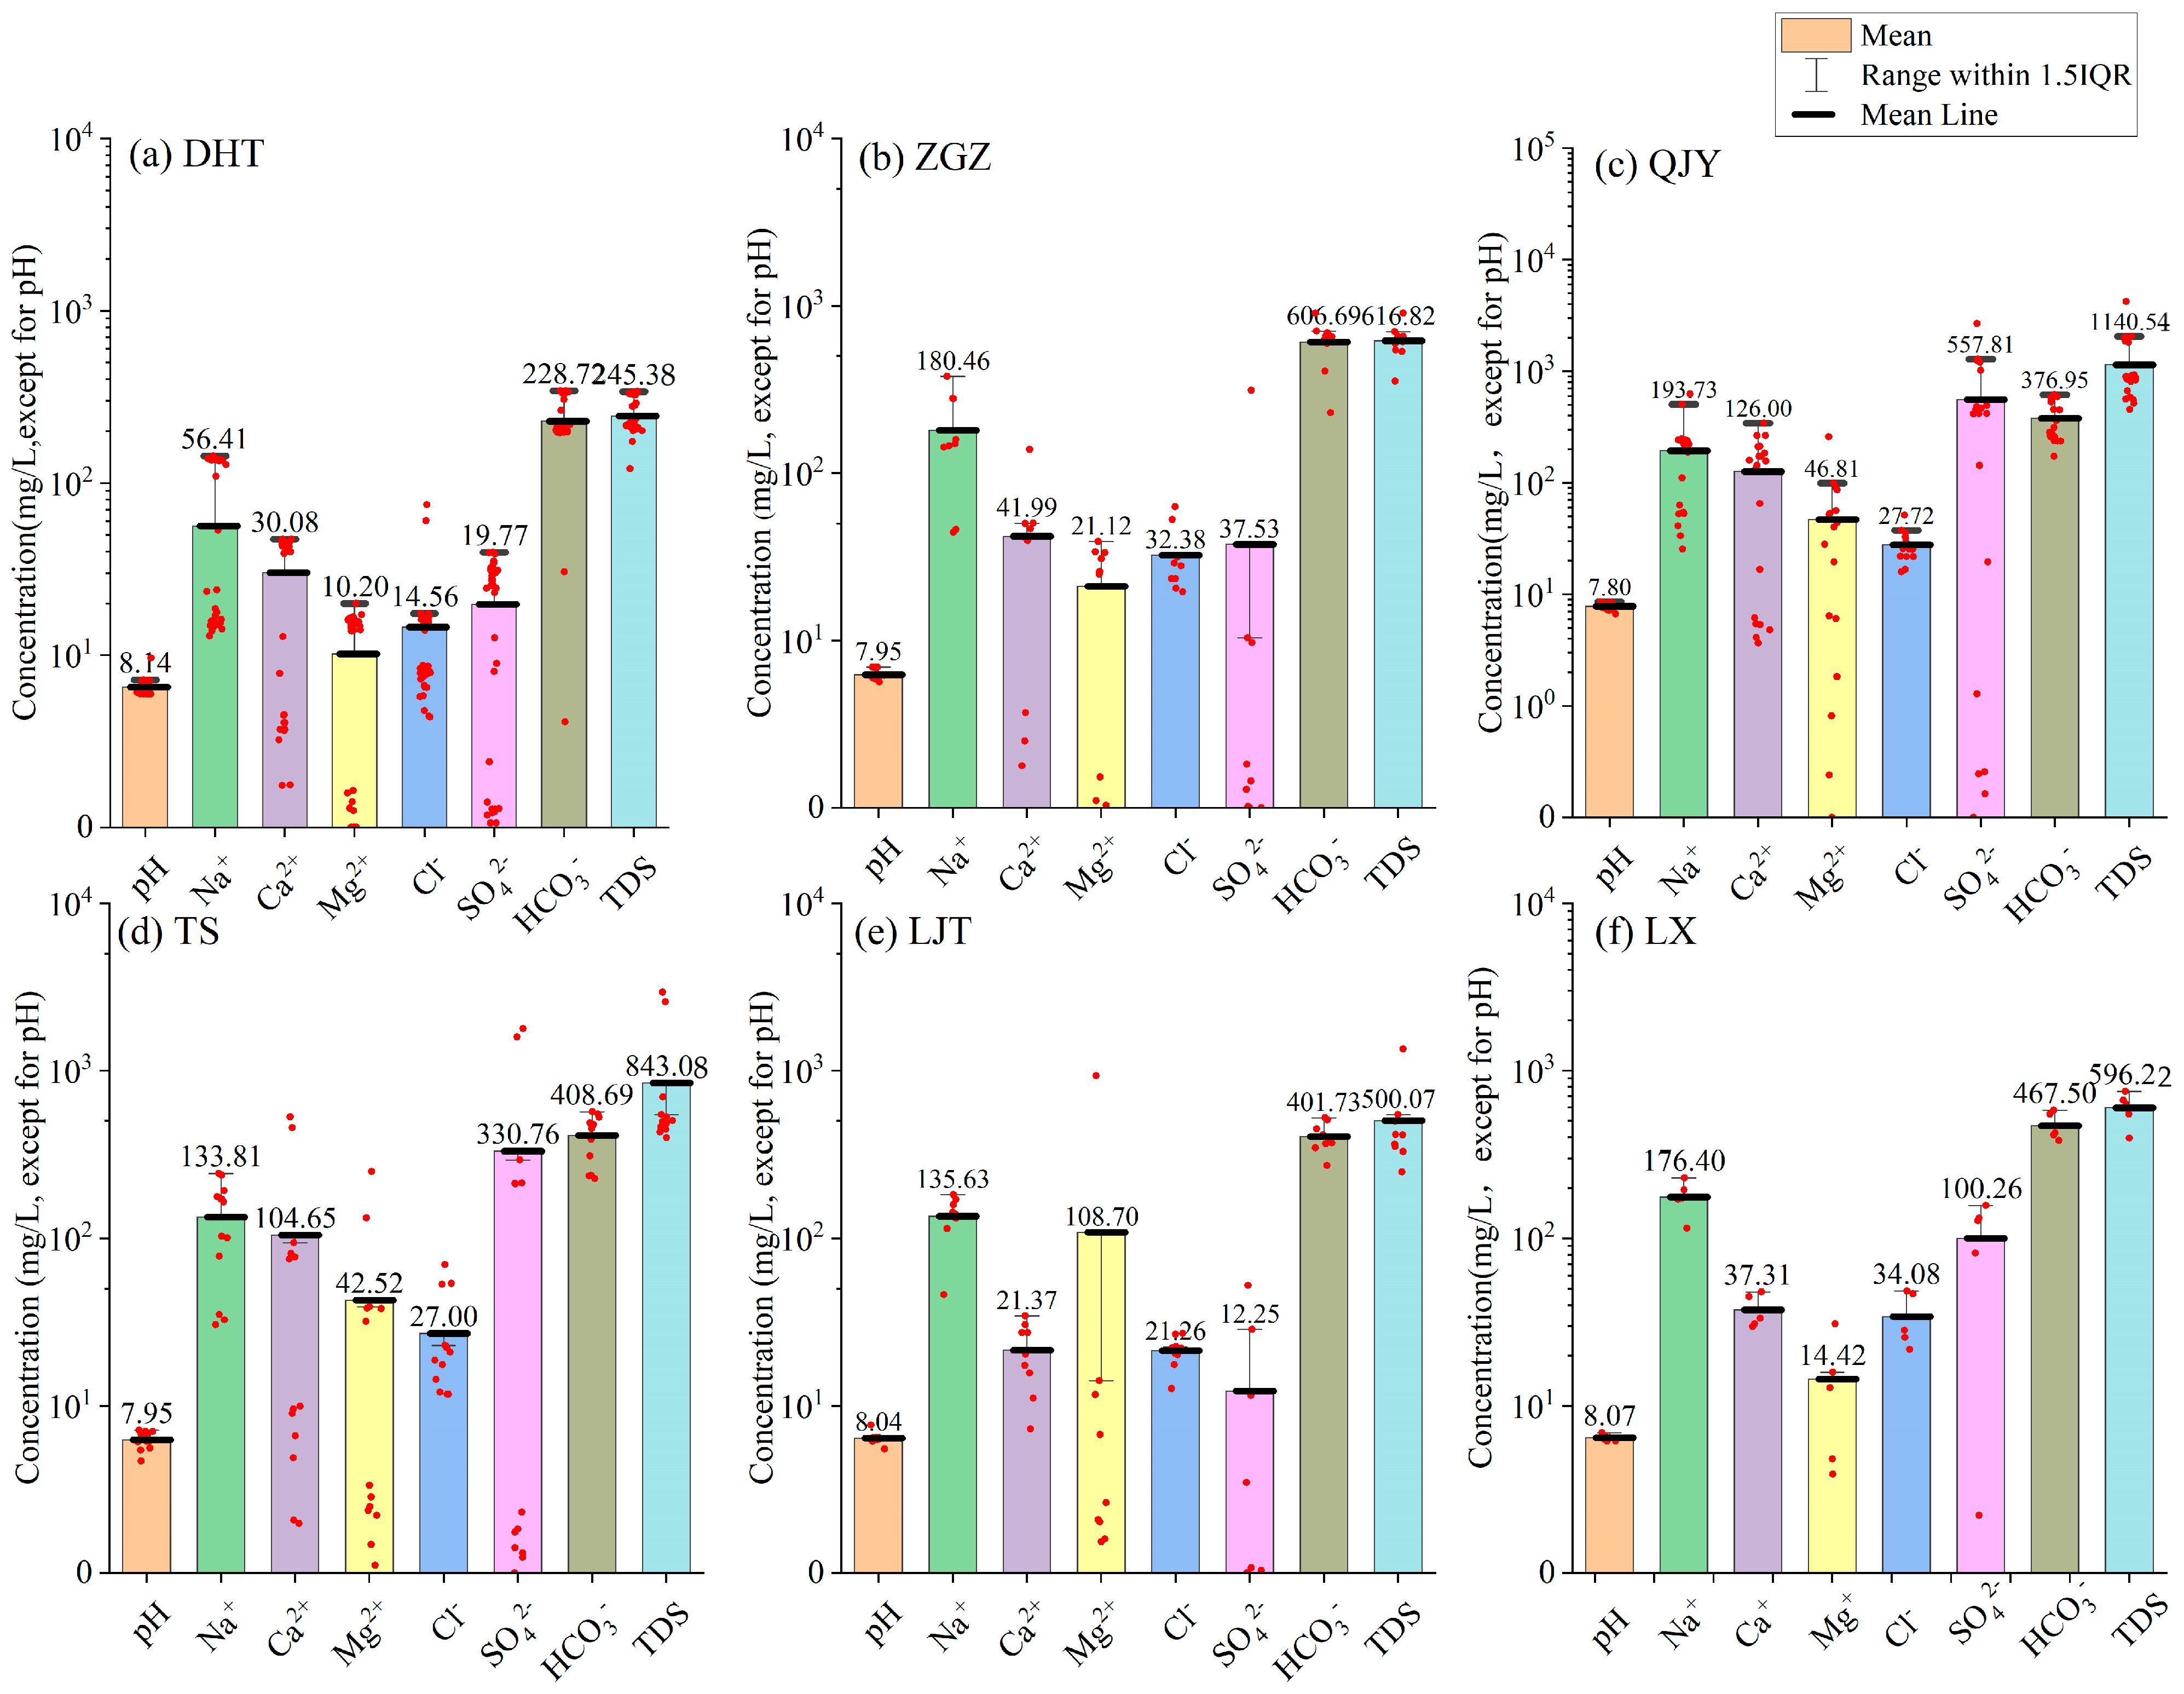
4.1. General Physical and Chemical Statistical Characteristics
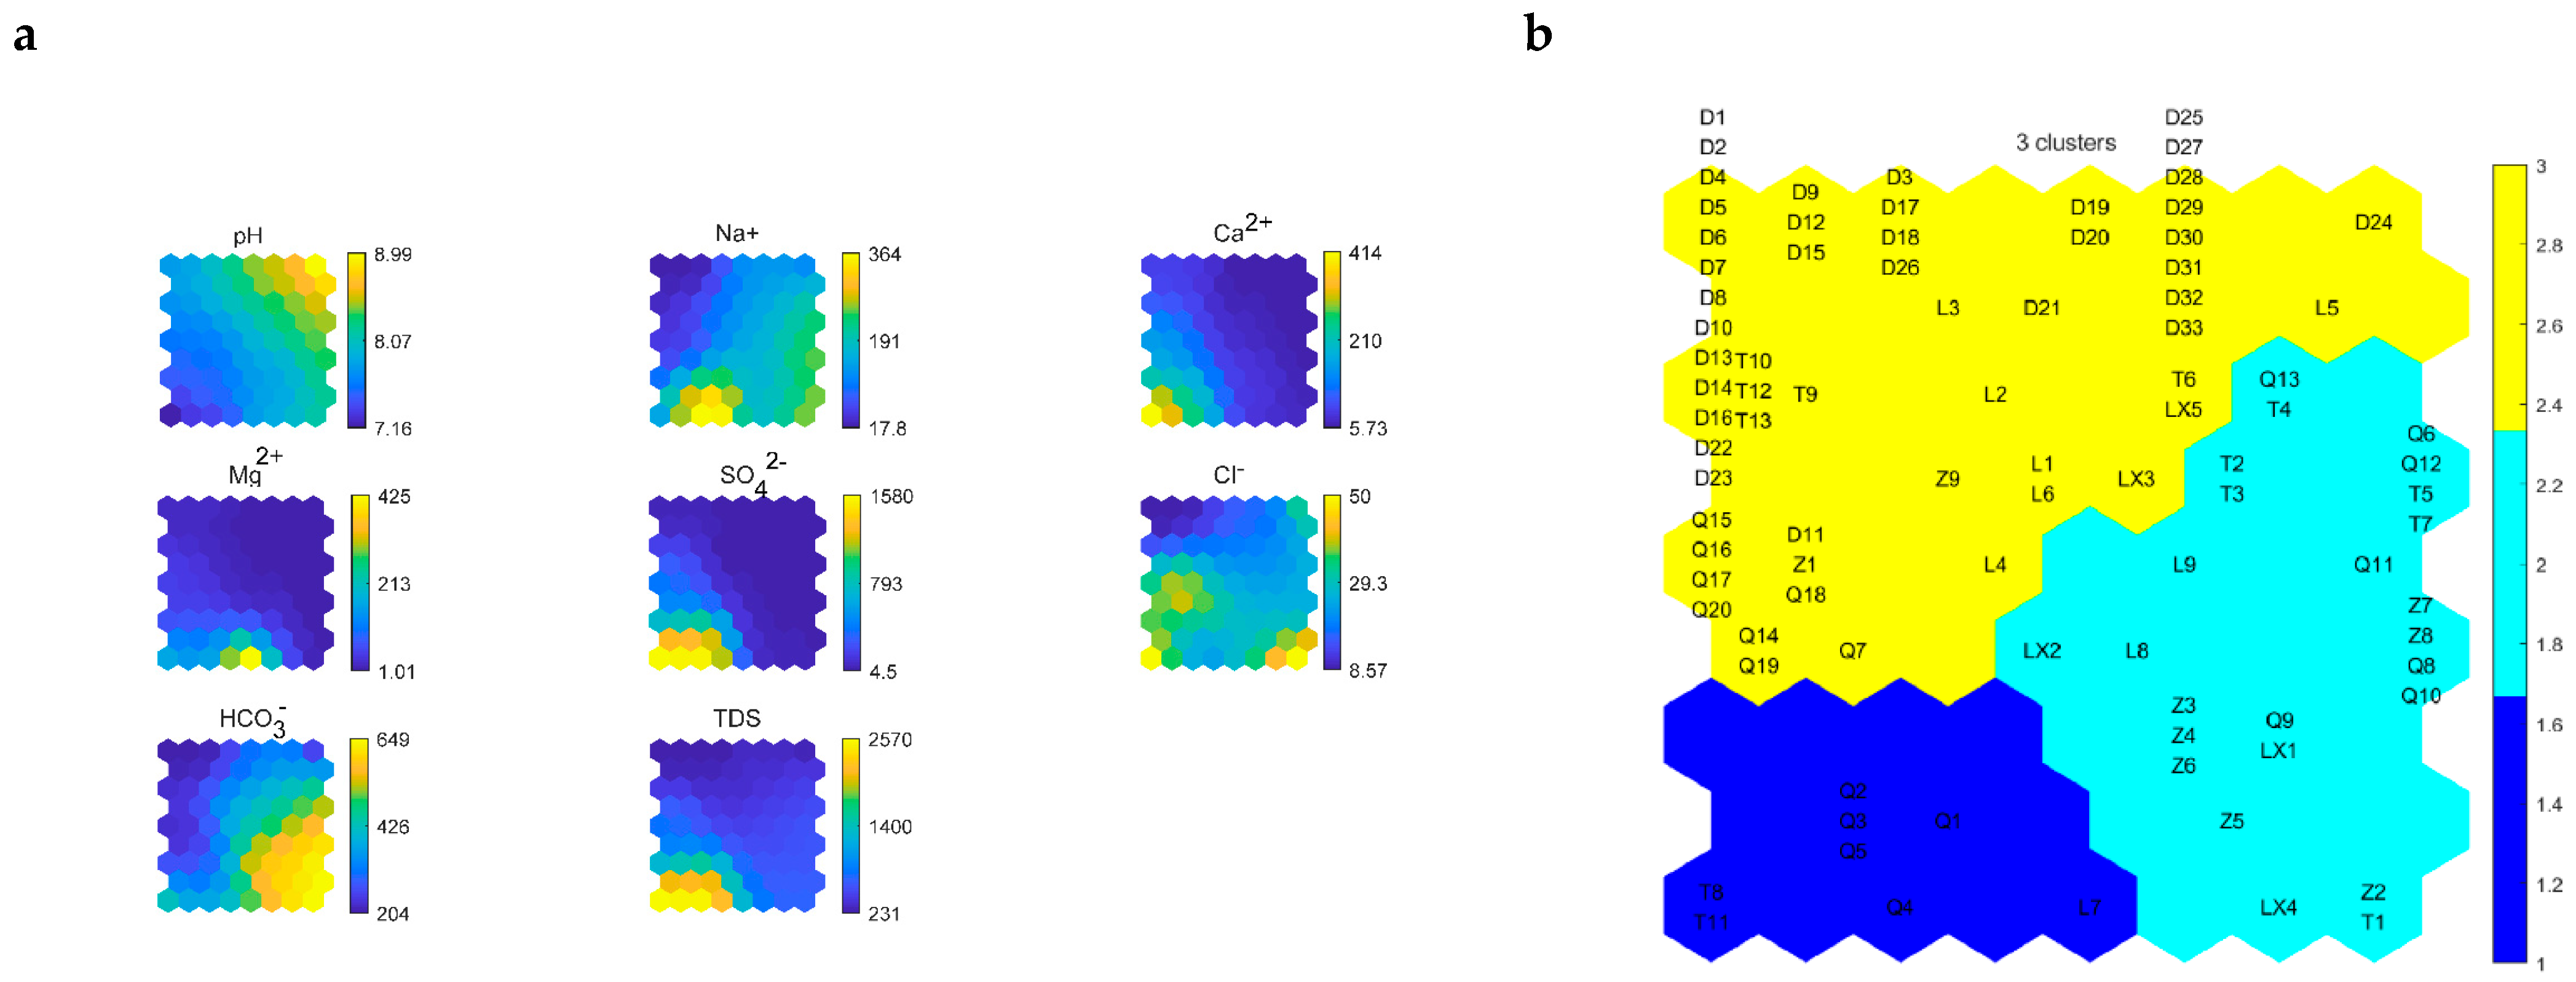
4.2. SOM Algorithm Results
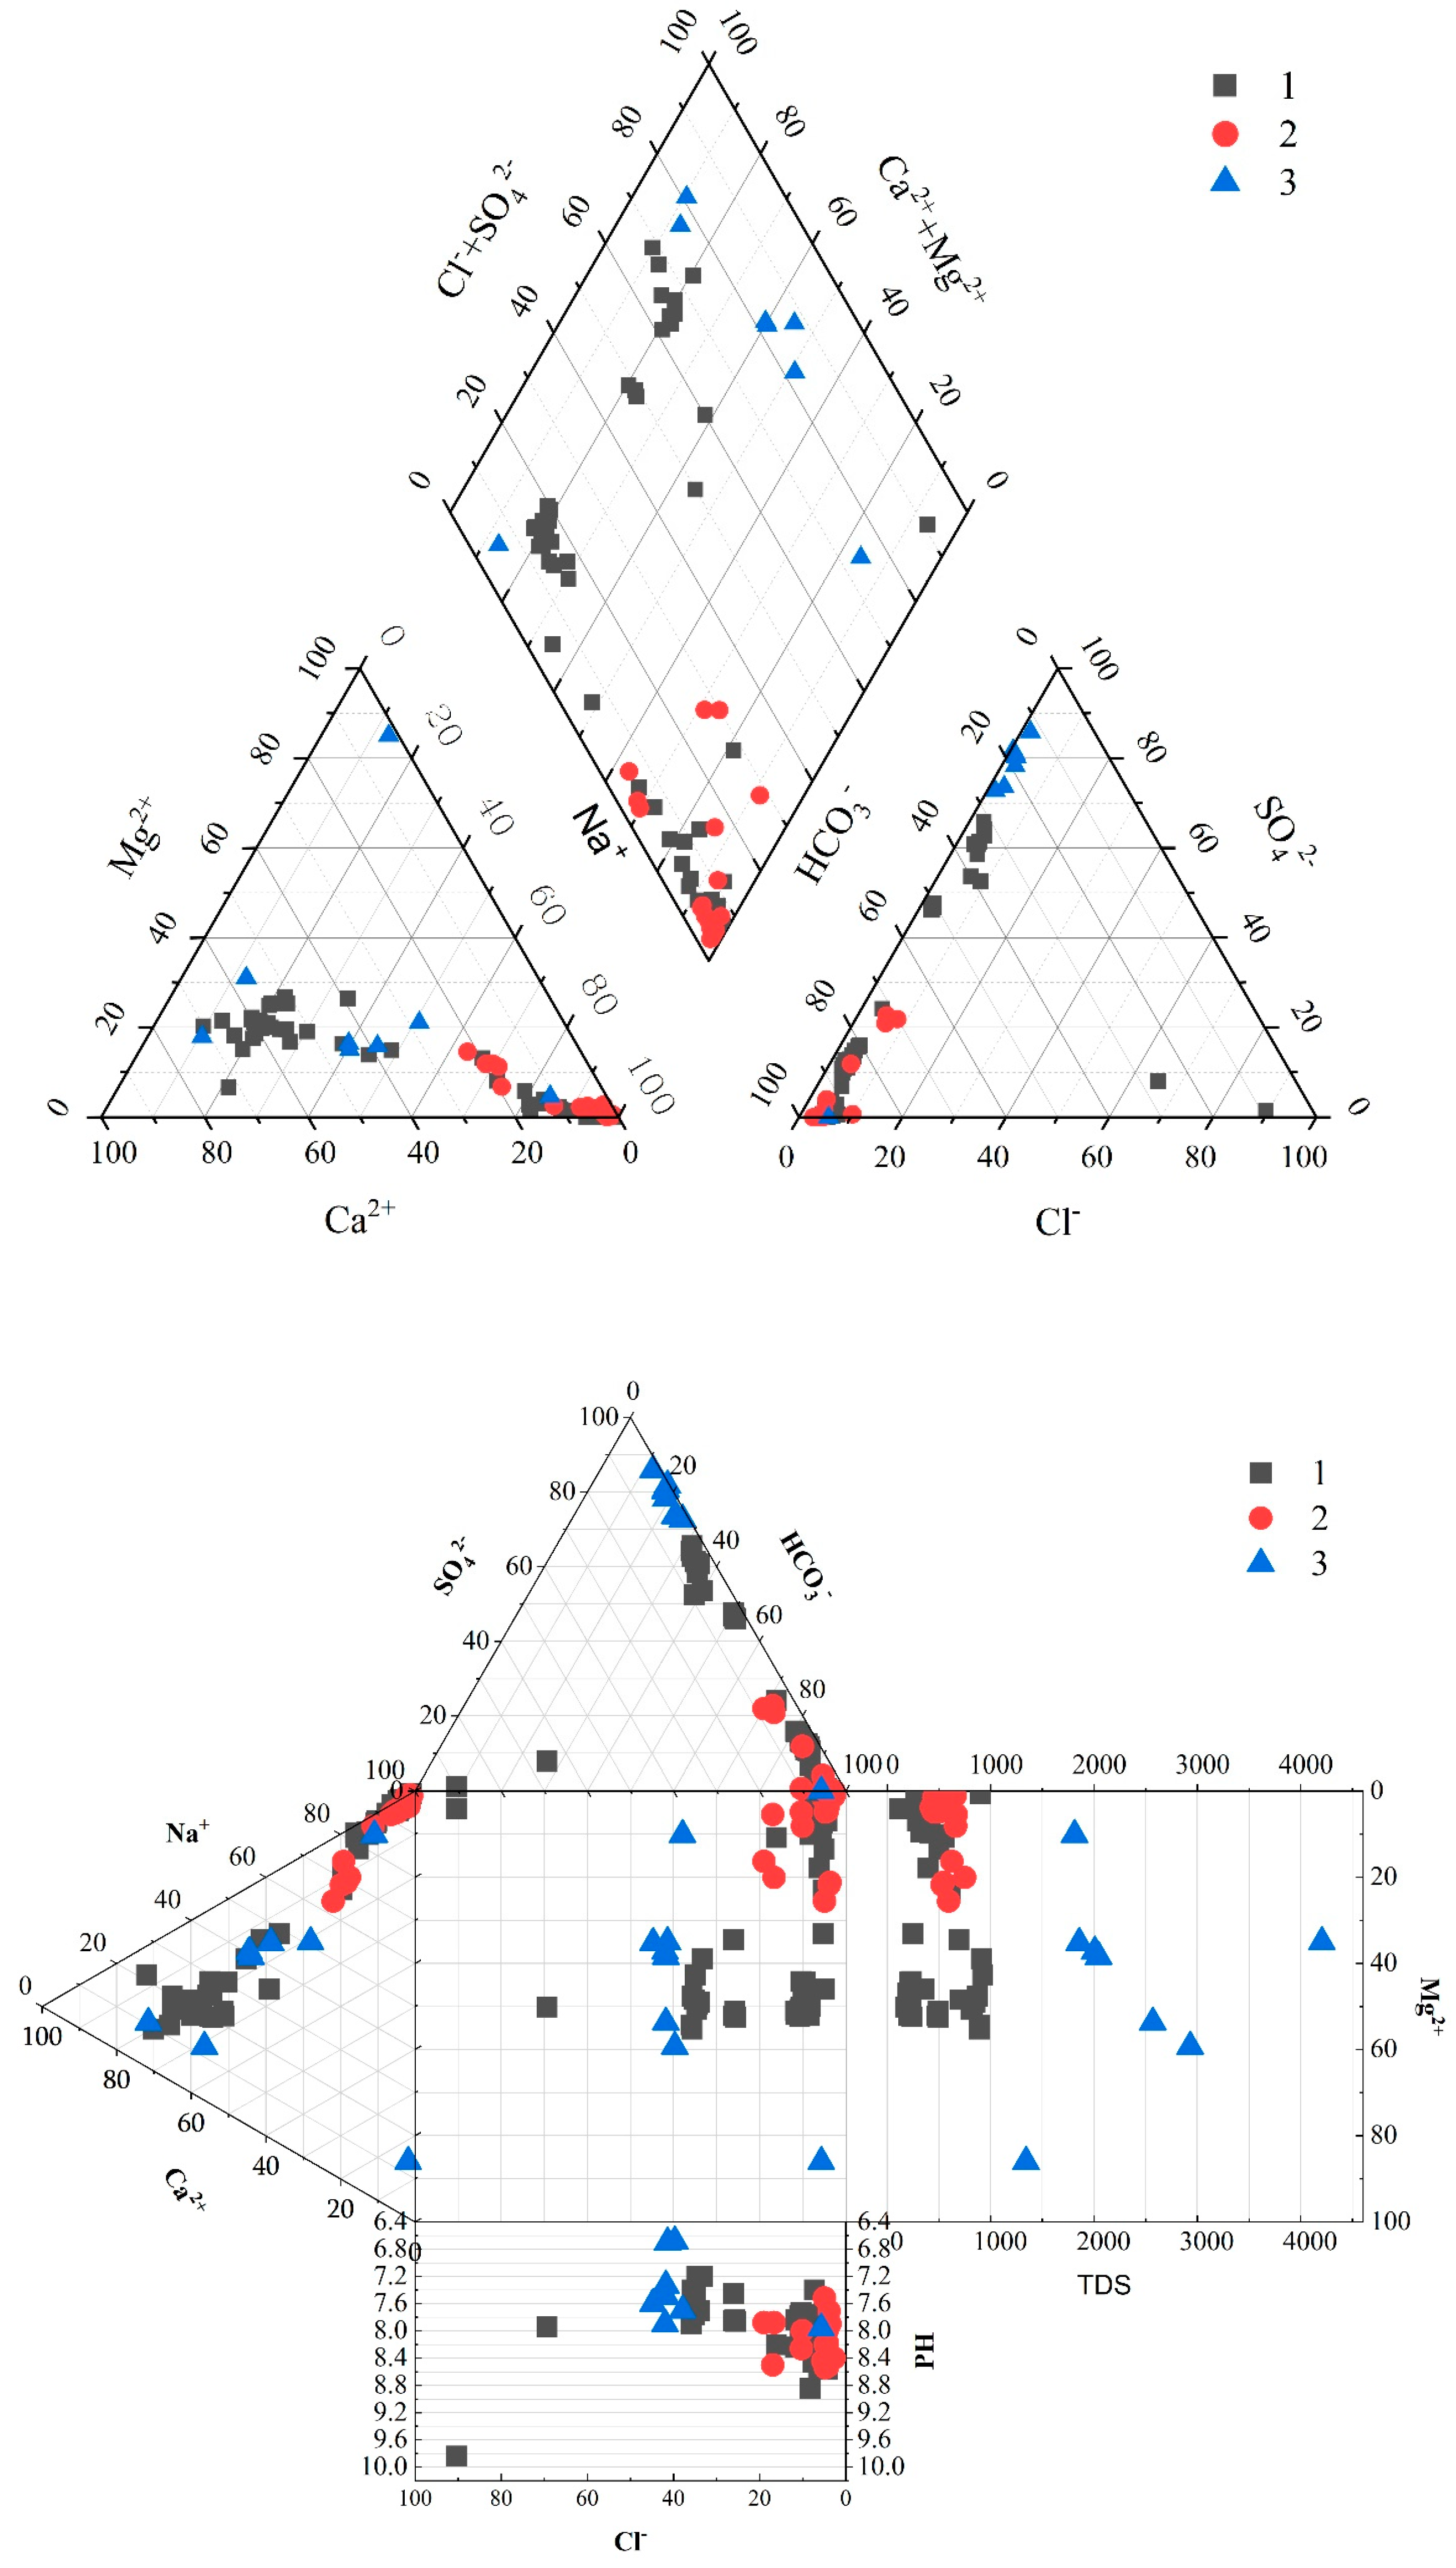
4.3. Hydrochemical Types
4.4. PCA and Correlation Analysis
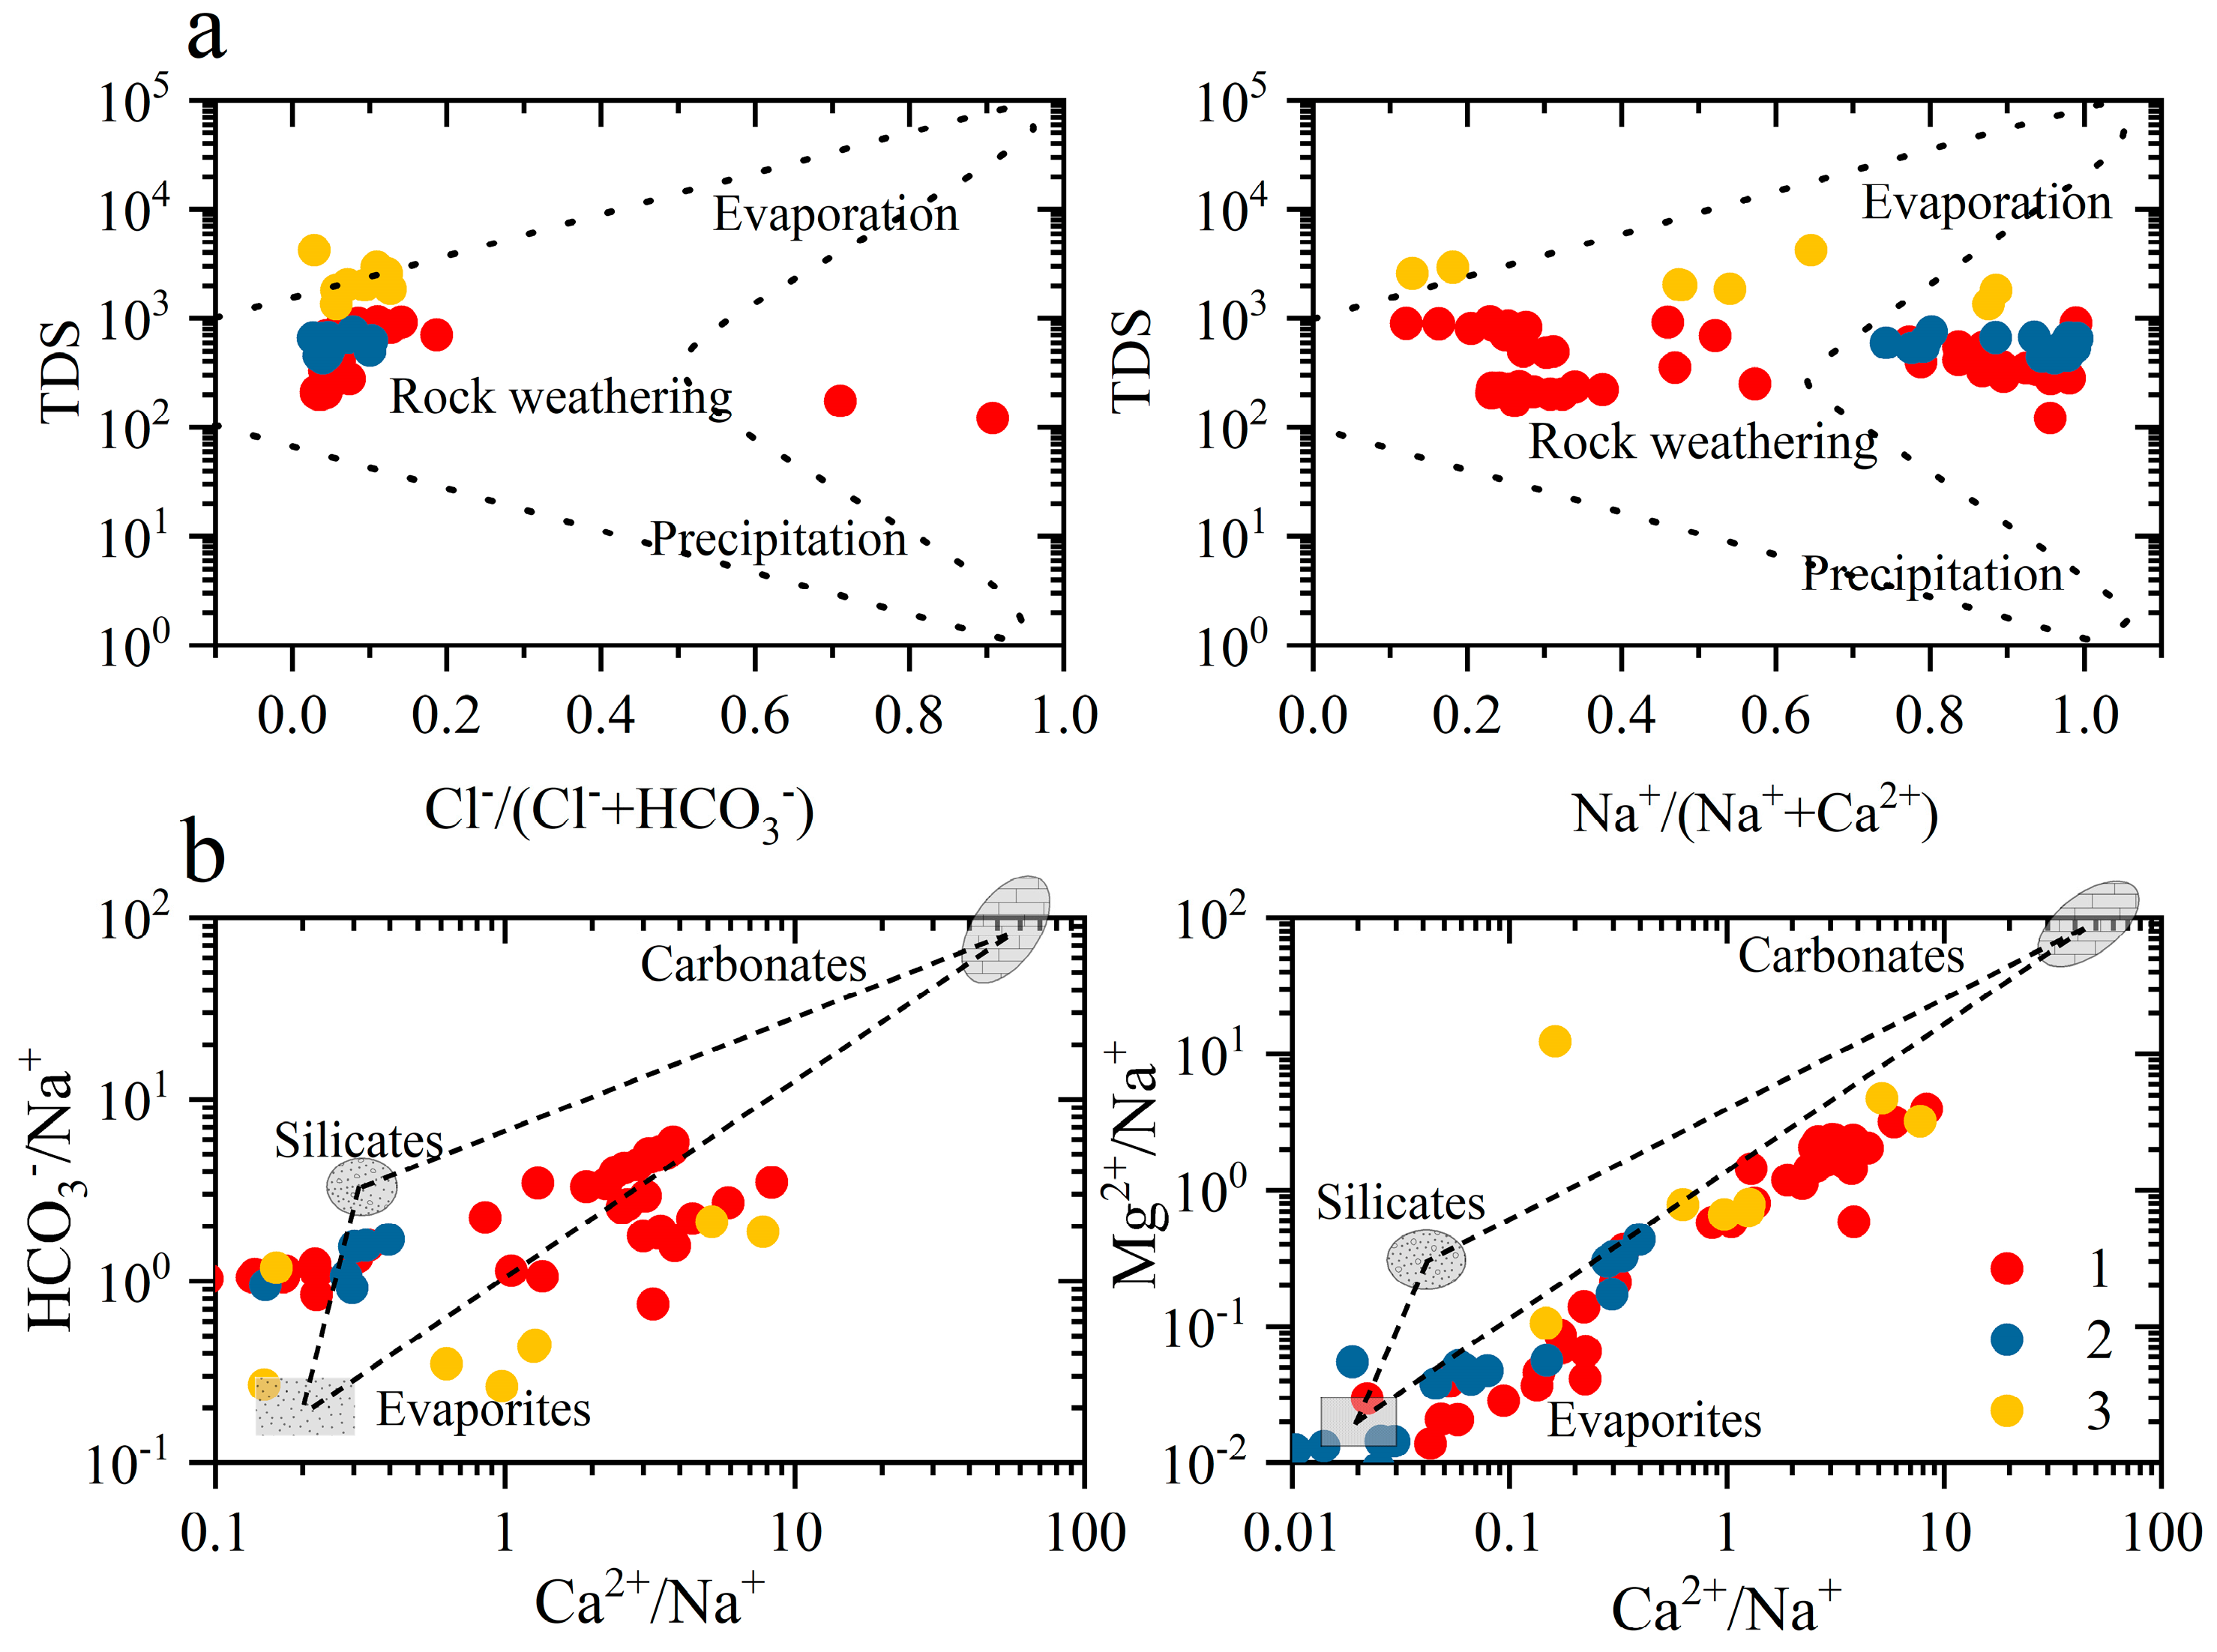
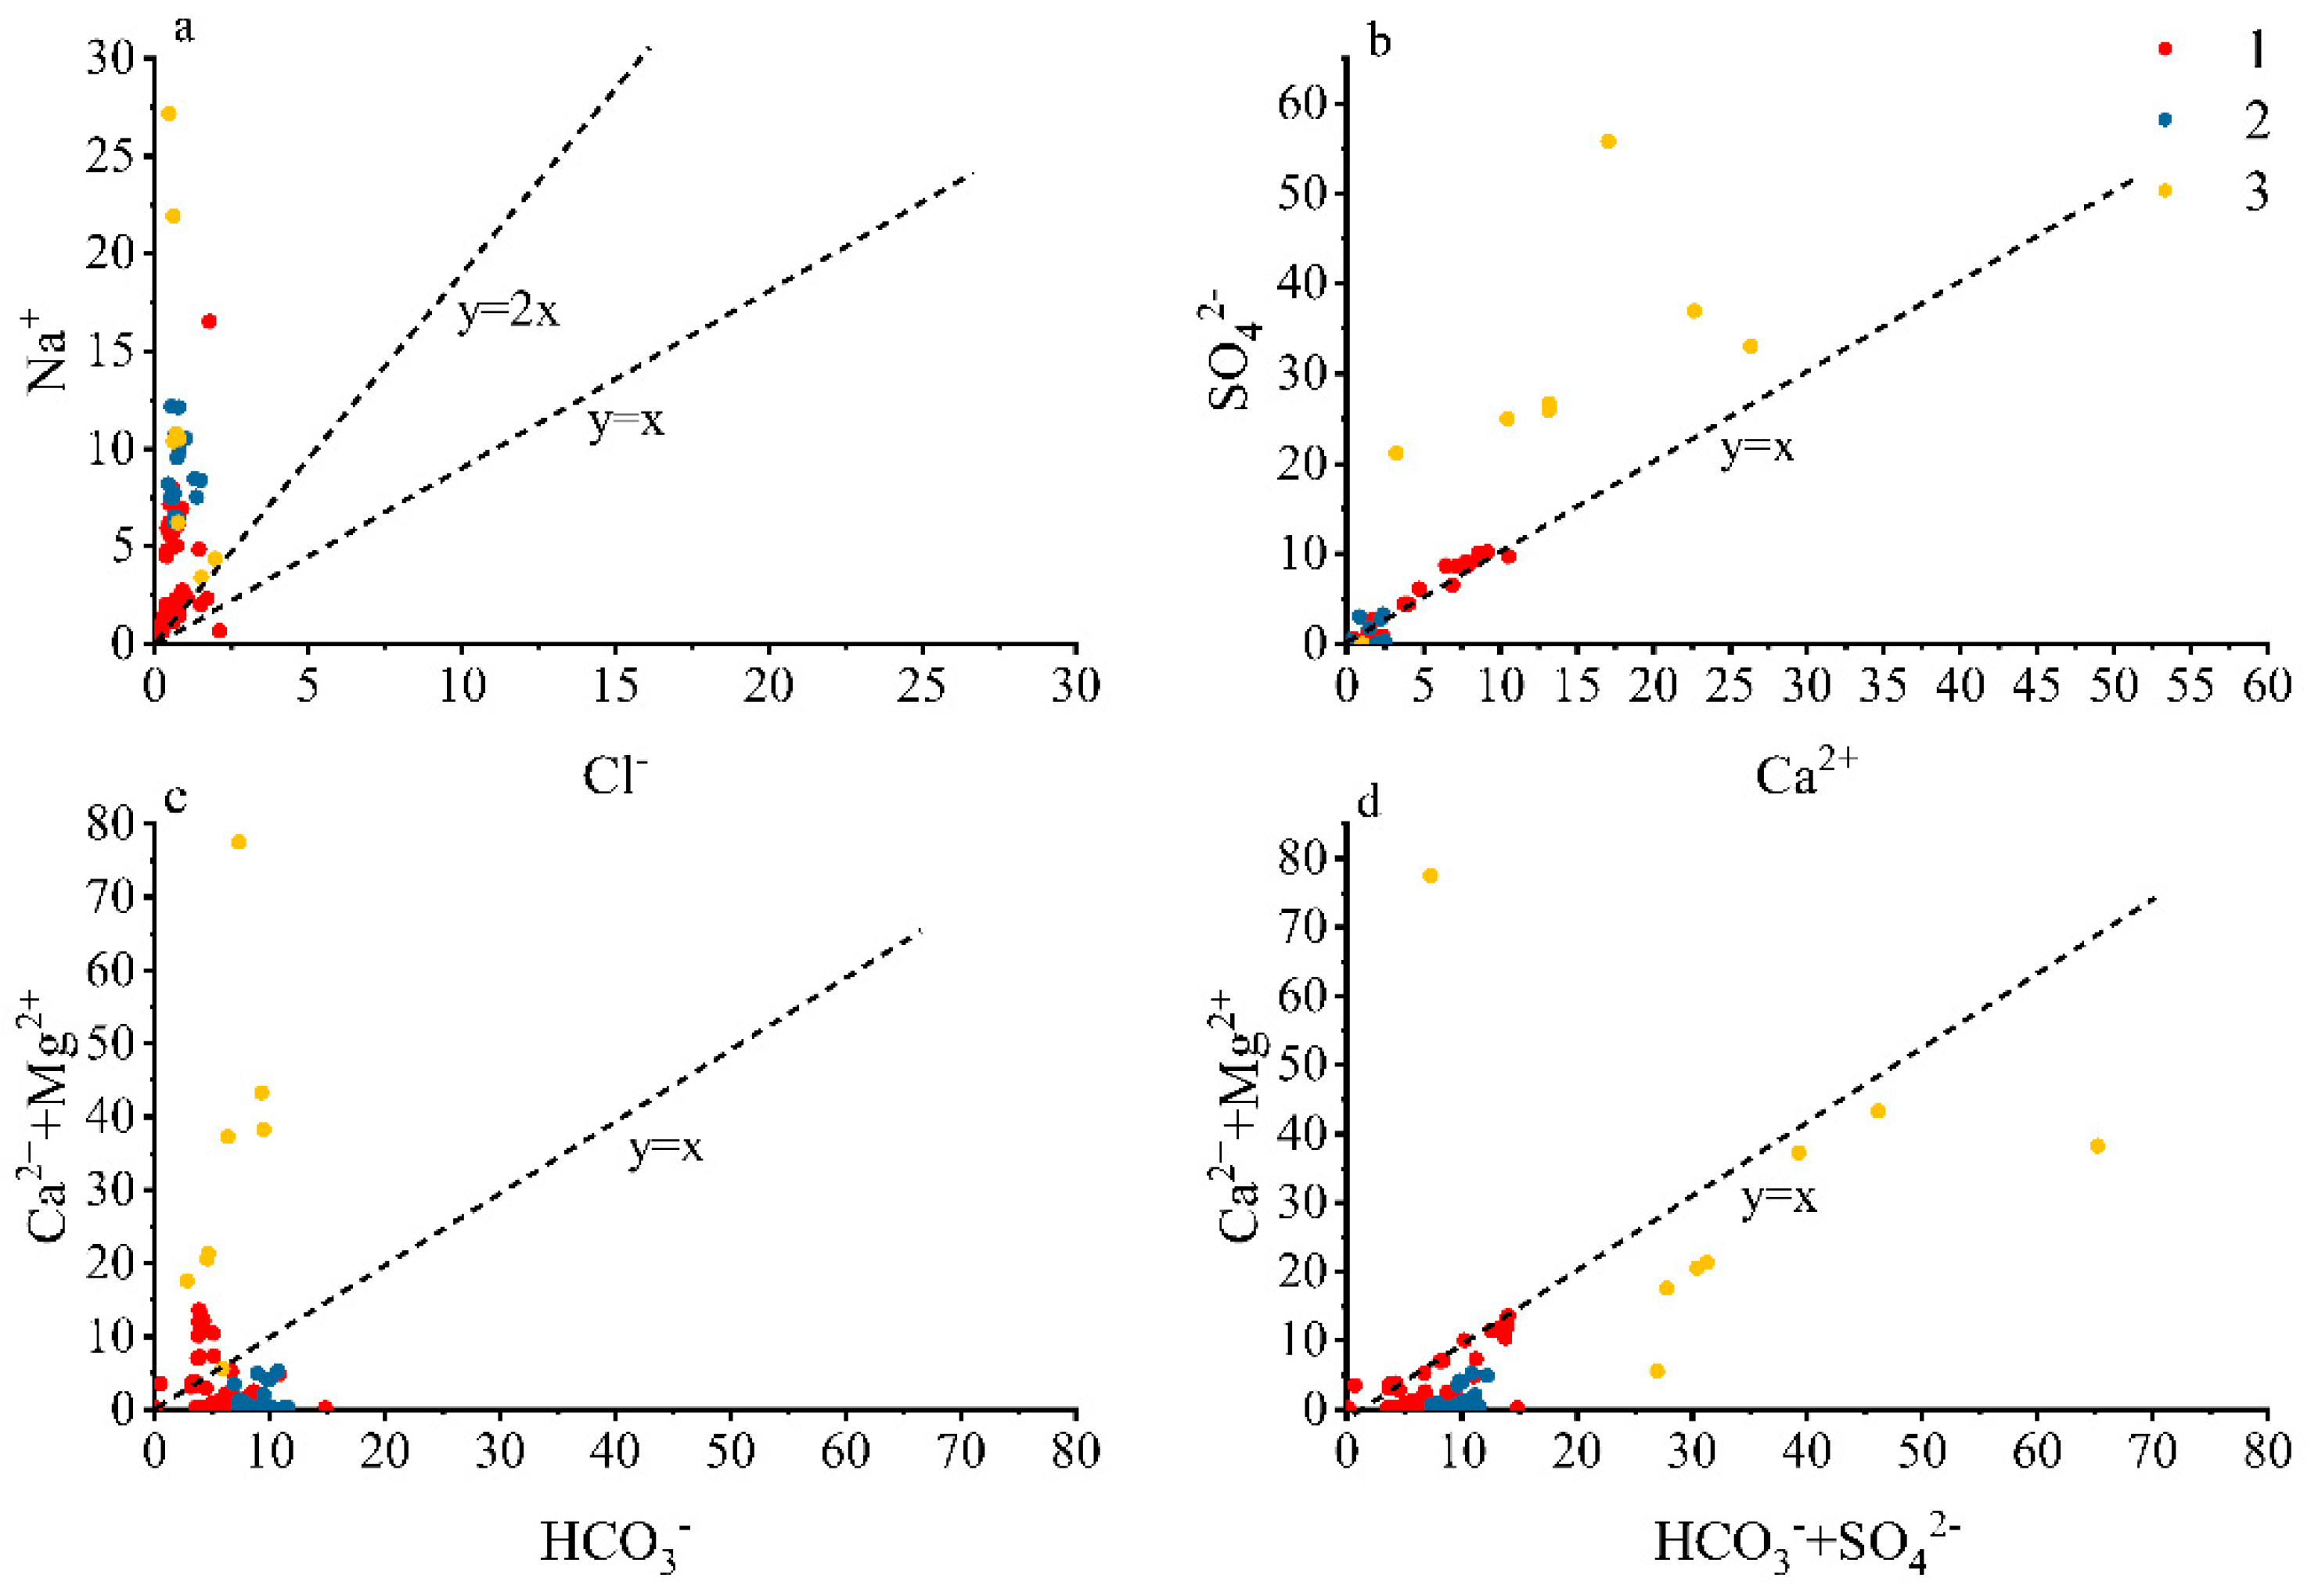
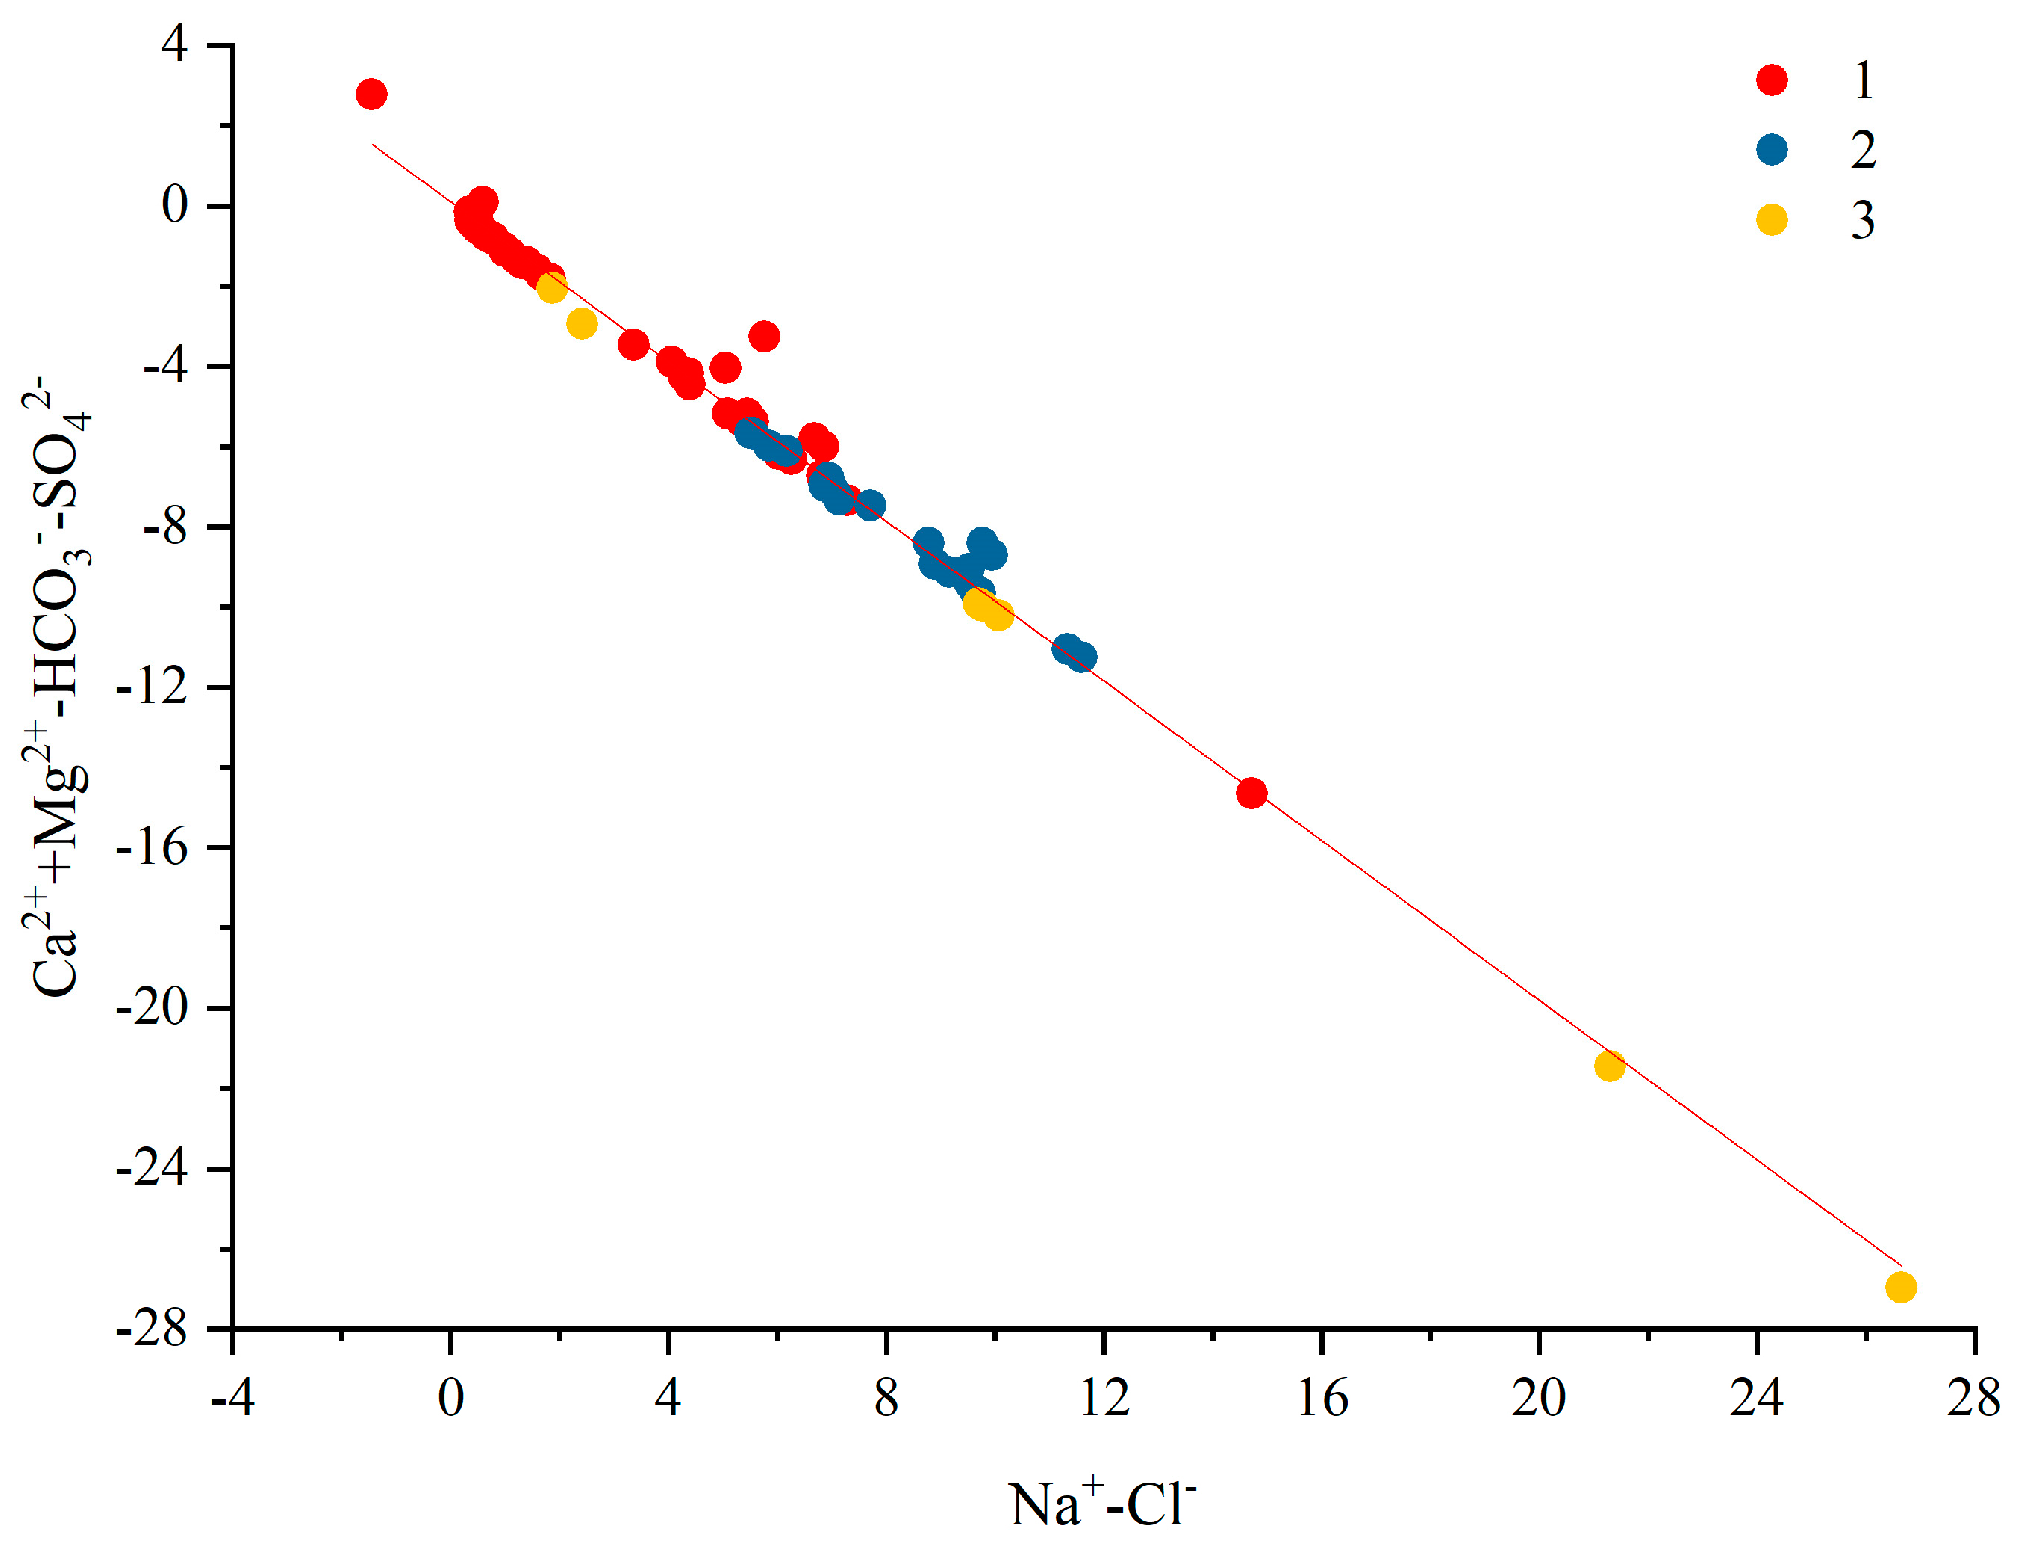
4.5. Analysis of Ion Source Based on Ion Combination and Ratio Method
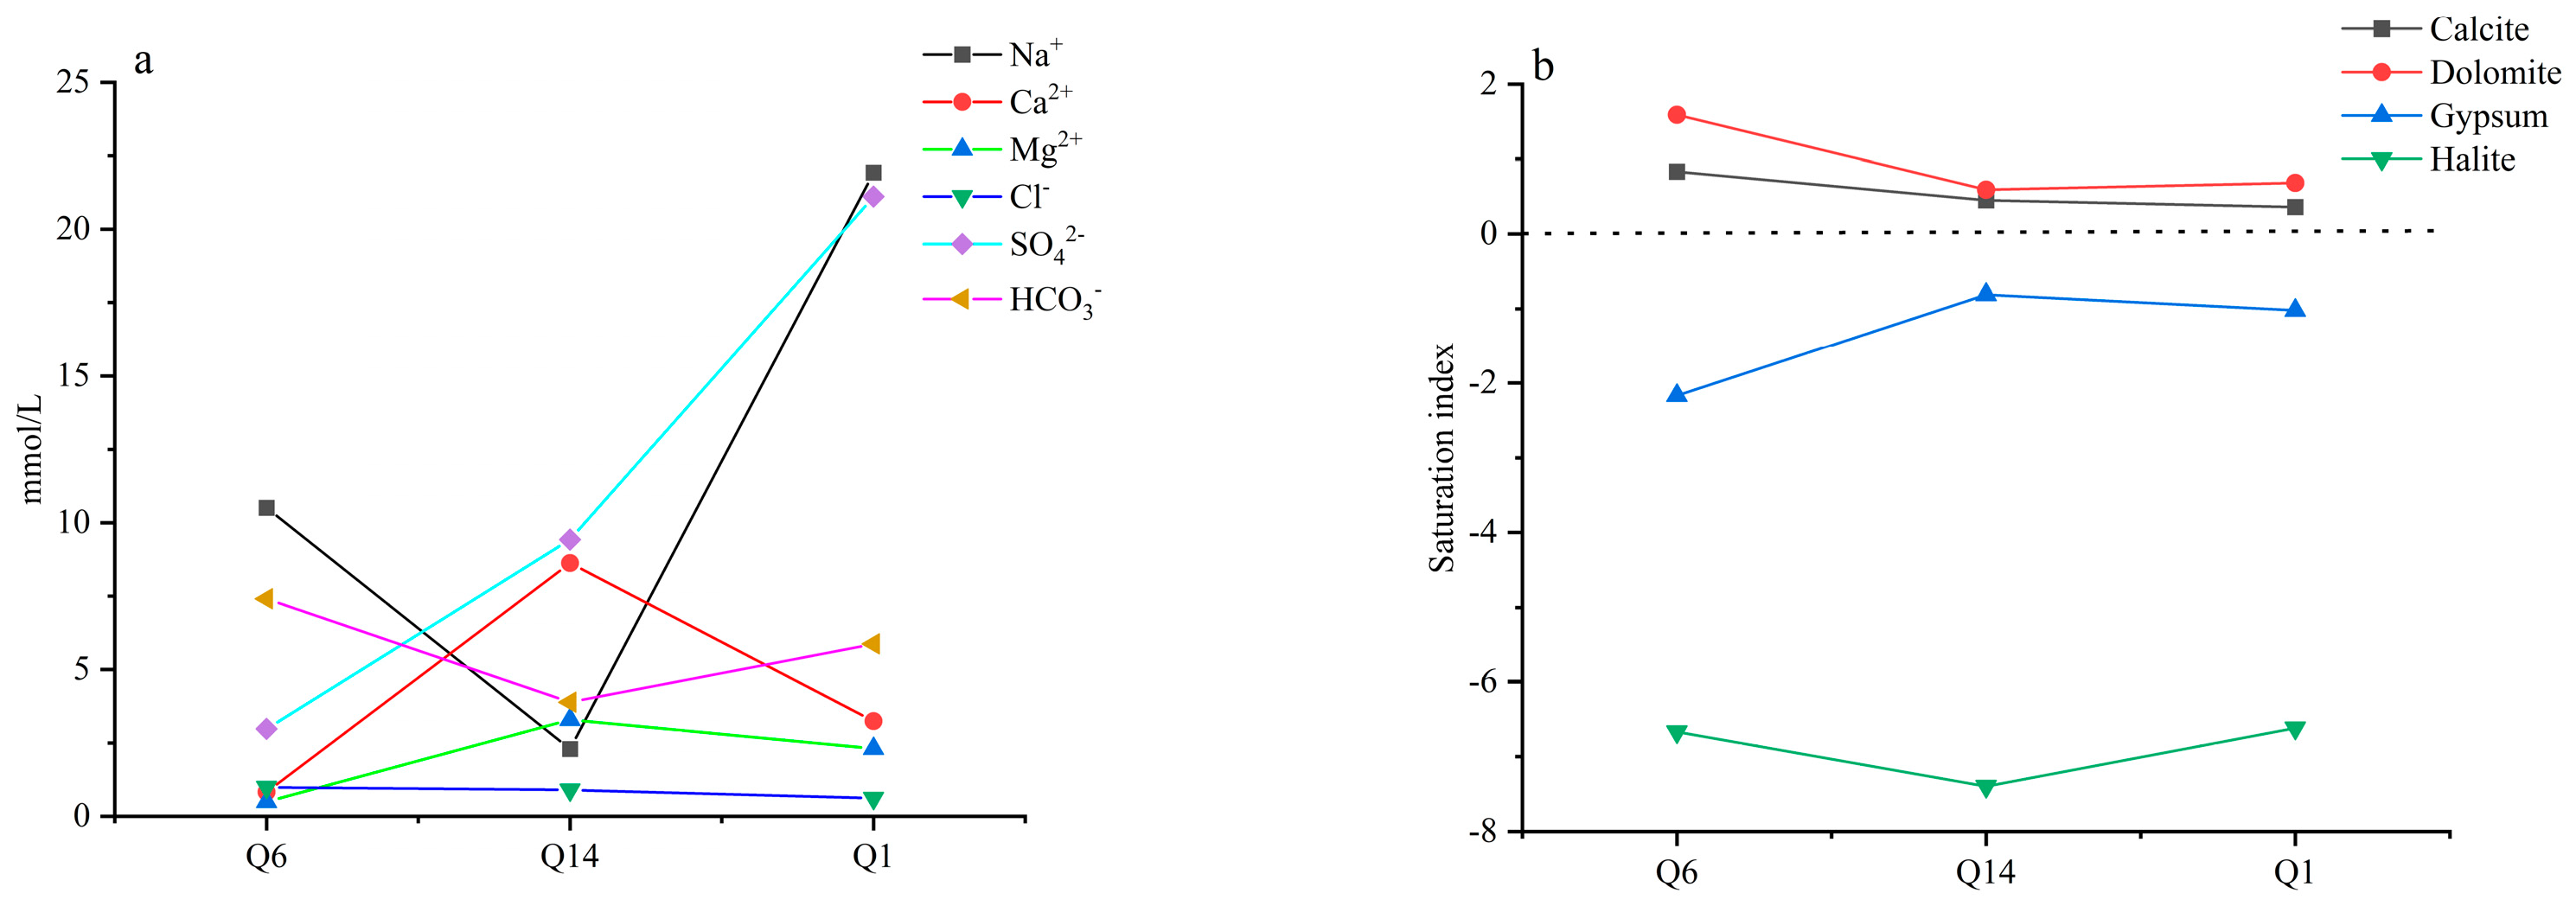
4.6. Hydrogeochemical Simulation Results
5. Conclusions
Supplementary Materials
Author Contributions
Funding
Data Availability Statement
Conflicts of Interest
References
- Zhang, J.; Chen, L.; Li, J.; Chen, Y.; Ren, X.; Shi, X. Analysis of mining effects on the geochemical evolution of groundwater, Huaibei coalfield, China. Environ. Earth Sci. 2021, 80, 98. [Google Scholar] [CrossRef]
- Teng, Y.; Zuo, R.; Xiong, Y.; Wu, J.; Zhai, Y.; Su, J. Risk assessment framework for nitrate contamination in groundwater for regional management. Sci. Total Environ. 2019, 697, 134102. [Google Scholar] [CrossRef] [PubMed]
- Dash, C.J.; Sarangi, A.; Singh, D.K.; Adhikary, P.P. Numerical simulation to assess potential groundwater recharge and net groundwater use in a semi-arid region. Environ. Monit. Assess. 2019, 191, 371. [Google Scholar] [CrossRef]
- Li, J.; Shi, Z.M.; Wang, G.C.; Liu, F. Evaluating spatiotemporal variations of groundwater quality in Northeast Beijing by self-organizing map. Water 2020, 12, 1382. [Google Scholar] [CrossRef]
- Zhang, Y.; Dai, Y.; Wang, Y.; Huang, X.; Xiao, Y.; Pei, Q. Hydrochemistry, quality and potential health risk ap-praisal of nitrate enriched groundwater in the Nanchong area, southwestern China. Sci. Total Environ. 2021, 784, 147186. [Google Scholar] [CrossRef] [PubMed]
- Zhang, F.; Huang, G.; Hou, Q.; Liu, C.; Zhang, Y.; Zhang, Q. Groundwater quality in the Pearl River Delta after the rapid expansion of industrialization and urbanization: Distributions, main impact indicators, and driving forces. J. Hydrol. 2019, 577, 124004. [Google Scholar] [CrossRef]
- Nyirenda, T.M.; Zhou, J.; Mapoma, H.; Xie, L.; Li, Y. Hydrogeochemical characteristics of groundwater at the xikuangshan antimony mine in south china. Mine Water Environ. 2016, 35, 86–93. [Google Scholar] [CrossRef]
- Mahato, M.K.; Singh, P.K.; Singh, A.K.; Tiwari, A.K. Assessment of hydrogeochemical processes and mine water suitability for domestic, irrigation, and industrial purposes in east bokaro coalfield, india. Mine Water Environ. 2018, 37, 493–504. [Google Scholar] [CrossRef]
- Yang, Y.G.; Meng, Z.L.; Jiao, W.T. Hydrological and pollution processes in mining area of Fenhe River Basin in China. Environ. Pollut. 2018, 234, 743–750. [Google Scholar] [CrossRef] [PubMed]
- Sun, Y.; Chen, G.; Xu, Z. Research progress of water environment, treatment and utilization in coal mining areas of china. Meitan Xuebao/J. China Coal Soc. 2020, 45, 304–316. [Google Scholar]
- Al-Bassam, A.M.; Khalil, A.R. Durovpwin: A new version to plot the expanded durov diagram for hy-dro-chemical data analysis. Comput. Geosci. 2012, 42, 1–6. [Google Scholar] [CrossRef]
- Ma, M.Y.; Dong, S.G.; Zhang, W.Q.; Hou, Q.Q.; Zhao, Z. Hydrochemical Characteristics and Genesis of Groundwater in Wuliangsuhai Lake Area. Earth Environ. 2021, 49, 472–479. [Google Scholar]
- Sharma, T.; Bajwa, B.S.; Kaur, I. Hydro-geochemical characteristics and quality appraisal of aquifers using mul-tivariate statistics and associated risk assessment in Tarn-Taran district, Punjab, India. Environ. Sci. Pollut. Res. 2022, 29, 54916–55493. [Google Scholar] [CrossRef] [PubMed]
- Zhang, M.; Chen, L.W.; Yao, D.X.; Hou, X.W.; Zhang, J.; Qin, H.; Ren, X.X.; Zhang, X. Hydrogeochemical processes and inverse modeling for a multilayer aquifer system in the yuaner coal mine, huaibei coalfield, china. Mine Water Environ. 2022, 41, 775–789. [Google Scholar] [CrossRef]
- Gorai, A.K.; Kumar, S. Spatial distribution analysis of groundwater quality index using gis: A case study ofm ranchi municipal corporation(rmc) area. Geoinform. Geoinform. Geostats Overv. 2013, 1, 1–11. [Google Scholar] [CrossRef]
- Qu, S.; Duan, L.; Shi, Z.; Liang, X.; Lv, S.; Wang, G.; Liu, T.; Yu, R. Hydrochemical assessments and driving forces of groundwater quality and potential health risks of sulfate in a coalfield, northern Ordos Basin, China. Sci. Total Environ. 2022, 835, 155519. [Google Scholar] [CrossRef] [PubMed]
- Nakagawa, K.; Amano, H.; Kawamura, A.; Berndtsson, R. Classification of groundwater chemistry in Shimabara, using self-organizing maps. Hydrol. Res. 2017, 48, 840–850. [Google Scholar] [CrossRef]
- Olawoyin, R.; Nieto, A.; Grayson, R.L.; Hardisty, F.; Oyewole, S. Application of artificial neural network (ANN)-self-organizing map (SOM) for the categorization of water, soil and sediment quality in petrochemical re-gions. Expert Syst. Appl. 2013, 40, 3634–3648. [Google Scholar] [CrossRef]
- Yousefi, F.; Amoozandeh, Z. A new model to predict the densities of nanofluids using statistical mechanics and artificial intelligent plus principal component analysis. Chin. J. Chem. Eng. 2017, 25, 157–165. [Google Scholar] [CrossRef]
- Tang, P.; Taohong, Y.E.; Xia, Z.; Zhou, Y.U.; Zhang, H. A novel method for chemistry tabulation of strained premixed/stratified flames based on principal component analysis. Appl. Math. Mech. 2018, 39, 12. [Google Scholar] [CrossRef]
- Chen, J.P.; Zhu, J.C.; Yin, X.C.; Lv, X.M.; Sun, H.F. Discrimination of mine water-inrush source based on PHREEQC inverse analysis-cluster analysis method. Coal Technol. 2020, 39, 75–78. [Google Scholar]
- Parkhurst, D.L.; Appelo, C.A.J. User’s Guide to PHREEQC(Version 2)—A Computer Program for Speciation, Batch-Reaction, One-Dimensional Transport, and Inverse Geochemical Calculations; Water Resources Investigations Report; U.S. Geological Survey: Reston, VA, USA, 1999.
- Tran, T.Q.; Banning, A.; Wisotzky, F.; Wohnlich, S. Mine water hydrogeochemistry of abandoned coal mines in the outcropped Carboniferous formations, Ruhr Area, Germany. Environ. Geol. 2020, 79, 84. [Google Scholar] [CrossRef]
- Jiang, W.; Zhao, D.; Wang, G.; Guo, Y.; Liu, C.; Zhong, T.; Liu, S.; He, S. Hydro-geochemical characteristics and formation of groundwater in Tuha basin, Xinjiang. Geoscience 2016, 30, 825–833. [Google Scholar]
- Gibbs, R.J. Mechanisms controlling world water chemistry. Science 1970, 170, 1088–1090. [Google Scholar] [CrossRef]
- Gao, Z.; Han, C.; Yuan, S.; Liu, J.; Peng, Y.; Li, C. Assessment of the hydrochemistry, water quality, and human health risk of groundwater in the northwest of nansi lake catchment, north China. Environ. Geochem. Health 2022, 44, 961–977. [Google Scholar] [CrossRef]
- Li, P.; Qian, H.; Wu, J.; Zhang, Y.; Zhang, H. Major ion chemistry of shallow groundwater in the dongsheng coalfield, ordos basin, china. Mine Water Environ. 2013, 32, 195–206. [Google Scholar] [CrossRef]
- Li, Z.X.; He, Y.Q.; Pang, H.X.; Yang, X.M.; Jia, W.X.; Zhang, N.N. Source of major anions and cations of snowpacks in Hailuogou No.1 glacier, Mt. Gongga and Baishui No. 1 glacier, Mt. Yulong. J. Geogr. Sci. 2008, 18, 115–125. [Google Scholar] [CrossRef]
- Zhu, G.F.; Su, Y.H.; Feng, Q. The hydrochemical characteristics and evolution of groundwater and surface water in the heihe river basin, northwest China. Hydrogeol. J. 2008, 16, 167–182. [Google Scholar] [CrossRef]
- Ma, L.; Qian, J.; Yan, X.; Luo, Q.; Chen, L.; Zhao, W. Using GIS methods for determining the spatial distribution of groundwater hydrochemical facies: A Case study for a shallow aquifer in Fuyang, China. Environ. Earth Sci. 2019, 78, 335. [Google Scholar] [CrossRef]
- Wang, P.; Yu, J.J.; Zhang, Y.C.; Liu, C.M. Groundwater Recharge and Hydrogeochemical Evolution in the Ejina Basin, Northwest China. J. Hydrol. 2013, 476, 72–86. [Google Scholar] [CrossRef]
- Zhu, B.Q.; Wang, X.M.; Rioual, P. Multivariate Indications between Environment and Ground Water Recharge in a Sedimentary Drainage Basin in Northwestern China. J. Hydrol. 2017, 549, 92–113. [Google Scholar] [CrossRef]
- Wang, J.J.; Liang, X.; Liu, Y.F.; Jin, M.G.; Peter, S.K.; Knappett, P.S.; Liu, Y.L. Hydrogeochemical Evolution along Groundwater Flow Paths in the Manas River Basin, Northwest China. Ground Water 2019, 57, 575–589. [Google Scholar] [CrossRef]
- Barzegar, R.; Moghaddam, A.A.; Tziritis, E.; Fakhri, M.S.; Soltani, S. Identification of hydrogeochemical processes and pollution sources of groundwater resources in the Marand plain, northwest of Iran. Environ. Earth Sci. 2017, 76, 297. [Google Scholar] [CrossRef]
- Zaidi, F.K.; Nazzal, Y.; Jafri, M.K.; Naeem, M.; Ahmed, I. Reverse ion exchange as a major process controlling the groundwater chemistry in an arid environment: A case study from northwestern Saudi Arabia. Environ. Monit. Assess. 2015, 187, 607. [Google Scholar] [CrossRef] [PubMed]

Disclaimer/Publisher’s Note: The statements, opinions and data contained in all publications are solely those of the individual author(s) and contributor(s) and not of MDPI and/or the editor(s). MDPI and/or the editor(s) disclaim responsibility for any injury to people or property resulting from any ideas, methods, instructions or products referred to in the content. |
© 2025 by the authors. Licensee MDPI, Basel, Switzerland. This article is an open access article distributed under the terms and conditions of the Creative Commons Attribution (CC BY) license (https://creativecommons.org/licenses/by/4.0/).
Share and Cite
Wei, Z.; Ji, Y.; Li, Y.; Fang, H.; Dong, D.; Yu, L. An Analysis of Multi-Coal Seam Mining Impacting Aquifer Water Based on Self-Organizational Maps. Water 2025, 17, 598. https://doi.org/10.3390/w17040598
Wei Z, Ji Y, Li Y, Fang H, Dong D, Yu L. An Analysis of Multi-Coal Seam Mining Impacting Aquifer Water Based on Self-Organizational Maps. Water. 2025; 17(4):598. https://doi.org/10.3390/w17040598
Chicago/Turabian StyleWei, Zhonglin, Yuan Ji, Yuan Li, Huiming Fang, Donglin Dong, and Lujia Yu. 2025. "An Analysis of Multi-Coal Seam Mining Impacting Aquifer Water Based on Self-Organizational Maps" Water 17, no. 4: 598. https://doi.org/10.3390/w17040598
APA StyleWei, Z., Ji, Y., Li, Y., Fang, H., Dong, D., & Yu, L. (2025). An Analysis of Multi-Coal Seam Mining Impacting Aquifer Water Based on Self-Organizational Maps. Water, 17(4), 598. https://doi.org/10.3390/w17040598