Article

Seasonal Variations and Drivers of Total Nitrogen and Phosphorus in China’s Surface Waters

1
School of Remote Sensing and Geomatics Engineering, Nanjing University of Information Science and Technology, Nanjing 210044, China
2
Technology Innovation Center for Integration Applications in Remote Sensing and Navigation, Ministry of Natural Resources, Nanjing 210044, China
3
Jiangsu Engineering Center for Collaborative Precise Navigation/Positioning and Smart Applications, Nanjing 210044, China
4
School of Geography, Geomatics and Planning, Jiangsu Normal University, Xuzhou 221116, China
*
Author to whom correspondence should be addressed.
Water 2025, 17(4), 512; https://doi.org/10.3390/w17040512
Submission received: 1 January 2025 / Revised: 7 February 2025 / Accepted: 7 February 2025 / Published: 11 February 2025

Abstract

:
Total nitrogen (TN) and total phosphorus (TP) are essential indicators for assessing water quality. This study systematically analyzes the spatial and temporal distribution of TN and TP in China’s surface waters and examines the influence of natural factors and human activities on their concentrations. Utilizing data from 1387 monitoring sites (2020–2021) and employing K-means clustering and geographically weighted regression (GWR), we found that the national average concentrations were 3.89 mg/L for TN and 0.096 mg/L for TP. Spatially, higher TN and TP levels were observed in northern regions, coastal areas, and plains compared with southern, inland, and mountainous areas. Notably, TN concentrations reached up to 29.49 mg/L in the Haihe River basin and related plains, while TP peaked at 0.497 mg/L in the southeastern Shandong and northern Jiangsu coastal zones. Temporally, TN levels were approximately 50% higher in winter than summer, whereas TP levels were about 40% higher in summer. Key influencing factors included rainfall, elevation, fertilizer use, and population density, with spatial heterogeneity observed. Rainfall was the primary factor for TN change and the secondary factor for TP change. Soil type positively correlates with TN and TP changes, affecting non-point source pollution. Human activities such as land use, fertilizer application and population density had a significant effect on the nitrogen and phosphorus concentrations, while woodland had a significant impact on the improvement of water quality. The geographically weighted regression analysis showed spatial heterogeneity in the effects of each factor on TN and TP concentrations, and the best fit was at the watershed scale. The findings highlight the need for enhanced control of agricultural runoff, improved sewage treatment, and region-specific management strategies to inform effective water environment policies in China.

1. Introduction

Maintaining the sound quality of water bodies helps to balance water ecosystems, promotes the restoration of wetland ecosystems, and slows down environmental problems such as water depletion and soil erosion [1]. Pollution of water bodies not only threatens human health but also has profound impacts on aquatic ecosystems and biodiversity. Water quality monitoring is essential for the timely detection of water pollution. Water quality monitoring is vital to detect and promptly solve all kinds of pollution problems in water bodies to ensure the sustainable use of water resources [2]. By monitoring water quality, it is possible to trace the source of pollution, assess the extent of pollution, and provide a scientific basis for developing environmental protection policies and management measures [3].
Nutrient pollution of surface water bodies is a serious problem facing the current water environment and total phosphorus (TP) and total nitrogen (TN) play vital roles in assessing and monitoring the quality of water bodies [4]. Excessive amounts of TP and TN can lead to eutrophication, formation of algal blooms, disruption of the ecological balance of water bodies, negative impacts on water quality, and a series of environmental problems [5]. TP is mainly derived from agricultural discharges, municipal sewage, and industrial wastewater, while TN is primarily derived from farming activities, municipal sewage, and atmospheric deposition [6,7]. An in-depth understanding of the transport and transformation processes of TP and TN can help predict the eutrophication trend and develop scientific water quality management strategies [8].
TP and TN levels in surface waters in China show regional differences. Rivers and lakes (reservoirs) are the main components of surface water. The primary pollution indicators for rivers are chemical oxygen demand (COD), ammonia nitrogen (AN) and permanganate index (PMI) [9]. The primary pollution indicators for lakes (reservoirs) are total phosphorus, chemical oxygen demand, and permanganate index [9]. The water quality of lakes can often directly reflect the regional water environment quality. For large lakes such as Taihu Lake and Chaohu Lake, changes in their water quality are important indicators for measuring the water environment health of the surrounding areas and beyond. According to the results of the national water quality testing work published in the “2022 Bulletin of China’s Environmental Situation”, among the 204 key lakes in China in which the monitoring of nutritional status is carried out, lakes in a light eutrophic process and those in a moderate eutrophic process account for 30% [9,10,11]. The eutrophic status of lakes and reservoirs in China remains thought provoking. Therefore, studying the spatial and temporal variations and drivers of total phosphorus (TP) and total nitrogen (TN) in Chinese surface waters in short and medium cycles is necessary.
Currently, research on nitrogen and phosphorus monitoring in Chinese water bodies is focused mainly on regional lake studies and the monitoring of nitrogen and phosphorus in major rivers [12,13,14], and the study areas are mainly concentrated in the Yellow River basin and Yangtze River basin [15,16]. Most of these research areas are small in scale. Although studies have focused on the pollution status of TP and TN in surface waters, there are still insufficient systematic studies on their spatial and temporal characteristics and driving factors in short and medium cycles. In particular, the analysis of the spatial and temporal dynamics of TP and TN concentrations nationally and the comprehensive evaluation of the impacts of natural factors and human activities on them have yet to be in-depth.
This paper aims to investigate the spatial and temporal variations of total phosphorus (TP) and total nitrogen (TN) in Chinese surface waters in the short and medium term and to analyze their drivers. The nutrient status of Chinese surface waters was investigated and monitored to reveal the trends of total phosphorus (TP) and total nitrogen (TN) in different regions and time scales. We analyzed the temporal and spatial change rules of TN and TP, which are the indicators of the water quality of surface water bodies in China, from 2020 to 2021. This analysis also utilized a combination of these data with the amount of pollution into the lake of the watershed and meteorological and hydrological data, which were in turn spatially combined with the topography of the watersheds, soils, land use and other factors. The system will clarify the driving factors affecting the change of nitrogen and phosphorus water quality, and provide reference and suggestions for the management of river and lake environmental pollution.

2. Study Area and Data

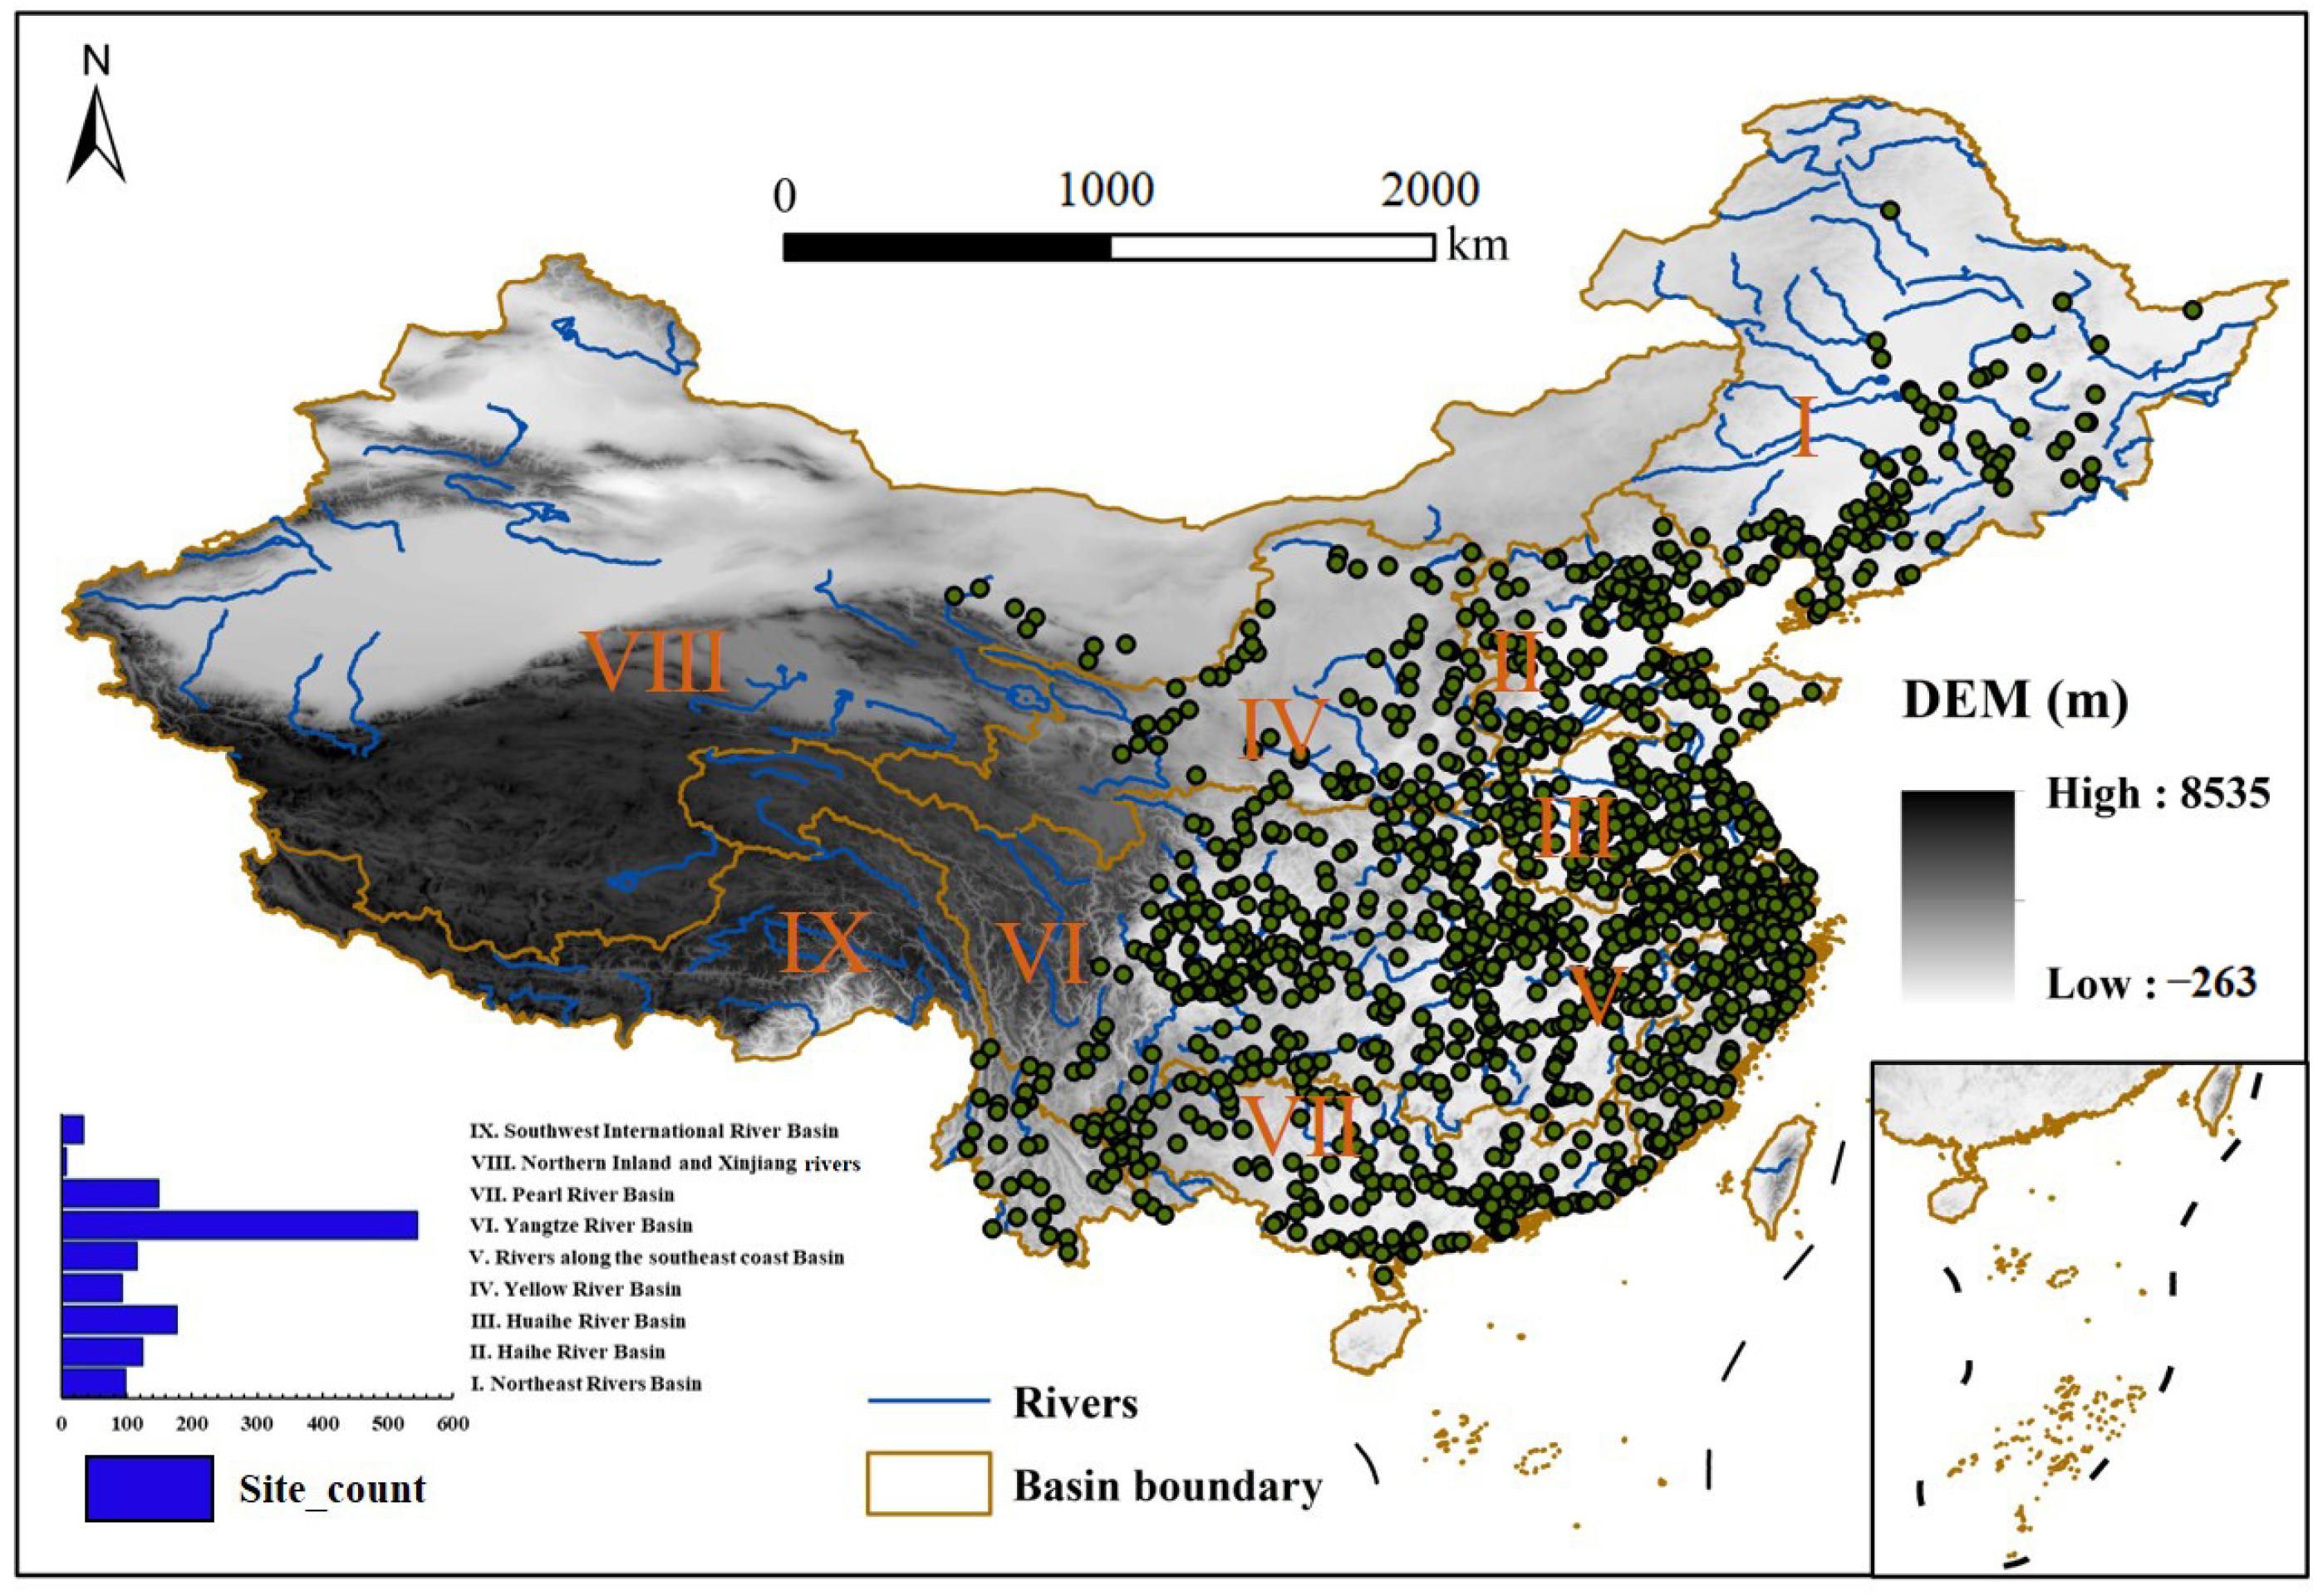
2.1. Overview of the Study Area

Nine major river basins in China, including the Yangtze River basin, the Yellow River basin, the Pearl River basin, the Huaihe River basin, the Haihe River basin, the northeastern river basins, the southwestern river basins, the southeastern coastal river basins, as well as the inland northern river basins and the Xinjiang river basins, were used as the study areas in the present study (Figure 1). These basins cover a wide geographical area in China, with diverse climatic conditions, topographic features, and human activities, and provide a good spatial background for studying spatial and temporal changes of nitrogen and phosphorus in surface waters.
The concentrations of total nitrogen (TN) and total phosphorus (TP) in China’s surface water bodies are affected by multiple factors, showing distinct seasonal variation patterns in different river basins. This is closely associated with the natural geographical conditions and human activities within each basin. There are significant disparities among China’s major river basins in aspects such as area, topography, water systems, land-use types, and agricultural activities [17]. The Yangtze River basin covers an area of about 1.8 million square kilometers, with a well-developed water system and numerous lakes and wetlands. The main land-use types include extensive arable land, especially rice and oilseed rape cultivation, with a high intensity of agricultural activities and widespread use of chemical fertilizers, leading to serious problems of nitrogen and phosphorus pollution. Under humid climatic conditions, precipitation promotes surface source pollution of nitrogen and phosphorus from the soil to the river system, and the overall environment is under greater pressure [18]. The Yellow River basin covers an area of about 795,000 square kilometers, with a diverse topography covering both plateaus and plains. The main land use in the basin is arable land, mainly cultivated with wheat, maize, and cotton, with high-intensity agricultural activities and widespread fertilizer application, leading to increased nitrogen and phosphorus pollution [19]. The region’s relative scarcity of water resources and reliance on chemical fertilizers for irrigation exacerbate the pollution problem [20]. The Pearl River basin covers an area of about 450,000 square kilometers and is known for its rich waterways and abundant precipitation. The main land-use types in the basin include cropland, forest land, and urban land, with agricultural activities dominated by the cultivation of rice, sugar cane, and fruits, the relatively widespread use of chemical fertilizers, and high agricultural intensity. The Huaihe River basin covers an area of about 280,000 square kilometers and is known for its dense water systems and moderate precipitation. The main land-use types in the basin include cropland and forest land, and agricultural activities are dominated by rice, wheat, and oilseed rape. The Haihe River basin covers an area of about 320,000 square kilometers, with a topography dominated by plains and a relatively complex water system. The main types of land use in the basin include arable land and urban land, and agricultural activities are mainly focused on the cultivation of wheat, corn, and vegetables, with the use of chemical fertilizers being more common and the agricultural intensity being higher. The northeast river basins includes major rivers such as the Songhua, Heilongjiang, and Liao, with a watershed area of about 1.25 million square kilometers [17]. The region is known for its fertile black soil, with the main land-use types being arable land and forest land, and agricultural activities dominated by the cultivation of maize and soybeans, with the use of chemical fertilizers being more prevalent and the intensity of agriculture being relatively high. The southwest international river basins cover an area of about 850,000 square kilometers, including major rivers such as the Lancang and Mekong, with a topography dominated by mountains and plateaus. The main land-use types in the region are arable land and forest land, and agricultural activities are dominated by rice, maize, and tea cultivation. With the development of tourism and urbanization, urban sewage and agricultural surface pollution have impacted nitrogen and phosphorus concentrations in water bodies [21]. The northern inland and Xinjiang River basins include the Tarim River, the Kashgar River, and other major rivers, with a basin area of about 3.34 million square kilometers, mainly covering the Xinjiang Uygur Autonomous Region and surrounding areas [17]. The region’s terrain is dominated by arid and semi-arid plateaus and mountains, and water resources are relatively scarce. The main land-use types include arable land and grassland, and agricultural activities are dominated by the cultivation of cotton, grains, and fruits. Due to the dry climate and limited precipitation, excessive irrigation and fertilization may lead to nitrogen and phosphorus enrichment and loss, resulting in water pollution. The southeast coastal rivers basin is a general term for small and medium-sized rivers that enter the sea independently in the southeast of China, except for the Yangtze River and the Pearl River, with a watershed area of about 240,000 square kilometers, mainly covering the provinces of Fujian, Guangdong and Zhejiang. It is the main distribution area of hilly terrain, with well-developed water systems and abundant precipitation. The main land-use types include arable land, forest land and urban land. Agricultural activities are dominated by rice, fruit, vegetable and tea cultivation, and the use of chemical fertilizers with high agricultural intensity is common. The monsoon climate concentrates precipitation and easily triggers the loss of nitrogen and phosphorus, further affecting water quality and ecological balance [22].

2.2. Data Sources and Processing

2.2.1. Measured Water Quality Data

The measured water quality data are mainly from the China Environmental Monitoring Center (CEMC) and the monitoring results of the National Surface Water Quality Monitoring Network. In this study, the total nitrogen and total phosphorus data from 1387 water quality monitoring stations in nine major river basins in China for the year of 2020–2021 were analyzed and studied to analyze the spatial distribution of total nitrogen and total phosphorus. The layout of monitoring stations is shown in Figure 1. The statistical summaries of the TN and TP values in each river basin are shown in Table 1 and Table 2.

2.2.2. Meteorological Data

To analyze the effect of rainfall on the distribution of total nitrogen and total phosphorus concentrations, the Climate Hazards Group Infrared Precipitation and Site Data (CHIRPS, Version 2.0) was used in this study. CHIRPS provides global high-resolution precipitation data from 1981 to the present, combining 0.05° resolution satellite images with ground station data to create rainfall time series for trend analysis and seasonal drought monitoring [23]. This study extracted daily rainfall data for 2020 and 2021 within a 5 km buffer zone around each monitoring station using the Google Earth Engine platform. The seasonal and annual average precipitation (from 2020 to 2021) of each river basin is shown in Table 3.

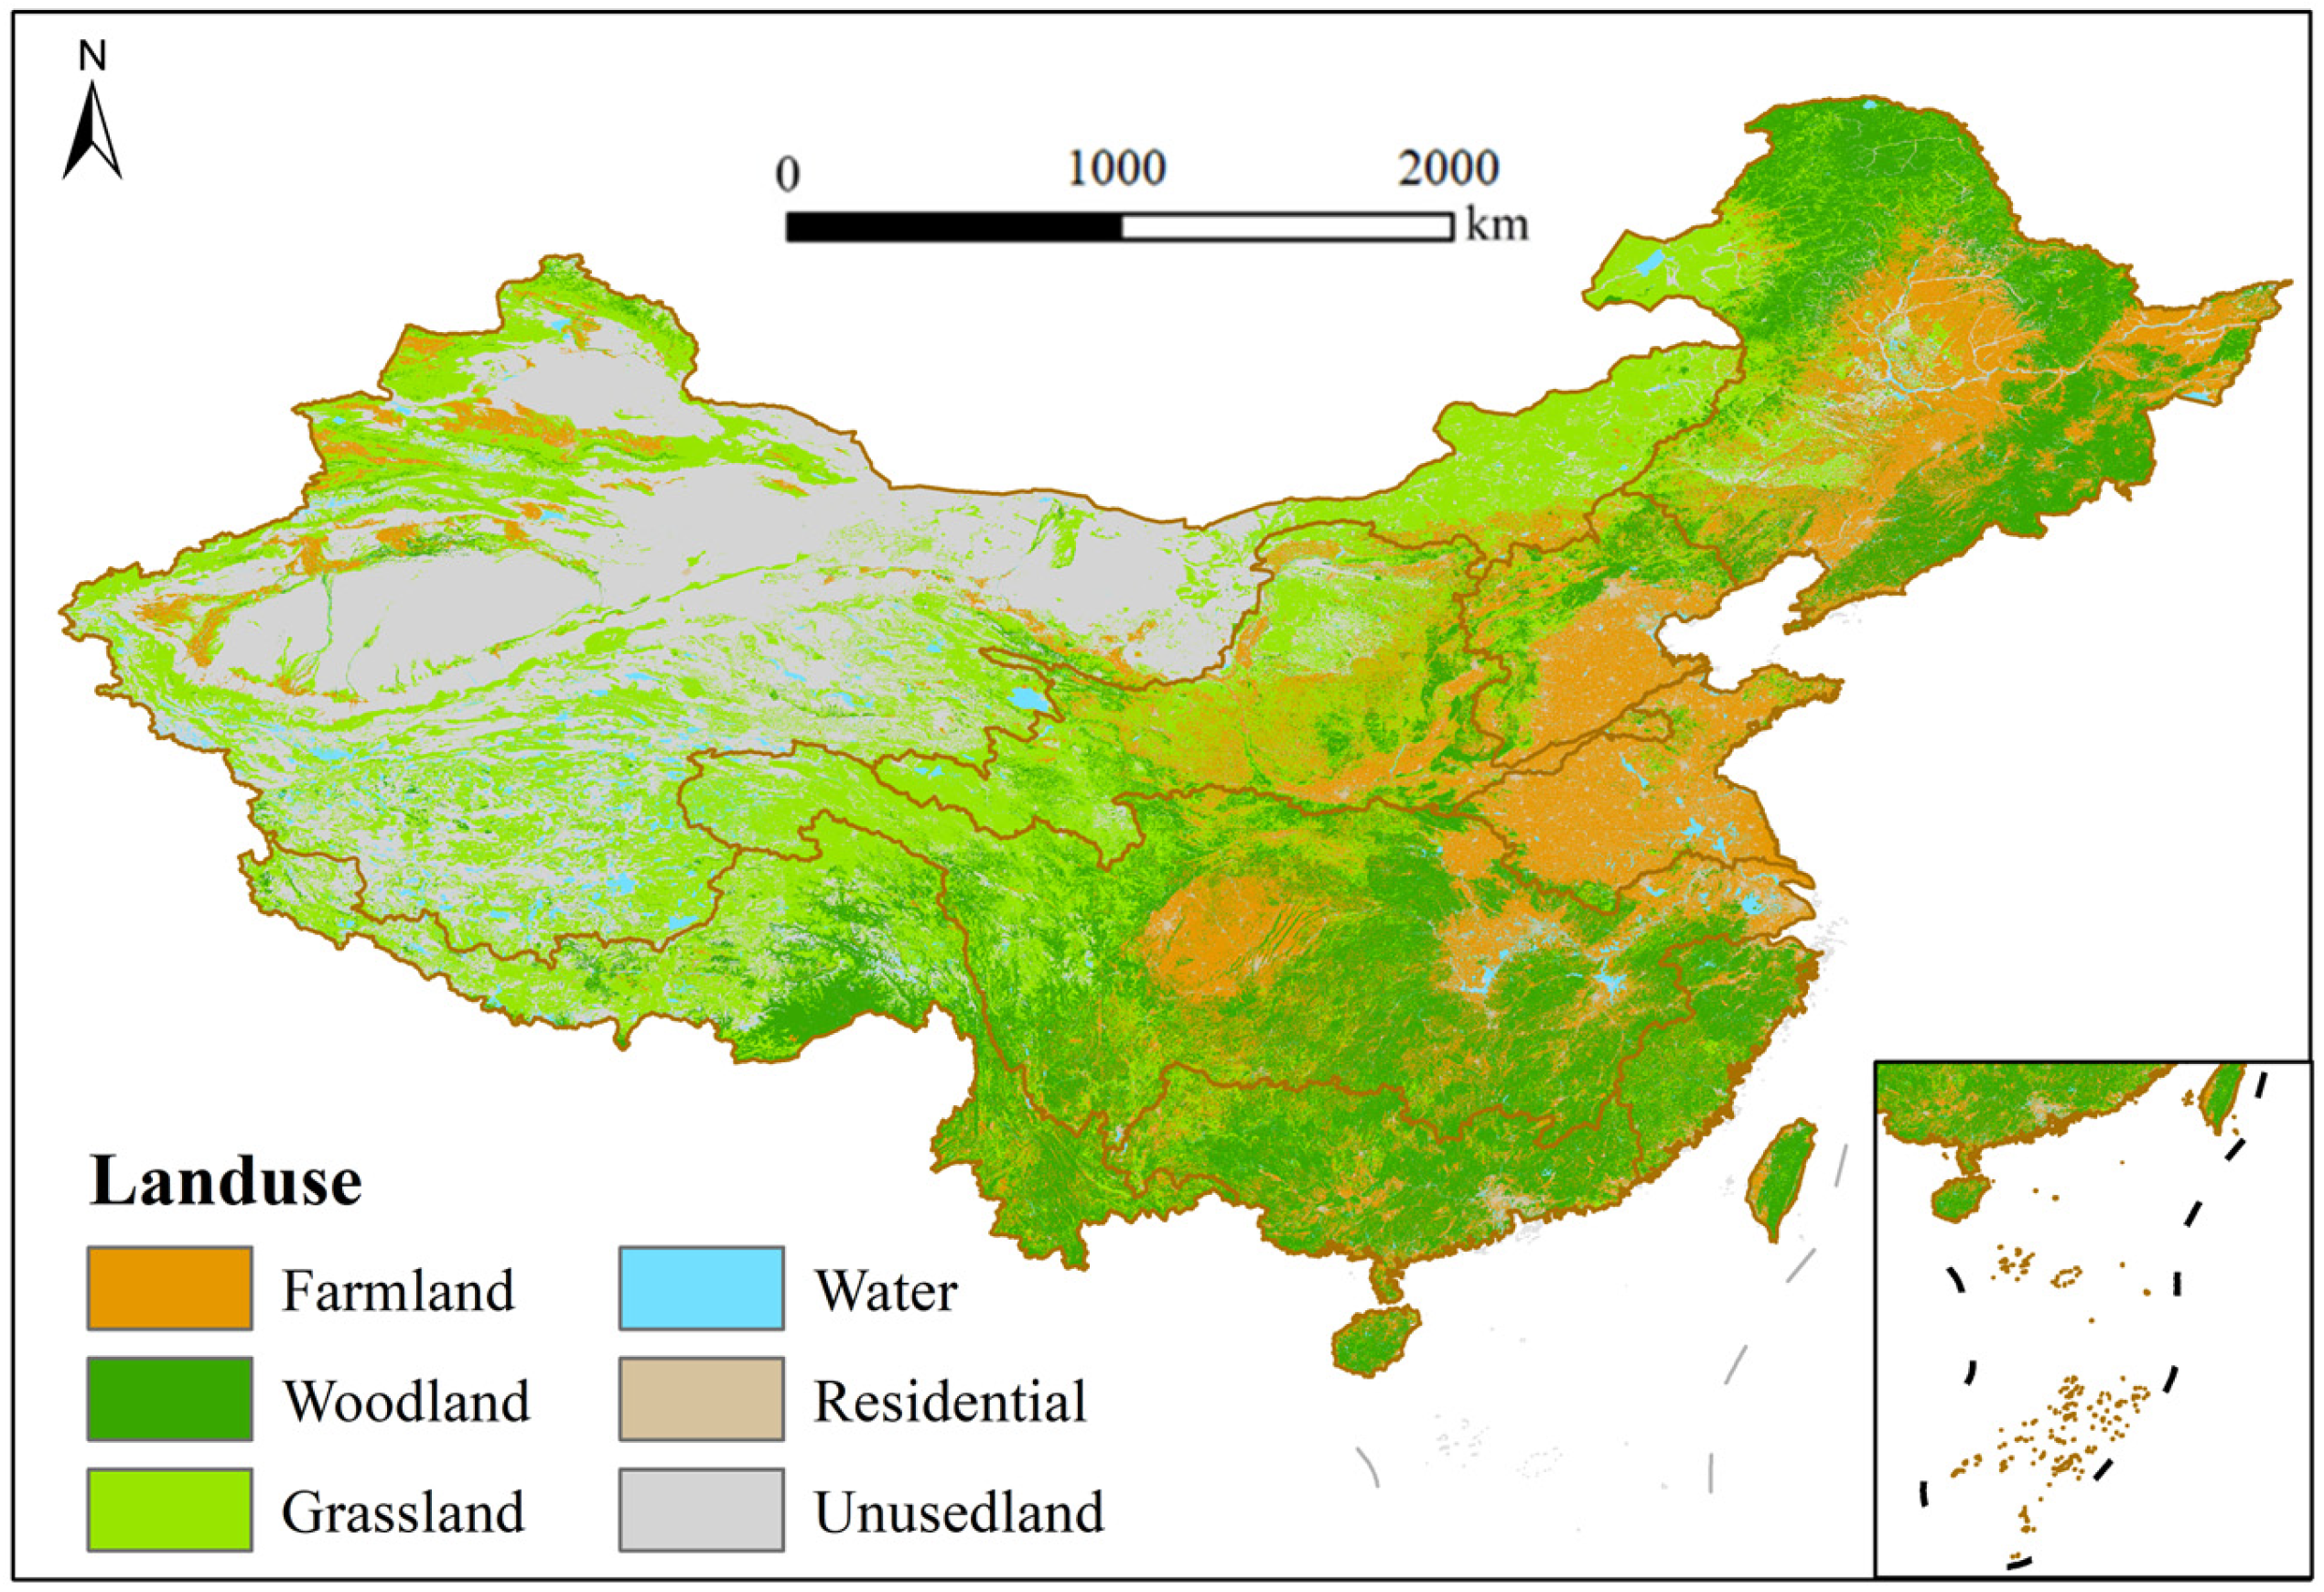
2.2.3. Land-Use Data

Land-use data from the China Multi-Period Land Use Remote Sensing Monitoring Dataset (CNLUCC), with a spatial resolution of 30 m2, were used to analyze the impact of land use on the spatial and temporal changes of nitrogen and phosphorus. The dataset was constructed by manual visual interpretation using Landsat satellite remote sensing images from the United States as the primary source of information. It covered the land-use types in 2020. The data were classified using a two-level classification system. This paper used the first classification level, including six categories: arable land, forest land, grassland, watershed, construction land, and unutilized land [24]. The land classification of each region is shown in Figure 2.

2.2.4. Soil Type Data

To study the driving factors of the nature of the subsurface on the spatial and temporal distribution of nitrogen and phosphorus concentrations, the spatial distribution data of soil types in China were digitized based on the 1:1 million soil map of the People’s Republic of China, which was compiled and published by the National Soil Census Office in 1995, and the traditional system of “Soil Occurrence Classification” was adopted, with a total of 12 soil classes, 61 soil categories and 227 subclasses. The number of records in the soil attribute database reaches 2647, with 16 attribute data items covering all types of soils and their main attribute characteristics throughout the country [25].

2.2.5. Fertilization Data

Fertilization data were used to study the effect of fertilizer application on nitrogen and phosphorus concentration levels. The study used the historical nitrogen fertilizer application dataset of China from 1952–2018 (National Ecological Data Center Resource Sharing Service Platform (nesdc.org.cn), with a spatial resolution of 5 km × 5 km, which integrates the relevant data from the IFA, the FAO, the National Bureau of Statistics, and the Compendium of Agricultural Products Data in China. The dataset integrated the relevant data from IFA, FAO, the National Bureau of Statistics and China Agricultural Products Data Compendium, reconstructed the total amount of nitrogen fertilizer used in each province of China and the fertilizer application rate of China’s major planting crops, took into account the three uncertainty factors and divided the data into eight scenarios to statistically calculate the fertilizer application rate data of China’s crops [26].The fertilization conditions in each river basin are shown in Figure 3.

3. Methods

3.1. Spatial and Temporal Patterns Analysis of TP:TN

Utilize the elbow method. By calculating the sum of squared errors (SSE) values corresponding to different numbers of clusters, and then by visualizing the relationship between the SSE values and the number of clusters, an appropriate number of clusters can be selected. Cluster analysis, as an effective big data analysis tool, is widely used in the fields of economy, biology, artificial intelligence, etc. The K-means cluster method is one kind of cluster analysis method, and is an algorithm of the cyclic iterative solution. Its purpose is to find the potential categories of the sample data, and its main features are its simplicity, speed, and easiness to understand. This method is of great significance for exploring the spatial clustering characteristics of nitrogen and phosphorus pollution in watersheds and revealing the key source areas of nonpoint source pollution emissions in watersheds. Therefore, to further explore the spatial clustering characteristics of nonpoint source pollution loads in watersheds, reveal the spatial and temporal distribution patterns of nitrogen and phosphorus pollution loads, and analyze the different types of temporal changes of nitrogen and phosphorus, this paper used K-means cluster analysis to perform the clustering analysis of the characteristics of spatial and temporal changes of nitrogen and phosphorus [27].

3.2. Influencing Factors Analysis of TP:TN

This paper integrates the Pearson correlation analysis, random forest model, and geographically weighted regression (GWR) analysis to analyze the driving factors affecting the spatial and temporal variations of nitrogen and phosphorus concentrations. It conducts an in-depth study of land use, elevation, soil type, fertilizer application, and rainfall.

3.2.1. Pearson Correlation Analysis

Pearson’s correlation analysis measures the degree of linear correlation between two variables and takes values in the range of [−1, 1]. The formula for its calculation is as follows:
r = i = 1 n ( x i x ¯ ) ( y i y ¯ ) i = 1 n ( x i x ¯ ) 2 i = 1 n ( y i y ¯ ) 2 ,
where x i and y i are the values of the independent variable and dependent variable of the second sample, x ¯ and y ¯ are the mean values of the independent variable and dependent variable, and n is the number of samples. By calculating Pearson’s correlation coefficient, the linear correlation between the influencing factors and nitrogen and phosphorus concentrations can be initially judged, which provides a reference for the subsequent analysis.

3.2.2. Random Forest Model

Random forest is an integrated learning method based on decision trees, one which has the advantages of dealing with high-dimensional data and overfitting resistance [28]. In this study, the random forest model was utilized to assess the degree of influence of each influencing factor on nitrogen and phosphorus concentrations. The method of feature importance assessment in random forest is based on the out-of-bag error (OBE). In the training process of a random forest, about two-thirds of the samples are used in constructing each decision tree, and about one-third of the samples that are not selected are called out-of-bag samples (OOB samples). Using the OOB samples, unbiased estimation of the model is possible. The importance of a feature is assessed by comparing the change in OOB error when that feature is and is not involved in model training. The random forest model allows the importance of each influence to be quantified and the drivers that have the greatest impact on nitrogen and phosphorus concentrations to be identified.

3.2.3. Geographically Weighted Regression Analysis

Geographically weighted regression (GWR) is a spatial analysis technique widely used in geography and spatial pattern analysis. GWR can reveal the spatial heterogeneity among variables by establishing local regression equations at each sample point in the study area and considering the local effects of spatial objects.
The GWR model is of the following form:
y i = β 0 ( u i , v i ) + k = 1 p β k  ( u i , v i ) x i k + ɛ i
where y i is the first i position of the dependent variable, x i k is the kth independent variable at position i ( u i , v i ) denotes the geographic coordinates of i the geographic coordinates of the first sample point, the β k  ( u i , v i ) is the regression coefficient at location ( u i , v i ) , and ɛ i is the random error term.
The main advantage of GWR is the consideration of spatial non-stationarity to capture the spatial variation of the relationship between the independent and dependent variables and reveal the characteristics of spatial heterogeneity. In this study, the GWR model was used to analyze the spatial heterogeneity of the effects of the influencing factors on the nitrogen and phosphorus concentrations to further reveal the spatial mechanism of the drivers.

3.3. Model Evaluations

Evaluation metrics such as the coefficient of determination ( R 2 ), root mean square error (RMSE) and mean absolute percentage error (MAPE) are used in this paper to assess the predictive performance and reliability of the model.
The degree of variation that the independent variables can explain as a proportion of the total degree of variation, R 2 , is calculated as follows:
y ¯ = 1 n i = 1 n y i
R 2 = ( y ^ y ¯ ) 2 ( y y ¯ ) 2 = 1 ( y ^ y ¯ ) 2 ( y y ¯ ) 2
where y i is the first i position of the dependent variable, y ¯    represents the mean values of the dependent variable and n is the number of samples.
RMSE is the square root of the ratio of the square of the deviation of the predicted value from the true value to the number of observations n, which is a good reflection of the accuracy of each algorithm and is calculated as follows:
R M S E = 1 m i = 1 m ( X i Y i ) 2
where  m is the number of observations, X i is the inversion value, and  Y i is the true value. The relationship between the inversion result and the true value can be measured by  R M S E . The relationship between the inversion result and the true value can be measured.
M A P E is one of the most popular metrics used to assess the performance of predictions, independent of scale, and can be used to compare predictions of different scales, expressed as a percentage, which is a very intuitive demonstration of the accuracy of the inversion results.
M A P E = i = 1 n x ^ i x i x i n × 100 %
In the formula,  x ^ i denotes the predicted value obtained by inversion, x i denotes the measured value obtained from the experiment, and  n denotes the number of test samples.

4. Results

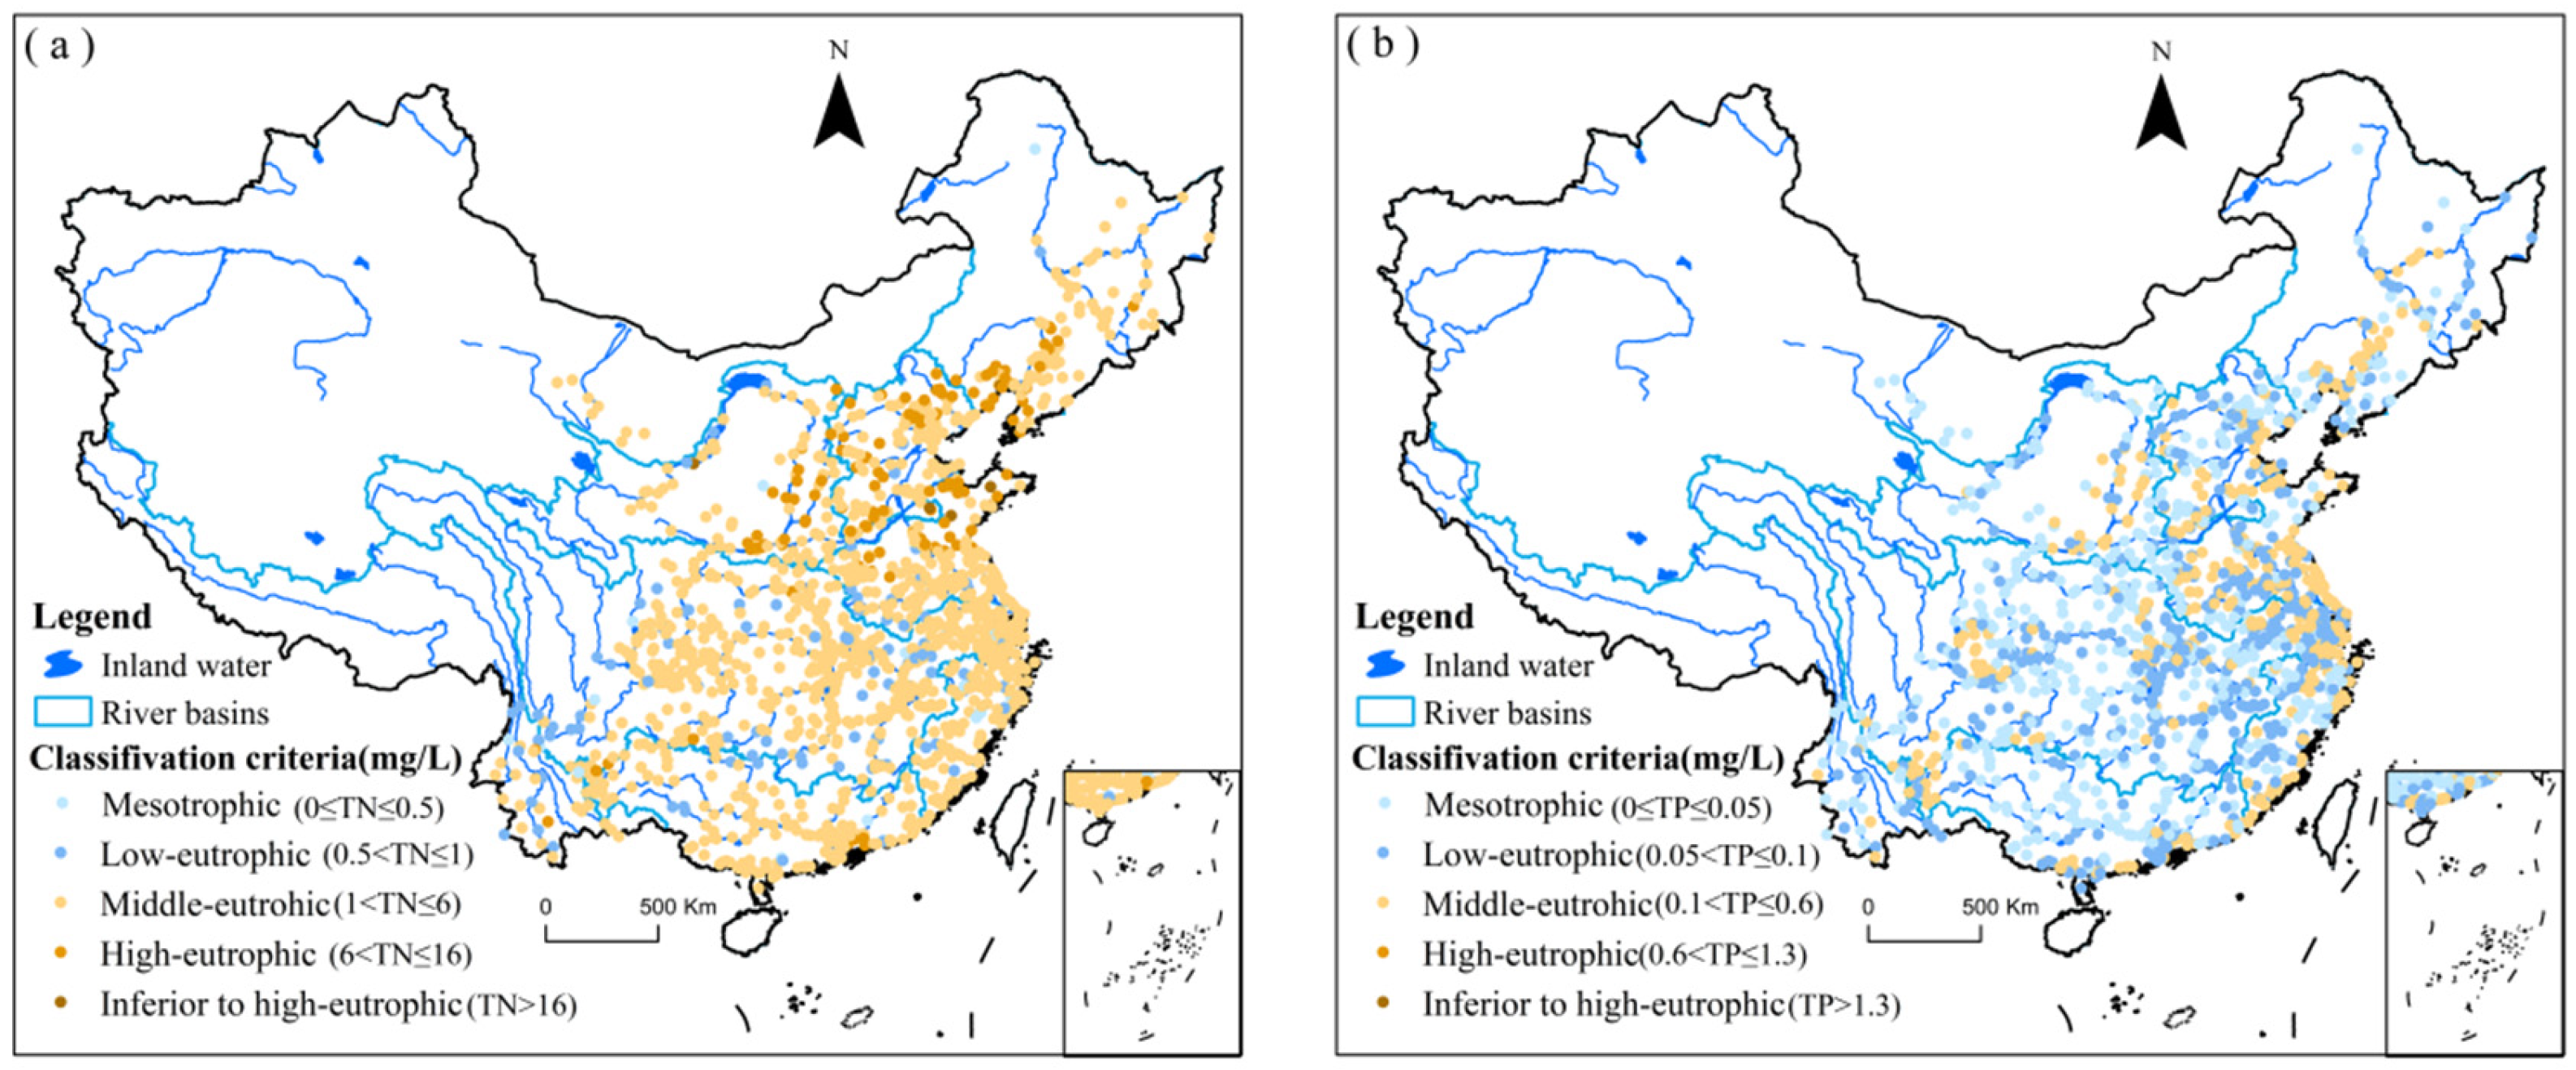
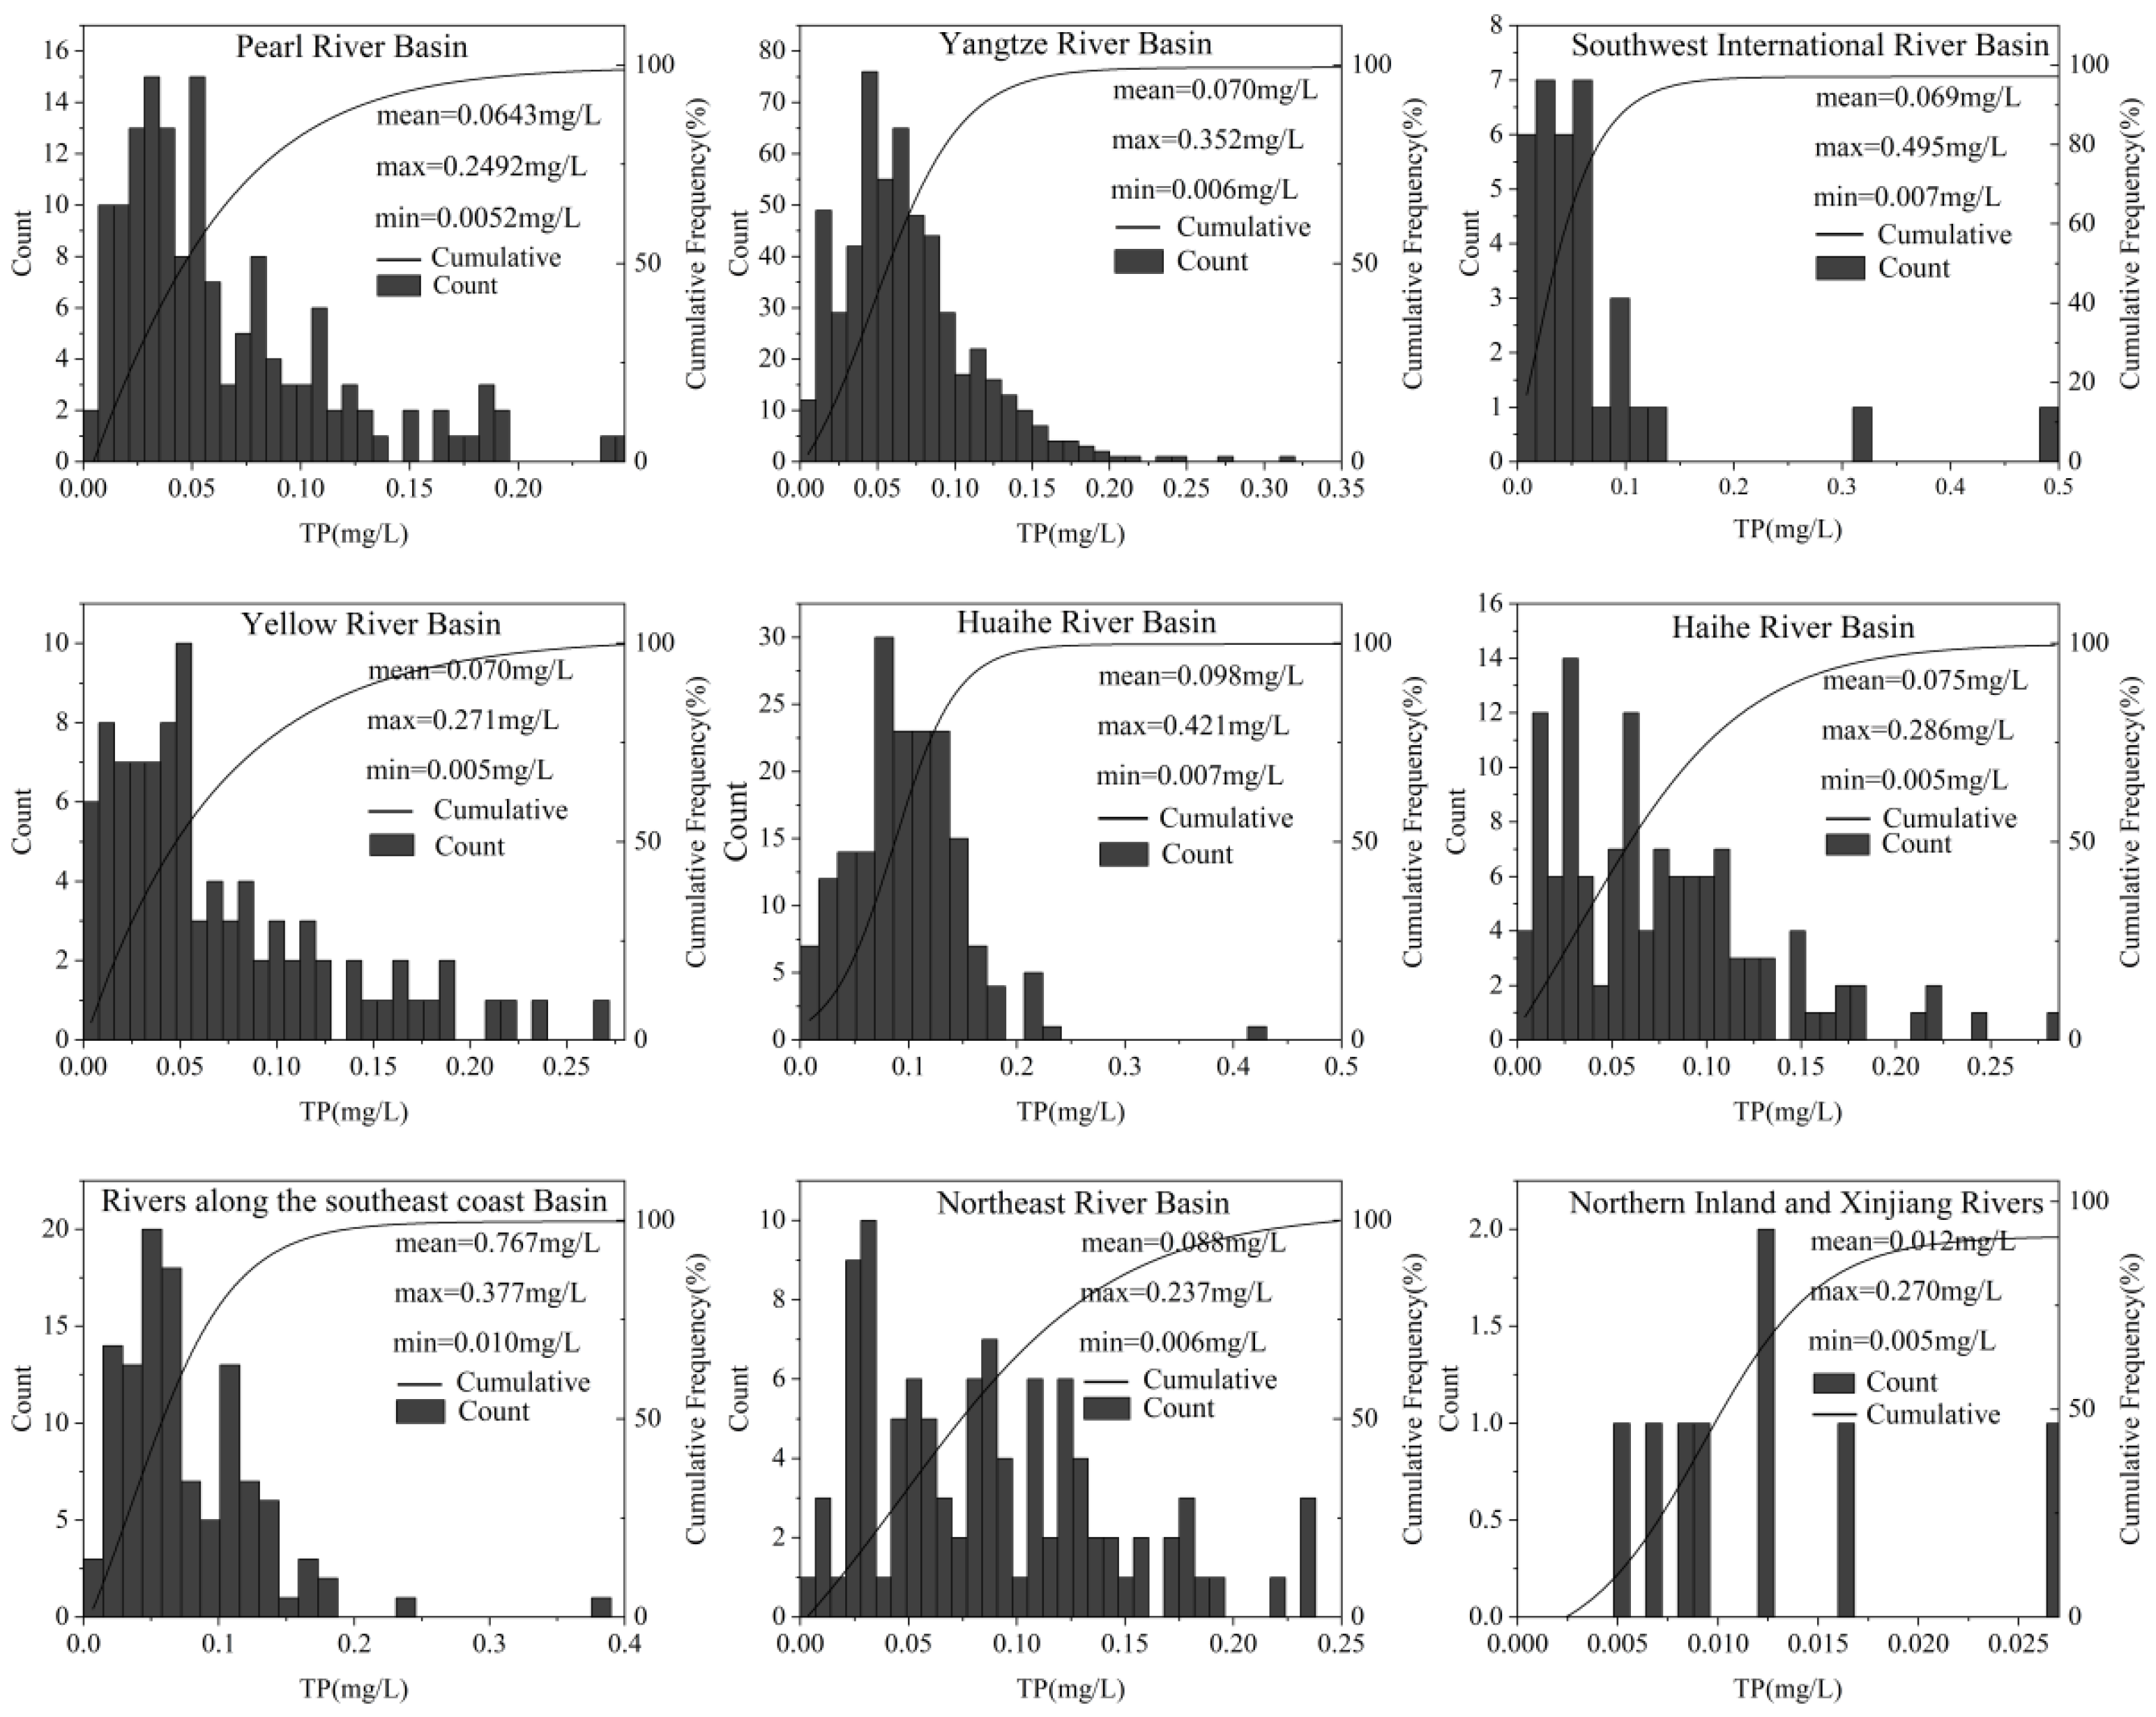
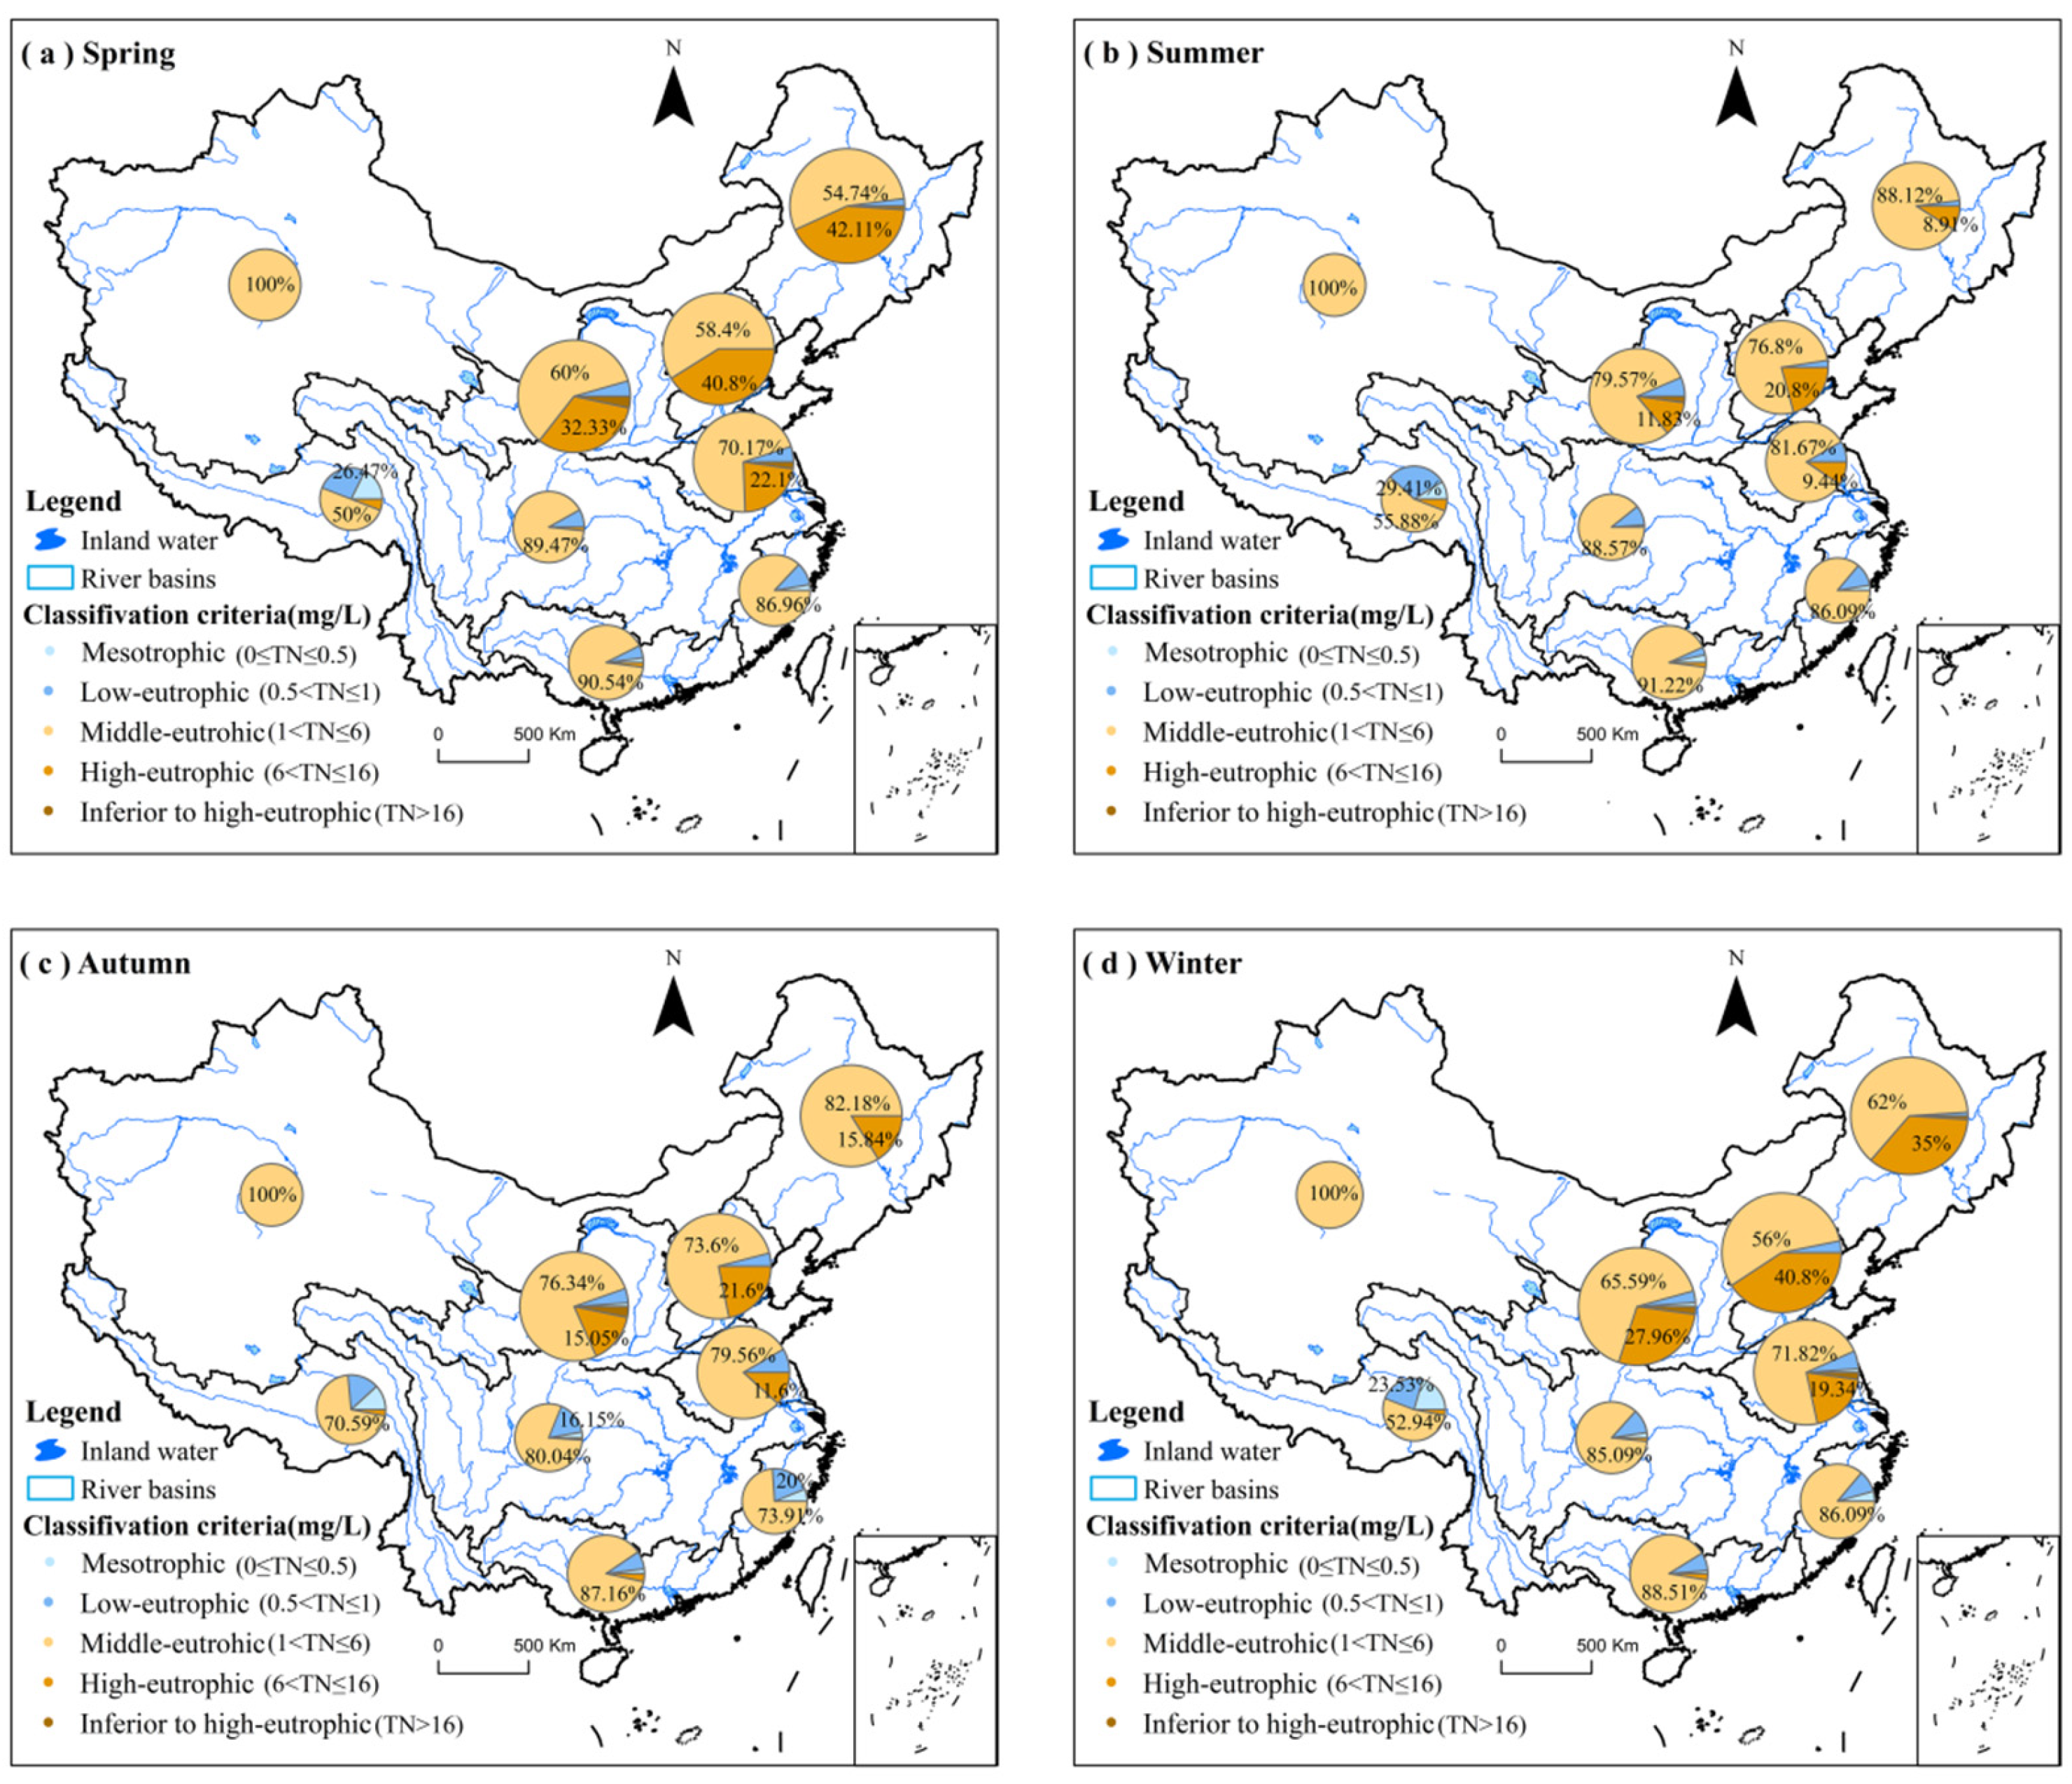
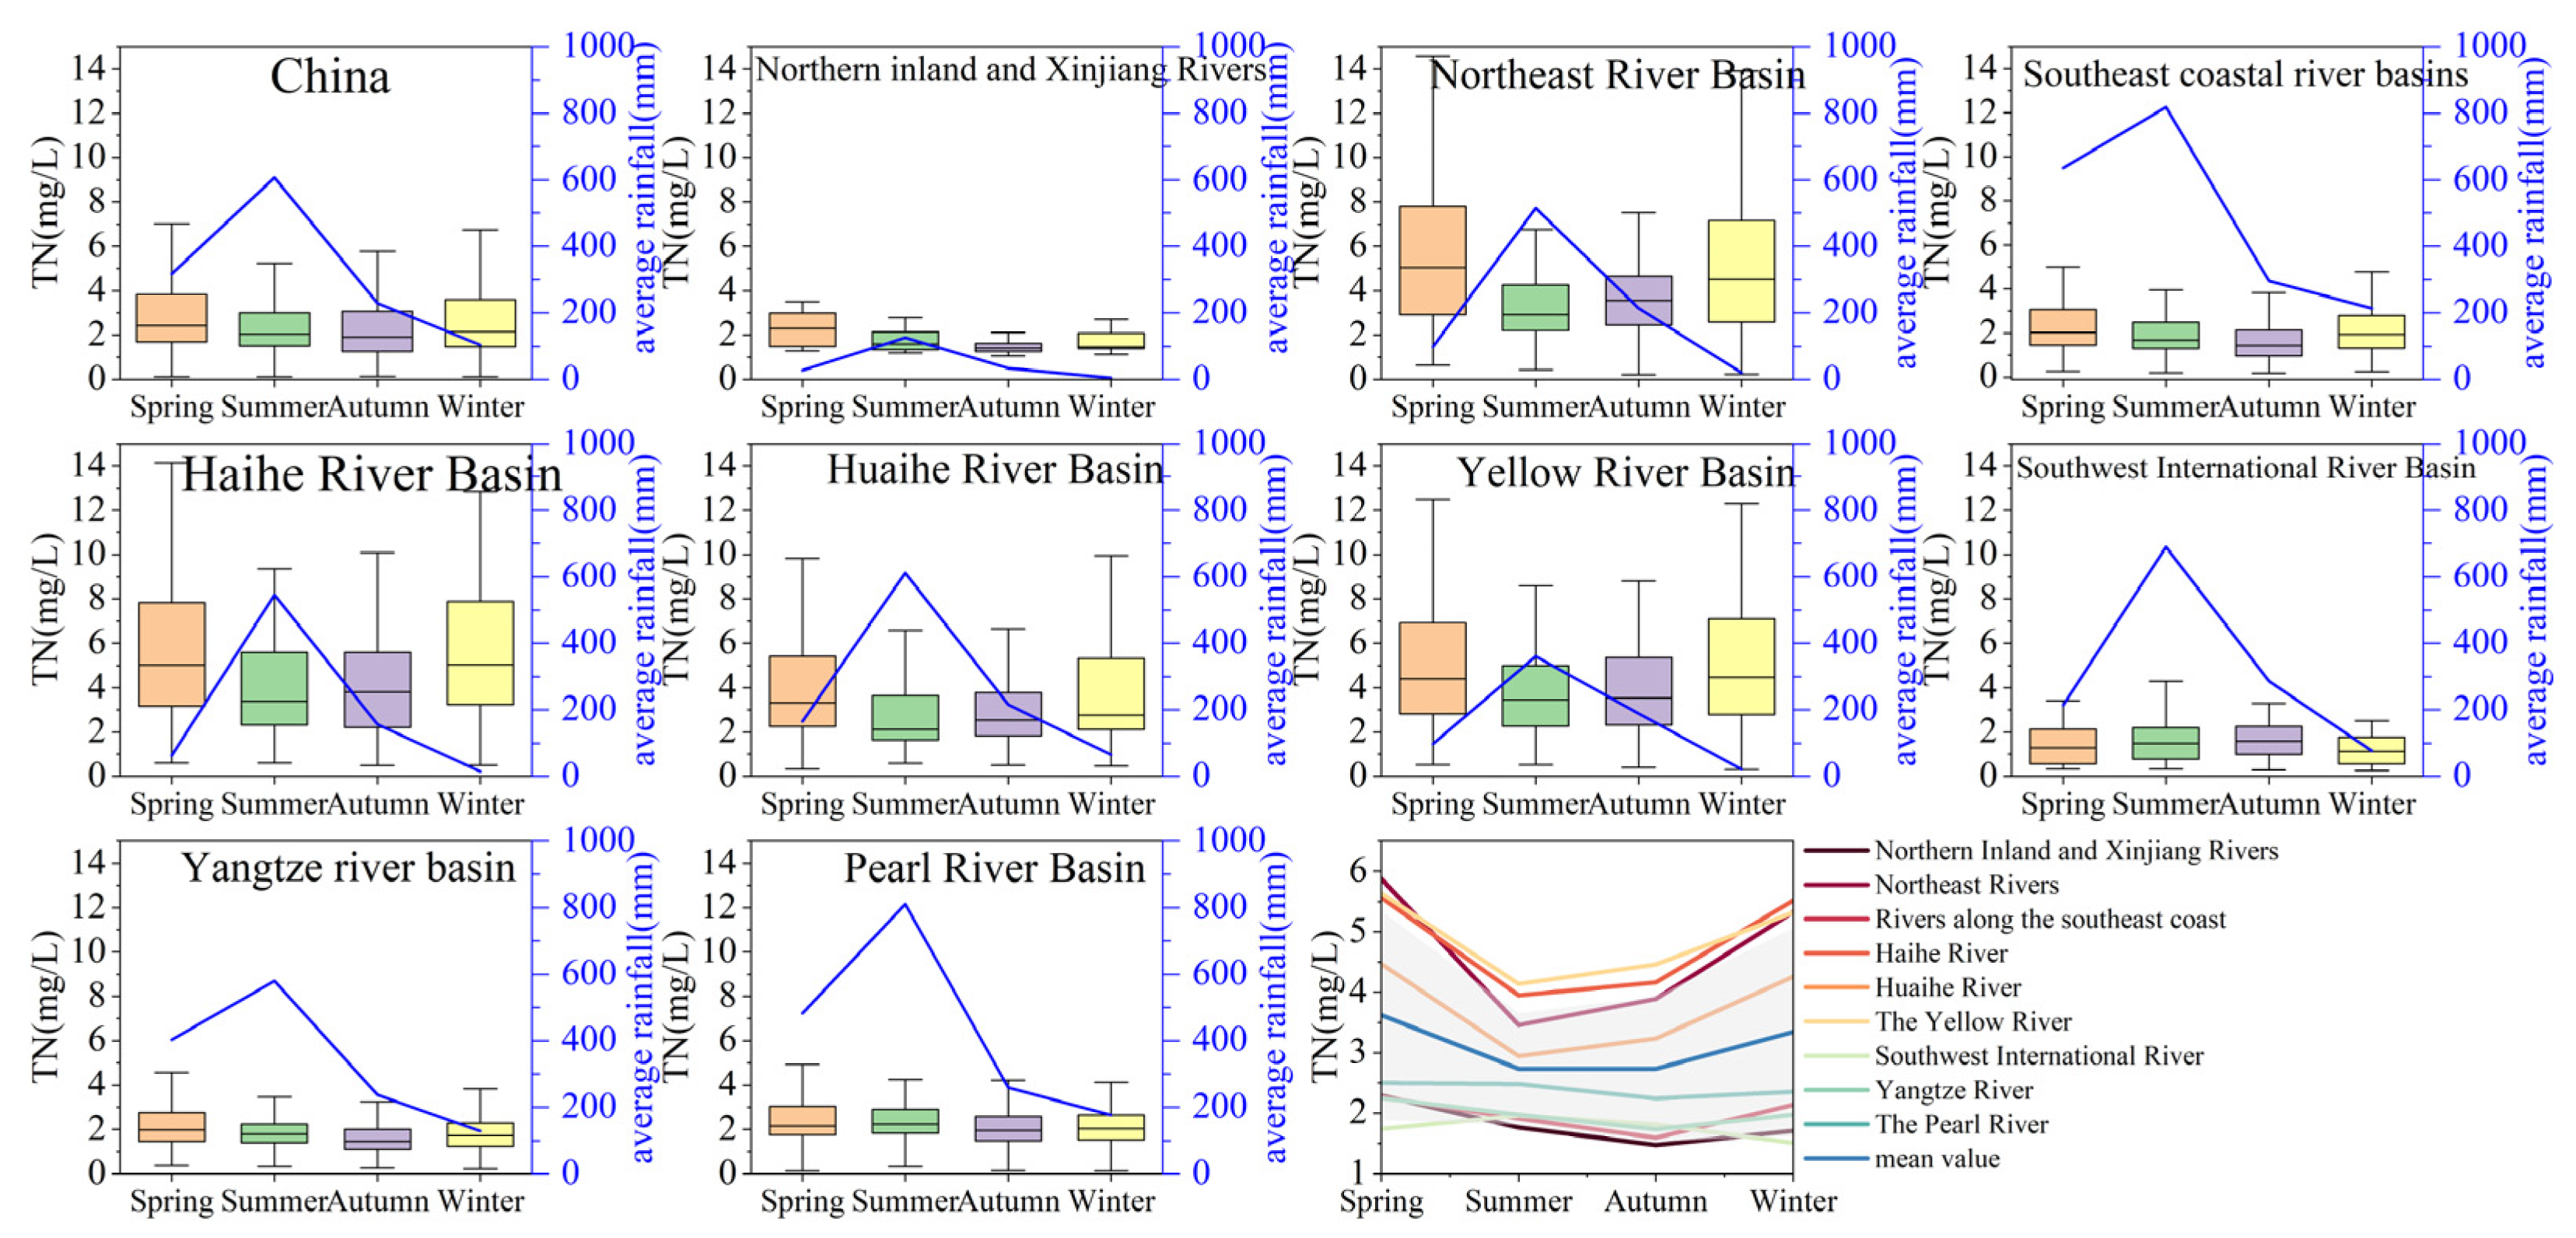
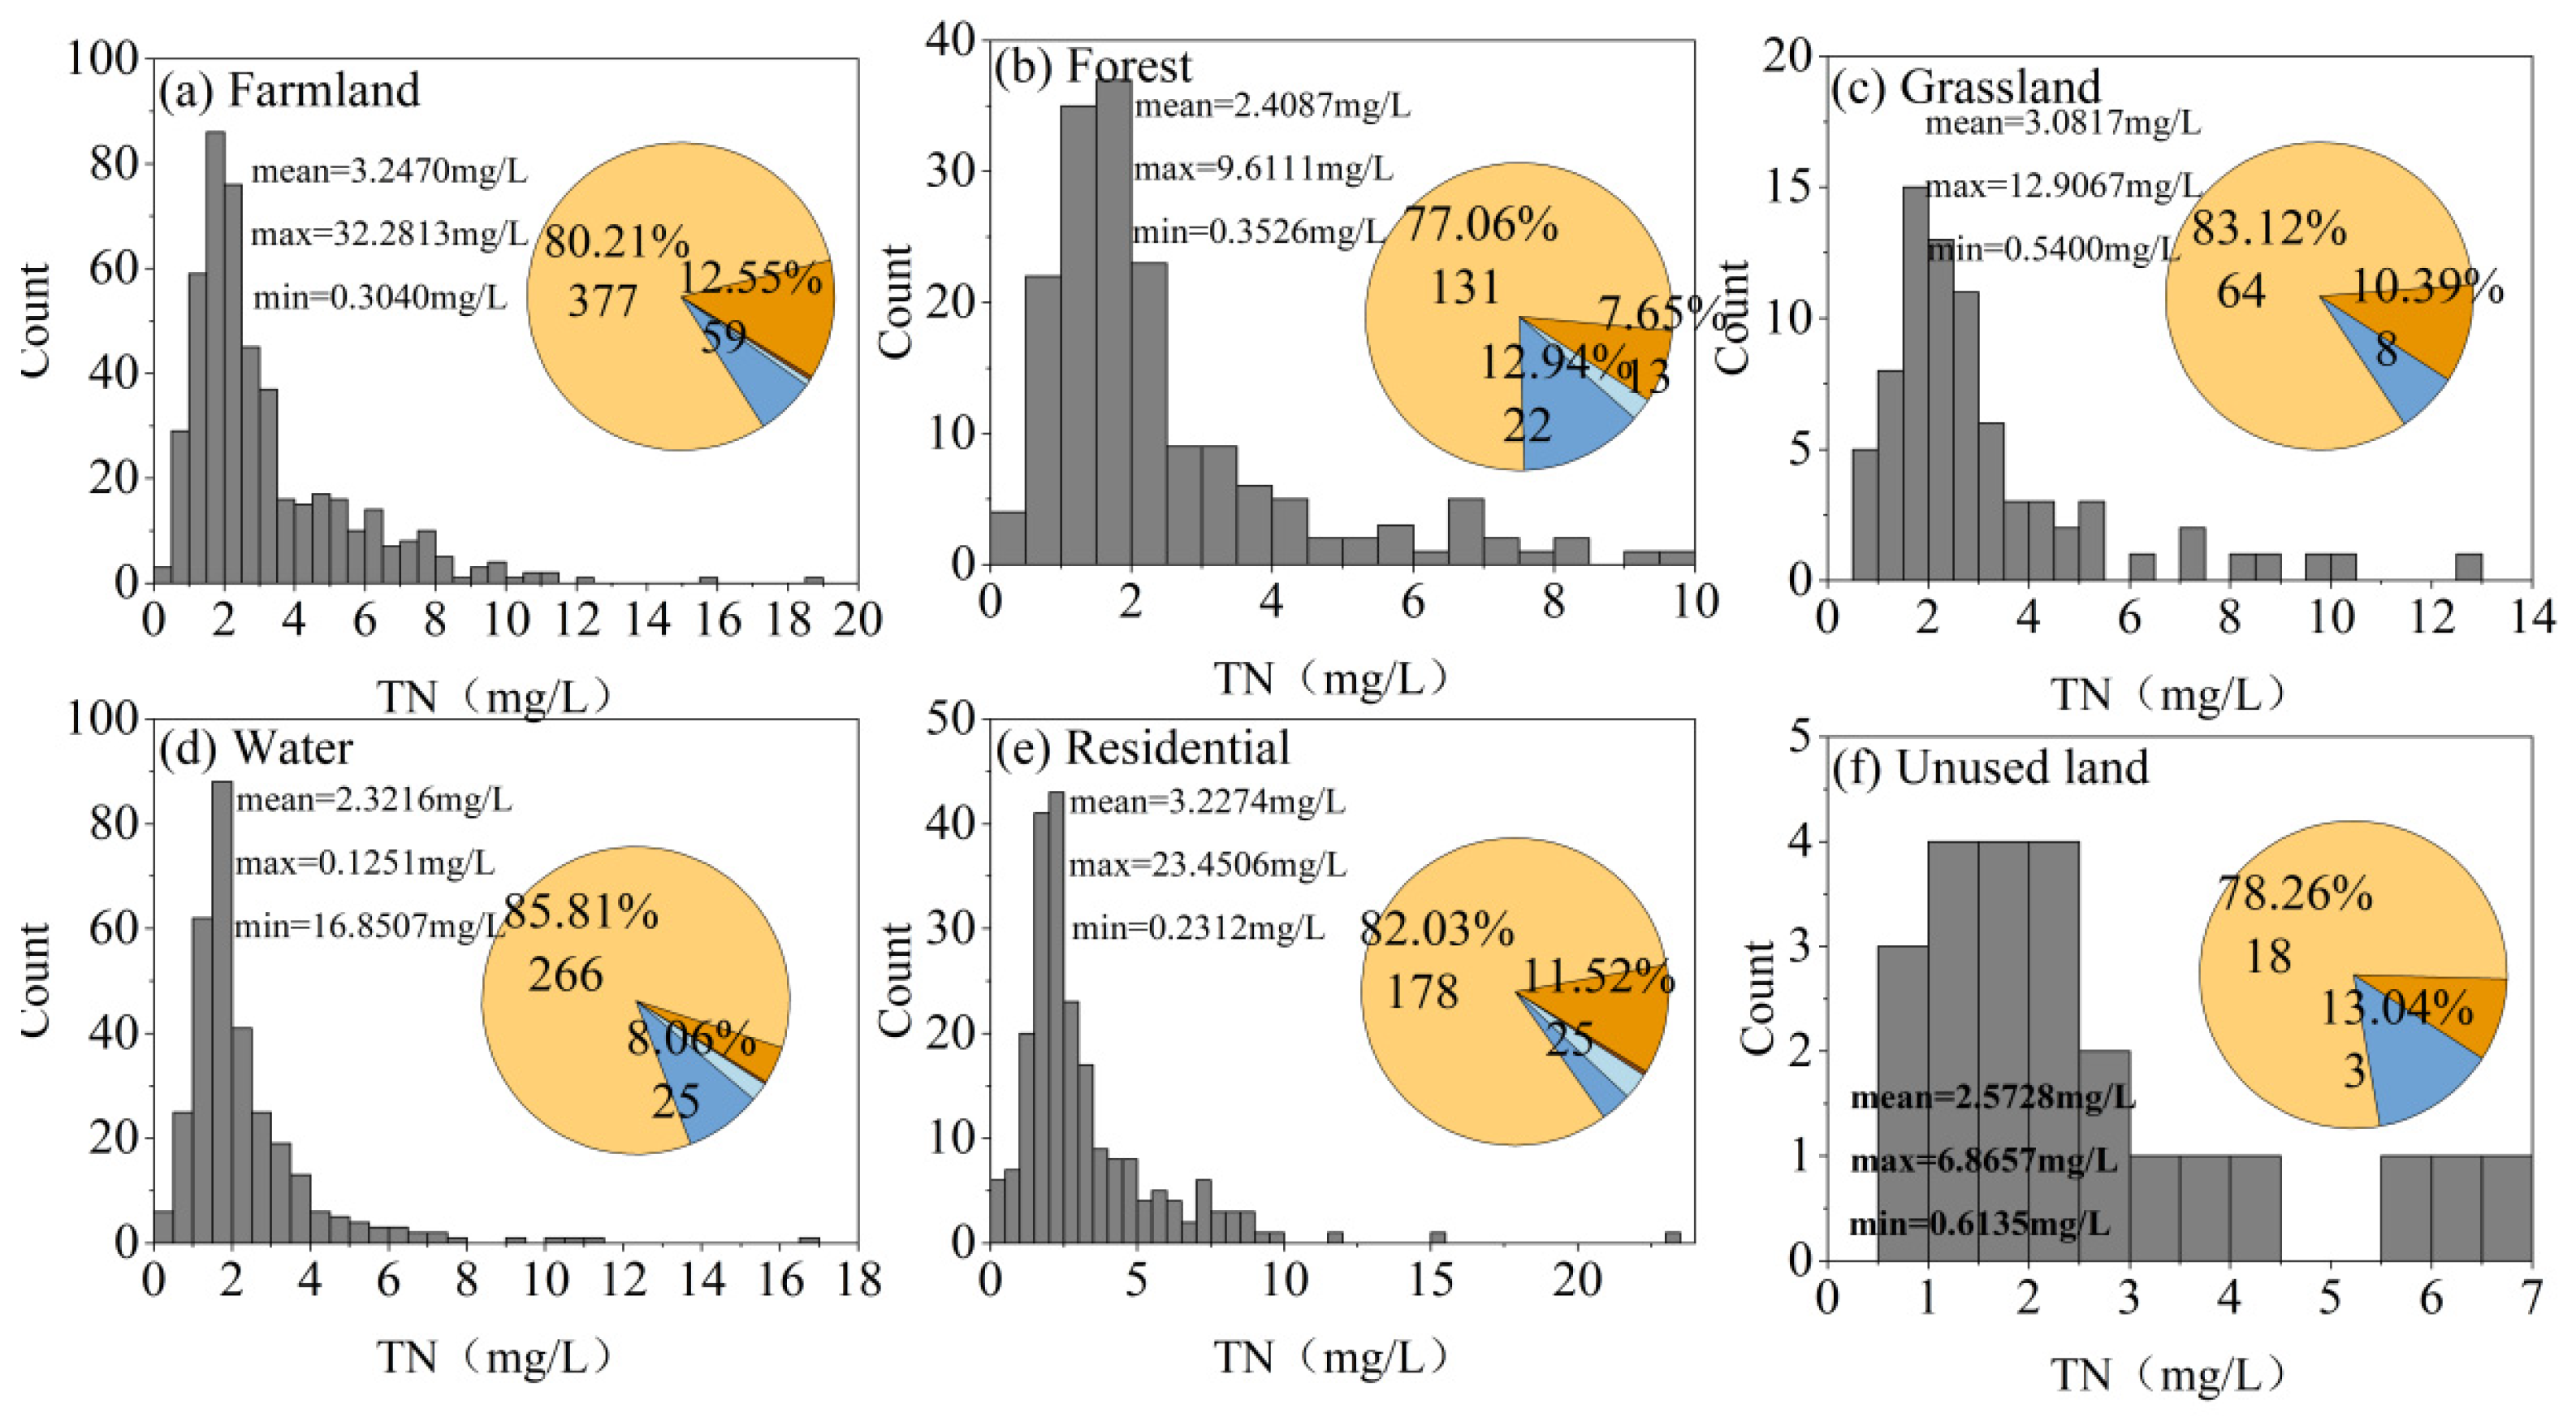
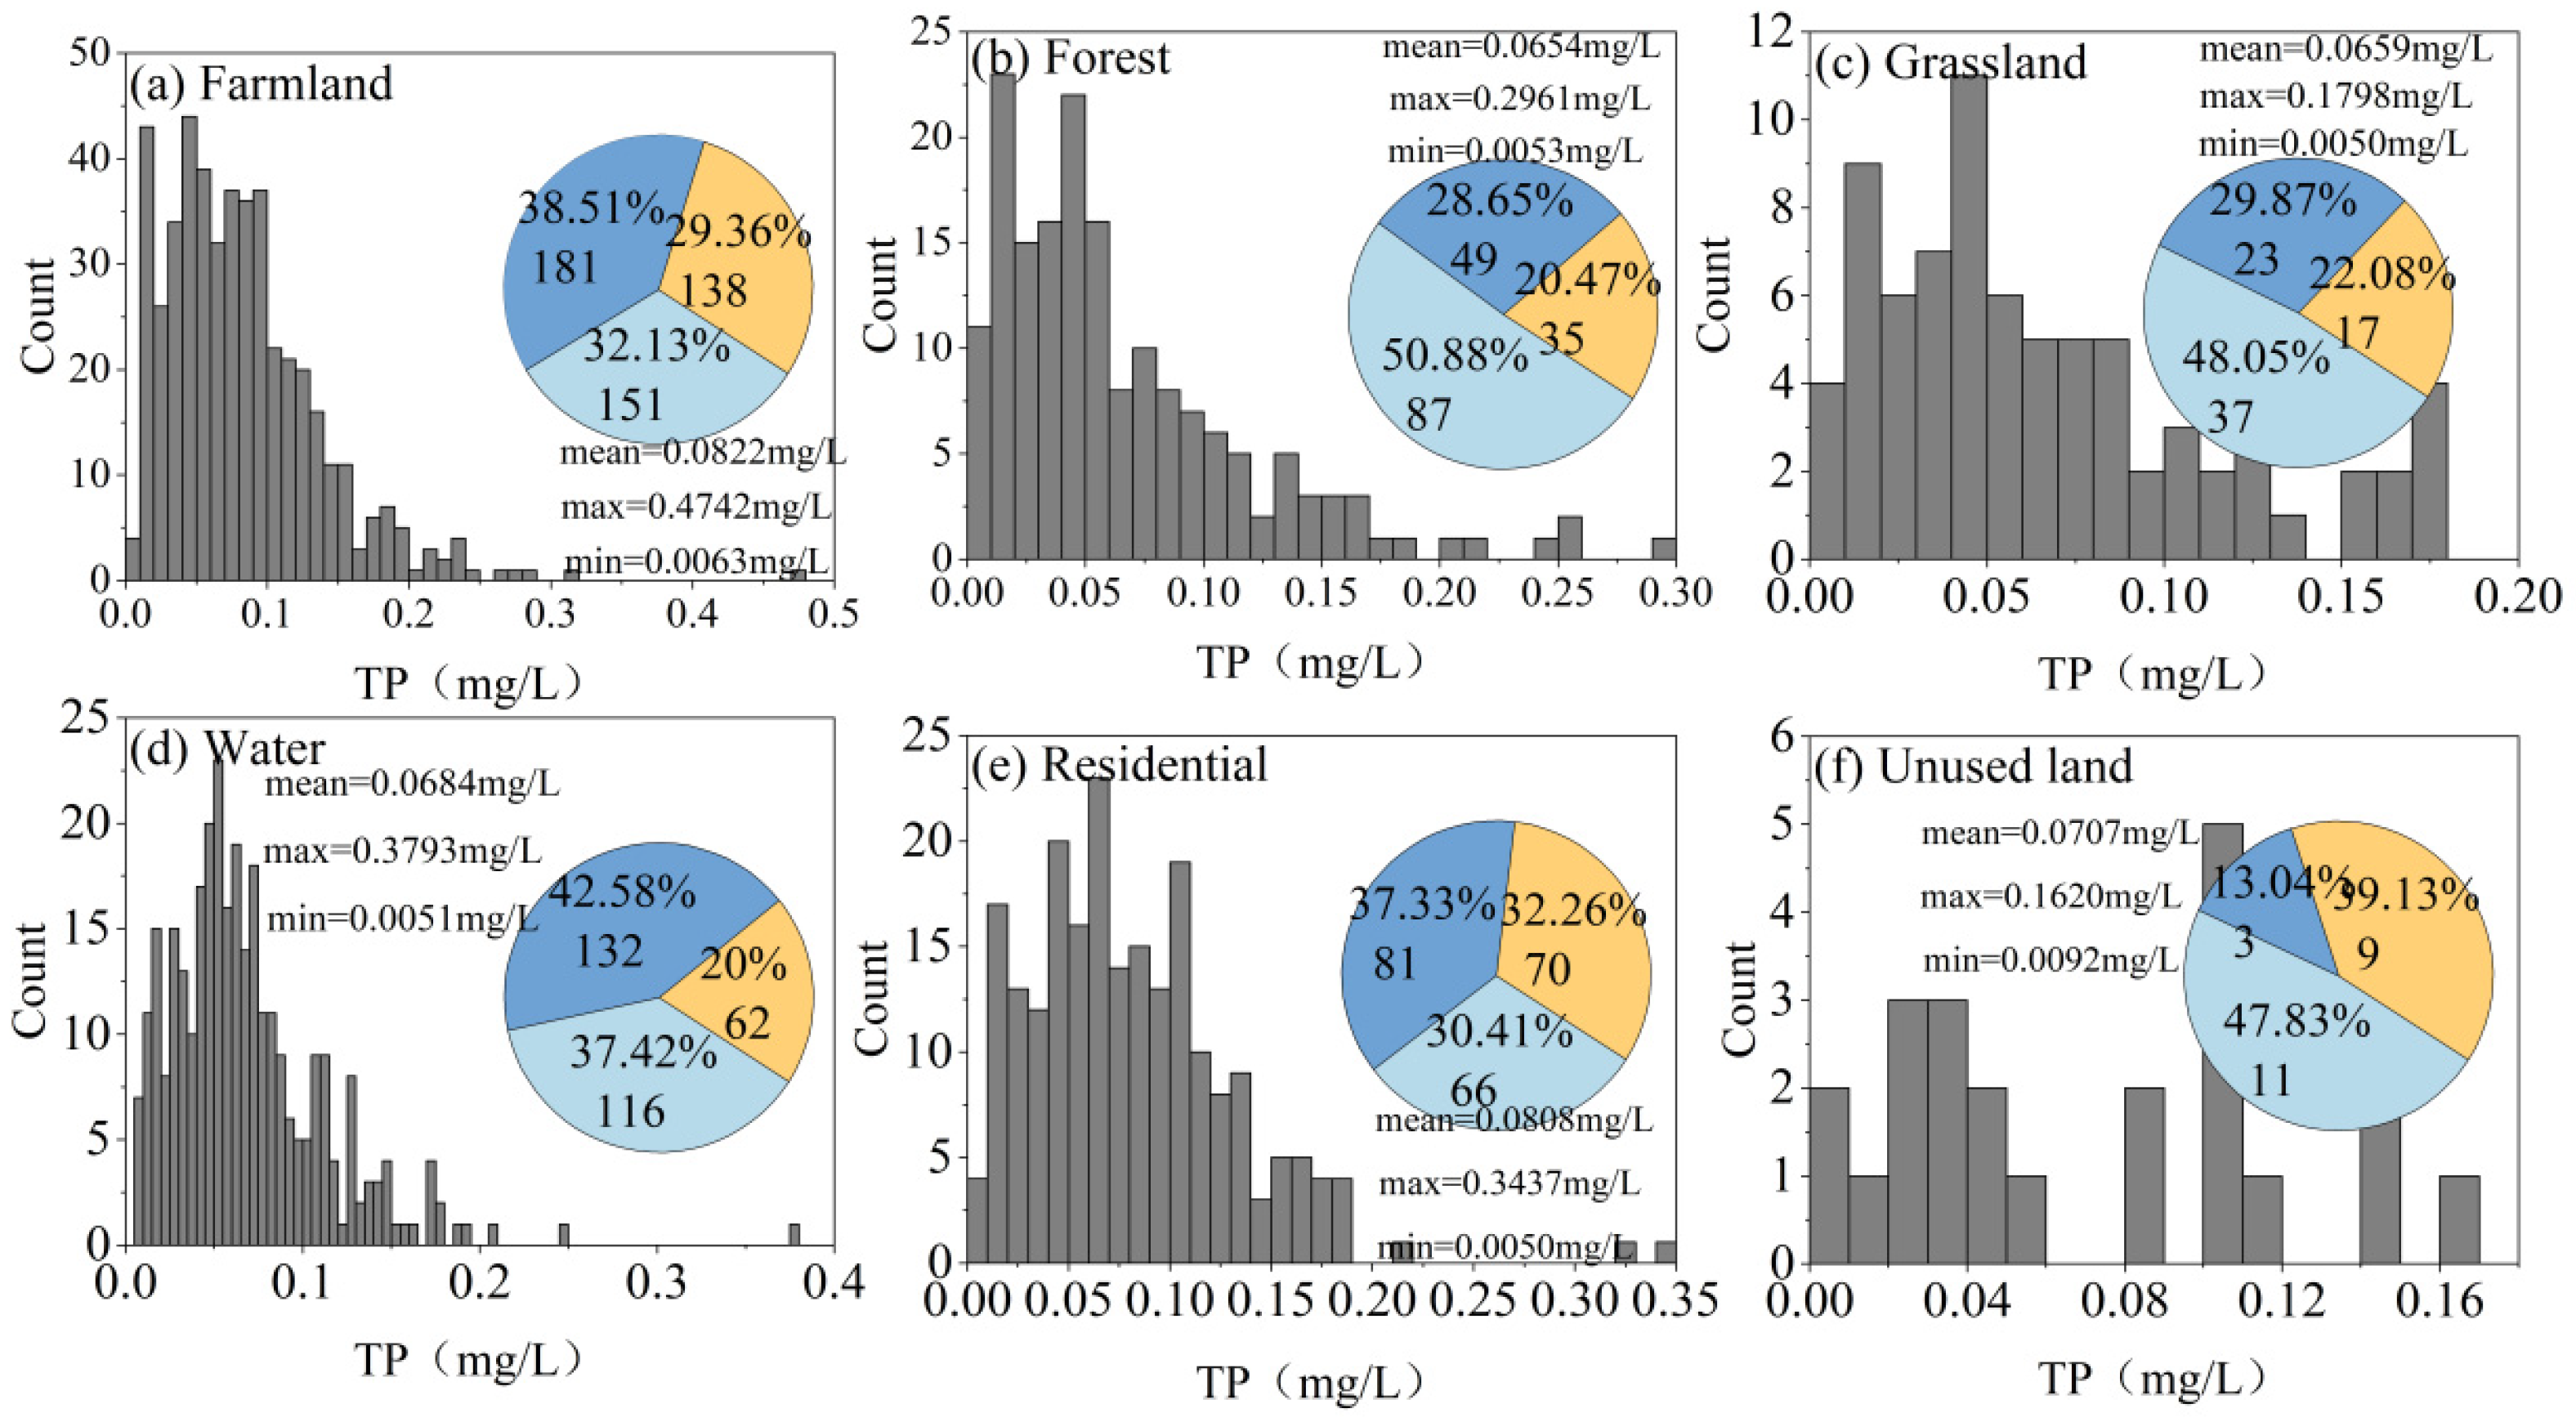
4.1. General Characteristics of TP and TN Distribution in China

The annual average TN concentration was 2.88 mg/L, ranging from a minimum of 0.12 mg/L to a maximum of 32.74 mg/L. According to the “Technical Procedures for Evaluation of the Quality of Surface Water Resources” (SL395-2007), TN levels were categorized as follows: mesotrophic (≤0.5 mg/L), mildly eutrophic (0.5 < TN ≤ 1 mg/L), moderately eutrophic (1 < TN ≤ 6 mg/L), severely eutrophic (6 < TN ≤ 16 mg/L), and exceeding severe eutrophic (>16 mg/L). The distribution of TN concentrations was approximately 1.2% moderately eutrophic, 7.1% mildly eutrophic, 82.5% moderately eutrophic, 8.8% severely eutrophic, and 0.4% exceeding severe eutrophication.
For TP, the annual average concentration was 0.076 mg/L, with values ranging from 0.005 mg/L to 0.495 mg/L. TP levels were classified as mesotrophic (≤0.05 mg/L), mildly eutrophic (0.05 < TP ≤ 0.1 mg/L), and moderately eutrophic (0.1 < TP ≤ 0.6 mg/L), with proportions of 36.4%, 37%, and 26.6%, respectively.
The spatial distribution map (Figure 4) illustrates that both TN and TP concentrations are “higher in the north and lower in the south,” “higher in coastal areas and lower inland,” and “higher in plains than in mountainous regions.” High TN concentrations were primarily concentrated in the Haihe River basin and the Yellow River and Huaihe River plains, reaching up to 29.49 mg/L in some sections. High TP concentrations were mainly found in the coastal areas of southeastern Shandong Province and northern Jiangsu Province, with peaks of up to 0.497 mg/L in certain sections. This may be related to the development level of the cities through which the river flows, including indicators such as GDP, sewage discharge volume, population size, and the quantity of livestock and poultry farming [29].
Seasonally, TN concentrations were approximately 50% higher in winter than in summer, reflecting a “low in summer and high in winter” pattern. Conversely, TP concentrations were about 40% higher in summer than in winter, exhibiting a “high in summer and low in winter” trend. Rainfall had a significant delayed effect on nutrient concentrations, with TN impacted on the day of rainfall and TP peaking the day after. The TN and TP concentrations were statistically analyzed for each month and the results are shown in Figures S1 and S2. From January to June, TN concentration decreased, and the number of heavily eutrophic sections reached the lowest value of the year; from August to December, TN concentration showed a fluctuating upward trend. From August to December, TP concentrations displayed a fluctuating downward trend. The hotspot areas were primarily located in the coastal regions of Jiangsu and Fujian.
Human activities were the primary drivers of TN concentrations, contributing approximately 68%, with rainfall (45%) and population density (20%) being major factors. In contrast, natural factors accounted for 57% of TP variations, with elevation (26%), rainfall (21%), and population density (17%) playing significant roles. Based on these findings, it is recommended to enhance agricultural pollution control, promote scientific fertilizer use, improve sewage treatment facilities, implement targeted regional management strategies, and strengthen ecological restoration and early warning systems to effectively mitigate nitrogen and phosphorus pollution and ensure the sustainable use of water resources in China.
In the Haihe River basin near Bohai Bay, total nitrogen (TN) levels were the highest, with 30% of sections classified as severely eutrophic, primarily in the Haihe Plain and Huanghuai Plain areas. Conversely, only about 2.4% of water bodies in this region had TN values below 0.5 mg/L, indicating mild eutrophication. In contrast, southern China is predominantly mountainous, resulting in lower TN and total phosphorus (TP) levels compared with the northern plains. This trend is evident in regions such as the Nanling Mountains in the Pearl River basin and the Wuyi Mountains along the southeast coast. The Huaihe River basin plain, particularly along the southeastern coast of Shandong and northern Jiangsu, exhibited the highest TP levels, with 46.9% of sections falling within the moderately eutrophic range (0.1–0.5 mg/L). Statistical analyses of TN and TP concentrations across various watersheds are illustrated in Figure 5 and Figure 6, respectively. The Yellow River basin recorded the highest mean TN concentration, while the southwest river basins had the lowest. Nationwide, TN levels are predominantly in the moderate eutrophic category, and TP levels are mainly mesotrophic.
Overall, China’s surface waters exhibit a “high in the north and low in the south, high on the coast and low inland, and high in the plains and low in the mountains” pattern. This distribution is closely linked to China’s topography, with two of the three major plains located in the north. Topographic features influence water flow, affecting nitrogen and phosphorus’s transport and distribution. High-altitude slopes benefit from greater forest cover, which reduces nutrient runoff, whereas shallow slopes with intensive human activities increase nitrogen and phosphorus levels. Additionally, southern China receives more rainfall, which drives runoff generation and pollutant transport, further explaining the higher nutrient concentrations in the north and lower concentrations in the south.

4.2. Spatial and Temporal Patterns of TP:TN in China

4.2.1. Seasonal Variations

Total nitrogen (TN) and total phosphorus (TP) concentrations were categorized into five eutrophication classes based on the “Technical Regulations for Evaluation of the Quality of Surface Water Resources” (SL395-2007). Seasonal changes in TN and TP were analyzed across nine major river basins in China, divided into spring (March–May), summer (June–August), autumn (September–November), and winter (December–February) (Figure 7 and Figure 8). Except for the northern inland and Xinjiang River basins, TN concentrations generally exhibited a “low in summer and high in winter” pattern, likely due to increased precipitation and runoff diluting TN levels during the summer. In contrast, TP concentrations followed a “high in summer and low in winter” trend, possibly resulting from intensified surface pollution caused by summer rainfall.
Among the basins, the southwestern river basins had the lowest TN levels, with an average concentration of 1.78 mg/L and 94.8% of sections classified as moderately eutrophic or higher. Conversely, the northern inland and Xinjiang river basins showed the lowest TP levels, averaging 0.012 mg/L, with 100% of sections categorized as moderately eutrophic (Figure 9 and Figure 10). Nationwide, TN concentrations are predominantly in the moderate eutrophic category, while TP levels are mainly mesotrophic. As can be seen from Figure 9 and Figure 10, for most river basins, the trends of rainfall and TN concentration are opposite. The TN concentration is the lowest in summer when rainfall is the heaviest. The trends of rainfall and TP concentration are the same, but there is a lag. This is jointly determined by various factors such as seasonal rainfall, topography, and population. The results of the monthly analysis are also similar (Figures S3 and S4).
Overall, China’s surface waters display a “high in the north and low in the south, high on the coast and low inland, and high in the plains and low in the mountains” pattern. This distribution is closely linked to China’s topography, with two of the three major plains located in the north. Topographic features influence water flow, thereby affecting the transport and distribution of nitrogen and phosphorus. High-altitude slopes benefit from greater forest cover, reducing nutrient runoff, whereas shallow slopes with intensive human activities increase nitrogen and phosphorus levels. Additionally, southern China receives more rainfall, driving runoff generation and pollutant transport, which further explains the higher nutrient concentrations in the north and lower concentrations in the south.

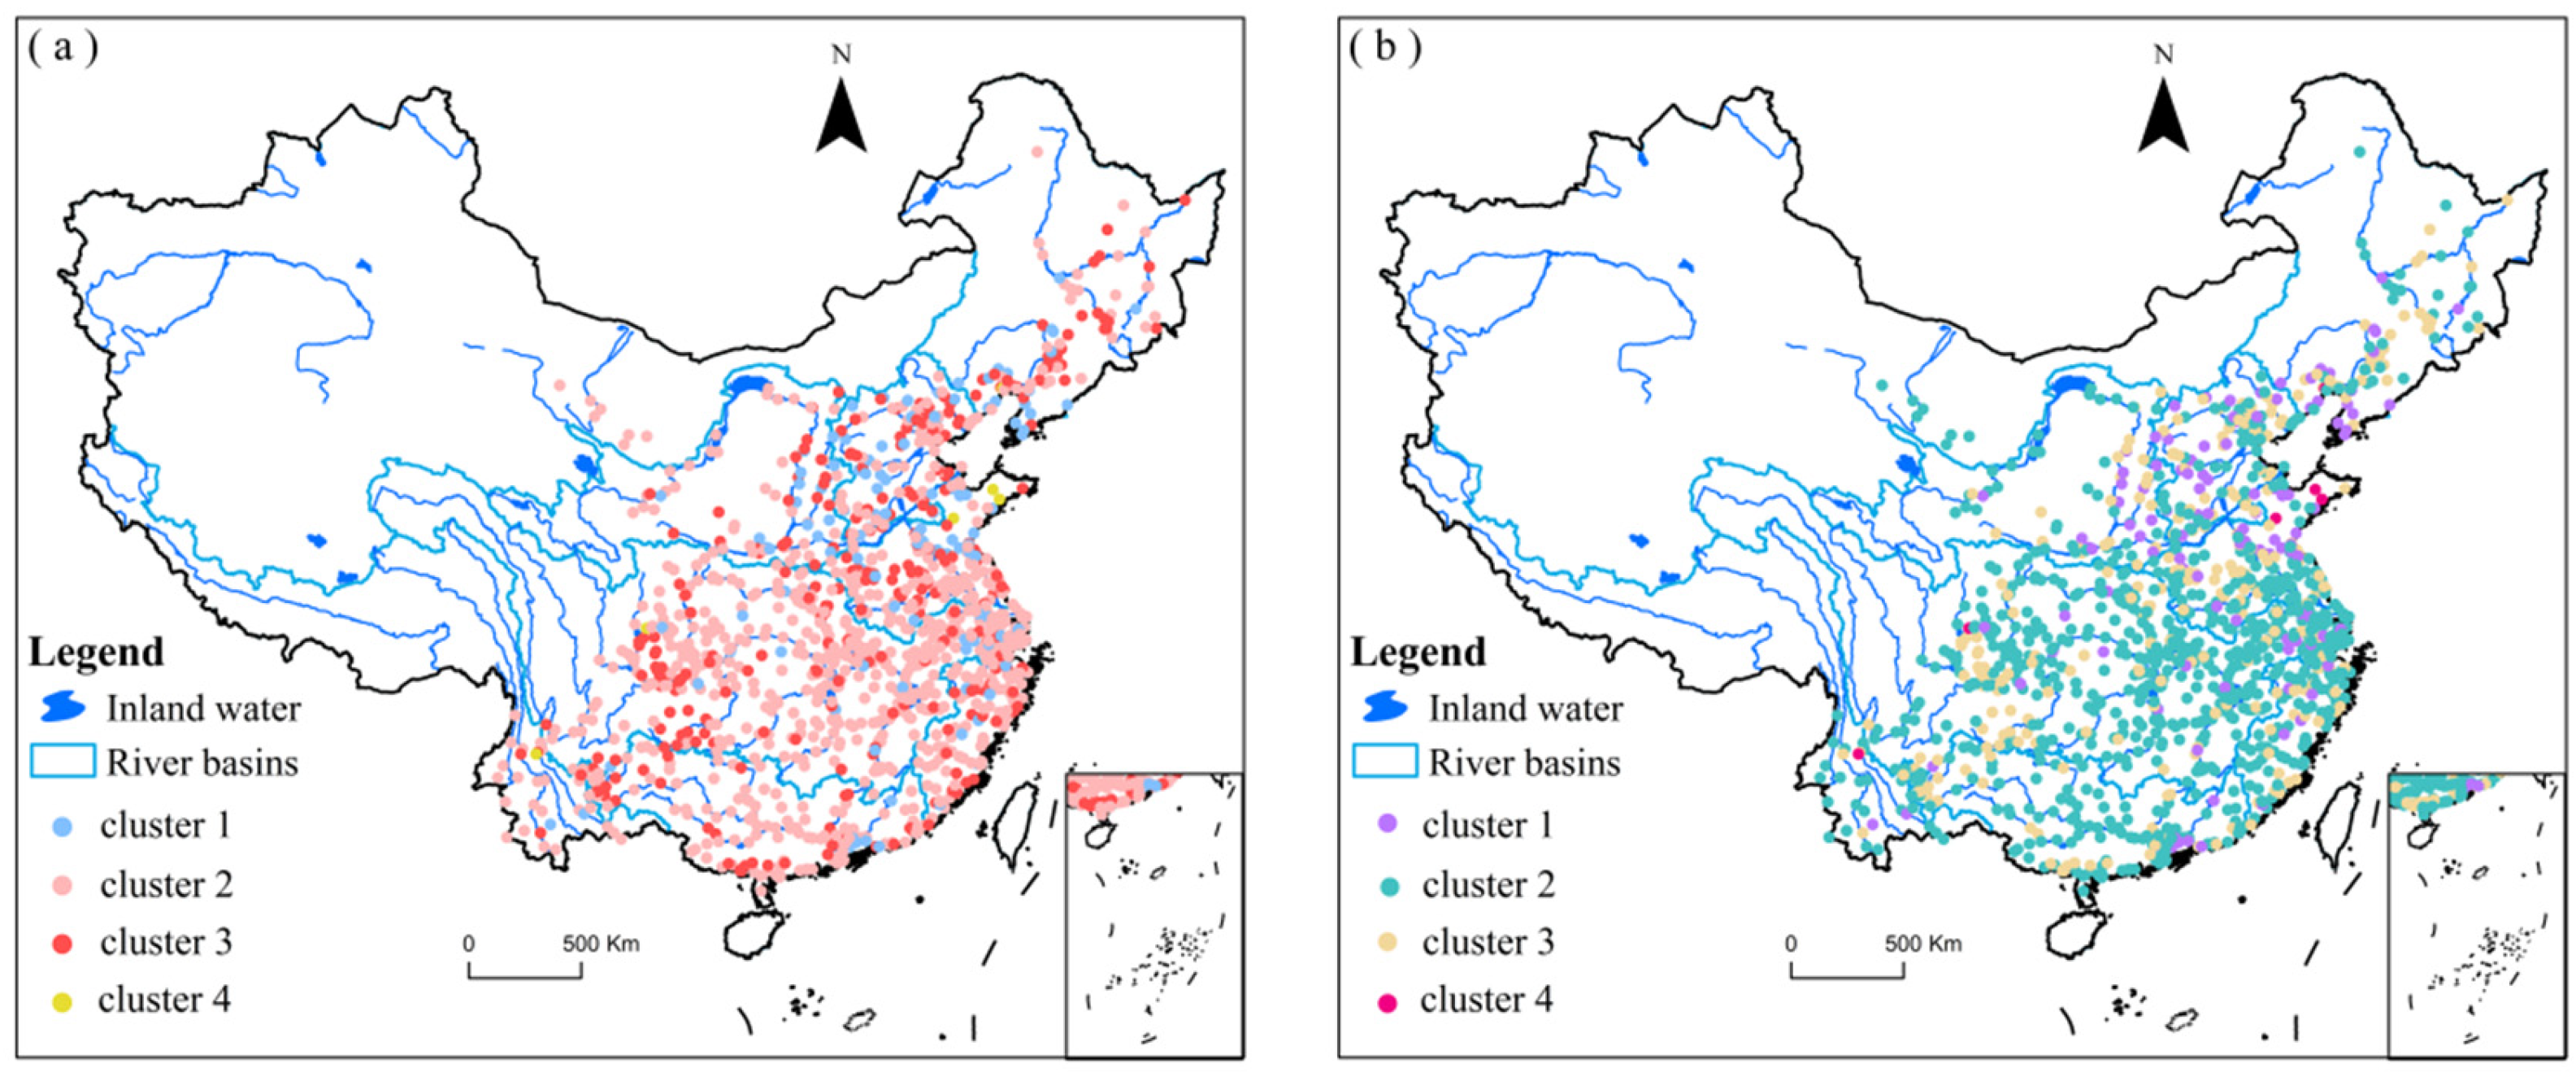
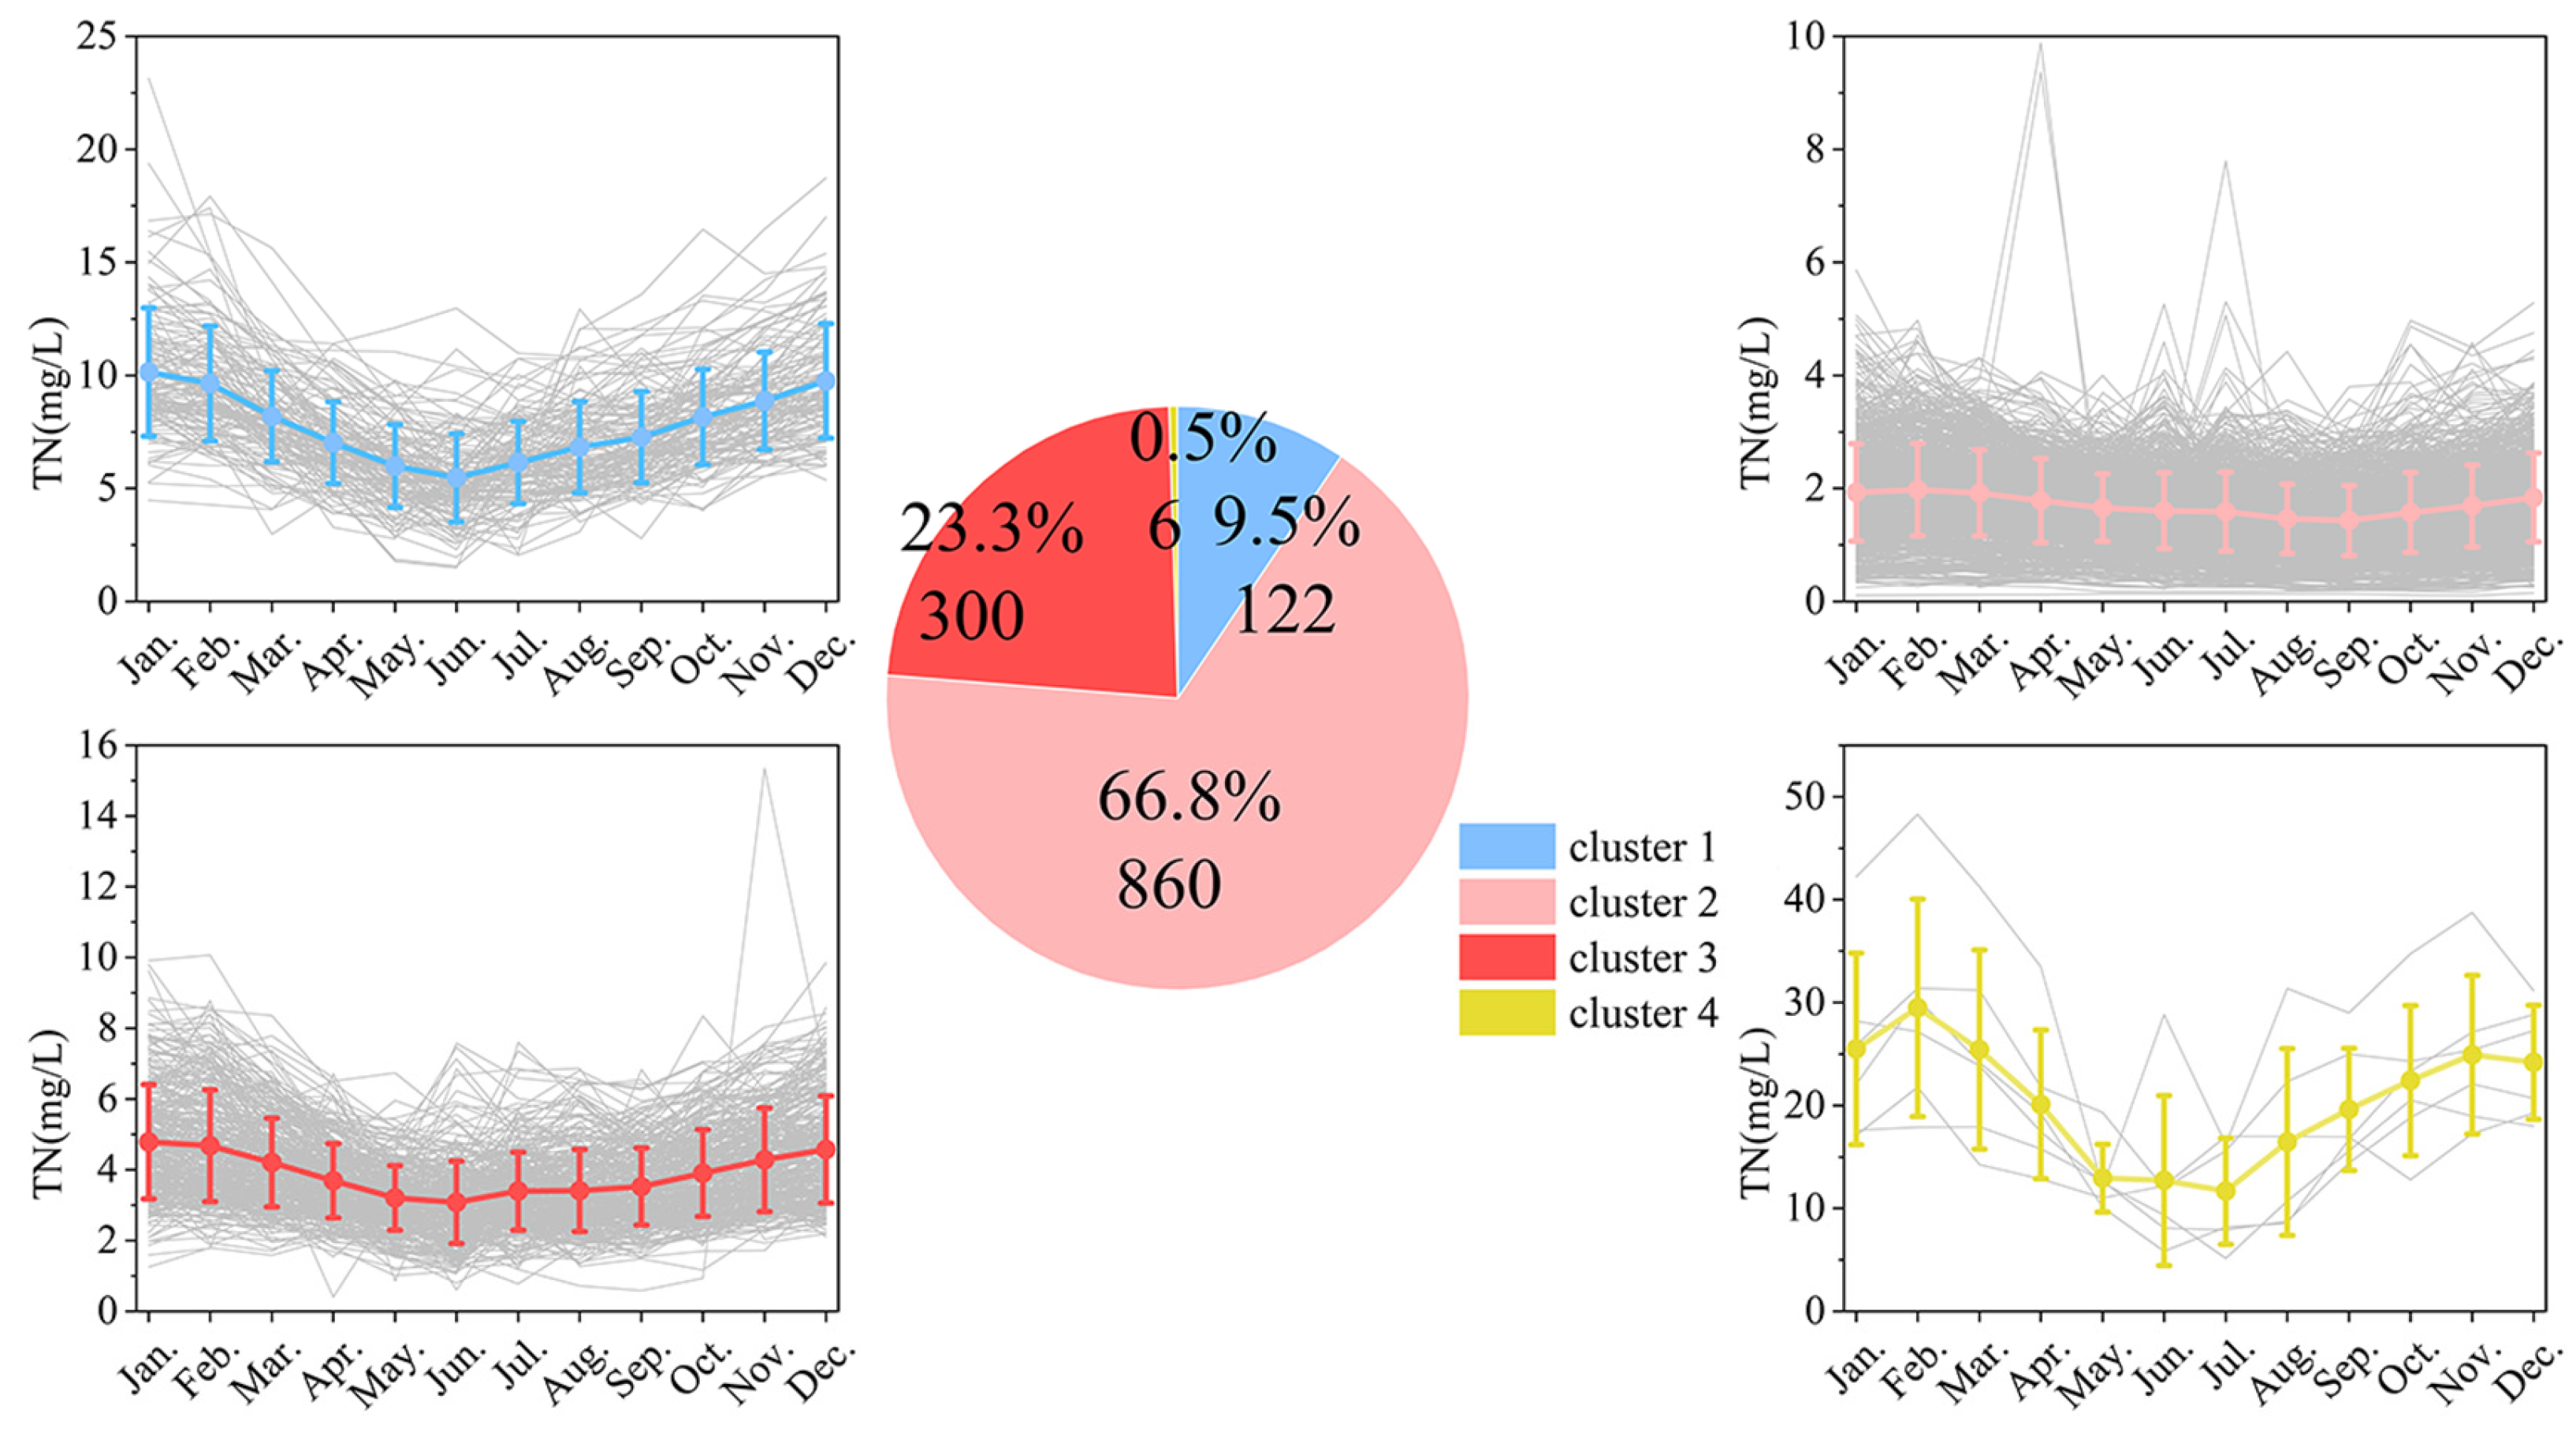
4.2.2. Cluster Analysis Results

SPSS statistics data analysis software (IBM SPSS Statistics 22) was used to preprocess the TN data of 1387 cross sections across the country and K-means cluster analysis was calculated. The spatial distribution is shown in Figure 11.
By conducting statistics on the clustering results, the results of classifying the total nitrogen (TN) into four categories were obtained, as shown in Figure 12. The four clustering types are respectively named high concentration fluctuation, low and stable, medium concentration fluctuation, and extremely high concentration.
Cluster 1 exhibits high TN concentrations, with an annual average of 7.79 mg/L and significant seasonal fluctuations. The highest concentration occurs in winter (10.15 mg/L in January), while the lowest is in summer (5.47 mg/L in June). These sections are primarily located in the Haihe River basin and the Huanghuai Plain, areas characterized by intensive agricultural and industrial activities, leading to high anthropogenic nitrogen emissions. During the dry winter, reduced flow rates contribute to increased pollutant concentrations. Cluster 2 maintain low TN concentrations, averaging 1.70 mg/L annually, with minimal seasonal variation. The peak concentration is 1.98 mg/L in February, and the lowest is 1.43 mg/L in September. These areas are mainly situated in the southwest river basins, Pearl River basin, and the upper reaches of the Yangtze River. The abundant vegetation and high rainfall in these regions enhance the dilution of pollutants, resulting in lower and more stable TN levels. Cluster 3 has an annual average TN concentration of 3.89 mg/L, with noticeable seasonal changes—higher in winter and lower in summer. The maximum concentration reaches 4.79 mg/L in January, and the minimum drops to 3.07 mg/L in June. These sections are located in the northeast, Huaihe, and the middle and lower reaches of the Yangtze River, where agricultural runoff and industrial discharges significantly influence TN levels. Cluster 4 is characterized by exceptionally high TN concentrations and has an annual average of 20.45 mg/L, with drastic seasonal fluctuations. The highest concentration peaks at 29.49 mg/L in February, while the lowest drops to 11.67 mg/L in July. Although few, these sections are predominantly found in industrial zones near urban sewage outfalls, where pollution loads are extremely high and require targeted intervention.
Clusters 1 and 4 are mainly distributed in the northern plains, particularly within the Haihe River basin and the lower reaches of the Yellow River, regions with dense populations and extensive industrial and agricultural activities. Cluster 2 sections are predominantly located in the southern mountainous and hilly areas, benefiting from stronger environmental self-purification capacities. All categories exhibit the seasonal trend of higher concentrations in winter and lower in summer, with Cluster 4 showing the most pronounced fluctuations. This pattern is likely due to reduced water flow and pollutant accumulation during the dry winter. High-concentration areas are closely linked to excessive agricultural fertilizer use, industrial wastewater discharge, and domestic sewage, whereas low-concentration areas benefit from favorable ecological conditions and minimal anthropogenic disturbances.
Similarly, K-means clustering analysis was conducted on the TP data to categorize the monitored sections into four groups, with the results presented in Figure 13. The four clustering types are respectively named low and stable, moderate concentration fluctuation, high concentration fluctuation, very high concentration specific.
Cluster 1 exhibits low TP concentrations, averaging 0.037 mg/L annually, with minimal seasonal fluctuations. The highest concentration occurs in July (0.046 mg/L) and the lowest in January (0.030 mg/L). These sections are predominantly located in the southwestern river basins and the Pearl River basin, areas characterized by good vegetation cover and reduced soil erosion. Cluster 2 has an annual average TP concentration of 0.096 mg/L, showing noticeable seasonal variations. The peak concentration is in July (0.129 mg/L), while the lowest is in December (0.077 mg/L). These sections are mainly found in the middle and lower reaches of the Yangtze River and the southeastern coastal areas, influenced by agricultural surface pollution and urban domestic sewage. Cluster 3 has an annual average TP concentration of 0.175 mg/L and experiences significant seasonal changes. The highest concentration is in July (0.229 mg/L), and the lowest in December (0.141 mg/L). These sections are primarily situated in the Huaihe River basin, Haihe River basin, and other agriculturally intensive areas, affected by farmland runoff and livestock and poultry breeding wastes. Cluster 4 has an exceptionally high annual average TP concentration of 0.384 mg/L, with the highest value recorded in April (0.497 mg/L) and the lowest in August (0.280 mg/L). Although few in number, these sections are typically located near specific pollution sources such as phosphate mining areas and chemical enterprise concentrations.
Clusters 1 and 2 are mainly distributed in the mountainous and forested southern regions, whereas Cluster 3 and 4 are predominantly found in the northern plains and hilly areas with agriculture-dominated land use. Except for Cluster 4, all categories exhibit the seasonal trend of higher TP concentrations in summer and lower in winter. This pattern is likely due to increased rainfall in summer, which enhances soil erosion and agricultural runoff, thereby transporting substantial phosphorus into water bodies. The exceptionally high TP concentrations in Cluster 4 during April may be linked to specific industrial activities or anthropogenic discharges. High concentration areas are closely associated with agricultural fertilization, soil erosion, and industrial wastewater discharges, while low concentration areas benefit from robust vegetation cover and stable soil conditions, minimizing phosphorus loss.
The spatial distribution of total nitrogen (TN) and total phosphorus (TP) across the country is influenced by geographic location, topography, and human activities. Due to intensive agricultural and industrial activities, northern plains exhibit higher TN and TP concentrations. In contrast, southern mountainous regions show lower levels, attributed to abundant vegetation cover and lower population densities [30,31].
Seasonally, TN concentrations decrease in summer and increase in winter, likely because increased summer rainfall dilutes nitrogen in rivers [32]. Conversely, TP concentrations rise in summer and fall in winter, possibly due to the enhanced surface runoff from summer rains transporting more phosphorus into water bodies [33].
K-means clustering analysis further elucidated the regional and temporal patterns of TN and TP. High concentrations of both nutrients overlap spatially, primarily in northern plains such as the Haihe River basin, the lower Yellow River, and the Huaihe River basin. These densely populated areas with extensive agricultural and industrial activities have multiple nitrogen and phosphorus pollution sources. Seasonal trends differ for TN and TP—TN peaks in winter and dips in summer, while TP reaches its highest levels in summer and lowest in winter. This discrepancy arises from nitrogen and phosphorus’s distinct chemical properties and transport mechanisms. Water-soluble nitrogen accumulates during the dry winter months, whereas phosphorus, often particulate, is mobilized by summer rainfall-induced runoff.
Factors such as agricultural fertilization, industrial and domestic wastewater discharge, rainfall, runoff, topography, and geomorphology collectively influence the spatial and temporal distribution of TN and TP [34,35]. To mitigate nitrogen and phosphorus pollution, efforts should focus on plains and areas with intensive agriculture and industrial development, implementing targeted prevention and control measures.

5. Discussions

5.1. Influencing Factors

This paper examines the effects of rainfall, topography, land use, and agricultural fertilization on nitrogen (N) and phosphorus (P) levels in water bodies. Numerous studies have identified rainfall as a key driver of surface pollution, with factors such as rainfall intensity, rainfall duration, frequency of rainfall, and raindrop potential energy being the main contributors to soil nutrient loss [36]. Seasonal rainfall largely determines the spatial and temporal variability of N and P loss [37,38]. Seasonal rainfall largely determines spatial and temporal variability of N and P losses. For example, Yang et al. [39] investigated the surface source pollution load in the water source area of the South-to-North Water Diversion Project and found that nitrogen and phosphorus concentrations are low during the dry season but increase significantly in the rainy season due to runoff transporting nutrients from the soil into water bodies. Additionally, rainfall intensity can exacerbate surface source pollution. Ningjali et al. [40], through in-situ runoff plot experiments, discovered a highly significant positive correlation between surface runoff volume, nitrogen loss on vegetable land slopes, and rainfall intensity. These findings highlight the critical role of rainfall patterns in influencing nutrient transport and water quality.
The results indicate that on a monthly scale, total nitrogen (TN) concentrations are lower in summer and higher in winter, while total phosphorus (TP) concentrations exhibit the opposite pattern, being higher in summer and lower in winter.In order to determine the factors influencing the changes of total phosphorus (TP) in water bodies, a Random Forest Indicator Importance Ranking (RFIR) analysis was carried out. The results showed that rainfall emerged as the most significant factor affecting TN changes and the second most important factor influencing TP variations. Nationwide, TN and TP levels were generally negatively correlated with rainfall. However, in the southwestern and northeastern river basins, as well as the Yellow River basin, TN concentrations showed a positive correlation with rainfall. This regional discrepancy is likely attributable to topography and land use pattern variations [41,42,43].
Special conditions in the southwestern river basins are influenced by topographic factors. The region’s karst topography results in significant dissolution and erosion, creating a unique dichotomous hydrological structure both above and below ground [44]. During most rainfall events, total nitrogen (TN) predominantly contaminates groundwater with minimal impact on surface rivers. For most river basins, the trends of rainfall and TN concentration are opposite. The TN concentration is the lowest in summer when rainfall is the heaviest. The trends of rainfall and TP concentration are the same, but there is a lag. This is jointly determined by various factors such as seasonal rainfall, topography, and population. Taking the Yangtze River basin as an example, it has abundant rainfall, with most of the annual precipitation ranging from 800 to 1600 mm. The rainfall is unevenly distributed throughout the seasons. The river has a large water volume and strong water flow mobility. The dilution effect of the water body is significant and can disperse and dilute pollutants such as nitrogen elements, thus relatively reducing the TN concentration [45]. In winter, precipitation in the Yangtze River basin decreases, and the river water volume is relatively small. The dilution capacity of the water body for nitrogen-containing pollutants weakens, leading to an increase in the TN content. In summer, the vegetation in the Yangtze River basin grows luxuriantly. The roots of plants will absorb a large amount of nitrogen for growth and metabolism, converting the nitrogen in the water body and soil into organic nitrogen within the plants, thus reducing the TN content in the water body [45,46,47]. In winter, as the river flow decreases and the water velocity slows down, the scouring and transportation capacity of the water body for nitrogen-containing pollutants weakens. Pollutants tend to accumulate in local areas, leading to an increase in the TN content [48]. Jencso’s research has demonstrated that some hillslopes in a river basin may be connected to the river network throughout the year, while others are either never connected to the river network or are only briefly connected during the wettest periods and rainstorm events. During rainstorms, surface runoff from the hillslopes to the rivers can transport a large amount of sediment and nutrients to the river network [48]. In some low-lying areas, a relatively enclosed water environment may form in winter. Poor water exchange makes it difficult for nitrogen-containing pollutants to disperse, further contributing to the rise in the TN content [49]. The total phosphorus (TP) content in water bodies is higher in summer and lower in winter, which is mainly related to factors such as water temperature, biological activities, and agricultural activities. In summer, the water temperature is relatively high. This increases the solubility of phosphorus-containing substances such as calcium phosphate in the water. More phosphorus will dissolve from solid-phase substances like bottom mud into the water, leading to an increase in the TP content in the water. Summer is the peak season for agricultural production. A large amount of phosphate fertilizer is applied to farmland. Under the effects of rainfall and irrigation, phosphorus in the farmland will enter the water body in large quantities through surface runoff and other means, thus increasing the TP content in the water. Yang’s research on the output characteristics of non-point source pollutants in a typical river basin of the water source area of the Middle Route Project of the South-to-North Water Diversion also shows that, in the dry season, there is little precipitation in the farmland, making it difficult to form effective runoff. As a result, nitrogen and phosphorus have a clear latency period in the dry season [39]. In the Yellow River basin, there are often rainstorms in summer with high precipitation intensity. In areas such as the Loess Plateau, the soil is loose, and it is difficult for vegetation cover to completely and effectively block the erosion of the soil by rainwater during rainstorms. A large amount of sediment containing phosphorus elements is washed into the Yellow River water body. The phosphorus carried by these sediments will increase the TP content in the water body in the form of particulate phosphorus, etc. Shi and Shao conducted research on the Loess Plateau region and obtained a conclusion similar to ours [19]. In most areas of the Loess Plateau, the average annual precipitation is between 400 and 600 mm, and the precipitation from June to September accounts for 60–70% of the annual precipitation. The rainfall here is characterized by short duration and high intensity, which exacerbates the loss of nitrogen and phosphorus carried by the soil and water body. As for the Haihe River basin, its terrain is generally high in the northwest and low in the southeast. The surface runoff formed by summer precipitation flows from the northwest to the southeast, carrying phosphorus elements from the areas it passes through during the flow process [37,50]. Chardon and Schoumans in 2007 studied the relationship between organic matter and phosphorus [50]. The mountainous areas are rich in phosphorus-containing resources such as phosphate rocks. The runoff formed by precipitation will wash a large amount of phosphorus-containing substances, such as the weathering products of phosphate rocks, into water bodies such as rivers and lakes in the middle and lower reaches. In addition, the mountainous areas have large terrain undulations and fast water flow speeds, which have strong erosion and transportation capabilities on the surface, enabling more phosphorus to be carried into the water bodies and thus increasing the TP content in the water bodies. In winter, due to low precipitation, weak surface runoff, the erosion and transportation effects of the water flow on the terrain, are greatly weakened, and the amount of phosphorus elements washed from the mountainous areas into the water bodies in the middle and lower reaches is significantly reduced. Moreover, in winter, some rivers may freeze, with slow or even stagnant water flow, and the diffusion and migration capabilities of phosphorus elements in the water bodies are weakened, resulting in a relatively low TP content in the water bodies [38].
In contrast, the northeast river basins and the Yellow River basin are major agricultural regions in China. These areas experience substantial agricultural surface pollution due to the excessive use of agrochemicals, soil erosion, water and soil loss, and livestock and poultry manure, all of which adversely affect water quality [51,52,53]. Henan and Shandong provinces, through which the Yellow River basin flows, are the largest consumers of agricultural fertilizers in China, with a total application of 9.574 million tons in 2022. Additionally, the three northeastern provinces, serving as the main grain production areas in China [54], applied 5.918 million tons of fertilizers in 2020, significantly impacting nitrogen and phosphorus concentrations in water bodies.
The intense agricultural activities in these basins lead to elevated levels of nitrogen and phosphorus through runoff and leaching, exacerbating water pollution [55]. The combination of high fertilizer usage, soil erosion, and livestock waste contributes to the persistent degradation of water quality in these regions [56]. Effective management strategies, including the regulation of fertilizer application, the implementation of soil conservation practices, and the treatment of agricultural and domestic waste, are essential to mitigate the impacts of agricultural surface pollution on water bodies.
Several studies have demonstrated a strong correlation between terrain characteristics and nitrogen (N) and phosphorus (P) outputs [57]. For instance, Xin et al. developed a model linking slope and soil loss rate, revealing that slope affects runoff intensity and rate, with slope instability positively correlating with surface runoff and erosion rates [58]. Topography not only influences the transport of N and P to water bodies but also impacts the distribution of human activities. Shallow slopes tend to be more densely inhabited, leading to increased N and P pollution due to human activities [59].
As can be seen from Figure 4, the findings of this paper indicate that TN and TP concentrations are higher in water bodies within plains compared with mountainous regions, characterized by “high in the plains and low in the mountains.” Topography emerges as the most significant factor influencing TP changes and the third most important factor affecting TN variations in water bodies. As can be seen from Figure 14, nationally, TP changes are negatively correlated with elevation, meaning that higher elevations correspond to lower TP concentrations. Conversely, TN changes show a positive correlation with elevation, particularly in the Yangtze River basin, Pearl River basin, and Haihe River basin. This may be attributed to these areas’ favorable geographical locations, abundant resources, high urbanization rates, dense populations, and developed industries, resulting in elevated sewage and wastewater discharges. Additionally, residential land use positively correlates with water quality indicators, with domestic pollution sources contributing significantly to N and P inputs in water bodies.
Soil type also significantly affects N and P levels in water bodies [50]. The physical, chemical, and biological properties of soil play crucial roles in nonpoint source pollution [60,61]. For example, Niu Jun et al. examined purple soil in Sichuan and found that N and P are the primary components of nutrient loss from sloping cropland [61,62]. As shown in Figure 16, soil type is the fifth most influential factor for TN changes and the fourth for TP changes in water bodies, with national changes in TN and TP positively correlated with soil type.
Human activities significantly impact N and P concentrations in water bodies. Land use changes, increasing population density, and heavy chemical fertilizer application have led to substantial increases in water body N and P levels, causing issues such as lake eutrophication and pollution of irrigation and drinking water sources. This study investigated the effects of land use, fertilizer application, and population density on N and P levels. Figure 16 illustrates that, nationally, TN changes are negatively correlated with land-use type and positively correlated with fertilizer application and population density. Similarly, TP changes are negatively correlated with land use and positively correlated with fertilizer application and population density. The negative correlation between land use and nitrogen and phosphorus means that natural land has a purification effect and construction land has relatively low nitrogen emissions. The positive correlation between fertilization amount and the contents of total nitrogen and total phosphorus indicates that precise fertilization is necessary in agricultural production. Excessive fertilization can lead to the accumulation of nutrients such as nitrogen and phosphorus in the soil, which can then enter water bodies through surface runoff and other means, causing pollution.
Figure 15 presents the TN concentration statistics for sites across different land-use types. The data indicate that woodlands exhibit the best water quality regarding total nitrogen, with 15% of woodland sites achieving a water quality rating of mildly eutrophic or better. This improvement is attributed to woodlands’ ability to intercept, filter, and adsorb particulate matter entering rivers through infiltration and the biological uptake of nitrogen and phosphorus by plant root systems. Conversely, the highest mean TN concentration was observed in agricultural land, averaging 3.25 mg/L, while the lowest mean concentration was recorded in water bodies, averaging 2.32 mg/L. These findings highlight the significant role of land use in influencing nitrogen levels in aquatic environments and underscore the benefits of woodland areas in mitigating nitrogen pollution.
Figure 16 presents the TP concentration statistics for sites across different land-use types. The data indicate that forest land exhibits the best water quality regarding total phosphorus, with 76% of forest sites achieving a water quality classification of mildly eutrophic or better. In contrast, agricultural land recorded the highest mean TP concentration at 0.0822 mg/L, while forest land had the lowest mean TP concentration at 0.0654 mg/L. These findings highlight the significant role of land use in influencing phosphorus levels in aquatic environments and demonstrate the effectiveness of forested areas in mitigating phosphorus pollution.
Random forest indicator importance ranking (RFIR) analysis was performed to identify the factors influencing total phosphorus (TP) changes in water bodies, with results depicted in Figure 14a. The analysis revealed that natural factors (elevation, rainfall, and soil type) and human factors (land-use type, fertilizer application, and population density) significantly contributed to TP variations. Specifically, natural factors accounted for approximately 57% of the total contribution, while human activities contributed around 43%. Among the natural factors, elevation had the most substantial impact, contributing 26%, followed by rainfall at 21%, and population density at 17%.
For total nitrogen (TN) changes, natural factors contributed about 77%, and human activities accounted for approximately 23%. Rainfall emerged as the most influential factor for TN, contributing 45% of the total variation, followed by population density at 20%.
Overall, rainfall is the primary factor influencing TN changes, while elevation is the main factor affecting TP variations. Rainfall drives runoff generation and pollutant transport, significantly determining the temporal variability of nitrogen and phosphorus losses in the watershed. Topography influences surface water flow, thereby affecting the transport of dissolved nitrogen and phosphorus to receiving waters. Additionally, shallow slopes are typically associated with intensive human activities such as farming and construction, which are major sources of nitrogen and phosphorus pollution.
These findings underscore the critical roles of both natural and anthropogenic factors in shaping nutrient dynamics in water bodies. Effective water quality management must therefore consider the interplay between rainfall patterns, topographic features, and human land use practices to mitigate nitrogen and phosphorus pollutions.

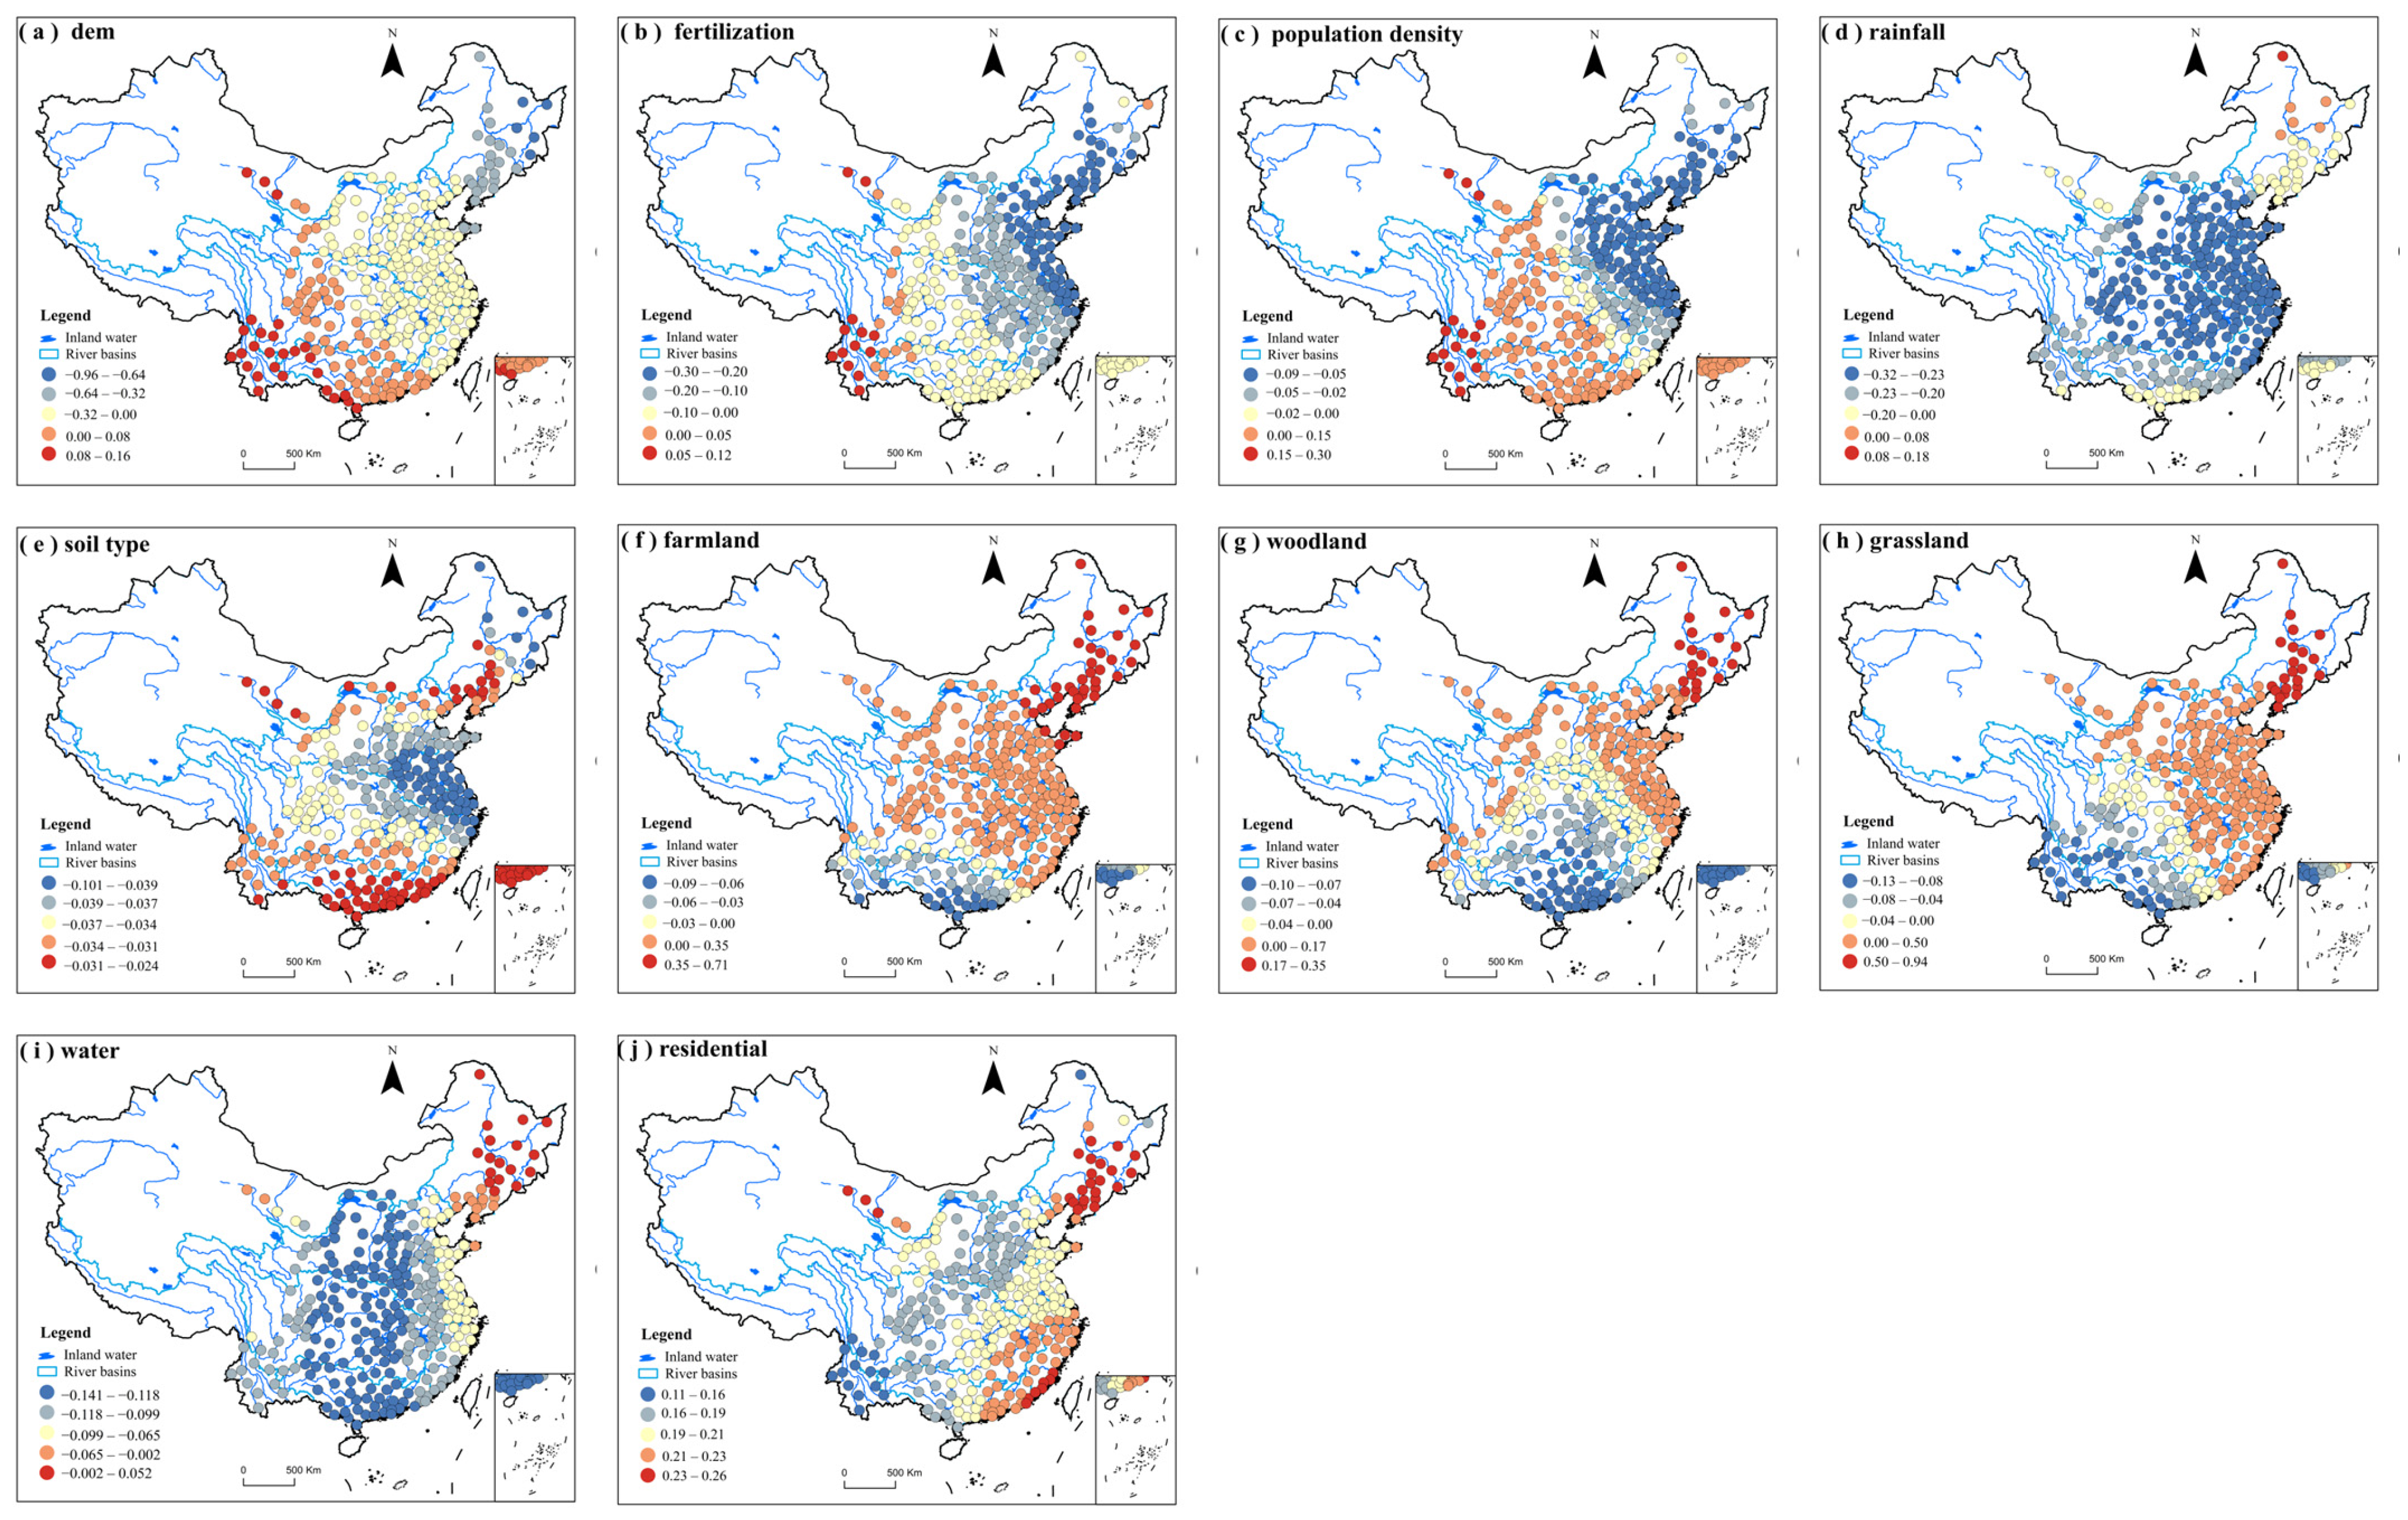
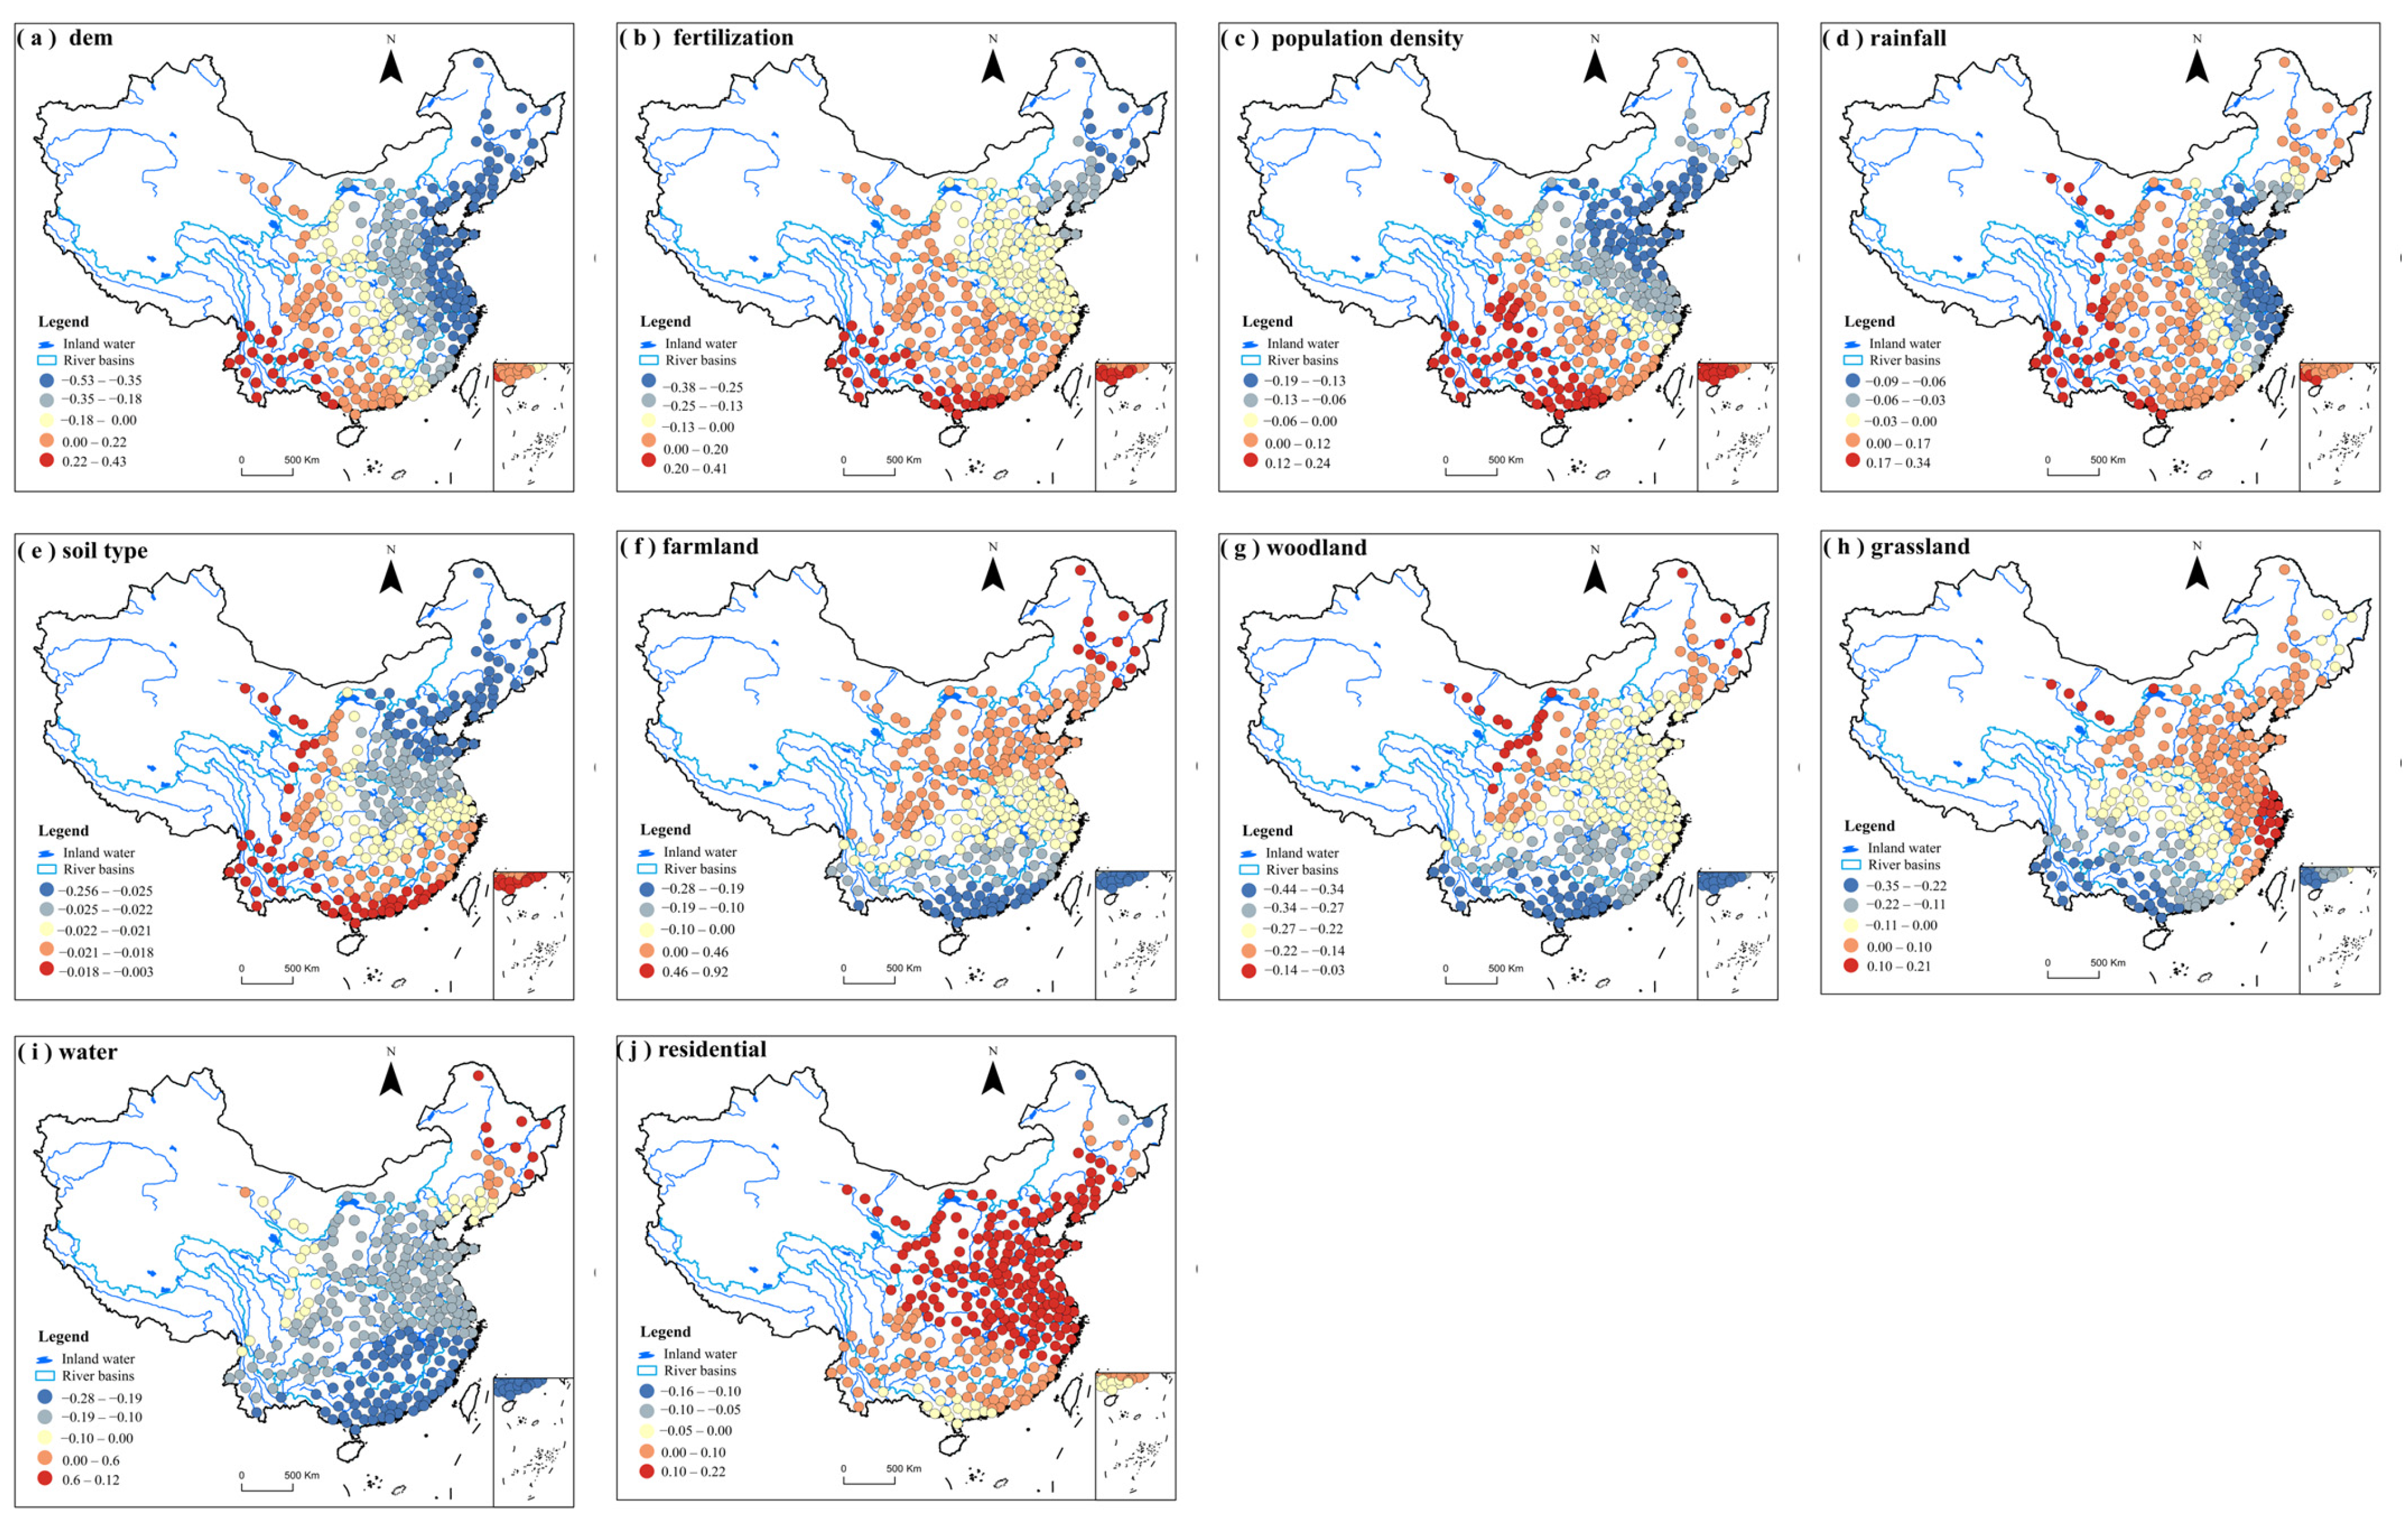
5.2. Spatial Heterogeneity of Influencing Factors

To thoroughly investigate the spatial heterogeneity of factors influencing nitrogen and phosphorus (NP) concentrations in China’s surface waters, this study employed a geographically weighted regression (GWR) model. The GWR model was utilized to analyze the relationships between total nitrogen (TN) and total phosphorus (TP) concentrations and a variety of natural and anthropogenic factors. By allowing the regression coefficients to vary spatially, the GWR model effectively revealed the spatial variability in the effects of these influencing factors on NP concentrations.
Table 4 presents the diagnostic information for the GWR models applied to analyze the spatial heterogeneity of factors influencing total nitrogen (TN) and total phosphorus (TP) concentrations in China’s surface waters. The results indicate that the GWR model for TN at the watershed scale demonstrates a good fit, with an adjusted R2 of 0.449. This suggests that the model explains approximately 44.9% of the variability in TN concentrations. Conversely, the GWR model for TP at the provincial scale shows a lower fit, with an adjusted R2 of 0.177. Additionally, the models at the municipal scale exhibit relatively poor performance, as evidenced by lower adjusted R2 values.
These differences in model performance may be attributed to the spatial scale of the data and the number of samples available. At larger spatial scales, such as the watershed and provincial levels, the models can better capture the underlying spatial patterns and relationships. In contrast, at the municipal scale, the limited number of samples and finer spatial resolution may hinder the model’s ability to explain the variability in nutrient concentrations accurately.
Overall, the GWR analysis highlights the importance of selecting appropriate spatial scales for modeling nutrient dynamics and suggests that watershed and provincial scales are more effective for understanding the spatial heterogeneity of TN and TP concentrations in China’s surface waters.
The analysis of the data contained in Table 5 and Table 6 revealed that elevation significantly negatively affects both total nitrogen (TN) and total phosphorus (TP) concentrations, with mean regression coefficients of −0.399 and −0.492, respectively. Higher elevations are associated with lower nutrient levels, likely due to reduced human activities, fewer pollution sources, and increased vegetation cover that enhances nitrogen uptake. Rainfall also negatively correlates with TN and TP, with respective mean coefficients of −0.469 and −0.039. Increased rainfall dilutes TN concentrations and, to a lesser extent, TP concentrations, although phosphorus’s particulate nature limits the dilution effect.
Population density shows a negative correlation with both TN (−0.216) and TP (−0.278) concentrations, suggesting that areas with higher population densities benefit from more effective wastewater treatment facilities, thereby reducing nutrient emissions. Interestingly, fertilizer application is negatively correlated with TN (−0.133) but positively correlated with TP (0.182). The negative association for TN may result from stricter agricultural practices or enhanced nitrogen uptake by vegetation, while the positive correlation for TP is due to phosphorus runoff from high fertilizer use. Soil type also plays a role, with mean coefficients of −0.126 for TN and 0.212 for TP, indicating that different soil properties influence nutrient retention and transport.
Overall, natural factors such as elevation and rainfall are primary drivers of nutrient concentrations, while human activities like population density and fertilizer application also significantly impact TN and TP levels. These findings highlight the need for targeted management strategies that consider both natural and anthropogenic factors in order to effectively mitigate nitrogen and phosphorus pollution in China’s surface waters.
The intensity of factors influencing regional total nitrogen (TN) concentrations in urban areas, ranked by the median absolute regression coefficients, is as follows: rainfall, residential land, cropland, fertilizer application, water, elevation, grassland, soil type, population density, and forest land. Rainfall and soil type negatively correlate with TN concentrations.
According to Figure 17, spatially, elevation and fertilizer application exhibit similar distribution patterns, with their regression coefficients gradually decreasing from northeast to southwest. Rainfall coefficients are highest in southern north China and northern central China, diminishing outward. Soil type coefficients follow a similar trend but include some high values in the northeast. Population density coefficients peak in southeast China, most of central China, and parts of Gansu and Shaanxi, decreasing outward while increasing again in the three eastern provinces.
These spatial heterogeneities underscore the varying impacts of natural and anthropogenic factors on TN concentrations across urban regions in China. Understanding these patterns is essential for developing targeted strategies to manage and mitigate nitrogen pollution effectively.
Based on the median absolute regression coefficients, the factors influencing regional total phosphorus (TP) concentrations in urban areas are ranked in descending order as follows: forest land, elevation, watersheds, residential land, population density, rainfall, grassland, cropland, fertilizer application, and soil type. Notably, soil type consistently exhibits a negative correlation with TP concentrations across all urban areas. It can be seen from Figure 18 that the absolute regression coefficients for soil type decrease in an arc from the Bohai Bay coast southward, with values diminishing further south. Rainfall and fertilizer application display similar spatial distributions, showing higher coefficients in southeast and central China and decreasing outward; however, rainfall coefficients also exhibit elevated values in the three eastern provinces. Elevation demonstrates distinct spatial patterns, with negative correlations prevalent across most of China and positive correlations concentrated in parts of Yunnan and Sichuan provinces. The influence of elevation diminishes from south and central China and parts of Gansu and Shaanxi, reaching its lowest impact in the coastal regions of Jiangsu Province and Zhejiang Province. Population density coefficients are highest in southeast China, most of central China, and parts of Gansu and Shaanxi, decreasing outward but increasing again in the three eastern provinces.
The geographically weighted regression (GWR) models reveal varying performance across different spatial scales, with the best fit observed at the watershed scale and relatively poor performance at the urban scale. This discrepancy is likely due to the watershed scale better capturing the overall water pollution patterns, whereas the urban scale is more affected by data limitations and localized factors, reducing the model’s effectiveness.
Key influencing factors include elevation and rainfall, which consistently show significant effects on both total nitrogen (TN) and TP concentrations. Elevation is generally negatively correlated with nutrient concentrations, while rainfall is negatively correlated with TN and has inconsistent effects on TP. Fertilizer application is positively correlated with TP concentrations at the watershed scale, indicating agricultural fertilization as a significant phosphorus source, whereas its effect on TN concentrations varies across scales due to the complex biogeochemical cycling of nitrogen. Additionally, higher population density areas exhibit lower TN and TP concentrations, likely attributable to effective sewage treatment facilities that control pollutant discharges.
These findings emphasize the importance of considering both natural factors, such as elevation and rainfall, and anthropogenic activities, including land use and fertilizer application, in managing nitrogen and phosphorus pollution in urban water bodies. The observed spatial heterogeneity underscores the necessity for tailored management strategies that address the specific environmental and socio-economic contexts of different regions in China.

6. Conclusions

This study systematically analyzed the spatial and temporal distribution of total nitrogen (TN) and total phosphorus (TP) in China’s surface waters using data from 1387 monitoring transects collected between 2020 and 2021. The average concentrations were 3.89 mg/L for TN and 0.096 mg/L for TP. Spatially, both TN and TP were higher in the north, coastal areas, and plains compared with the south, interior, and mountainous regions. Notably, TN concentrations reached up to 29.49 mg/L in the Haihe River basin and Yellow River plain, while TP peaked at 0.497 mg/L in southeastern Shandong and northern Jiangsu. Seasonally, TN was 50% higher in winter than in summer, whereas TP was 40% higher in summer. Rainfall had a significant delayed effect, impacting TN on the day of rainfall and TP the day after. Natural factors were the primary drivers of TN concentrations, contributing approximately 77%, with rainfall and population density being major factors. In contrast, natural factors accounted for 57% of TP variations, with elevation and rainfall being the most influential. Recommendations include enhancing agricultural pollution control, promoting scientific fertilizer use, improving sewage treatment, implementing targeted regional management, and strengthening ecological restoration and early warning systems to mitigate nitrogen and phosphorus pollution and ensure sustainable water resource use in China.
Taking the Yangtze River basin as an example, due to a large backlog of historical issues in the drainage pipeline systems of small and medium-sized cities in China, there are phenomena such as direct sewage discharge and overflow pollution. In almost all cities in the Yangtze River basin, there are areas lacking pipeline network construction, especially in urban villages, old urban areas, and the junctions between urban and rural areas. This results in a low sewage collection rate, with domestic sewage being directly discharged into rivers. In some old urban areas, the pipeline network coverage is low, and the drainage system is mainly a combined sewer system, making overflow pollution likely to occur after rainfall. Therefore, in order to reduce the level of total nitrogen pollution, it is necessary to focus on coordinating sewage collection and treatment. In accordance with the principle of “collecting all sewage that should be collected and separating all rainwater that should be separated,” a comprehensive inspection should be carried out on the misconnections, mixed connections, and leaky connections of the sewage pipeline network, as well as user access. Regarding agricultural non-point source pollution, it is recommended to precisely prevent and control this type of pollution by improving the monitoring and evaluation system for agricultural non-point source pollution, perfecting the technical models for treating agricultural non-point source pollution, and establishing a performance evaluation system for the treatment of agricultural non-point source pollution.

Supplementary Materials

The following supporting information can be downloaded at: https://www.mdpi.com/article/10.3390/w17040512/s1, Figure S1. Monthly spatial distribution of total nitrogen concentration; Figure S2. Monthly spatial distribution of total phosphorus concentration; Figure S3. Monthly plot of total nitrogen concentrations; Figure S4. Monthly plot of total phosphorus concentrations.

Author Contributions

Conceptualization, J.L.; methodology, Y.H.; software, Y.H.; validation, Z.S. and S.B.; investigation, X.Z.; resources, T.X.; writing—original draft preparation, J.L.; writing—review and editing, T.X.; visualization, C.W. All authors have read and agreed to the published version of the manuscript.

Funding

This work was supported by the National Natural Science Foundation of China (No. 41701379, 42071325), Fengyun Application Pioneering Project (FY-APP-2024.0303), Natural Science Foundation of Jiangsu Province (BK20241053).

Data Availability Statement

The original data for this article are included within the main text. The datasets generated during and/or analyzed during the current study are available from the corresponding author on reasonable request.

Acknowledgments

The authors would like to express their gratitude to Nanjing University of Information Science and Technology.

Conflicts of Interest

The authors declare no conflicts of interest.

References

  1. Wang, S.; Qing, B. Research progress on remote sensing monitoring of lake water quality parameters. Environ. Sci. 2023, 44, 1228–1237. [Google Scholar]
  2. Levallois, P.; Villanueva, C.M. Drinking Water Quality and Human Health: An Editorial. Int. J. Environ. Res. Public Health 2019, 16, 631. [Google Scholar] [CrossRef] [PubMed]
  3. Xu, Z. Hydrological models: Past, present and future. J. Beijing Norm. Univ. (Nat. Sci.) 2010, 46, 278–289. [Google Scholar]
  4. Fu, C.; Zhong, C.; Deng, C. Analysis on Cause of the Eutrophication of Water Body. J. Civ. Environ. Eng. 2005, 27, 128–131. [Google Scholar]
  5. Xie, L.; Wu, D.; Zhang, Y. Analysis and Evaluation of China’s Rural Domestic Sewage Treatment Technology. J. Ecol. Rural. Environ. 2018, 34, 865–870. [Google Scholar]
  6. Leaf, S.S.; Chatterjee, R. Developing a strategy on eutrophication. Water Sci. Technol. 1999, 39, 307–314. [Google Scholar] [CrossRef]
  7. Huang, X.; Li, H.; Jin, B. Hydrology; Higher Education Press: Beijing, China, 2001. [Google Scholar]
  8. Chen, W.; Chen, Y.; Huang, H.; Lu, Y.; Khorram, M.S.; Zhao, W.; Wang, D.; Qi, S.; Jin, B.; Zhang, G. Occurrence of N-Nitrosamines in the Pearl River delta of China: Characterization and evaluation of different sources. Water Res. 2019, 164, 114896.1–114896.10. [Google Scholar] [CrossRef]
  9. Report on the State of the Ecology and Environment in China 2022; Ministry of Ecology and Environment of the People’s Republic of China: Beijing, China, 2023; pp. 11–15.
  10. Cui, M.; Guo, Q.; Wei, R. Human-driven spatiotemporal distribution of phosphorus flux in the environment of a mega river basin. Sci. Total Environ. 2021, 752, 141781. [Google Scholar] [CrossRef]
  11. Nan, S.; Li, J.; Zhang, L. Distribution characteristics of phosphorus in the Yarlung Zangbo River basin. Water 2018, 10, 913. [Google Scholar] [CrossRef]
  12. Huang, Z.; Jiang, S.; Gao, H.; Zhang, Q.; Huang, J.; Liu, Q. Analysing the spatial and temporal variations and influencing factors of the water quality in the hilly watershed of Poyang Lake. Environ. Sci. Technol. 2022, 45, 47–57. [Google Scholar]
  13. Yang, C.; He, B.; Duan, W.; Li, B.; Chen, W.; Yang, G. Analysing the spatial and temporal variations and influencing factors of the water quality in a typical hilly water source of lake Taihu basin: A case study in Pingqiao river watershed. Resour. Environ. Yangtze Basin 2017, 26, 273–281. [Google Scholar]
  14. Li, Y.; Zhang, Z.; Cheng, J.; Zou, L.; Zhang, Q.; Zhang, M.; Gong, Z.; Xie, S.; Cai, Y. Water quality change and driving forces of Lake Hongze from 2012 to 2018. J. Lake Sci. 2021, 33, 715–726. [Google Scholar]
  15. Li, Z.; Yu, X.; Liu, Q.; Jing, G. Phosphorus output characteristics of special rainfall in a typical small watershed in the Yimeng Mountains. Environ. Sci. 2012, 33, 1152–1158. [Google Scholar]
  16. Li, L.; Lu, S.; Meng, W.; Liu, X.; Guo, X.; Wang, Z. Eutrophication and control measures of key lakes in the Yangtze River Basin. Sci. Technol. Rev. 2017, 35, 13–22. [Google Scholar]
  17. Tang, C. Hydrology of Chinese Rivers; Science Press: Beijing, China, 1998. [Google Scholar]
  18. Fang, Z.; Su, J.; Zhao, H.; Hu, L.; Li, X. Non-point source nitrogen and phosphorus output characteristics of typical land use in small watersheds in red soil hilly areas. Environ. Sci. 2021, 42, 5394–5404. [Google Scholar]
  19. Shi, H.; Shao, M. Soil and water loss from the Loess Plateau in China. J. Arid. Environ. 2000, 45, 9–20. [Google Scholar] [CrossRef]
  20. Wei, W.; Chen, L.; Fu, B.; Huang, Z.; Wu, D.; Gui, L. The effect of land uses and rainfall regimes on runoff and soil erosion in the semi-arid loess hilly area, China. J. Hydrol. 2007, 335, 247–258. [Google Scholar] [CrossRef]
  21. Pratt, B.; Chang, H. Effects of land cover, topography, and built structure on seasonal water quality at multiple spatial scales. J. Hazard. Mater. 2012, 209–210, 48–58. [Google Scholar] [CrossRef]
  22. Li, X.; Lei, Q.; Zhou, J.; Zhang, Y.; Li, Y.; Hu, W.; Wu, S.; Zhai, L.; Wang, H.; Liu, H. Effects of rainfall intensity on nitrogen and phosphorus emissions in Fengyu River in the Erhai Basin. Environ. Sci. 2019, 40, 5375–5383. [Google Scholar]
  23. Funk, C.; Peterson, P.; Landsfeld, M.; Pedreros, D.; Verdin, J.; Shukla, S.; Husak, G.; Rowland, J.; Harrison, L.; Hoell, A. The climate hazards infrared precipitation with stations—A new environmental record for monitoring extremes. Sci. Data 2015, 2, 150066. [Google Scholar] [CrossRef]
  24. Liu, J.; Zhang, Z.; Xu, X.; Kuang, W.; Zhou, W.; Zhang, S.; Li, R.; Yan, C.; Yu, D.; Wu, S.; et al. Spatial Patterns and Driving Forces of Land Use Change in China in the Early 21st Century. Acta Geogr. Sin. 2009, 64, 1411–1420. [Google Scholar] [CrossRef]
  25. Xi, C.; Zhang, S. Brief introduction on achievements in national soil survey project since 1979. Acta Pedol. Sin. 1994, 31, 330–335. [Google Scholar]
  26. Yu, Z.; Liu, J.; Kattel, G. Historical nitrogen fertilizer use in China from 1952 to 2018. Earth Syst. Sci. Data 2022, 14, 5179–5194. [Google Scholar] [CrossRef]
  27. Bauwe, A.; Tiemeyer, B.; Kahle, P.; Lennartz, B. Classifying hydrological events to quantify their impact on nitrate leaching across three spatial scales. J. Hydrol. 2015, 531, 589–601. [Google Scholar] [CrossRef]
  28. Lu, H.; Feng, Q. Survey on random forest algorithms. J. Hebei Acad. Sci. 2019, 36, 37–41. [Google Scholar]
  29. Zhuo, Y.; Zeng, W.; Ma, B. Spatiotemporal variation and influencing factors of nitrogen and phosphorus in lake sediments in China since 1850. J. Clean. Prod. 2022, 368, 133170. [Google Scholar] [CrossRef]
  30. Fernández-Raga, M.; Palencia, C.; Keesstra, S.; Jordán, A.; Cerdà, A. Splash erosion: A review with unanswered questions. Earth-Sci. Rev. 2017, 171, 463–477. [Google Scholar] [CrossRef]
  31. Wu, L.; Peng, M.; Qiao, S.; Ma, X.Y. Effects of rainfall intensity and slope gradient on runoff and sediment yield characteristics of bare loess soil. Environ. Sci. Pollut. Res. 2018, 25, 3480–3487. [Google Scholar] [CrossRef]
  32. Mengistu, S.G.; Creed, I.F.; Webster, K.L.; Eric, E.; Beall, F.D. Searching for similarity in topographic controls on carbon, nitrogen and phosphorus export from forested headwater catchments. Hydrol. Process. 2014, 28, 3201–3216. [Google Scholar] [CrossRef]
  33. Liao, Z.; Lu, Y.; Chen, Z.; Ding, R.; Wu, Y.; Wei, D.; Gao, H.; Xu, H.; Wen, H.; Hu, H. Characteristics of spatial-temporal variation in the ecological risk of aquatic organisms for ammonia nitrogen in the Yellow River Basin. Res. Environ. Sci. 2023, 37, 42–50. [Google Scholar]
  34. Hongjun, D.; Tao, S.; Kun, Z.; Wen, G. Research on Rural Nonpoint Source Pollution in the Process of Urban-Rural Integration in the Economically-Developed Area in China Based on the Improved STIRPAT Model. Sustainability 2015, 7, 782–793. [Google Scholar] [CrossRef]
  35. Essaid, H.I.; Bekins, B.A.; Cozzarelli, I.M. Organic contaminant transport and fate in the subsurface: Evolution of knowledge and understanding. Water Resour. Res. 2015, 51, 4861–4902. [Google Scholar] [CrossRef]
  36. Liu, R.; Wang, J.; Shi, J.; Chen, Y.; Sun, C.; Zhang, P.; Shen, Z. Runoff characteristics and nutrient loss mechanism from plain farmland under simulated rainfall conditions. Sci. Total Environ. 2014, 468–469, 1069–1077. [Google Scholar] [CrossRef]
  37. Shen, Z.; Qiu, J.; Hong, Q.; Chen, L. Simulation of spatial and temporal distributions of non-point source pollution load in the Three Gorges Reservoir Region. Sci. Total Environ. 2014, 493, 138–146. [Google Scholar] [CrossRef]
  38. Sawicz, K.; Wagener, T.; Sivapalan, M.; Troch, P.A.; Carrillo, G. Catchment classification: Empirical analysis of hydrologic similarity based on catchment function in the eastern USA. Hydrol. Earth Syst. Sci. Discuss. 2011, 15, 2895–2911. [Google Scholar] [CrossRef]
  39. Yang, J.; Liang, J.; Yang, G.; Feng, Y.; Ren, G.; Ren, C.; Han, X.; Wang, X. Characteristics of Non-Point Source Pollution under Different Land Use Types. Sustainability 2020, 12, 2012. [Google Scholar] [CrossRef]
  40. Ning, J.; Huang, Y.; Li, G.; Chen, Z.; Wang, J. Characteristics of soil erosion and nitrogen loss in vegetable fields under natural rainfall. Environ. Sci. 2023, 44, 293–302. [Google Scholar]
  41. Huang, C.; Huang, X.; Peng, C.; Zhou, Z.; Teng, M.; Wang, P. Land use/cover change in the Three Gorges Reservoir area, China: Reconciling the land use conflicts between development and protection. Catena 2019, 175, 388–399. [Google Scholar] [CrossRef]
  42. Rothwell, J.J.; Dise, N.B.; Taylor, K.G.; Allott, T.E.H.; Neal, C. A spatial and seasonal assessment of river water chemistry across North West England. Sci. Total Environ. 2009, 408, 841–855. [Google Scholar] [CrossRef]
  43. Jiao, X.; Peng, T.; Li, S.; Zhang, L.; Gu, Z.; Zhang, X.; Wang, S. A preliminary study on the erosive rainfall threshold of karst slopes. J. Soil Water Conserv. 2023, 37, 57–63. [Google Scholar]
  44. Guo, J.H.; Liu, X.J.; Zhang, Y.; Shen, J.L.; Han, W.X.; Zhang, W.F.; Christie, P.; Goulding, K.W.T.; Vitousek, P.M.; Zhang, F.S. Significant Acidification in Major Chinese Croplands. Science 2010, 327, 1008–1010. [Google Scholar] [CrossRef] [PubMed]
  45. Turnbull, L.; Wainwright, J.; Brazier, R.E. A conceptual framework for understanding semi-arid land degradation: Ecohydrological interactions across multiple-space and time scales. Ecohydrology 2008, 1, 23–34. [Google Scholar] [CrossRef]
  46. Bai, J.; Deng, W.; Zhu, Y.; Wang, Q. Spatial variability of nitrogen in soils from land/Inland water ecotones. Commun. Soil Sci. Plant Anal. 2004, 35, 735–749. [Google Scholar] [CrossRef]
  47. Suescun, D.; Villegas, J.; Leon, J.D.; Florez, C.P.; Garcia-Leoz, V.; Correa-Londono, G.A. Vegetation cover and rainfall seasonality impact nutrient loss via runoff and erosion in the Colombian Andes. Reg. Environ. Change 2017, 17, 827–839. [Google Scholar] [CrossRef]
  48. Jencso, K.G.; Mcglynn, B.L.; Gooseff, M.N.; Wondzell, S.M.; Bencala, K.E.; Marshall, L.A. Hydrologic connectivity between landscapes and streams: Transferring reach-and plot-scale understanding to the catchment scale. Water Resour. Res. 2009, 45, W04428. [Google Scholar] [CrossRef]
  49. Saco, P.M.; Rodríguez, J.; Heras, M.; Keesstra, S.D.; Rossi, M.J.J.C. Using hydrological connectivity to detect transitions and degradation thresholds: Applications to dryland systems. Catena 2020, 186, 104354. [Google Scholar] [CrossRef]
  50. Lin, C.; Ma, R.H.; Xiong, J.F. Can the watershed non-point phosphorus pollution be interpreted by critical soil properties? A new insight of different soil P states. Sci. Total Environ. 2018, 628, 870–881. [Google Scholar] [CrossRef]
  51. Chardon, W.J.; Schoumans, O.F. Soil texture effects on the transport of phosphorus from agricultural land in river deltas of Northern Belgium, The Netherlands and North-West Germany. Soil Use Manag. 2007, 23, 16–24. [Google Scholar] [CrossRef]
  52. Lisi, P.J.; Hein, C.L. Eutrophication drives divergent water clarity responses to decadal variation in lake level. Limnol. Oceanogr. 2019, 64, S49–S59. [Google Scholar] [CrossRef]
  53. Liu, X.; Zhang, Y.; Han, W.; Tang, A.; Shen, J.; Cui, Z.; Vitousek, P.; Erisman, J.W.; Goulding, K.; Christie, P. Enhanced nitrogen deposition over China. Nature 2013, 494, 459–462. [Google Scholar] [CrossRef]
  54. Catherine, M.O.; Sapna, S.; Derek, K.G. Rapid and highly variable warming of lake surface waters around the globe. Geophys. Res. Lett. 2015, 42, 10773–10781. [Google Scholar]
  55. Vitousek, P.M.; Porder, S.; Houlton, B.Z.; Chadwick, O.A. Terrestrial phosphorus limitation: Mechanisms, implications, and nitrogen–phosphorus interactions. Ecol. Appl. 2010, 20, 5–15. [Google Scholar] [CrossRef] [PubMed]
  56. Salmaso, N.; Anneville, O.; Straile, D.; Viaroli, P. European large perialpine lakes under anthropogenic pressures and climate change: Present status, research gaps and future challenges. Hydrobiologia 2018, 824, 1–32. [Google Scholar] [CrossRef]
  57. Shen, Z.; Chen, L.; Hong, Q.; Qiu, J.; Xie, H.; Liu, R. Assessment of nitrogen and phosphorus loads and causal factors from different land use and soil types in the Three Gorges Reservoir Area. Sci. Total Environ. 2013, 454, 383–392. [Google Scholar] [CrossRef]
  58. Xin, Y.; Liu, G.; Xie, Y.; Gao, Y.; Liu, B.; Shen, B. Effects of soil conservation practices on soil losses from slope farmland in northeastern China using runoff plot data. Catena 2019, 174, 417–424. [Google Scholar] [CrossRef]
  59. Chung, S.O.; Kim, H.S.; Kim, J.S. Model development for nutrient loading from paddy rice fields. Agric. Water Manag. 2003, 62, 1–17. [Google Scholar] [CrossRef]
  60. Rehman, K.; Imran, A.; Amin, I.; Afzal, M. Enhancement of oil field-produced wastewater remediation by bacterially-augmented floating treatment wetlands. Chemosphere 2019, 217, 576–583. [Google Scholar] [CrossRef]
  61. Niu, J.; Zhang, P.; Xing, M. Characteristics of soil erosion in purple soil slope cultivated land in the upper reaches of the Yangtze River and its prevention and control measures. J. Soil Water Conserv. 2010, 8, 64–68. [Google Scholar]
  62. Kwong, K.F.N.K.; Bholah, A.; Volcy, L.; Pynee, K. Nitrogen and phosphorus transport by surface runoff from a silty clay loam soil under sugarcane in the humid tropical environment of Mauritius. Agric. Ecosyst. Environ. 2002, 91, 147–157. [Google Scholar] [CrossRef]
Figure 1. Overview map of the study area. Note: The Roman numerals represent various river basins, and the green dots represent the locations of water quality monitoring stations.
Water 17 00512 g001
Figure 2. Land-use type map.
Water 17 00512 g002
Figure 3. Spatial distribution map of fertilization amount.
Water 17 00512 g003
Figure 4. Spatial distribution of annual average concentrations. (a) TN; (b) TP.
Water 17 00512 g004
Figure 5. Statistical map of total nitrogen concentration values within each watershed.
Water 17 00512 g005
Figure 6. Statistical map of total phosphorus concentration values within each watershed.
Water 17 00512 g006
Figure 7. Seasonal spatial changes of total nitrogen concentration. Note: The size of the pie charts in the figure represents the number of observation stations in each river basin.
Water 17 00512 g007
Figure 8. Seasonal spatial changes of total phosphorus concentrations. Note: The size of the pie charts in the figure represents the number of observation stations in each river basin.
Water 17 00512 g008
Figure 9. Seasonal plot of total nitrogen concentration.
Water 17 00512 g009
Figure 10. Seasonal plot of total phosphorus concentrations.
Water 17 00512 g010
Figure 11. Spatial distribution of clustering results. (a) TN; (b) TP.
Water 17 00512 g011
Figure 12. Total nitrogen clustering.Note:Some of the data in this graph may be increased by more than 100% due to rounding.
Water 17 00512 g012
Figure 13. Total phosphorus clustering.
Water 17 00512 g013
Figure 14. Impacts of the natural and anthropogenic drivers of TP and TN changes in nine watersheds in China and evaluation of the contribution rate. Note: V1: farmland; V2: woodland; V3: grassland; V4: water; V5: residential; V6: unused land; V7: land use; V8: population density; V9: fertilizer application; V10: soil type; V11: elevation; V12: rainfall. (a) Ranking of the contribution of the TP random forest indicator. (b) Ranking of the contribution of the TN random forest indicator.
Water 17 00512 g014
Figure 15. Distribution of TN concentration by land use.
Water 17 00512 g015
Figure 16. Distribution of TP concentrations by land use.
Water 17 00512 g016
Figure 17. Spatial distribution of regression coefficients of GWR model for urban TN.
Water 17 00512 g017
Figure 18. Spatial distribution of regression coefficients of GWR model for TP in urban areas.
Water 17 00512 g018
Table 1. Summary of TN statistics for each river basin.
NameNo. StationsBasin Area
(104 km2)
Average
(mg/L)
Max
(mg/L)
Min
(mg/L)
Std
(mg/L)
Number of
Measurements
Northern inland and Xinjiang rivers8333.891.832.571.360.5196
Northeast river basins100124.924.5718.040.402.781200
Rivers along the southeast coast114241.994.850.230.941368
Haihe River12331.84.6811.590.542.531476
Huaihe River17927.53.6523.300.613.002148
Yellow River9379.54.7732.740.474.151116
Southwest international river basins3485.141.788.990.331.79408
Yangtze River5541801.9811.960.321.106648
Pearl River14645.372.409.530.121.371752
Table 2. Summary of TP statistics for each river basin.
NameNo. StationsBasin Area
(104 km2)
Average
(mg/L)
Max
(mg/L)
Min
(mg/L)
Std
(mg/L)
Number of
Measurements
Northern inland and Xinjiang rivers8333.890.0120.0270.0050.00796
Northeast river basins100124.920.0880.2370.0060.0561200
Rivers along the southeast coast114240.0770.3770.0100.0531368
Haihe River12331.80.0750.2860.0050.0561476
Huaihe River17927.50.0980.4210.0070.0532148
Yellow River9379.50.0700.2710.0050.0591116
Southwest international river basins3485.140.0690.4950.0070.095408
Yangtze River5541800.0690.3520.0060.0456648
Pearl River14645.370.0640.2490.0050.0501752
Table 3. The seasonal and annual average precipitation of each river basin.
NameSpringSummerAutumnWinterAnnual
Northern inland and Xinjiang rivers2712634448
Northeast river basins9851421420211
Rivers along the southeast coast636819296214496
Haihe River6254515615195
Huaihe River16561221665266
Yellow River9836118921168
Southwest international river basins21469028677318
Yangtze River403579237128338
Pearl River482809259176436
Table 4. The results of the GWR model diagnostic information.
AICcR2Adjusted R2Bandwidth
Basin TN123.7770.6210.44917.54
Basin TP135.8940.3880.16768.5
Province TN111.2960.363−0.1167.45
Province TP103.230.5280.17767.45
City TN771.7480.2760.2067.48
Downtown TP758.8140.3170.2477.08
Table 5. Diagnostic information for the MGWR model of TN.
VariableMeanSTDMinMedianMax
Intercept 0.002 0.007 −0.019 0.004 0.012
Dem −0.399 0.019 −0.429 −0.4 −0.362
Rainfall −0.469 0.066 −0.586 −0.484 −0.315
Population Density −0.216 0.037 −0.28 −0.217 −0.129
Fertilization −0.133 0.055 −0.235 −0.14 −0.036
Soil type −0.126 0.042 −0.2 −0.137 −0.021
Farmland 0.106 0.081 −0.017 0.106 0.285
Woodland 0.038 0.065 −0.096 0.029 0.172
Grassland 0.061 0.024 0.019 0.057 0.113
Water 0.126 0.072 −0.029 0.133 0.279
Residential 0.357 0.03 0.307 0.358 0.423
Table 6. Diagnostic information for the MGWR model of TP.
VariableMeanSTDMinMedianMax
Intercept00.001−0.00200.001
Dem−0.4920.004−0.501−0.491−0.485
Rainfall0.1820.0050.1710.1820.191
Population Density−0.2780.002−0.282−0.279−0.276
Fertilization−0.0390.001−0.042−0.039−0.037
Soil type−0.0850.003−0.092−0.085−0.079
Farmland−0.2570.003−0.265−0.257−0.250
Woodland0.10300.1020.1030.104
Grassland−0.140 0.004−0.149−0.140 −0.133
Water0.0540.0010.0520.0540.057
Residential0.2120.0020.208 0.2120.217
Disclaimer/Publisher’s Note: The statements, opinions and data contained in all publications are solely those of the individual author(s) and contributor(s) and not of MDPI and/or the editor(s). MDPI and/or the editor(s) disclaim responsibility for any injury to people or property resulting from any ideas, methods, instructions or products referred to in the content.

