Article

Mitigating Nitrous Oxide Emission from a Lab-Scale Membrane-Aerated Biofilm Reactor

1
OxyMem Ltd., Unit F, Moydrum Business Park, N37 DR79 Athlone, Westmeath, Ireland
2
School of Chemical and Bioprocess Engineering, University College Dublin, D04 V1W8 Dublin, Ireland
*
Author to whom correspondence should be addressed.
Water 2025, 17(4), 500; https://doi.org/10.3390/w17040500
Submission received: 13 December 2024 / Revised: 14 January 2025 / Accepted: 22 January 2025 / Published: 11 February 2025
(This article belongs to the Section Wastewater Treatment and Reuse)

Abstract

:
The membrane-aerated biofilm reactor (MABR) is an emerging technology for the biological treatment of wastewaters. It can achieve simultaneous nitrification and denitrification due to anoxic liquid conditions. The counter diffusion of oxygen and nutrients in the biofilm allows for aerobic and anoxic layers, providing conditions where the formation, accumulation and consumption of nitrous oxide can all occur. The microbial processes involved in the production and consumption of N2O are complex, and, due to the innovative nature of the MABR, understanding the influence of operational factors helps to minimise N2O emission. Using a lab-scale 20L MABR system, an investigation was carried out to determine the influence of operational factors on the emission of nitrous oxide from the reactor. A direct link between the nitrous oxide emissions and bulk liquid conditions could not be established with only limited statistical correlation between them. It was found that under both steady loading rates and transient conditions, the emission of nitrous oxide was most influenced by the air flow rate through the membranes. The majority of N2O emissions occurred via the membrane off-gas and not through the liquid. N2O flux through the membrane was influenced not only by the accumulation of N2O in the biofilm side but also by the gas residence time on the lumen side. Therefore, minimising the air flow rate is an effective strategy to mitigate nitrous oxide emissions from the MABR.

1. Introduction

Climate change is one of the major challenges facing the world today. The IPCC report published in February 2022 details the impacts which climate change will have on the world around us even if we keep the temperature rise to 1.5 °C. CO2 emissions are the largest greenhouse gas (GHG) offender, while other compounds with higher global warming potential (methane, nitrous oxide and fluorinated gases) are also of scientific interest. Among these, nitrous oxide (N2O), which has a global warming potential 265 times greater than CO2, was found to account for 6% of the total GHG emissions [1], making even low emissions of concern.
Nitrous oxide is produced during the natural nitrogen cycle and during biological nitrogen removal in wastewater treatment plants (WWTPs). Estimates suggest that 1.1% of the total nitrogen load entering a wastewater treatment plant is emitted as N2O [2]. Critical reviews have concluded that there is a direct relationship between N2O emissions and total nitrogen removal efficiencies in WWTPs [3]. This significance has led to N2O being included in the list of greenhouse gasses that require monitoring in all WWTPs for a population of over 10,000 in the recently updated Europe Urban Wastewater Treatment Directive [4]. Our understanding of the nitrification process has evolved since its discovery in the late 19th century. For a long time, a two-step model was used to describe ammonium oxidation to nitrite and then nitrate by distinct groups of autotrophic microbes. Hydroxylamine was proven to be an intermediate of ammonium oxidation only in the 1950s [5]. The formation of N2O as a by-product in the processes of the nitrogen cycle was confirmed in multiple studies into wastewater treatment applications [6]. The key conditions resulting in elevated N2O emissions have been identified as low DO concentrations in the nitrification and denitrification stages, high nitrite concentrations in nitrification and denitrification stages and a low availability of carbon substrate for denitrification [6]. Several models have been proposed and verified with experimental data for multiple possible pathways [7,8,9,10].
The oxidation of ammonium to nitrite takes place in two steps (Figure 1). First, ammonium is oxidised to hydroxylamine catalysed by the ammonia monooxygenase enzyme. Hydroxylamine is further oxidised to nitrite catalysed by the hydroxylamine oxidoreductase enzyme. Nitrous oxide can be formed in two ways during this process: (1) via the incomplete oxidation of hydroxylamine, where it is formed as a chemical or biological by-product; (2) via autotrophic denitrification, where nitrite acts as an electron acceptor instead of oxygen [11]. The heterotrophic denitrification of nitrate to nitrogen gas happens in four steps, with nitrous oxide being an intermediate of the process. Incomplete denitrification can occur when low concentrations of dissolved oxygen are present or the ratio of COD to N is low [12], leading to the accumulation of N2O.
Nitrous oxide emissions from biofilm processes have received less attention than the more common activated sludge process [14]; however, the increase in the use of fixed film [15,16] and granular technologies [17], particularly for nitrogen removal applications, has prompted further scientific investigation. In a modelling study, nitrous oxide formation in co- and counter-diffusional biofilms was investigated by Ni et al. [18]; the results suggested that the use of a membrane-aerated biofilm can mitigate nitrous oxide emissions compared to conventional attached growth processes. It was also found that intermittent aeration, and the proliferation of the Anammox bacteria, could efficiently reduce both NO and N2O emissions. Simulation studies revealed a strong correlation between nitrous oxide emission and nitrogen removal efficiency in autotrophic nitrogen removal in an MABRs [19]. Sabba et al. published a comprehensive update on the current understanding of nitrous oxide production in biofilms [20], outlining how changing dissolved oxygen concentration in either space or time is one of the main conditions responsible for increased N2O production. The transient zone between aerobic and anoxic zones can be a hotspot for nitrous oxide production. High reaction rates in the biofilm can also promote increased N2O production due to a more significant accumulation of intermediates like NO and NH2OH. The thickness and population stratification of the biofilm has an important role, resulting in different nitrous oxide production rates under the same bulk liquid conditions. Heterotrophic denitrification can be a major sink for N2O within the biofilm, and the factors potentially limiting denitrification (biofilm thickness, rbCOD availability and DO concentration) can influence the emissions greatly. Counter-diffusional biofilms may have an advantage over co-diffusional biofilms in utilising denitrification as an N2O sink due to their different layering [21]. However, it is acknowledged that stripping of N2O via the membrane is a possibility in counter-diffusional biofilms. Full-scale investigations have confirmed this, showing that the N2O emissions in hybrid MABRs are primarily from the membrane off-gas [22] with N2O emissions rate following the pattern of the ammonia load and concentration. Liquid emissions are also not insignificant and are influenced by extreme events. Other studies have shown that nitrous oxide production is influenced by fast-changing conditions, e.g., shock loads, oxygen depletion or elevated nitrite concentration, resulting in increased N2O emissions [6]. A recent review of many novel technologies for wastewater treatment concluded that while processes have their individual strengths, denitrification acts as an N2O sink [23], indicating that simultaneous nitrification and denitrification may be advantageous over systems with these processes taking place in individual tanks. With the increasing popularity of MABR upgrades to improve the nitrogen removal capacity of existing WWTPs, there is a need to expand the understanding of N2O emissions from an MABR.
Previous research has quantified emissions from MABRs operating with Returned Activated Sludge (RAS) in suspension and investigated N2O production in conventional biofilm systems. This study investigates how changes in operating factors such as nutrient concentrations, dynamic loading conditions (common in real wastewater treatment plants) and oxygen supply can influence the rate of N2O emissions from a biofilm in an MABR. Unlike studies in real-world conditions, this work uses synthetic wastewater to ensure that the nutrient loading is controlled and not subject to external variation. This ensures accurate correlation between the operational factors and N2O emissions. This work builds on the scientific understanding of N2O emissions from biofilm processes, specifically counter-current biofilms.

2. Materials and Methods

The reactor consisted of a plastic tank with a working volume of 20L and a rectangular footprint that housed the membrane (Figure 2). Feeding of the reactor was carried out by two peristaltic pumps, one (Watson-Marlow 120S/DV, Cornwall, UK) for the concentrated synthetic wastewater and the other (Watson Marlow 604S, Cornwall, UK) for the dilution water. Both peristaltic pumps were equipped with flow controls. This way, the nutrient loading and the reactor hydraulic residence time (HRT) could be varied independently. The concentrated wastewater was refrigerated at 4 °C to minimise any variation over time.
Mixing was carried out to minimise concentration gradients in the reactor and decrease boundary layer thickness at the biofilm surface. Two modes of mixing were provided in the reactor: (1) Liquid was drawn from the bottom of the reactor into a recirculation pump (Jebao DCT-8000, 68 W, Zhongshan, China) and returned to the liquid surface. The recirculation line included a flow cell to accommodate on-line monitoring sensors. (2) A submersible mixer (Newave 3.9, 5.2 W, Shantou, China) was located inside the reactor between the two cassettes, just below the liquid surface. While the reactor tank was originally designed for four membrane cassettes, only two cassettes were used in this experiment. This allowed the installation of the submersible mixer between the cassettes. Temperature in the reactor was maintained at 21 ± 1.5 °C by a silicone heating pad.

2.1. Membranes and Modules

Cylindrical silicone hollow fibre membranes (provided by OxyMem Ltd., Athlone, Ireland) with an outer diameter of 0.51 mm and an internal dimeter of 0.3 mm were used both to provide oxygen and as the surface for biofilm growth. Fibres were 0.4 m in length and arranged into bunches of 550 fibres. Each cassette consisted of 10 membrane bunches. The membrane fibres were supplied with air by a small aquarium air pump. The system also consisted of a scour blower (NittoDenko LA-28, Osaka, Japan), which provided air to a coarse air bubble scouring system beneath the cassettes. This operated when required (on average once per week) to remove excess biofilm from the membrane fibres. The agitation caused by the bubbles created high shear conditions around the membranes, which resulted in the sloughing of excess biomass.

2.2. Process Monitoring

Liquid samples from the reactor were taken several times a week; they were passed through 0.45 µm syringe filters and subsequently analysed with cuvette tests (Hach LCK) and a spectrophotometer (Hach DR1900, Berlin, Germany). Ammonium, nitrite and nitrate concentrations were monitored with on-line probes (WTW AmmoLyt 700 IQ and WTW NitraVis 705 IQ NI, Weilheim, Germany) located in the recirculation line. These were connected to a monitoring module (DIQ/S 182 XT-4, WTW, Weilheim, Germany), which transmitted the data to the PLC (Unitronics, Ben Gurion Airport, Israel). The off-line measurements were used to check the sensors’ accuracy and readjust their calibration if necessary. The flow rate and pressure of air in the membranes were controlled by a needle valve located at the gas outlet. The flow rate (Burket, Ingelfingen, Germany) and pressure (Norgren, Litchfield, UK) of air into and out of the membranes was measured and the concentration of O2, CO2 (Ntron, Midox, Navan, Ireland) and N2O (ATI-D12, Saddleworth, UK) were all measured in the outlet gas from the membrane modules.
The exhaust air was dehumidified before being passed to the gas analysers by passing it through a refrigerated moisture trap. All instruments were connected to the PLC, which recorded data and controlled the process.
Dissolved N2O concentration was measured using a novel method. The inner lumen of a bundle of clean membranes was connected in a closed loop to a vacuum pump, and the N2O gas analyser was placed in-line to this air flow. The bundle was immersed in the bulk liquid of the reactor, and air was circulated through the closed loop until the measured N2O concentration in the gas phase stabilised. The N2O concentration in the liquid could then be determined utilising Henrys law (Supplementary Materials).

2.3. Wastewater Feed

The reactor was fed continuously with synthetic wastewater. The composition of the concentrated wastewater was 19.6 mg/L sodium acetate (CH3COONa), 24.6 g/L ammonium bicarbonate (NH4HCO3), 0.365 g/L monopotassium phosphate (KH2O4P), 0.47 g/L sodium phosphate dibasic dihydrate (Na2HPO4 · 2H2O) and 4 g/L yeast extract (Marmite). The yeast extract served to compensate the otherwise one-sided organic substrate supply and provided a wide range of microelements to the biofilm. The concentration of sodium acetate was varied when the COD:N ratio of the wastewater was changed. Additionally, micronutrients were added to the feedstock: 4.08 mg/L zinc sulphate (ZnSO4 · H2O), 2.86 mg/L manganese chloride (MnCl2), 0.59 mg/L nickel chloride (NiCl2), 4.72 mg/L cobalt chloride (CoCl2) and 1.40 mg/L sodium molybdate (Na2MoO4). The loading rate of the biofilm was controlled by adjusting the flow rate of the wastewater concentrate. The dilution water was supplied independently so the hydraulic residence time in the reactor remained constant at 11 h. The feed solution was stored in a refrigerator, and a new batch was prepared every 3 to 4 days to minimise variation and reduce biological growth in the feed.

2.4. Biofilm Removal

Excess biofilm was sloughed off using coarse bubbles via the scour system. Before carrying out the scour, the mixing was stopped, and the liquid level was reduced to prevent the overflow of the liquid in the reactor. Scour frequency and duration were varied according to the growth of the biofilm assessed with visual inspection and measurements; typically, this occurred once a week for 10 min. After the scour, the removed biomass was allowed to settle to the bottom of the reactor and removed via a sludge extraction pipe. Short periods of air flow to the scour system were used to induce coarse bubbles at adjustable intervals; these coarse bubbles helped to remove the small gas (nitrogen) bubbles that formed on the biofilm and could have impeded mass transfer from the bulk liquid to the biofilm. This burst of coarse bubbles also provided additional bulk liquid mixing but did not detach any biofilm.

3. Reactor Operation

3.1. Start Up

The reactor was seeded with activated sludge from a local municipal wastewater treatment plant. The sludge was placed in the reactor and mixed for two days before the flow of synthetic wastewater to the reactor was started. The flow washed out the suspended biomass from the reactor, encouraging the growth of the micro-organisms that had attached to the membrane. The reactor was operated for a period of three months at constant temperature, pH and nutrient loading before any experiments were conducted. This was to allow for biofilm development and maturation, reducing microbial population variation and consistent nutrient removal.

3.2. Transient Experiments

Transient experiments were carried out to study the system’s response to suddenly changing conditions. The lab-scale MABR system was subjected to COD and ammonium shock loads, step changes of COD loading, nitrogen loading and air flow rate. The monitoring of changes, which occurred during all transient experiments, was for 24 h, eliminating any influences of changes in biofilm composition.

3.3. COD Spike Experiment

In two instances, COD spikes (sodium acetate) were applied to elevate COD concentration in the bulk liquid from 35 mg/L to 90 mg/L. These tests were carried out after 3 months of operation. The biofilm contained filamentous organisms and a light growth of flocculent bacteria (as visually observed). Nitrite and nitrate concentrations were between 2 and 5 mg N/L at the start of these experiments.

3.4. Ammonium Spike Experiment

An ammonium spike experiment elevating the bulk liquid concentration from 23 mg N/L to 30 mg N/L was applied when bulk liquid nitrite and nitrate concentrations were both 0 mg N/L. This was carried out by adding a concentrated ammonia solution to the reactors.

3.5. Step Changes

Eight tests were carried out applying step changes to the nutrient loading of the system. This was achieved by changing the flow rate of the concentrated wastewater, while the flow rate of dilution water and thus the HRT remained unchanged. In six cases, loading was increased, and, in two cases, it was decreased.

3.6. Gas Flow Effects

Step changes in the supplied air flow rate were performed to investigate the short-term effects of changing oxygen supplied, without affecting the population distribution of micro-organisms in the biofilm. Eight changes were investigated: four events of increasing the gas flow and four of decreasing gas flow.

3.7. Steady Loading Conditions

After four months of operation, the loading to the reactor was held steady to investigate N2O production during periods of steady loading. While the loading to the reactors remained steady, the biofilm went through changes in appearance, thickness and most likely density and microbial composition, although the latter were not investigated in this study. During this time, deliberate changes to operating parameters were made. Four steady phases as characterised based on the nitrogen and COD loading applied to the biofilm (Table 1) were achieved beginning at Day 0. Initially, a nitrogen loading of 1.0 gN m−2d−1 was applied at a COD:N ratio of 3.5. On Day 20, the COD:N ratio was increased to 4.0 while maintaining the same nitrogen loading. The nitrogen loading was increased to 1.7 gN m−2d−1 on Day 73 while keeping the COD:N ratio at 4. On Day 100, nitrogen loading was decreased back to 1.0 gN m−2d−1.
Within these four phases, the air flow rate was changed between 0.004 and 0.320 Lmin−1 to investigate its effect on nitrification, denitrification and total nitrogen removal (inlet air flow rates shown in Supplementary Materials). Occasional operational issues, e.g., equipment malfunction, occurred during this time and prevented true steady-state operation. These were all rectified within 24 h.

4. Results and Discussion

4.1. Steady Loading Results

Concentrations of ammonia, nitrite and nitrate in the bulk liquid as well as N2O concentration in the off-gas for all four steady loading phases changed during the course of the investigation (Figure 3). During Phase 1, denitrification was incomplete, and high nitrite and nitrate concentrations were measured in the reactor (5–10 mg N L−1 of both). In Phase 2, a steady decrease in nitrite and nitrate concentrations occurred due to more carbon being available for denitrification. Eventually, complete denitrification was achieved. In Phase 3, the higher loading resulted in an increase in the ammonium concentration. While the air flow to the membranes was increased and the removal rate of ammonium rose correspondingly, the bulk liquid ammonia concentration also increased and reached over 35 mg N L−1. The removal efficiency of ammonium dropped from 62–85% to 48–68%. Complete denitrification was maintained during Phase 3. The denitrification occurring within the biofilm caused the formation of many small bubbles on the surface of the biofilm. The bubbles remained attached to the biofilm and reduced the biofilm-liquid contact significantly. The periodic removal of the bubbles was attempted using the coarse bubble scour system from Day 78. Short bursts of air were introduced, and, consequently, the total volume of retained bubbles decreased from 1.7 to below 0.5 L (see Supplementary Materials). During Phase 4, at reduced loading, ammonium concentration gradually decreased below 10 mg N L−1, while denitrification remained complete and nitrite and nitrate concentrations below 1 mg N L−1 were maintained. This changed after Day 142 when the air flow rate was increased. The concentration of nitrate, and later of nitrite, increased, and denitrification did not return to the previous levels despite lowering the air flow rate to the membranes.
Nitrification efficiency in Phase 1 and Phase 2 averaged at 71.6%, reaching over 80% on some days but dropping to 60% occasionally (Figure 4). This was slightly lower than results reported by Zhong et al. [24] of up to 90% nitrification at a C:N ratio of 5 and 70–75% at a C:N ratio of 3. By the end of Phase 2, the efficiency of nitrogen removal increased from the initial 30–60% to above 65% and was limited only by the degree of nitrification taking place, with most nitrite and nitrate being reduced, being in line with other results. During Phase 3, nitrification and nitrogen removal efficiency averaged at 60.3%, the minimum being 48.9%. Nitrification efficiency started to increase again in Phase 4 upon the reduction in nitrogen loading, and, by Day 144, it rose to 85–90%. By the end of the experiment, nitrification efficiency fell to 72–78%, and, at the same time, nitrogen removal rate deteriorated to 40–60%.
Nitrous oxide concentration in the off-gas varied over a wide range, from as low as 200 ppm to over 2000 ppm. The highest concentration was observed when operating with influent wastewater with a low COD:N ratio in Phase 1. Once the COD:N ratio was increased and denitrification improved, N2O concentration in the off-gas rarely exceeded 600 ppm. During Phase 2, it fell rapidly and then remained in the range of 350 and 550 ppm. In Phase 3, with the higher N and COD loading rate, values between 470 and 610 ppm were recorded. When the loading was decreased again for Phase 4, off-gas nitrous oxide concentration started falling continuously until Day 150 to a minimum of 260 ppm. A slight increase was observed after Day 153 with values changing between 270 and 360 ppm.

4.2. COD Spike Results

Immediately after the addition of the concentrated sodium acetate (carbon substrate), the oxygen flux began increasing, and, at the same time, the concentration of nitrite and nitrate started to fall. N2O concentration in the off-gas started rising (from 900 ppm to 1200 ppm in the first and from 800 ppm to 1100 ppm in the second test) at the same time that oxygen flux increased, and this increase continued for over 30 min (Figure 5). N2O concentration started falling again when the liquid nitrite concentration fell below approximately 1 mg N/L.

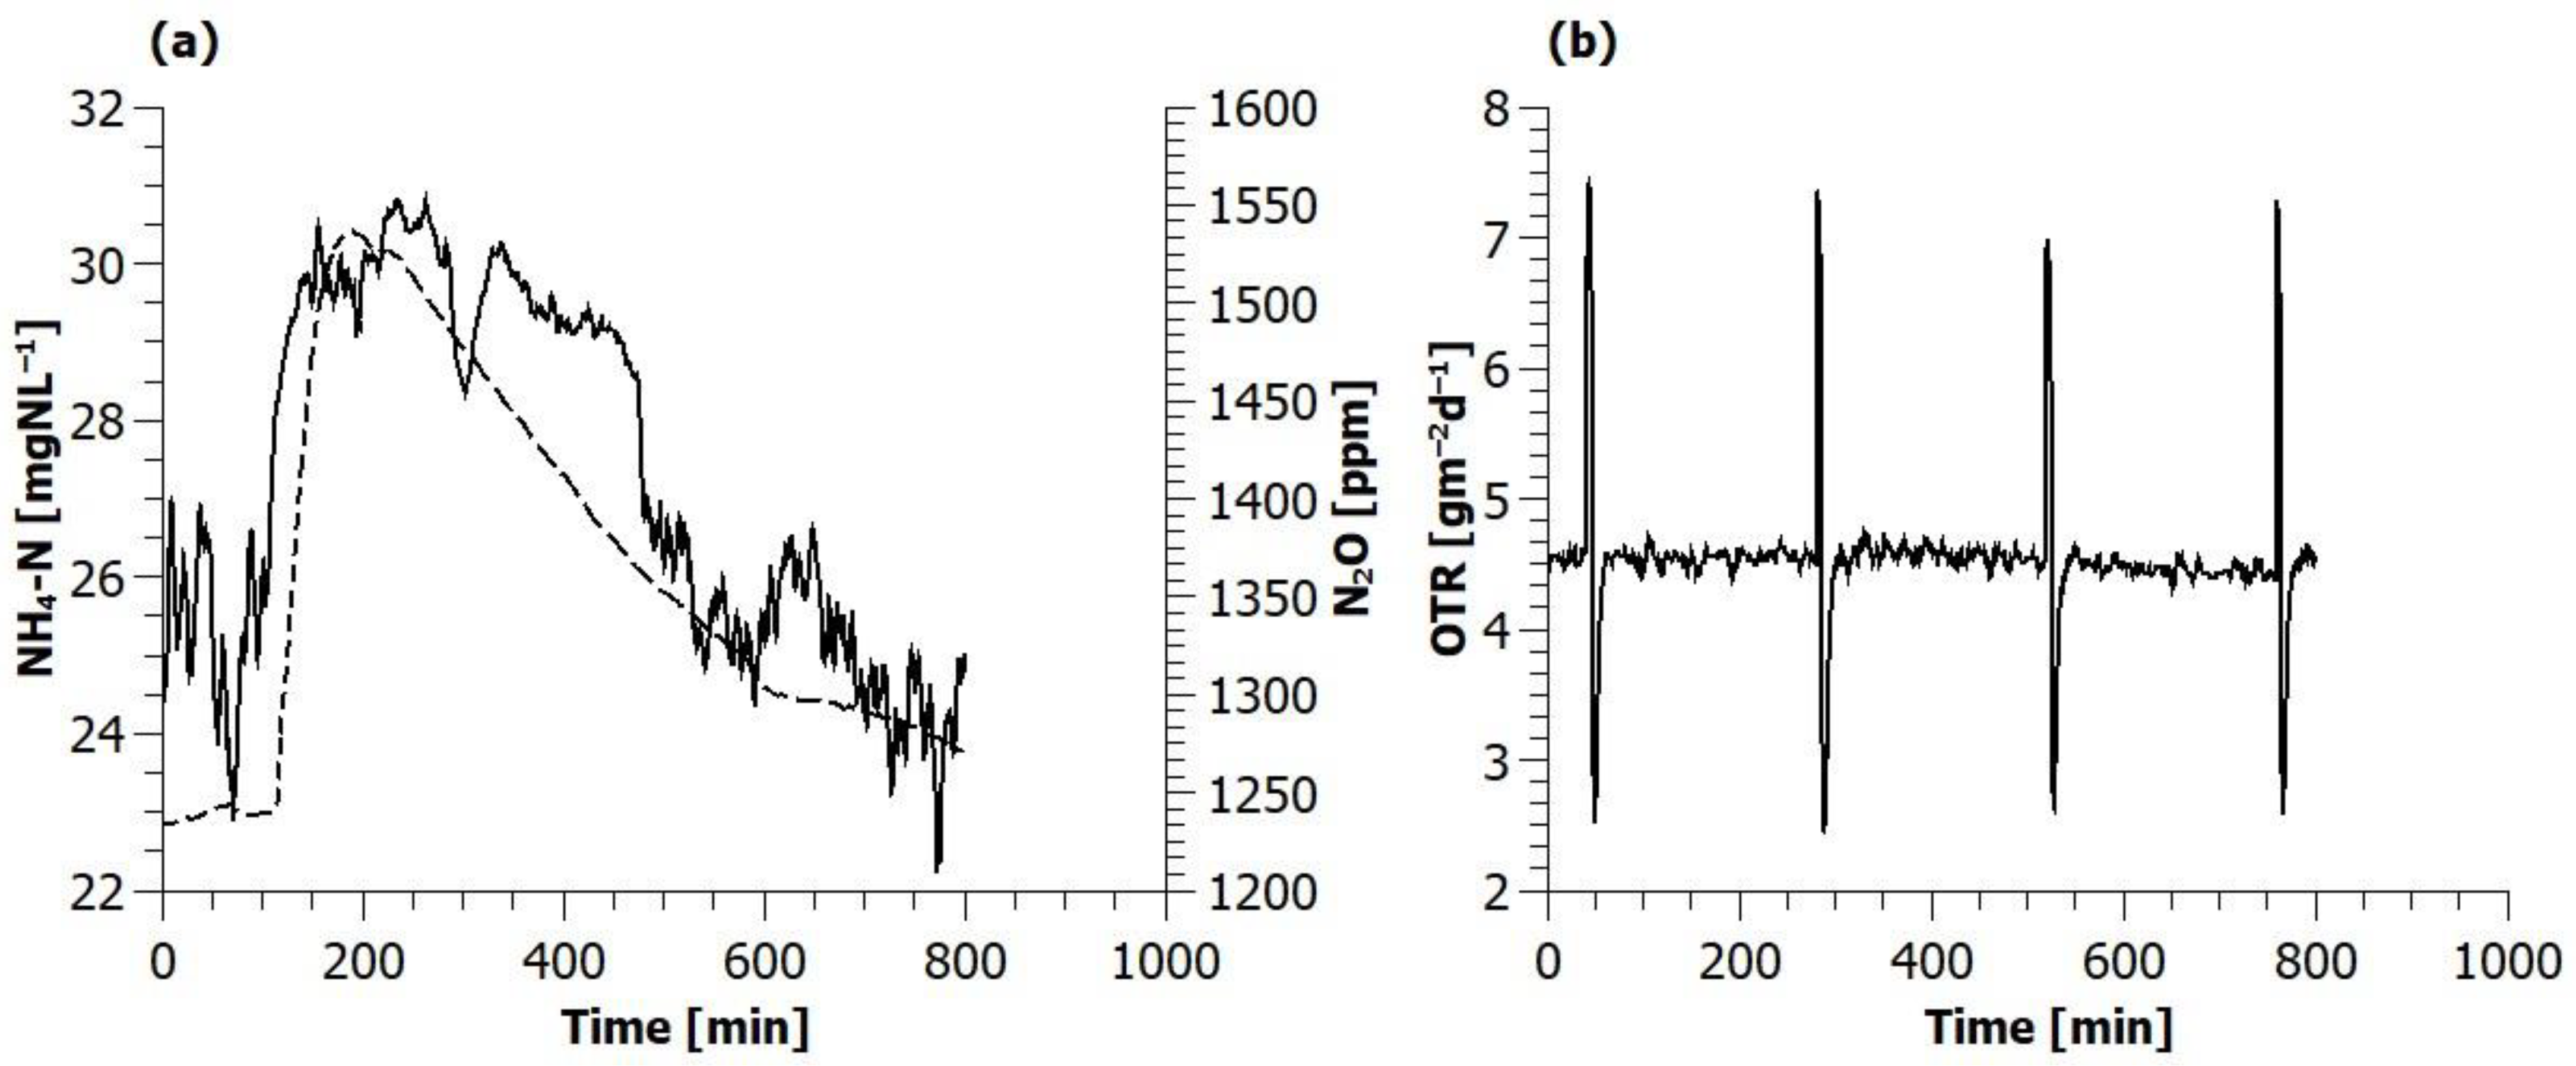
4.3. Ammonium Spike Results

The spike in ammonia concentration caused by the addition of concentration ammonia solution resulted in a transient increase in the off-gas N2O concentration from 1350 to 1550 ppm in 124 min; after which, it slowly fell back to the original level (Figure 6). No significant change in the oxygen flux could be observed

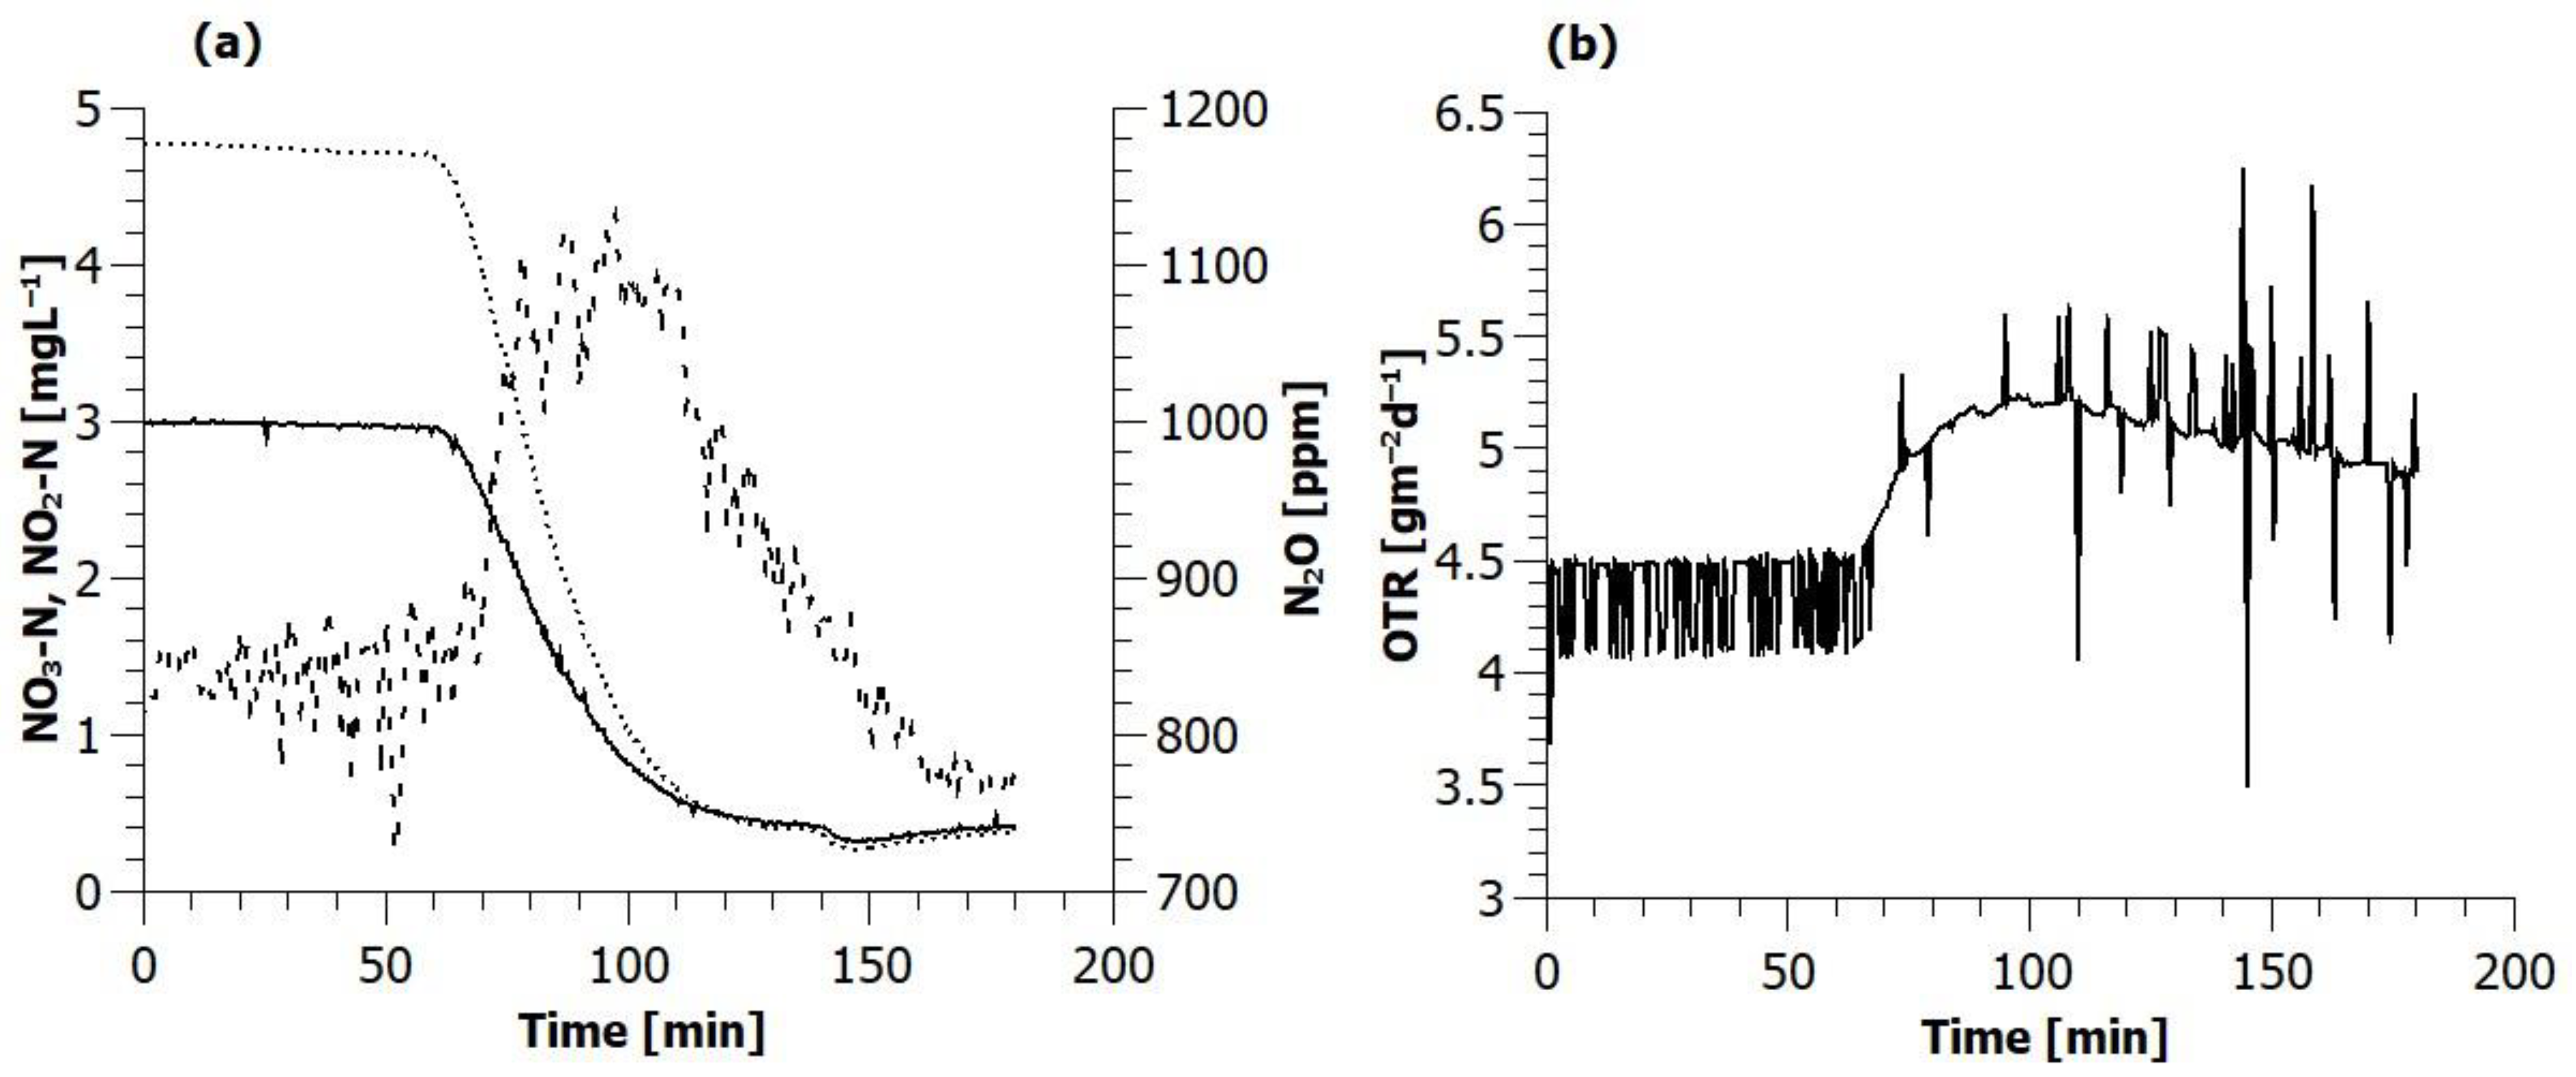
4.4. Step Change Results

Before applying the step change to the nutrient loading rate, the reactor was checked to ensure that the concentrations of dissolved nitrogen forms and off-gas nitrous oxide were stable for 1–3 h. Table 2 summarises the main testing conditions and results. The changed values of the parameters represent the extremes (maximum or minimum) reached in the duration of the test. Tests on Day 6 and 7 were carried out at the lower COD:N ratio of 3.57, while the rest were at 4.04. The last four rows show one of three possible outcomes according to whether the parameter increased (↗), remained unchanged (−) or decreased (↘) during the test. In most cases, a monotonic change of the parameters was observed during the experiments. In one instance, however (on Day 55), a temporary accumulation of nitrite occurred.

4.5. Step Air Flow Changes

As shown in Table 3, in all four cases when the flow rate was increased, a decrease in the off-gas N2O concentration could be observed. In one case, however (Day 83), a temporary increase was recorded after the flow rate was elevated. A decrease in the flow rate resulted in a rise of the N2O concentration on three out of the four occasions. A slight decrease was seen in the third case (Day 148), but the nitrous oxide concentration was not steady before changing the air flow rate; instead, it had been increasing continuously since a biofilm sloughing and excess biomass removal event earlier that day (Table 3).
The flow rate of the supplied air can influence the off-gas nitrous oxide concentration in two ways. Firstly, it can change the flux of oxygen transferred through the membrane and the concentration profile of dissolved oxygen in the biofilm. This impacts the activity of the biomass, and the location of various zones within the biofilm, and can result in changes of the environmental conditions of both nitrifying and denitrifying bacteria, which are immobilised within the film. Secondly, the flow rate of air affects the mass transfer between the gas and the outside of the membrane. A higher air flow rate can strip more nitrous oxide from the shell side as the nitrous oxide gas concentration remains lower due to the higher dilution. The fate of nitrous oxide within the biofilm can be altered as well, affecting the amount consumed in the anoxic layer or being transferred to the bulk liquid.

5. Discussion

5.1. Steady Loading Nitrous Oxide Production

Due to the variations that occurred during the operation of the reactor even under steady loading conditions, 56 periods were selected from the whole dataset. These periods were chosen based on the stability and reliability of the liquid and gas operating parameters and on-line measurements recorded. They represented the conditions where transient changes were not influencing the production of nitrous oxide. Average values from these periods were calculated for the on-line data collected at a 1/s frequency (represented by symbols on Figure 3a,b). Correlations between off-gas nitrous oxide concentration with dissolved ammonium, nitrite and nitrate concentration were investigated, along with air supply rate (Lair given in NLm−2d−1) and the ratio of the air supply rate to the area-specific nitrogen loading (Lair/LN given in NLgN−1). Using the Pearson correlation coefficient and the Spearman’s rank correlation coefficient (Spearman’s rho), statistical analysis was carried out to determine the factors contributing to nitrous oxide emissions. In previous studies, nitrous oxide production was found to depend mainly on the concentrations of ammonium [25], nitrite [26,27], dissolved oxygen [6,28] and aeration intensity [29,30], along with a combination of these factors [31]. Dissolved oxygen concentration is, however, location specific inside the biofilm and is close to zero in the bulk liquid of MABRs operated in a SND mode. The air supply rate was used instead since it has a direct effect on the oxygen profile inside the biofilm. Additionally, the ratio of Lair to LN was included in the analysis as these parameters were suggested to have a correlation to nitrogen removal and nitrous oxide production in membrane-aerated biofilms [19,32].
The Pearson correlation coefficients showed a weak linear relationship between the off-gas N2O content and nitrite concentration, and no significant linear relationship to the other parameters was detected (Figure 7). The value of Spearman’s rho was the highest for the ammonium concentration, indicating the highest degree of positive monotonic relationship with the off-gas N2O concentration.
When the same analysis is carried out for the nitrous oxide transfer rate (gN m−2d−1) equalling the average flux of nitrous oxide across the membrane, a very different picture is obtained (Figure 8). Correlation with NH4-N concentration becomes negligible, and the highest correlation is with the air supply rate both in terms of linearity and monotonicity.
While a complete picture of the fate of N2O cannot be given without simultaneously monitoring its concentration in both the liquid and the gas phase, the occasional measurements of the dissolved N2O concentration in the liquid may help to understand the interrelations in this complex phenomenon. The flux of nitrous oxide through the membrane and through the liquid boundary layer was calculated from the gas and liquid flow rates and their N2O content (the loss of N2O from the liquid through the reactor surface was neglected). Nitrous oxide emission via the process gas flow accounted for 80.2–91.1% of the total emissions. Emission via the liquid was only slightly influenced by the changing air flow rate in contrast with the air supply rate’s significant effect on the off-gas nitrous oxide emission. As a net effect, an overall increase in the total production (emission via the off-gas and the liquid) could be observed at increasing air supply rates. More in-depth information would be necessary to determine the exact reasons behind the observed trend, but the current knowledge of nitrous oxide production and consumption processes allows some possible explanations.

5.2. Effect of Mass Transfer

In a counter-diffusional biofilm, nitrous oxide can go in two directions from the location of production: towards the outer layer of the biofilm and eventually the bulk liquid, or towards the membrane and the gas phase (Figure S2). Flux through the membrane will be increased by increasing the concentration gradient, which is a result of lower off-gas N2O concentration due to the dilution by a higher air flow rate. If the rate of production is constant, the increased flux in one direction will reduce flux in opposite direction [33]. This can affect the net emission rate in cases where the outer layer of the biofilm is anoxic and consumes a significant amount of the nitrous oxide that enters this region. A schematic of this bi-directional diffusion can be observed in Figure S2. Previous research has shown that mass transfer limitations have a larger impact on reaction rates than changes in microbial composition, which are very slow in a mature biofilm [34].

5.3. Effect of Substrate Concentration Profiles

Changing the air supply rate will have direct effects on the biological reaction rates. An altered dissolved oxygen concentration profile would affect nitrification rate, COD oxidation rate and denitrification rate [35] and, through direct and indirect effects, can potentially influence any of the known biological pathways of nitrous oxide formation. The biofilm can be modelled as a diffusion–reaction system, and the two effects cannot be separated.

5.4. Change of Production by Autotrophs

The production of N2O by autotrophs depends on the concentration and relative amount of dissolved oxygen, ammonium and nitrite and is a function of the growth rate of the ammonium-oxidising organisms. Only a bulk liquid concentration of these components was measured, so conditions within the biofilm can only be speculated about. The increasing oxygen concentration resulting from an elevated air supply rate could increase the nitrification rate, lowering ammonium concentration and increasing nitrite concentration at the base of the biofilm. The hydroxylamine oxidation and autotrophic denitrification pathways are possibly affected differently by DO concentration [9].

5.5. Change of Production/Consumption by Heterotrophs

By increasing the air supply rate, the penetration depth of oxygen into the biofilm increases. This can lead to micro-oxic conditions, which favour the accumulation of nitrous oxide during the denitrification process [36]. The role of denitrification in influencing nitrous oxide production in counter-diffusional biofilms has been previously studied by Kinh et al. [21]. It was argued that the significantly lower nitrous oxide concentration in the bulk liquid of the MABR was the result of the optimal relative locations of the nitrifying and denitrifying bacteria in the counter-diffusional biofilm. The concentration profile measurement of N2O in the biofilms showed a net consumption in the outer anoxic region, and the analysis of functional gene abundance profiles also indicated N2O reducing activity in the zone between 200 and 1500 μm from the membrane–biofilm interface (corresponding to the depth profile of N2O production and consumption rates). The flux of N2O across the membrane and emission via the gas phase was not quantified as it was found that the concentration in the off-gas could not be distinguished from ambient atmospheric levels. Seemingly contradicting the findings of this study, two possible explanations could be offered. In the study of Kinh et al., the thickness of the gas permeable silicone membrane was significantly higher (1000 μm and 100 μm), increasing the mass transfer resistance and reducing the flux of nitrous oxide. At the same time, the membrane surface-area-specific air flow rate was considerably higher (4.82 Lm−2min−1 compared to a maximum of 0.043 Lm−2min−1), resulting in a high dilution rate and decreasing the chance of detecting nitrous oxide emission via the off-gas. Despite the uncertainty regarding the nitrous oxide mass balance, the role of denitrifying bacteria was demonstrated. Consequently, our suggestion that an increased dissolved concentration in the normally anoxic region of the biofilm affects the fate and net production of nitrous oxide in the counter-diffusional biofilm is justifiable.
To better isolate the effects of mass transfer and substrate concentration profiles, it would be possible to use prepared gas mixtures instead of atmospheric air as the process gas. By varying the partial pressure of oxygen only while keeping the flow rate of gas stable, the effect of the changing oxygen flux through the membrane could be determined. To some extent, this effect could be replicated by changing the operating pressure while maintaining the gas retention time.

5.6. Nitrous Oxide Production Under Transient Conditions

The increase in bulk liquid COD concentration could have two effects on the biological processes involving nitrous oxide. Firstly, the rate of denitrification in the anoxic zone increased, as indicated by the rapidly dropping nitrite and nitrate concentration. This can influence both the production and consumption of N2O by heterotrophs; how its accumulation is affected depends on the associated DO concentration as well. The elevated concentration of COD also means that the penetration of organic substrates into the aerobic layer of the biofilm is increased. Here, the competition between nitrifiers and heterotrophs for oxygen becomes more severe, and DO concentration in the biofilm decreases, shown by the increasing oxygen transfer rate and decreasing off-gas oxygen content. The drop of DO concentration directly affects the nitrifying bacteria and can lead to a transient increase in nitrous oxide concentration, as shown by earlier studies [6,25]. This has been connected to nitrite accumulation under oxygen-limited conditions, which is not the case in this study, as a relatively high nitrite concentration was already present. However, it is possible that nitrous oxide production was increased via the nitrifier denitrification pathway as a consequence of low DO concentration. The off-gas nitrous oxide concentration started decreasing again when the concentration of nitrite in the bulk liquid dropped below 1.0 mg/L, highlighting its role in N2O production during dynamically changing conditions in the MABR.
The results of the ammonium spike experiment suggest that the ammonium oxidation rate was minimally affected by the increased concentration. There was no nitrite or nitrate present in the bulk liquid, but the total nitrogen removal efficiency of 59% at the beginning of the test evidenced their production and presence in the aerobic layer of the biofilm. These results are insufficient to shed light on the interactions of the various mechanisms of nitrous oxide production under the prevailing conditions (hydroxyl-amine oxidation, nitrifier denitrification and abiotic production) since all are likely to be influenced by changes in ammonium concentration. A more targeted investigation would be possible by using hydroxylamine instead of ammonium and measuring the concentration profile of the nitrogen species and dissolved oxygen within the biofilm (although the latter may not be practicable under rapidly changing conditions).
Step changes of the surface-area-specific loading rate resulted in mixed results regarding their effect on the off-gas nitrous oxide concentration. In five out of eight experiments, the correlation was positive; in two cases, it was negative; and in one case, no change in the N2O concentration could be observed. Negative correlations were observed only when the load was increased, not when it was decreased. The continuously recorded data reveal a possible explanation of why different reactions were obtained. In the tests carried out on Days 6 and 7 (resulting in opposite correlations), there was a difference in the concentrations of ammonium, nitrite and nitrate at the beginning of the test. A lower initial ammonium, but higher nitrite and nitrate concentration, on Day 6 resulted in an increase in the nitrous oxide concentration upon the step increase in the loading, while a higher ammonium concentration, and at the same time lower nitrite and nitrate concentration, meant that the same step increase had the opposite effect. In this case, it is possible that, on Day 6, the concentration of nitrite was sufficiently high to facilitate more production of N2O once the ammonium concentration was elevated. On Day 7, the nitrite concentration may have been limiting for nitrous oxide production. A decrease in nitrate concentration was evident and corresponded to the change in nitrous oxide concentration, while nitrite concentration changed more slowly. Wunderlin et al. [36] observed that the influence of ammonium concentration on nitrous oxide production can depend on DO concentration in batch experiments carried out with activated sludge, but both of the experiments were carried out in the same range of the NH4-N concentration of 0–23 mgNL−1, preventing a more direct comparison to some of the data produced in this study. There was a difference in the nitrite concentrations, however, with lower values reached at a lower DO concentration (0–20 and 0–10 mgNL−1). This may have contributed to the limited correlation between ammonium concentration and nitrous oxide production. When ammonium and acetate were added simultaneously to create SND conditions, they found a strong correlation between nitrite concentration and nitrous oxide production, while the impact of ammonium concentration was insignificant. In the present study, evidence for the influence of nitrite can be found in the data from Day 55 where a continuously rising ammonium concentration was paired with a transient increase in nitrite. The decrease in nitrite concentration following a peak caused the increase in nitrous oxide emission to come to a halt and even a minor decrease before increasing again.
On Day 34, a similar scenario took place, but the loading was changed by less (from 1.0 to 2.0 instead of 3.0 gN m−2d−1), and the reduction in nitrite concentration was also smaller (6.7 to 6.1 mgL−1). This may be the cause why the same trend was not observed and why no change in the nitrous oxide production could be detected.
On Days 54 and 55, the positive correlation was obtained in a wide range of ammonium concentration (1–25 mgNL−1) but at low nitrite and nitrate concentrations only, and positive correlations on Day 81 were produced at 0 mgNL−1 of oxidised nitrogen forms and an ammonium concentration below 16 mgNL−1. On Day 72, a negative correlation was obtained at again a higher ammonium concentration range (17–26 mgNL−1).
The data suggest that, above a certain ammonium concentration, its effect on nitrous production decreases; this, however, is influenced by other factors, like nitrite concentration and possibly dissolved oxygen concentration.
The step change of the air flow rate to the membranes has produced results analogous to the observations made under steady-state conditions. A negative correlation between off-gas nitrous oxide concentration and air supply rate reinforces the proposed hypotheses regarding the influence of the air flow rate on the fate and the emission of nitrous oxide. The time required for the off-gas nitrous oxide concentration to change after the modification of the air supply rate is comparable to that of oxygen and is about 2–3 times the gas residence time (at the modified air flow rate). This suggests that the phenomena responsible for the changing N2O concentration are fast processes acting in the short term. A positive relationship between the nitrous oxide transfer rate and the air supply rate was observed for all dynamic experiments, indicating that it was not only the higher dilution factor affecting the off-gas nitrous oxide concentration.

6. Conclusions

Using both off-gas and bulk liquid analysis, an investigation was carried out into the nitrogen removal performance and nitrous oxide production of a lab-scale MABR system fed with synthetic wastewater and performing simultaneous nitrification and denitrification. The following conclusions can be drawn from the obtained results.
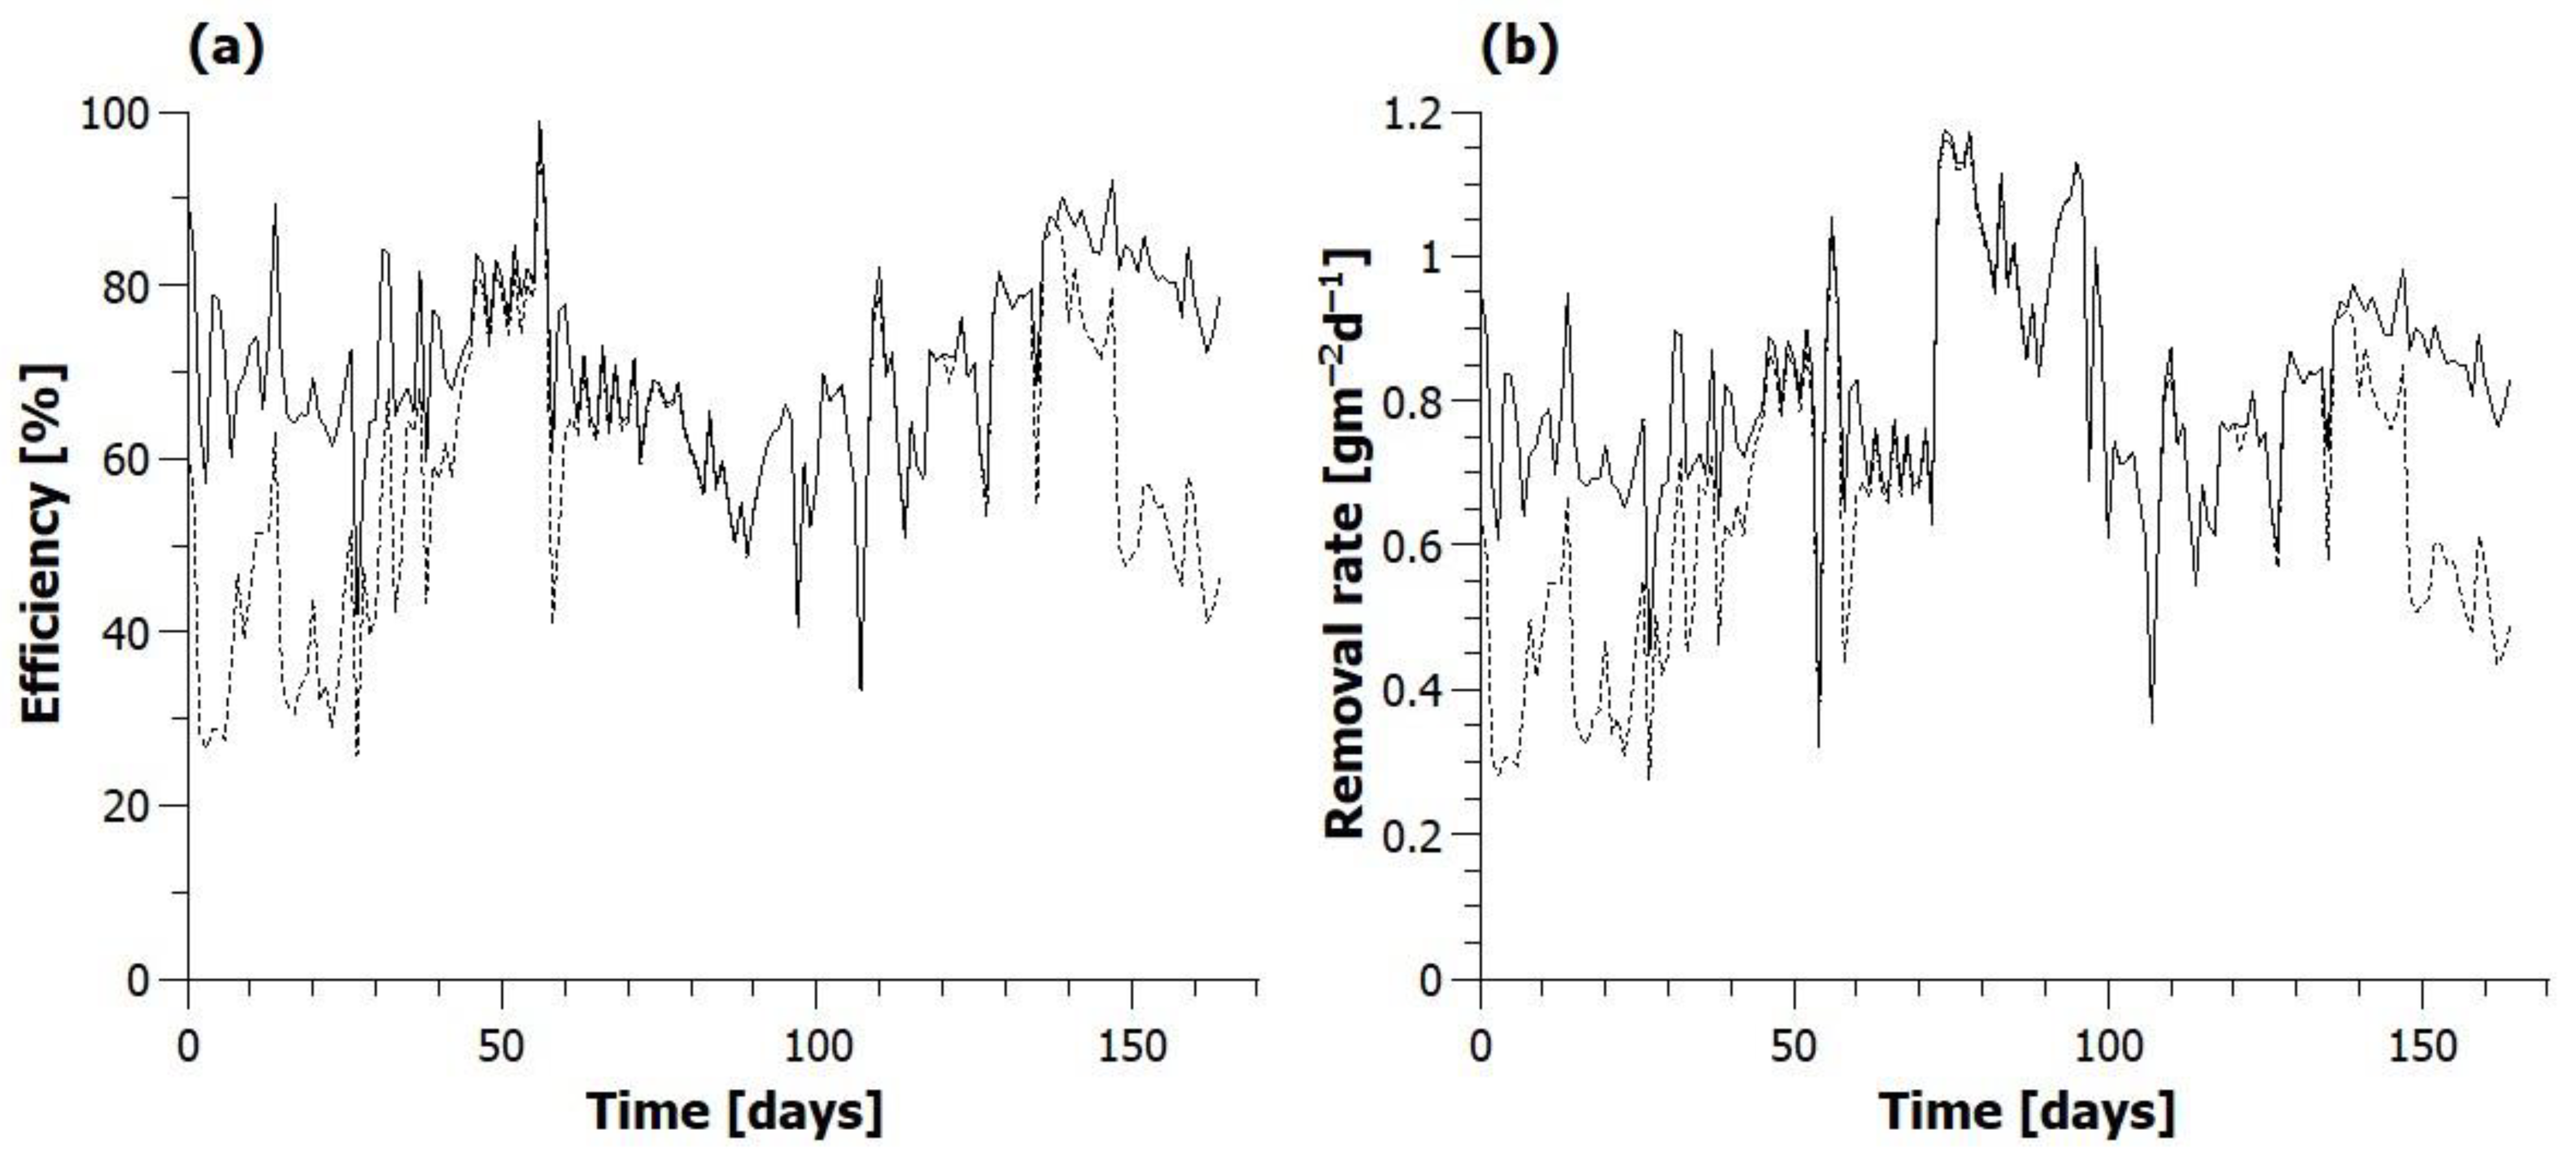
  • Nitrous oxide emission via the off-gas and total net nitrous oxide production is strongly influenced by the process air flow rate under SND conditions. Both steady state and dynamic data show an increase in off-gas and total nitrous oxide emission with an increase in the air flow rate.
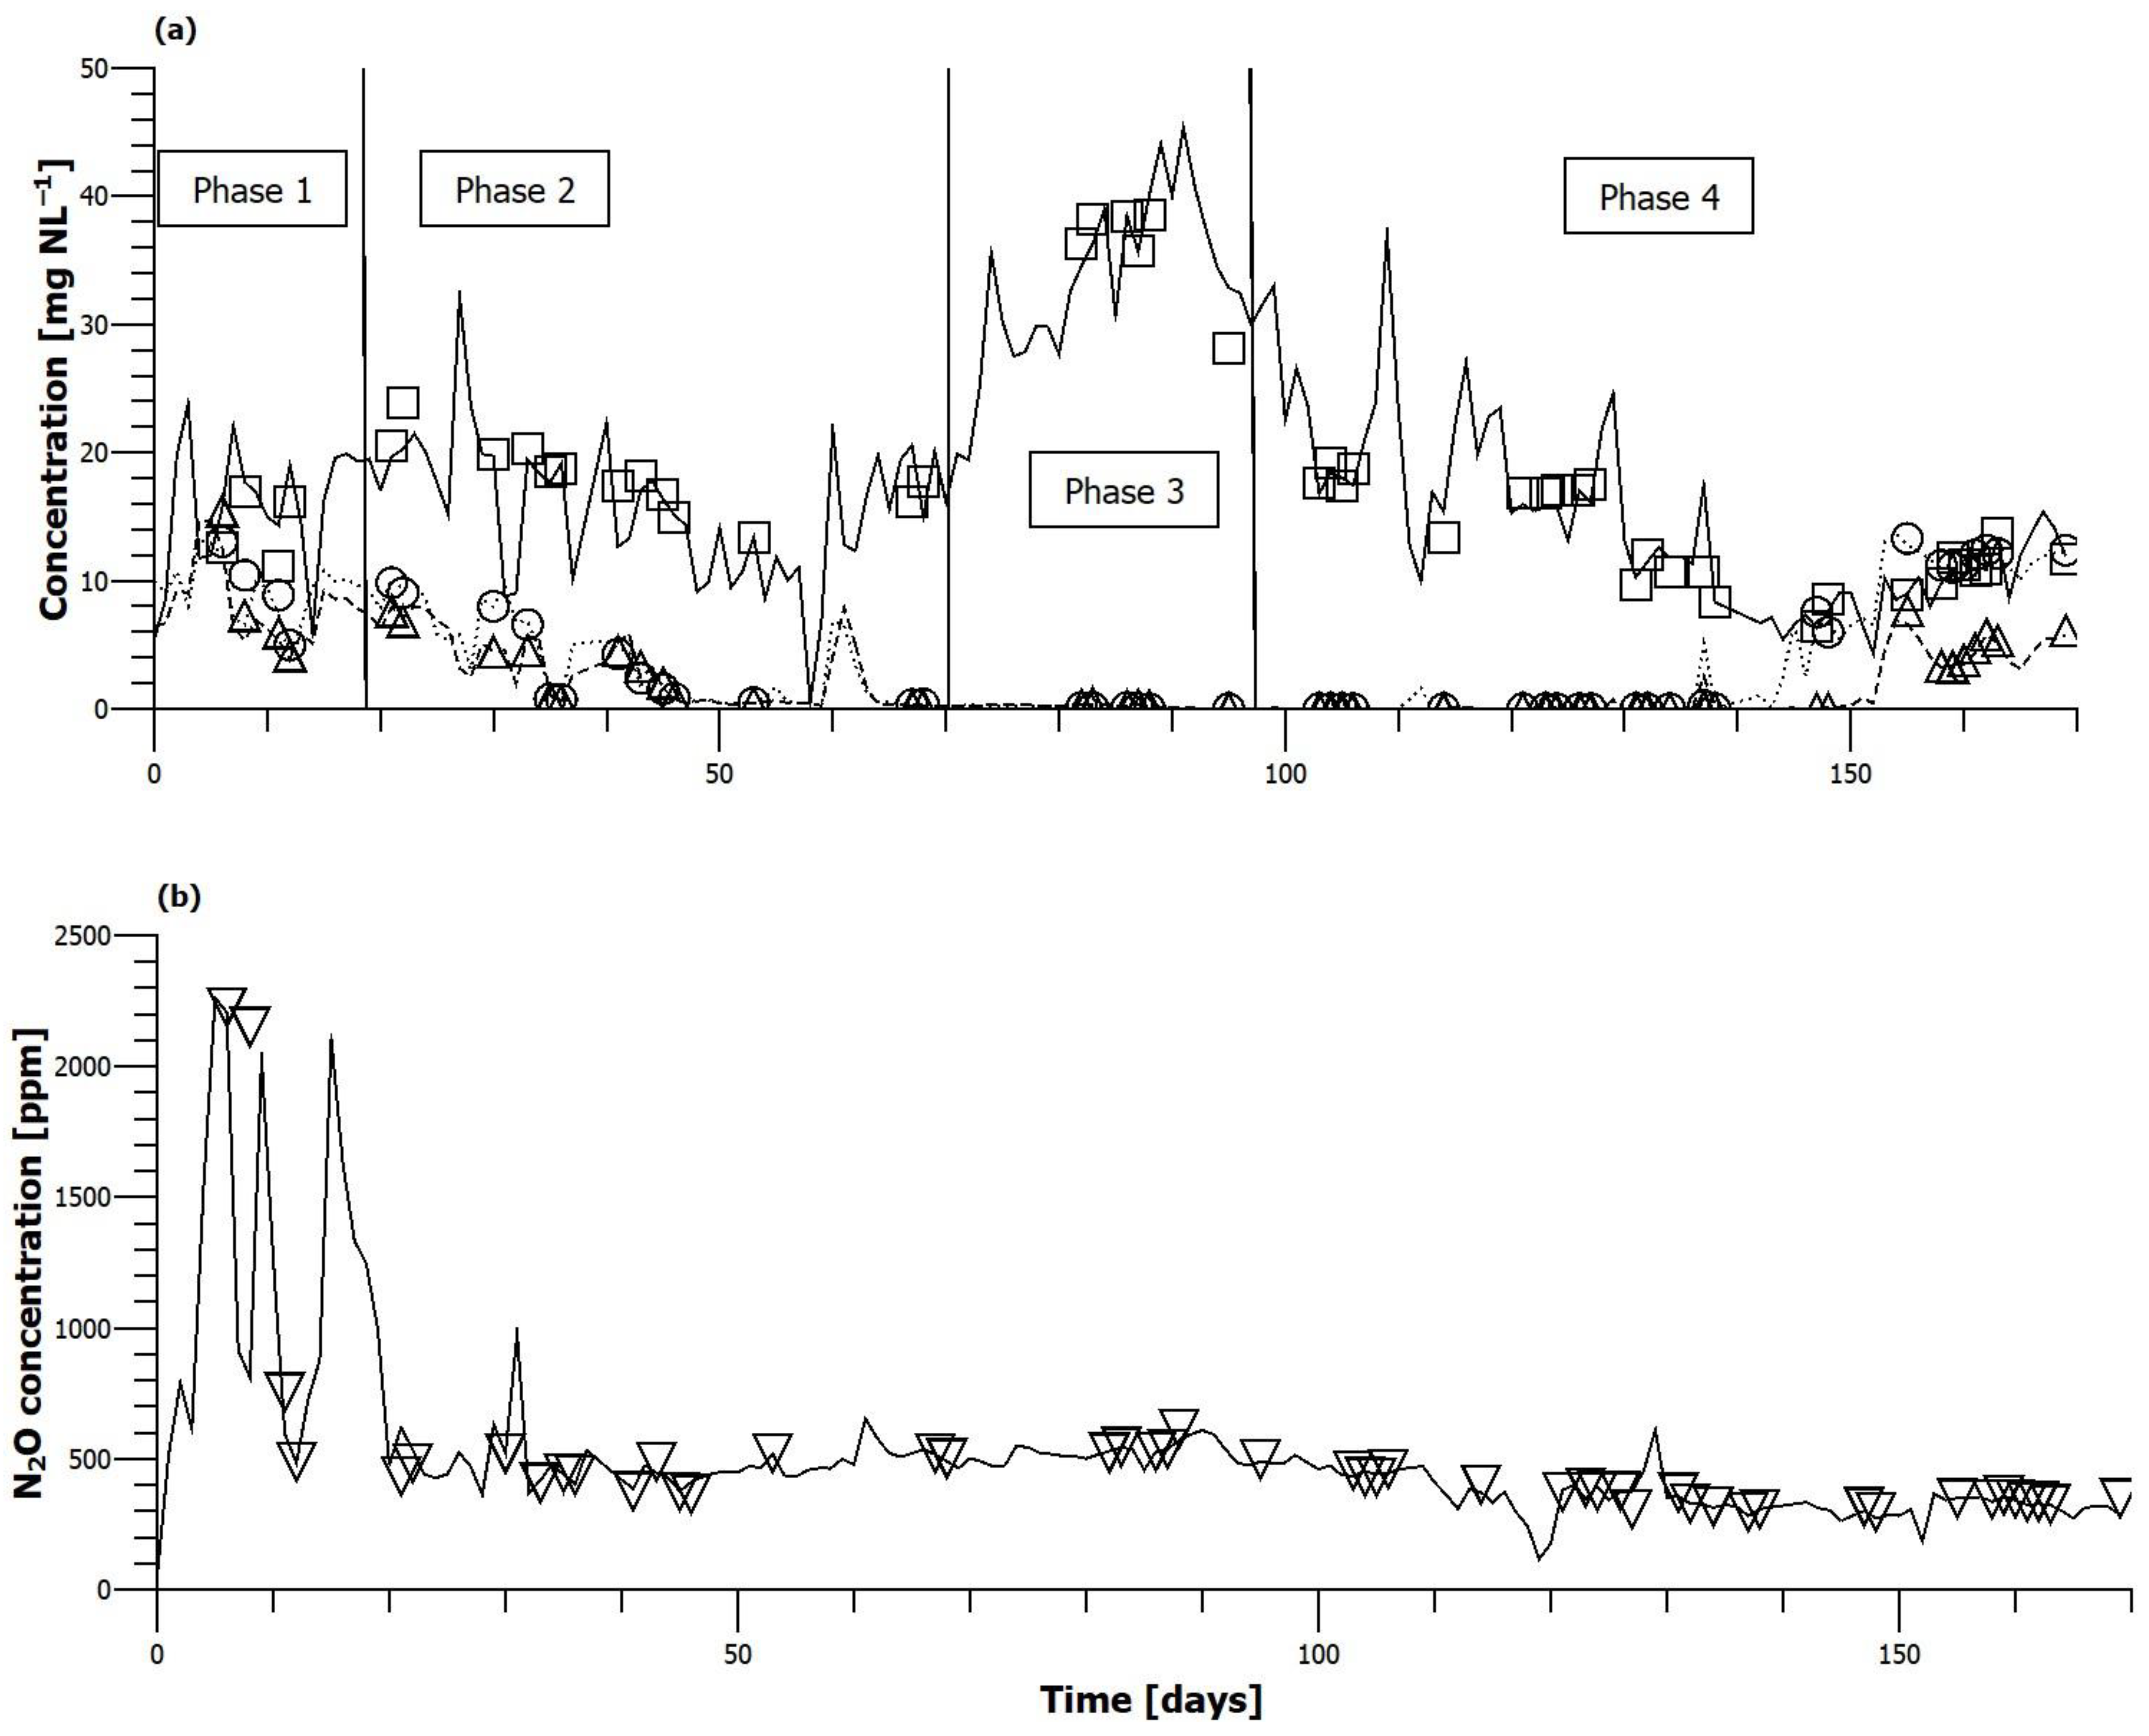
  • The COD:N ratio has a significant impact on off-gas nitrous oxide levels. It was found that increasing the COD:N ratio from 3.5 to 4.0 decreased the off-gas N2O concentration from over 2000 ppm to below 600 ppm. The carbon source in the synthetic wastewater was entirely easily biodegradable (acetate).
  • Denitrification in the anoxic zone is a major sink for N2O. Evidence suggests that reduced carbon availability for denitrification or shifting the nitrous oxide flux away from the anoxic zone towards the membrane lumen results in an increased nitrous oxide emission, highlighting the importance of facultative heterotrophs.
  • There is some correlation between bulk liquid ammonium concentration and off-gas nitrous oxide concentration. No correlation was found with bulk liquid nitrite concentration.
  • The non-uniform environment in a membrane-aerated biofilm results in a complex interaction of processes participating in the production and consumption of nitrous oxide. More focused investigation is necessary for a deeper understanding.
Microbial population dynamics were not investigated as part of this work, with every effort being made to minimise potential variation. Future investigations could build on the work carried out here by investigating the microbial consortia within the biofilm modelling; additionally, investigating the simulation of the microbial dynamics within the biofilm would be beneficial to expand upon the understanding of N2O emissions from membrane-aerated biofilms.

Supplementary Materials

The following supporting information can be downloaded at https://www.mdpi.com/article/10.3390/w17040500/s1. Figure S1: Schematic of Membrane bunch submersed in the reactor, Air recirculation pump and N2O analyser in gas phase. Figure S2: Schematic of Diffusion of produced N2O from production within the Biofilm towards membrane and Biofilm Liquid surface. (A) the presence of a Denitrifying region on the liquid side of the biofilm creates a sink for N2O, causing a steeper concentration profile indicating a higher rate of flux to this region. (B) The absence of a Dentirfying region results in more of the produced N2O diffusing to the Gas permeable membrane.

Author Contributions

Conceptualisation, E.C. and E.S.; methodology, A.N. and E.S.; software and validation, A.N., E.C. and E.S.; writing—original draft preparation, A.N.; writing—review and editing, A.N., E.C. and E.S.; visualisation, A.N. supervision, E.S.; project administration, E.C.; funding acquisition, E.C. and E.S. All authors have read and agreed to the published version of the manuscript.

Funding

This research was supported by the Irish Research Council Grant Number EBPPG/2014/17.

Data Availability Statement

Data is contained within the article.

Conflicts of Interest

AAndras Nemeth is an employee of OxyMem Ltd. Eoin Syron and Eoin Casey were founders of OxyMem Ltd. The authors used experimental equipment manufactured by OxyMem Ltd. for this research. The company had no role in the design of the study; in the collection, analyses, or interpretation of data; in the writing of the manuscript; or in the decision to publish the results.

References

  1. Pörtner, H.-O.; Roberts, D.C.; Tignor, M.M.B.; Poloczanska, E.; Mintenbeck, K.; Alegría, A.; Craig, M.; Langsdorf, S.; Löschke, S.; Möller, V.; et al. Climate Change 2022: Impacts, Adaptation, and Vulnerability. Contribution of Working Group II to the Sixth Assessment Report of the Intergovernmental Panel on Climate Change; IPCC: Geneva, Switzerland, 2022. [Google Scholar]
  2. de Haas, D.; Andrews, J. Nitrous oxide emissions from wastewater treatment—Revisiting the IPCC 2019 refinement guidelines. Environ. Chall. 2022, 8, 100557. [Google Scholar] [CrossRef]
  3. Yao, H.; Gao, X.; Guo, J.; Wang, H.; Zhang, L.; Fan, L.; Jia, F.; Guo, J.; Pemg, Y. Contribution of nitrous oxide to the carbon footprint of full-scale wastewater treatment plants and mitigation strategies—A critical review. Environ. Pollut. 2022, 314, 120295. [Google Scholar] [CrossRef] [PubMed]
  4. Directive (EU) 2024/3019 of the European Parliament and of the Council of 27 November 2024 Concerning Urban Wastewater Treatment, 2024/3019 (2024). Available online: https://eur-lex.europa.eu/eli/dir/2024/3019/oj (accessed on 1 December 2024).
  5. Lees, H. Hydroxylamine as an Intermediate in Nitrification. Nature 1952, 169, 156–157. [Google Scholar] [CrossRef]
  6. Kampschreur, M.J.; Temmink, H.; Kleerebezem, R.; Jetten, M.S.M.; van Loosdrecht, M.C.M. Nitrous oxide emission during wastewater treatment. Water Res. 2009, 43, 4093–4103. [Google Scholar] [CrossRef]
  7. Ni, B.J.; Ruscalleda, M.; Pellicer-Nàcher, C.; Smets, B.F. Modeling nitrous oxide production during biological nitrogen removal via nitrification and denitrification: Extensions to the general ASM models. Environ. Sci. Technol. 2011, 45, 7768–7776. [Google Scholar] [CrossRef] [PubMed]
  8. Schreiber, F.; Loeffler, B.; Polerecky, L.; Kuypers, M.M.; de Beer, D. Mechanisms of transient nitric oxide and nitrous oxide production in a complex biofilm. ISME J. 2009, 3, 1301–1313. [Google Scholar] [CrossRef]
  9. Ni, B.-J.; Yuan, Z.; Chandran, K.; Vanrolleghem, P.A.; Murthy, S. Evaluating four mathematical models for nitrous oxide production by autotrophic ammonia-oxidizing bacteria. Biotechnol. Bioeng. 2013, 110, 153–163. [Google Scholar] [CrossRef]
  10. Ni, B.J.; Yuan, Z. Recent advances in mathematical modeling of nitrous oxides emissions from wastewater treatment processes. Water Res. 2015, 87, 336–346. [Google Scholar] [CrossRef]
  11. Ali, M.; Rathnayake, R.M.L.D.; Zhang, L.; Ishii, S.; Kindaichi, T.; Satoh, H.; Toyoda, S.; Yoshida, N.; Okabe, S. Source identification of nitrous oxide emission pathways from a single-stage nitritation-anammox granular reactor. Water Res. 2016, 102, 147–157. [Google Scholar] [CrossRef] [PubMed]
  12. Zhao, Y.W.; Du, L.L.; Hu, B.; Lin, H.Y.; Liang, B.; Song, Y.P.; Wang, Y.Q.; Wang, H.W.; Li, P.F.; Wang, A.J.; et al. Impact of influent characteristics and operational parameters on nitrous oxide emissions in wastewater treatment: Strategies for mitigation and microbial insights. Curr. Res. Biotechnol. 2024, 7, 100207. [Google Scholar] [CrossRef]
  13. Peng, L.; Sun, J.; Liu, Y.; Dai, X.; Ni, B.-J. Nitrous Oxide Production in Co- Versus Counter-Diffusion Nitrifying Biofilms. Sci. Rep. 2016, 6, 28880. [Google Scholar] [CrossRef] [PubMed]
  14. Kemmou, L.; Amanatidou, E. Factors Affecting Nitrous Oxide Emissions from Activated Sludge Wastewater Treatment Plants—A Review. Resources 2023, 12, 114. [Google Scholar] [CrossRef]
  15. Semmens, M.J.; Dahm, K.; Shanahan, J.; Christianson, A. COD and nitrogen removal by biofilms growing on gas permeable membranes. Water Res. 2003, 37, 4343–4350. [Google Scholar] [CrossRef]
  16. Syron, E.; Casey, E. Membrane-Aerated Biofilms for High Rate Biotreatment: Performance Appraisal, Engineering Principles, Scale-up, and Development Requirements. Environ. Sci. Technol. 2008, 42, 1833–1844. [Google Scholar] [CrossRef]
  17. Castro-Barros, C.M.; Daelman, M.R.J.; Mampaey, K.E.; van Loosdrecht, M.C.M.; Volcke, E.I.P. Effect of aeration regime on N2O emission from partial nitritation-anammox in a full-scale granular sludge reactor. Water Res. 2015, 68, 793–803. [Google Scholar] [CrossRef]
  18. Ni, B.-J.; Smets, B.F.; Yuan, Z.; Pellicer-Nàcher, C. Model-based evaluation of the role of Anammox on nitric oxide and nitrous oxide productions in membrane aerated biofilm reactor. J. Membr. Sci. 2013, 446, 332–340. [Google Scholar] [CrossRef]
  19. Ni, B.-J.; Yuan, Z. A model-based assessment of nitric oxide and nitrous oxide production in membrane-aerated autotrophic nitrogen removal biofilm systems. J. Membr. Sci. 2013, 428, 163–171. [Google Scholar] [CrossRef]
  20. Sabba, F.; Terada, A.; Wells, G.; Smets, B.F.; Nerenberg, R. Nitrous oxide emissions from biofilm processes for wastewater treatment. Appl. Microbiol. Biotechnol. 2018, 102, 9815–9829. [Google Scholar] [CrossRef] [PubMed]
  21. Kinh, C.T.; Suenaga, T.; Hori, T.; Riya, S.; Hosomi, M.; Smets, B.F.; Terada, A. Counter-diffusion biofilms have lower N2O emissions than co-diffusion biofilms during simultaneous nitrification and denitrification: Insights from depth-profile analysis. Water Res. 2017, 124, 363–371. [Google Scholar] [CrossRef] [PubMed]
  22. Uri-Carreño, N.; Nielsen, P.H.; Gernaey, K.V.; Domingo-Félez, C.; Flores-Alsina, X. Nitrous oxide emissions from two full-scale membrane-aerated biofilm reactors. Sci. Total Environ. 2024, 908, 168030. [Google Scholar] [CrossRef] [PubMed]
  23. An, Z.; Zhang, Q.; Gao, X.; Ding, J.; Shao, B.; Peng, Y. Nitrous oxide emissions in novel wastewater treatment processes: A comprehensive review. Bioresour. Technol. 2024, 391, 129950. [Google Scholar] [CrossRef]
  24. Zhong, H.; Dong, L.; Tang, Y.; Qi, L.; Wang, M. The C/N Ratio’s Effect on a Membrane-Aerated Biofilm Reactor (MABR): COD and Nitrogen Removal, Biofilm Characteristics, and Microbial Community Structure. Water 2023, 15, 4298. [Google Scholar] [CrossRef]
  25. Burgess, J.E.; Colliver, B.B.; Stuetz, R.M.; Stephenson, T. Dinitrogen oxide production by a mixed culture of nitrifying bacteria during ammonia shock loading and aeration failure. J. Ind. Microbiol. Biotechnol. 2002, 29, 309–313. [Google Scholar] [CrossRef] [PubMed]
  26. Foley, J.; de Haas, D.; Yuan, Z.; Lant, P. Nitrous oxide generation in full-scale biological nutrient removal wastewater treatment plants. Water Res. 2010, 44, 831–844. [Google Scholar] [CrossRef] [PubMed]
  27. Wang, Y.; Fang, H.; Zhou, D.; Han, H.; Chen, J. Characterization of nitrous oxide and nitric oxide emissions from a full-scale biological aerated filter for secondary nitrification. Chem. Eng. J. 2016, 299, 304–313. [Google Scholar] [CrossRef]
  28. Lotito, A.M.; Wunderlin, P.; Joss, A.; Kipf, M.; Siegrist, H. Nitrous oxide emissions from the oxidation tank of a pilot activated sludge plant. Water Res. 2012, 46, 3563–3573. [Google Scholar] [CrossRef]
  29. Furuya, Y.; Saito, T.; Konuma, S.; Odake, Y.; Suzuki, S. Effect of Aeration Intensity on Nitrous Oxide Production. J. Water Environ. Technol. 2013, 11, 477–486. [Google Scholar] [CrossRef]
  30. Kim, D.J.; Kim, Y. Effect of aeration on nitrous oxide (N2O) emission from nitrogen-removing sequencing batch reactors. J. Microbiol. Biotechnol. 2013, 23, 99–105. [Google Scholar] [CrossRef] [PubMed]
  31. Vasilaki, V.; Volcke, E.I.P.; Nandi, A.K.; van Loosdrecht, M.C.M.; Katsou, E. Relating N2O emissions during biological nitrogen removal with operating conditions using multivariate statistical techniques. Water Res. 2018, 140, 387–402. [Google Scholar] [CrossRef]
  32. Terada, A.; Lackner, S.; Tsuneda, S.; Smets, B.F. Redox-stratification controlled biofilm (ReSCoBi) for completely autotrophic nitrogen removal: The effect of co- versus counter-diffusion on reactor performance. Biotechnol. Bioeng. 2007, 97, 40–51. [Google Scholar] [CrossRef] [PubMed]
  33. Syron, E.; Kelly, H.; Casey, E. Studies on the effect of concentration of a self-inhibitory substrate on biofilm reaction rate under co-diffusion and counter-diffusion configurations. J. Membr. Sci. 2009, 335, 76–82. [Google Scholar] [CrossRef]
  34. Németh, A.; Ainsworth, J.; Ravishankar, H.; Lens, P.N.L.; Heffernan, B. Temperature dependence of nitrification in a membrane-aerated biofilm reactor. Front. Microbiol. 2023, 14, 1114647. [Google Scholar] [CrossRef] [PubMed]
  35. Syron, E.; Casey, E. Model-based comparative performance analysis of membrane aerated biofilm reactor configurations. Biotechnol. Bioeng. 2008, 99, 1361–1373. [Google Scholar] [CrossRef] [PubMed]
  36. Wunderlin, P.; Mohn, J.; Joss, A.; Emmenegger, L.; Siegrist, H. Mechanisms of N2O production in biological wastewater treatment under nitrifying and denitrifying conditions. Water Res. 2012, 46, 1027–1037. [Google Scholar] [CrossRef]
Figure 1. Schematic representation of N2O production pathways from co-diffusional biofilm and counter diffusional biofilm -Source [13].
Water 17 00500 g001
Figure 2. Process flow diagram of the lab-scale membrane-aerated biofilm reactor.
Water 17 00500 g002
Figure 3. (a) Bulk liquid ammonium (−), nitrite (---) and nitrate (···) concentration. ☐-Indicate steady loading periods. (b) Off-gas nitrous oxide concentration, ▽ indicate steady loading periods.
Water 17 00500 g003
Figure 4. (a) Nitrification efficiency (−) and total nitrogen removal efficiency (---). (b) Surface area specific nitrification rate (−) and total nitrogen removal rate (---).
Water 17 00500 g004
Figure 5. Evolution of (a) nitrite (···), nitrate (−) off-gas nitrous oxide (---) concentrations and (b) oxygen transfer rate during the second COD spike experiment.
Water 17 00500 g005
Figure 6. Evolution of (a) ammonium concentration (---) and off-gas nitrous oxide concentration (−) and (b) oxygen transfer rate during an ammonium spike experiment (the four spikes indicate the periodic vents to remove condensate from the air line).
Water 17 00500 g006
Figure 7. (a) Linear relationship and (b) monotonic relationship between off-gas nitrous oxide concentration (ppm), concentrations of nitrogen species in the reactor, air supply rate and ratio of air supply to nitrogen loading rate.
Water 17 00500 g007
Figure 8. (a) Linear relationship and (b) monotonic relationship between nitrous oxide transfer rate (gN m−2d−1) and various operating conditions.
Water 17 00500 g008
Table 1. Loading conditions during the four steady loading phases.
Nitrogen Loading [gm−2d−1]COD Loading [gm−2d−1]COD:N Ratio
Phase 1 (Days 0–19)1.0643.803.57
Phase 2 (Days 20–72)1.0644.304.04
Phase 3 (Days 73–99)1.7016.854.03
Phase 4 (Days 100–169)1.0654.304.04
Table 2. Results of the loading step-change experiments.
Day 6Day 7Day 34Day 54Day 55Day 72Day 81Day 81
Initial nitrogen loading [gN m−2d−1]1.01.01.01.00.41.01.00.0
Changed nitrogen loading
[gN m−2d−1]
3.03.02.00.41.62.00.01.0
Air flow rate [Lmin−1]0.090.0850.0470.1000.1000.0780.1090.109
Initial off-gas N2O concentration [ppm]21501100480465295510420210
Changed off-gas N2O concentration [ppm]>2500650480415495485210360
Initial NH4-N concentration [mgL−1]14201715.6117160
Changed NH4-N concentration [mgL−1]2130217.42526015
Initial NO2-N concentration [mgL−1]1376.70.20.80.00.00.0
Changed NO2-N concentration [mgL−1]966.10.20.50.00.00.0
Initial NO3-N concentration [mgL−1]12.58.55.50.24.2003.5
Changed NO3-N concentration [mgL−1]10.66.24.21.30.503.50
Change of loading
Change of NH4-N concentration
Change of NO2-N concentration↗↘
Change of NO3-N concentration
Change of off-gas N2O concentration
Table 3. Results of the air flow rate step-change experiments.
Day 82Day 83Day 127Day 137Day 147Day 148Day 155
Nitrogen loading [gN m−2d−1]1.71.71.01.01.01.01.0
Initial air flow rate [Lmin−1]0.150.600.110.110.250.200.150.12
Changed air flow rate [Lmin−1]0.600.110.150.290.300.150.120.09
NH4-N concentration [mgL−1]34.538.615.910.76.37.38.9
NO2-N concentration [mgL−1]0.40.40.00.00.00.17.6
NO3-N concentration [mgL−1]0.20.10.00.07.27.413.1
Initial off-gas N2O concentration [ppm]540365550360315285315345
Changed off-gas N2O concentration [ppm]365555525300290330295364
Change of air flow rate
Change of off-gas N2O concentration
Disclaimer/Publisher’s Note: The statements, opinions and data contained in all publications are solely those of the individual author(s) and contributor(s) and not of MDPI and/or the editor(s). MDPI and/or the editor(s) disclaim responsibility for any injury to people or property resulting from any ideas, methods, instructions or products referred to in the content.

