Accuracy Evaluation of Multiple Runoff Products: A Case Study of the Middle Reaches of the Yellow River


Abstract
1. Introduction
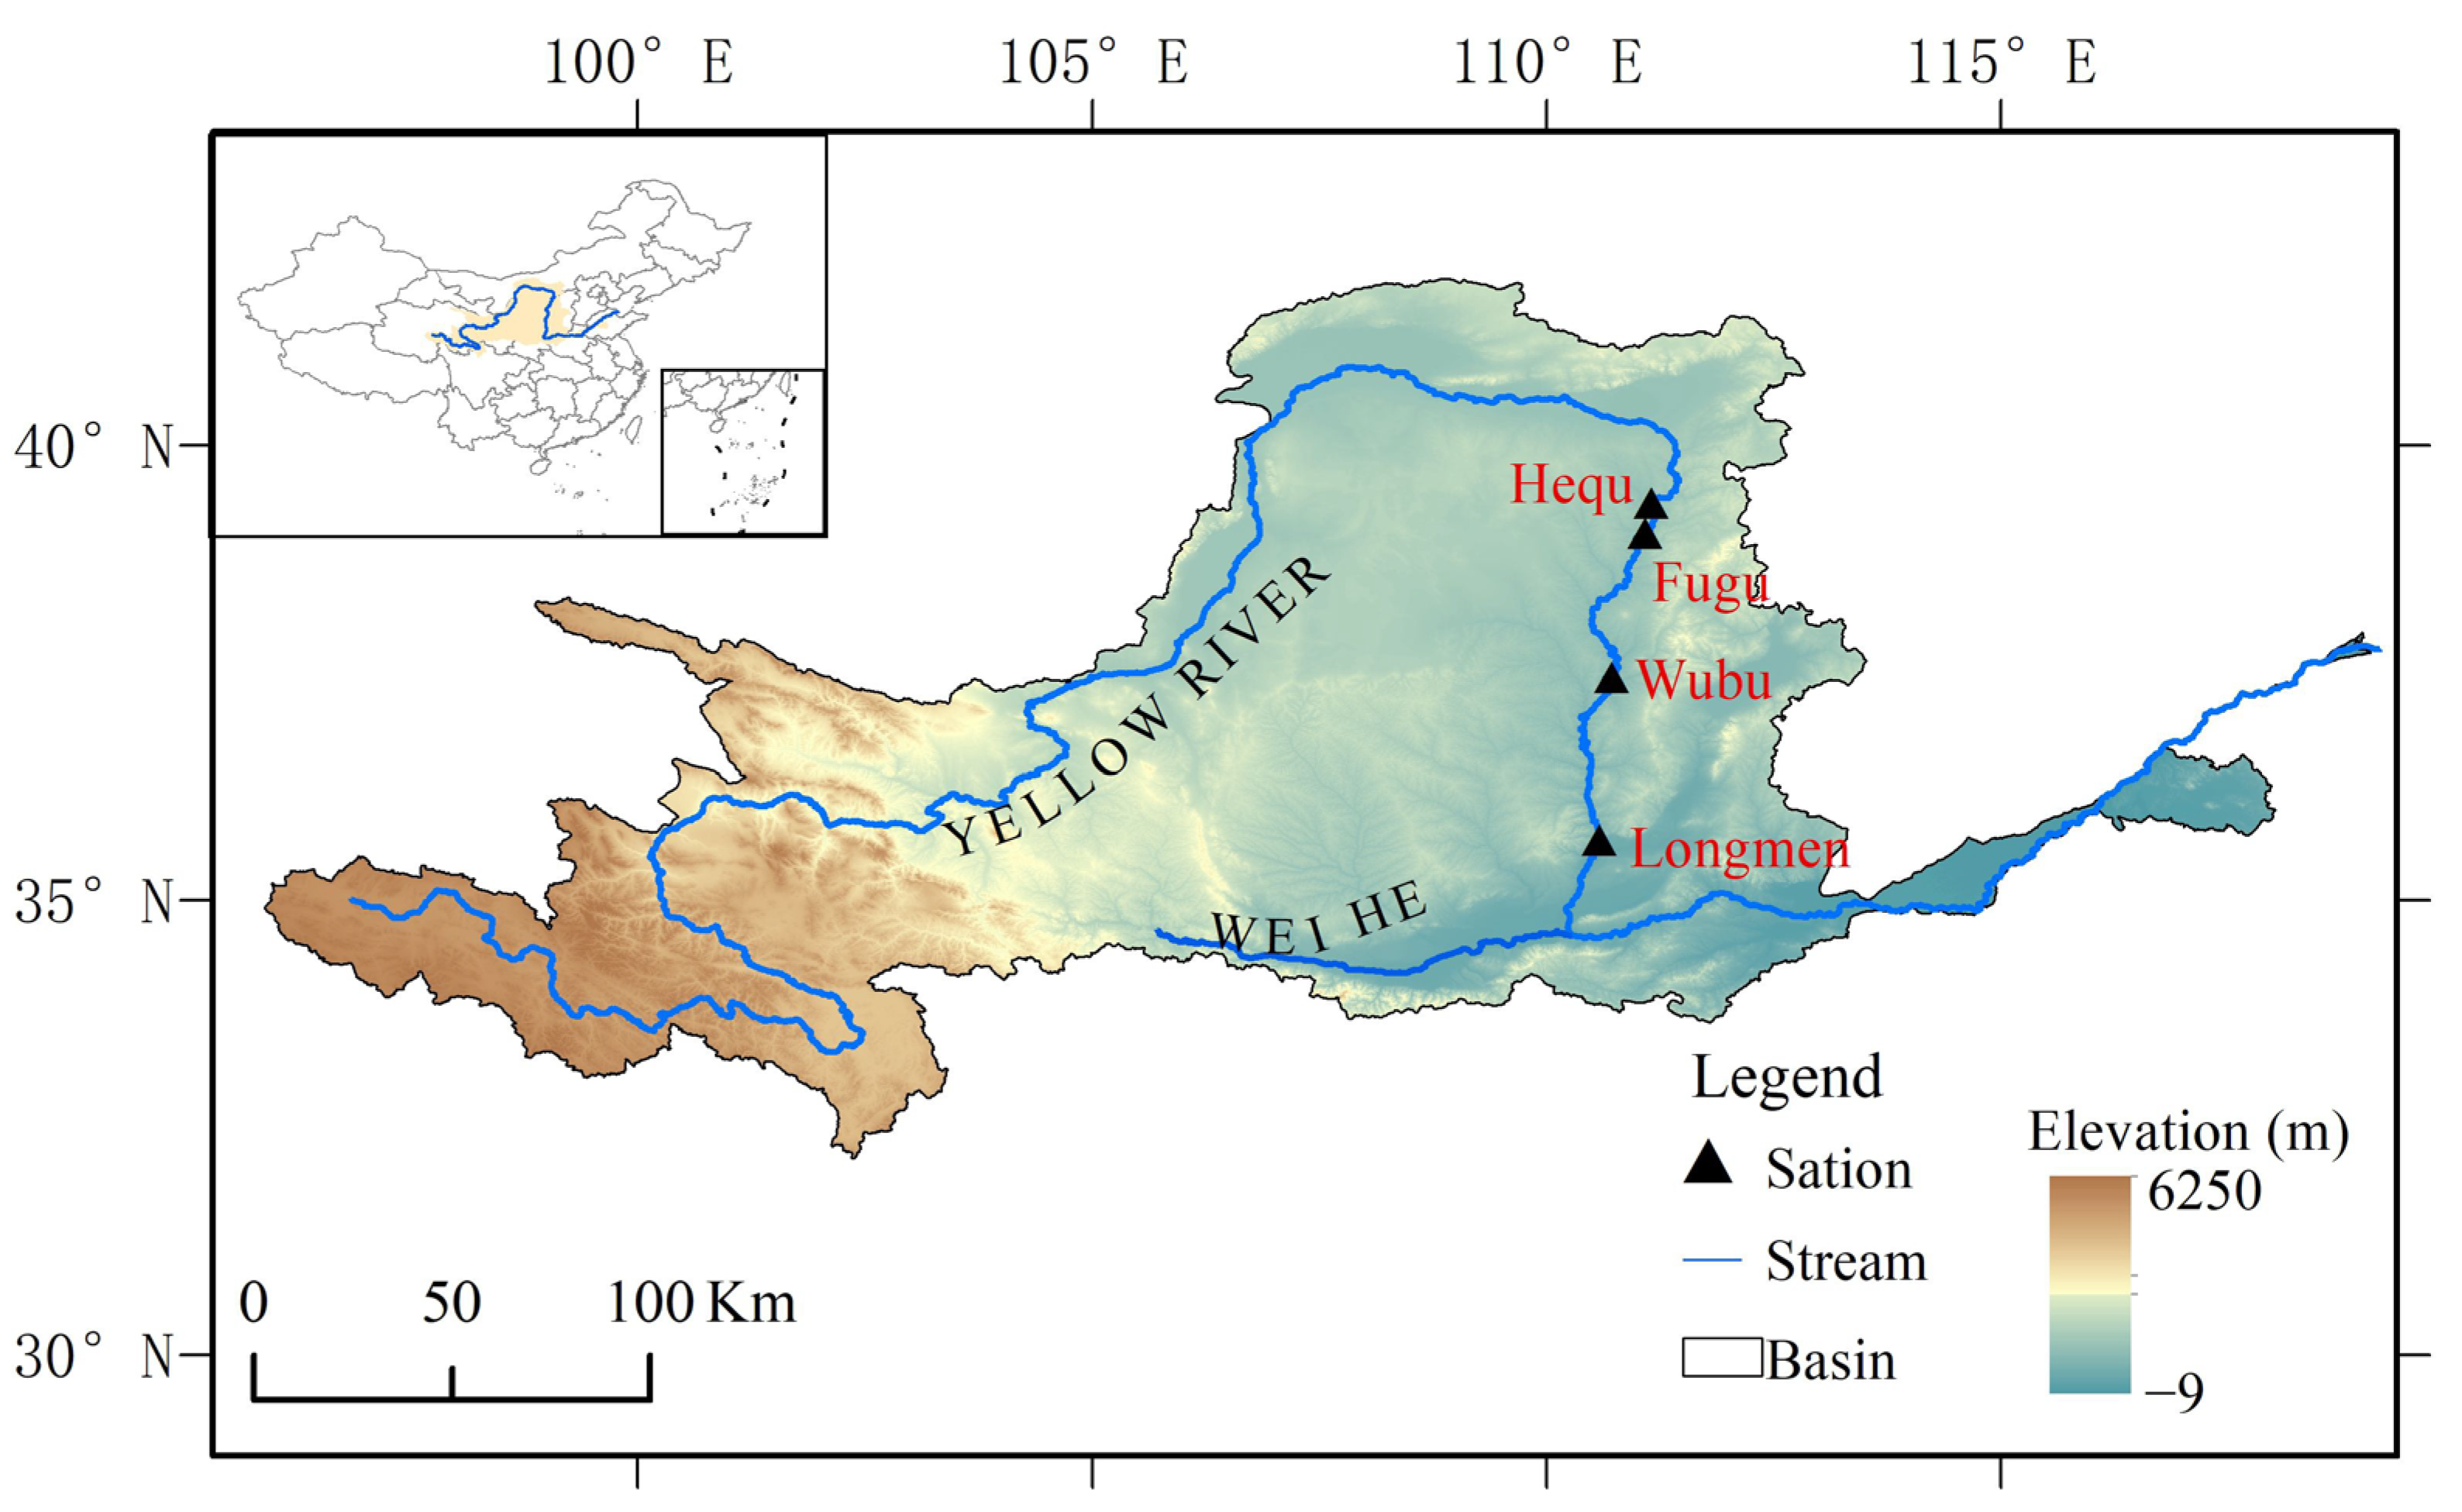
2. Study Area
3. Materials and Methods
3.1. Introduction to the Runoff Datasets
3.2. Methodology
- (1)
- Data collection: The observed runoff data at the four gauging stations (Hequ, Fugu, Wubu, and Longmen, see Table 2) were all sourced from the official website of the Yellow River Conservancy Commission (http://www.yrcc.gov.cn/, accessed on 20 July 2024). These data reflect the flow conditions after human interventions. To ensure the consistency and reliability of the comparative analysis across different time scales, we uniformly selected the time series data from 2006 to 2015 for analysis. In addition, three grid runoff products were collected by the corresponding website, with streamflow units for each grid expressed in m³/s, consistent with the observed streamflow units at hydrological gauging stations.
- (2)
- Simulated streamflow extraction: Based on the longitude and latitude values of the hydrological stations, each station was matched to a unique pixel within the given grid-based global runoff dataset, and the streamflow value of that pixel was extracted. Finally, the extracted streamflow values from the given grid-based runoff dataset were subsequently compared to the observed streamflow at the corresponding hydrological stations.
3.3. Assessment Criteria
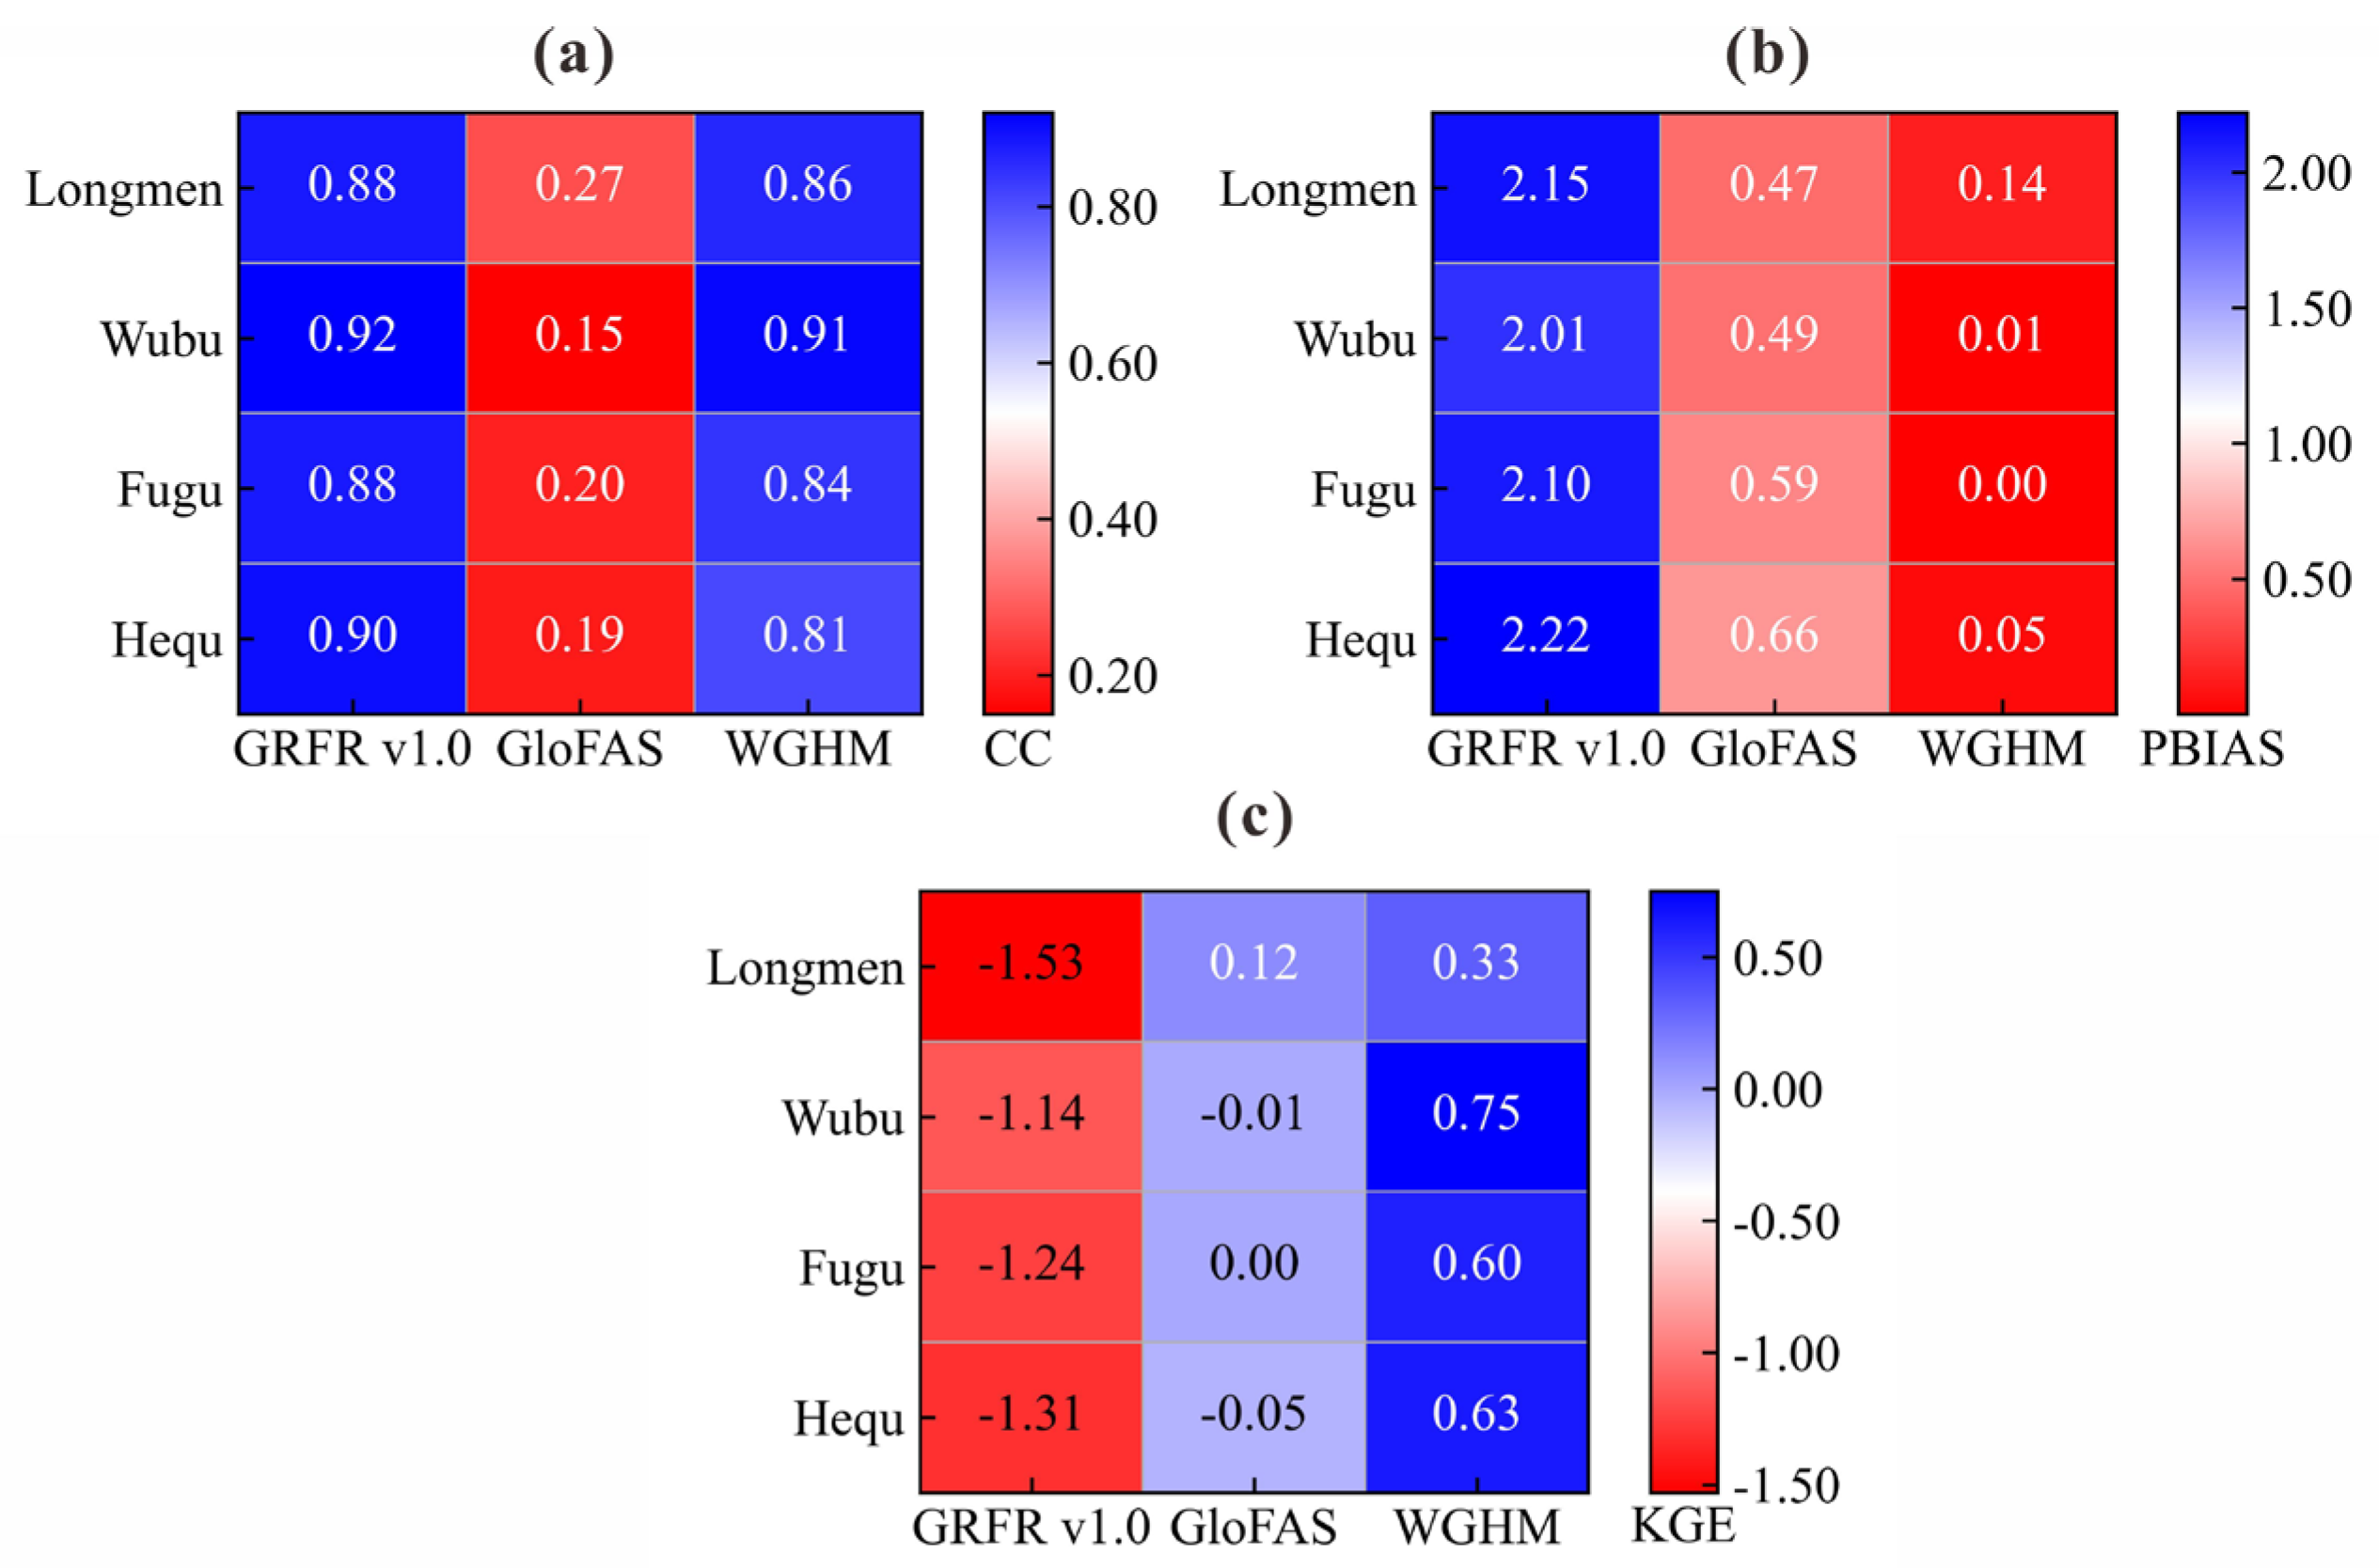
4. Results
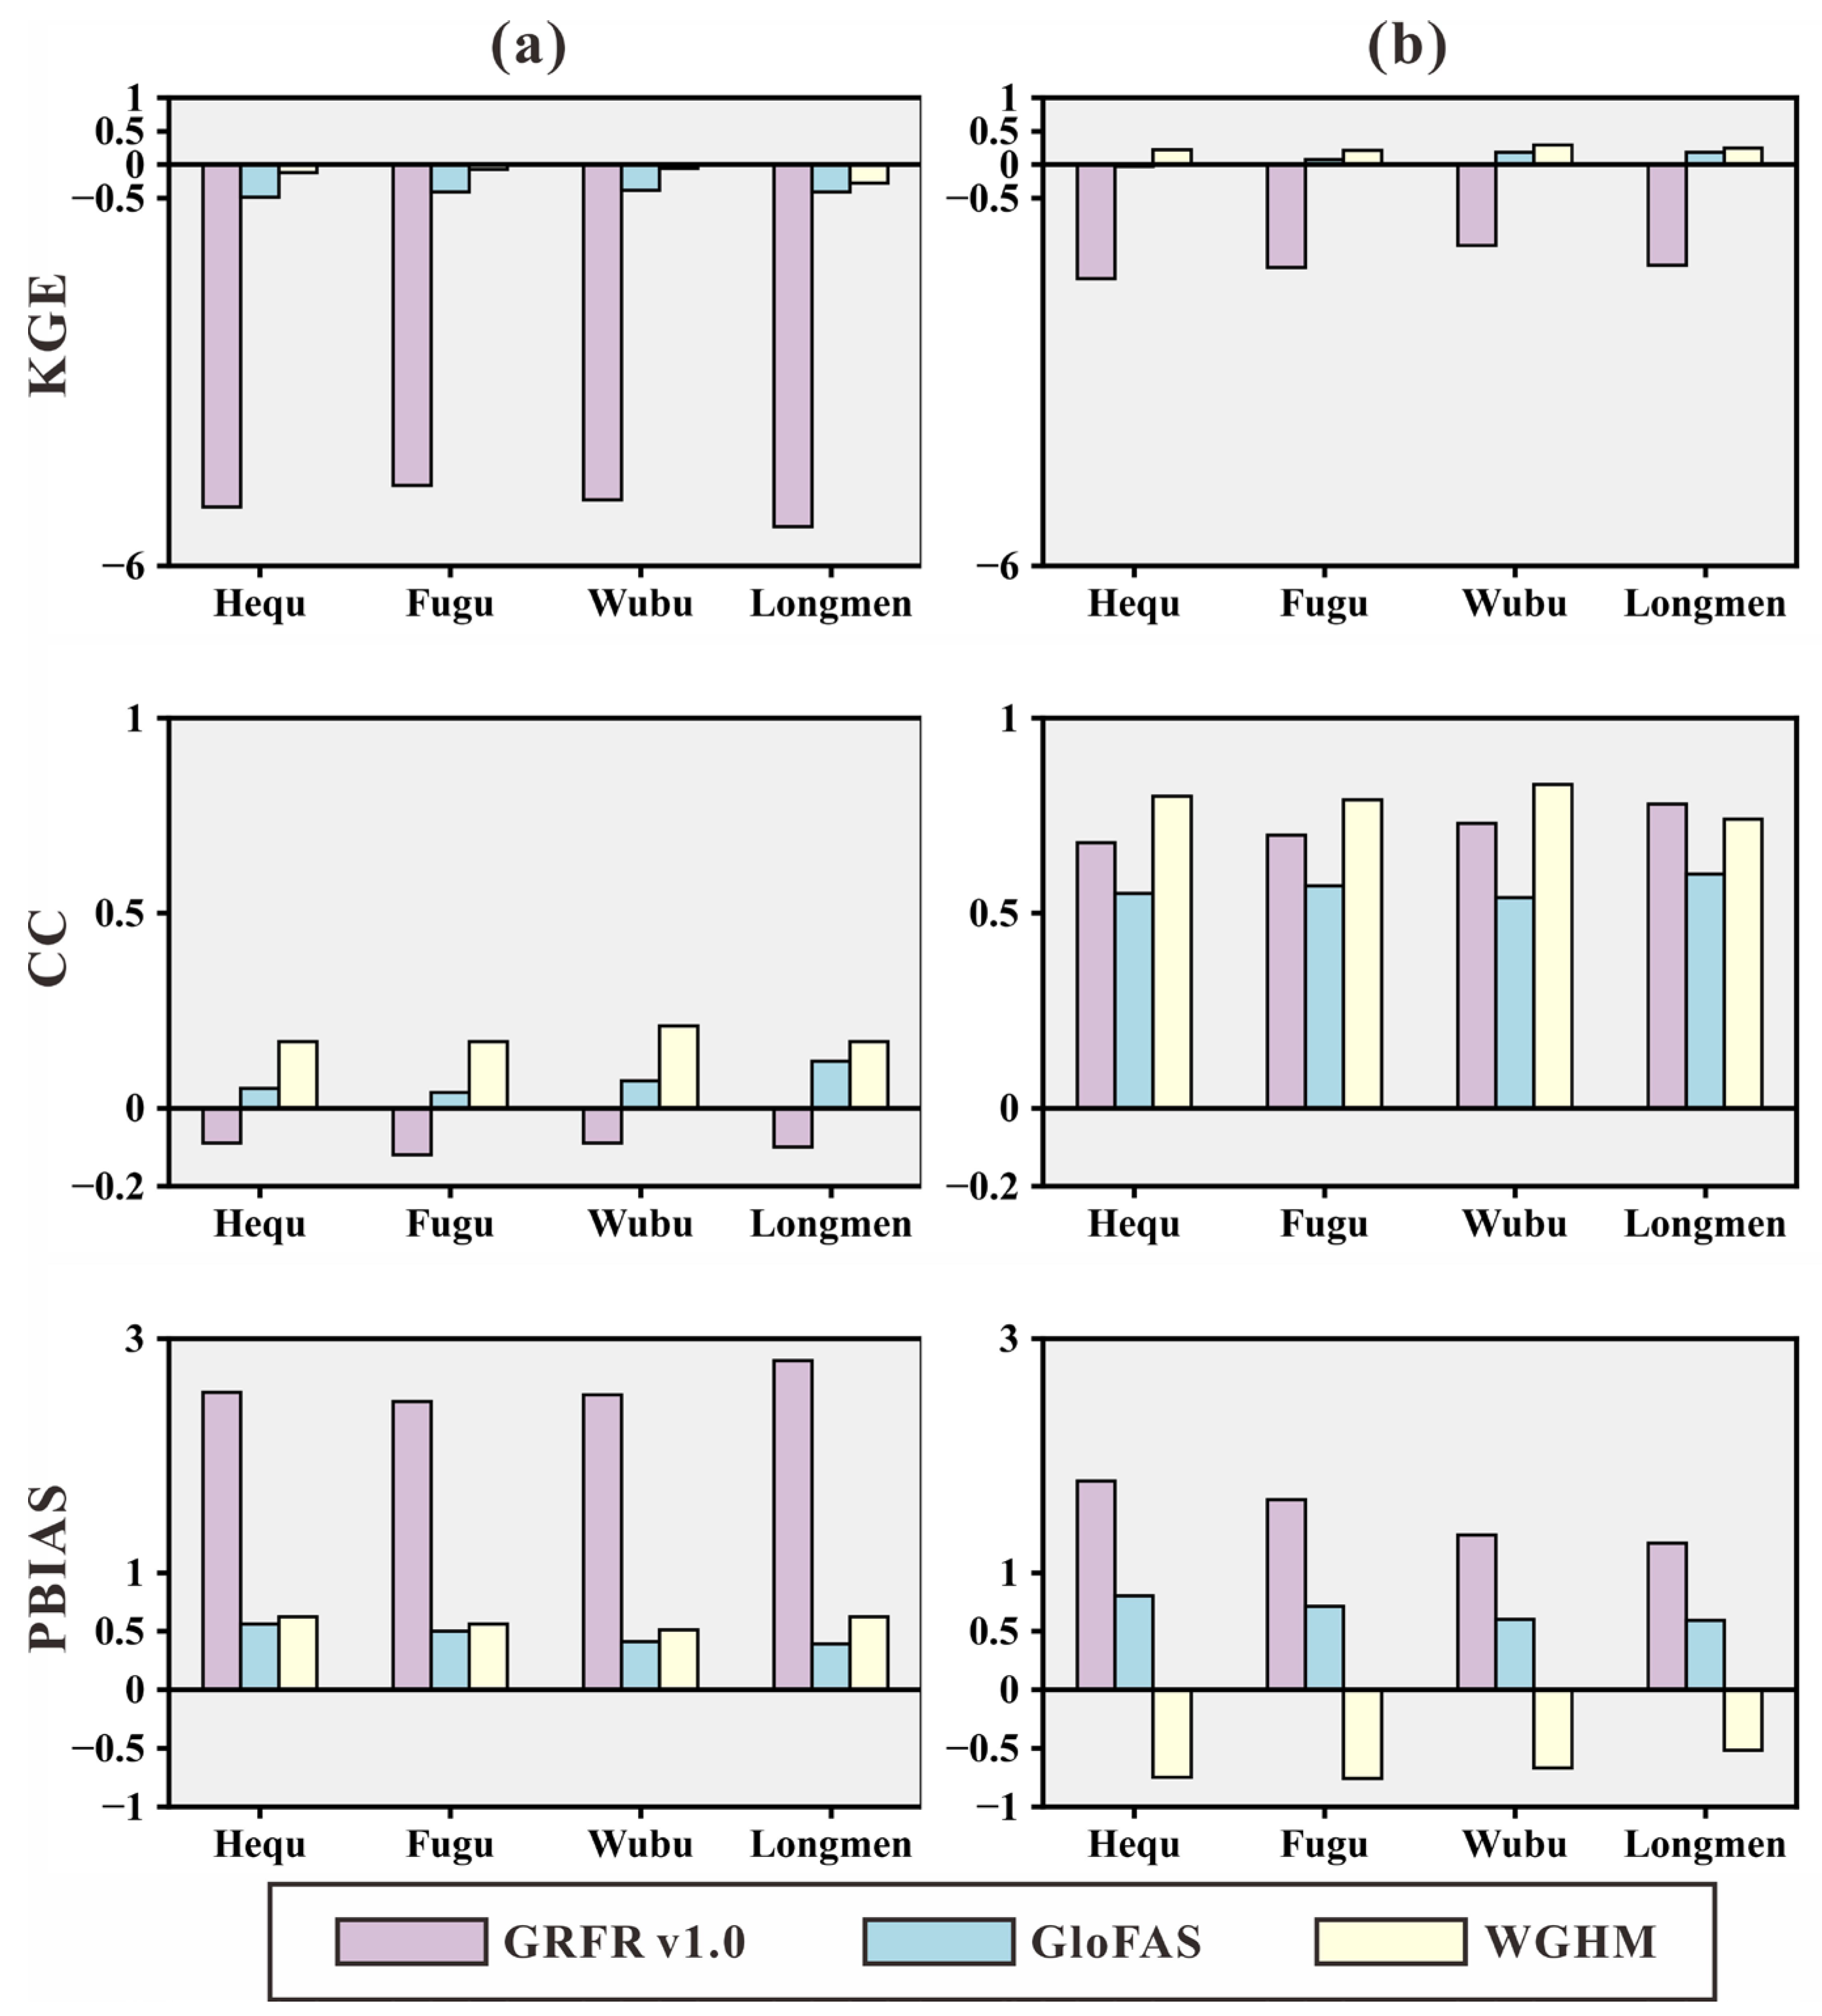
4.1. Simulated Streamflow Performance on Daily Scale
4.2. Simulated Runoff Performance on Monthly Scale
4.3. Simulated Streamflow Performance on Annual Scale
4.4. Simulated Streamflow Performance in Dry/Wet Periods
5. Discussion
6. Conclusions
- (1)
- The performance of simulated streamflow improves with increasing time scale. Specifically, the GloFAS dataset performs the best at the daily scale, while the WGHM dataset outperforms the others at the monthly, annual, and seasonal scales, providing more reliable streamflow simulations.
- (2)
- All three datasets tend to overestimate the total streamflow across all stations.
- (3)
- The three datasets perform better during the wet period, accurately simulating streamflow changes compared to the dry period.
- (4)
- The ability to capture peak flow timing is influenced by the dataset type, temporal scale, and station characteristics. Overall, the datasets perform better at hydrological stations with higher base streamflow, such as Longmen and Wubu stations.
- (5)
- Simulation errors in the datasets may stem from issues including the quality of meteorological input data, missing or simplified model processes, and improper model parameterization.
Author Contributions
Funding
Data Availability Statement
Conflicts of Interest
References
- Huang, C.; Li, Y.; Tarpanelli, A.; Wang, N.; Chen, Y. Observing river discharge from space: Challenges and opportunities. Innov. Geosci. 2024, 2, 100076. [Google Scholar] [CrossRef]
- Yang, D.W.; Xu, Z.X.; Li, Z.; Yuan, X.; Wang, L.; Liao, C.; Tian, F.; Tian, L.; Long, D.; Tang, Q. Progress and prospect of hydrological sciences. Prog. Geogr. 2018, 37, 36–45. [Google Scholar]
- Lohse, K.A.; Brooks, P.D.; McIntosh, J.C.; Meixner, T.; Huxman, T.E. Interactions between biogeochemistry and hydrologic systems. Annu. Rev. Environ. Resour. 2009, 34, 65–96. [Google Scholar] [CrossRef]
- Ahmad, T.; Pandey, A.C.; Kumar, A.; Tirkey, A. Understanding the role of surface runoff in potential flood inundation in the Kashmir valley, Western Himalayas. Phys. Chem. Earth Parts A/B/C 2023, 131, 103423. [Google Scholar] [CrossRef]
- Gu, L.; Chen, J.; Yin, J.; Xu, C.Y.; Zhou, J. Responses of precipitation and runoff to climate warming and implications for future drought changes in China. Earth’s Future 2020, 8, e2020EF001718. [Google Scholar] [CrossRef]
- Do, H.X.; Gudmundsson, L.; Leonard, M.; Westra, S. The Global Streamflow Indices and Metadata Archive (GSIM)–Part 1: The production of a daily streamflow archive and metadata. Earth Syst. Sci. Data 2018, 10, 765–785. [Google Scholar] [CrossRef]
- Gudmundsson, L.; Do, H.X.; Leonard, M.; Westra, S. The Global Streamflow Indices and Metadata Archive (GSIM)–Part 2: Quality control, time-series indices and homogeneity assessment. Earth Syst. Sci. Data 2018, 10, 787–804. [Google Scholar] [CrossRef]
- Beck, H.E.; van Dijk, A.I.J.M.; De Roo, A.; Miralles, D.G.; McVicar, T.R.; Schellekens, J.; Bruijnzeel, L.A. Global-scale regionalization of hydrologic model parameters. Water Resour. Res. 2016, 52, 3599–3622. [Google Scholar] [CrossRef]
- Gao, H.; Zhao, F. Global-scale hydrological models: Opportunities, challenges, and prospects. J. Glaciol. Geocryol. 2020, 42, 224–233. (In Chinese) [Google Scholar]
- Hou, Y.; Guo, H.; Yang, Y.; Liu, W. Global evaluation of runoff simulation from climate, hydrological and land surface models. Water Resour. Res. 2023, 59, e2021WR031817. [Google Scholar] [CrossRef]
- Gudmundsson, L.; Tallaksen, L.M.; Stahl, K.; Clark, D.B.; Dumont, E.; Hagemann, S.; Bertrand, N.; Gerten, D.; Heinke, J.; Hanasaki, N.; et al. Comparing large-scale hydrological model simulations to observed runoff percentiles in Europe. J. Hydrometeorol. 2012, 13, 604–620. [Google Scholar] [CrossRef]
- Zaitchik, B.F.; Rodell, M.; Olivera, F. Evaluation of the Global Land Data Assimilation System using global river discharge data and a source-to-sink routing scheme. Water Resour. Res. 2010, 46. [Google Scholar] [CrossRef]
- Zhang, X.; Tang, Q.; Zhang, X.; Lettenmaier, D.P. Runoff sensitivity to global mean temperature change in the CMIP5 Models. Geophys. Res. Lett. 2014, 41, 5492–5498. [Google Scholar] [CrossRef]
- Rakovec, O.; Mizukami, N.; Kumar, R.; Newman, A.J.; Thober, S.; Wood, A.W.; Clark, M.P.; Samaniego, L. Diagnostic evaluation of large-domain hydrologic models calibrated across the contiguous United States. J. Geophys. Res. Atmos. 2019, 124, 13991–14007. [Google Scholar] [CrossRef]
- Beck, H.E.; Van Dijk, A.I.J.M.; De Roo, A.; Dutra, E.; Fink, G.; Orth, R.; Schellekens, J. Global evaluation of runoff from 10 state-of-the-art hydrological models. Hydrol. Earth Syst. Sci. 2017, 21, 2881–2903. [Google Scholar] [CrossRef]
- Sikder, M.S.; David, C.H.; Allen, G.H.; Qiao, X.; Nelson, E.J.; Matin, M.A. Evaluation of available global runoff datasets through a river model in support of transboundary water management in South and Southeast Asia. Front. Environ. Sci. 2019, 7, 171. [Google Scholar] [CrossRef]
- Bai, P.; Liu, X.; Yang, T.; Liang, K.; Liu, C. Evaluation of streamflow simulation results of land surface models in GLDAS on the Tibetan plateau. J. Geophys. Res. Atmos. 2016, 121, 12180–12197. [Google Scholar] [CrossRef]
- Yang, Y.; Pan, M.; Lin, P.; Beck, H.E.; Zeng, Z.; Yamazaki, D.; David, C.H.; Lu, H.; Yang, K.; Hong, Y.; et al. Global reach-level 3-hourly river flood reanalysis (1980–2019). Bull. Am. Meteorol. Soc. 2021, 102, E2086–E2105. [Google Scholar] [CrossRef]
- Harrigan, S.; Zsoter, E.; Alfieri, L.; Prudhomme, C.; Salamon, P.; Wetterhall, F.; Barnard, C.; Cloke, H.; Pappenberger, F. GloFAS-ERA5 operational global river discharge reanalysis 1979–present. Earth Syst. Sci. Data 2020, 12, 2043–2060. [Google Scholar] [CrossRef]
- Müller Schmied, H.; Cáceres, D.; Eisner, S.; Flörke, M.; Herbert, C.; Niemann, C.; Peiris, T.A.; Popat, E.; Portmann, F.T.; Reinecke, R.; et al. The global water resources and use model WaterGAP v2. 2d: Model description and evaluation. Geosci. Model Dev. 2021, 14, 1037–1079. [Google Scholar] [CrossRef]
- Liang, X.; Lettenmaier, D.P.; Wood, E.F.; Burges, S.J. A simple hydrologically based model of land surface water and energy fluxes for general circulation models. J. Geophys. Res. Atmos. 1994, 99, 14415–14428. [Google Scholar] [CrossRef]
- David, C.H.; Maidment, D.R.; Niu, G.Y.; Yang, Z.-L.; Habets, F.; Eijkhout, V. River network routing on the NHDPlus dataset. J. Hydrometeorol. 2011, 12, 913–934. [Google Scholar] [CrossRef]
- Hersbach, H.; de Rosnay, P.; Bell, B.; Schepers, D.; Simmons, A.; Soci, C.; Abdalla, S.; Alonso-Balmaseda, M.; Balsamo, G.; Bechtolg, P.; et al. Operational Global Reanalysis: Progress, Future Directions and Synergies with NWP. ERA Report. 2018. Available online: https://www.ecmwf.int/en/elibrary/80922-operational-global-reanalysis-progress-future-directions-and-synergies-nwp (accessed on 5 February 2024).
- Van Der Knijff, J.M.; Younis, J.; De Roo, A.P.J. LISFLOOD: A GIS-based distributed model for river basin scale water balance and flood simulation. Int. J. Geogr. Inf. Sci. 2010, 24, 189–212. [Google Scholar] [CrossRef]
- Kim, H. Global Soil Wetness Project Phase 3 Atmospheric Boundary Conditions (Experiment 1). Available online: https://search.diasjp.net/en/dataset/GSWP3_EXP1_Forcing (accessed on 5 February 2024).
- Cucchi, M.; Weedon, G.P.; Amici, A.; Bellouin, N.; Lange, S.; Müller Schmied, H.; Hersbach, H.; Buontempo, C. WFDE5: Bias-adjusted ERA5 reanalysis data for impact studies. Earth Syst. Sci. Data 2020, 12, 2097–2120. [Google Scholar] [CrossRef]
- Gupta, H.V.; Kling, H.; Yilmaz, K.K.; Martinez, G.F. Decomposition of the mean squared error and NSE performance criteria: Implications for improving hydrological modelling. J. Hydrol. 2009, 377, 80–91. [Google Scholar] [CrossRef]
- Nash, J.E.; Sutcliffe, J.V. River flow forecasting through conceptual models part I—A discussion of principles. J. Ofhydrology 1970, 10, 282–290. [Google Scholar] [CrossRef]
- Fekete, B.M.; Vörösmarty, C.J.; Roads, J.O.; Willmott, C.J. Uncertainties in precipitation and their impacts on runoff estimates. J. Clim. 2004, 17, 294–304. [Google Scholar] [CrossRef]
- Müller Schmied, H.; Eisner, S.; Franz, D.; Wattenbach, M.; Portmann, F.T.; Flörke, M.; Döll, P. Sensitivity of simulated global-scale freshwater fluxes and storages to input data, hydrological model structure, human water use and calibration. Hydrol. Earth Syst. Sci. 2014, 18, 3511–3538. [Google Scholar] [CrossRef]
- Weiland FC, S.; Vrugt, J.A.; Weerts, A.H.; Bierkens, M.F. Significant uncertainty in global scale hydrological modeling from precipitation data errors. J. Hydrol. 2015, 529, 1095–1115. [Google Scholar] [CrossRef]
- Beck, H.E.; Wood, E.F.; Pan, M.; Fisher, C.K.; Miralles, D.G.; Van Dijk, A.I.; McVicar, T.R.; Adler, R.F. MSWEP V2 global 3-hourly 0.1 precipitation: Methodology and quantitative assessment. Bull. Am. Meteorol. Soc. 2019, 100, 473–500. [Google Scholar] [CrossRef]
- Yang, Y.; Wu, J.; Bai, L.; Wang, B. Reliability of gridded precipitation products in the Yellow River Basin, China. Remote Sens. 2020, 12, 374. [Google Scholar] [CrossRef]
- Wu, H.; Liu, D.; Huang, Q.; Zheng, H.; Zou, H.; Ye, N. Accuracy Assessment and Alternative Study of Precipitation Products in the Loess Plateau. J. Hydroelectr. Eng. 2021, 40, 31–40. (In Chinese) [Google Scholar] [CrossRef]
- Huang, R.; Yong, B.; Huang, F.; Wu, H.; Shen, Z.; Qian, D. A comprehensive investigation of three long-term precipitation datasets: Which performs better in the Yellow River basin? Int. J. Climatol. 2024, 44, 1302–1325. [Google Scholar] [CrossRef]
- Liang, X.; Wood, E.F.; Lettenmaier, D.P. Surface soil moisture parameterization of the VIC-2L model: Evaluation and modification. Glob. Planet. Change 1996, 13, 195–206. [Google Scholar] [CrossRef]
- Beven, K.J.; Kirkby, M.J. A physically based, variable contributing area model of basin hydrology/Un modèle à base physique de zone d’appel variable de l’hydrologie du bassin versant. Hydrol. Sci. J. 1979, 24, 43–69. [Google Scholar] [CrossRef]
- Niu, G.Y.; Yang, Z.L.; Dickinson, R.E.; Gulden, L.E. A simple TOPMODEL-based runoff parameterization (SIMTOP) for use in global climate models. J. Geophys. Res. Atmos. 2005, 110. [Google Scholar] [CrossRef]
- Kirkby, M. Hillslope runoff processes and models. J. Hydrol. 1988, 100, 315–339. [Google Scholar] [CrossRef]
- Pilgrim, D.H.; Chapman, T.G.; Doran, D.G. Problems of rainfall-runoff modelling in arid and semiarid regions. Hydrol. Sci. J. 1988, 33, 379–400. [Google Scholar] [CrossRef]
- Hirpa, F.A.; Salamon, P.; Beck, H.E.; Gulden, L.E. Calibration of the Global Flood Awareness System (GloFAS) using daily streamflow data. J. Hydrol. 2018, 566, 595–606. [Google Scholar] [CrossRef]
- GRDC: Long-Term Statistics and Annual Characteristics of GRDC Time Series Data/Online Provided by the Global Runoff Data Centre of WMO. Available online: https://grdc.bafg.de/data/data_portal/index.html (accessed on 5 February 2024).


| Runoff Dataset | Production Method | Forcing | Temporal Resolution | Spatial Resolution | Coverage | River Routing |
|---|---|---|---|---|---|---|
| GRFR V1.0 | Built using a global high-resolution and high-accuracy natural river runoff simulation system, with distributed hydrological model VIC and river routing model RAPID as the core, integrating multiple sources of data and modeling methods. | MSWEP 2.2 ERA5 | Daily | 0.05° | 1980–2019 | RAPID |
| GloFAS | This dataset is the result of extensive hydrological modeling that combines a grid-based hydrological routing model with a terrestrial surface model. During this process, the land surface model, known as H-TESSEL, calculates the water balance to generate surface and subsurface runoff, and the routing model, RAPID, is utilized to determine the flow within river channels. | ERA5 | Daily | 0.1° | 1979–2018 | LISLOOD |
| WGHM | A conceptual model based on the water balance method, which calculates the net runoff (precipitation minus evapotranspiration and changes in soil water storage) for each grid cell and routes the runoff through the river network to simulate river streamflow. | GSWP3 W5E5 v2.0 | Monthly | 0.5° | 1901–2019 | Fractional Routing scheme |
| Characteristics | Hequ | Fugu | Wubu | Longmen |
|---|---|---|---|---|
| Latitude | 39.37° N | 39.04° N | 37.45° N | 35.67° N |
| Longitude | 111.15° E | 111.08° E | 110.72° E | 110.58° E |
| Period of daily streamflow | 2006–2015 | 2006–2015 | 2006–2015 | 2006–2015 |
| Catchment Area (km2) | 397,658 | 404,039 | 433,514 | 497,552 |
| Evaluation Metric | Formula | Range of Values |
|---|---|---|
| Percent bias | − | |
| Correlation Coefficient | − | |
| Kling–Gupta Efficiency | − |
| Station | GRFR v1.0 | GloFAS | ||||
|---|---|---|---|---|---|---|
| KGE | CC | PBIAS | KGE | CC | PBIAS | |
| Hequ | −2.31 | 0.20 | 2.23 | −0.02 | 0.35 | 0.67 |
| Fugu | −2.18 | 0.20 | 2.12 | 0.04 | 0.36 | 0.60 |
| Wubu | −2.04 | 0.20 | 2.02 | 0.13 | 0.37 | 0.50 |
| Longmen | −2.40 | 0.21 | 2.16 | 0.13 | 0.42 | 0.48 |
Disclaimer/Publisher’s Note: The statements, opinions and data contained in all publications are solely those of the individual author(s) and contributor(s) and not of MDPI and/or the editor(s). MDPI and/or the editor(s) disclaim responsibility for any injury to people or property resulting from any ideas, methods, instructions or products referred to in the content. |
© 2025 by the authors. Licensee MDPI, Basel, Switzerland. This article is an open access article distributed under the terms and conditions of the Creative Commons Attribution (CC BY) license (https://creativecommons.org/licenses/by/4.0/).
Share and Cite
Cui, H.; Huang, C. Accuracy Evaluation of Multiple Runoff Products: A Case Study of the Middle Reaches of the Yellow River. Water 2025, 17, 461. https://doi.org/10.3390/w17030461
Cui H, Huang C. Accuracy Evaluation of Multiple Runoff Products: A Case Study of the Middle Reaches of the Yellow River. Water. 2025; 17(3):461. https://doi.org/10.3390/w17030461
Chicago/Turabian StyleCui, Handi, and Chang Huang. 2025. "Accuracy Evaluation of Multiple Runoff Products: A Case Study of the Middle Reaches of the Yellow River" Water 17, no. 3: 461. https://doi.org/10.3390/w17030461
APA StyleCui, H., & Huang, C. (2025). Accuracy Evaluation of Multiple Runoff Products: A Case Study of the Middle Reaches of the Yellow River. Water, 17(3), 461. https://doi.org/10.3390/w17030461