1. Introduction
With global climate warming and the impact of human activities, urban waterlogging disasters caused by extreme rainfall have become increasingly severe, with their frequency rising and affected areas expanding, often resulting in serious issues such as casualties, economic losses, traffic congestion, destruction of urban infrastructure, and public health problems [
1]. Timely access to urban waterlogging information can not only assist in disaster prevention and relief efforts but also help to identify and address problems with urban drainage facilities in advance.
There are various methods for obtaining urban waterlogging information. Traditionally, it mainly relies on field monitoring in disaster areas and statistical reports from authorities at all levels. However, the entire process takes a long time, requires significant labor and material resources, and suffers from information lag, making it difficult for government agencies to carry out timely flood disaster emergency response and management [
2]. Due to the low spatiotemporal resolution of the data obtained from remote sensing monitoring, coupled with the harsh weather conditions during floods, it is often unable to capture images in real time, failing to meet the needs of high-precision and real-time monitoring of urban waterlogging [
3]. High-definition surveillance cameras, which provide detailed information about the surrounding environment over a large area and are widely distributed throughout the city, serve as an effective way to monitor large-scale waterlogging. However, the difficulty of data acquisition makes this approach difficult to practice. Urban rainfall and flood simulation methods, based on numerical models, are complex and require many parameters, which are often difficult to obtain. Additionally, the large computational load of these models affects their real-time applicability [
4].
With the rapid development of the internet and the advent of the data explosion era, social media data have advantages such as strong real-time capability, broad sources, low acquisition cost, large data volume, and high content comprehensiveness [
5,
6], making it an effective tool for quickly obtaining urban flood information [
7,
8]. Researchers have already used social media data for urban waterlogging monitoring. For example, Zhang et al. [
9] used Sina Weibo data during the Wuhan waterlogging event in the summer of 2020 and identified 84.55% of the flood locations. Chen et al. [
10] proposed a waterlogging point extraction method based on the deep learning BERT-BiLSTM-CRF model, extracting waterlogging points from Sina Weibo, and the obtained urban waterlogging points covered no less than 82% of those officially reported in real time. In terms of disaster information extraction, methods like Chinese Named Entity Recognition (NER) have been applied to extract location names and other information from Weibo texts. However, due to issues such as Chinese word segmentation ambiguity and polysemy, Chinese NER is more challenging than English NER, and the precision of extraction still needs improvement compared to mainstream methods based on dictionaries, rules, machine learning, and deep learning [
11,
12,
13,
14]. Lin et al. [
15] produced a flood risk distribution map over a large area using Sina Weibo and a regionally stable deep neural network (RS-DNN). Jamaludin et al. [
16] obtained a flood risk distribution map by weighting the location and flood level in Twitter and the description of the flood. Sadiq et al. [
17] extracted various background information about urban waterlogging points from Twitter, including demands and requests, reports on disaster impact or damage, and situational information. Huang et al. [
3] predicted flood occurrence probabilities using the Normalized Difference Water Index (NDWI) and Twitter data. However, in these studies, it is difficult to validate the accuracy of urban waterlogging points extracted from social media due to the insufficiency of observed data. Additionally, keyword selection may be subject to subjective influences, leading to incomplete extraction of urban waterlogging information.
The flood in Guilin on 19 June 2024 was the largest flood in the region since 1998, causing severe waterlogging and having a significant impact on the local area. Therefore, this study employs a word semantic similarity calculation method to construct a keyword database combined with web scraping technology to collect text data from the Weibo platform. It utilizes the BERT-BILSTM-CRF deep learning model and large language models (GPT-3.5-turbo and ERNIE-3.5-128K) to extract the locations of urban waterlogging points in Guilin’s flood event on 19 June 2024. By comparing the extracted urban waterlogging points with the officially reported points, the accuracy of the three methods is evaluated. Additionally, an urban waterlogging hazard distribution map is generated based on the frequency of urban waterlogging point occurrences. This research aims to provide a scientific basis for urban waterlogging hazard management.
2. Study Area and Data
2.1. Overview of the Study Area
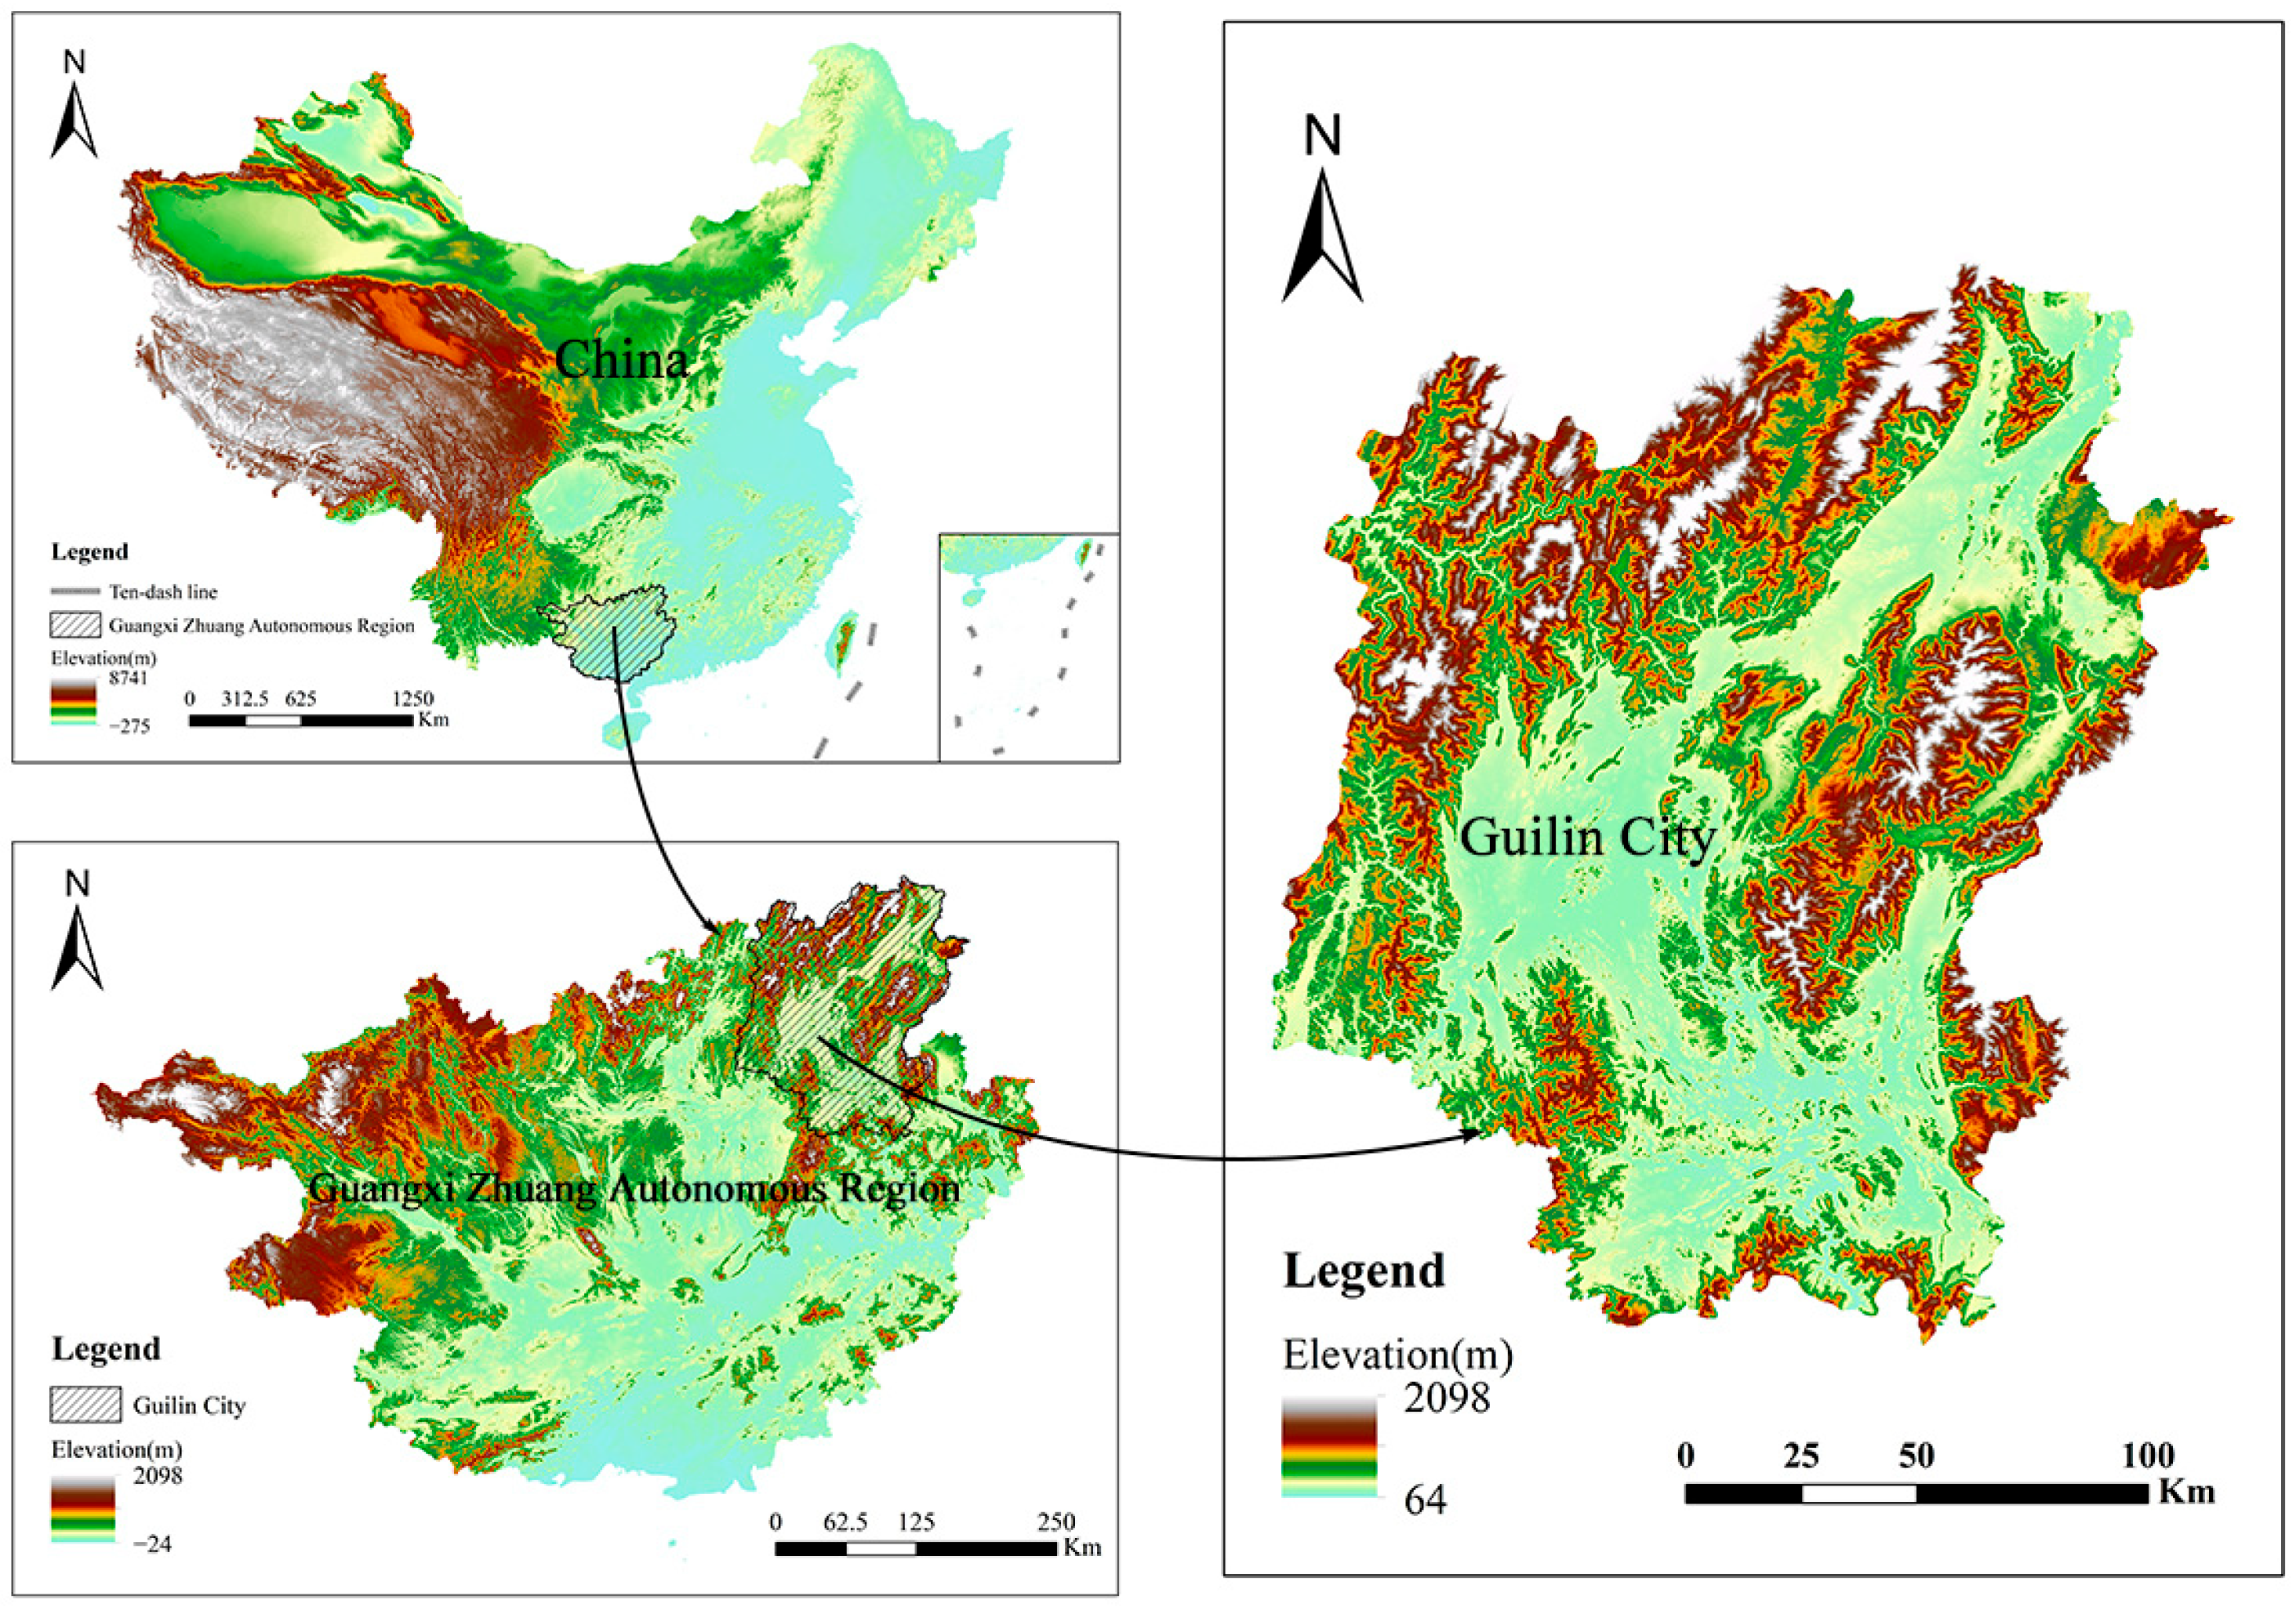
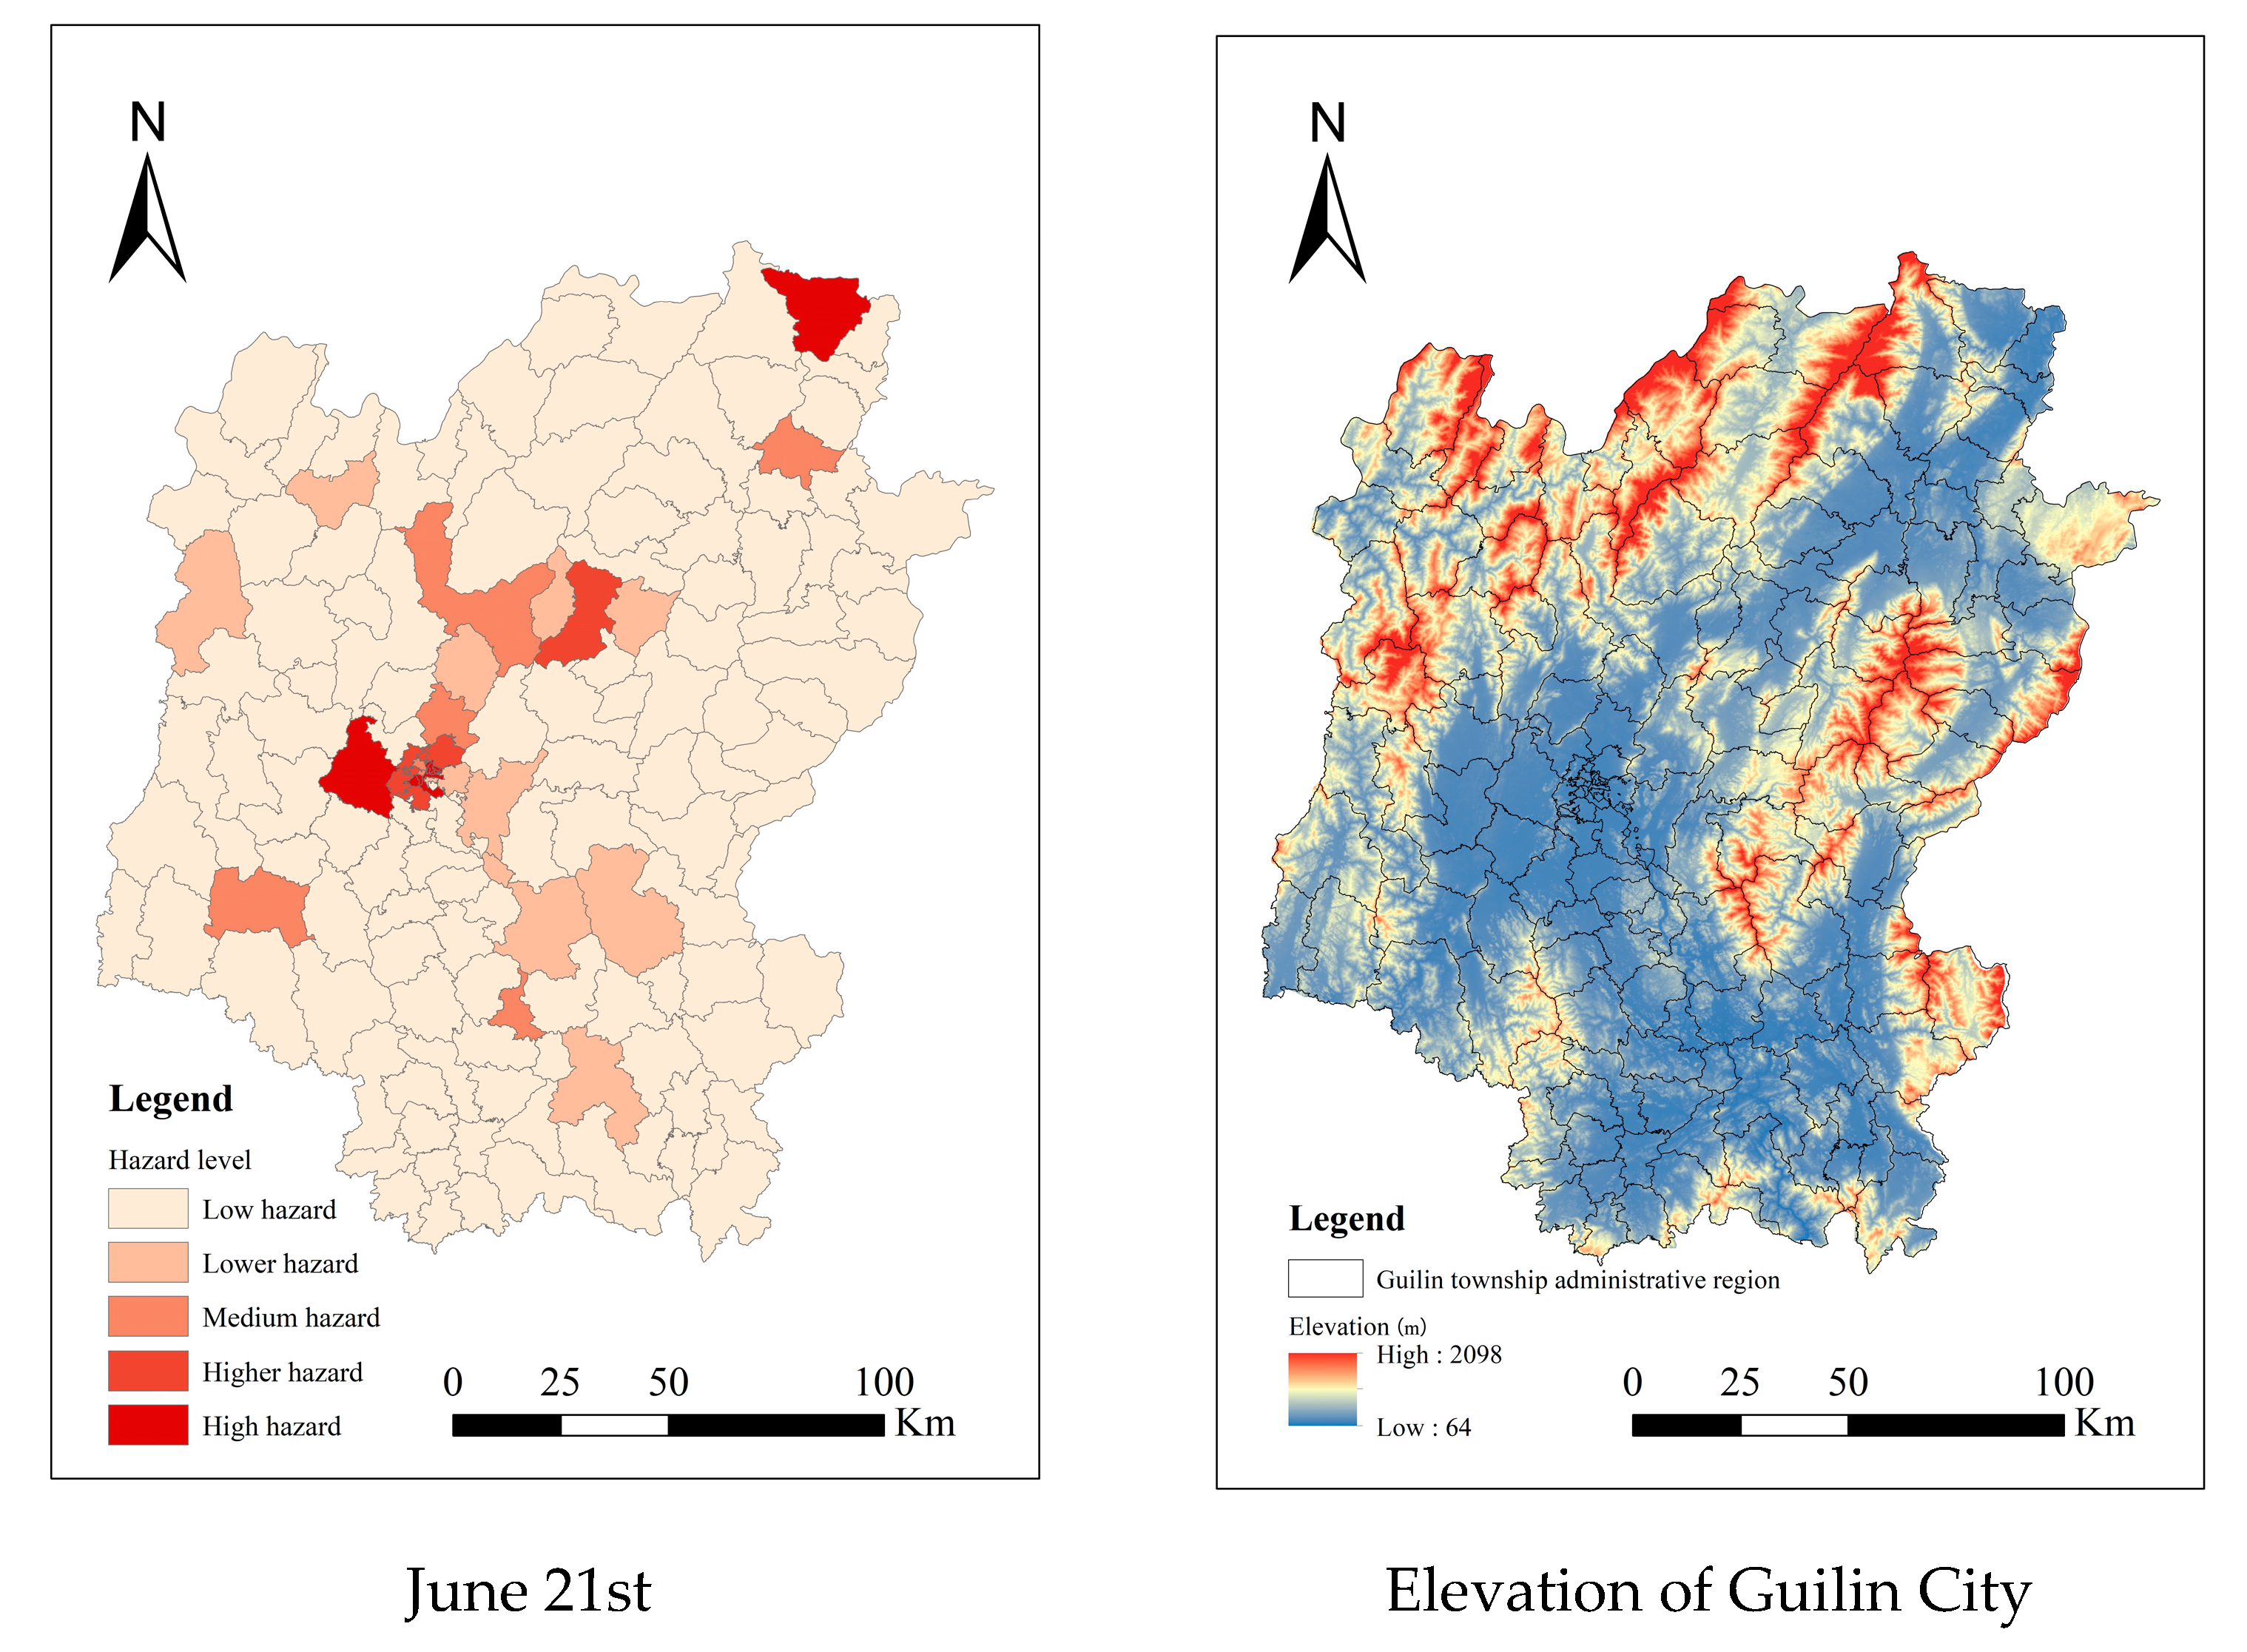
Guilin is located in the southwestern part of the Nanling Mountains, at the southern end of the Xiang-Gui Corridor, in the northeastern part of the Guangxi Zhuang Autonomous Region. The city lies between longitudes 109°36′50″–111°29′30″ E and latitudes 24°15′23″–26°23′30″ N, with a total length of 236 km from north to south and a width of 189 km from east to west, as shown in
Figure 1.
Guilin is situated at a low latitude and has a subtropical monsoon climate. The climate is mild, with abundant rainfall, a long frost-free period, plenty of sunshine, and ample heat. The summers are long and winters are short, with clear seasonal differences and rainfall and heat occurring in the same season. The climate is very favorable, with an average annual number of rainy days of 166 and the longest continuous rainfall lasting up to 30 days. The average annual precipitation from 2014 to 2024 is 1901.3 mm, and the average annual relative humidity is 76%.
2.2. 6.19 Guilin Flood
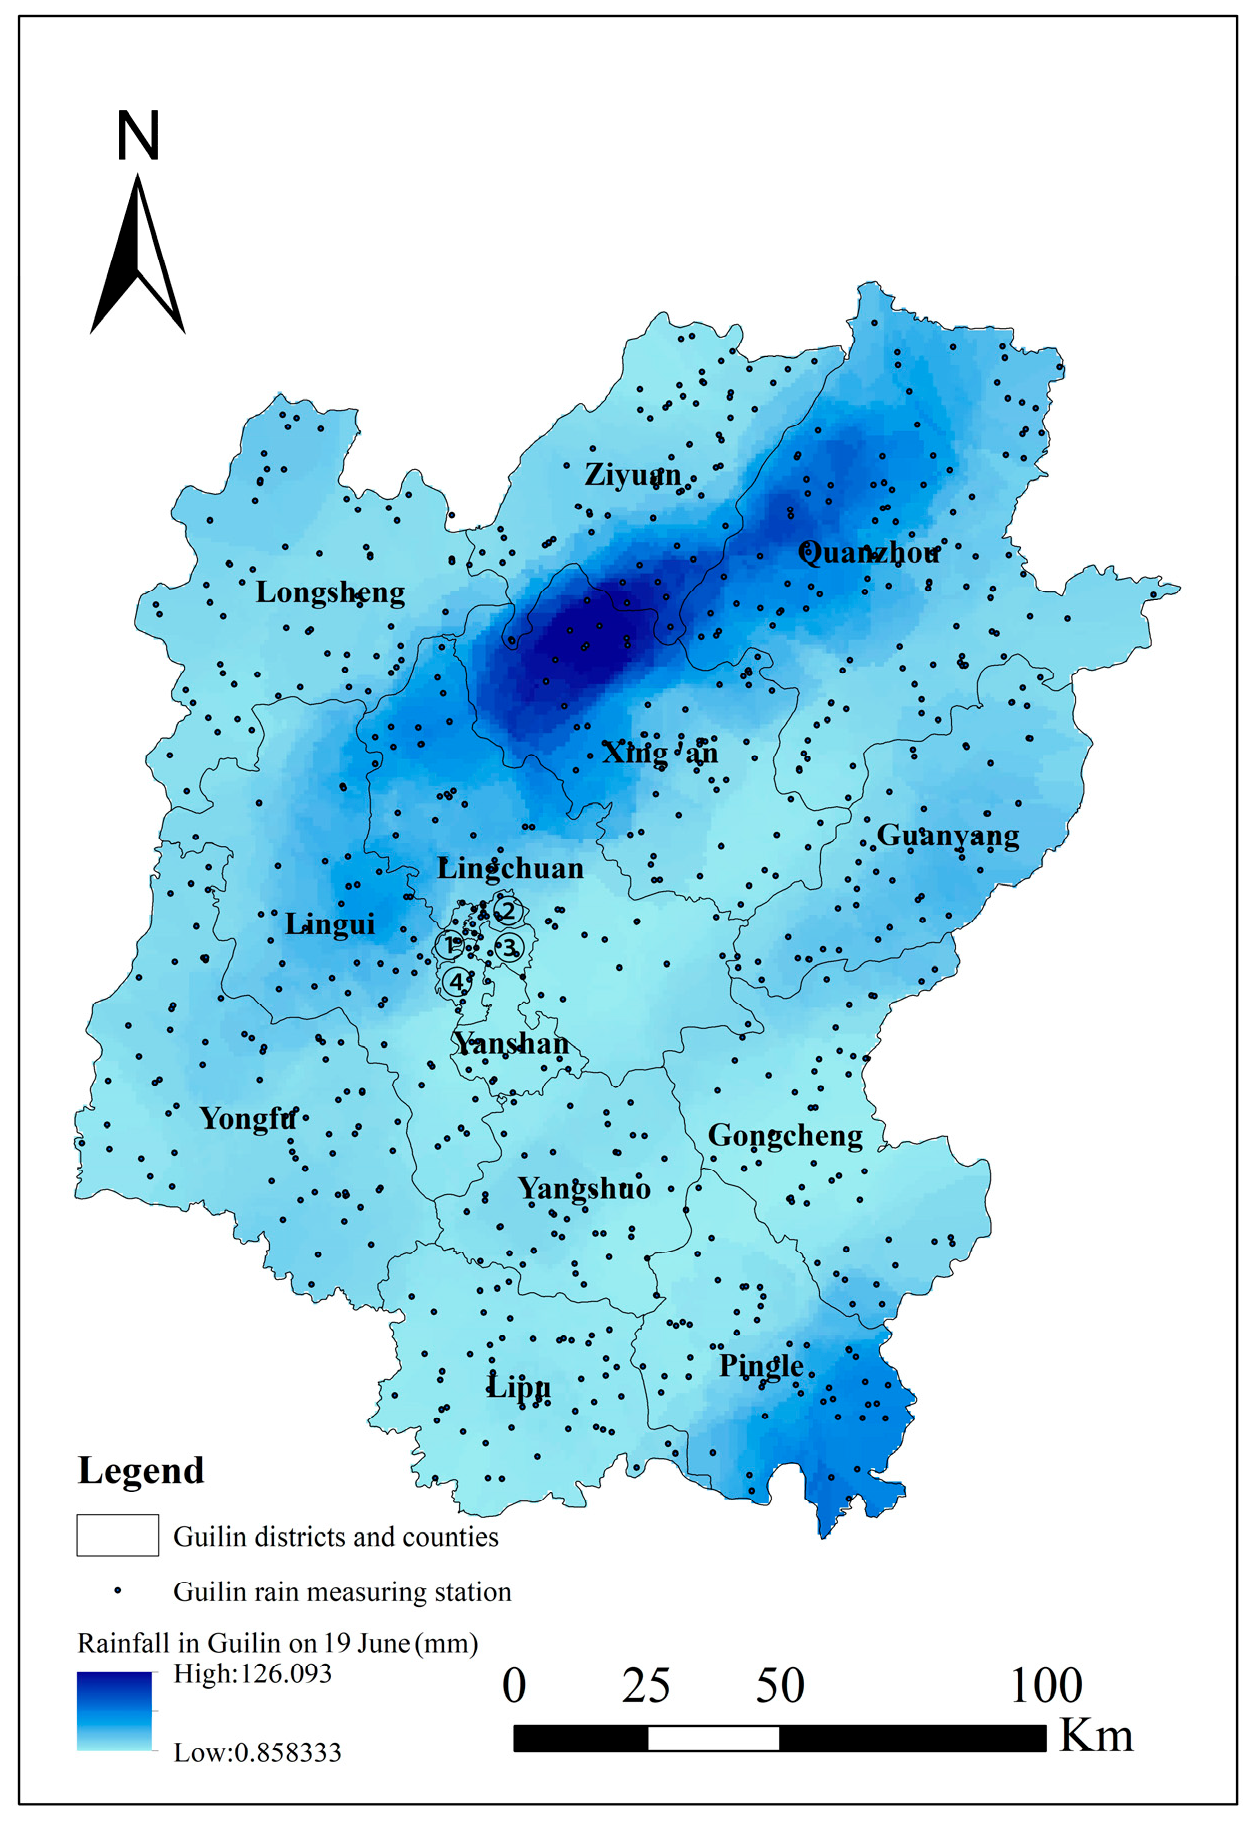
From 12 to 19 June 2024, Guilin experienced continuous heavy rainfall, with 38 meteorological stations breaking their all-time 24 h rainfall records. At 8 o’clock on 12 June, the Guilin Hydrology Center observed that under the influence of heavy rainfall, the Guijiang River, Luoqing River, Xiangjiang River, Guyi River, and Zijiang main tributaries had a rising process of 0.3–1.1 m. On 17 June, due to the heavy rain, water levels in the Li River Scenic Area rose, and a notice was issued to suspend navigation. On 19 June, continuous heavy rainfall and the release of water from upstream reservoirs caused rapid rises in water levels along major rivers in Guilin, Guangxi. By 17:00, the water level at Guilin hydrological station reached 148.55 m, surpassing the 148.4 m of the 1998 Li River severe flood, exceeding the warning level by 2.55 m, marking the largest flood in Guilin since 1998. The rainfall on 19 June is shown in
Figure 2, which was generated using Kriging interpolation based on data from Guilin’s rainfall stations. On that day, the main urban area of Guilin suffered severe urban waterlogging, with many scenic spots closed, bus routes suspended, some schools closed, and the Liu Pi Ma Scenic Area submerged with power outages in nearby areas. Parts of Provincial Road 301 in Quanzhou County collapsed, blocking traffic, with five bus routes suspended and twenty-one others rerouted or shortened. At Guilin Station, water accumulation affected passenger movement, and passenger services were temporarily moved to Guilin North Station, with some trains either suspended or running at reduced speeds. On the evening of 19 June, the Guilin Flood Control and Drought Relief Command announced that the period from 12 to 19 June had seen continuous heavy rainfall, breaking rainfall records at 38 meteorological stations. Normal operations resumed at Guilin Station on 21 June.
2.3. Basic Data
2.3.1. Weibo Data
Social media platforms are diverse, including WeChat, blogs, Bilibili, Douyin, Xiaohongshu, Sina Weibo, and others. Among them, Sina Weibo is the most widely used source of data in China. As an active social platform, Sina Weibo’s data encompasses a variety of content, such as users’ personal experiences, eyewitness accounts, and news reports. This information is produced in real time, accurately reflecting events that occur in specific regions at specific times. After preprocessing, this study obtained a total of 1033 Weibo posts closely related to the research topic.
2.3.2. Other Data
The rainfall data for Guilin City comes from the data published by the Rainfall Monitoring Module of the Guangxi Zhuang Autonomous Region Water Resources Department. It includes data from 10,651 stations, which are widely distributed across various towns and villages in Guangxi. This study obtained hourly rainfall data from 19 June 2024 to 21 June 2024 in Guilin.
Wikipedia, similar to Baidu Baike, provides detailed explanations for each entry. It is language-standardized, has minimal ambiguity in its sentences, and offers high-quality content across a broad range of fields, with an open access model. The latest version can be downloaded directly from Wikipedia’s data download site or by visiting
https://dumps.wikimedia.org/zhwiki/ (accessed on 25 August 2024) to access historical versions. This study selected the most recent version, the entry data updated on 1 March 2024, as the training corpus for the model calculating the similarity of floods, urban waterlogging, and ponding water.
2.4. Data Preprocessing
This study used web scraping techniques to filter Weibo posts based on keywords (such as “floods”, “ponding water”, “urban waterlogging”, “submerged”, “water immersion”) and the time period (from 17 June 2024 to 21 June 2024). A total of 4205 Weibo posts were successfully retrieved, which is 368 more posts compared to using only keywords like “floods”, “urban waterlogging”, and “ponding water”.
After acquiring the data, detailed preprocessing was carried out to improve its quality and usability:
- (1)
Deduplication: Since Weibo texts may contain multiple keywords and the same content may be repeatedly retrieved when users forward or slightly modify their posts, we used the merge_similar_texts function in Python to merge Weibo posts with over 80% similarity to eliminate duplicate content.
- (2)
Removal of Irrelevant Data: Given the similarity between Chinese characters, some non-target data may be captured. For example, “ponding water” could refer to fluid accumulation in a medical context rather than urban waterlogging. We cleaned the data by excluding all irrelevant entries.
3. Methods
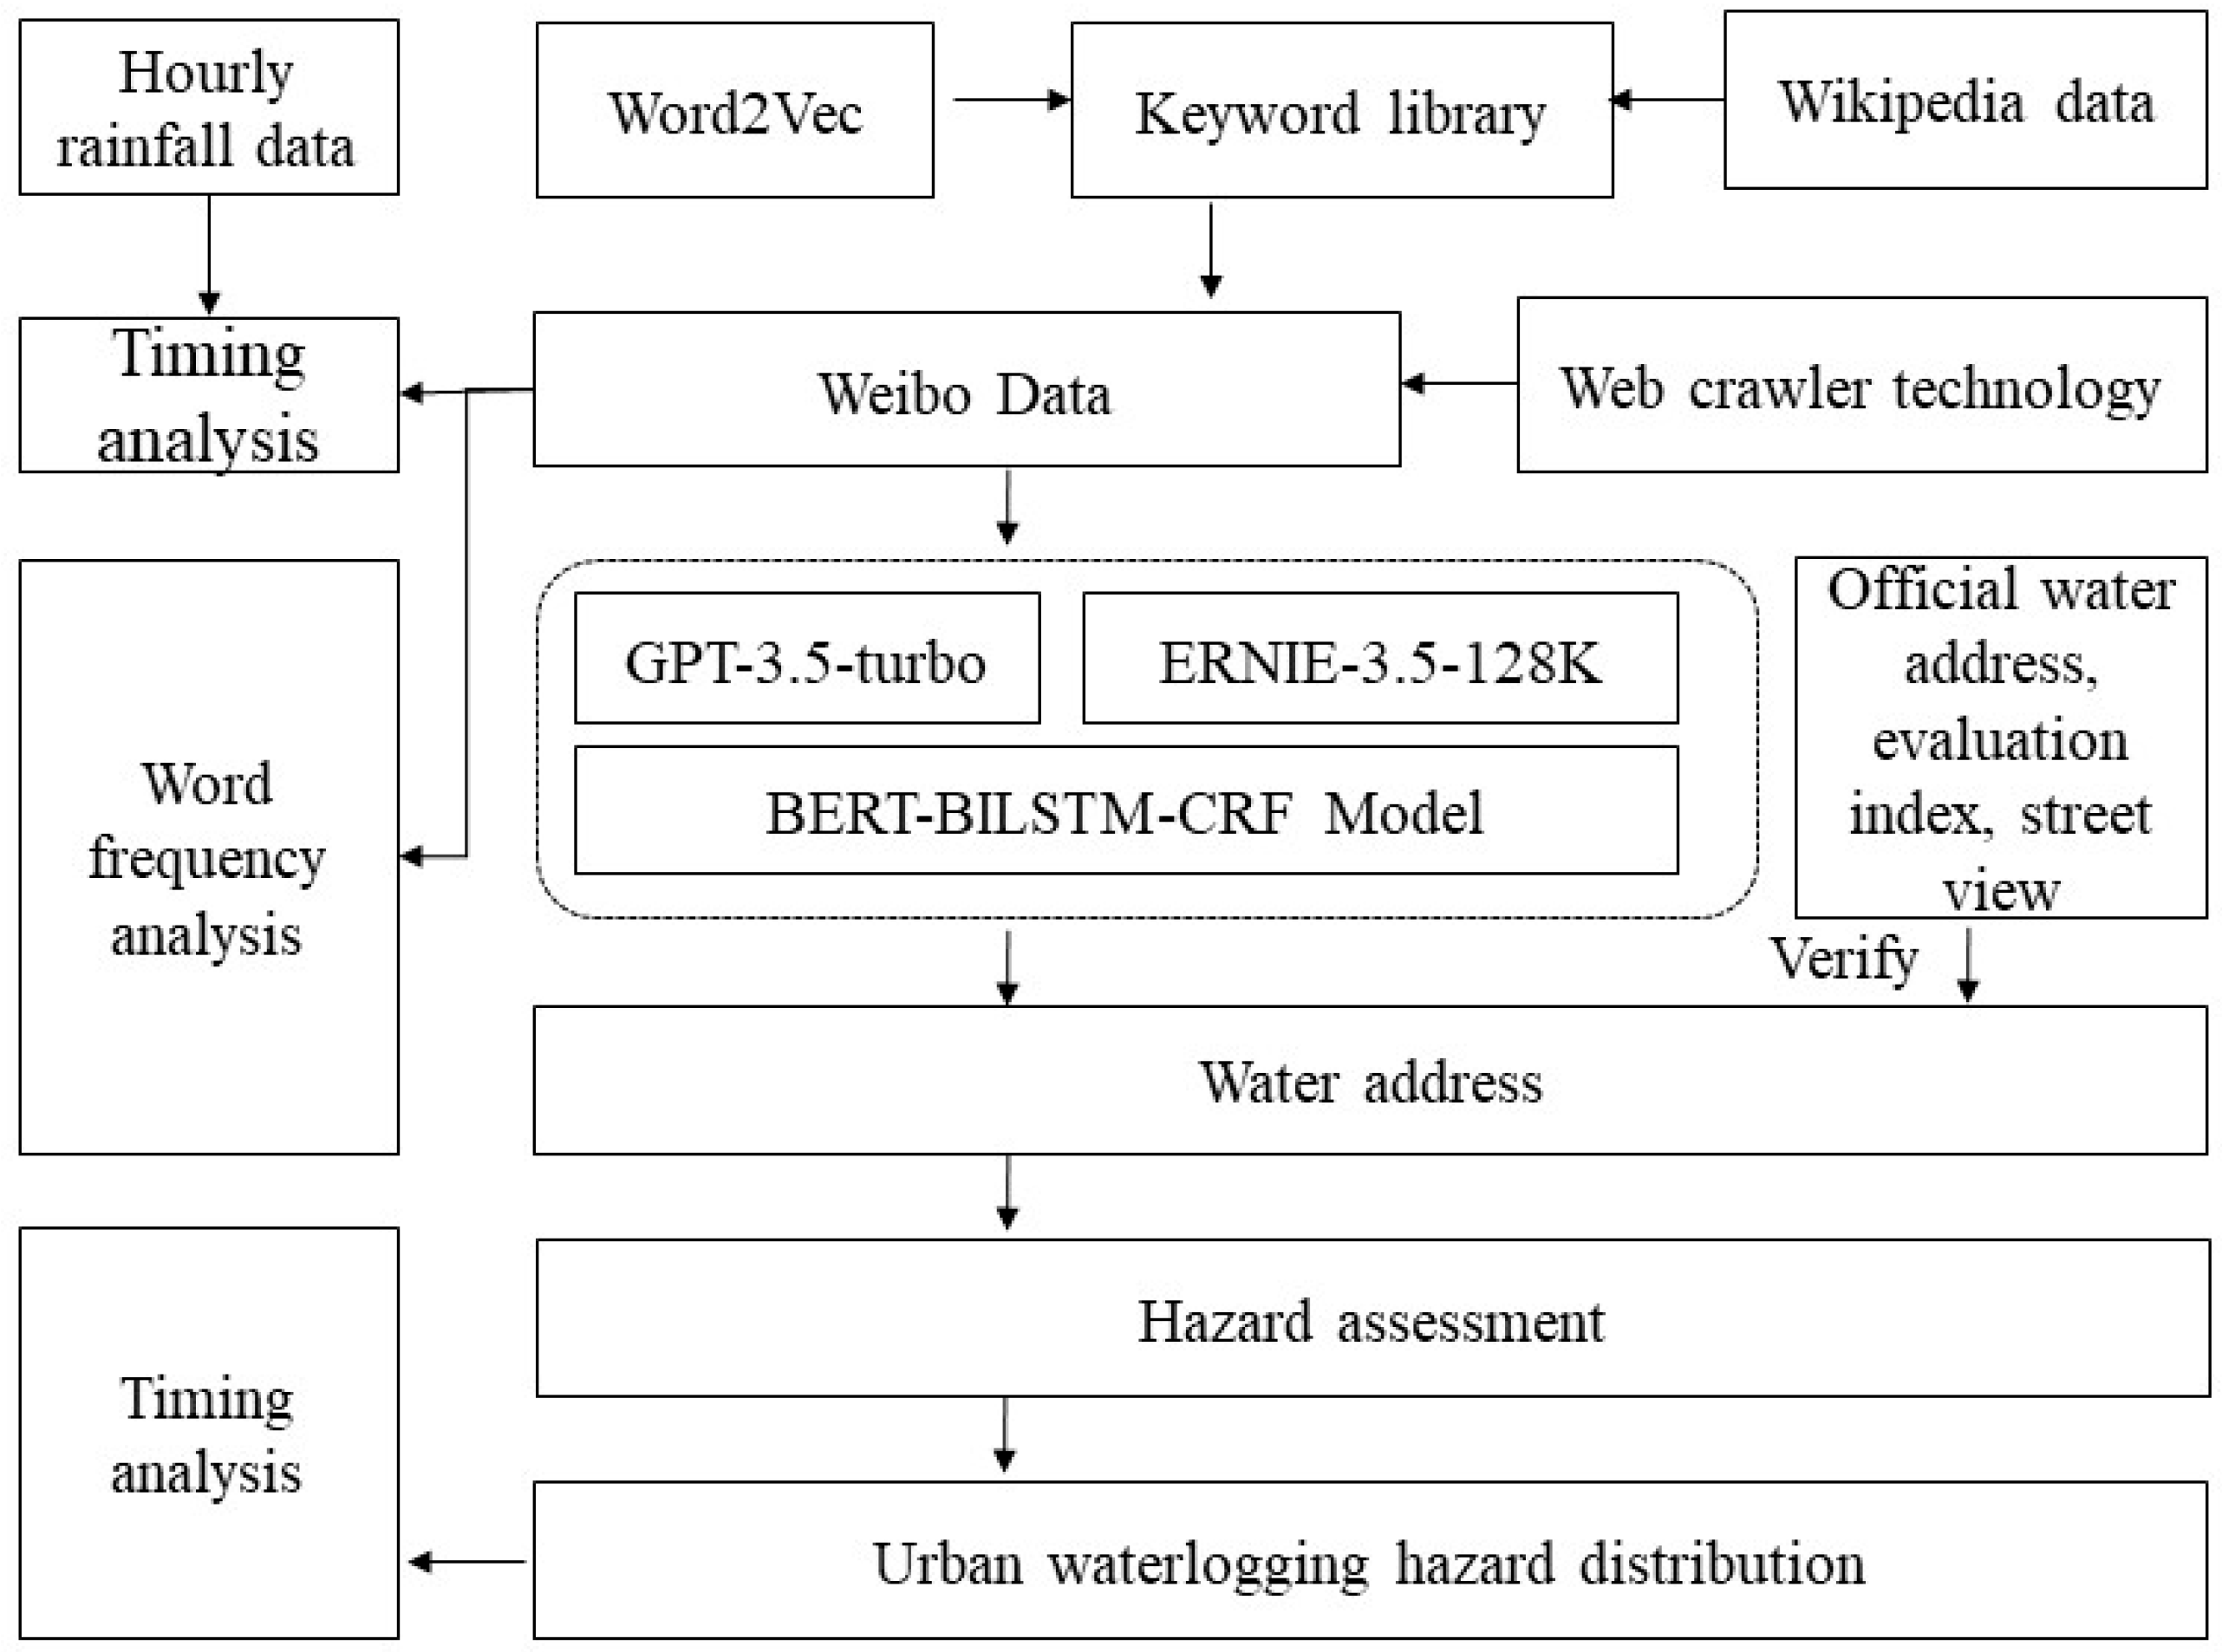
From
Figure 3, this study begins with preprocessing Wikipedia data, including steps such as removing unnecessary English content and converting traditional Chinese characters to simplified Chinese to ensure data accuracy and usability. Subsequently, the Word2Vec method is used to train a word similarity model, calculating the semantic similarity of terms related to “urban waterlogging” and other words, and constructing a targeted keyword database. Based on this, web scraping technology is applied to collect data from Weibo.
The processing of Weibo data is divided into two main aspects. First, a temporal analysis is conducted with hourly rainfall data to explore the relationship between the number of posts and the average hourly rainfall, and daily Weibo data are analyzed to extract thematic keywords and perform word frequency analysis. Second, urban waterlogging addresses are extracted separately using the BERT-BILSTM-CRF model, the GPT-3.5-turbo model, and the ERNIE-3.5-128K model from Weibo data. The extracted addresses are compared with officially reported urban waterlogging locations, and 10% of the samples are randomly selected for manual annotation to calculate evaluation metrics and compare the performance of the three methods. Finally, the model that performs well is validated with additional urban waterlogging points using street view images.
Based on the best-performing method, urban waterlogging points are extracted and classified according to the frequency of mentions. A higher frequency indicates a greater urban waterlogging hazard, while a lower frequency corresponds to a lower hazard. For specific hazard levels, this paper uses the natural breaks method to determine the classification standard based on the day with the highest frequency. The classification standards are as follows: 0–4 occurrences for low hazard, 5–14 occurrences for lower hazard, 15–34 occurrences for medium hazard, 35–51 occurrences for higher hazard, and above 51 occurrences for high hazard. These urban waterlogging addresses are mapped to their corresponding townships, and spatial distribution is visualized at the township level. Additionally, a temporal analysis of daily urban waterlogging hazard data is conducted to reveal its dynamic patterns.
3.1. Keyword Construction for Urban Waterlogging
The keyword library can be built using the TF-IDF algorithm [
18] or similarity-based methods [
19]. Compared to the former, the latter can effectively capture semantic relationships between words, dynamically update and adjust word vectors, and adapt to different contexts with higher flexibility. Therefore, this paper adopts the similarity-based method for constructing the keyword library.
Wikipedia is chosen as the corpus for this study. The initial Wikipedia file is in XML format, which can be directly processed using the WikiCorpus method provided by Python’s Gensim package (in XML BZ2 format, no need for extraction) and converted into TXT format. The documents in the Wiki corpus contain Traditional Chinese, and OpenCC is used to convert it to Simplified Chinese. The converted corpus contains many English words, which are removed to avoid affecting the trained word vectors. Finally, Python’s Jieba library is used for tokenization.
Word2Vec is a neural network-based word embedding method that maps words to continuous vector spaces, with semantically similar words being closer together in the vector space. There are two main training methods: Skip-gram and CBOW (Continuous Bag of Words). Skip-gram performs better on large corpora, capturing rare words and fine-grained word relationships but requires more training time. CBOW is faster and works better on smaller corpora but is less effective in capturing rare words and fine-grained relationships [
20]. This paper uses the Skip-gram method for model training [
21]. The vector size (size) is set to 400, which is large enough to capture more word features but requires more computational resources and time. The context window size (window) is set to 5, meaning the model considers a maximum distance of 5 surrounding words during training. A larger window captures broader contextual information. The min_count (minimum word frequency) is set to 5, meaning words with a frequency lower than this threshold are ignored during training.
Finally, the trained model was used to calculate the top 20 words with the highest similarity to “floods”, “urban waterlogging”, and “ponding water”. The results are shown in
Table 1. Based on the characteristics of urban waterlogging and previous keyword selections [
22,
23,
24], the final keywords selected for extracting urban waterlogging data from Weibo are floods, ponding water, urban waterlogging, submerged, and water immersion.
3.2. Named Entity Recognition (NER)
3.2.1. BERT—BiLSTM—CRF Model
A Transformer is a deep learning architecture based on the self-attention mechanism. BERT leverages the encoder part of the Transformer to capture deep semantic information in text through bidirectional context modeling and self-attention, enhancing natural language understanding capabilities [
25]. LSTM (Long Short-Term Memory) is a type of recurrent neural network (RNN) capable of handling long-range dependencies. BiLSTM consists of two LSTMs: one processes the sequence from left to right, and the other processes it from right to left. This allows BiLSTM to capture dependencies between distant words in a sentence. By using both forward and backward LSTMs, BiLSTM can leverage both the preceding and succeeding contexts of words. Building upon the contextual representations provided by BERT, BiLSTM can further process and integrate these representations to capture deeper features within the sequence [
11,
26].
CRF (Conditional Random Field) is a probabilistic graphical model used for sequence labeling tasks. Its primary feature is the ability to consider dependencies between labels, which is useful for solving the label consistency problem in sequence labeling. By defining a state transition matrix, CRF can capture dependencies between labels in the sequence, improving the accuracy of the labeling process. CRF employs dynamic programming algorithms (such as the Viterbi algorithm) to find the globally optimal label sequence. On top of the feature representations provided by BERT and BiLSTM, CRF can further optimize the final label sequence, ensuring the coherence and consistency of the output.
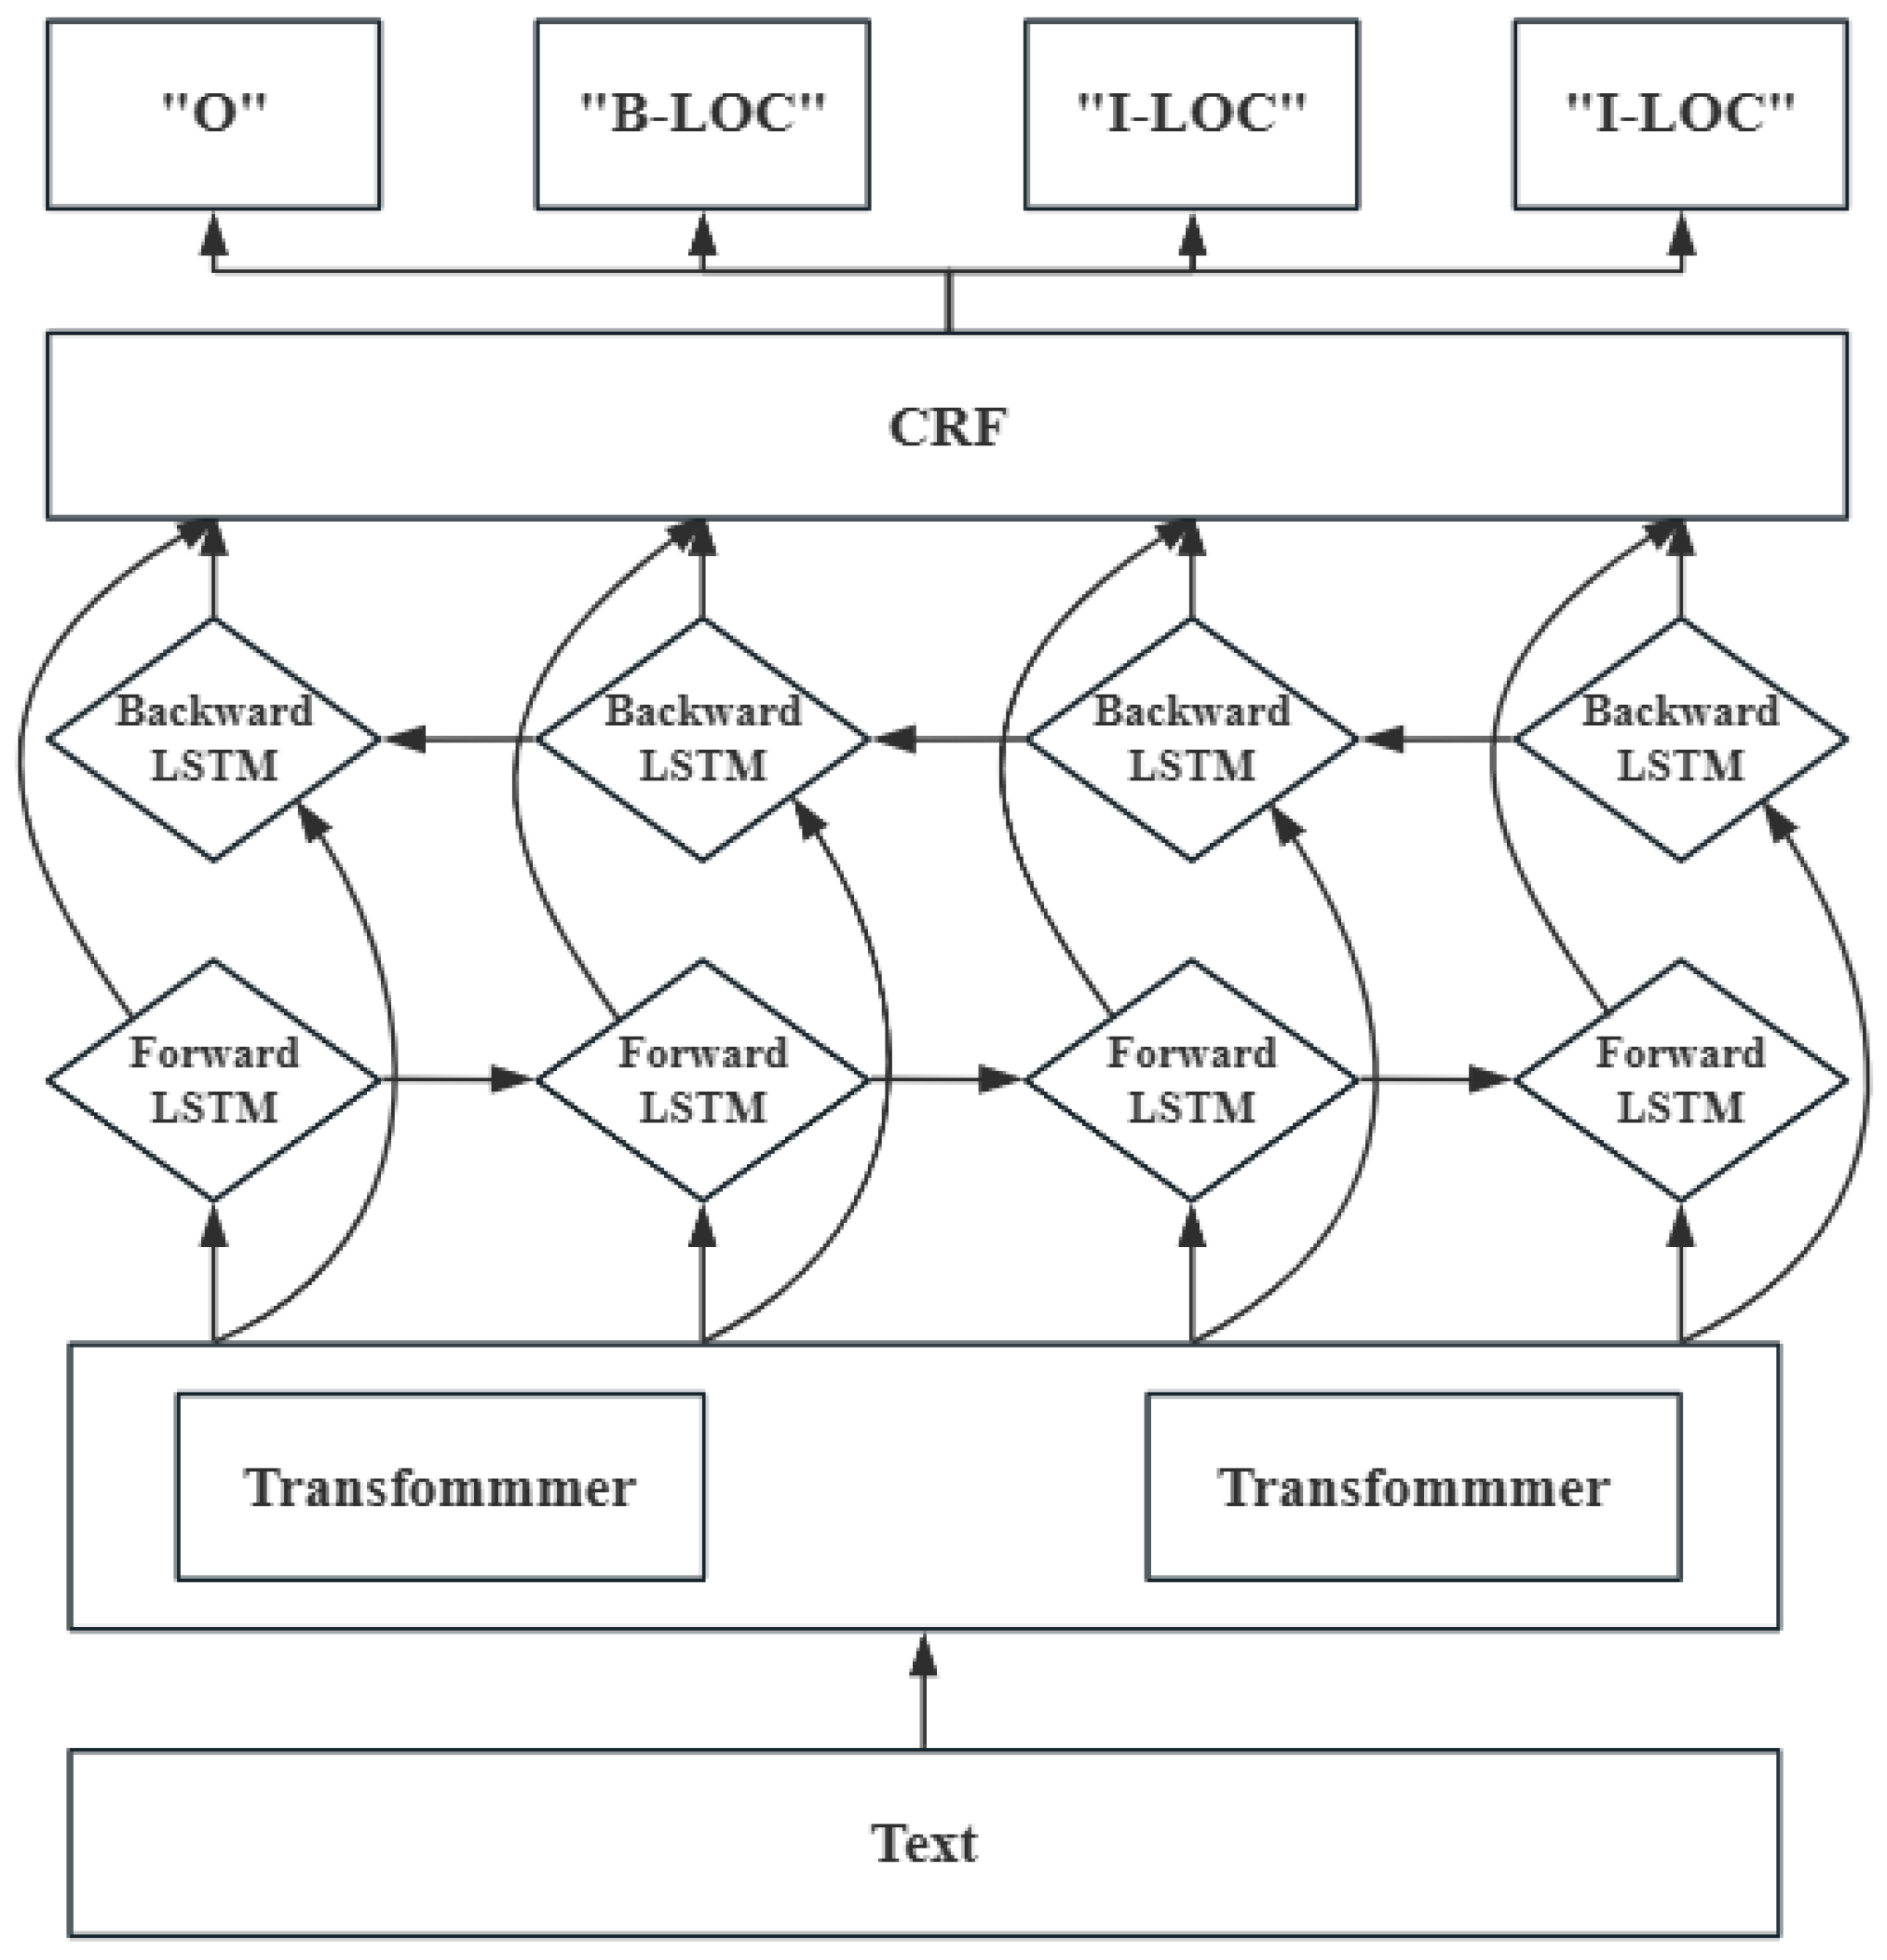
The structure of the BERT—BiLSTM—CRF model is shown in
Figure 4. Input Layer: The input text is tokenized and converted into the format required by BERT. BERT Layer: The pre-trained BERT model encodes the input text, generating the contextual representation for each word. BiLSTM Layer: The output from BERT is fed into BiLSTM, which further processes it to capture features from the sequence. CRF Layer: The output of BiLSTM is used as input to the CRF layer, where sequence labeling is performed, and the optimal label is generated. A few examples of the generation of the optimal label, as shown in
Table 2.
This paper uses labeled data downloaded from GitHub
https://github.com/zjy-ucas/ChineseNER (accessed on 13 June 2024) to train a named entity recognition (NER) model. The entity types include three categories: person, organization, and location. This study only focuses on recognizing the location entity type, but the person and organization categories are also included in the training. This approach helps improve the model’s generalization ability and robustness, and reduces the hazard of overfitting.
3.2.2. Large Language Models
This paper utilizes large language models to perform named entity recognition (NER) tasks. First, we construct prompt words. During this stage, we conducted repeated experiments and comparisons to determine the most effective prompt. When extracting location names related to waterlogging in Guilin City, we used the following prompt: “Weibo text content + Please extract the addresses of urban waterlogging or urban waterlogging events in Guilin City from the above content, only output the addresses”. This prompt ensures that the extracted address information is related to ponding water or urban waterlogging events while outputting only the address information, making it easier for subsequent processing.
Next, we input the constructed prompt and the Weibo text content into the large model. The large model processes the input prompt and Weibo content, generating the extracted address information. The powerful processing capability of the large model ensures the accuracy and relevance of the extraction results. Due to the large volume of data we need to process, manual input would consume significant time and effort. To improve efficiency, we utilized API calls provided by OpenAI and Baidu Smart Cloud. By writing scripts in Python3.8, we were able to call the GPT-3.5-turbo model and the ERNIE-3.5-128K model, enabling continuous input and output, and automating the extraction of location information from all Weibo texts. Specifically, the Python script reads data files containing Weibo text content, processes each Weibo entry using the constructed prompt, and calls the gpt-3.5-turbo model and ERNIE-3.5-128K model via API. After processing, the models return the extracted location information, and the script aggregates and stores these data, ultimately forming a complete dataset. Using this automated method, we efficiently extract location information related to ponding water or urban waterlogging in Guilin City from a large volume of Weibo data.
3.3. Model Performance Evaluation
This paper evaluates the models using four metrics: accuracy, precision, recall, and F1 score. Accuracy represents the proportion of correctly classified samples among the total samples, as shown in Formula (1). Precision measures the proportion of predicted positive samples that are actually positive, as shown in Formula (2). Recall measures the proportion of actual positive samples that are correctly predicted as positive, as shown in Formula (3). The F1 score is the harmonic mean of precision and recall, which is used to evaluate the overall accuracy and recall capability of the model, as shown in Formula (4).
where
TP (True Positive): the number of actual positive samples correctly predicted as positive;
TN (True Negative): the number of actual negative samples correctly predicted as negative;
FP (False Positive): the number of actual negative samples incorrectly predicted as positive;
FN (False Negative): the number of actual positive samples incorrectly predicted as negative.
3.4. Hazard Assessment Criteria
Using three models—the BERT-BILSTM-CRF model, the GPT-3.5-turbo model, and the ERNIE-3.5-128K model—location names from Weibo text are extracted and initially presented in textual form. To make them more intuitive and facilitate subsequent analysis, these location names need to be converted into geographic coordinates and displayed on a map. This study uses the Gaode Geocoding API to perform the conversion, transforming address text into latitude and longitude coordinates. The geocoding service URL is
https://lbs.amap.com/api/javascript-api/guide/services/geocoder (accessed on 19 November 2024). The API parameters primarily include address (address) and key (user key). The address format follows the structure “Province_City_District_Town_Village(Street)_House Number”, while the key is an access token obtained through user registration. The API response is in JSON format by default, from which the location parameter is extracted to obtain the latitude and longitude coordinates (Gaode coordinates).
During data processing, records with identical latitude and longitude (i.e., the same urban waterlogging point) are merged, and their occurrence frequencies are counted to analyze different urban waterlogging addresses and their frequency of mention.
Since the severity and impact of urban waterlogging vary across different points, some are minor while others are more severe. When a specific urban waterlogging point experiences severe damage and has a widespread impact, it tends to receive higher exposure on social media, with its location name appearing more frequently. This indicates a higher level of urban waterlogging hazard intensity. Based on this, ArcGIS10.5 is used to convert the urban waterlogging point data, which includes coordinates and occurrence counts, into spatial information. The frequency attribute is then assigned to the corresponding township, ultimately producing a township-level urban waterlogging hazard intensity distribution map.
4. Results and Discussions
4.1. Results Validation
This paper comprehensively summarizes the road urban waterlogging situations in Guilin City mentioned in three reports published by Guilin Daily. These reports were released on 19 June at 18:00
https://news.qq.com/rain/a/20240619A0831000 (accessed on 22 June 2024), 20 June at 7:30
https://news.qq.com/rain/a/20240620A00YUA00 (accessed on 22 June 2024), and 21 June at 10:00
https://news.qq.com/rain/a/20240621A02RA600 (accessed on 22 June 2024), and they provided detailed information on the urban waterlogging conditions in various districts and streets. Based on this official data, we evaluated the coverage of the urban waterlogging points extracted by the three methods.
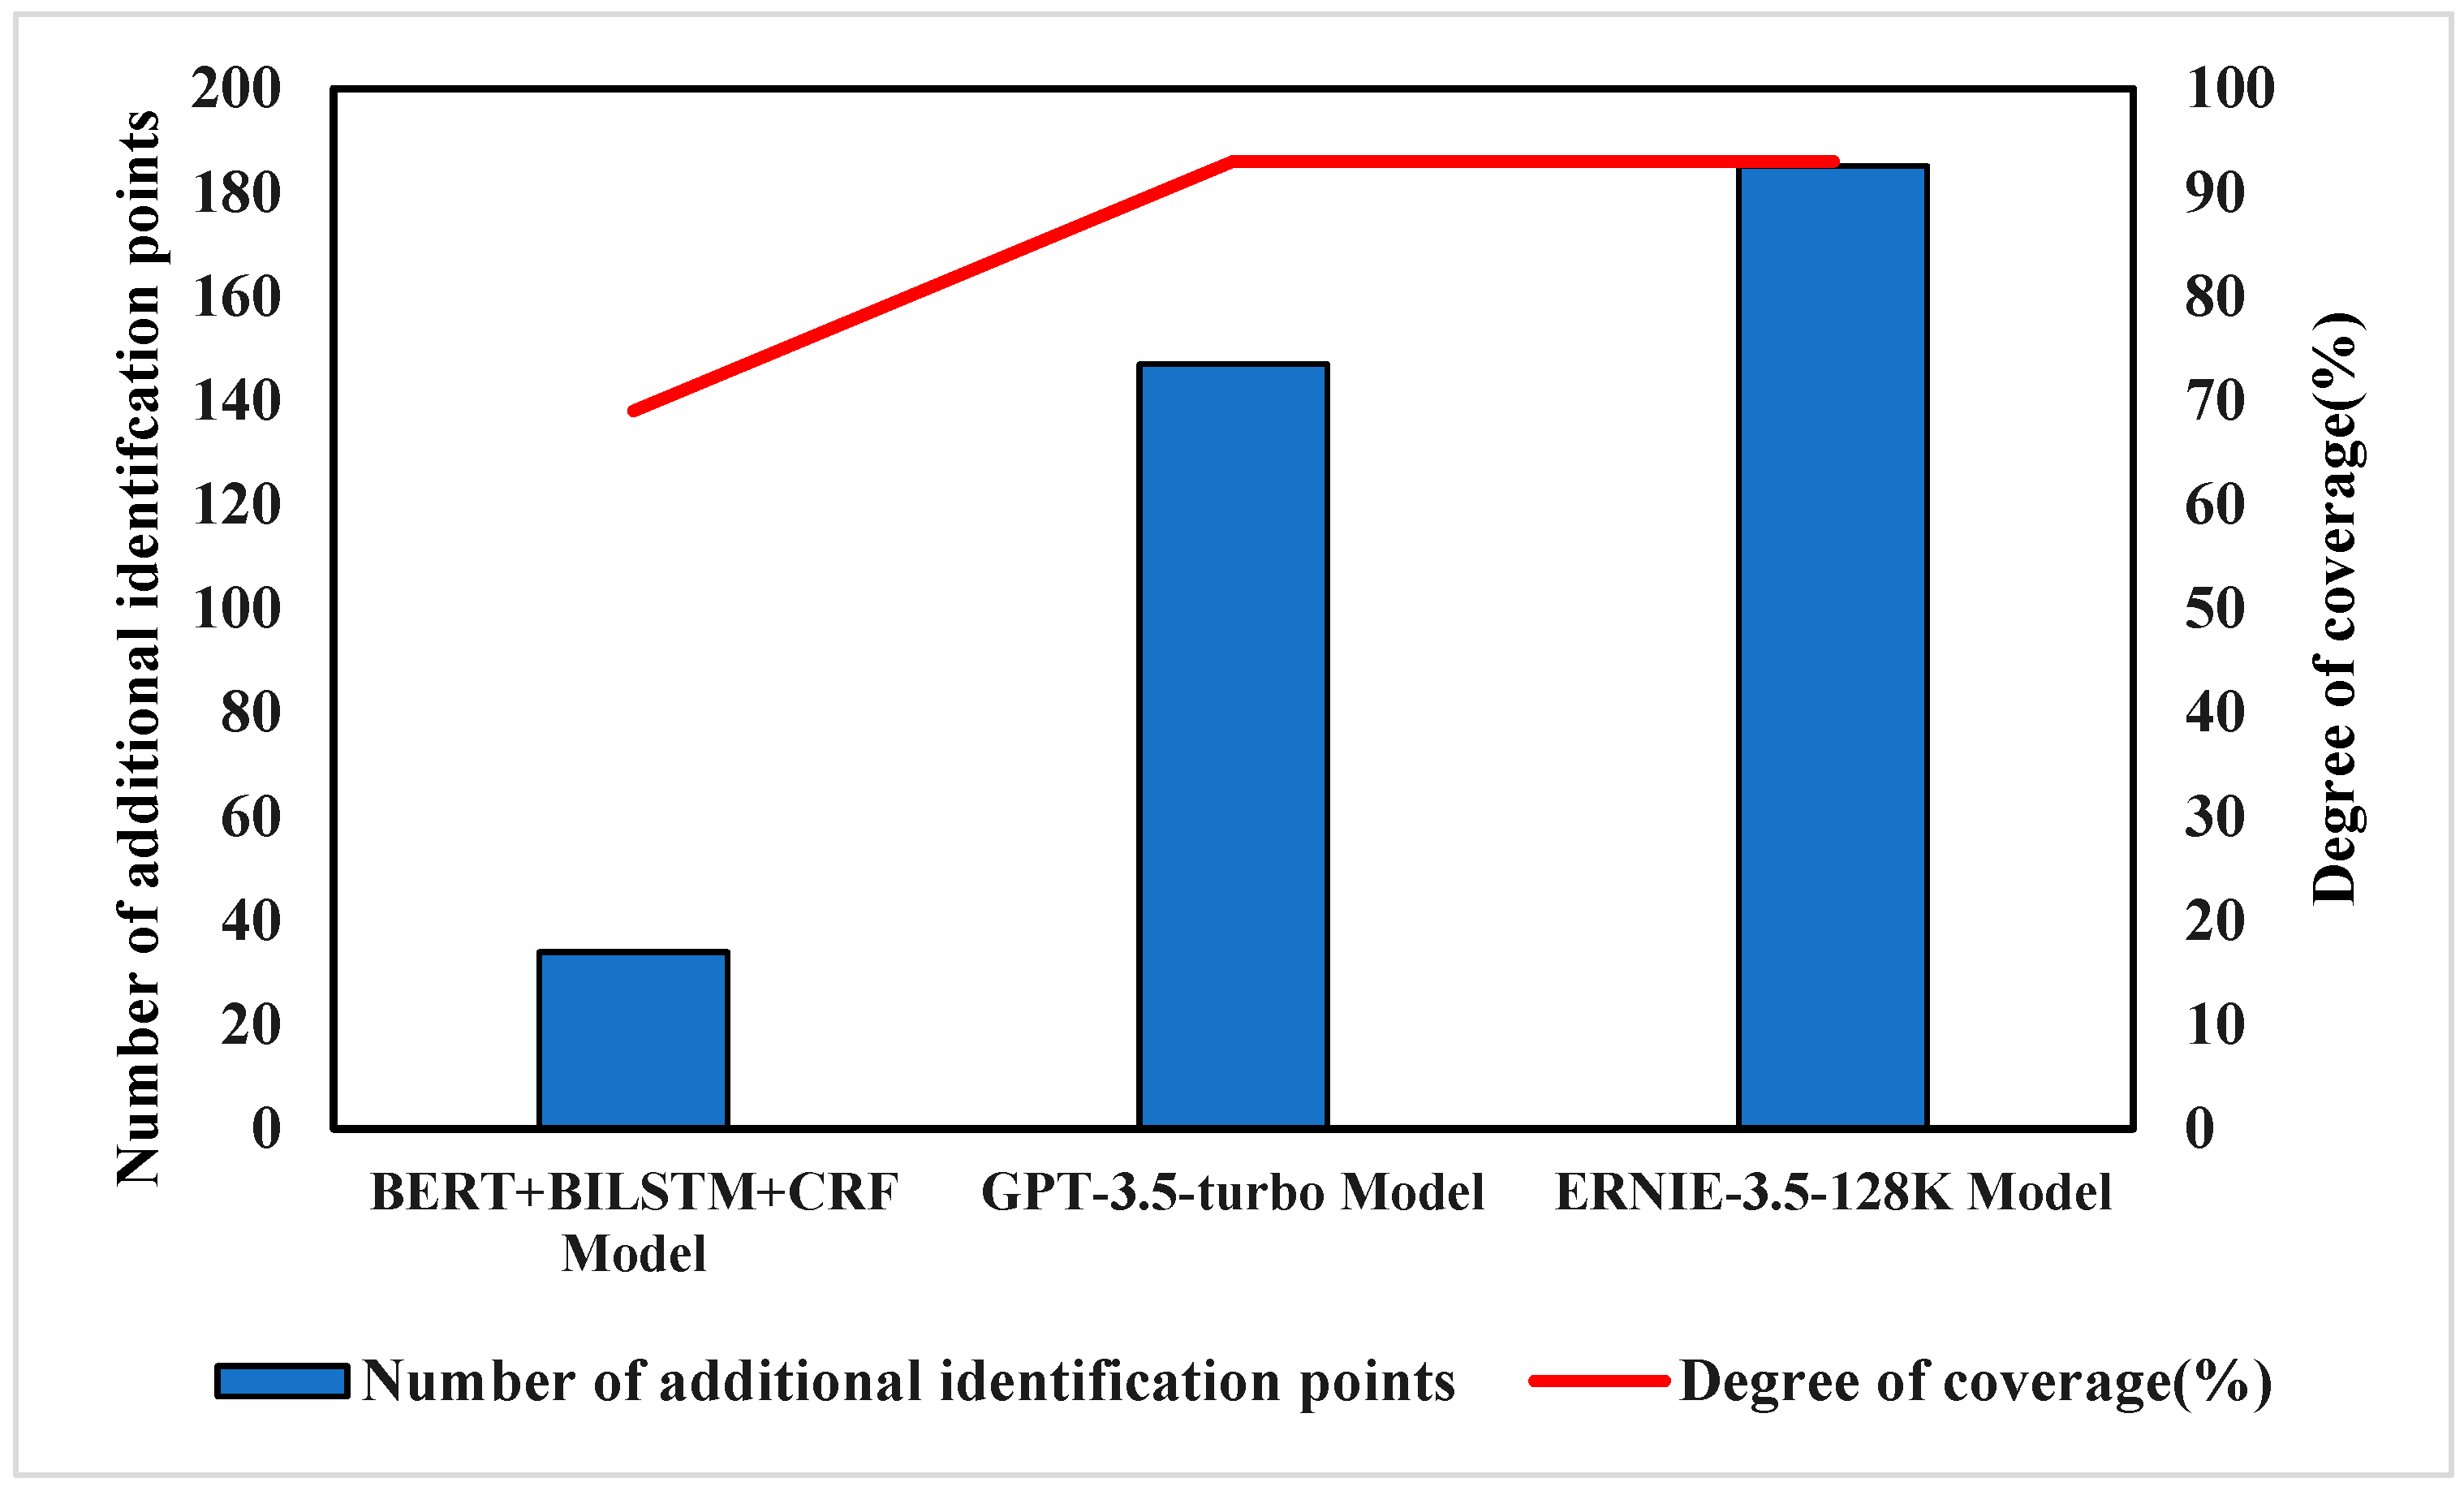
Guilin Daily published 100 urban waterlogging points, which were converted into latitude and longitude coordinates and displayed on a map. These were then compared with the urban waterlogging points extracted by the three methods. Since the official urban waterlogging points represent a range rather than specific locations, we set a threshold distance of 800 m: if the extracted urban waterlogging point was within 800 m of an official point, it was considered covered. Under this threshold, the result is shown in
Figure 5.
According to
Figure 5, the GPT-3.5-turbo and ERNIE-3.5-128K models significantly outperform the BERT-BILSTM-CRF model in the task of place name extraction. Both models have a coverage rate of 93%, which is much higher than the 69% coverage of BERT-BILSTM-CRF. Additionally, in terms of additional identified points, GPT-3.5-turbo and ERNIE-3.5-128K identified 147 and 185 more place names, respectively, highlighting their advantage in place name recognition. It may be because the BERT-BILSTM-CRF model only performs well in the recognition of commonly familiar names in microblog data (such as Guangxi Province, Guilin City), but it does not perform well in the accuracy of township roads, hospitals, and villages, resulting in reduced recognition accuracy (as shown in
Table 3). Despite the high coverage rates of the GPT-3.5-turbo and ERNIE-3.5-128K models, they did not achieve 100% coverage, which may be related to the models being lower versions (3.5) and their limitations when processing larger text data. When there are too many place names in a Weibo post, the models may miss some of them. Regarding the additional identified urban waterlogging points, on one hand, the official data only covers road urban waterlogging conditions and does not include all areas of Guilin, so the identification of urban waterlogging points outside of roads further validates the feasibility of the approach. On the other hand, large language models (GPT-3.5-turbo and ERNIE-3.5-128K) tend to exhibit a certain degree of “overconfidence” [
27,
28,
29], which may lead to over-predictions, such as generating addresses that are not actually mentioned in the Weibo post. In contrast, the BERT-BILSTM-CRF model identifies all place names, including some irrelevant to urban waterlogging.
Overall, GPT-3.5-turbo and ERNIE-3.5-128K demonstrate superior recognition capabilities, able to identify the vast majority of place names and meet the needs for extracting urban waterlogging information.
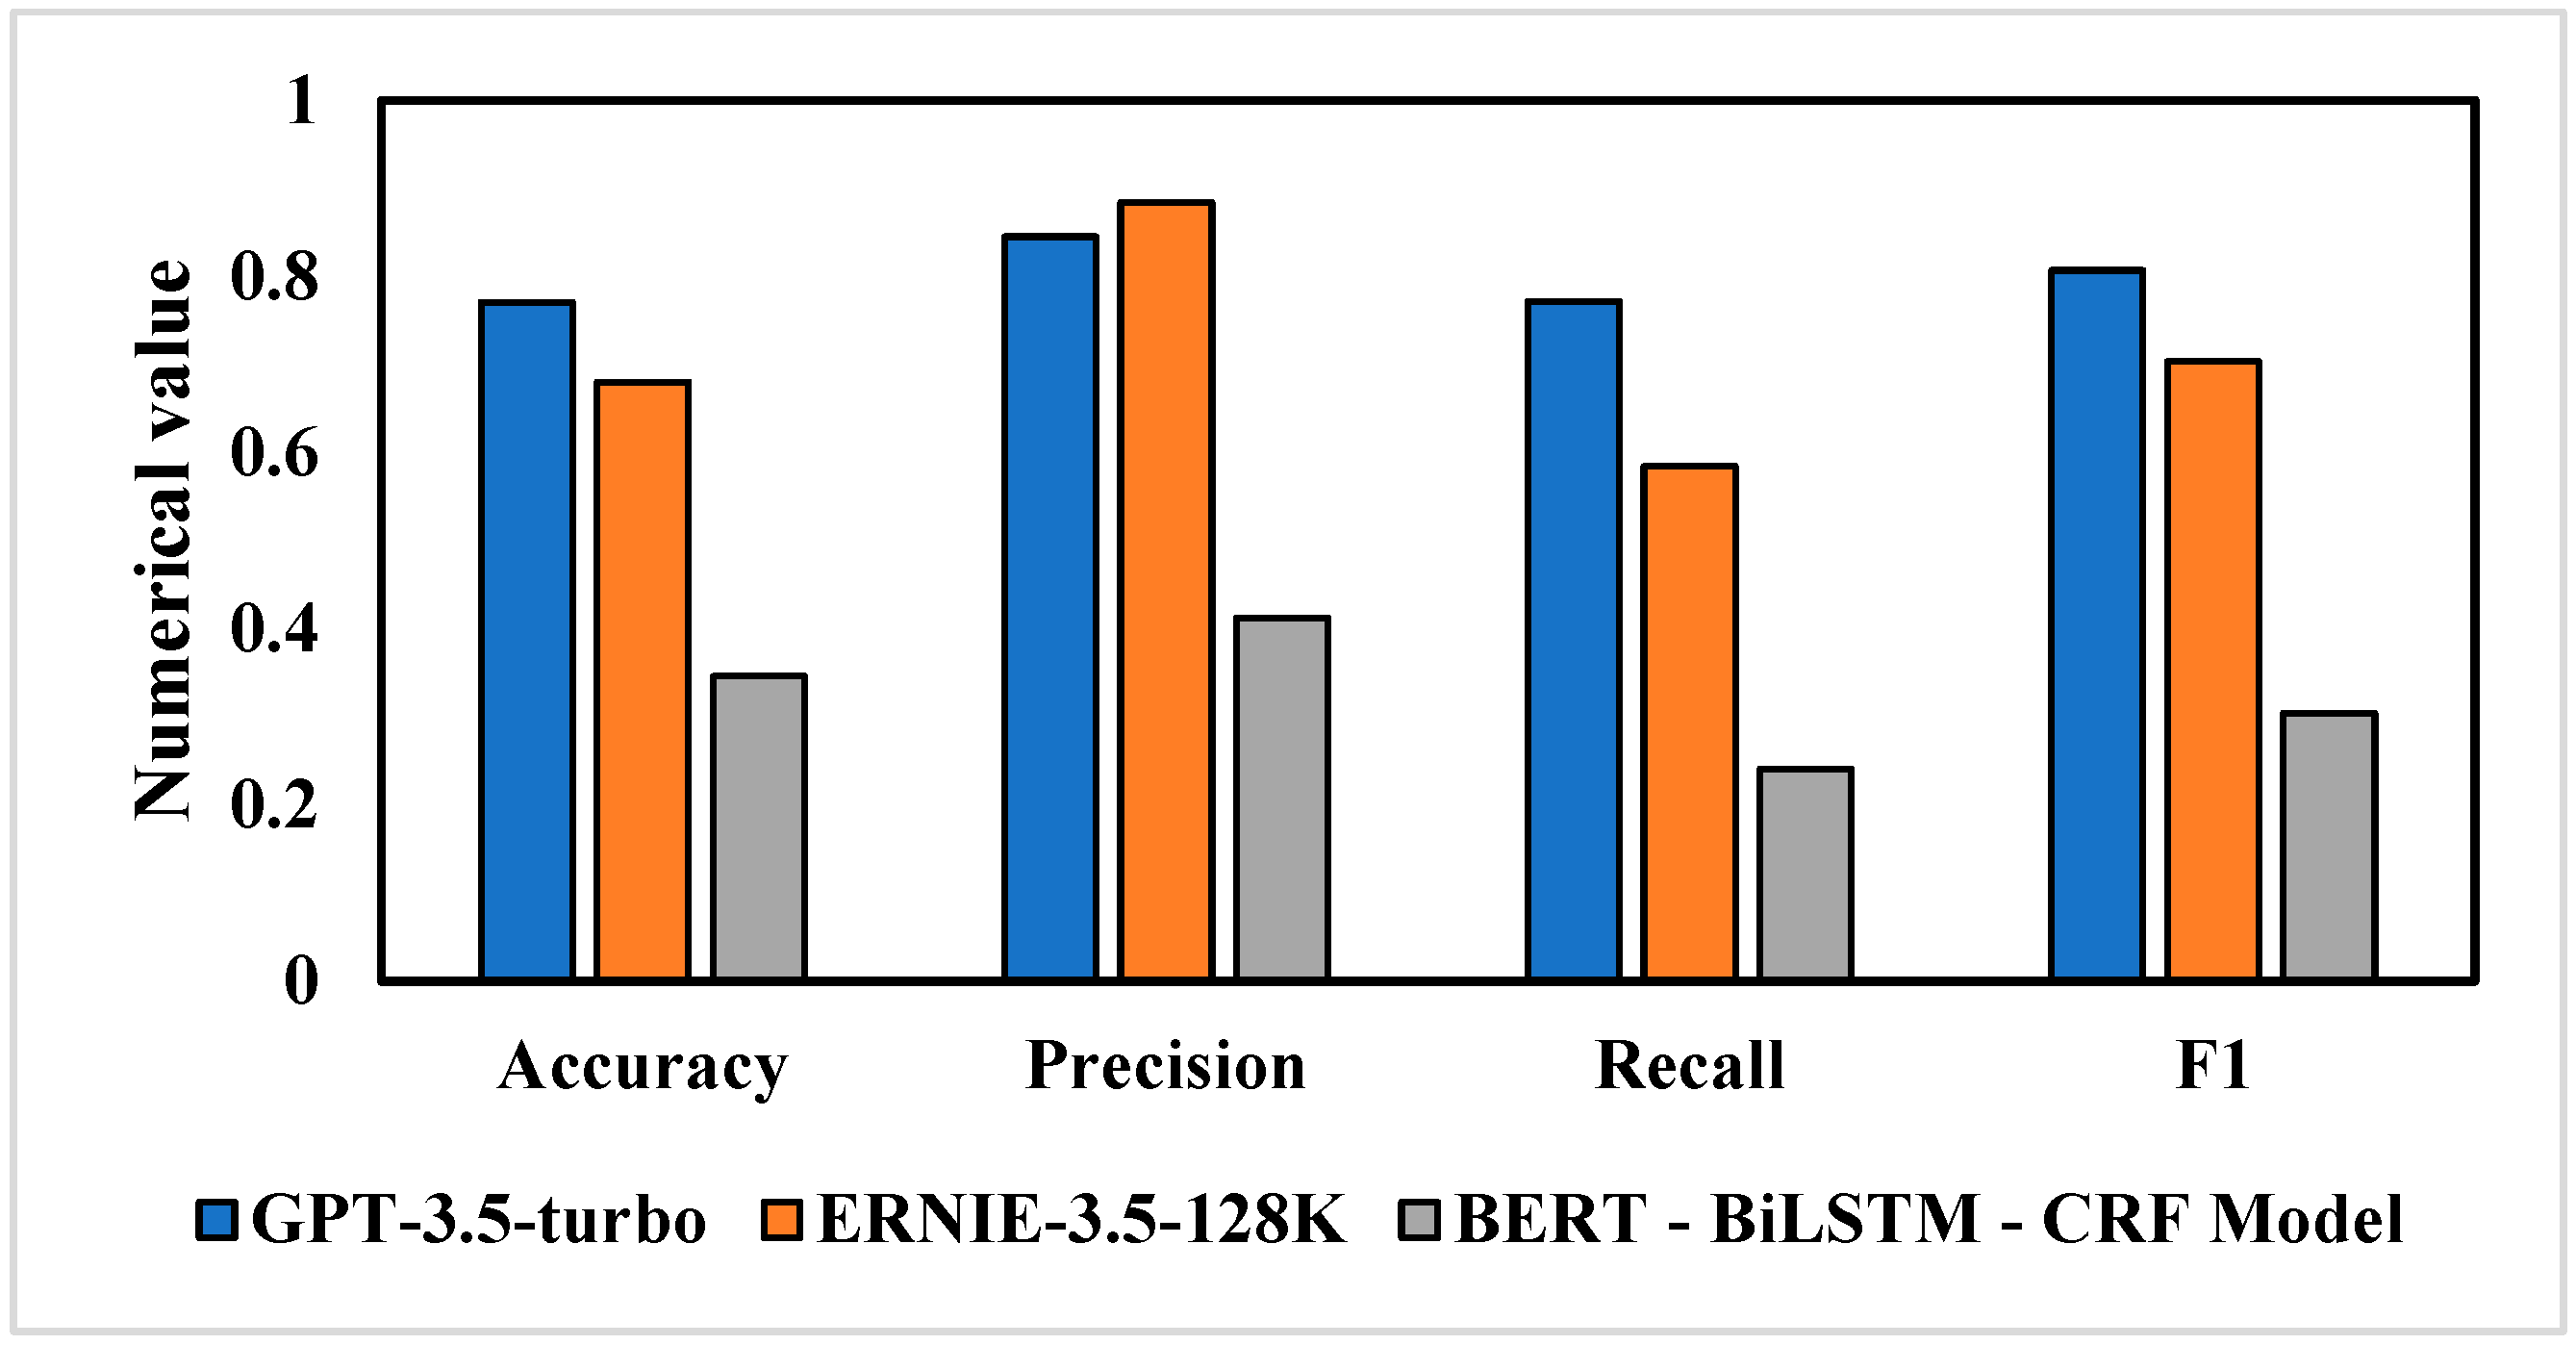
In order to further verify and analyze the results of the GPT-3.5-turbo, ERNIE-3.5-128K, and BERT-BILSTM-CRF models, in this study, 10% of Weibo texts were randomly sampled, and place names embedded in the data were manually identified as ground truth. Then, these ground truth values were used to calculate accuracy, precision, recall, and F1 score using Formulas (1) to (4) to evaluate the output of the three models, and the results are shown in
Figure 6. From the analysis, it is evident that GPT-3.5-turbo performs the best in place name recognition tasks, with an accuracy of 0.7707, a recall of 0.7717, and an F1 score of 0.8066, all higher than those of the other models. This demonstrates its excellent classification performance and effective balance between precision and recall. While ERNIE-3.5-128K achieves the highest precision (0.8837), its recall is only 0.5846, leading to a lower F1 score of 0.7037, indicating a certain imbalance. The BERT—BiLSTM—CRF model performs significantly worse in all metrics, with an F1 score of only 0.3041, showing poor classification performance. Therefore, GPT-3.5-turbo is the best choice for place name recognition tasks, outperforming both ERNIE-3.5-128K and BERT—BiLSTM—CRF in overall performance. Subsequent analysis will be carried out using it.
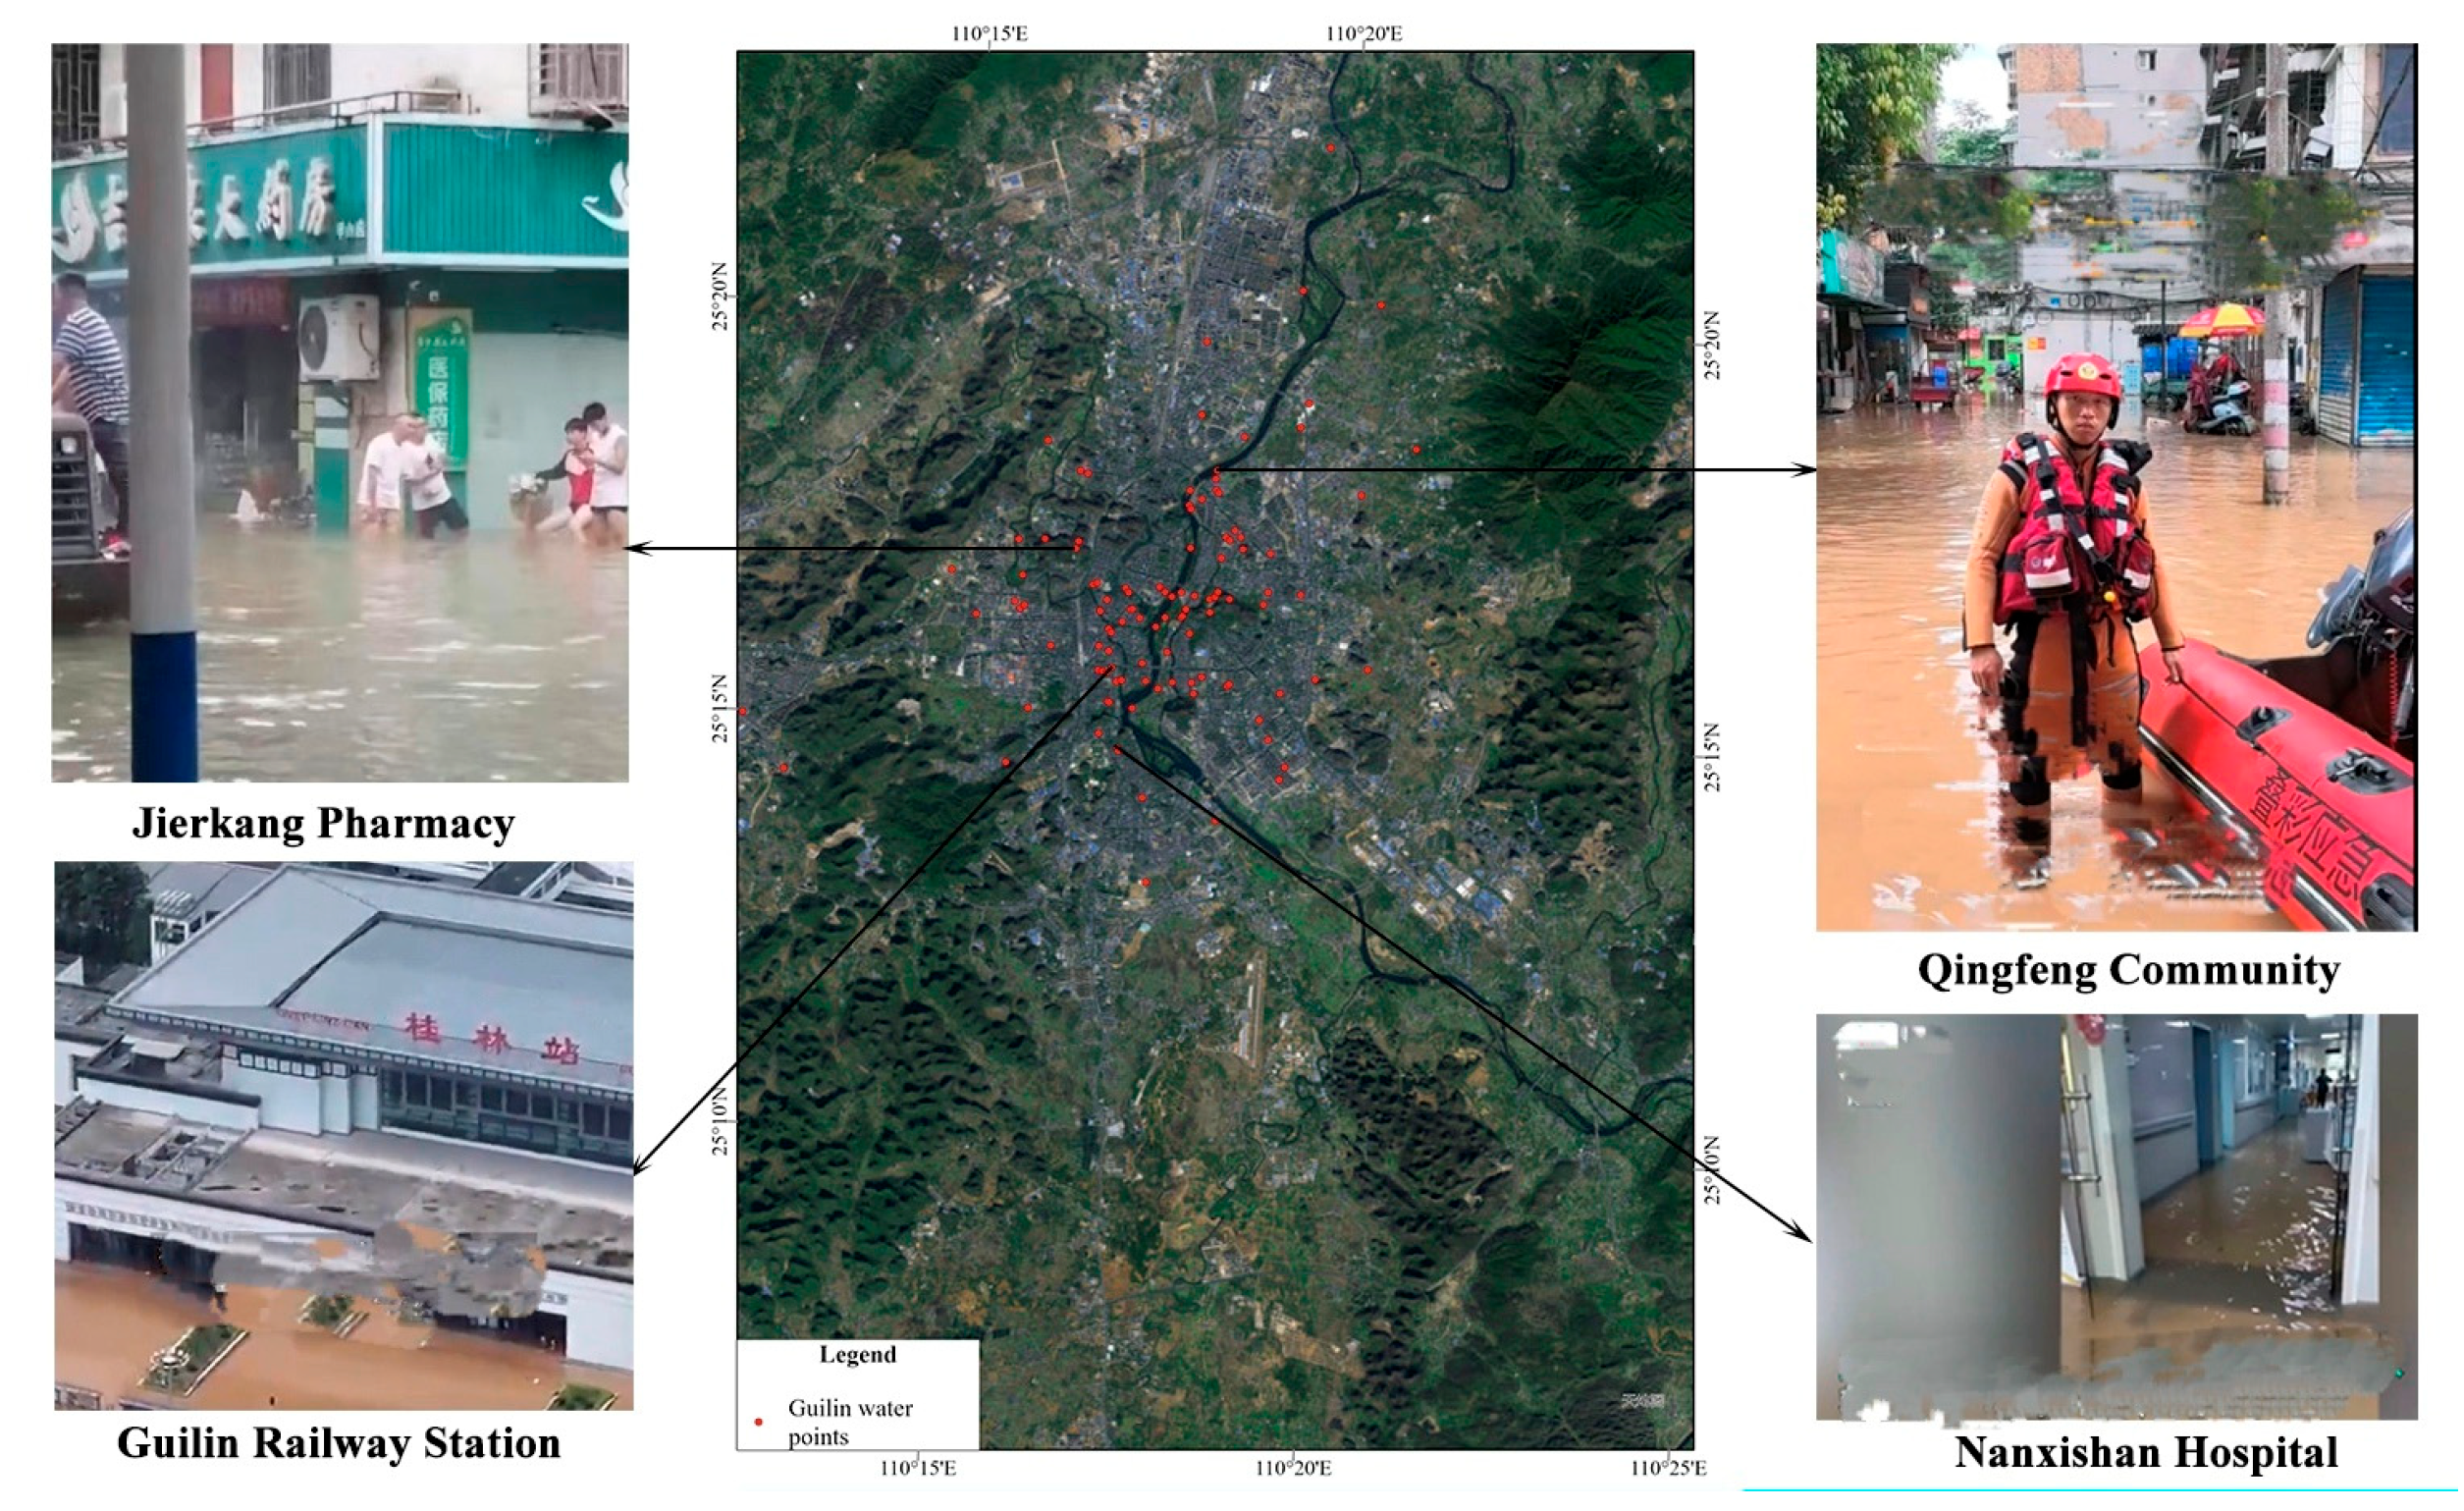
This paper further validates the additional urban waterlogging points in Guilin City extracted by the GPT-3.5-turbo model, which performs the best, using real-time street view images. As shown in
Figure 7, the model accurately extracted urban waterlogging locations for key locations in Guilin City, such as the Guilin Railway Station, Jierkang Pharmacy in the Jiashan Street office area of Xiufeng District, Qingfeng Community, and Nanxishan Hospital. The extracted locations closely match the actual street view images, confirming the high consistency between the model’s results and the actual situation.
4.2. Timing Analysis
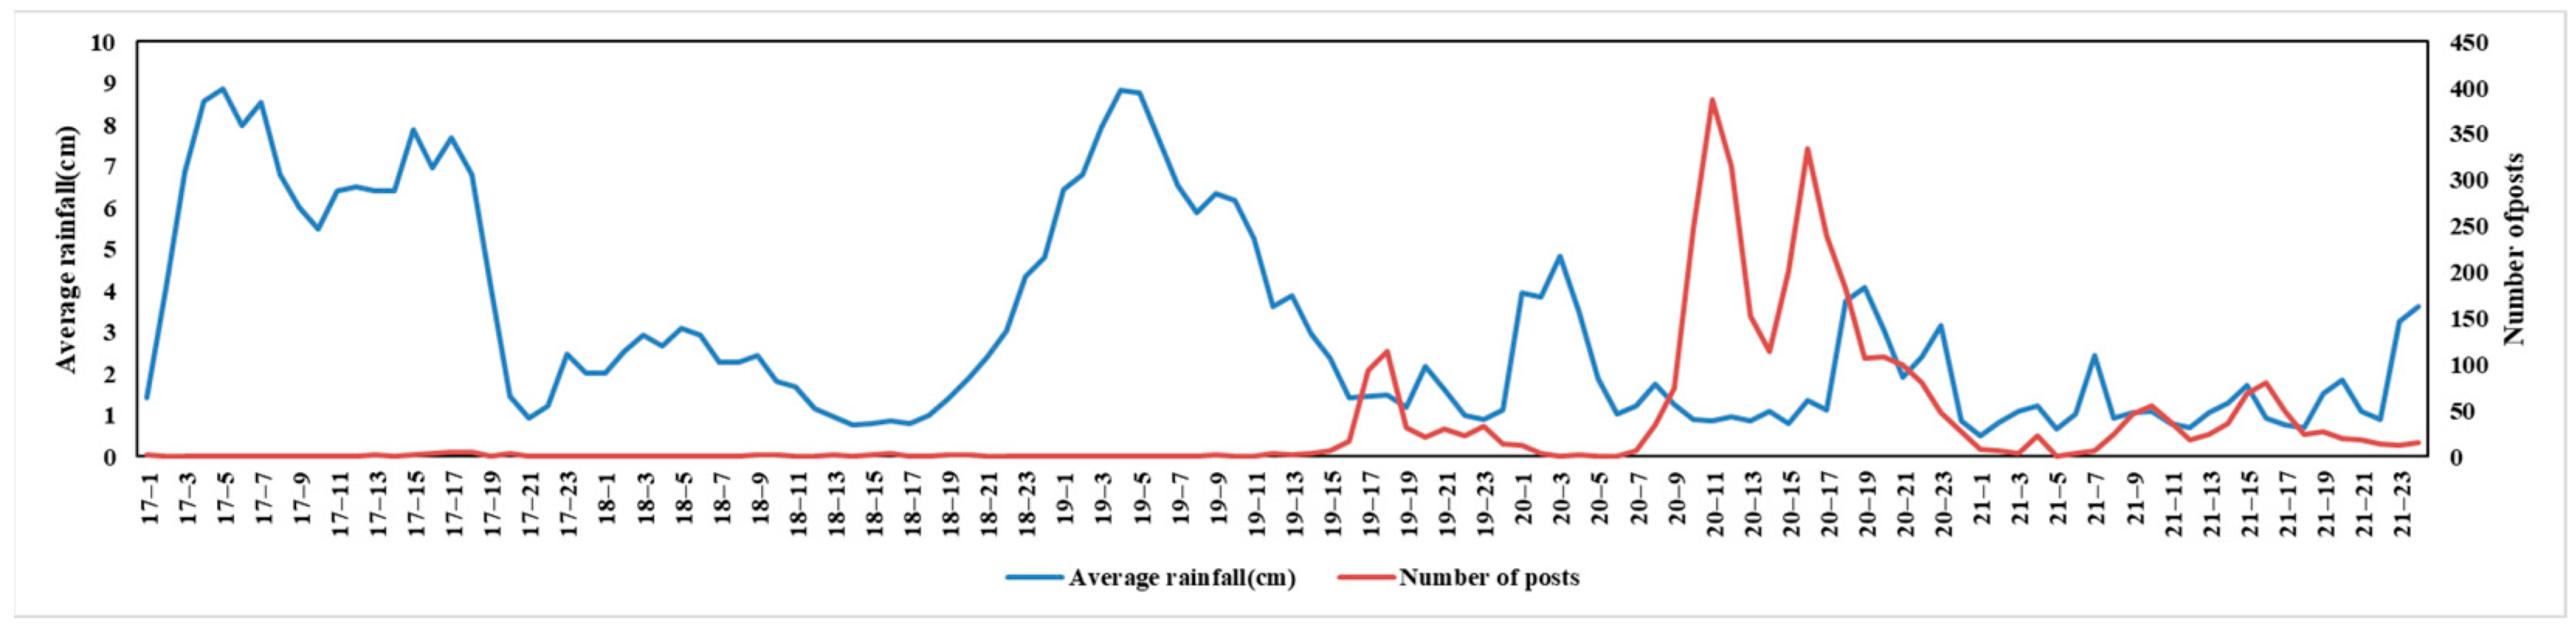
By visualizing the hourly rainfall data and Weibo post data in Guilin, the results are presented in
Figure 8. The blue curve represents the average rainfall (in cm), while the red curve represents the number of Weibo posts. It can be observed that on 17 June, rainfall rapidly rose to a peak. At this time, although the number of Weibo posts was relatively low, it showed a slight increase. From 18 June to midday on 19 June, rainfall reached another peak, accompanied by a significant increase in Weibo posts. Notably, the peak in Weibo posts occurred after the peak in rainfall, suggesting that users may have started actively posting in response to issues such as urban waterlogging and traffic disruptions caused by sustained heavy rainfall.
In the early hours of 20 June, a smaller rainfall peak occurred. After three consecutive days of heavy rain, the rainfall exceeded the capacity of Guilin’s drainage system, leading to a series of problems. These issues triggered widespread discussion on 20 June, with a surge in Weibo activity. Subsequently, from 20 June to 21 June, the number of Weibo posts increased with rising rainfall and decreased as rainfall subsided, though the changes in posts showed a certain lag. This indicates a strong correlation between rainfall patterns and the volume of Weibo posts. In particular, significant increases in Weibo activity were observed when heavy rainfall overwhelmed the city’s drainage capacity. Additionally, the peak in Weibo posts typically lagged behind the peak in rainfall, likely reflecting the time required for users to perceive and respond to the consequences of the rain.
By categorizing the crawled Weibo data based on its publication time, daily data from 17 June to 21 June were obtained and subjected to a word frequency analysis, as shown in
Table 4. On 17 June, high-frequency words such as “urban waterlogging”, “heavy rain”, “intense rainfall”, and “flood control” reflect the users’ focus on rainfall intensity and flood control measures during the early stages of the rain. On 18 June, keywords such as “traffic”, “road sections”, “unable”, “vehicles”, “under the bridge”, “firefighting”, and “traffic control” indicate that as the rainfall intensified, issues such as urban waterlogging on city roads and traffic disruptions became more prominent and were widely discussed. On 19 June, frequent terms like “ponding water”, “unable”, “flood”, “urban waterlogging”, and “trapped” further highlight the worsening flood and urban waterlogging problems, with some areas having trapped individuals in need of rescue. On 20 June, high-frequency words such as “flood”, “Li River”, “water level”, “urban waterlogging”, and “severe” indicate that the disaster reached its peak, especially with the rising water levels of the Li River causing severe impacts on the city. By 21 June, high-frequency words like “public”, “flood disaster”, “flood control”, and “emergency” showed that public attention had shifted towards post-disaster flood control and the resettlement of affected populations. Overall, the changes in the high-frequency words on Weibo clearly reflect users’ real-time attention to the development of the disaster, from the initial rainfall to the peak of urban waterlogging and ponding water, and then to subsequent flood control and recovery efforts. The dynamic changes in keywords vividly reveal the entire process of the disaster and its social impacts.
4.3. Urban Waterlogging Hazard Assessment
The information on urban waterlogging points extracted from daily Weibo data was visualized at the township level to assess urban waterlogging hazards (see
Figure 9). As shown in Figure, from 17 to 18 June, the urban flood hazard in Guilin was generally low, with only a few towns, such as Lingui Town, experiencing lower hazard levels. However, after the heavy rainfall on 19 June and the continuous rainfall from 20 to 21 June, high-hazard towns appeared in the city center on 19 June, while suburban areas saw medium hazards. From 20 to 21 June, the flood hazard in Guilin intensified, with higher- and high-hazard areas in the city center gradually expanding to the suburbs. Some suburban towns also shifted to high-hazard status, leading to a further deterioration of the urban flooding issue. Combined with an analysis of Guilin’s elevation data, it is evident that the northwestern and southeastern parts of Guilin, characterized by mountainous and higher terrain, mostly remained in low-hazard states.
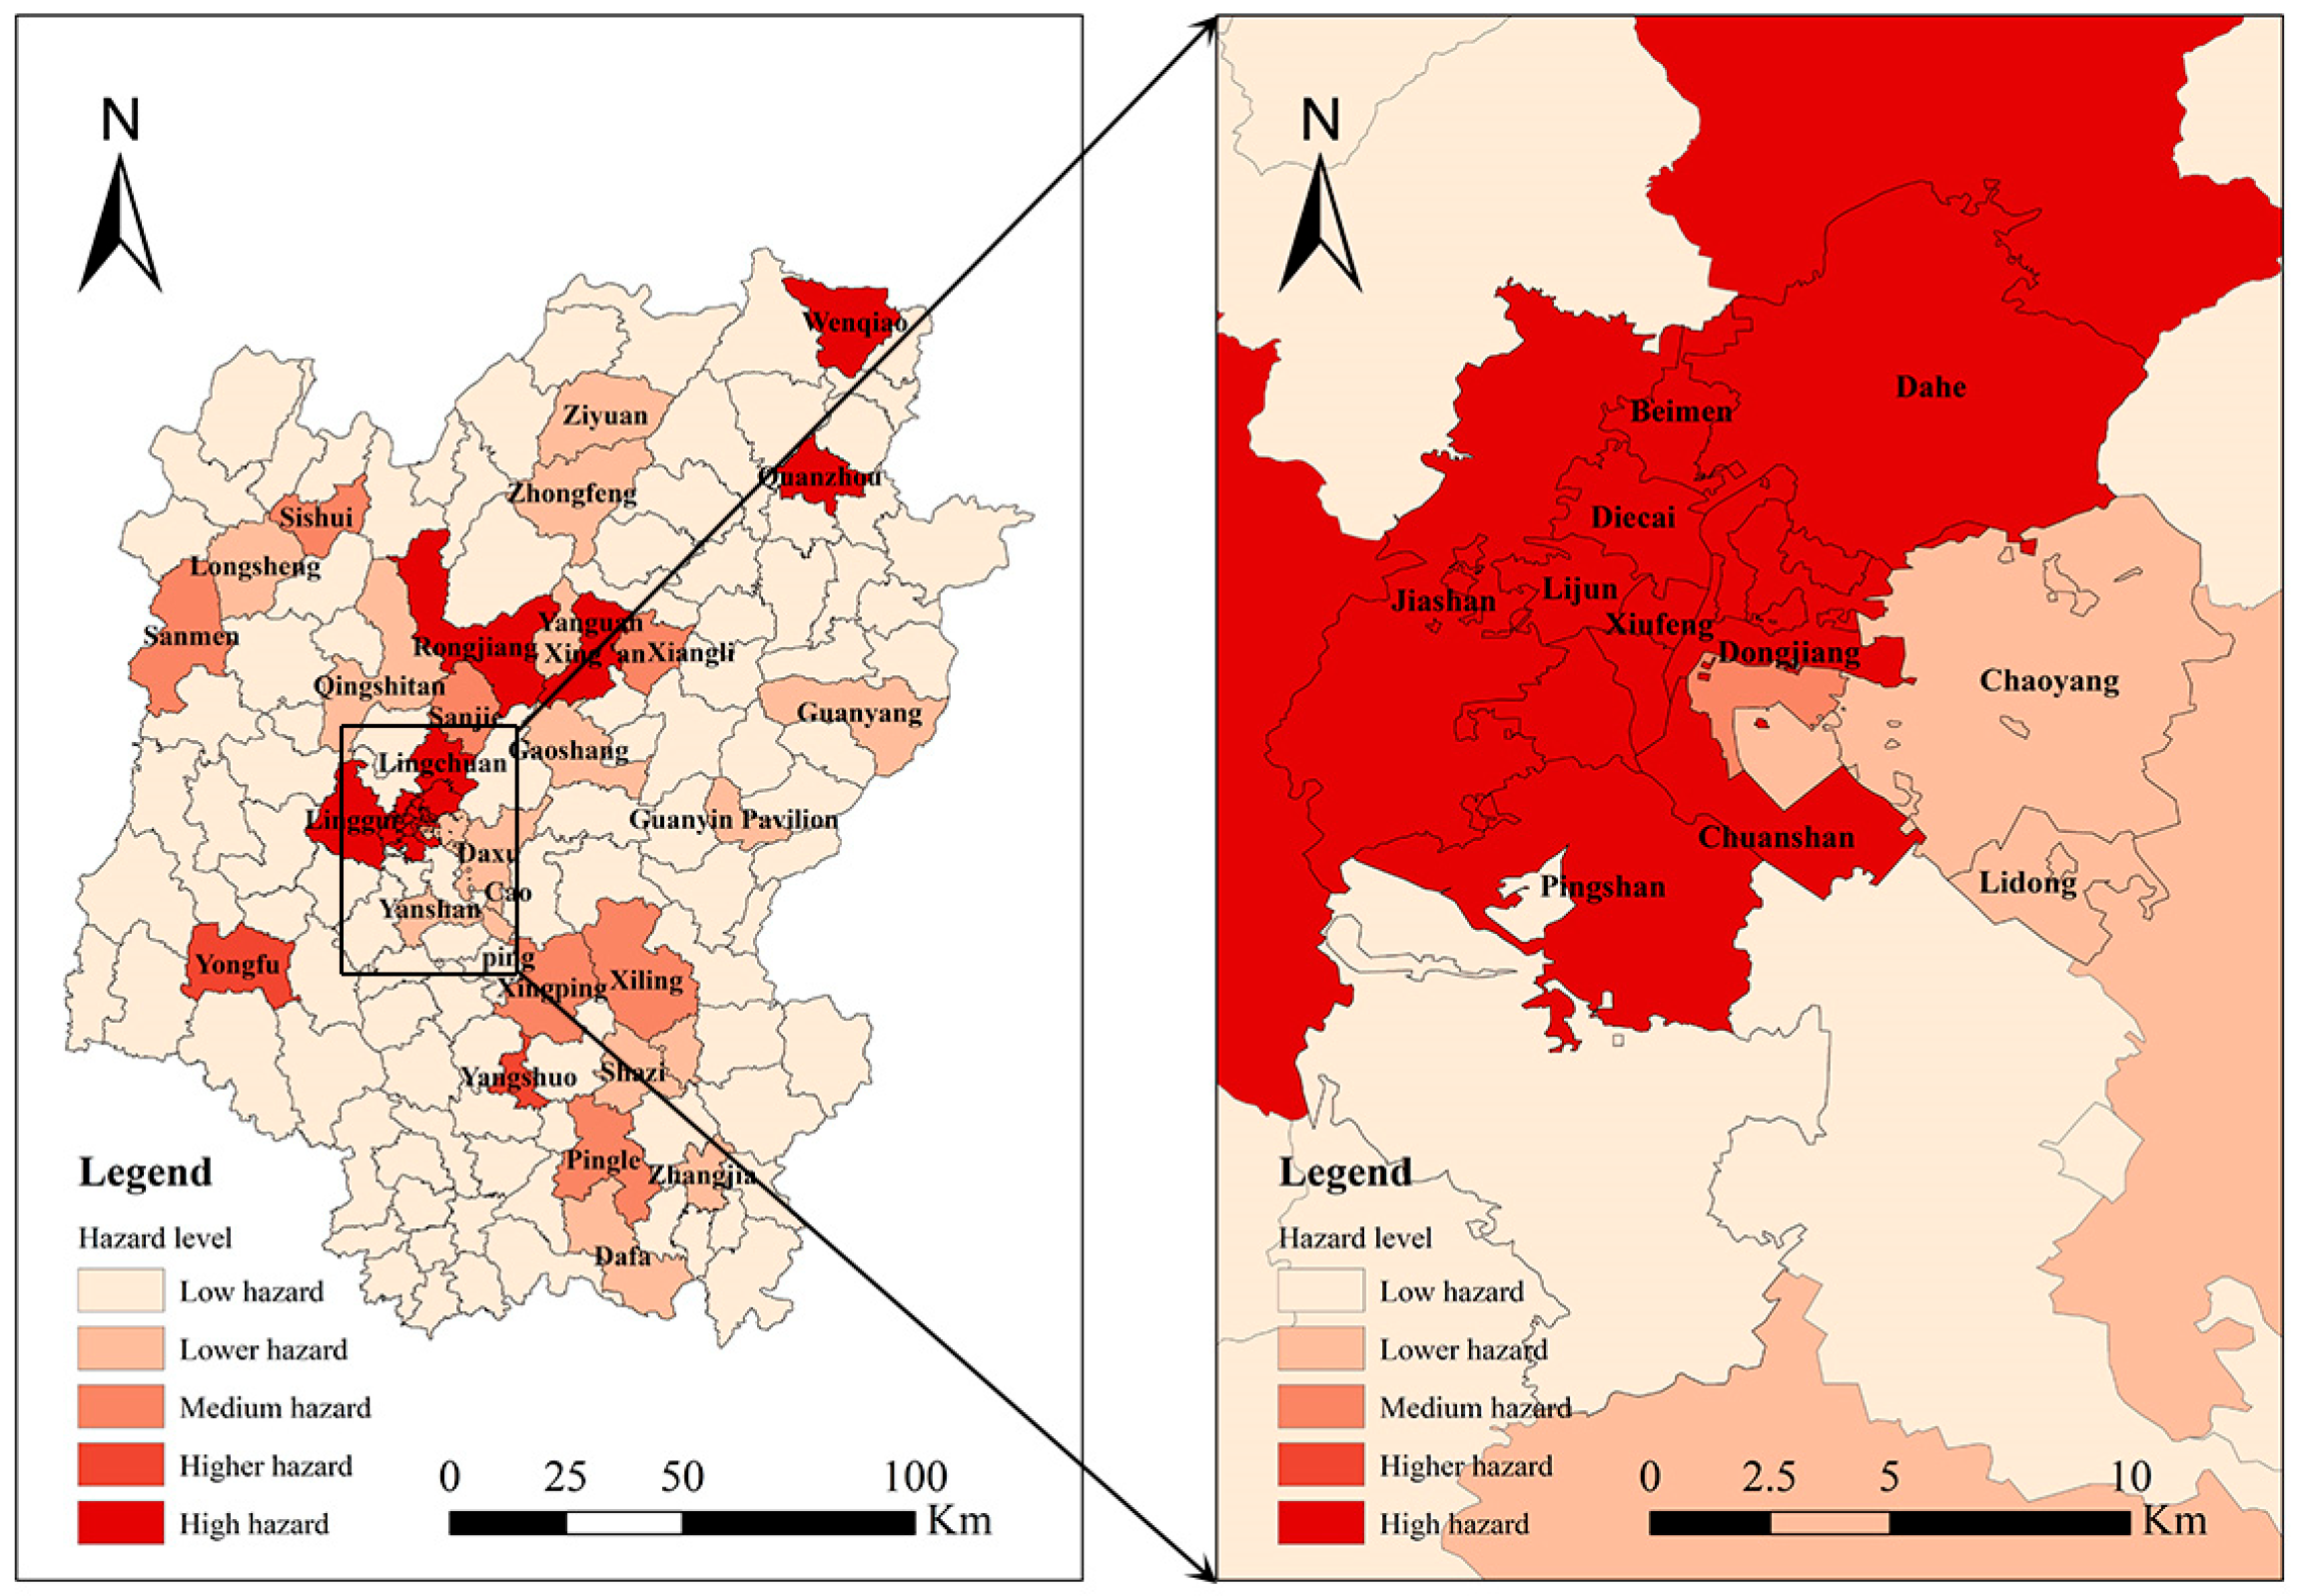
The water accumulation points from 17 June to 21 June were summarized, and the urban waterlogging hazard intensities on June 19 in Guilin were visualized at the township scale (
Figure 10). Wenqiao Town, Quanzhou Town, Rongjiang Town, Xing’an Town, Lingchuan Town, Lingui Town, Dahu Township Jiashan Street, Beimen Street, Pingshan Street, Diecai Street, Xiufeng Street, Lijun Street, Dongjian Street, Chuanshan Street, and other areas were identified as high-hazard urban waterlogging zones. Observing the distribution of these areas, it is evident that most are concentrated in urban regions, indicating that urban waterlogging disasters significantly impact densely populated areas. Furthermore, these areas receive higher attention on social media due to their population density.
5. Conclusions
A real-time urban waterlogging point extraction based on the GPT-3.5-Turbo model was proposed, using the flood event in Guilin City on 19 June 2024 as a case study. This method was validated for its feasibility in rapidly detecting urban waterlogging points and assessing urban waterlogging hazards caused by extreme rainfall. The main research conclusions are as follows.
By utilizing a Word2Vec-trained word similarity computation model, a keyword database was constructed to extract highly similar terms related to core concepts such as “urban waterlogging”. These extracted terms were used to crawl Weibo data, resulting in an additional 368 highly relevant entries. This approach not only effectively expanded the keyword scope but also significantly enhanced the coverage and accuracy of collecting urban waterlogging and related data from the Weibo platform, providing richer and more reliable data support for subsequent analyses.
The GPT-3.5-turbo and ERNIE-3.5-128K models show significant advantages in the coverage of urban waterlogging point identification, achieving 93%, far surpassing the traditional BERT-BILSTM-CRF model. This indicates that GPT-3.5-turbo and ERNIE-3.5-128K are more capable of comprehensively capturing and identifying locations and events related to urban waterlogging in complex contextual information. Both models can accurately identify known urban waterlogging points and effectively detect unofficially reported urban waterlogging points, filling gaps in the data and significantly enriching the urban waterlogging information. Particularly, the GPT-3.5-turbo model achieves an F1 score of 0.8066, demonstrating superior accuracy and completeness, clearly outperforming both ERNIE-3.5-128K and BERT-BILSTM-CRF models. This indicates that GPT-3.5-turbo exhibits higher overall performance in the urban waterlogging point identification task, achieving a better balance between precision and recall, and providing more stable and reliable recognition results.
Public opinion is closely related to waterlogging events, especially during urban flooding, when public feedback often provides timely disaster information. This study validates the effectiveness and timeliness of using social media data and large language models for rapid hazard assessment of urban flooding events through practical cases. In the future, real-time dynamics on social media platforms will provide valuable firsthand information for disaster response, helping relevant authorities quickly grasp the event’s progress. Meanwhile, large language models will efficiently process vast amounts of textual data, extracting key information to accelerate disaster assessment and decision-making.


 in the first half of the year really reversed it, originally scheduled to start next Monday
  Guilin results of heavy rain waterlogging, Ctrip system returned the ticket, just said yesterday to Anhui south Hong village, small partners said don’t come also flooded
  just want to see the mountains and see the water in the rainy season just
 GUI, Nanhong