
Geospatial Assessment of Stormwater Harvesting Potential in Uganda’s Cattle Corridor


Abstract
1. Introduction
2. Materials and Methods
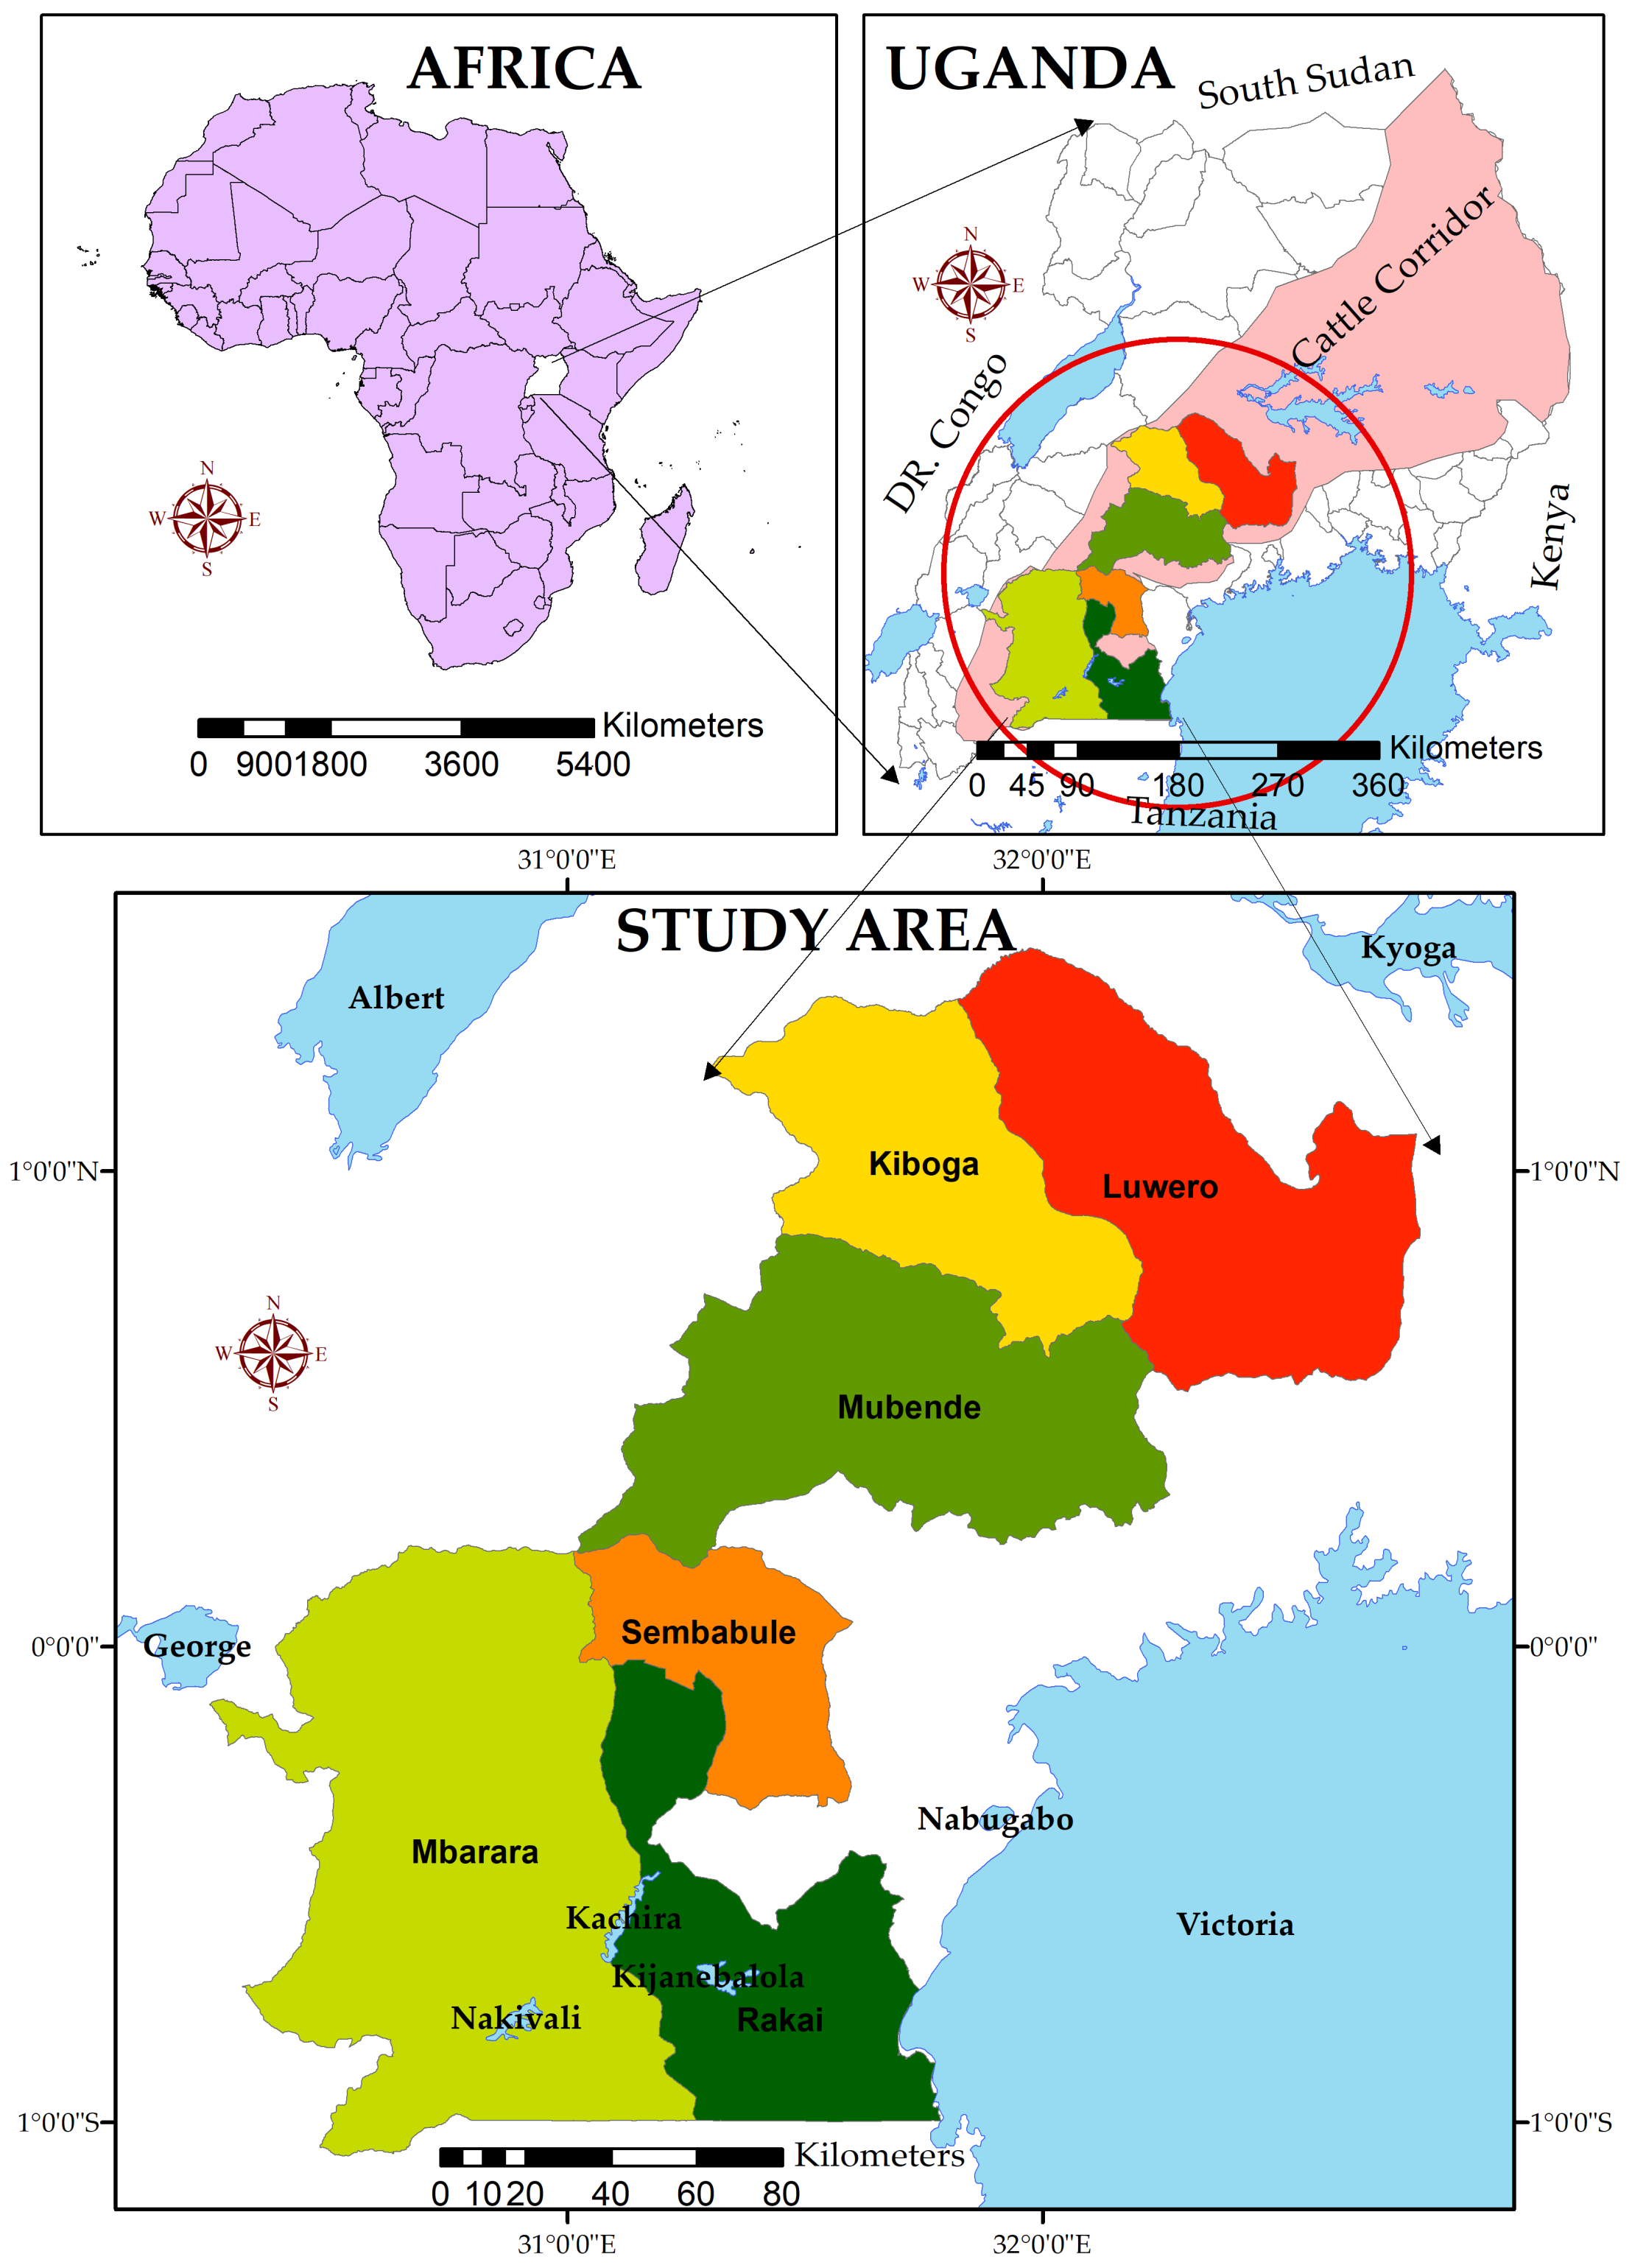
2.1. Study Area Description
2.2. Data Sources
2.3. Methodology
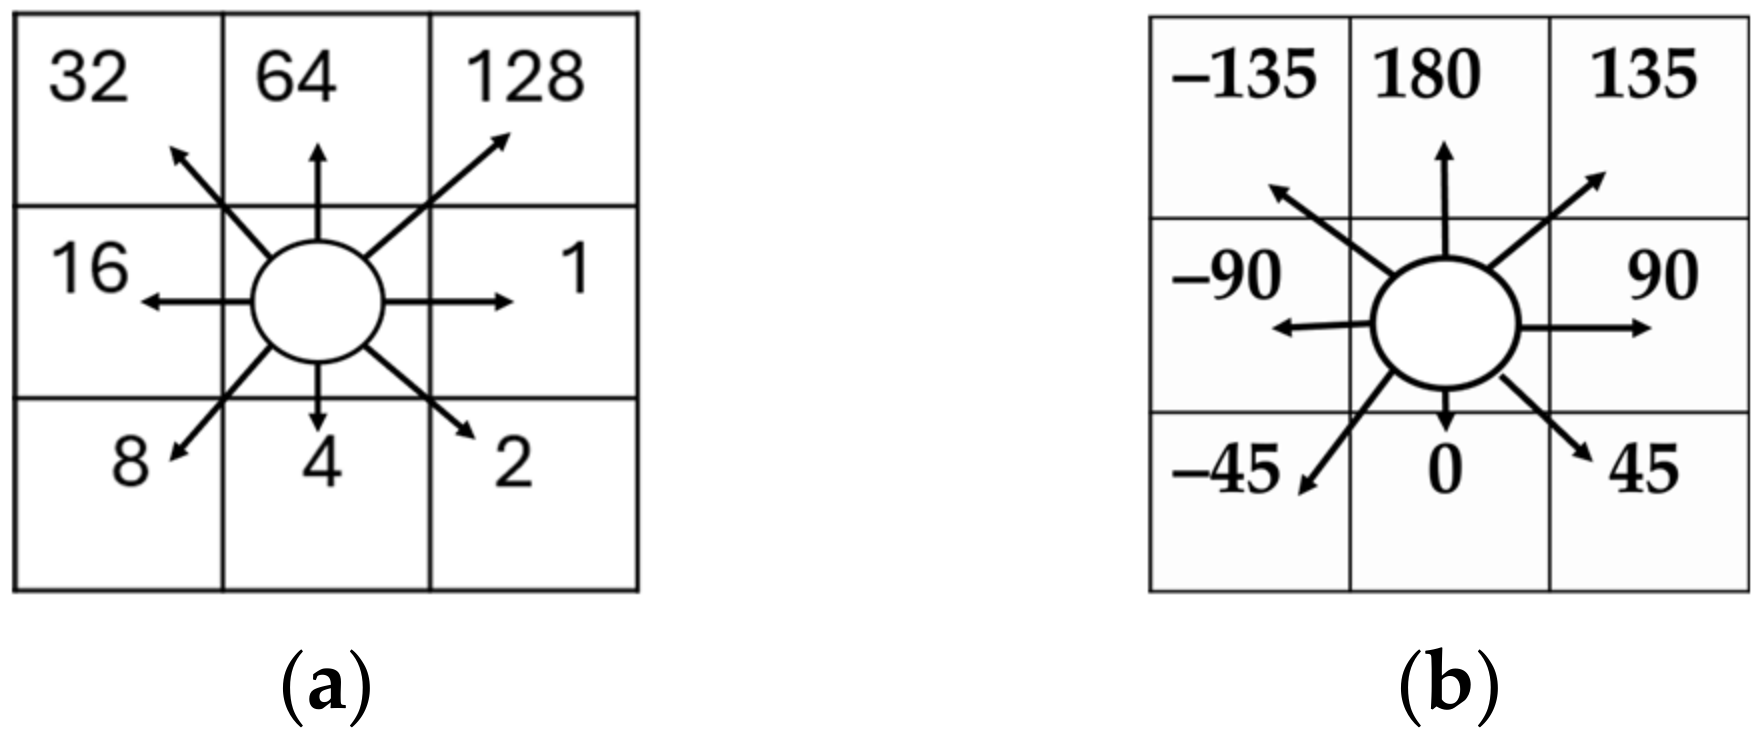
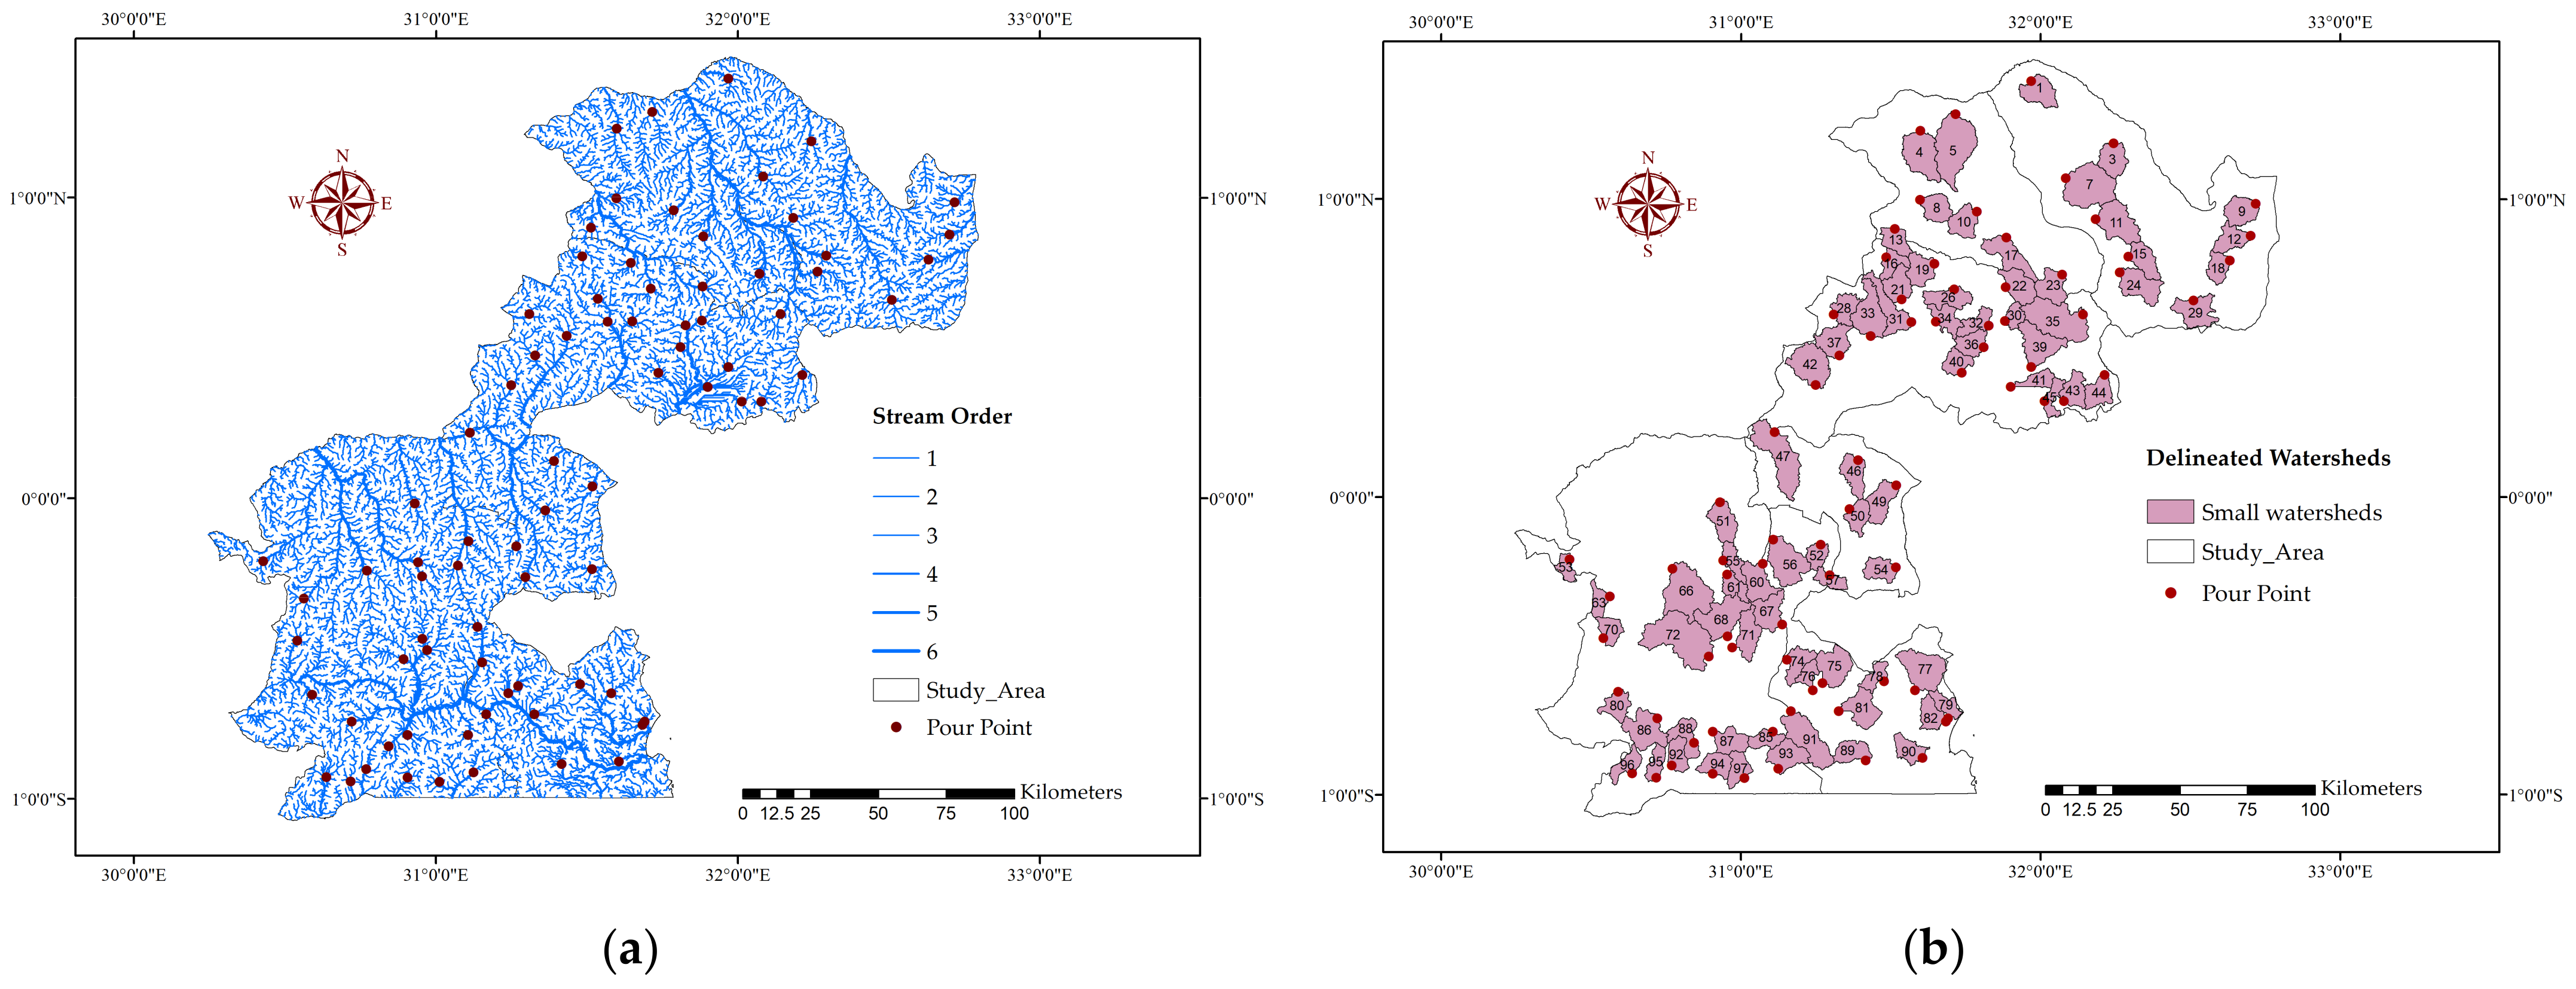
2.3.1. Delineating Watersheds
2.3.2. Preparation of Layers for Stormwater Assessment
2.3.3. Surface Runoff Assessment Using the SCS-CN Technique
- Soil analysis
- 2.
- Land use land cover categories
2.3.4. Stormwater Runoff Volume Across Watershed
2.3.5. Determining Optimal Stormwater Storage Solutions for Selected Sites
3. Results and Discussion
3.1. Soil Data
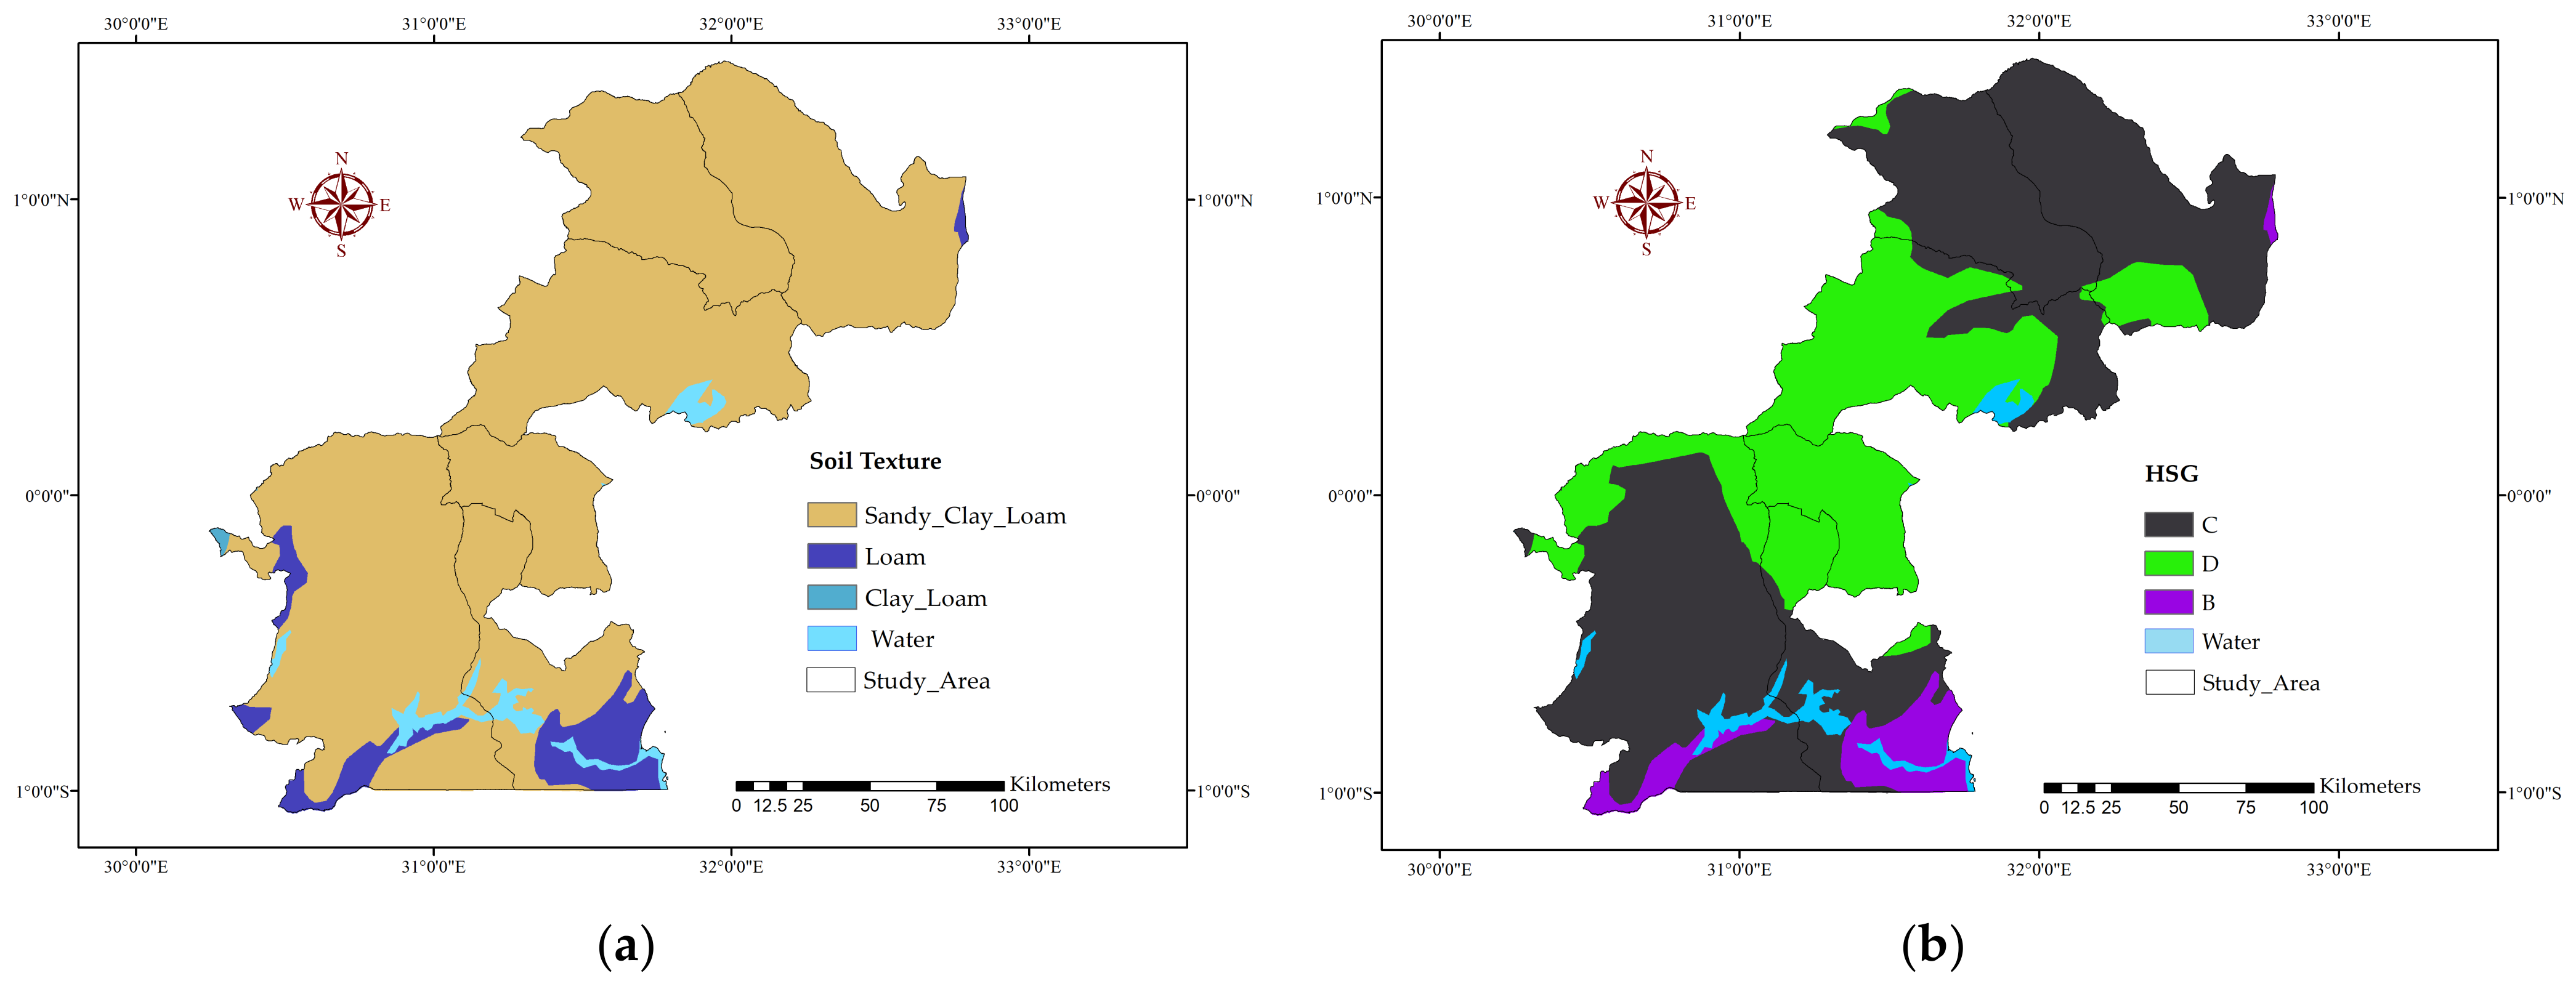
3.1.1. Soil Texture
3.1.2. Hydrological Soil Group
3.2. Land Use and Land Cover Map
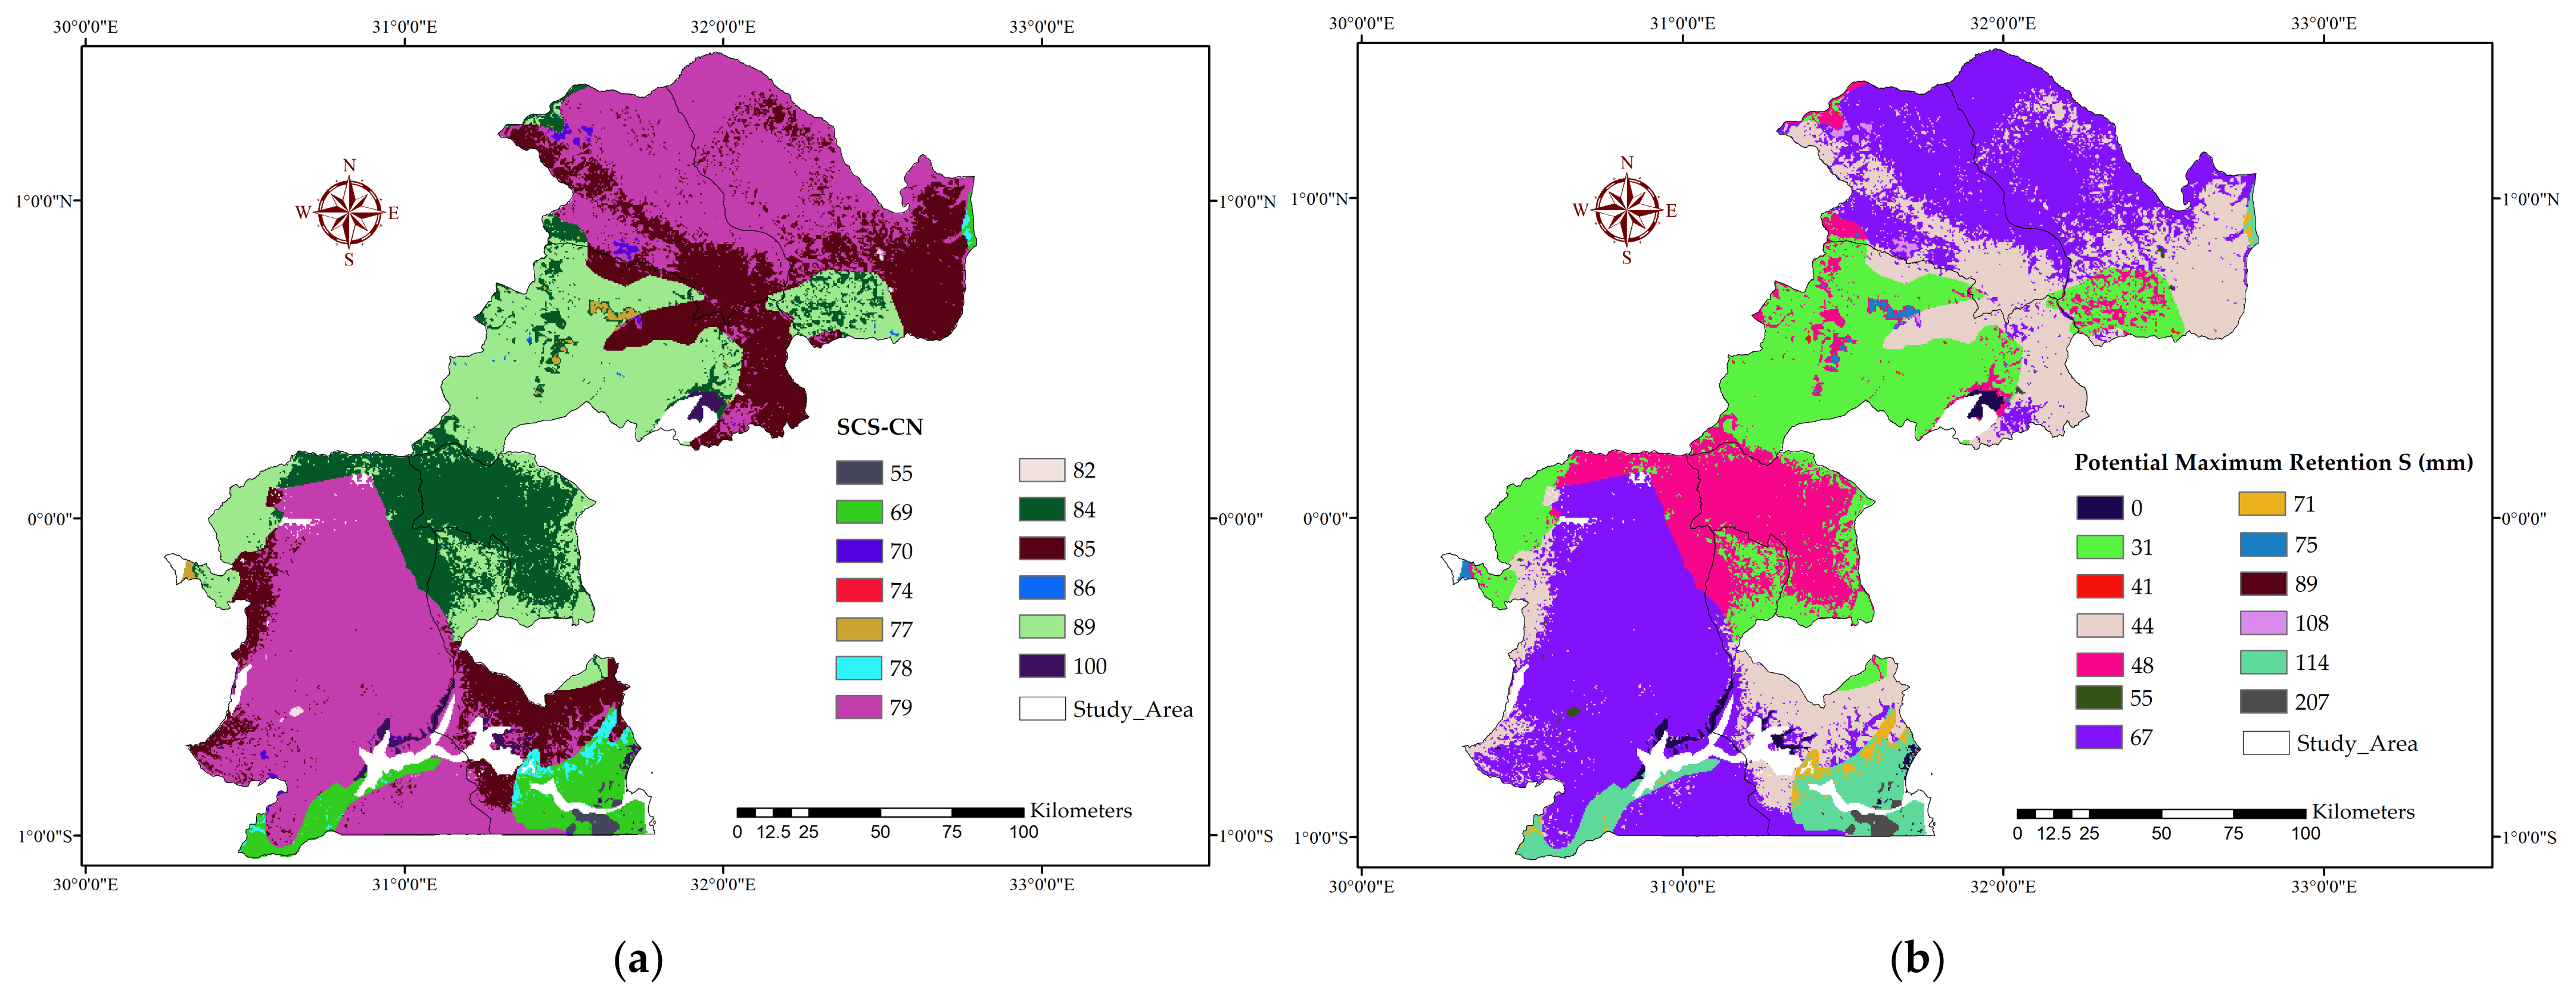
3.3. Curve Number
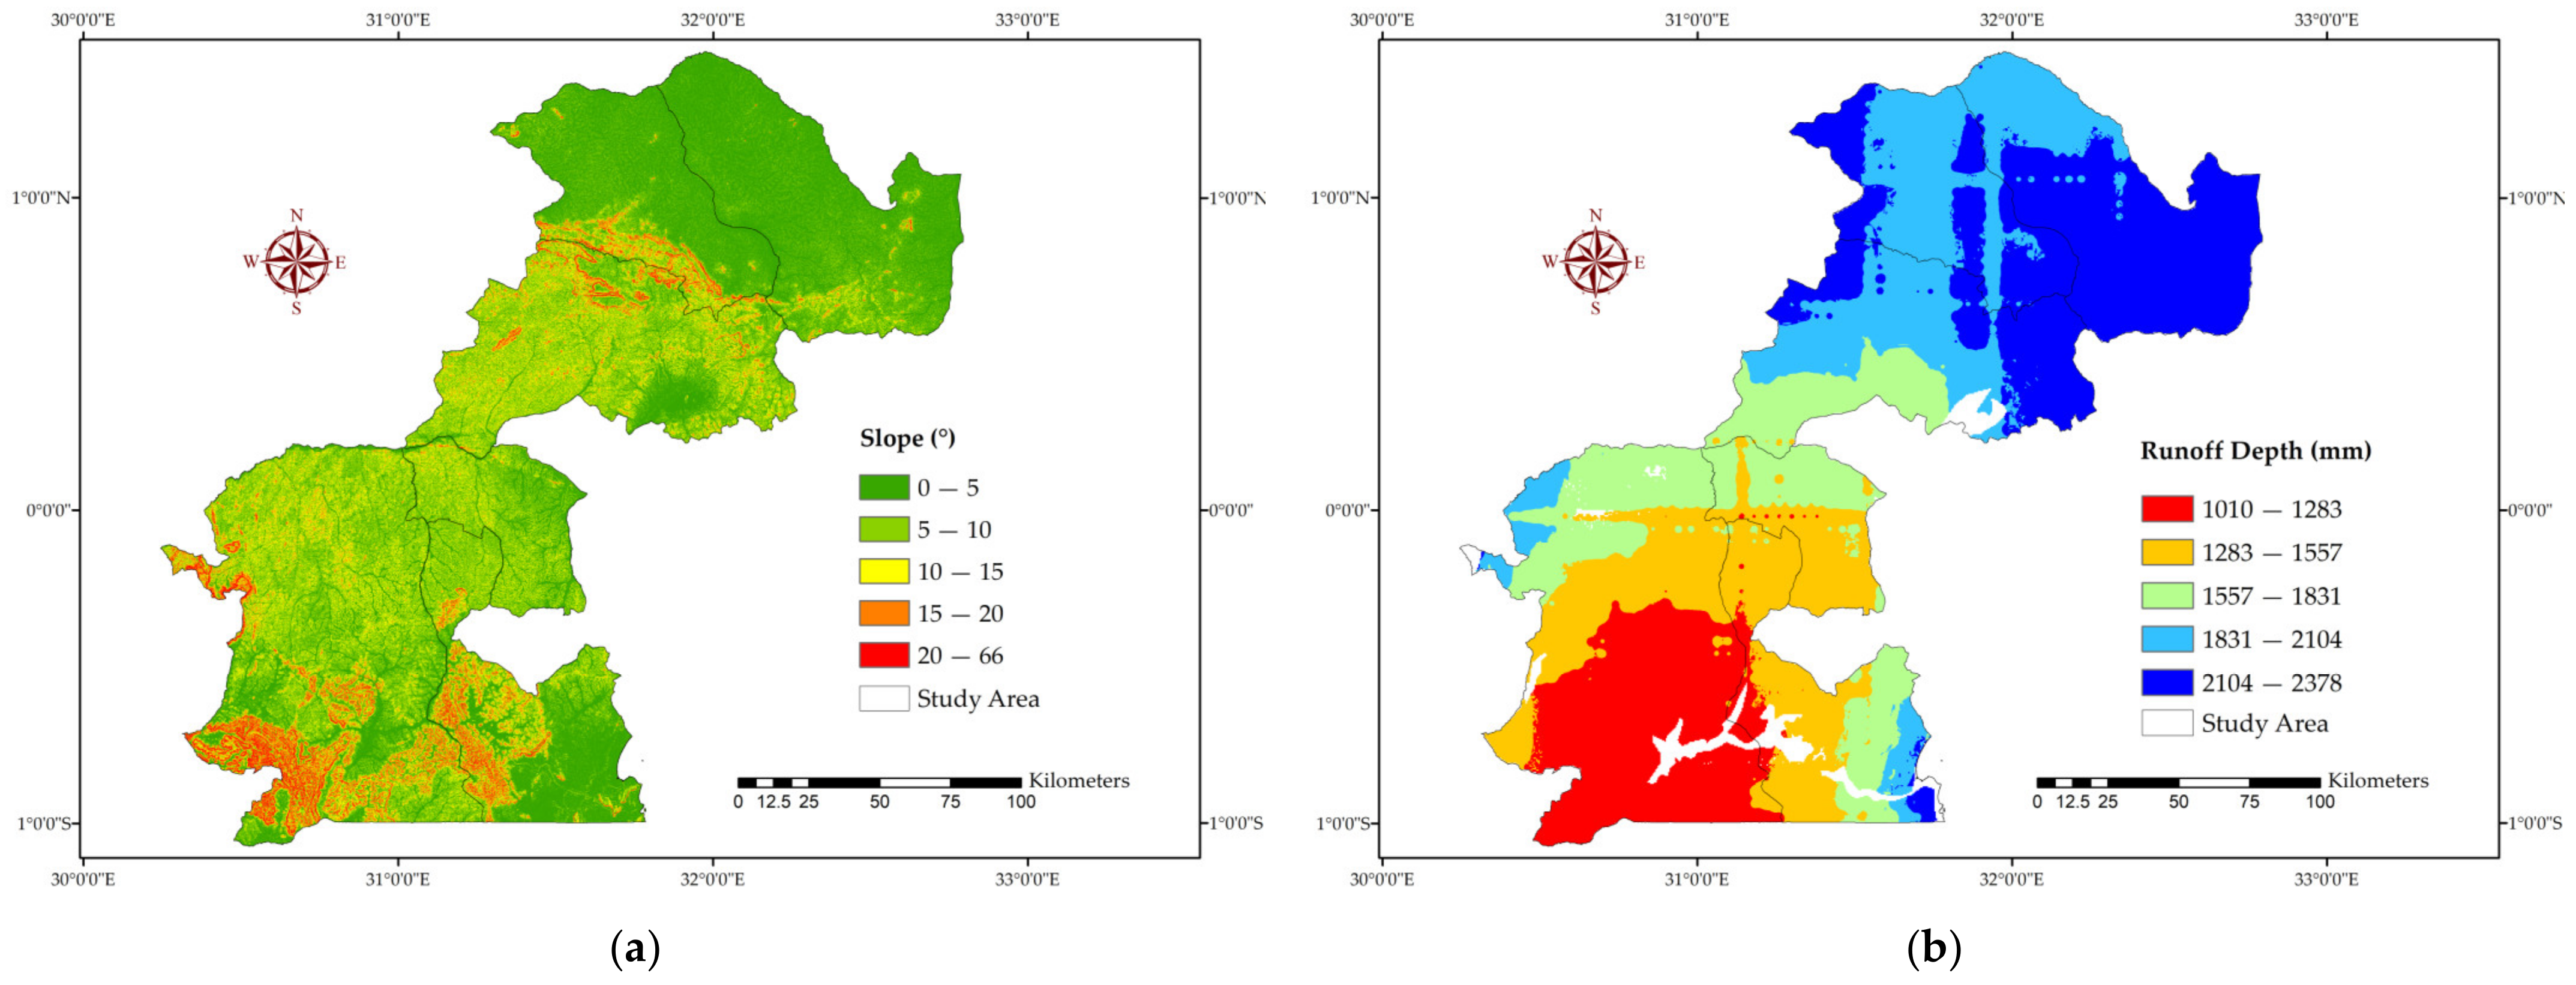
3.4. Slope
3.5. Rainfall Distribution
3.6. Runoff Potential
3.7. Watershed Delineation
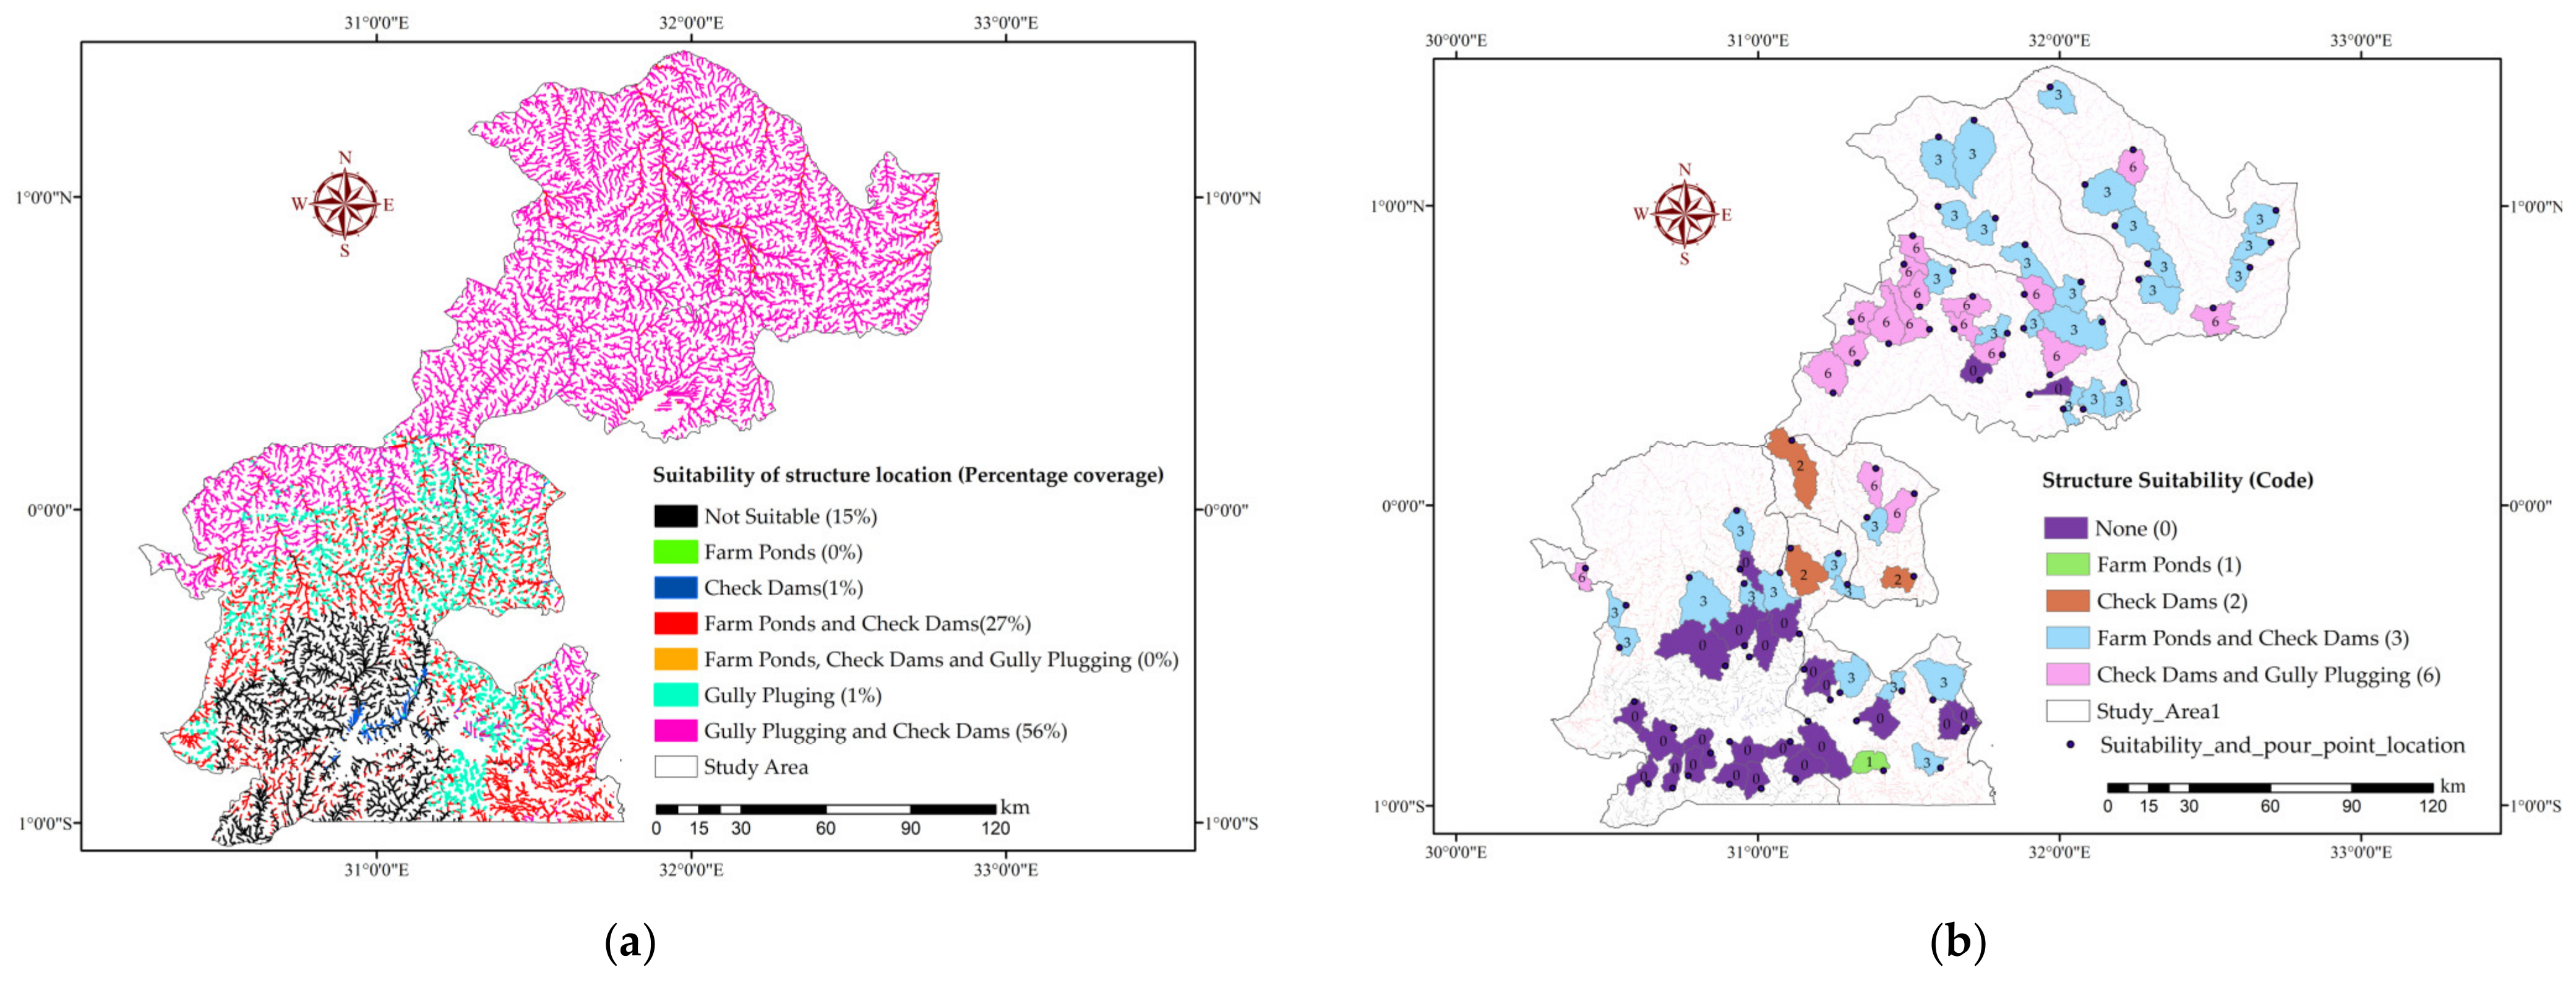
3.8. Potential Stormwater Harvesting Structures for the Demarcated Watershed
4. Conclusions
Author Contributions
Funding
Data Availability Statement
Acknowledgments
Conflicts of Interest
Appendix A

| Watershed No. | Area (km2) | Mean Runoff Depth (mm) | Runoff Volume (hm3) | Longitude (°) | Latitude (°) | Suitability Code | Observation (Google Earth) |
|---|---|---|---|---|---|---|---|
| 1 | 110.7 | 1924 | 212.9 | 31.9683 | 1.3978 | 3 | Open land |
| 2 | 105.3 | 2077 | 218.7 | 32.2433 | 1.1881 | 6 | Near ponds |
| 3 | 181.2 | 2023 | 366.6 | 31.5983 | 1.2306 | 3 | Open land |
| 4 | 281.5 | 1963 | 552.7 | 31.7161 | 1.2864 | 3 | Open land |
| 5 | 243.7 | 2099 | 511.6 | 32.0836 | 1.0719 | 3 | Near River |
| 6 | 94.3 | 1990 | 187.7 | 31.5967 | 0.9989 | 3 | Near Pond |
| 7 | 105.8 | 2247 | 237.8 | 32.7169 | 0.9858 | 3 | Open land |
| 8 | 98.8 | 1984 | 196.1 | 31.7867 | 0.9594 | 3 | Near Pond |
| 9 | 168.4 | 2131 | 358.9 | 32.1833 | 0.9342 | 3 | Near Lake |
| 10 | 91.1 | 2215 | 201.8 | 32.7006 | 0.8786 | 3 | Open land |
| 11 | 81.2 | 2124 | 172.4 | 31.5131 | 0.9008 | 6 | Open land |
| 12 | 97.9 | 2155 | 211.1 | 32.2922 | 0.8075 | 3 | Open land |
| 13 | 66.5 | 2123 | 141.2 | 31.4839 | 0.8058 | 6 | Swamp |
| 14 | 137.1 | 2055 | 281.7 | 31.8856 | 0.8714 | 3 | Open land |
| 15 | 73.5 | 2216 | 162.8 | 32.6311 | 0.7953 | 3 | Open land |
| 16 | 96.9 | 2043 | 198.1 | 31.6456 | 0.7833 | 3 | Open land |
| 17 | 101.4 | 2054 | 208.3 | 31.5364 | 0.6642 | 6 | Swamp |
| 18 | 118.3 | 2046 | 241.9 | 31.8825 | 0.7056 | 6 | Swamp |
| 19 | 108.0 | 2107 | 227.6 | 32.0711 | 0.7469 | 3 | Open land |
| 20 | 139.5 | 2208 | 308.0 | 32.2628 | 0.7553 | 3 | Open land |
| 21 | 102.4 | 1955 | 200.1 | 31.7114 | 0.6981 | 6 | Open land |
| 22 | 84.3 | 2053 | 173.0 | 31.3089 | 0.6136 | 6 | Swamp |
| 23 | 131.8 | 2221 | 292.7 | 32.5089 | 0.6600 | 6 | Swamp |
| 24 | 51.6 | 2095 | 108.2 | 31.8808 | 0.5917 | 3 | Near Swamp |
| 25 | 129.5 | 1994 | 258.2 | 31.5689 | 0.5883 | 6 | Swamp |
| 26 | 73.7 | 1983 | 146.0 | 31.8269 | 0.5753 | 3 | Near Pond |
| 27 | 169.4 | 2022 | 342.6 | 31.4331 | 0.5408 | 6 | Swamp |
| 28 | 84.2 | 1929 | 162.3 | 31.6497 | 0.5892 | 6 | Open land |
| 29 | 260.5 | 2140 | 557.4 | 32.1408 | 0.6133 | 3 | Swamp |
| 30 | 82.8 | 1901 | 157.3 | 31.8100 | 0.5033 | 6 | Near ponds |
| 31 | 114.4 | 1928 | 220.5 | 31.3289 | 0.4758 | 6 | Open land |
| 32 | 161.2 | 2095 | 337.6 | 31.9675 | 0.4367 | 6 | Swamp |
| 33 | 73.8 | 1814 | 133.9 | 31.7358 | 0.4181 | 0 | Open land |
| 34 | 58.4 | 2060 | 120.2 | 31.8994 | 0.3703 | 0 | Lake Wamala |
| 35 | 175.8 | 1848 | 324.9 | 31.2492 | 0.3761 | 6 | Near Swamp |
| 36 | 88.8 | 2100 | 186.5 | 32.0778 | 0.3217 | 3 | Swamp |
| 37 | 91.8 | 2126 | 195.1 | 32.2125 | 0.4100 | 3 | Swamp |
| 38 | 57.7 | 2074 | 119.7 | 32.0119 | 0.3225 | 3 | Swamp |
| 39 | 99.8 | 1613 | 161.1 | 31.3908 | 0.1236 | 6 | Open land |
| 40 | 243.9 | 1585 | 386.6 | 31.1125 | 0.2175 | 2 | Near River |
| 41 | 113.4 | 1561 | 177.0 | 31.5178 | 0.0397 | 6 | Near Gully |
| 42 | 80.1 | 1494 | 119.7 | 31.3614 | −0.0400 | 3 | Open land |
| 43 | 112.5 | 1522 | 171.3 | 30.9294 | −0.0169 | 3 | Near Ponds |
| 44 | 58.9 | 1443 | 85.0 | 31.2661 | −0.1603 | 3 | Near Ponds |
| 45 | 45.8 | 1816 | 83.3 | 30.4283 | −0.2097 | 6 | Open land |
| 46 | 83.9 | 1514 | 127.0 | 31.5169 | −0.2364 | 2 | Open land |
| 47 | 71.7 | 1424 | 102.1 | 30.9408 | −0.2131 | 0 | Open land |
| 48 | 184.4 | 1424 | 262.5 | 31.1072 | −0.1428 | 2 | Near Ponds |
| 49 | 56.1 | 1438 | 80.6 | 31.2964 | −0.2631 | 3 | Open land |
| 50 | 122.9 | 1390 | 170.9 | 31.0728 | −0.2244 | 3 | Open land |
| 51 | 66.0 | 1357 | 89.6 | 30.9542 | −0.2603 | 3 | Open land |
| 52 | 57.5 | 1498 | 86.2 | 30.5631 | −0.3336 | 3 | Swamp |
| 53 | 261.0 | 1340 | 349.7 | 30.7722 | −0.2408 | 3 | Open land |
| 54 | 119.3 | 1335 | 159.3 | 31.1378 | −0.4286 | 0 | Open land |
| 55 | 188.8 | 1275 | 240.8 | 30.9556 | −0.4683 | 0 | Open land |
| 56 | 70.1 | 1400 | 98.2 | 30.5408 | −0.4744 | 3 | Open land |
| 57 | 119.2 | 1300 | 155.0 | 30.9711 | −0.5058 | 0 | Near River |
| 58 | 335.9 | 1265 | 424.8 | 30.8922 | −0.5361 | 0 | Open land |
| 59 | 86.2 | 1348 | 116.2 | 31.1528 | −0.5469 | 0 | Near Lake |
| 60 | 142.8 | 1405 | 200.6 | 31.2714 | −0.6247 | 3 | Waterbody |
| 61 | 45.8 | 1360 | 62.2 | 31.2392 | −0.6492 | 0 | Waterbody |
| 62 | 185.9 | 1724 | 320.5 | 31.5797 | −0.6492 | 3 | Open land |
| 63 | 61.2 | 1528 | 93.6 | 31.4767 | −0.6197 | 3 | Open land |
| 64 | 62.7 | 1917 | 120.1 | 31.6906 | −0.7433 | 0 | Open land |
| 65 | 81.9 | 1239 | 101.5 | 30.5906 | −0.6542 | 0 | Open land |
| 66 | 127.8 | 1485 | 189.9 | 31.3261 | −0.7194 | 0 | Lake |
| 67 | 82.5 | 1833 | 151.2 | 31.6831 | −0.7542 | 0 | Near Lake |
| 68 | 67.0 | 1239 | 83.0 | 31.1067 | −0.7881 | 0 | Open land |
| 69 | 158.9 | 1202 | 191.0 | 30.7211 | −0.7433 | 0 | Open land |
| 70 | 78.7 | 1172 | 92.2 | 30.9064 | −0.7878 | 0 | Lake |
| 71 | 90.5 | 1143 | 103.5 | 30.8431 | −0.8256 | 0 | Lake |
| 72 | 80.1 | 1471 | 117.8 | 31.4161 | −0.8847 | 1 | Open land |
| 73 | 80.0 | 1734 | 138.7 | 31.6050 | −0.8761 | 3 | Open land |
| 74 | 163.9 | 1350 | 221.3 | 31.1658 | −0.7197 | 0 | Lake |
| 75 | 75.8 | 1146 | 86.9 | 30.7689 | −0.9017 | 0 | Open land |
| 76 | 121.2 | 1292 | 156.6 | 31.1236 | −0.9125 | 0 | Open land |
| 77 | 84.9 | 1202 | 102.0 | 30.9056 | −0.9297 | 0 | Open land |
| 78 | 61.2 | 1172 | 71.7 | 30.7172 | −0.9425 | 0 | Open land |
| 79 | 72.7 | 1248 | 90.7 | 30.6364 | −0.9286 | 0 | Open land |
| 80 | 78.4 | 1211 | 94.9 | 31.0111 | −0.9444 | 3 | Waterbody |
References
- Manaouch, M.; Sadiki, M.; Fenjiro, I. Integrating GIS-based FAHP and WaTEM/SEDEM for identifying potential RWH areas in semi-arid areas. Geocarto Int. 2021, 37, 8882–8905. [Google Scholar] [CrossRef]
- Kumar, T.; Jhariya, D.C. Identification of rainwater harvesting sites using SCS-CN methodology, remote sensing and Geographical Information System techniques. Geocarto Int. 2016, 32, 1367–1388. [Google Scholar] [CrossRef]
- Liu, J.; Yang, H.; Gosling, S.N.; Kummu, M.; Florke, M.; Pfister, S.; Hanasaki, N.; Wada, Y.; Zhang, X.; Zheng, C.; et al. Water scarcity assessments in the past, present and future. Earths Future 2017, 5, 545–559. [Google Scholar] [CrossRef] [PubMed]
- Hussain, A.; Rahman, K.U.; Shahid, M.; Haider, S.; Pham, Q.B.; Linh, N.T.T.; Sammen, S.S. Investigating feasible sites for multi-purpose small dams in Swat District of Khyber Pakhtunkhwa Province, Pakistan: Socioeconomic and environmental considerations. Environ. Dev. Sustain. 2021, 24, 10852–10875. [Google Scholar] [CrossRef]
- Asmar, N.F.; Sim, J.O.L.; Ghodieh, A.; Fauzi, R. Effect of Land Use\Land Cover Changes on Estimated Potential Runoff in the Nablus Mountains Watersheds of Palestine: A Case Study. J. Indian Soc. Remote Sens. 2021, 49, 1067–1080. [Google Scholar] [CrossRef]
- Jafari Shalamzari, M.; Zhang, W.; Gholami, A.; Zhang, Z. Runoff Harvesting Site Suitability Analysis for Wildlife in Sub-Desert Regions. Water 2019, 11, 1944. [Google Scholar] [CrossRef]
- Kolekar, S.S.; Mishra, A.; Choudhari, P.; Choudhari, N.R. Identification of specific areas for water conservation measures using Geoinformatics approach. Arab. J. Geosci. 2021, 14, 1–13. [Google Scholar] [CrossRef]
- Tiwari, K.; Goyal, R.; Sarkar, A. GIS-based Methodology for Identification of Suitable Locations for Rainwater Harvesting Structures. Water Resour. Manag. 2018, 32, 1811–1825. [Google Scholar] [CrossRef]
- Zabidi, H.A.; Goh, H.W.; Chang, C.K.; Chan, N.W.; Zakaria, N.A. A Review of Roof and Pond Rainwater Harvesting Systems for Water Security: The Design, Performance and Way Forward. Water 2020, 12, 3163. [Google Scholar] [CrossRef]
- Raimondi, A.; Quinn, R.; Abhijith, G.R.; Becciu, G.; Ostfeld, A. Rainwater Harvesting and Treatment: State of the Art and Perspectives. Water 2023, 15, 1518. [Google Scholar] [CrossRef]
- Teston, A.; Geraldi, M.; Colasio, B.; Ghisi, E. Rainwater Harvesting in Buildings in Brazil: A Literature Review. Water 2018, 10, 471. [Google Scholar] [CrossRef]
- Teston, A.; Piccinini Scolaro, T.; Kuntz Maykot, J.; Ghisi, E. Comprehensive Environmental Assessment of Rainwater Harvesting Systems: A Literature Review. Water 2022, 14, 2716. [Google Scholar] [CrossRef]
- Melville-Shreeve, P.; Ward, S.; Butler, D. A preliminary sustainability assessment of innovative rainwater harvesting for residential properties in UK. J. Southeast Univ. 2014, 30, 135–142. [Google Scholar]
- Aghad, M.; Manaouch, M.; Sadiki, M.; Batchi, M.; Al Karkouri, J. Identifying Suitable Sites for Rainwater Harvesting Using Runoff Model (Scs-Cn), Remote Sensing and Gis Based Fuzzy Analytical Hierarchy Process (Fahp) in Kenitra Province, Nw Morocco. Geogr. Tech. 2021, 16, 111–127. [Google Scholar] [CrossRef]
- Doulabian, S.; Ghasemi Tousi, E.; Aghlmand, R.; Alizadeh, B.; Ghaderi Bafti, A.; Abbasi, A. Evaluation of Integrating SWAT Model into a Multi-Criteria Decision Analysis towards Reliable Rainwater Harvesting Systems. Water 2021, 13, 1935. [Google Scholar] [CrossRef]
- Sayl, K.N.; Mohammed, A.S.; Ahmed, A.D. GIS-based approach for rainwater harvesting site selection. IOP Conf. Ser. Mater. Sci. Eng. 2020, 737, 012246. [Google Scholar] [CrossRef]
- Preeti, P.; Shendryk, Y.; Rahman, A. Identification of Suitable Sites Using GIS for Rainwater Harvesting Structures to Meet Irrigation Demand. Water 2022, 14, 3480. [Google Scholar] [CrossRef]
- Patil, D.; Kumar, G.; Kumar, A.; Gupta, R. A systematic basin-wide approach for locating and assessing volumetric potential of rainwater harvesting sites in the urban area. Env. Sci. Pollut. Res. Int. 2023, 30, 14707–14721. [Google Scholar] [CrossRef]
- Fassman-Beck, E.; Schiff, K.; Apt, D. Evaluating Potential Methods to Quantify Stormwater Capture; SCCWRP Technical Report 1116; SCCWRP: Costa Mesa, CA, USA, 2020. [Google Scholar]
- Nansamba, M.; Sibiya, J.; Tumuhimbise, R.; Ocimati, W.; Kikulwe, E.; Karamura, D.; Karamura, E. Assessing drought effects on banana production and on-farm coping strategies by farmers—A study in the cattle corridor of Uganda. Clim. Change 2022, 173, 1–20. [Google Scholar] [CrossRef]
- Mayanja, M.N.; Rubaire-Akiiki, C.; Morton, J.; Kabasa, J.D. Pastoral community coping and adaptation strategies to manage household food insecurity consequent to climatic hazards in the cattle corridor of Uganda. Clim. Dev. 2019, 12, 110–119. [Google Scholar] [CrossRef]
- Kiggundu, N.; Wanyama, J.; Mfitumukiza, D.; Twinomuhangi, R.; Barasa, B.; Katimbo, A.; Birungi Kyazze, F. Rainwater harvesting knowledge and practice for agricultural production in a changing climate: A review from Uganda’s perspective. Agric. Eng. Int. CIGR J. 2018, 20, 19–36. [Google Scholar]
- Nanfuka, S.; Mfitumukiza, D.; Egeru, A. Characterisation of ecosystem-based adaptations to drought in the central cattle corridor of Uganda. Afr. J. Range Forage Sci. 2020, 37, 257–267. [Google Scholar] [CrossRef]
- Nalwanga, F.S.; Nanteza, J.; Obua, J.; Nimusiima, A.; Mukwaya, P.; Kisembe, J.; Odongo, R.; Musali, P.; Nabanoga, G.N.; Kisira, Y. Insights into meteorological drought: Navigating Uganda’s cattle corridor through past trends and future projections. Nat. Hazards 2024, 120, 8695–8721. [Google Scholar] [CrossRef]
- Mbaziira, J. Insights into agropastoral communities’ innovations in uganda’s cattle corridor. Sustain. Technol. Entrep. 2023, 2, 100038. [Google Scholar] [CrossRef]
- Ingrao, C.; Strippoli, R.; Lagioia, G.; Huisingh, D. Water scarcity in agriculture: An overview of causes, impacts and approaches for reducing the risks. Heliyon 2023, 9, e18507. [Google Scholar] [CrossRef]
- Gavhane, K.P.; Mishra, A.K.; Sarangi, A.; Singh, D.K.; Sudhishri, S. Targeting of rainwater harvesting structures using geospatial tools and analytical hierarchy process (AHP) in the semi-arid region of Rajasthan (India). Environ. Sci. Pollut. Res. 2023, 30, 61682–61709. [Google Scholar] [CrossRef]
- Gebremedhn, A.Y.; Getahun, Y.S.; Moges, A.S.; Tesfay, F. Identification of Suitable Rainwater Harvesting Sites Using Geospatial Techniques With AHP in Chacha Watershed, Jemma Sub-Basin Upper Blue Nile, Ethiopia. Air Soil Water Res. 2023, 16, 1–16. [Google Scholar] [CrossRef]
- Fatumah, N.; Mohammed, S.; Ashraf, N.; Abasi, K.; Shadia, N. Adoption of novel climate-smart farming systems for enhanced carbon stock and carbon dioxide equivalent emission reduction in cattle corridor areas of Uganda. Heliyon 2023, 9, e14114. [Google Scholar] [CrossRef]
- Nanyeenya, N.W.; Bugeza, J.; Kigozi, A.; Kayiwa, S.; Sserumaga, P.; Semwanga, M.; Segawa, A.; Nakiguli, F.; Zziwa, E.; Kabanda, N.; et al. Understanding the dynamics of access to water for beef production and adoption of valley tanks in eight cattle corridor districts of Uganda. RUFORUM Work. Doc. Ser. 2022, 20, 10–18. [Google Scholar]
- Al-Ghobari, H.; Dewidar, A.Z. Integrating GIS-Based MCDA Techniques and the SCS-CN Method for Identifying Potential Zones for Rainwater Harvesting in a Semi-Arid Area. Water 2021, 13, 704. [Google Scholar] [CrossRef]
- Kadam, A.K.; Kale, S.S.; Pande, N.N.; Pawar, N.J.; Sankhua, R.N. Identifying Potential Rainwater Harvesting Sites of a Semi-arid, Basaltic Region of Western India, Using SCS-CN Method. Water Resour. Manag. 2012, 26, 2537–2554. [Google Scholar] [CrossRef]
- Naidu, K.; Ramlal, S.; Rao, V. Runoff Estimation of Mini Watershed of Pedda Kedari Reserve Forest, Tekkali, Srikakulam, AP Using Remote Sensing, GIS And SCS Curve Number Techniques. Int. J. Civ. Eng. Technol. (IJCIET) 2019, 10, 1999–2013. [Google Scholar]
- Rajasekhar, M.; Gadhiraju, S.R.; Kadam, A.; Bhagat, V. Identification of groundwater recharge-based potential rainwater harvesting sites for sustainable development of a semiarid region of southern India using geospatial, AHP, and SCS-CN approach. Arab. J. Geosci. 2020, 13, 24. [Google Scholar] [CrossRef]
- Al-Khuzaie, M.M.; Janna, H.; Al-Ansari, N. Assessment model of water harvesting and storage location using GIS and remote sensing in Al-Qadisiyah, Iraq. Arab. J. Geosci. 2020, 13, 1–9. [Google Scholar] [CrossRef]
- Shadmehri Toosi, A.; Ghasemi Tousi, E.; Ghassemi, S.A.; Cheshomi, A.; Alaghmand, S. A multi-criteria decision analysis approach towards efficient rainwater harvesting. J. Hydrol. 2020, 582, 124501. [Google Scholar] [CrossRef]
- Zhang, S.; Li, Y.; Ma, M.; Song, T.; Song, R. Storm Water Management and Flood Control in Sponge City Construction of Beijing. Water 2018, 10, 1040. [Google Scholar] [CrossRef]
- Napoli, M.; Cecchi, S.; Orlandini, S.; Zanchi, C.A. Determining potential rainwater harvesting sites using a continuous runoff potential accounting procedure and GIS techniques in central Italy. Agric. Water Manag. 2014, 141, 55–65. [Google Scholar] [CrossRef]
- Zhong, S.; Liu, W.; Ni, C.; Yang, Q.; Ni, J.; Wei, C. Runoff harvesting engineering and its effects on soil nitrogen and phosphorus conservation in the Sichuan Hilly Basin of China. Agric. Ecosyst. Environ. 2020, 301, 107022. [Google Scholar] [CrossRef]
- Sujud, L.H.; Jaafar, H.H. A global dynamic runoff application and dataset based on the assimilation of GPM, SMAP, and GCN250 curve number datasets. Sci. Data 2022, 9, 1–11. [Google Scholar] [CrossRef]
- Uganda Bureau of Statistics. National Population and Housing Census 2024—Preliminary Results; Uganda Bureau of Statistics: Kampala, Uganda, 2024. [Google Scholar]
- Radwan, F.; Alazba, A.A.; Mossad, A. Estimating potential direct runoff for ungauged urban watersheds based on RST and GIS. Arab. J. Geosci. 2018, 11, 748. [Google Scholar] [CrossRef]
- Nguyen, P.; Shearer, E.J.; Tran, H.; Ombadi, M.; Hayatbini, N.; Palacios, T.; Huynh, P.; Braithwaite, D.; Updegraff, G.; Hsu, K.; et al. The CHRS Data Portal, an easily accessible public repository for PERSIANN global satellite precipitation data. Sci. Data 2019, 6, 180296. [Google Scholar] [CrossRef] [PubMed]
- Soil Conservation Services United States. SCS National Engineering Handbook, Section 4: Hydrology; US 444 Department of Agriculture, US Government Printing Office: Washington, DC, USA, 1972. [Google Scholar]
- Farooq, S.; Mahmood, K.; Faizi, F. Comparative Simulation of GIS-Based Rainwater Management Solutions. Water Resour. Manag. 2022, 36, 3049–3065. [Google Scholar] [CrossRef]
- Mahmood, K.; Qaiser, A.; Farooq, S.; Nisa, M.u. RS- and GIS-based modeling for optimum site selection in rain water harvesting system: An SCS-CN approach. Acta Geophys. 2020, 68, 1175–1185. [Google Scholar] [CrossRef]
- Mugo, G.M.; Odera, P.A. Site selection for rainwater harvesting structures in Kiambu County-Kenya. Egypt. J. Remote Sens. Space Sci. 2019, 22, 155–164. [Google Scholar] [CrossRef]
- Khan, D.; Raziq, A.; Young, H.-W.V.; Sardar, T.; Liou, Y.-A. Identifying Potential Sites for Rainwater Harvesting Structures in Ghazi Tehsil, Khyber Pakhtunkhwa, Pakistan, Using Geospatial Approach. Remote Sens. 2022, 14, 5008. [Google Scholar] [CrossRef]
- Ibrahim, G.R.F.; Rasul, A.; Ali Hamid, A.; Ali, Z.F.; Dewana, A.A. Suitable Site Selection for Rainwater Harvesting and Storage Case Study Using Dohuk Governorate. Water 2019, 11, 864. [Google Scholar] [CrossRef]
- Asif, M.; Yaseen, M.; Shahid, S.U.; Latif, Y.; Anwar, S.; Abbas, S. Geospatial identification of possible rainwater harvesting locations within a high-altitude Gilgit River basin, Pakistan. Theor. Appl. Climatol. 2024, 155, 7991–8004. [Google Scholar] [CrossRef]
- Pandey, P.; Tiwari, S.K.; Pandey, H.K.; Chaurasia, A.K.; Singh, S. Identification of Potential Recharge Zones in Drought Prone Area of Bundelkhand Region, India, Using SCS-CN and MIF Technique Under GIS-frame work. Water Conserv. Sci. Eng. 2021, 6, 105–125. [Google Scholar] [CrossRef]
- Pathak, S.; Ojha, C.; Zevenbergen, C.; Garg, R. Ranking of Storm Water Harvesting Sites Using Heuristic and Non-Heuristic Weighing Approaches. Water 2017, 9, 710. [Google Scholar] [CrossRef]
- Singhai, A.; Das, S.; Kadam, A.K.; Shukla, J.P.; Bundela, D.S.; Kalashetty, M. GIS-based multi-criteria approach for identification of rainwater harvesting zones in upper Betwa sub-basin of Madhya Pradesh, India. Environ. Dev. Sustain. 2017, 21, 777–797. [Google Scholar] [CrossRef]
- MAmin, H.N.; Majeed, S.A. Runoff Estimation and Dam Selection Site in the Khur khur Watershed (KHW), Using (SCS-CN) Method and (GIS & RS) Techniques. IOP Conf. Ser. Earth Environ. Sci. 2022, 1120, 012019. [Google Scholar] [CrossRef]
- Aklan, M.; Al-Komaim, M.; de Fraiture, C. Site suitability analysis of indigenous rainwater harvesting systems in arid and data-poor environments: A case study of Sana’a Basin, Yemen. Environ. Dev. Sustain. 2022, 25, 8319–8342. [Google Scholar] [CrossRef]
- Rejani, R.; Rao, K.V.; Srinivasa Rao, C.H.; Osman, M.; Sammi Reddy, K.; George, B.; Pratyusha Kranthi, G.S.; Chary, G.R.; Swamy, M.V.; Rao, P.J. Identification of Potential Rainwater-Harvesting Sites for the Sustainable Management of a Semi-Arid Watershed. Irrig. Drain. 2017, 66, 227–237. [Google Scholar] [CrossRef]
- Dangwal, A.; Sharma, A. Mitigation of Urban Flooding using Blue-Green Infrastructure: A Case of Dehradun City, India. Disaster Adv. 2022, 15, 50–61. [Google Scholar] [CrossRef]


| HSG | |||||||
|---|---|---|---|---|---|---|---|
| No. | LULC | Area (km2) | Percentage (%) | A | B | C | D |
| 1. | Grassland | 18,995 | 58 | __ | 69 | 79 | 84 |
| 2. | Cropland | 12,704 | 39 | __ | 78 | 85 | 89 |
| 3. | Open water | 438 | 1 | __ | 100 | 100 | 100 |
| 4. | Forests | 341 | 1 | __ | 55 | 70 | 77 |
| 5. | Built-up land | 44 | 0 | __ | __ | 82 | 86 |
| Total | 32,522 | 100 | |||||
| No. | Structure | Soil Texture | HSG | LULC | Slope | Runoff Potential | Stream Order |
|---|---|---|---|---|---|---|---|
| 1. | Farm ponds | Sandy clay loam/Clay loam | B | Cropland | ≤5 | Moderate to high | 1–4 |
| (Influence by weight %) | (3) | (3) | (8) | (6) | (54) | (12) | |
| 2. | Check dams | Clay loam | C | Open water/stream | ≤15 | Moderate to high | 1–4 |
| (Influence by weight %) | (3) | (3) | (7) | (6) | (45) | (11) | |
| 3. | Gully plugging | Sandy clay loam/Clay | D | Drainage Channel | ≥10 | High | 1–2 |
| (Influence by weight %) | (7) | (7) | (7) | (35) | (37) | (7) | |
Disclaimer/Publisher’s Note: The statements, opinions and data contained in all publications are solely those of the individual author(s) and contributor(s) and not of MDPI and/or the editor(s). MDPI and/or the editor(s) disclaim responsibility for any injury to people or property resulting from any ideas, methods, instructions or products referred to in the content. |
© 2025 by the authors. Licensee MDPI, Basel, Switzerland. This article is an open access article distributed under the terms and conditions of the Creative Commons Attribution (CC BY) license (https://creativecommons.org/licenses/by/4.0/).
Share and Cite
Ssekyanzi, G.; Ahmad, M.J.; Choi, K.-S. Geospatial Assessment of Stormwater Harvesting Potential in Uganda’s Cattle Corridor. Water 2025, 17, 349. https://doi.org/10.3390/w17030349
Ssekyanzi G, Ahmad MJ, Choi K-S. Geospatial Assessment of Stormwater Harvesting Potential in Uganda’s Cattle Corridor. Water. 2025; 17(3):349. https://doi.org/10.3390/w17030349
Chicago/Turabian StyleSsekyanzi, Geoffrey, Mirza Junaid Ahmad, and Kyung-Sook Choi. 2025. "Geospatial Assessment of Stormwater Harvesting Potential in Uganda’s Cattle Corridor" Water 17, no. 3: 349. https://doi.org/10.3390/w17030349
APA StyleSsekyanzi, G., Ahmad, M. J., & Choi, K.-S. (2025). Geospatial Assessment of Stormwater Harvesting Potential in Uganda’s Cattle Corridor. Water, 17(3), 349. https://doi.org/10.3390/w17030349