Article

Mercury Fraction and Transformation in Sediment Cores of the Eutrophic Estuary in Northern Taiwan

Department of Marine Environmental Informatics, National Taiwan Ocean University, Keelung 202, Taiwan
*
Author to whom correspondence should be addressed.
Water 2025, 17(3), 290; https://doi.org/10.3390/w17030290
Submission received: 29 October 2024 / Revised: 25 December 2024 / Accepted: 15 January 2025 / Published: 21 January 2025
(This article belongs to the Section Oceans and Coastal Zones)

Abstract

:
The Hg fractions in three sediment cores of the eutrophic estuary in northern Taiwan were determined by the Bloom sequential extraction method, which chemically divided the sedimentary Hg into five fractions: water-soluble (F1); human stomach acid (F2); organo-chelated (F3); elemental Hg (F4), and residual (F5). The pH, redox potential, and dissolved total Hg in sediment pore waters, grain size, and total organic carbon (TOC) in sediment cores were analyzed, and the results were interpreted. The three sediment cores were in an anoxic environment. The total Hg concentrations in the sediment cores ranged between 110 and 369 ng/g, and most values exceeded the guideline value (ERL, 150 ng/g) of the EPA, U.S.A. However, the total Hg concentrations were mainly dominated by the non-labile Hg fraction (the elemental and the residual fraction), accounting for an average of 60% of the total Hg pool. The organo-chelated fraction accounted for an average of 29% of the total Hg pool. The amounts of the labile fraction (F1 + F2) of Hg in sediment cores of the middle and lower estuary were generally <2% of the total Hg pool. However, the F2 fraction in the sediment core of the upper estuary exceeded 10% of the total Hg pool. This result implied that Hg still poses a potential risk to the benthic organisms in the DRE based on the risk assessment code method. The profile variations between the labile and non-labile Hg fractions exhibited a negatively well-linear correlation, suggesting the transformation of the labile and moderately labile Hg fraction into the non-labile Hg fraction in sediment cores during the sediment burial processes. In addition, the TOC content seemed to play an important role in controlling the sediment Hg fractions in sediment cores.

1. Introduction

Mercury, which caused the Minamata disease in Japan during the 1950–1970 period [1], is a neurotoxin and can be bio-accumulated and bio-magnified at high trophic levels of organisms through the food web [2,3,4]. Thus, Hg is still listed as one of the high-priority environmental pollutants by many countries, such as the European Union and the U.S.A. [2,5]. The natural sources of Hg in the environment are chiefly forest fires, volcanoes, and degassing of the earth’s crust [4]. There are many anthropogenic sources of Hg in the environment, such as artisanal gold mining, coal combustion, specific chemical industries, and domestic sewage effluent [6,7,8]. The final destination of Hg in the environment is the marine environment through riverine and atmospheric transportation [6,7,8]. Mercury has three valency states (0, +1, and +2) and has some characteristics differing from the other trace metals [4,9]. Mercury can be in gas phase, Hg (0), in the water column, and escapes into the atmosphere and is transported far away from the point source [4,7]. Mercury, ranking at the top of the Irving–Williams order, easily reacts with dissolved organic matter to form organic Hg complexes in the water column [10]. Owing to high affinity with the Fe-Mn oxides, mercury ions are easily adsorbed by particles and finally settle down to the sediment [11,12,13,14,15,16,17]. The methylation of Hg naturally occurs in anoxic environments, and methyl Hg (MeHg) is commonly detected in marine sediment [11,18,19,20]. In contrast, the dissolution of authigenic Fe and Mn oxhydroxides could release the adsorbed Hg and MeHg, and the degradation of organic matter could decompose the associated organic Hg compounds during the diagenetic processes in anoxic sediments [4,11,12,18]. It is suggested that the decomposition of organic Hg compounds may change them to the amorphous organic-sulfur Hg or crystalline Fe/Mn oxide phases [14,19]. Thus, to fully understand the geochemistry of Hg in sediments, it is necessary to know the sedimentary Hg species [9,21,22,23].
Many methods have been developed to fractionate the Hg species in soil and sediment. Issaro et al. [24] comprehensively reviewed the published studies, which used the selective (one reagent) method or sequential (several reagents) method to determine the total Hg content and its speciation/fractionation, such as methyl Hg, ethyl Hg, elementary Hg, Hg sulfide, and organically bound Hg, in soil and sediment. Basically, the Hg present in sediments can be roughly fractionated into the volatile compound, the reactive/labile, and non-reactive/non-labile Hg compounds based on the different chemical reagents. Reactive species of Hg compounds are bioavailable and toxic to organisms, while the non-reactive species of Hg compounds are not bioavailable to organisms [24,25]. In spite of that, reactive species of sedimentary Hg may transform into the non-reactive species during the burial processes in sediments [21,22,23]. Among the published methods, Bloom et al. [9] concentrate on Hg fractionation and develop the sequential extraction method (SEM) to chemically divide the sedimentary Hg into five fractions. An earlier SEM was published by Tessier et al. [26], who chemically divided the sedimentary trace metals into five fractions. It is indicated that the amount of sedimentary trace metals bonded to ion exchange (fraction 1) of the Tessier method was generally negligible in sediments [27]. For analytical efficiency, the European Commission developed a four-step analytical procedure, the BCR (Community Bureau of Reference, 2001) protocol [28], to fractionate the sedimentary trace metals into four fractions. Among the published SEMs, the Tessier and the BCR SEMs are the most commonly employed to fractionate the species of sedimentary trace metals in soils and sediments [29]. It is suggested that the Tessier SEM was unsuitable for studying Hg because the Hg chemical properties significantly differ from those of the trace metals [9,24]. Nonetheless, the Tessier and the BCR SEMs are still widely employed to study the fractionations of sedimentary Hg in marine sediments [23,30,31,32,33].
The Danshuei River Estuary (DRE) is the largest estuary in northern Taiwan and is an area influenced seriously by domestic sewage discharge. Such a discharge has caused the DRE to become seriously polluted by nutrients in the estuarine water and sediment [34,35,36,37,38,39]. The detailed descriptions of the partition and the temporal and spatial variations of nutrients within the DRE have been well interpreted in the above studies. In addition, the DRE is also contaminated by Hg which is also introduced by domestic sewage effluent discharge [17,40,41]. The dissolved total Hg (DTHg) concentrations within the DRE generally ranged from 10 to 40 ng/L [17,41], and these values were obviously higher than those, generally <5 ng/L, reported in developed countries [16,42,43]. The sedimentary total Hg (STHg) concentrations in the DRE mostly exceeded the value of effect range low values (ERL, 150 ng/g, Long et al. [44]), the guideline value of the EPA, U.S.A. [17].
Recent studies indicated that municipal sewage effluent is the principal anthropogenic Hg source, resulting in the inshore environment being mildly contaminated by Hg in some countries, especially developing countries [45,46,47]. This phenomenon may be because the DTHg concentration in the municipal raw sewage of developing countries is much higher than that of developed countries because untreated waste water, especially dental amalgam waste water, also discharges into the municipal sewage system [48]. Gbondo-Tugbawa et al. [6] illustrate that the DTHg concentration in the municipal raw sewage of developed countries, such as the U.S.A., averages approximately 310 ± 239 ng/L. This concentration rises to 800–6400 ng/L in developing countries [48]. While, more than 95% of the total Hg in the sewage water can be efficiently removed into sewage sludge, reducing the DTHg concentration in the sewage effluent to approximately 160 ± 130 ng/L [48]. This value is nearly a hundred times higher than in seawater [3,4]. Thus, the inshore environment is inevitably contaminated by Hg from municipal sewage effluent, like the DRE, as mentioned above [17,40,41].
The Hg species present in sediment may obviously alter the geochemistry of Hg in the estuarine and marine sediment, as mentioned above. Our recent study found that the sediment cores within the DRE were anoxic, and the mineralization of dissolved organic nitrogen and total nitrogen occurred obviously during the sediment burial [39]. However, the known of the Hg species, species transformation, and remineralization of Hg in the DRE sediment is very limited. Thus, the present study aimed to examine the species and geochemical variation of sedimentary Hg in sediment cores of different estuarine sections in the DRE. To approach the present study’s purposes, sedimentary Hg fractions in the DRE sediment cores were analyzed using the sequential extraction method (SEM). Prior to determining the sedimentary Hg fractions in sediment cores, three SEMs, namely the Bloom, the modified Tessier, and the BCR, were chosen for comparison, and the best method was employed to fractionate the Hg fractions in sediment cores of the DRE. The MESS 4 reference material was used to examine the three SEMs. As mentioned above, the Bloom SEM completely focuses on Hg fractions in soil and sediment. The Tessier and the BCR SEMs are mainly designed to fractionate trace metal species in soil and sediment. However, both SEMs are probably the most popular methods among the SEMs and are also widely employed to fractionate Hg species in sediments. What are the analytical differences of the Hg fractions in sediment determined by these three SEMs? Such knowledge is nearly absent in the literature. The present study tried to establish the Hg geochemical variation in anoxic sediment which is mildly contaminated by Hg.

2. Sampling and Methods
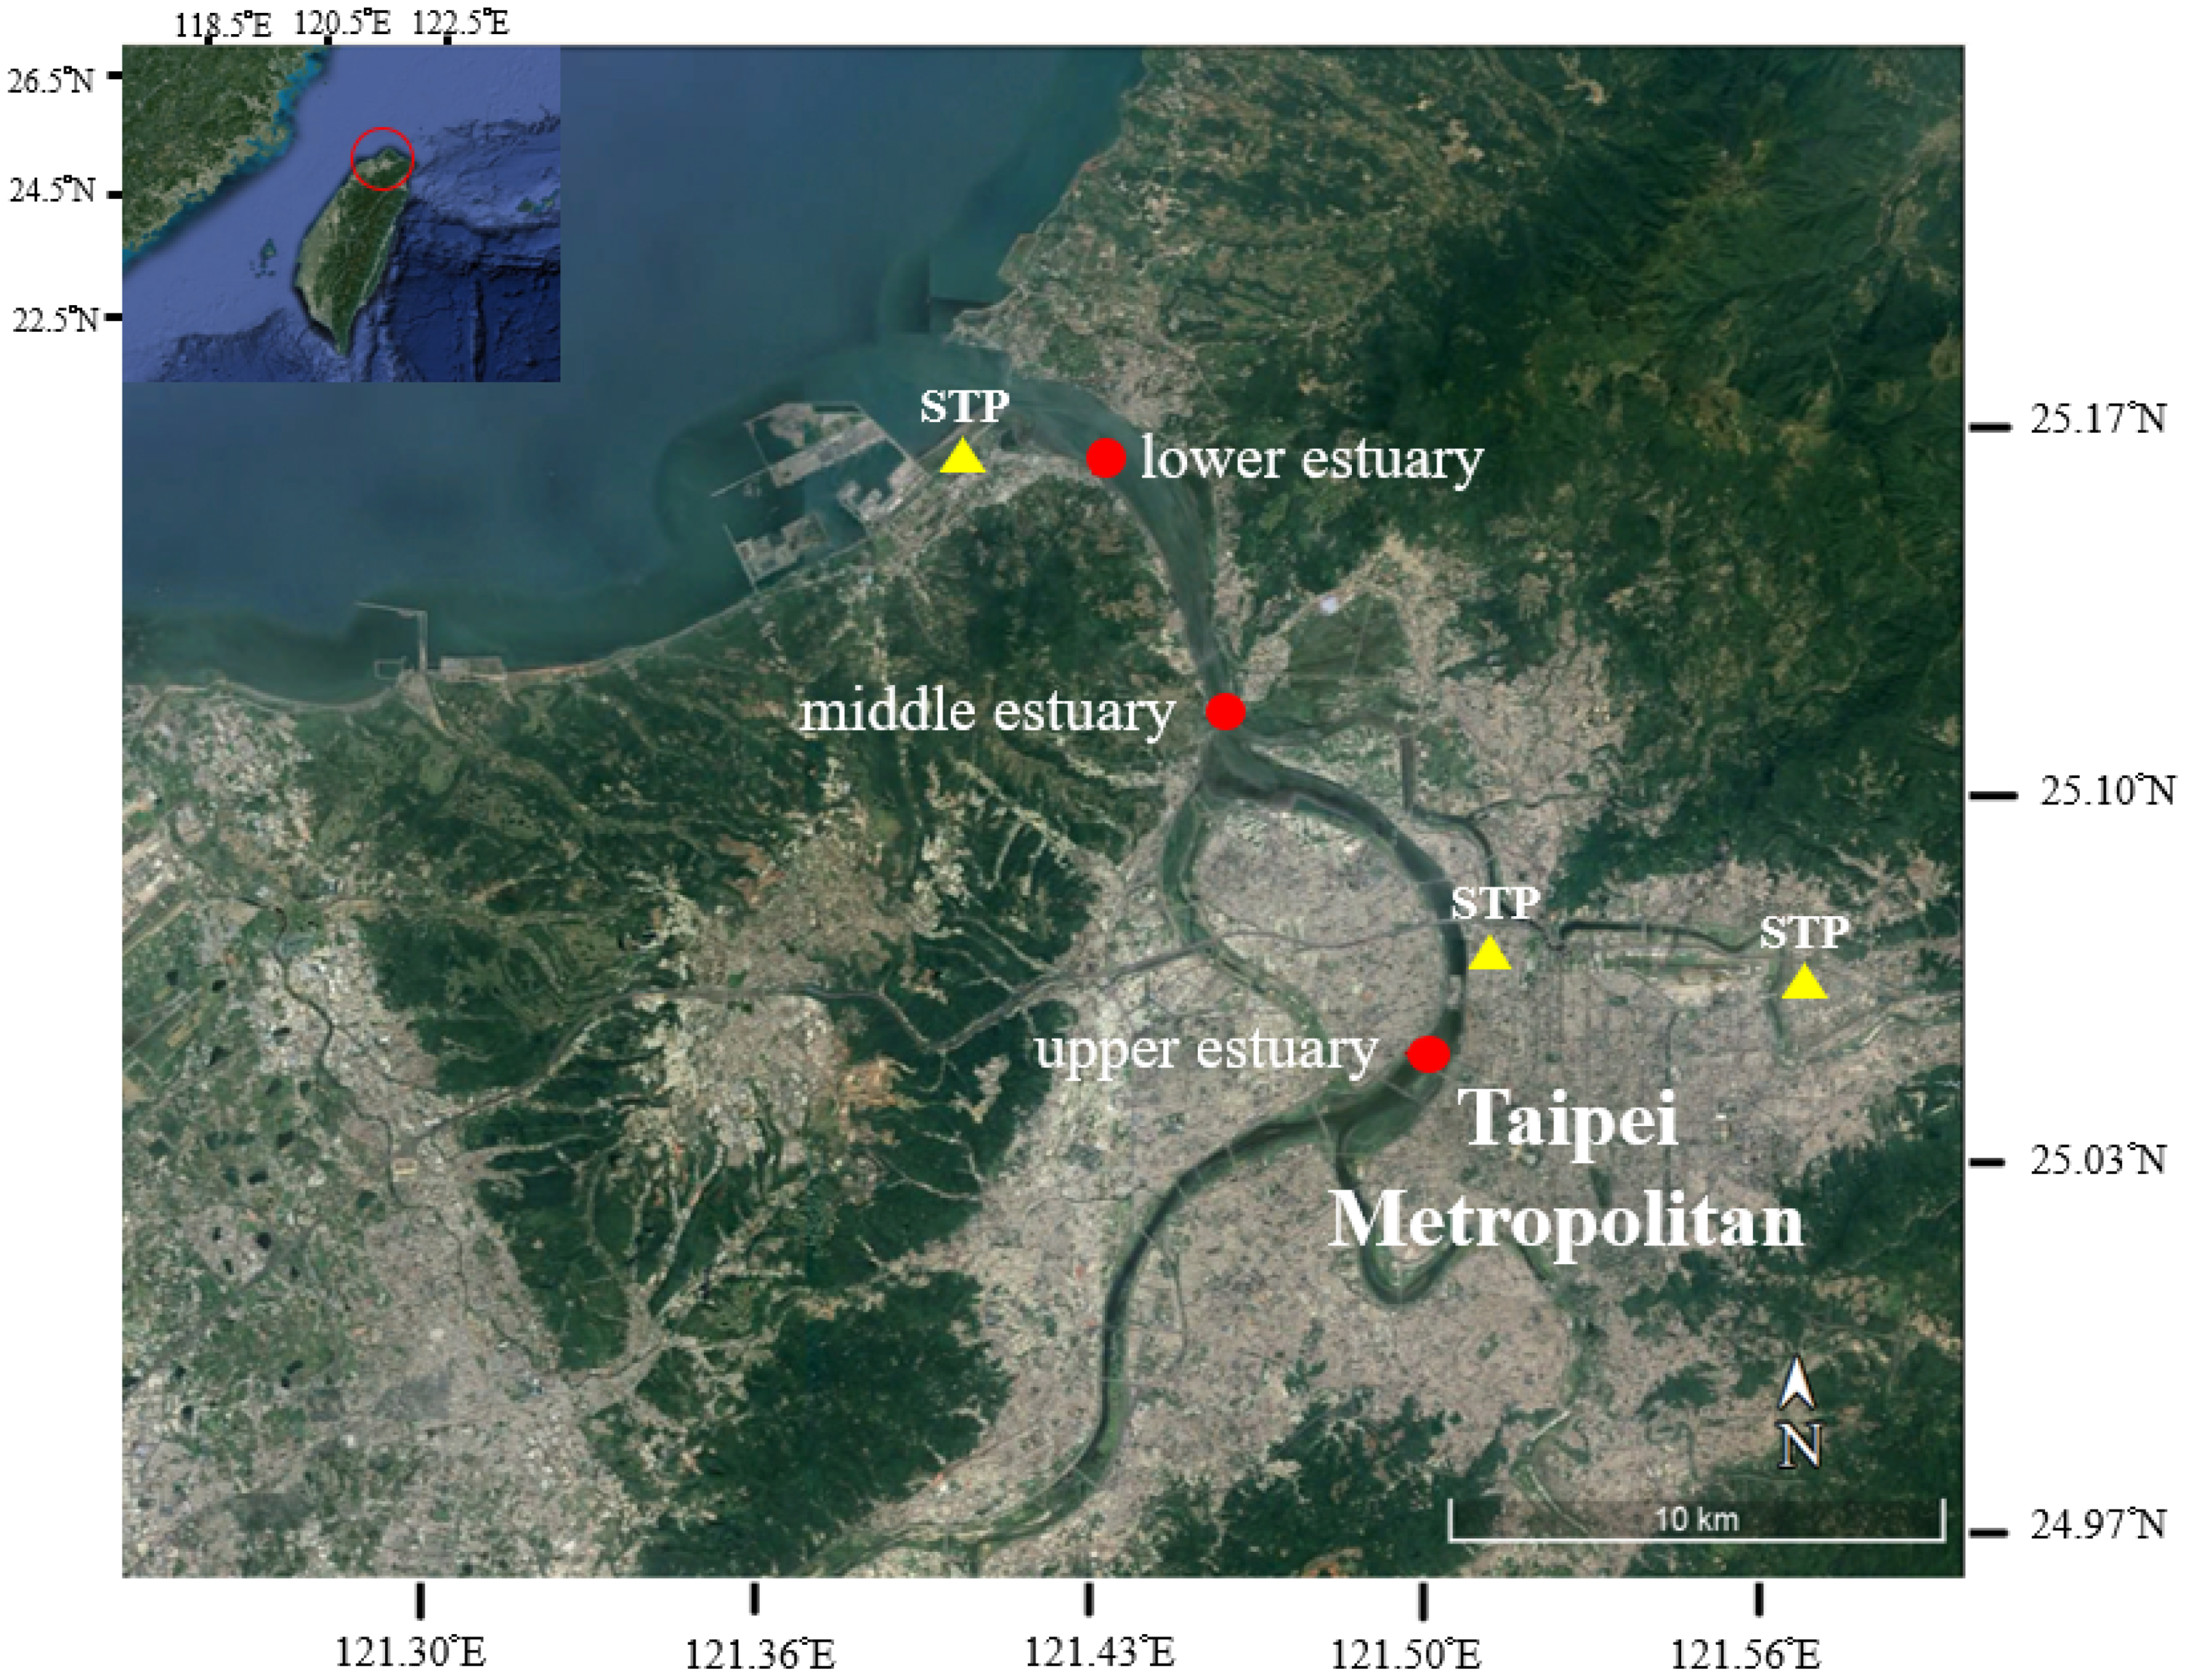
2.1. Study Area

The Danshuei River Estuary (DRE) is a shallow (1~15 m) estuarine system which contains three major tributaries and embraces four major cities of northern Taiwan. The drainage area of the DRE is approximately 2726 km2 and more than seven million people reside within the DRE system. The length of the DRE system is about 30 km, and the average tidal range is approximately 2.2 m [36,37,38]. The depth of the DRE lower estuary varies between 4–8 m and may exceed 10 m at high tide [49]. The estuary is a partially mixed estuary during the ebb period, but can be a well-mixed estuary during the flood period [36,37,38]. The major forcing mechanics of the DRE are the barotropic flow induced by the astronomical tides and the river discharges [49]. However, the occasional storm may occur during the typhoon period in June and September [36,37,38]. The rainy season in northern Taiwan generally occurs during late May and early June, and the annual precipitation has ranged between 1500 and 2500 mm in the last four decades [50]. However, extremely heavy precipitation may occur during the summer season, when tropical typhoons hit Taiwan. For example, extremely heavy precipitation, 800–1200 mm, was commonly measured in northern Taiwan during 13–17 October 1998, when typhoon Zeb directly hit Taiwan [50]. Extremely heavy precipitation generally accompanies a hyperpycnal event (defined as sediment concentration > 40 g/L), which can continue for several days, and the sedimentation rate may vary by one to two orders of magnitude during the typhoon period [51].
There are three sewage treatment plants (STPs) in the river estuary system (Figure 1). The Bali STP is the largest STP among the three STPs, and its daily sewage treatment ranges between 0.94–1.30 (average 1.16) × 106 m3/d in 2023. The average concentrations of chemical oxygen demand (COD), suspended particulate matter (SPM), and pH in the discharge effluent of the Bali STP were 181.32 mg/L, 55.78 mg/L, and 6.94, respectively, in 2023 [52]. The treated effluent of the Bali STP is discharged into the inshore, outside of the DRE. The DTHg concentration in adjacent seawater off the Bali STP was 9–22 ng/L and the concentration reduced to 1–2 ng/L in the ambient seawater in the seasonal investigation during the studied periods from May 2003 to January 2005 [40]. The other two STPs, located in the upper estuary, had daily sewage treatment in the range 1.62–2.17 (average 1.91) × 105 m3/d and 4.04–4.65 (average 4.41) × 105 m3/d, respectively, in 2023. The concentration ranges of chemical oxygen demand (COD), SPM, and pH in the discharge effluent of these two STPs were 31.5–43.2 mg/L, 13.3–16.2 mg/L, and 6.5–7.0, respectively, in 2023 [52]. The nutrient pollution of the DRE caused by the municipal waste waters has been addressed well in our previous studies [36,37,38].

2.2. Sampling

The detailed descriptions of the sediment core collection and the water depth and salinity at each station in the present study can be found in our recent study [39]. The water depths of the three stations were approximately 6.2 m, 7.5 m, and 5.7 m, respectively. A small fishing boat sailed to reach the sampling locations. Three sediment cores at the different estuarine sections of the DRE were collected by divers by inserting the PVC core tube (diameter 7.4 cm and length 50 cm) into the sediment on the 14 May 2021 (Figure 1). The sediment core was capped on both sides, and the PVC tube was retrieved. The detailed processes of the collected sediment core samples can be found in our recent study [39].

2.3. Analysis

2.3.1. Hg Fractions with the Three SEMs

The MESS 4 reference material, the National Research Council of Canada (NRC-MESS-4), was used to examine the analytical quality assurance and quality control (QA/QC) of the Bloom, the modified Tessier, and the BCR SEMs. The fractionation, chemical treatments, and the possibly analytical mechanisms of the Bloom et al. [9], the modified Tessier et al. [26], and the BCR [28] SEMs were tabulated in Table 1. The chemical treatment of the last step of the Tessier (fraction 5) SEM was replaced by aqua regia, which is used for the U.S.A. EPA Method 7474 [53]. Many studies used the aqua regia to replace the HF-HC1O4 mixture (Tessier method) and named it as the modified Tessier SEM [24]. The analytical procedure of the Hg SEM was briefly described below. The MESS-4 sample was weighed at 1.0 g into a 50 mL polypropylene (PP) centrifuge tube, and the chemical reagent (Table 1) was added to the PP tube for each step extraction. Each analytical method was carried out with six replicate analyses. The sample weight, volume of the chemical reagent extraction, and the analytical procedure in each extraction step completely followed the three published SEMs. The extracted mixture was centrifuged at 3000 rpm for 10 min to separate it from the residual sediment. The extractant of each step was filtered by 0.45 μm (PVDF) syringes and was stored in the 50 mL PP centrifuge tube. A small amount of the filtered solution (3–5 mL) in each extractant was taken by auto-pipette into the 50 mL PP centrifuge tube. This solution was diluted to 50 mL with Milli-Q water and was immediately added to the 0.2 M BrCl solution to oxidize the Hg overnight. The remaining solution in each extract was decanted carefully. The remaining sample was washed by adding 10–40 mL Milli-Q water, and the sample was centrifuged at 5000 rpm for 10 min. Afterward, the washed solution was carefully decanted. the next step extraction proceeded, again following the same procedure. The analysis of Hg in each extractant employed the U.S.A. EPA Method 1631 [54]. The Hg concentration in each extractant was determined with an atomic fluorescence spectrophotometer (Brooks Rand Model III, Seattle, WA, USA). Each method of the three SEMs was performed via six-repeat analysis of the MESS-4 reference material.
The analytical concentrations and percentages of different Hg fractions in the MESS-4 reference material analyzed by the three SEMs are tabulated in Table 2 and shown in Figure 2. The result indicated that the average sum Hg concentration (ASHg) of different fractions of the Bloom SEM was 84.3 ± 1.2 ng/g (one standard deviation, n = 6), and the analytical accuracy was 93.6 ± 1.3%. The corresponding values of the modified Tessier and the BCR SEMs were 109.4 ± 7.7 ng/g and 121.5 ± 8.6%, as well as 86.8 ± 3.9 ng/g and 96.5 ± 4.3%, respectively. The analytical accuracy of the Bloom SEM paralleled with the BCR SEM, but the modified Tessier exceeded 120%. These results matched well with the reviewed paper of Issaro et al. [24], who indicate that the published methods all claimed their analyzed recovery was good enough (almost >95%) no matter what kind of different mixture of strong acids, such as the HNO3/H2O2, HNO3/HCl/HF, HNO3/H2SO4/HClO4, H2SO4/HNO3/V2O5, HNO3/H2SO4/KMnO4, HNO3/HF/HCl, HNO3/H2SO4/BrCl, and HNO3/HCl/BrCl, were employed to analyze the Hg contents in soil and sediment samples. Our analyzed result employed the Bloom SEM was also consistent with the result of Bloom et al. [9], who show that the analyzed recovery of the geological solid samples determined by their SEM was in the range 90–105%.
Figure 2 clearly shows that Hg fractions analyzed by the Bloom SEM were mainly dominated by the elemental Hg (F4, 57–61%, average 59%) and organic-chelated Hg (F3, 24–27%, average 25%), averagely accounting for 84% of ASHg. The other three fractions, the human stomach acid (F2, 7–9%, average 7.8%), the residual fraction (F5, 4–6%, average 5%), and the water-soluble (F1, 2.7–3.6%, average 3%), averagely accounted for 16% of ASHg. The corresponding sequence of the modified Tessier SEM was organic matter (F4, 23–36%, average 32.4%) > Fe-Mn oxides (F3, 25–41%, average 32.2%) > residual (F5, 22–31%, average 27%) > carbonates (F2, 3.4–6.8%, average 5.6%) > exchangeable (F1, 2.4–3.9%, average 2.9%). The sequence of the BCR SEM was oxidizable (F3, 39–53%, average 46%) > reducible (F2, 31–40%, average 35%) > residual (F4, 9–18%, average 12%) > exchangeable (F1, 4.7–8.5%, average 6.9%). The analyzed result of the BCR SEM was quite similar to that of the Bloom SEM when the amounts of F1 and F2 fractions were merged together. The amount of residual fraction (F5) analyzed by the Bloom SEM was the least among the three SEMs, and the quantity of this fraction was even lower than the human stomach acid fraction (F2) in the MESS-4 material. The reason for this may be that the nearly concentrated HNO3 (14 M), which is used during the fourth step of the Bloom SEM, could dissolve HgS, known as cinnabar [55]. In addition, Fernández-Martínez and Rucandio [56] systematically studied the suitability of HNO3 and HCl as extraction chemicals of Hg fraction in sediment and indicated that HNO3 could dissolve all the possible Hg fractions in sediment.
Table 2 showed that the variation in the analyzed precision of the Bloom SEM was the least, and that of the modified Tessier SEM was the greatest among these three SEMs. The mechanisms for such phenomena were not clear in the present study. An assumption that the released Hg cations was re-adsorbed by the solid during or after the weaker chemical reagent extraction [27,57] is made in the present study. Table 2 indicates that the chemical reagents used in the modified Tessier SEM were relatively weaker than those of the other two SEMs. However, this assumption needs further investigation. Overall, based on the analytical QA/QC of the MESS-4 analysis, the present study suggested that the Bloom SEM was the best choice to determine the Hg fractions in sediment among these three SEMs. For fractionation of multi elements of trace metals (including Hg) in sediment, the BCR SEM was better than the modified Tessier SEM. Finally, the Bloom SEM was chosen to fractionate the Hg species in the sediment cores of the present study.

2.3.2. Sediment Core Analysis

The present study used the same sediment cores which were used to study the N geochemical variation in the DRE sediment cores, and the analyzed results can be found in our recent work [39]. The sediment pore waters were measured for the pH, redox potential (Eh), and different dissolved nitrogen species (NH4+, NO2, NO3, and dissolved total nitrogen). The grain size (GS) of the sediment core samples was measured by dividing it into four fractions: medium sand (>177 μm), fine sand (125–177 μm), very fine sand (63–125 μm), and mud (<63 μm), based on the method of Folk [58]. The total organic carbon and total nitrogen of the sediment core samples were also determined. The detailed processes of these sediment cores and the analyzed results of these parameters can be found in our recent study [39].
The detailed extraction process of sediment pore water of the present work can be found in our recent study [39]. The extracted pore water in each sample was stored in acid-cleaned plastic PP tube and was analyzed for the dissolved total Hg (DTHg). A small amount, 0.5–2 mL depending upon the volume of pore water, of the filtered pore water was taken by auto-pipette and diluted to 10 mL with the Milli-Q water. This solution was immediately added the 0.2 M BrCl solution to oxide Hg overnight. The determinations of DTHg concentration of the pore waters were employed the U.S.A. EPA Method 1631 [54], as described above. The detailed analytical procedure of DTHg in water can be found in our previous study [17,41].
The remaining samples of sediment cores for analyzing the DTHg in sediment pore water were dried using the dry freezer. The dried sediment samples were ground with a mortar and pestle, and were sieved to pass a 100 mesh nylon sieve. The sieved samples were stored in plastic bags for the further determination of different fractions of Hg. The Bloom et al. [9] SEM was chosen in the present study to examine the Hg fractions in the sediment cores of the DRE. This SEM operationally chemically divides the sedimentary Hg into five fractions: water-soluble, hereafter referred to as fraction 1 (F1); human stomach acid (F2); organo-chelated (F3); elemental Hg (F4); and residual (F5). The detailed description of the analytical procedure of the Bloom SEM has been addressed in Section 2.3.1.

2.3.3. Trace Metals Contamination Assessment

In order to sustain the marine ecology of marine environment, many countries worldwide have established sediment quality guidelines (SQGs) to protect the coastal environment [44]. The design of the SQGs is generally based on the protection of marine life away from adverse effects, such as effect range low (ERL), effect range median (ERM), the threshold effects (TEL), and the probable effects level (PEL) [44]. The adverse effects on marine life are the probability concept of acute toxicity of the total concentrations of individual elements or chemical compounds to marine organisms [59]. However, trace metals preserved in sediments can be divided into the labile fraction and non-labile fraction. The former faction of trace metals can be taken up by marine organisms, and the later fraction is not [2,10]. Thus, the risk assessment code (RAC) method is developed to assess the potential ecological risk of trace metals to organisms [60,61]. The RAC method targets the exchangeable and the carbonate bound fractions of trace metals, which are generally the former two fractions of trace metals in solid samples (soil/sediment/particles) analyzed by the sequential extraction methods, such as the Tessier method and the Bloom method [2,55]. Both fractions of metals are the easily labile metal, which could equilibrate with the aqueous phase and thus become more rapidly bioavailable [2,55]. The potential risk assessment of the RAC method is divided into five groups: RAC ≤ 1%, no risk; 1% < RAC ≤ 10%, low risk; 10% < RAC ≤ 30%, medium risk; 30% < RAC ≤ 50%, high risk; and 50% < RAC, very high risk [60,61]. The SQG values of ERL/ERM and the RAC method are employed in the present study to assess the Hg contamination status and the potential risk to benthic organisms in the DRE.

3. Results

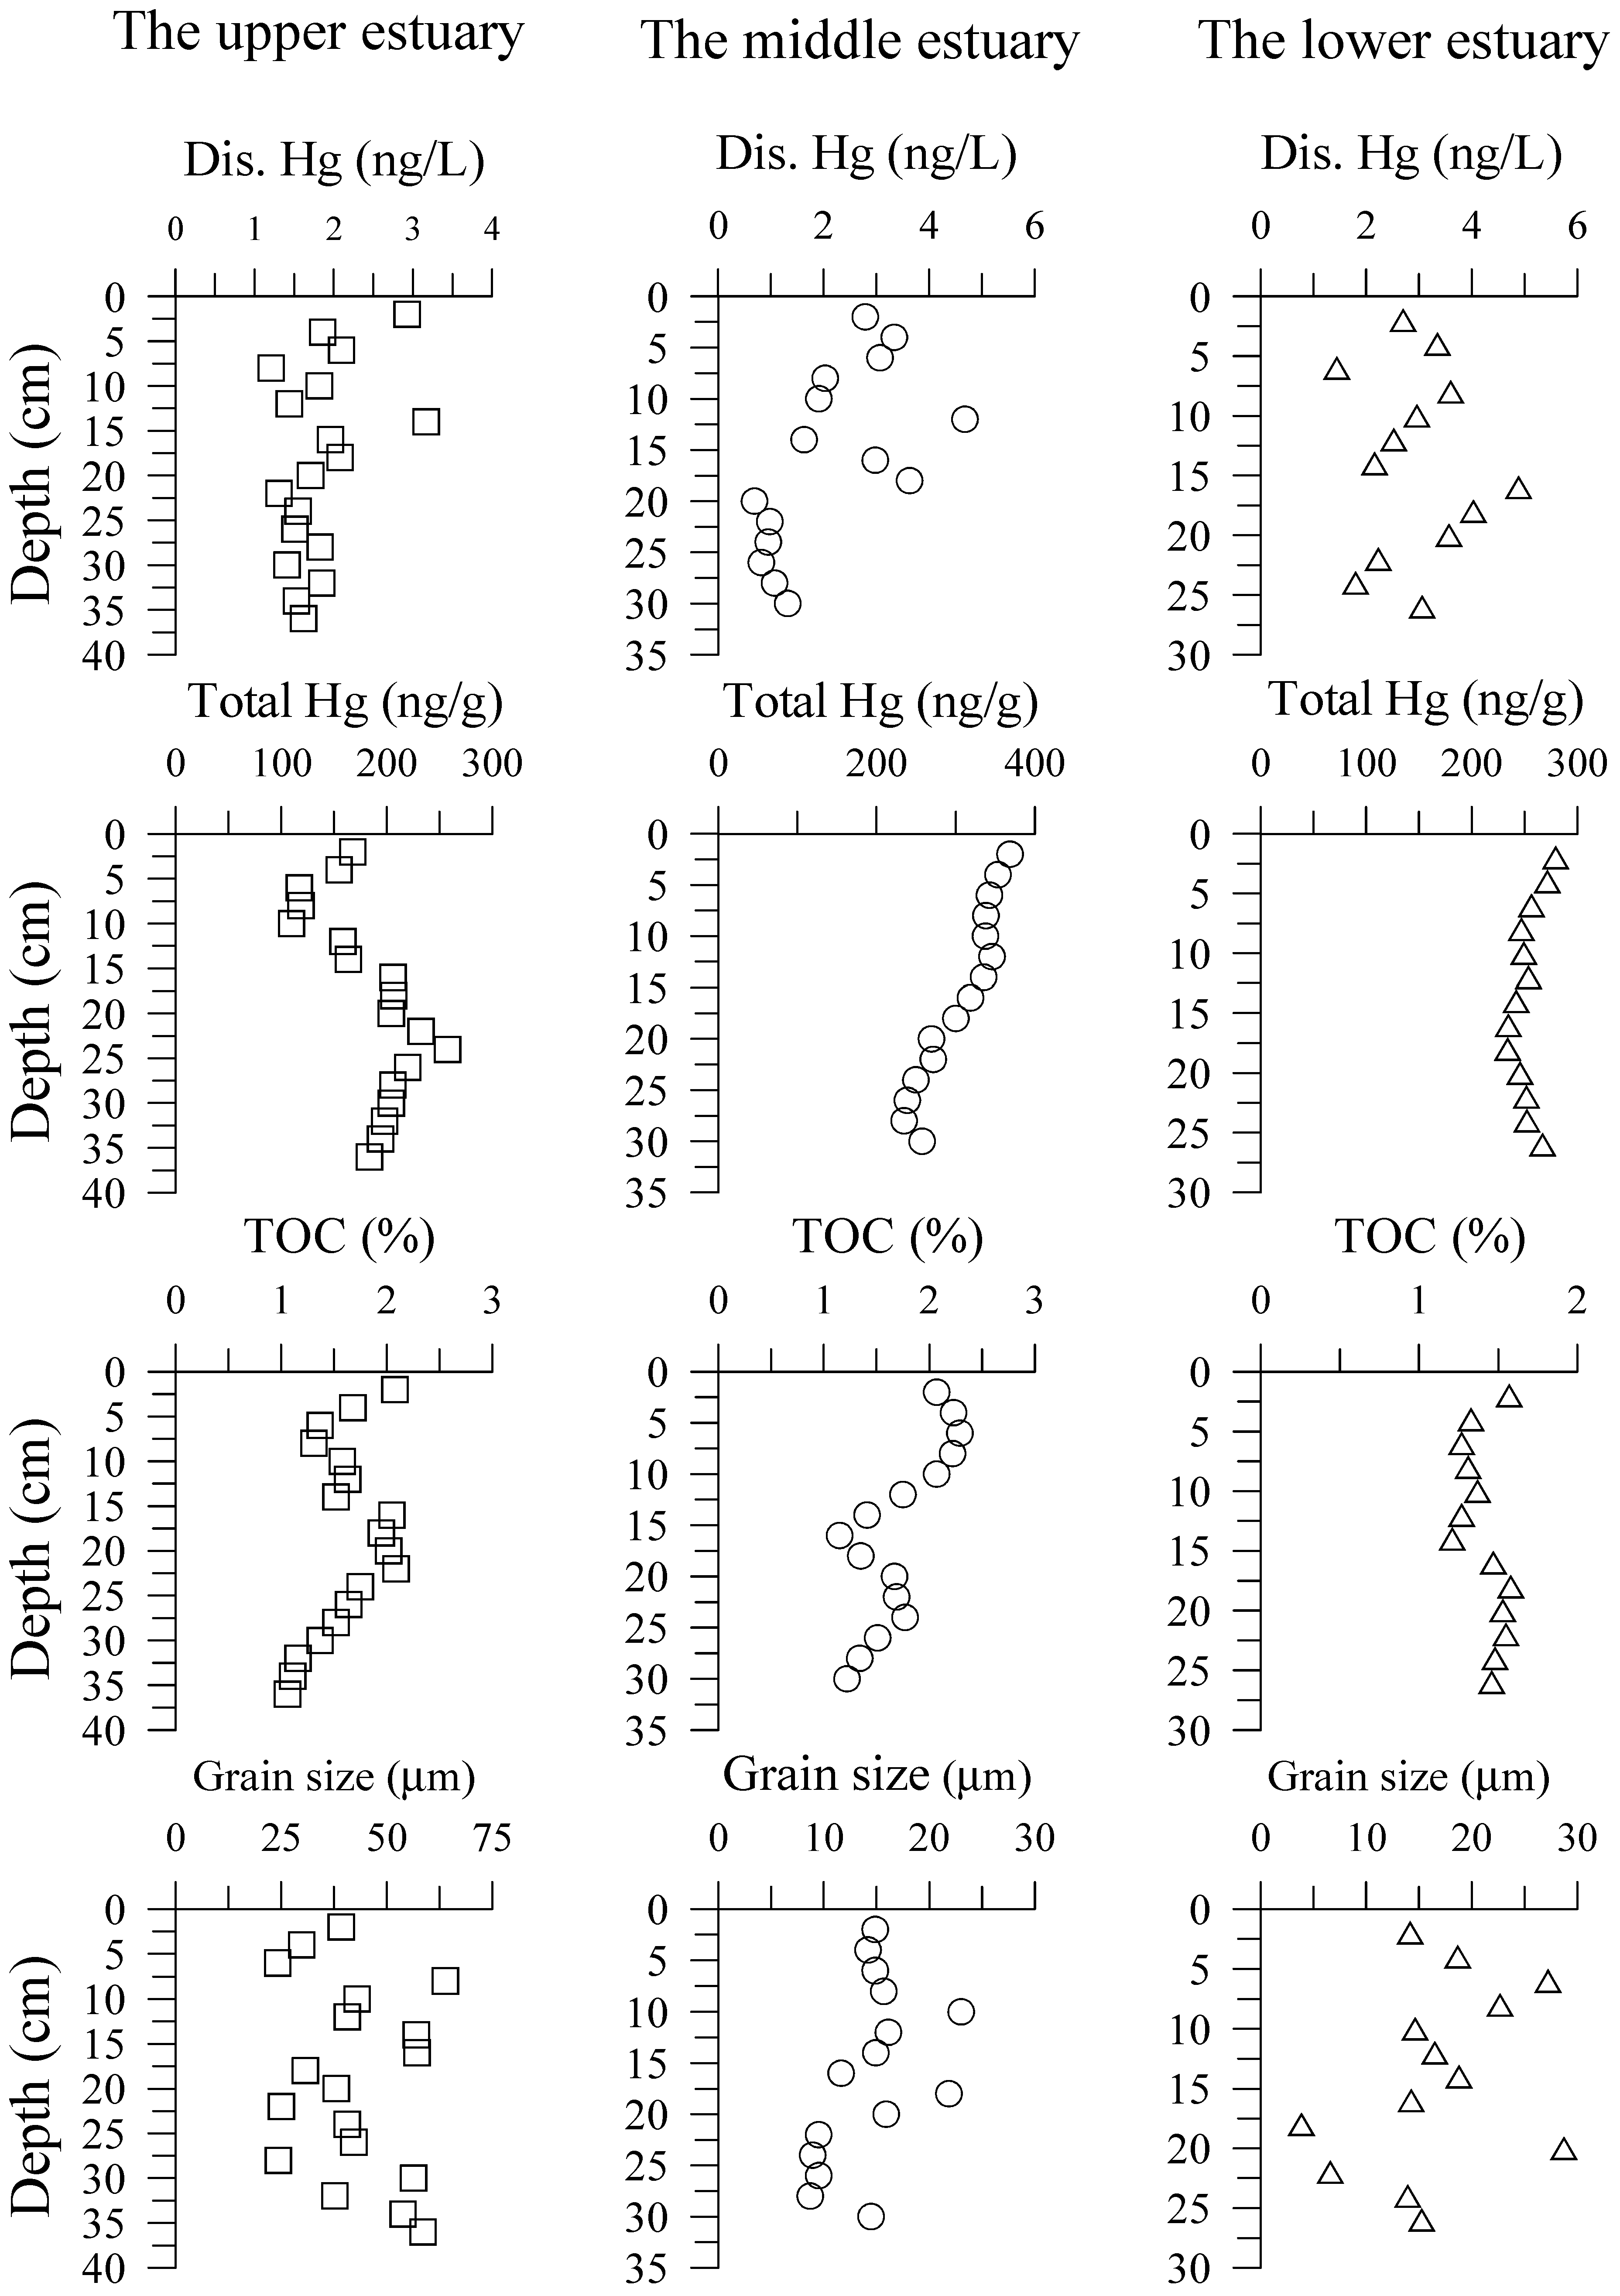
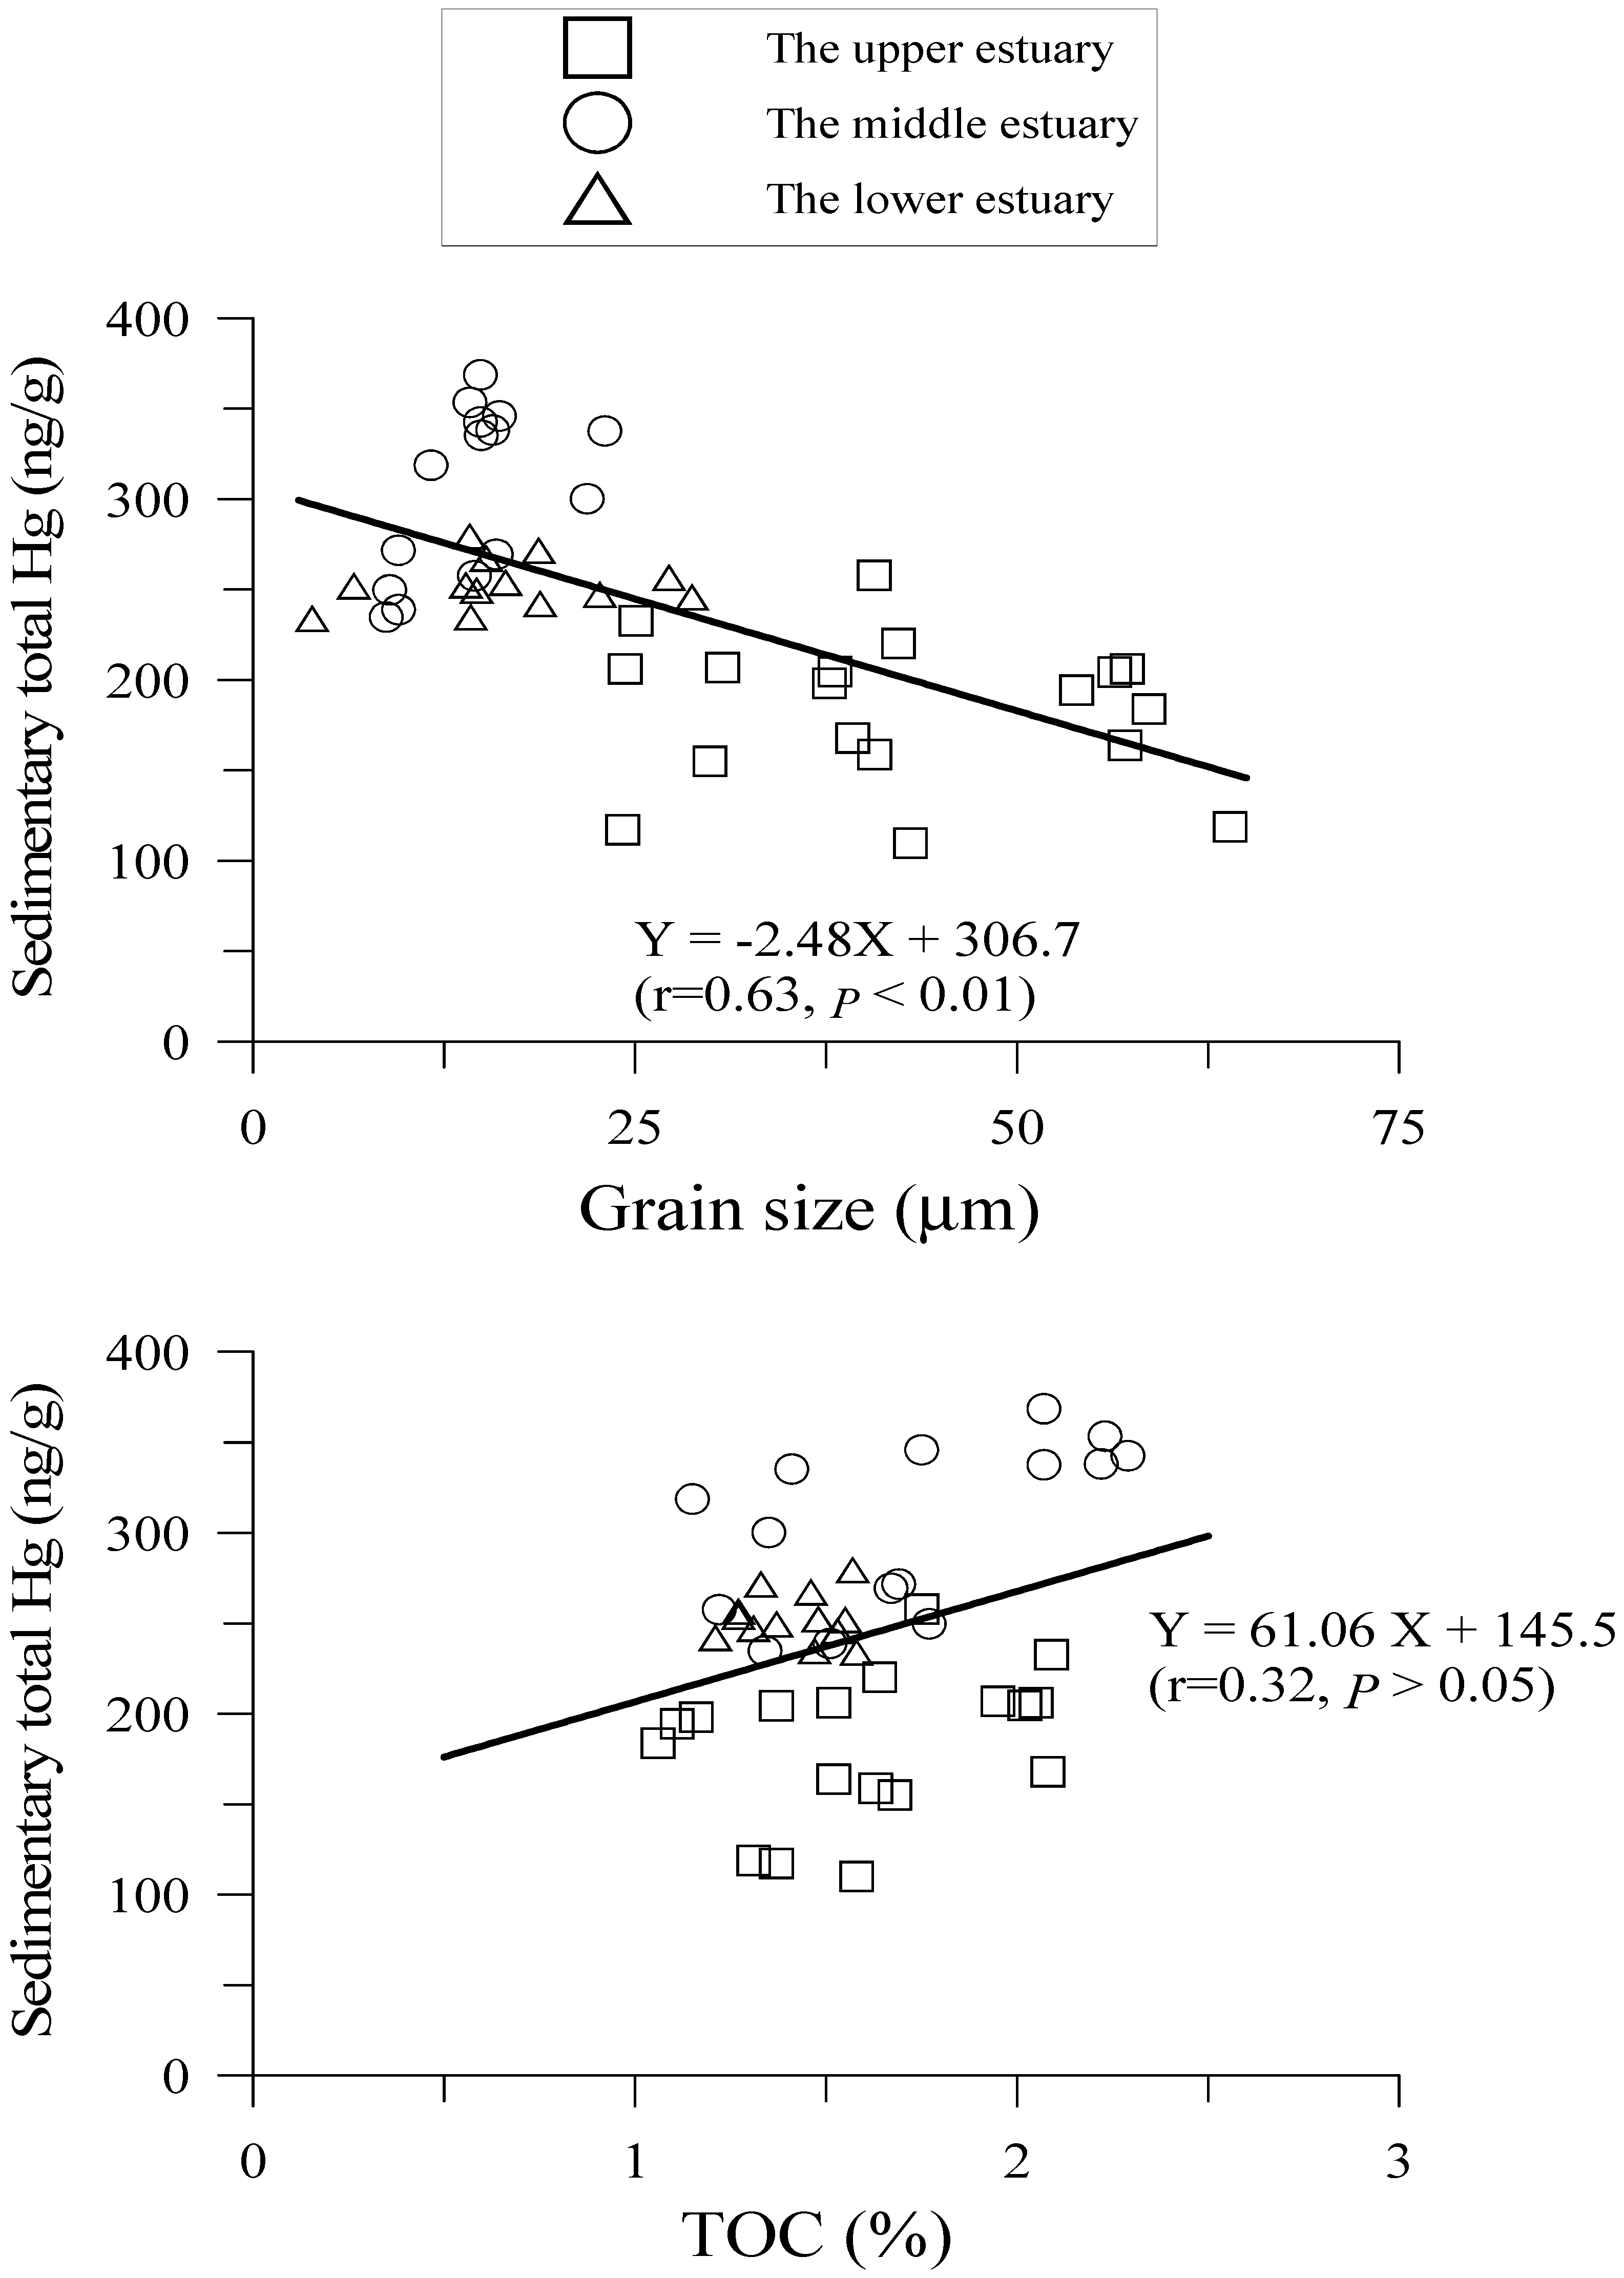
3.1. Hg in Pore Water and Sediment Cores

The detailed interpretations of analyzed results of pH, the redox potential (Eh), and dissolved N species in pore waters, and the GS, TOC, and TN in the three sediment cores of the DRE can be found in our recent study [39]. The present study will concentrate on the interpretation of Hg geochemical variations in the three sediment cores. The GS and TOC are often the crucial parameters which influence the content of sedimentary Hg in the marine environment [17,35,62,63,64,65]. Thus, both parameters will be briefly described in the present work. The concentration ranges of DTHg in pore water, and total Hg, TOC, GS, and the percentage of four-size GS of the three sediment cores are tabulated in Table 3, and their profiles are shown in Figure 3. The GS and TOC in the three sediment cores were in the range 3.86~63.94 μm and 1.06~2.29%, respectively. The very fine sand and mud fractions dominated the GS of sediment core of the upper estuary, while the mud fraction (<63 μm) governed the GS of the middle and lower estuary.
The DTHg concentrations in pore waters of the three sediment cores ranged between 0.69–4.89 ng/L, and their profiles exhibited a little scatter and varied independently with depth. The total Hg concentrations in the three sediment cores of the DRE were in the range 110–369 ng/g, and the concentrations followed the following sequence: the middle estuary > the lower estuary > the upper estuary, which may be attributed to the grain size effect. Figure 4 shows the scatter plots of the total Hg concentrations against the grain size in all the sediment core samples, and both parameters negatively correlate well, suggesting that the finer the sediment, the higher the Hg concentration. This result agreed well with some studies of the marine sediment, such as the Baltic Sea [62], the Adriatic Sea [64], and the East China Sea [35]. Meanwhile, the total Hg concentrations weakly positively correlate with the TOC in all the sediment core samples.
With a few exceptions in the upper estuary, most of the Hg data in sediment cores exceeded the biological effects range low value (ERL, Hg 150 ng/g), but was lower than the effects range median value (ERM, Hg 710 ng/g) of the sediment quality guidelines (SQGs) of the U.S. EPA [44], indicating that the DRE was contaminated by elemental Hg. This result was consistent with our previous study, which indicated that total Hg concentrations in surface sediments within the DRE ranged between 80 and 379 ng/g, while the methyl Hg concentration in surface sediment was mostly less than 0.5 ng/g [17]. The profile of STHg concentrations differed in the different sediment cores. The profile of STHg concentrations in the upper estuary exhibited much variation with depth, while the profile in the middle estuary showed that the concentration gradually decreased with increasing depth. Such a profile was also seen at depths of 2–16 cm in the lower estuary. Afterward, the concentration slightly increased with depth.

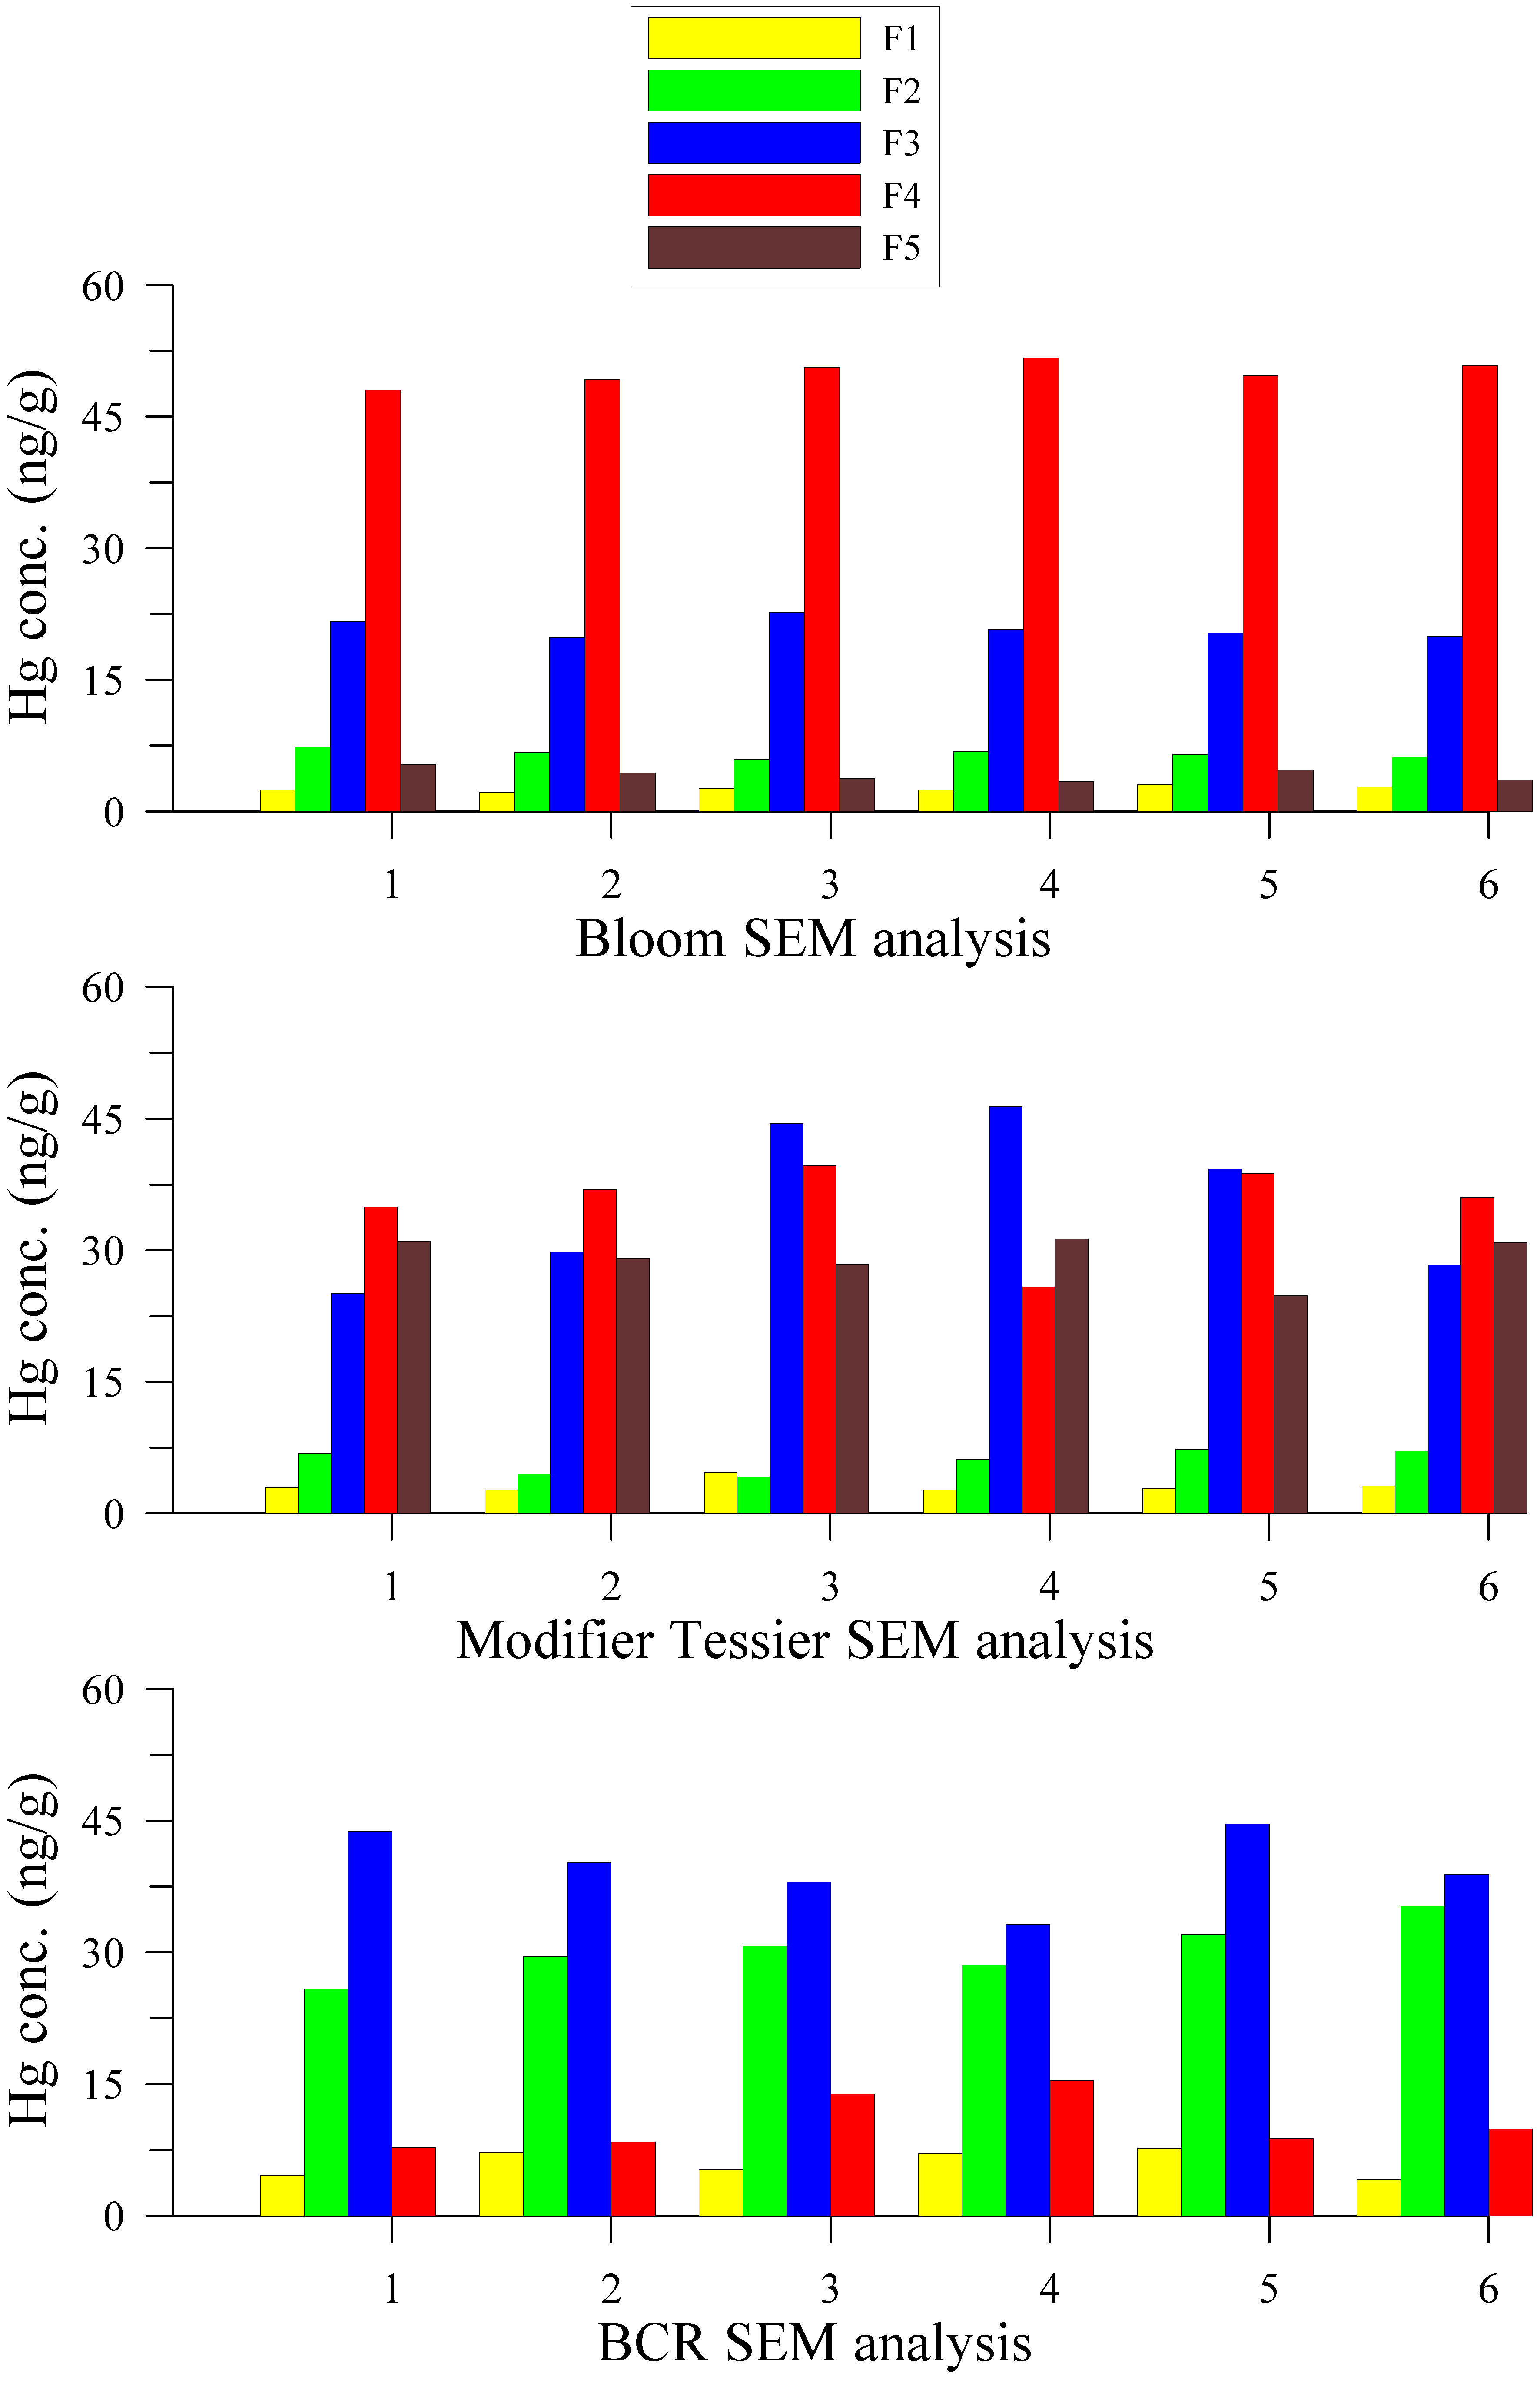
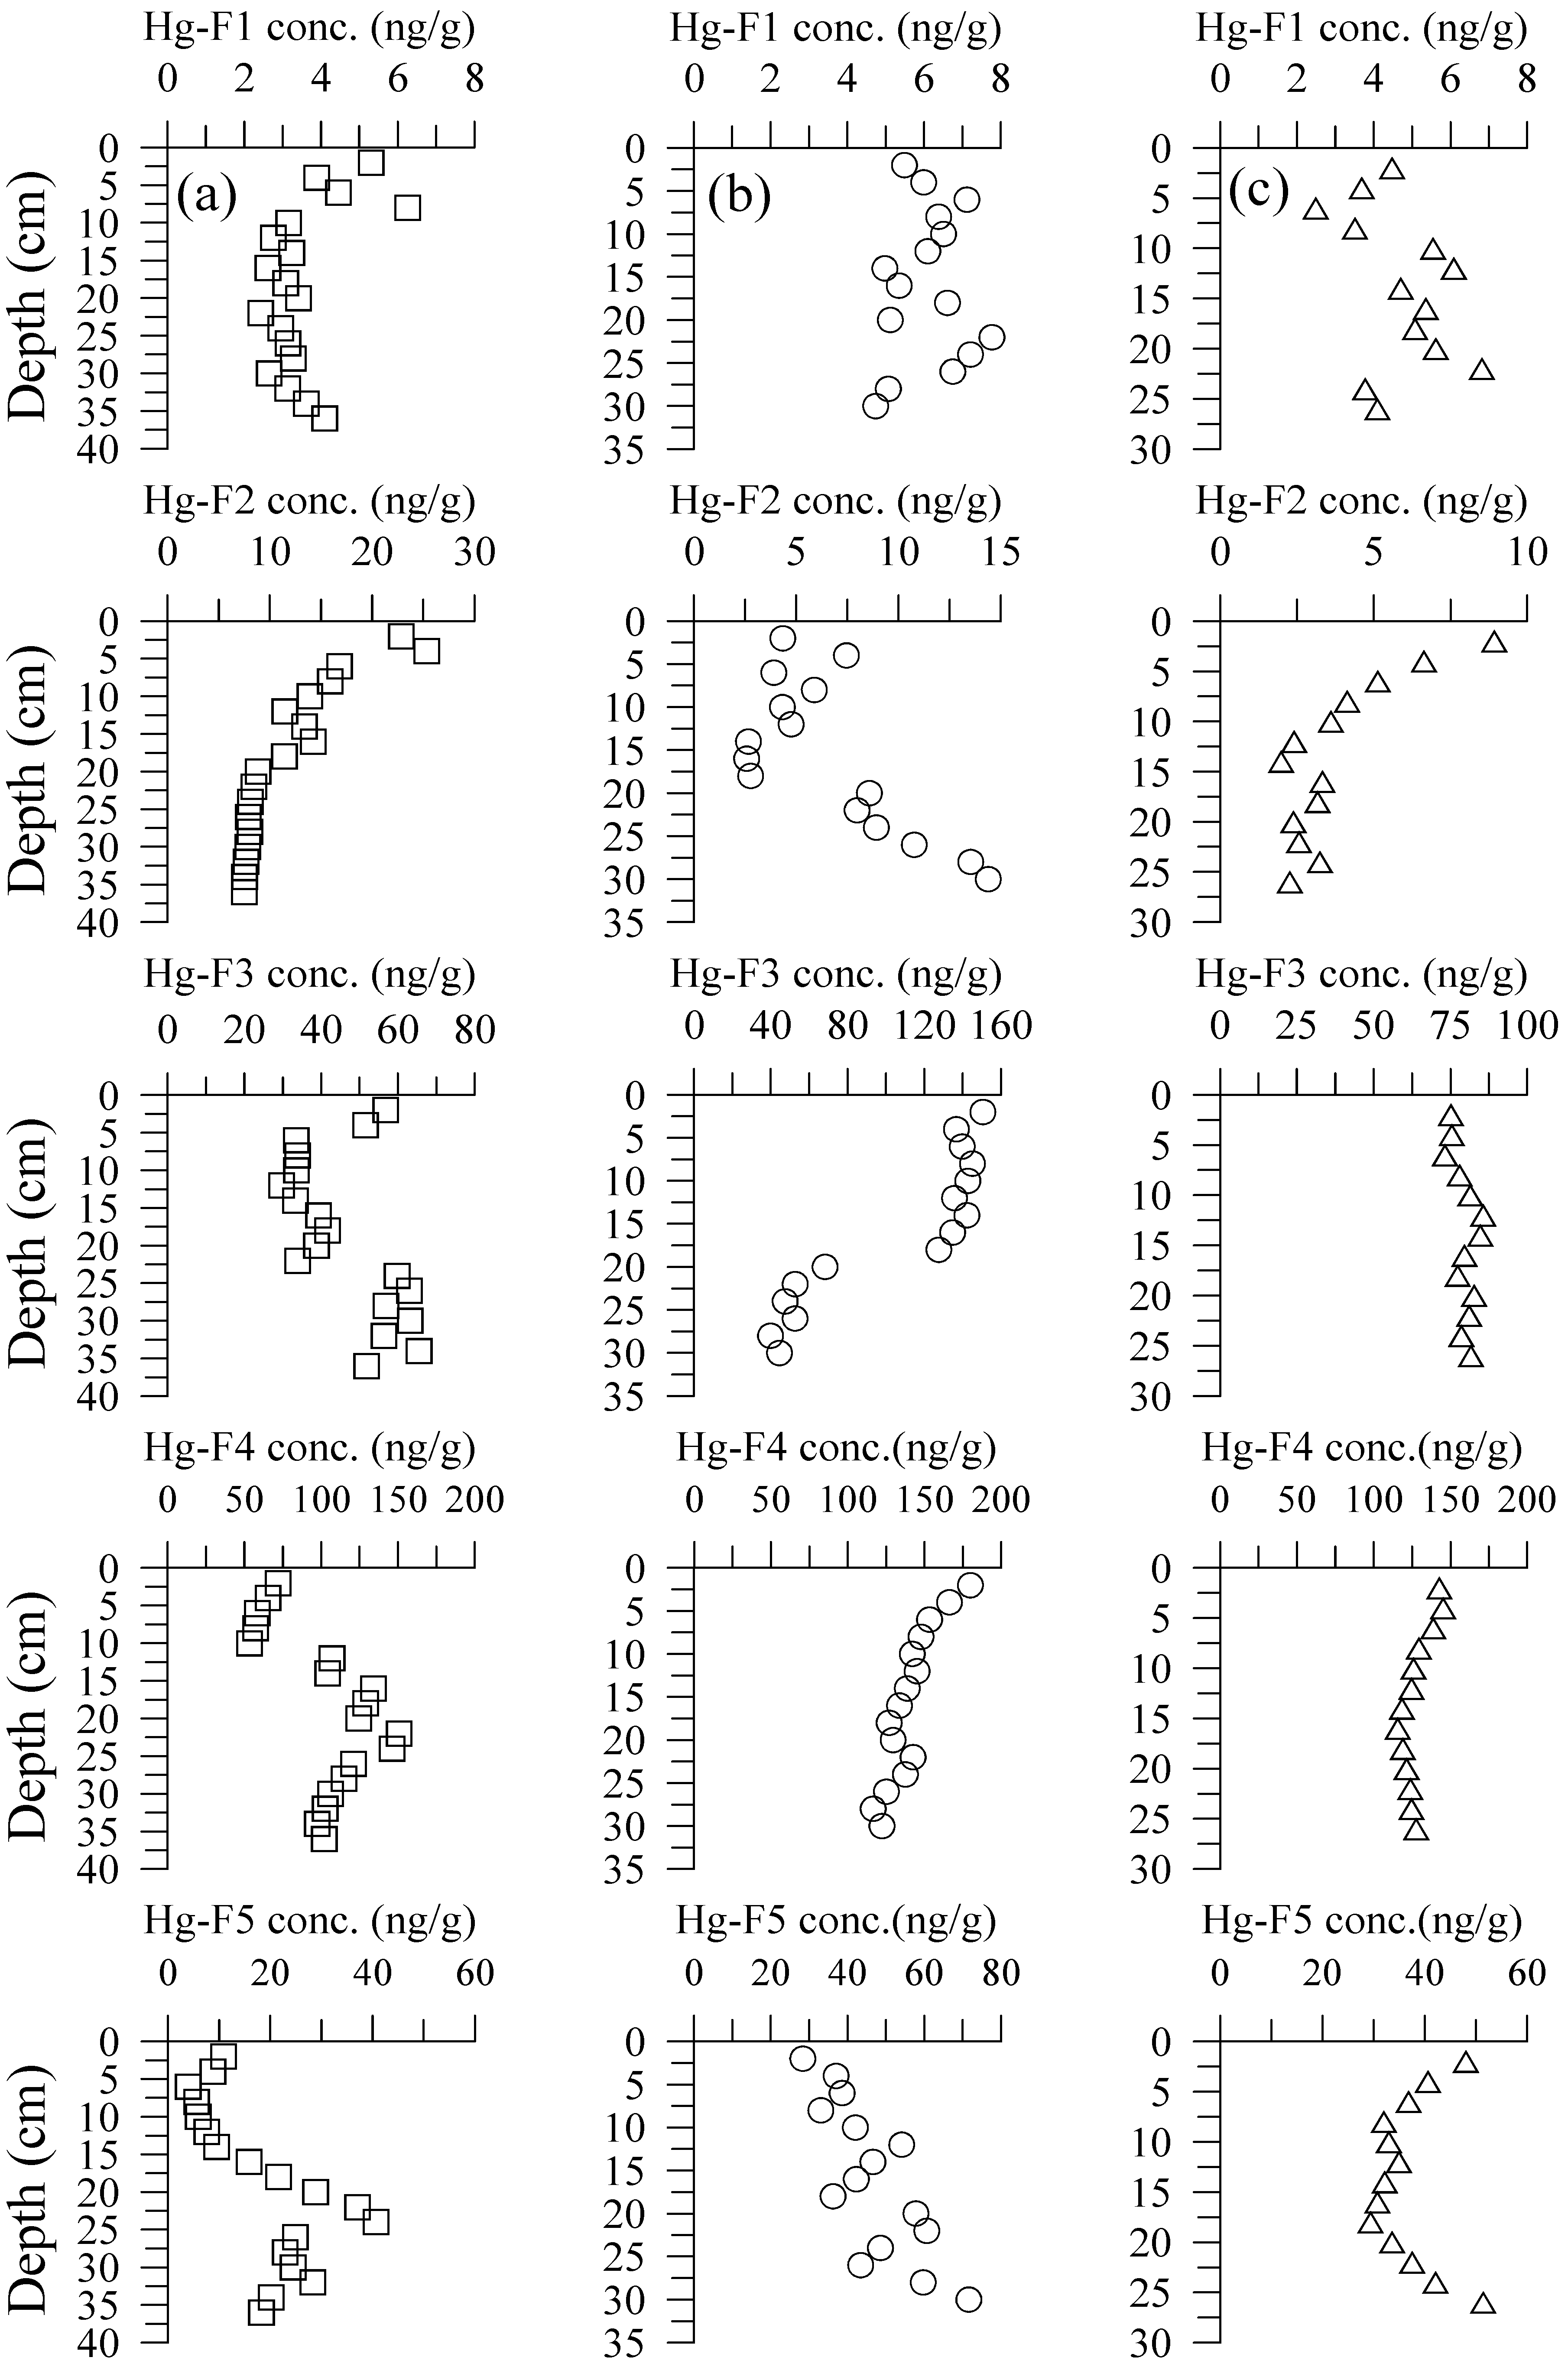
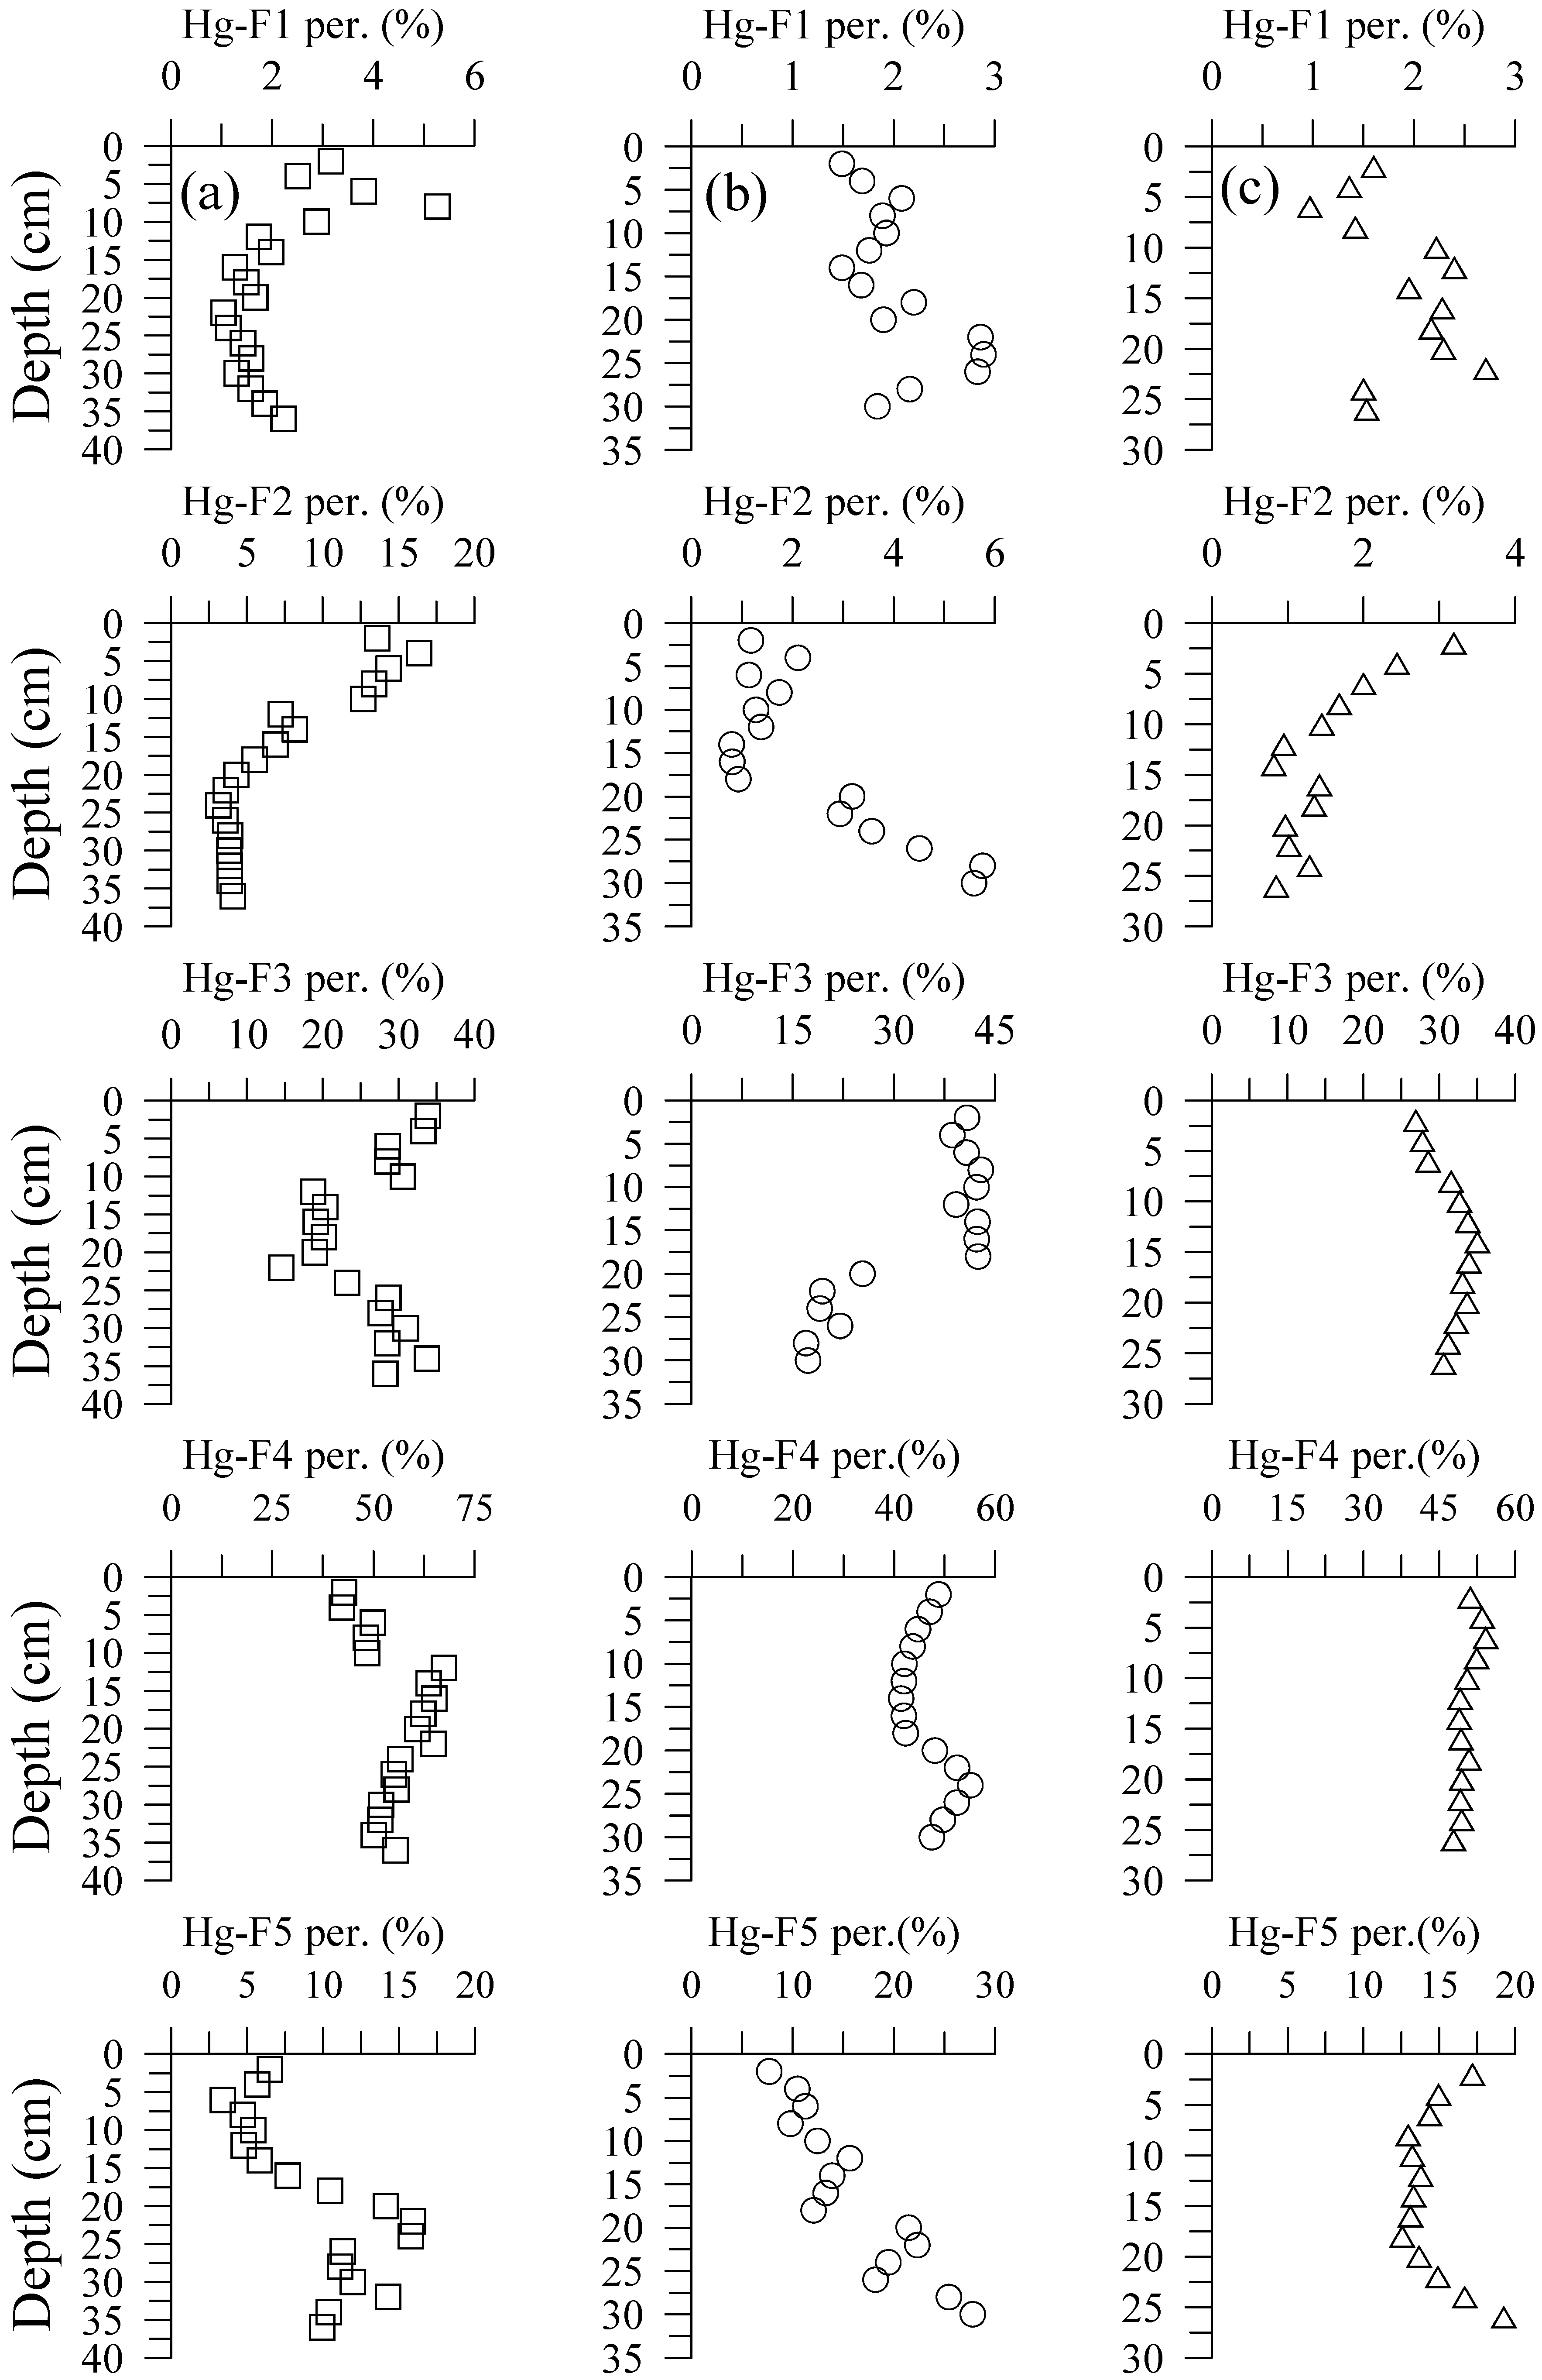
3.2. Hg Fractions in Sediment Cores

The five-fraction Hg concentrations and their percentages in the three sediment cores are tabulated in Table 4, and their concentration and percentage profiles are shown in Figure 5 and Figure 6, respectively. Figure 6 clearly shows that the total Hg concentrations in the three sediment cores of the DRE were mainly dominated by the elemental Hg (F4) fraction, accounting for 42–68% (average nearly 50%) of total Hg pools. The organo-chelated (F3) and residual (F5) fractions ranked as the second and the third important fractions, accounting for 16–42% (average nearly 29%) and 3–28% (average nearly 12%) of the total Hg pools, respectively. The contributions of water soluble (F1) and human stomach acid (F2) fractions to the total Hg pools were generally less than 2%, except that the F2 fraction accounted for 3–16% (average 7.4%) of the total Hg pools in sediment cores of the upper estuary.
Figure 5 shows that the profile of different fractions of Hg concentration in the different sediment cores exhibited inconsistency. The F2 fraction in sediment cores of the upper estuary showed a concentration decrease with increasing depth, while the other three fractions generally exhibited the maximum concentration occurring at depths of 15–25 cm. The F2 and F5 fractions in sediment cores of the middle estuary indicated concentration increase with increasing depth, while the F3 and F4 fractions exhibited concentration decreases with increasing depth. The F2 and F4 fractions in sediment cores of the lower estuary also exhibited concentration decreases with increasing depth. The concentration of the F3 fraction varied slightly with depth. The F5 fraction showed the minimum concentration appearing at depths of 12–25 cm. These results suggest that the transformations of different Hg fractions significantly occurred during the burial processes in the DRE sediments.

4. Discussion

4.1. DTHg in Sediment Pore Waters

The profiles of DTHg in sediment pore waters at the three stations of the DRE exhibited a little scatter and no specified trends. Meanwhile, the DTHg concentrations were well comparable with the recent studies which showed that DTHg concentration in sediment pore water of the inshore environment generally ranged within 1–10 ng/L [11,66,67,68,69,70,71]. However, much higher Hg concentrations in sediment pore water have been reported in the Marano Lagoon (8.4–675 ng/L), northern Adriatic Sea [15], and Tagus Estuary (6.8–365 ng/l), Portugal [47], where the sediment total Hg concentration ranged within 1420–4570 ng/g [15] and 310–125,000 ng/g [47], respectively. These values were one to two orders of magnitudes higher than in the present study.
Many studies indicate that some factors, such as the redox condition, sediment structure, Fe/Mn oxyhydroxides, organic matter, sulfide concentration, etc., can influence the DTHg concentration in sediment pore water in marine environment [9,11,12,13,15,68]. It is suggested that the release of dissolved methyl Hg (DMeHg) into pore waters from the dissolution of authigenic Fe and Mn oxhydroxides and degradation of organic matter could significantly elevate the DMeHg in sediment pore water [11,15,72]. The present study did not analyze the DMeHg concentration in sediment pore water. Thus, the reasons that the DTHg profiles in sediment pore waters of the DRE exhibited a little scatter were not clear in the present study. The DTHg concentration in sediment pore water and sediment reflects the overall reactions between the dissolved and the solid phase of Hg in sediment and may illustrate the migration and transformation of sediment Hg during the burial processes [11,15,73]. Thus, the solid–solution partitioning, KD, given as KD = S/C, where S (ng/g) and C (ng/L) are the sediment and dissolved total concentrations, respectively, is generally employed to address the dissolution and adsorption of Hg between the pore water and the solid phase [11,15,73,74]. The Hg partitioning coefficient, log(KD), in sediment cores of the DRE in the present study ranged within 4.68–5.59, with the average values of 5.0 (the upper estuary), 5.22 (the middle estuary), and 4.95 (the lower estuary). The Hg log(KD) values between water and particulate phase of the DRE ranged within 3.54–4.68, and the value exhibited a negatively linear trend with salinity [17]. The KD values in sediment cores were one order of magnitude higher than those of the water column of the DRE. This result paralleled well with the estuarine study of the Gironde Estuary in southwest France [68]. The results from sediment cores had higher KD values than those of the water column, which may illustrate that the partition dynamics of Hg between the water and solid phases in the water column were more complicated than those in the sediment core due to more hydrodynamics, such as the river flow and the tidal intrusion, and chemical constituents, such as the salinity and DOC, varying significantly in the water column within the estuary.
It is known well that many factors, such as the major anions, DOC, and the associated colloidal effect, may lead to increase the Hg dissolution from the solid phase [4,75,76,77,78]. These effects will lower the KD value between the dissolved and solid phases. The KD values in sediment cores of the DRE were similar to those reported in the inshore environments, such as the Hudson River Estuary, U.S.A. (4.88–5.70) [67], the Chesapeake Bay, U.S.A. (4.30–5.30) [79], the Marano and Grado Lagoon, Italy (3.57–5.60) [15], the Great Bay Estuary, U.S.A. (4.7–5.8) [70], and the Tagus Estuary, Portugal (4.9–5.7) [47]. These studies also indicated that seasonal variations with the relatively lower KD values, attributed to the organic matter decomposition during the diagenetic processes, were frequently found in sediment cores of these inshore environments [15,79]. In addition, the relatively lower KD values were also commonly reported in inshore sediments, such as Passamaquoddy Bay and the St. Croix River Estuary (3.12–3.76) [12], and Long Island Sound (3.24–4.76) [11]. These results reflect that the partition dynamics of Hg between sediment pore water and sediment were fully dynamic because many factors can influence the partition and the values may differ from the different marine environment. The KD values were commonly related with the organic matter in marine environment, as mentioned above. Meanwhile, the KD values did not correlate well with the TOC content (r < 0.1, p > 0.05) in sediment cores of the DRE in the present study. This result suggested that the partitioning of Hg between pore water and sediment in sediment cores may not be strongly influenced by sedimentary organic matter, as observed in some studies [11,47]. The profile variation of the KD value in the three sediment cores of the DRE were not significant, suggesting minor variation in the Hg partition in sediment cores within the DRE. The Hg fractions present in sediment cores may reveal the deeper view of Hg partition in sediment cores, which will be addressed in the next section

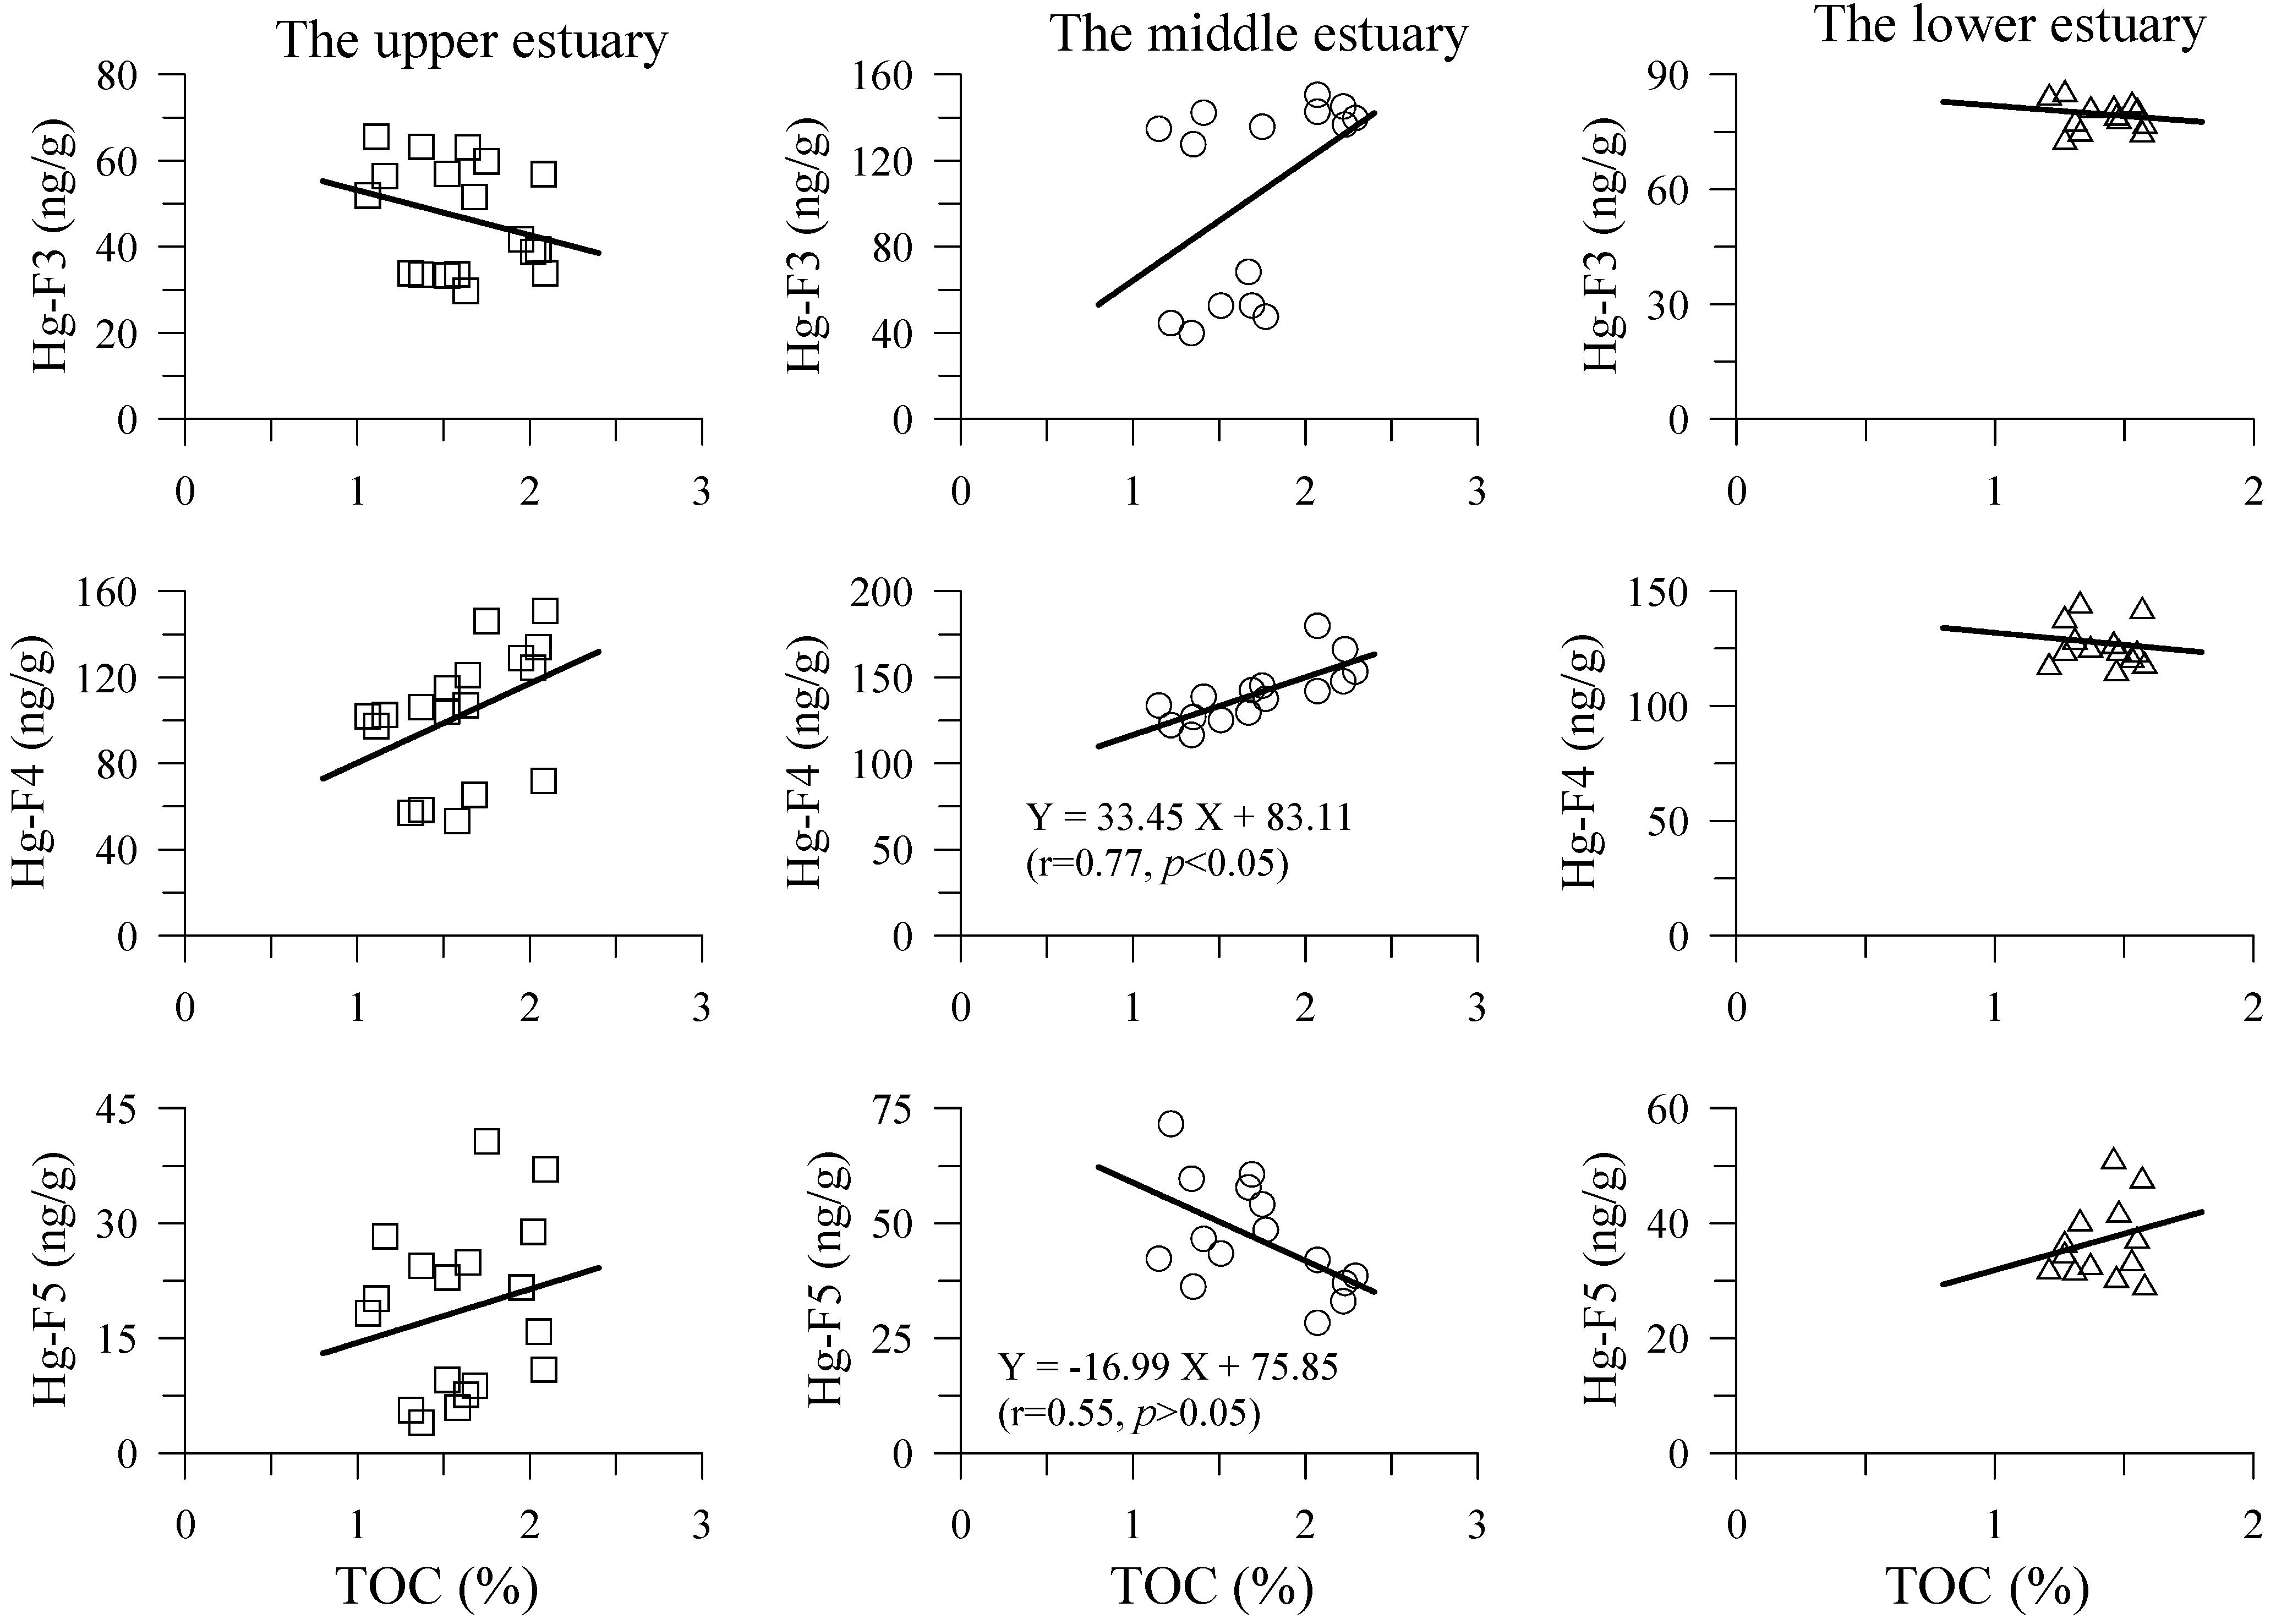
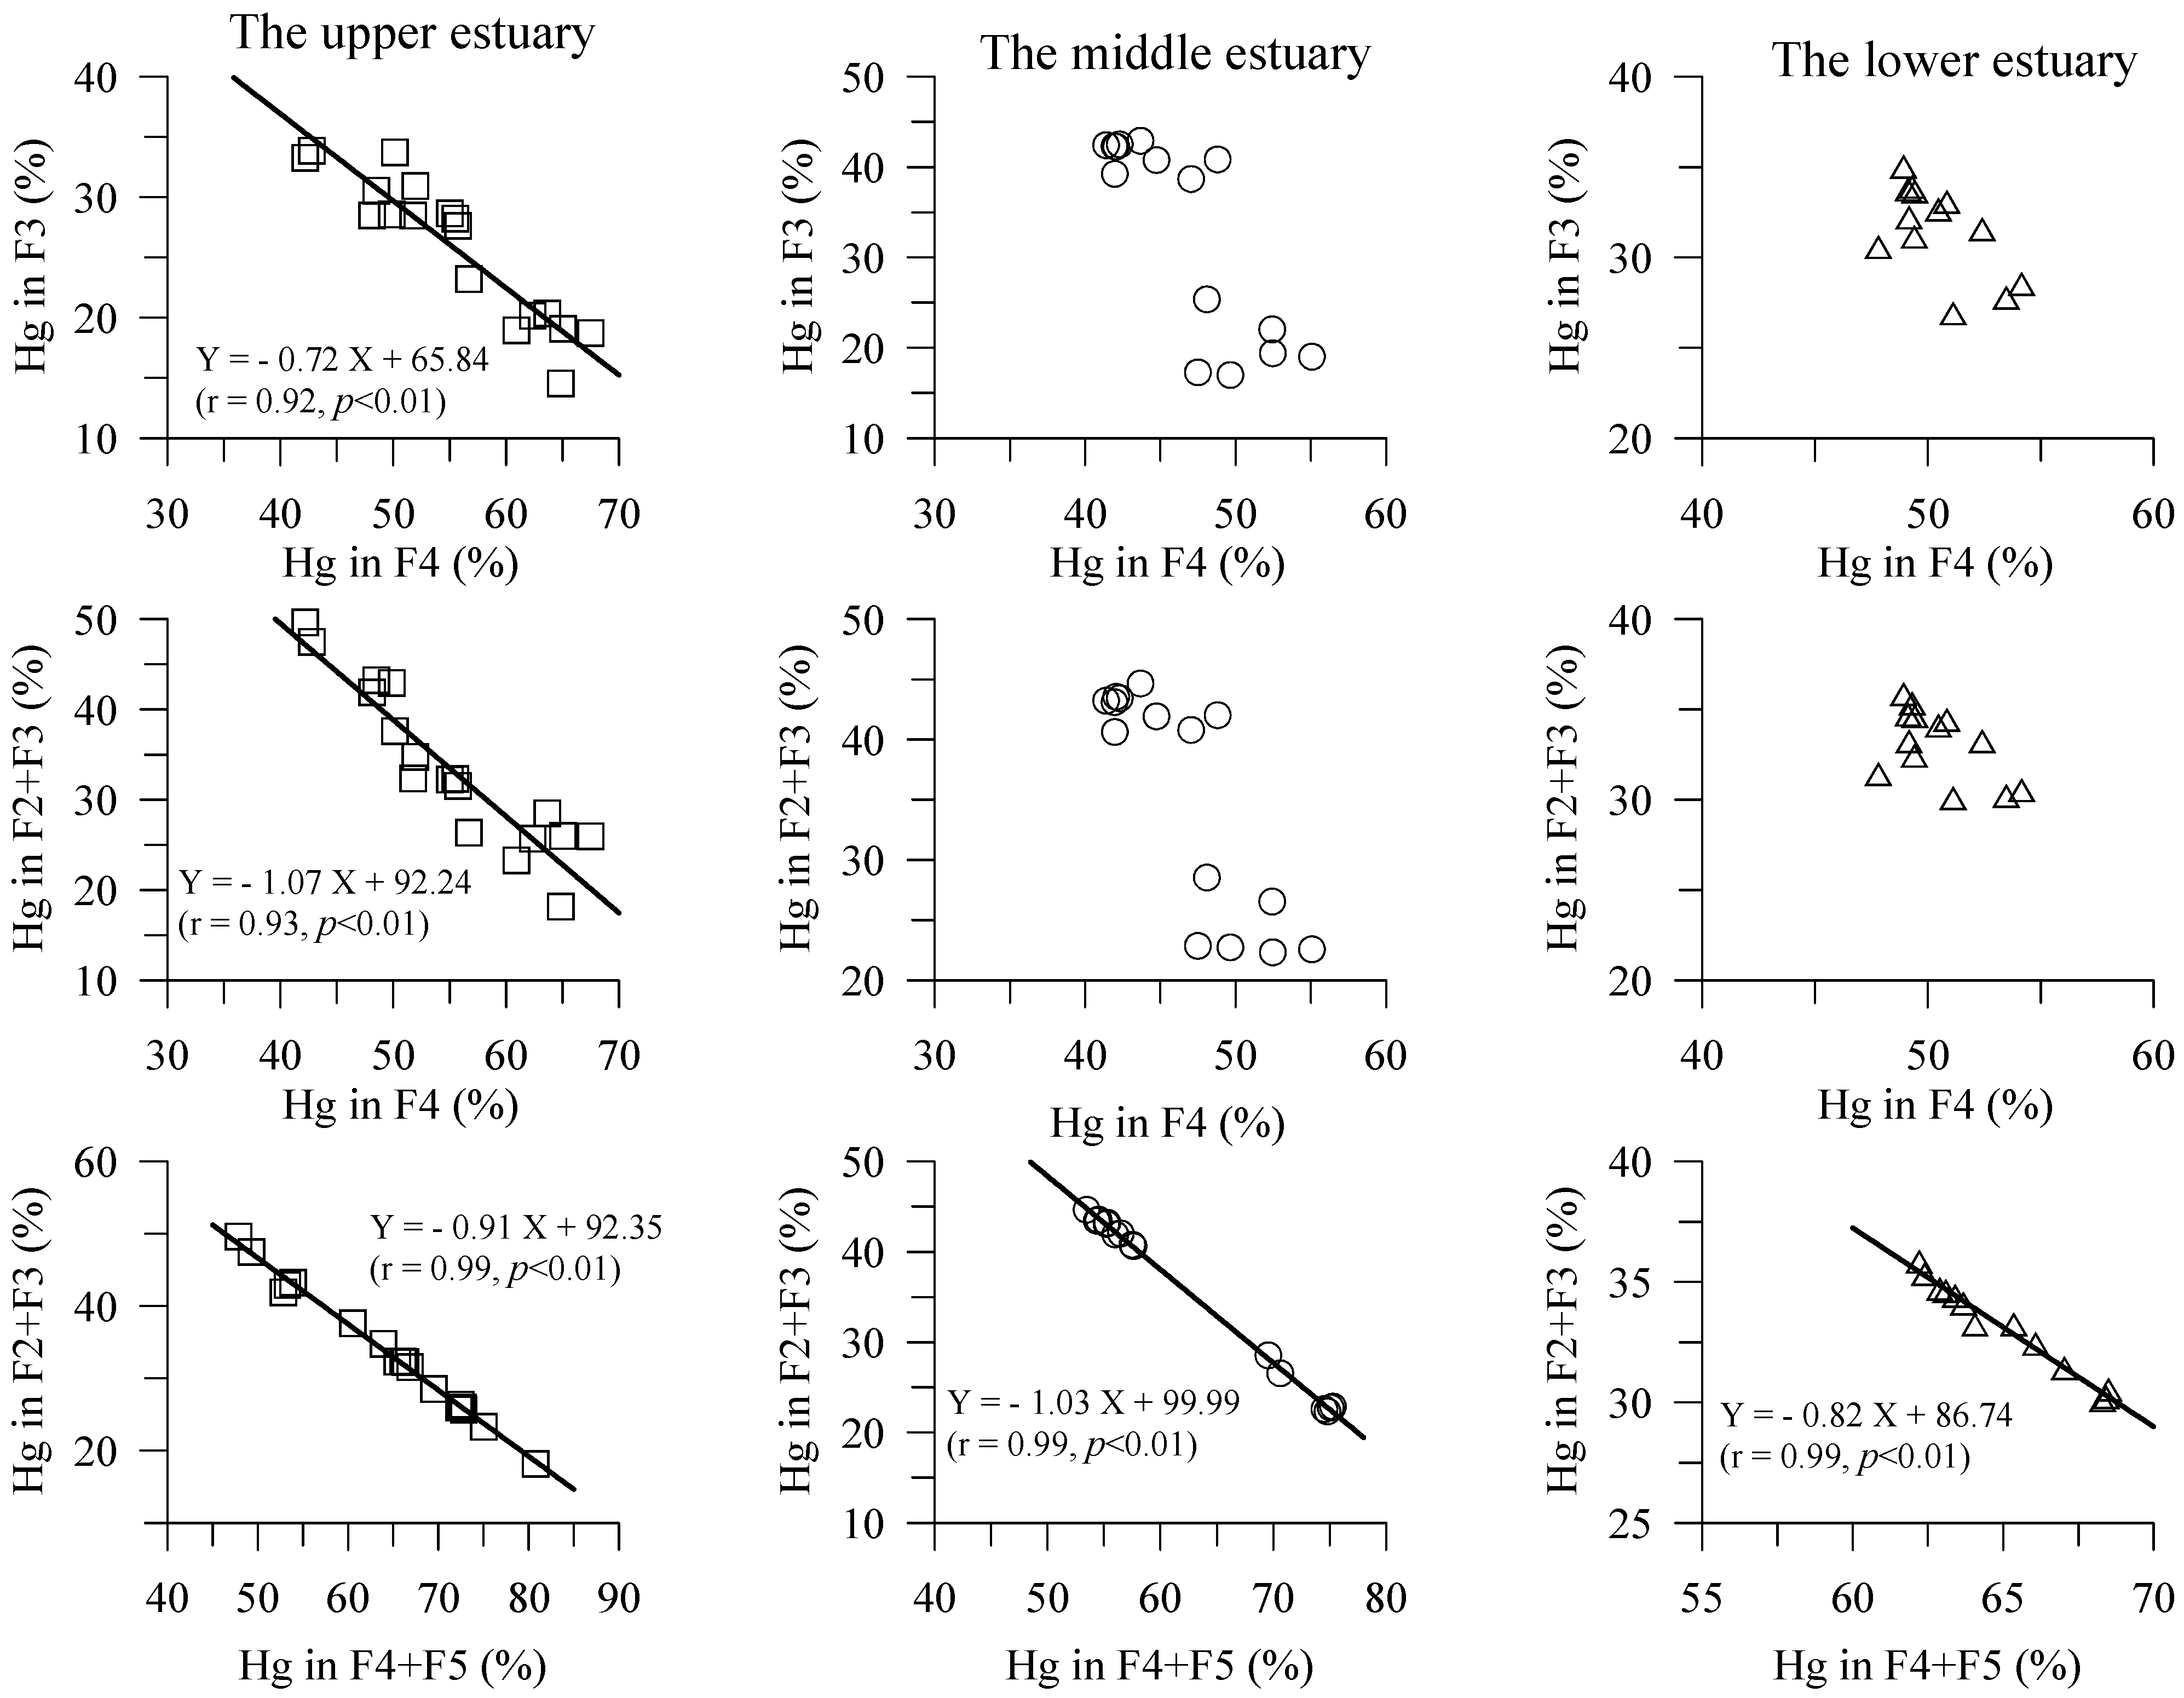
4.2. Hg Fractions in Sediment Cores

The Hg fractions in sediment cores of the DRE were mainly dominated by three fractions, F4 (42–68%), F3 (16–42%), and F5 (3–28%), on average accounting for a total of 91% of the total Hg pool. The sum of the F1 and F2 fractions generally accounted for <5% of the total Hg pool. These results were well consistent with many studies which also employed the Bloom method to fractionate the sedimentary Hg species in marine environments, such as Patong Bay, Thailand [80], the Marano lagoon, northern Adriatic [14], the Guanabra Bay, Brazil [21], the Mediterranean coast of Israel [22], and the Peral River Estuary, China [81]. These studies indicated that the sedimentary total Hg was generally dominated by F4 and F3 fractions, and that the labile fraction, the sum of the F1 and F2 fractions, was generally relatively minor (<5% of the total Hg pool). However, the sedimentary total Hg, mostly present in the F4 fraction, accounting for 92.9–98.7% of the total Hg pool, has been observed in the Guanabra Bay, Brazil [21]. The F4 and F5 fractions were strongly bounded in the mineral lattice and were considered as immobilized in the sediment [9]. The sediments containing the relatively higher proportions of F4 and F5 fractions were attributed to the chlor-alkali plant discharge and to the mine industry, respectively [9,14].
It is indicated that the labile fraction (F1 + F2) of sedimentary Hg in the marine environment was generally negligible, as shown above. However, this labile fraction represented the sedimentary Hg species which may pose a potential risk to organisms because it is easily available to organisms and might provide the main substrate for the Hg methylation process [9,14,21]. The labile fraction (F1 + F2) of sedimentary Hg was expected to be insignificant in estuarine and marine sediments because of the salinity effect [17,76]. It is well addressed that the inorganic Hg compounds, such as HgCl2, HgSO4, and HgO, had relatively high water solubility, and all of these compounds can be extracted by the F1 and F2 extractions [9]. The estuarine water and seawater contain the relatively high concentrations of major cations (Na+ & Mg2+) and anions (Cl & SO42−). This result induces that metals, especially Cd and Hg, are desorbed from the particles due to the increasing major cations (Na+ & Mg2+), and that metals interact with the major anions (Cl & SO42−) to form the soluble chloro- and sulfato-complexes [17,75,76]. In addition, the DOC interacts with Hg ion to form Hg-DOC complexes, of which stability constants are about 1020–1028 in aquatic environments [82]. Thus, the strong formation of Hg-DOC complexes also decreases Hg adsorption by particles in the water [83]. These effects will cause the labile Hg desorption from the particles in the water column. Our previous study found that the partition coefficient, log(KD), between estuarine water and particle within the DRE linearly decreased with increasing salinity [17], which also confirmed the associated salinity effect [76], though many factors, such as the texture of particles, re-suspension of particles, and the colloidal effect may also contribute such a result [72]. In addition, Figure 5 clearly indicated that the percentage of the F2 fraction in sediment cores of the upper estuary was obviously higher than those of the middle and lower estuary. The salinity in the water column at the three stations generally ranged within 0–3 psu, 10–20 psu, and 20–30 psu, respectively, depending upon the tidal intrusion [36,37]. The salinity effect of the upper estuary should be relatively minor due to the lower salinity. Thus, the labile fraction of sedimentary Hg in sediment cores of the upper estuary was obviously higher than those of the middle and lower estuary. Meanwhile, anthropogenic sources, such as the domestic waste water discharge, the industrial sources, and oil discharges, input to the upper estuary and contributing to the labile fraction of sedimentary Hg, cannot be ruled out. Figure 6 also showed that the F2 fraction in sediment cores, at depths of 2–10 cm, of the upper estuary exceeded 10% of the total Hg pool. However, this percentage decreased with increasing depth below 12 cm, suggesting the dissolution of this fraction during the diagenetic processes.
The organo-chelated fraction (F3) in the marine sediment was probably the most variable fraction among the Hg fractions because it differed significantly with the different marine environments [22,80]. Bloom et al. [9] showed that the Hg compounds with Hg-humic complexed and associated with living and dead biota can be completely digested by 1 M KOH, which is grouped into the organic-chelated Hg fraction (F3). The study of organic Hg in marine sediment mostly focused on methylation of Hg because methylmercury (MeHg) can be bio-accumulated and bio-magnified through the trophic level [2,3,4]. MeHg is generally found in the marine sediment [3,4]. It is suggested that the content of dissolved inorganic Hg and the activity of methylating bacteria, such as the iron reducing bacteria (FeRB), sulfate-reducing bacteria (SRB), and methanogens, including syntrophic acetogenic and fermentative firmicutes, play important roles in influencing MeHg production during the diagenetic processes [84,85,86]. In fact, the methylation of Hg in marine sediment is quite complicated because many factors, such as salinity, pH, the oxic/anoxic conditions, the quality and quantity of the dissolved and sediment organic matters, and temperature, all play crucial roles to influence the microbial community and determine the interactions of bacteria with Hg and the recycling of sedimentary Hg during the diagenetic processes, which has been fully documented in the literature [4,20,70,79,84]. In addition, the total Hg concentration positively correlating well with the TOC content was commonly seen in marine sediments due to Hg having a higher affinity with organic matter [17,21,35]. However, the MeHg content in marine sediment worldwide was relatively minor, generally <0.5% of the total sedimentary Hg pool [4,17,21,85]. The organo-chelated fraction (F3) reported in estuarine/marine sediment generally exceeded 20% of the sedimentary total Hg pool, as mentioned above. Thus, the role of TOC influencing the F3 variation in marine sediment should be more profound than the methylation of Hg. Surprisingly, many studies indicated that the F3 fraction content inversely correlated with TOC content in some marine sediments, such as the Pearl River Estuary, China [81], the northern Adriatic Sea [14], and the Israeli Mediterranean Coast [22]. This phenomenon was also found in sediment cores at stations of the upper and the lower estuary, but exhibited positive correlation in the middle estuary of the DRE.
Figure 7 showed the plots of TOC content against the Hg concentration in fractions 3–5 in sediment cores of the DRE, and the correlations differed from the different Hg fractions and different sediment cores. This result may suggest that the role of TOC influencing the Hg content in fractions 3–5 in sediment cores of the DRE was ambiguous. The Hg organo-chelated fraction was considered of moderate mobility but was correlated well with sediment methylation potential [9]. It can be seen in Table 1 that the F1 and F2 fractions of the solid Hg analyzed by the Bloom SEM are the water soluble (such as HgCl2) and the high-water-solubility species (such as HgO, HgSO4), respectively. Both fractions are of relatively high water solubility in marine sediment and are easily desorbed from the solid phase during the estuarine mixing due to the ion strength effect and the strong formation of Hg-DOC complexes [17,75,76], as mentioned above. The integrated result of these effects was confirmed in our previous study, which shows that the Hg partitioning coefficient, log(KD), in the DRE linearly decreased with increasing salinity [17], and the present study, which indicates that both Hg fractions (F1 + F2) in sediment cores of the middle and the lower estuary were relatively minor. The dissolution of this labile Hg fraction in marine sediment may diffuse upward to the water column or form the F3 fraction through the complexation with organic matter [86]. The F3 fraction negatively linearly correlating well with the F4 fraction has been observed in the Israeli Mediterranean Coastal sediment [22]. It is suggested that the decomposition of the F3 fraction was re-adsorbed mostly by the F4 fraction [22]. The transformation of the F3 fraction to the F4 fraction may be attributed to the strong interactions between Hg and organic matter, such as the sulfur-containing functional groups [9,14,22]. The decrease in the F1-F3 fractions should increase the F4 fraction and may extend to the F5 fraction during the diagenetic processes in the marine sediment. Table 1 shows that the F4 and F5 fractions of sedimentary Hg analyzed by the Bloom SEM are the Hg compounds associated with the crystalline Fe-Mn oxides and organosulfur, and bond to HgS as well as crystal lattice, respectively. The decomposition of organic matter in sediment proceeds by using a series of electron acceptors which follow the sequences O2 > NO3 > MnO2 > Fe(OH)3 > SO42− under oxic to anoxic environments [10]. The reduction of sulfate to sulfide related to the S content in anoxic sediments plays an important role in influencing the binding, speciation, and geochemical cycling in marine sediments [22,23,56,69]. The recent study investigates the reactions of Hg with different sulfur species (S2−, HS−1, and H2S) in anoxic sediments and indicates that Hg compounds sorbed on FeS and FeS2 groups which were mostly extracted by F3 and F4 chemical reagent, respectively, of the Bloom SEM. In contrast to FeS and FeS2, HgS was very refractory and mainly existed in the F5 fraction [87]. This result can partly explain why the contribution of F5 to the total Hg pool was much lower than those of the F3 and F4 fractions in the sediment cores of the DRE. Meanwhile, to fully understand the fraction transformation of sedimentary Hg, the reactions of sulfite chemistry with sedimentary Hg in the anoxic sediment of the DRE need further study.
Figure 8 shows that the F4 fraction negatively linearly correlated well with F3 fraction in sediment cores of the upper estuary. The corresponding result was also seen for the sum of the F2 + F3 fractions with the sum of the F4 + F5 fractions of the three sediment cores. The Hg fractions in sediment cores of the middle and the lower estuary also exhibited the same behavior but the correlations were weaker. These results may suggest that the labile Hg (F1 + F2) and the moderately labile fraction Hg (F3) were transformed into the non-labile Hg (F4 and F5) in the three sediment cores of the DRE. These results strongly confirm the transformation of the labile and moderately labile Hg fraction into the non-labile Hg fraction.

4.3. Hg Contamination Assessment

Figure 3 indicates that the total Hg concentrations in sediment cores of the DRE mostly exceeded the ERL value (150 ng/g), but were much lower than the ERM value (710 ng/g) of the sediment quality guidelines, U.S.A. [44]. This result suggests that the sediment cores of the DRE were mildly contaminated by Hg. Meanwhile, Figure 9 indicates that the risk assessment code (RAC) value of the sediment cores in the middle and lower estuary was completely <5%, representing low risk to marine organisms. The similar result was also found deeper (>12 cm) in sediment cores of the upper estuary. Meanwhile, the RAC value of the surface layer depth (2–10 cm) in sediment cores of the upper estuary ranged between 15.5 and 18.9%, representing medium risk to marine organisms. This result implies that Hg still has a potential risk to the benthic organisms in the DRE, which is pioneeringly observed in the DRE.

5. Conclusions

The present study compared the three sequential extraction methods, namely the Bloom method, the modified Tessier method, and the BCR method, to determine different Hg fractions in the MESS 4 reference material. Based on the analytical QA/QC of the MESS-4 analysis, the present study suggested that Bloom SEM was the best choice to determine the Hg fractions in sediment among these three SEMs. For fractionation of multiple elements of trace metals (including Hg) in sediment, the BCR SEM was better than the modified Tessier SEM.
The three sediment cores collected within the DRE were anoxic, and the potential value exhibited decrease with increasing depth. The total Hg concentrations in sediment cores of the DRE ranged within 110–369 ng/g, and most values exceeded the guideline value (ERL, 150 ng/g) of the EPA, U.S.A., suggesting that the DRE was mildly contaminated by Hg. The risk assessment code (RAC) value of the surface layer depth (2–10 cm) in sediment core of the upper estuary posed a medium risk to marine organisms, implying that Hg still poses a potential risk to the benthic organisms in the DRE. The sedimentary total Hg concentrations of the three sediment cores were mainly dominated by the non-labile fraction, the F4 and F5 fractions, on average accounting for 60% of the total Hg pool. The organo-chelated (F3) fraction ranked as the second most important fraction, accounting for 16–42% (average 29%) of the total Hg pool. The evidence of Hg labile fraction transforming into the non-labile fraction was significant in sediment cores of the DRE. Finally, a fractionation study of sedimentary Hg is necessary to fully understand the geochemical cycle of Hg in sediment, especially for the anoxic sediment like that of the DRE.

Author Contributions

Conceptualization, T.-H.F.; Methodology, X.L.W.; Investigation, X.L.W.; Resources, T.-H.F.; Data curation, X.L.W.; Writing—original draft, T.-H.F.; Supervision, T.-H.F. All authors have read and agreed to the published version of the manuscript.

Funding

This research was financially supported by the Ministry of Science and Technology, Taiwan under grants MOST 110-2611-M-019-014 and 111-2611-M-019-009.

Data Availability Statement

The original contributions presented in this study are included in the article. Further inquiries can be directed to the corresponding author.

Acknowledgments

The authors are grateful to the anonymous reviewers for their constructive comments and suggestions which led to significant improvements in this manuscript.

Conflicts of Interest

The authors declare no conflict of interest.

References

  1. Tomiyasu, T.; Matsuyama, A.; Eguchi, T.; Fuchigami, Y.; Oki, K.; Horvat, M.; Rajar, R.; Akagi, H. Spatial variations of mercury in sediment of Minamata Bay, Japan. Sci. Tot. Environ. 2006, 368, 283–290. [Google Scholar] [CrossRef] [PubMed]
  2. Neff, J.M. Bioaccumulation in Marine Organisms: Effect of Contaminants from Oil Well Produced Water; Elsevier Ltd.: Amsterdam, The Netherlands, 2002. [Google Scholar]
  3. Gworek, B.; Bemowska-Kalabun, O.; Kijenska, M.; Wrzosek-Jakubowska, J. Mercury in marine and oceanic waters—A review. Wat. Air. Soil Pollut. 2016, 227, 371. [Google Scholar] [CrossRef]
  4. Fitzgerald, W.F.; Lamborg, C.H.; Hammerschmidt, C.R. Marine Biogeochemical Cycling of Mercury. Chem. Rev. 2007, 107, 641–662. [Google Scholar] [CrossRef]
  5. Vieira, H.C.; Bordalo, M.D.; Figueroa, A.G.; Soares, A.M.V.M.; Morgado, F.; Abreu, S.N.; Osten, J.R. Mercury distribution and enrichment in coastal sediments from different geographical areas in the North Atlantic Ocean. Mar. Pollut. Bull. 2021, 165, 112153. [Google Scholar] [CrossRef] [PubMed]
  6. Gbondo-Tugbawa, S.S.; McAlear, J.A.; Driscoll, C.T.; Sharpe, C.W. Total and methyl mercury transformations and mass loadings within a wastewater treatment plant and the impact of the effluent discharge to an alkaline hypereutrophic lake. Wat. Res. 2010, 44, 2863–2875. [Google Scholar] [CrossRef] [PubMed]
  7. Streets, D.G.; Devane, M.K.; Lu, Z.; Bond, T.C.; Sunderland, E.M.; Jacob, D.J. All-time release of mercury to the atmosphere from human activities. Environ. Sci. Technol. 2011, 45, 10485–10491. [Google Scholar] [CrossRef] [PubMed]
  8. Outridge, P.M.; Mason, R.P.; Wang, F.; Guerrero, S.; Heimburger-Boavida, L.E. Updated global and oceanic mercury budgets for the United Nations global mercury assessment. Environ. Sci. Technol. 2018, 52, 11466–11477. [Google Scholar]
  9. Bloom, N.S.; Preus, E.; Katon, J.; Hiltner, M. Selective extractions to assess the biogeochemically relevant fractionation of inorganic mercury in sediments and soils. Anal. Chim. Acta 2003, 479, 233–248. [Google Scholar] [CrossRef]
  10. Stumm, W.; Morgan, J.J. Aquatic Chemistry, 3rd ed.; A Wiley-Interscience Publication: Hoboken, NJ, USA, 1996. [Google Scholar]
  11. Hammerschmidt, C.R.; Fitzgerald, W.F.; Lamborg, C.H.; Balcom, P.H.; Visscher, P.T. Biogeochemistry of methylmercury in sediments of Long Island Sound. Mar. Chem. 2004, 90, 31–52. [Google Scholar] [CrossRef]
  12. Sunderland, E.M.; Gobas, F.A.P.C.; Heyes, A.; Branfireun, B.A.; Bayer, A.K. Environmental controls on the speciation and distribution of mercury in coastal sediments. Mar. Chem. 2006, 102, 111–123. [Google Scholar] [CrossRef]
  13. Covelli, S.; Faganeli, J.; De Vittor, C.; Predonzani, S.; Acquavita, A.; Horvat, M. Benthic fluxes of mercury species in a lagoon environment (Grado Lagoon, Northern Adriatic Sea, Italy). Appl. Geochem. 2008, 23, 529–546. [Google Scholar] [CrossRef]
  14. Covelli, S.; Acquavita, A.; Piani, R.; Predonzani, S.; De Vittor, C. Recent contamination of mercury in an estuarine environment (Marano lagoon, Northern Adriatic, Italy). Est. Coast. Shelf Sci. 2009, 82, 273–284. [Google Scholar] [CrossRef]
  15. Emile, A.; Acquavita, A.; Koron, N.; Covelli, S.; Faganeli, J.; Horvat, M.; Zizek, S.; Fajon, V. Benthic flux measurements of Hg species in a northern Adriatic lagoon environment (Marano and Grado Lagoon, Italy). Est. Coast. Shelf Sci. 2012, 113, 71–84. [Google Scholar] [CrossRef]
  16. Gosnell, K.; Balcom, P.; Ortiz, V.; DiMento, B.; Schartup, A.; Greene, R.; Mason, R. Seasonal cycling and transport of mercury and methylmercury in the turbidity maximum of the Delaware estuary. Aquat. Geochem. 2016, 22, 313–336. [Google Scholar] [CrossRef]
  17. Fang, T.H.; Lien, C.Y. Different mercury species partitioning and distribution in the water and sediment of a eutrophic estuary in Northern Taiwan. Water 2021, 13, 2471. [Google Scholar] [CrossRef]
  18. Merrit, K.A.; Amirbahman, A. Mercury methylation dynamics in estuarine and coastal marine environment—A critical review. Ear. Sci. Rev. 2009, 96, 54–66. [Google Scholar] [CrossRef]
  19. Allard, B.; Arsenie, I. Abiotic reduction of mercury by humic substances in aquatic system—An important process for the mercury cycle. Water Air Soil Pollut. 1991, 56, 457–464. [Google Scholar] [CrossRef]
  20. Jonsson, S.; Skyllberg, U.; Nilsson, M.; Lundberg, E.; Andersson, A.; Bjorn, E. Differentaited availability of geochemical mercury pools controls methylmercury levels in estuarine sediment and biota. Nature Commun. 2014, 5, 4624. [Google Scholar] [CrossRef]
  21. Covelli, S.; Protopsalti, I.; Acquavita, A.; Sperle, M.; Bonardi, M.; Emili, A. Spatial variation, speciation and sedimentary records of mercury in the Guanabara Bay (Rio de Janeiro, Brazil). Cont. Shelf Res. 2012, 35, 29–42. [Google Scholar] [CrossRef]
  22. Shoham-Frider, E.; Azran, S.; Kree, N. Mercury speciation and total carbon in marine sediments along the Mediterranean Coast of Israel. Arch. Environ. Technol. 2012, 63, 495–502. [Google Scholar] [CrossRef] [PubMed]
  23. Duan, L.Q.; Song, J.M.; Yu, Y.; Yuan, H.M.; Li, X.G.; Li, N. Spatial variation, fractionation and sedimentary records of mercury in the East China Sea. Mar. Pollut. Bull. 2015, 101, 434–441. [Google Scholar] [CrossRef] [PubMed]
  24. Issaro, N.; Abi-Ghanem, C.; Bermond, A. Fractionation studies of mercury in soils and sediments: A review of the chemical reagents used for mercury extraction. Anal. Chim. Acta. 2009, 631, 1–12. [Google Scholar] [CrossRef]
  25. Reis, A.T.; Davidson, C.M.; Vale, C.; Pereira, E. Overview and challenges of mercury fractionation and speciation in soils. Trends Anal. Chem. 2016, 82, 109–117. [Google Scholar] [CrossRef]
  26. Tessier, A.; Campbell, P.G.C.; Bisson, M. Sequential extraction procedure for the speciation of particulate trace metals. Anal. Chem. 1979, 51, 844–851. [Google Scholar] [CrossRef]
  27. Bacon, J.R.; Davidson, C.M. Is there a future for sequential chemical extraction? Analyst 2008, 133, 25–46. [Google Scholar] [CrossRef] [PubMed]
  28. BCR, European Commission. The Certification of the Extractable Contents (Mass Fractions) of Cd, Cr, Cu, Ni, Pb and Zn in Freshwater Sediment Following a Sequential Extraction Procedure—BCR 701; Community Res.; European Commission: Brussels, Belgium, 2001; Volumes 1–88, Available online: https://op.europa.eu/en/publication-detail/-/publication/02c41803-8f6d-41f2-a73d-c47225ff8c6e (accessed on 11 August 2020).
  29. Hung, J.J.; Lu, C.C.; Huh, C.A.; Liu, J.T. Geochemical controls on distributions and speciation of As and Hg in sediments along the Gaoping (Kaoping) Estuary-Canyon system off southwestern Taiwan. J. Mar. Syst. 2009, 76, 479–495. [Google Scholar] [CrossRef]
  30. Kumkrong, P.; Mercier, P.H.J.; Gedara, I.P.; Mihai, O.; Tyo, D.D.; Cindy, J.; Kingston, D.M.; Mester, Z. Determination of 27 metals in HISS-1, MESS-4 and PACS-3 marine sediment certified reference materials by the BCR sequential extraction. Talanta 2021, 221, 121543. [Google Scholar] [CrossRef] [PubMed]
  31. Orecchio, S.; Polizzotto, G. Fractionation of mercury in sediments during draining of Augusta (Italy) coastal area by modifier Tessier method. Microchem. 2013, 110, 452–457. [Google Scholar] [CrossRef]
  32. Chakraborty, P.; Babu, P.V.R.; Vudamala, K.; Ramteke, D.; Chennuri, K. Mercury speciation in coastal sediments from the central east coast of Indis by modified BCR method. Mar. Pollut. Bull. 2014, 81, 282–288. [Google Scholar] [CrossRef] [PubMed]
  33. Chai, M.; Li, R.; Qiu, Z.; Niu, Z.; Shen, X. Mercury distribution and transfer in sediment-mangrove system in urban mangrove of fast-developing coastal region, Southern China. Est. Coast. Shelf Sci. 2020, 240, 106770. [Google Scholar] [CrossRef]
  34. Fang, T.H. Partitioning and behavior of different forms of phosphorus in the Tanshui estuary and one of its tributaries, Northern Taiwan. Est. Coast. Shelf Sci. 2000, 50, 689–701. [Google Scholar] [CrossRef]
  35. Fang, T.H.; Chen, R.Y. Mercury contamination and accumulation in sediments of the East China Sea. J. Environ. Sci. 2010, 22, 1164–1170. [Google Scholar] [CrossRef] [PubMed]
  36. Fang, T.H.; Wang, C.W. Dissolved and particulate phosphorus species partitioning and distribution in the Danshuei River Estuary, Northern Taiwan. Mar. Pollut. Bull. 2020, 151, 110839. [Google Scholar] [CrossRef] [PubMed]
  37. Fang, T.H.; Chen, W.H. Dissolved and particulate nitrogen species partitioning and distribution in the Danshuei River Estuary, Northern Taiwan. Mar. Pollut. Bull. 2021, 164, 111981. [Google Scholar] [CrossRef] [PubMed]
  38. Fang, T.H.; Wang, C.W. Distribution of geochemical species of P, Fe and Mn in surface sediments in the eutrophic estuary, northern Taiwan. Water 2021, 13, 3075. [Google Scholar] [CrossRef]
  39. Chang, T.C.; Lin, W.Y.; Fang, T.H. Spatial variability of nitrogen cycling in the sediments of the Danshuie River Estuary (Northern Taiwan). Mar. Pollut. Bull. 2023, 197, 115776. [Google Scholar] [CrossRef] [PubMed]
  40. Tseng, C.M.; Chen, Y.S.; Ang, S.J.; Li, K.C.; Peng, H.C.; Gong, G.C. Probing the outfall-related anomalous Hg levels in the Danshuei Estuarine Coastal, Taiwan. Mar. Pollut. Bull. 2022, 181, 1138940. [Google Scholar] [CrossRef] [PubMed]
  41. Fang, T.H.; Chang, F.W. Temporal variation of mercury and methyl mercury in water and accumulation by phytoplankton in the eutrophic estuary, northern Taiwan. Mar. Pollut. Bull. 2024, 205, 116624. [Google Scholar] [CrossRef] [PubMed]
  42. Balcom, P.H.; Schartup, A.T.; Mason, R.P.; Chen, C.Y. Sources of water column methylmercury across multiple estuaries in the Northeast U.S. Mar. Chem. 2015, 177, 721–730. [Google Scholar] [CrossRef] [PubMed]
  43. Sharif, A.; Monperrus, M.; Tessier, E.; Bouchet, S.; Pinaly, H.; Rodriguez-Gonzalez, P.; Maron, P.; Amouroux, D. Fate of mercury species in the coastal plume of the Adour River estuary (Bay of Biscay, SW France). Sci. Tot. Environ. 2014, 496, 701–713. [Google Scholar] [CrossRef]
  44. Long, E.R.; Macdonald, D.D.; Smith, S.; Calder, F.D. Incidence of adverse biological effects within ranges of chemical concentrations in marine and estuarine sediments. Environ. Manag. 1995, 19, 81–97. [Google Scholar] [CrossRef]
  45. Liu, J.; Feng, X.; Zhang, X.; Yin, R. Spatial distribution and speciation of mercury and methyl mercury in the surface waters of East River (Dongjiang) tributry of Pearl River Delta, South China. Environ. Sci. Pollut. Res. 2012, 19, 105–112. [Google Scholar] [CrossRef]
  46. Wang, J.; Liu, Q.; Chen, J.; Chen, H.; Lin, H.; Sun, X. Total mercury flux and offshore transport via submarine groundwater discfharge and coal-fired power plant in the Jiulong River estuary, China. Mar. Pollut. Bull. 2018, 127, 794–803. [Google Scholar] [CrossRef]
  47. Cesario, R.; Hintelmann, H.; O’Driscoll, N.J.; Monteiro, C.E.; Caetano, M.; Nogueira, M.; Mota, A.M.; Canario, J. Biogeochemical cycle of mercury and methylmetcury on two highly contaminated areas of Tagus Estuary (Portugal). Wat. Air Soil Pollut. 2017, 228, 257. [Google Scholar] [CrossRef]
  48. Liu, M.; Du, P.; Yu, C.; He, Y.; Zhang, H.; Sun, X.; Lin, H.; Luo, Y.; Xie, H.; Guo, J.; et al. Increases of total mercury and methylmercury releases from municipal sewage into environment in China and implications. Environ. Sci. Technol. 2018, 52, 124–134. [Google Scholar] [CrossRef] [PubMed]
  49. Liu, W.C.; Chen, W.B.; Kuo, J.T.; Wu, C. Numerical determination of residence time and age in a partially mixed estuary using three-dimensional hydrodynamic model. Cont. Shelf Res. 2008, 28, 1068–1088. [Google Scholar] [CrossRef]
  50. Water Resources Bureau. Hydrological Year Book of Taiwan, Ministry of Economic Affairs, Republic of China. 2020. Available online: https://gweb.wra.gov.tw/wrhygis (accessed on 1 June 2023).
  51. Kao, S.; Milliman, J.D. Water and sediment discharge from small mountainous rivers, Taiwan: The roles of lithology, episodic events, and human activities. J. Geol. 2008, 116, 431–448. [Google Scholar] [CrossRef]
  52. Sewerage System Office of the Public Works Department of Taipei City Government. 2023. Available online: https://www.sso.gov.taipei (accessed on 1 June 2023).
  53. Environmental Protection Agency. Method 7474. Mercury in Sediment and Tissue Samples by Atomic Fluorescence Spectrometry. 2007. Available online: https://www.epa.gov/hw-sw846/sw-846-test-method-7474-mercury-sediment-and-tissue-samples-atomic-fluorescence (accessed on 10 January 2025).
  54. Environmental Protection Agency. Method 1631. Revision E: Mercury in Water by Oxidation, Purge and Trap, and Cold Vapor Atomic Fluorescence Spectrometry. 2002. Available online: https://ddei3-0-ctp.trendmicro.com:443/wis/clicktime/v1/query?url=https%3a%2f%2fwww.epa.gov%2fsites%2fdefault%2ffiles%2f2015%2d08%2fdocuments%2fmethod%5f1631e%5f2002.pdf&umid=646E13A4-2C19-9306-AA56-A84667BFC3BC&auth=c26fd05b9d068d74167cd5770ee96b266b7e88ac-17a15ef09736f94e661b89873c1d4dfa1ae43296 (accessed on 10 January 2025).
  55. Kim, C.S.; Bloom, N.S.; Rytuba, J.J.; Brown, G.E. Mercury speciation by X-ray absorption fine structure spectroscopy and sequential chemical extractions: A comparison of speciation methods. Environ. Sci. Technol. 2003, 37, 5102–5108. [Google Scholar] [CrossRef] [PubMed]
  56. Fernández-Martínez, R.; Rucandio, I. Assessment of a sequential extraction method to evaluate mercury mobility and geochemistry in solid environmental samples. Ecotoxicol. Environ. Saf. 2013, 97, 196–203. [Google Scholar] [CrossRef] [PubMed]
  57. Gleyzes, C.; Tellier, S.; Astruc, M. Fractionation studies of trace elements in contaminated soils and sediments: A review of sequential extraction procedures. Trends. Anal. Chem. 2002, 21, 451–467. [Google Scholar] [CrossRef]
  58. Folk, R. Petrology of Sedimentary Rocks; Hamphill’s: Austin, TX, USA, 1974. [Google Scholar]
  59. Long, E.R.; Macdonald, D.D.; Severn, C.G.; Hong, C.B. Classifying probabilities of acute toxicity in marine sediments with emprically derived sediment quality guildlines. Environ. Toxic. Chem. 2000, 19, 2598–2601. [Google Scholar] [CrossRef]
  60. Perin, G.; Craboledda, L.; Lucchese, M.; Cirillo, R.; Dotta, L.; Zanette, M.L.; Orio, A.A. Heavy metal speciation in the sediments Northern Adriatic sea: A new approach for environmental toxicity determination. In Heavy Metals in the Environment; Lekkas, T.D., Ed.; CEP Consultants: Edinburgh, UK, 1985; Volume 2, pp. 454–456. [Google Scholar]
  61. Gao, X.; Zhuang, W.; Chen, C.T.A.; Zhang, Y. Sediment quality of the SW coastal Laizhou Bay, Bohai Sea, China: A comprehensive assessment based on the analysis of heavy metals. PLoS ONE 2015, 10, e0122190. [Google Scholar] [CrossRef] [PubMed]
  62. Pempkowiak, J.; Cossa, D.; Sikora, A.; Sanjuan, J. Mercury in water and sediments of the southern Baltic Sea. Sci. Tot. Environ. 1998, 213, 185–192. [Google Scholar] [CrossRef]
  63. Alonso, D.; Pineda, P.; Olivero, J.; Gonzalez, H.; Campos, N. Mercury levels in muscle of two fish species and sediments from the Cartagena bay and the Cienaga Grande de Santa Marta, Colombia. Environ. Pollut. 2000, 109, 157–163. [Google Scholar] [CrossRef] [PubMed]
  64. Covelli, S.; Faganeli, J.; Horvat, M.; Brambati, A. Mercury contamination of coastal sediments as the result of long-term cinnabar mining activity (Gulf of Trieste, northern Adriatic sea). Appl. Geochem. 2001, 16, 541–558. [Google Scholar] [CrossRef]
  65. Shi, J.; Liang, L.; Yuan, C.; He, B. Methylmercury and total mercury in sediments collected from the East China Sea. Bull. Environ. Contam. Toxicol. 2005, 74, 980–987. [Google Scholar] [CrossRef] [PubMed]
  66. Choe, K.Y.; Gill, G.A.; Lehman, R.D.; Han, S.; Heim, W.A.; Coale, K.H. Sediment-water exchange of total mercury and monomethyl mercury in the San Francisco Bay-Delta. Limnol. Oceanogr. 2004, 49, 1512–1527. [Google Scholar] [CrossRef]
  67. Heyes, A.; Miller, C.; Mason, R. Mercury and methylmercury in Hudson River sediment: Impact of tidal resuspension on partitioning and methylation. Mar. Chem. 2004, 90, 75–89. [Google Scholar] [CrossRef]
  68. Schafer, J.; Castelle, S.; Blanc, G.; Dabrin, A.; Masson, M.; Lanceleur, L.; Bossy, C. Mercury methylation in the sediments of a macrotidal estuary (Gironde Estuary, south-west France). Est. Coast. Shelf Sci. 2010, 90, 80–92. [Google Scholar] [CrossRef]
  69. Balcom, P.H.; Hammerschmidt, C.R.; Fitzgerald, W.F.; Lamborg, C.H.; O’Connor, J.S. Seasonal distributions and cycling of mercury and methylmercury in the waters of New York/New Jersey Harbor Estuary. Mar. Chem. 2008, 109, 1–17. [Google Scholar] [CrossRef]
  70. Brown, L.E.; Chen, C.Y.; Voytek, M.A.; Amirbahman, A. The effect of sediment mixing on mercury dynamics in two intertidal mudflats at great Bay Estuary, New Hampshire. Mar. Chem. 2015, 177, 731–741. [Google Scholar] [CrossRef] [PubMed]
  71. Matsuyama, A.; Yano, S.; Taninaka, T.; Kindachi, M.; Sonoda, I.; Tada, A.; Akagi, H. Chemical characteristics of dissolved mercury in the pore water of Minamata Bay sediments. Mar. Pollut. Bull. 2018, 129, 503–511. [Google Scholar] [CrossRef] [PubMed]
  72. Benoit, G.; Rozan, T.F. The influence of size distribution on the particle concentration effect and trace metal partitioning in rivers. Geochim. Cosmochim. Acta 1999, 63, 113–127. [Google Scholar] [CrossRef]
  73. Schartup, A.T.; Balcom, P.H.; Mason, R.P. Sediment-Porewater Partitioning, Total Sulfur, and Methylmercury Production in Estuaries. Environ. Sci. Technol. 2014, 48, 954–960. [Google Scholar] [CrossRef] [PubMed]
  74. Marvin-DiPasquale, M.; Lutz, M.A.; Brigham, M.E.; Krabbenhoft, D.P.; Aiken, G.R.; Orem, W.H.; Hall, B.D. Mercury Cycling in Stream Ecosystems. 2. Benthic Methylmercury Production and Bed Sediment-Pore Water Partitioning. Environ. Sci. Technol. 2009, 43, 2726–2732. [Google Scholar] [CrossRef]
  75. Grassi, S.; Netti, R. Sea water intrusion and mercury pollution of some coastal aquifers in the province of Grosseto (Southern Tuscany, Italy). J. Hydrol. 2000, 237, 198–211. [Google Scholar] [CrossRef]
  76. Turner, A.; Millward, G.E.; Le Roux, S.M. Sediment-water partitioning of inorganic mercury in estuaries. Environ. Sci. Technol. 2001, 35, 4648–4654. [Google Scholar] [CrossRef] [PubMed]
  77. Benoit, J.M.; Mason, R.P.; Gilmour, C.C.; Aiken, G.R. Constants for mercury binding by dissolved organic matter isolated from the Florida Everglades. Geochim. Cosmochim. Acta 2001, 65, 4445–4451. [Google Scholar] [CrossRef]
  78. Haitzer, M.; Aiken, G.R.; Ryan, J.N. Binding of mercury (II) to dissolved organic matter: The role of the mercury-to-DOM concentration ratio. Environ. Sci. Technol. 2002, 36, 3564–3570. [Google Scholar] [CrossRef]
  79. Hollweg, T.A.; Gilmour, C.C.; Mason, R.P. Methylmercury production in sediments of Chespeake Bay and the mid-Atlantic continental margin. Mar. Chem. 2009, 134, 86–101. [Google Scholar] [CrossRef]
  80. Boszke, L.; Kowalski, A.; Szczucinski, W.; Rachlewicz, G.; Lorenc, S.; Siepak, J. Assessment of mercury mobility and bioavailability by fractionation method in sediments from coastal zone inundated by the 26 December 2004 tsunami in Thailand. Environ. Geol. 2006, 51, 527–536. [Google Scholar] [CrossRef]
  81. Yu, X.; Li, H.; Pan, Y.; Wang, W.X. Mercury distribution, speciation and bioavailability in sediments from the Pearl River Estuary, Southern China. Mar. Pollut. Bull. 2012, 64, 1699–1704. [Google Scholar] [CrossRef] [PubMed]
  82. Daye, M.; Kadlecova, M.; Wuddane, B. Biogeochemical factors affecting the distribution, speciation, and transport of Hg species in the Deule and Lys Rivers (Northern France). Environ. Sci. Pollut. Res. 2015, 22, 2708–2720. [Google Scholar] [CrossRef] [PubMed]
  83. Ravichandran, M. Interactions between mercury and dissolved organic matter- a review. Chemosphere 2004, 55, 319–331. [Google Scholar] [CrossRef]
  84. Hsu-Kim, H.; Kucharzyk, K.H.; Zhang, T.; Deshusses, M.A. Mechanisms Regulating Mercury Bioavailability for Methylating Microorganisms in the Aquatic Environment: A Critical Review. Environ. Sci. Technol. 2013, 47, 2441–2456. [Google Scholar] [CrossRef] [PubMed]
  85. Beldowski, J.; Miotk, M.; Beldowska, M.; Pempkowiak, J. Total, methyl and organic mercury in sediments of the Southern Baltic Sea. Mar. Pollut. Bull. 2014, 87, 388–395. [Google Scholar] [CrossRef] [PubMed]
  86. Shoham-Frider, E.; Shelef, G.; Kress, N. Mercury speciation in sediments at a domestic sewage sludge marine disposal site. Mar. Environ. Res. 2007, 64, 601–615. [Google Scholar] [CrossRef] [PubMed]
  87. Zhong, H.; Wang, W.X. Inorganic mercury binding with different sulfur species in anoxic sediments and their gut juice extractions. Environ. Toxicol. Chem. 2009, 28, 1851–1857. [Google Scholar] [CrossRef] [PubMed]
Figure 1. The sediment cores collected at the stations located in the upper, middle, and lower estuary of the Danshuei River Estuary, northern Taiwan.
Water 17 00290 g001
Figure 2. The analytical concentrations of different Hg fractions of the MESS-4 reference material analyzed by the Bloom, the modified Tessier, and the BCR sequential extraction methods (SEM).
Water 17 00290 g002
Figure 3. The profiles of dissolved total Hg in pore water, and sediment total Hg, TOC, and grain size in sediment cores at the three stations of the Danshuei River Estuary.
Water 17 00290 g003
Figure 4. The scatter plots of sediment total Hg concentrations against grain size and TOC in sediment cores at the three stations of the Danshuei River Estuary.
Water 17 00290 g004
Figure 5. The distributions of Hg concentration in the five fractions of sediment cores of (a) the upper estuary, (b) the middle estuary, and (c) the lower estuary of the Danshuei River Estuary (F1, water-soluble; F2, human stomach acid; F3, organo-chelated; F4, elemental Hg; and F5, residual).
Water 17 00290 g005
Figure 6. The percentage of Hg concentration in each fraction to the total Hg pools in sediment cores of (a) the upper estuary, (b) the middle estuary, and (c) the lower estuary of the Danshuei River Estuary (F1, water-soluble; F2, human stomach acid; F3, organo-chelated; F4, elemental Hg; and F5, residual).
Water 17 00290 g006
Figure 7. The relation between TOC content and Hg content in the fractions 3–5 in sediment cores at the three stations of the Danshuei River Estuary.
Water 17 00290 g007
Figure 8. The relation between Hg percentage in the fraction 3 and fraction 4, the percentage in the fraction 2 plus fraction 3 and fraction 4, and the percentage in the fraction 2 plus fraction 3 and the fraction 4 plus fraction 5 in sediment cores at the three stations of the Danshuei River Estuary.
Water 17 00290 g008
Figure 9. The risk assessment code (RAC) value of Hg in the three sediment cores of the DRE. (1% < RAC ≤ 10%, low risk; 10% < RAC ≤ 30%, medium risk). The red lines indicate two RAC values of 10% and 30%.
Water 17 00290 g009
Table 1. Comparison the operational fraction, chemical treatment, and analytical mechanisms of the Bloom, the modified Tessier, and the BCR sequential extraction methods.
Sequential Extraction ProcessChemical TreatmentPossible Mechanism
Bloom Method
F1 Water-solubleMilli-Q waterWater soluble, HgCl2
F2 Human Stomach Acid0.1 M HOAc + 0.01 M HClbond to high water-solubility species
F3 Organo-chelated1 M KOHbond to humic, Hg humic, Hg2Cl2, CH3Hg
F4 Elemental Hg12 M HNO3crystalline in Fe-Mn oxides, organosulfur
F5 ResidualAqua regiabond to HgS, crystal lattice
Modified Tessier method
F1 Exchangeable1 M NaOAc (pH = 8.2)bond to ion exchange
F2 Carbonates1 M NaOAc (pH = 5.0)bond to carbonate
F3 Fe-Mn Oxides0.04 M NH2OH·HCl in 25% (v/v) HOAcbond to Fe-Mn oxides
F4 Organic Matter0.02 M HNO3 in 30% H2O2 (pH = 2.0)bond to organic matter
and 3.2 M NH4OAc in 20% (v/v) HNO3
F5 ResidualAqua regiabond to HgS, crystal lattice
BCR method
F1 Exchangeable0.11 M HOAcbond to ion exchangeable
F2 Reducible0.5 M NH2OH·HCl and 0.4 M HNO3bond to Fe-Mn oxides
F3 Oxidizable8.8 M H2O2 (pH = 2~3)bond to organic matter
and 1 M NH4OAc (pH = 2.0)
F4 ResidualAqua regiabond to HgS, crystal lattice
Table 2. The analytical concentrations and percentages of different Hg fractions in the MESS-4 reference material analyzed by the Bloom, the modifier Tessier, and the BCR sequential extraction methods (SEM). The reference value of total Hg concentration in the MESS-4 reference material is 0.09 ± 0.04 mg/kg.
Concentration (ng/g)Total Conc.Anal. Accur.Fraction Percentage (%)
F1F2F3F4F5(ng/g)(%)F1F2F3F4F5
Bloom SEM
Min2.195.9719.8448.073.3782.3991.542.666.9723.9556.643.96
Max3.067.3622.7051.735.3485.6295.133.638.6726.5160.996.29
Mean±2.586.6020.8750.034.1884.2693.623.067.8324.7659.384.96
1 std0.310.491.111.300.761.201.330.360.591.031.590.91
Modified Tessier SEM
Min2.704.1625.0925.8324.81100.82112.002.423.4324.8922.9921.94
Max4.727.3546.3839.6431.29121.44134.933.896.7741.2735.8830.76
Mean±3.186.0235.5535.3729.26109.38121.532.895.5532.2132.4426.92
1 std0.771.379.004.982.467.708.550.531.406.344.743.46
modified BCR SEM
Min4.1325.8033.207.76 81.9791.084.6831.4739.409.44
Max7.7035.2744.6415.41 93.18103.538.4940.0053.4118.29
Mean±6.0230.3139.7910.69 86.8196.466.9234.8745.8612.34
1 std1.523.224.173.17 3.894.321.672.804.783.77
Table 3. The concentration ranges of dissolved total Hg (DTH) in sediment pore water, and total Hg, TOC, grain size, and the percentage ranges of the four-size of grain size of the three core sediments analyzed in the present study.
Pore WaterSediment Core
DTHg
(ng/L)
Total Hg
(ng/g)
TOC
(%)
Grain Size
(µm)
Medium Sand
(%)
Fine Sand
(%)
Very Fine Sand
(%)
Mud
(%)
The upper estuary
Min1.21109.91.0624.191.315.3510.4125.04
Max3.17257.72.0963.9412.9925.7560.2274.48
Mean1.83183.61.6142.395.1514.5633.1547.14
The middle estuary
Min0.69234.81.158.710.370.461.9185.44
Max4.68368.72.2923.024.613.097.4197.26
Mean2.13304.21.7214.281.671.354.1692.82
The lower estuary
Min1.44234.01.213.861.081.225.3567.93
Max4.89279.51.5828.735.5312.3518.6291.86
Mean2.95252.81.4216.562.244.0110.6783.08
Table 4. The concentration and percentage ranges of the five-fraction sedimentary Hg in sediment cores collected from the Danshuei River Estuary.
Sampled
Time
Concentration (ng/g)Percentage (%)
F1F2F3F4F5TotalF1F2F3F4F5
The upper estuary
Min2.437.5229.7253.273.98109.91.043.1514.5542.203.40
Max6.2625.3565.53150.8540.69257.75.2716.3633.8767.5115.93
Mean3.5312.0846.82102.618.6183.62.117.3625.9755.159.41
The middle estuary
Min4.742.5839.88116.5728.35234.771.490.8016.9941.397.69
Max7.7714.39150.58179.9071.61368.672.895.7642.9155.0727.80
Mean6.086.88104.06140.5146.68304.192.052.4632.8046.6116.08
The lower estuary
Min2.491.9973.20115.7429.38233.970.970.8226.9047.8012.56
Max6.828.9385.71145.2451.42279.502.713.1935.0254.1519.24
Mean4.713.8379.61127.5537.11252.811.881.4931.6050.4314.60
Notes: F1, water-soluble; F2, human stomach acid; F3, organo-chelated; F4, elemental Hg; and F5, residual.
Disclaimer/Publisher’s Note: The statements, opinions and data contained in all publications are solely those of the individual author(s) and contributor(s) and not of MDPI and/or the editor(s). MDPI and/or the editor(s) disclaim responsibility for any injury to people or property resulting from any ideas, methods, instructions or products referred to in the content.

