1. Introduction
The WDNs are essential components of modern infrastructure and are used to supply clean water to households, industries, and agricultural sectors. These systems comprise an interconnected network of pipelines, valves, tanks, pumps, and consumer endpoints, all operating under continuous pressure to ensure an uninterrupted water supply. A significant challenge in WDNs is non-revenue water (NRW), which refers to the volume of water generated but not billed to consumers [
1]. NRW includes both real losses, such as physical leakages and bursts from pipes, and apparent losses, which arise from meter inaccuracies or unauthorized consumption. Among these, leakages and bursts are the primary contributors to real losses, often resulting from factors, such as aging assets, poor maintenance practices, ground movement, thermal expansion, and construction defects. The extent of water loss varies significantly across different regions. In the United States, approximately 126 billion cubic meters of treated water is lost annually owing to infrastructure deterioration, resulting in financial losses exceeding
$187 billion [
2]. In Asian cities, NRW levels have reached approximately 25.4% [
3], whereas daily losses of 51–80 L per person have been reported in the United Kingdom, depending on the region [
4]. In 2022, South Korea experienced a water leakage rate of 9.9% [
5].
Unaddressed leakage and bursts in WDNs not only waste treated water and increase operational costs, but also compromise the reliability, sustainability, and environmental integrity of these systems. Moreover, such issues can accelerate infrastructure deterioration and exacerbate supply disruptions during emergencies. The social and environmental ramifications of NRW have garnered increasing attention, particularly in the context of global water scarcity and climate change. In many urban areas, aging water infrastructure coincides with rising demand, intensifying the pressure on utility providers. Beyond the immediate loss of water, hidden bursts and leaks can lead to significant secondary damages, such as soil erosion, road subsidence, and the contamination of potable water supplies through infiltration. These failures disproportionately impact vulnerable populations by reducing water availability, reducing pressure, and compromising water quality. To address these challenges, governments and water utility providers worldwide are actively pursuing innovative, technology-driven solutions for the proactive monitoring and management of water infrastructure. Digitalization, integration of smart sensors, and advanced data analytics are emerging as essential components of modern water utility management.
The adoption of these technologies facilitates real-time monitoring and provides early warnings of abnormal conditions, thereby preventing catastrophic failures. Despite these advancements, achieving widespread implementation remains a formidable challenge owing to the heterogeneity of network conditions, financial constraints, and technical hurdles. Therefore, the implementation of robust, accurate, and cost-effective leakage and burst detection strategies is imperative. These practices support effective asset management, minimize economic losses, and bolster system resilience in the face of future challenges.
Over the past few decades, various techniques for leak and burst detection in WDNs have been proposed and categorized systematically [
6,
7,
8]. These methods can be broadly classified into equipment-based, data-driven, and simulation-based approaches. Equipment-based methods leverage physical sensors, such as leak noise loggers, acoustic hydrophones, ground-penetrating radar (GPR), and aerial thermal imaging (ATI), to identify potential leak locations. Although these tools provide direct field measurements, their effectiveness can be limited by environmental factors, such as soil type, underground noise, and installation complexity. Recent advancements, including acoustic vibration analysis [
9], frequency analysis of acoustic signals [
10], and the application of GPR and ATI for subsurface detection [
11,
12], have sought to improve the performance of these techniques. Although these methods can be effective in certain contexts, they often encounter challenges related to scalability and operational feasibility in complex urban environments.
In contrast, data-driven approaches utilize time-series sensor data, such as pressure and flow-rate measurements, to detect anomalies using statistical inference or machine-learning techniques. These methods facilitate real-time detection and adaptability. A notable application of this approach is multivariate statistical process control (SPC), which has been extensively used to monitor system behavior and detect anomalies within WDNs. Nam et al. [
13] proposed a hybrid system that integrates principal component analysis and standardized exponential weighted-moving average (EWMA) techniques, optimized for sensor placement to facilitate cost-effective burst detection. Romano et al. [
14] developed an SPC-based system to enhance burst localization and minimize false alarms. In a related study, Kim et al. [
15] presented a robust pressure-based leakage detection algorithm that addressed the limitations associated with cumulative sum and wavelet methods. Jung et al. [
16] compared various univariate and multivariate SPC techniques and concluded that univariate EWMA was particularly effective for detecting small bursts. Furthermore, Jung and Lansey [
17] employed a nonlinear Kalman filter to enhance burst detection under varying conditions. Despite significant advancements, the effectiveness of these methods depends on the quality and volume of data, as well as the variability of network conditions. Recently, machine-learning techniques, including artificial neural networks and dynamic time warping, have demonstrated significant potential in identifying nonlinear patterns in data [
18,
19,
20,
21]. Although machine-learning-based approaches demonstrate high accuracy and adaptability, their generalizability significantly depends on the diversity and quality of the training datasets. Moreover, challenges related to model interpretability and the transferability of these models to different hydraulic configurations continue to pose obstacles to practical implementation.
Simulation-based approaches for leak and burst detection involve the comparison between real-time sensor data and predictions from hydraulic models, utilizing the residuals between the observed and simulated values. Although these methods yield interpretable results, their effectiveness is contingent upon accurate model calibration, which necessitates regular updates to accurately reflect changes within the system. Recent studies have introduced advanced frameworks to enhance detection and localization, including hybrid residual analysis [
22], hierarchical dual modeling [
23], and multistage frameworks that integrate hydraulic modeling with clustering techniques [
24]. Although these methods demonstrate high accuracy, they often require significant modeling effort and exhibit sensitivity to changes in network topology and boundary conditions, which can hinder their scalability and adaptability.
Convolutional neural networks (CNNs), initially developed by LeCun et al. [
25], represent a class of deep-learning models that are particularly suited for image and pattern recognition tasks. In the context of water infrastructure monitoring, CNNs have been employed to identify anomalies, such as pipe bursts and leaks, by converting time-series sensor data into spatial or spectral representations. For example, Kang et al. [
26] integrated 1D-CNNs with support vector machines and graph-based methods and achieved an accuracy of 99.3% with precise localization. Peng et al. [
27] used log PS-ResNet18 with noise reduction for daytime acoustic leak detection, which outperformed conventional methods. Jun and Lansey [
28] demonstrated that incorporating a network layout and hydraulic responses significantly enhances the CNN-based burst detection. Guo et al. [
29] proposed a time–frequency CNN that leverages transfer learning for robust detection capabilities, even with limited data. Kim et al. [
30] developed an ensemble CNN that integrates results from SPC into heat maps to improve burst detection performance. Zhou et al. [
31] developed a DenseNet-based deep-learning framework that uses limited pressure signals to accurately localize pipe bursts and achieved high success rates in both benchmark and real networks. Collectively, these studies underscore the flexibility and effectiveness of CNNs in extracting spatiotemporal features from sensor data, positioning them as a promising solution for intelligent leak and burst detection in WDNs. CNN-based approaches demonstrate strong capabilities in feature extraction and classification; however, they exhibit inherent limitations in precise localization owing to factors, such as dependence on input data characteristics and the hierarchical downsampling of spatial information. These drawbacks become particularly pronounced in WDNs, where accurate detection and localization of subtle or spatially dispersed anomalies are essential.
Region-based CNNs (R-CNNs) models were developed to address these challenges [
32]. By introducing a region proposal mechanism to first identify potential object regions and subsequently perform CNN-based feature extraction and classification, R-CNNs integrate object recognition with accurate localization, representing a significant methodological enhancement compared to conventional CNN architectures. A faster R-CNN [
33] significantly improves detection speed and accuracy by introducing a region proposal network (RPN). Xie et al. [
34] proposed a robust, faster R-CNN-based infrared thermography method to automatically detect pipeline network leakage in complex backgrounds, which demonstrated high precision and generalization capabilities. Zhang et al. [
35] introduced a real-time detection method for floating objects on water surfaces using the faster R-CNN. They found that it outperformed other models in real-time valve detection for robotic inspection in water pipelines. Despite the advances in object detection, research on the application of these techniques for burst and leakage detection in WDNs remains limited.
This paper presents a novel deep-learning-based framework for detecting and localizing pipe bursts in WDNs. By converting hydraulic simulation outputs into spatial pressure contour images, the proposed framework leverages a region-based object detection algorithm to effectively identify pipe bursts. In contrast to purely data-driven and simulation-based methods, which often exhibit limited generalizability, high calibration effort, and sensitivity to system changes, the proposed approach capitalizes on image-based representations that preserve spatial information. Moreover, although conventional CNNs are effective at feature extraction, they are inherently limited in precise localization, particularly for subtle or spatially dispersed anomalies in WDNs. To overcome these constraints, we employed a faster R-CNN model, which integrates an RPN to achieve simultaneous classification and accurate localization with enhanced speed and robustness. The model was trained to recognize burst patterns and predict their locations across different sensor coverage levels.
The remainder of the manuscript is outlined as follows. A comprehensive description of the proposed methodology is provided in
Section 2, which includes the generation of the hydraulic scenarios, preprocessing of image-based data, designing of model architecture, and selection of performance evaluation metrics.
Section 3 presents the application of the framework to three real-world networks, analyzing detection accuracy, spatial localization performance, and sensor configuration sensitivity.
Section 4 discusses the findings and limitations of the study. Finally,
Section 5 presents the conclusions of this study and outlines potential directions for future research.
2. Methodology
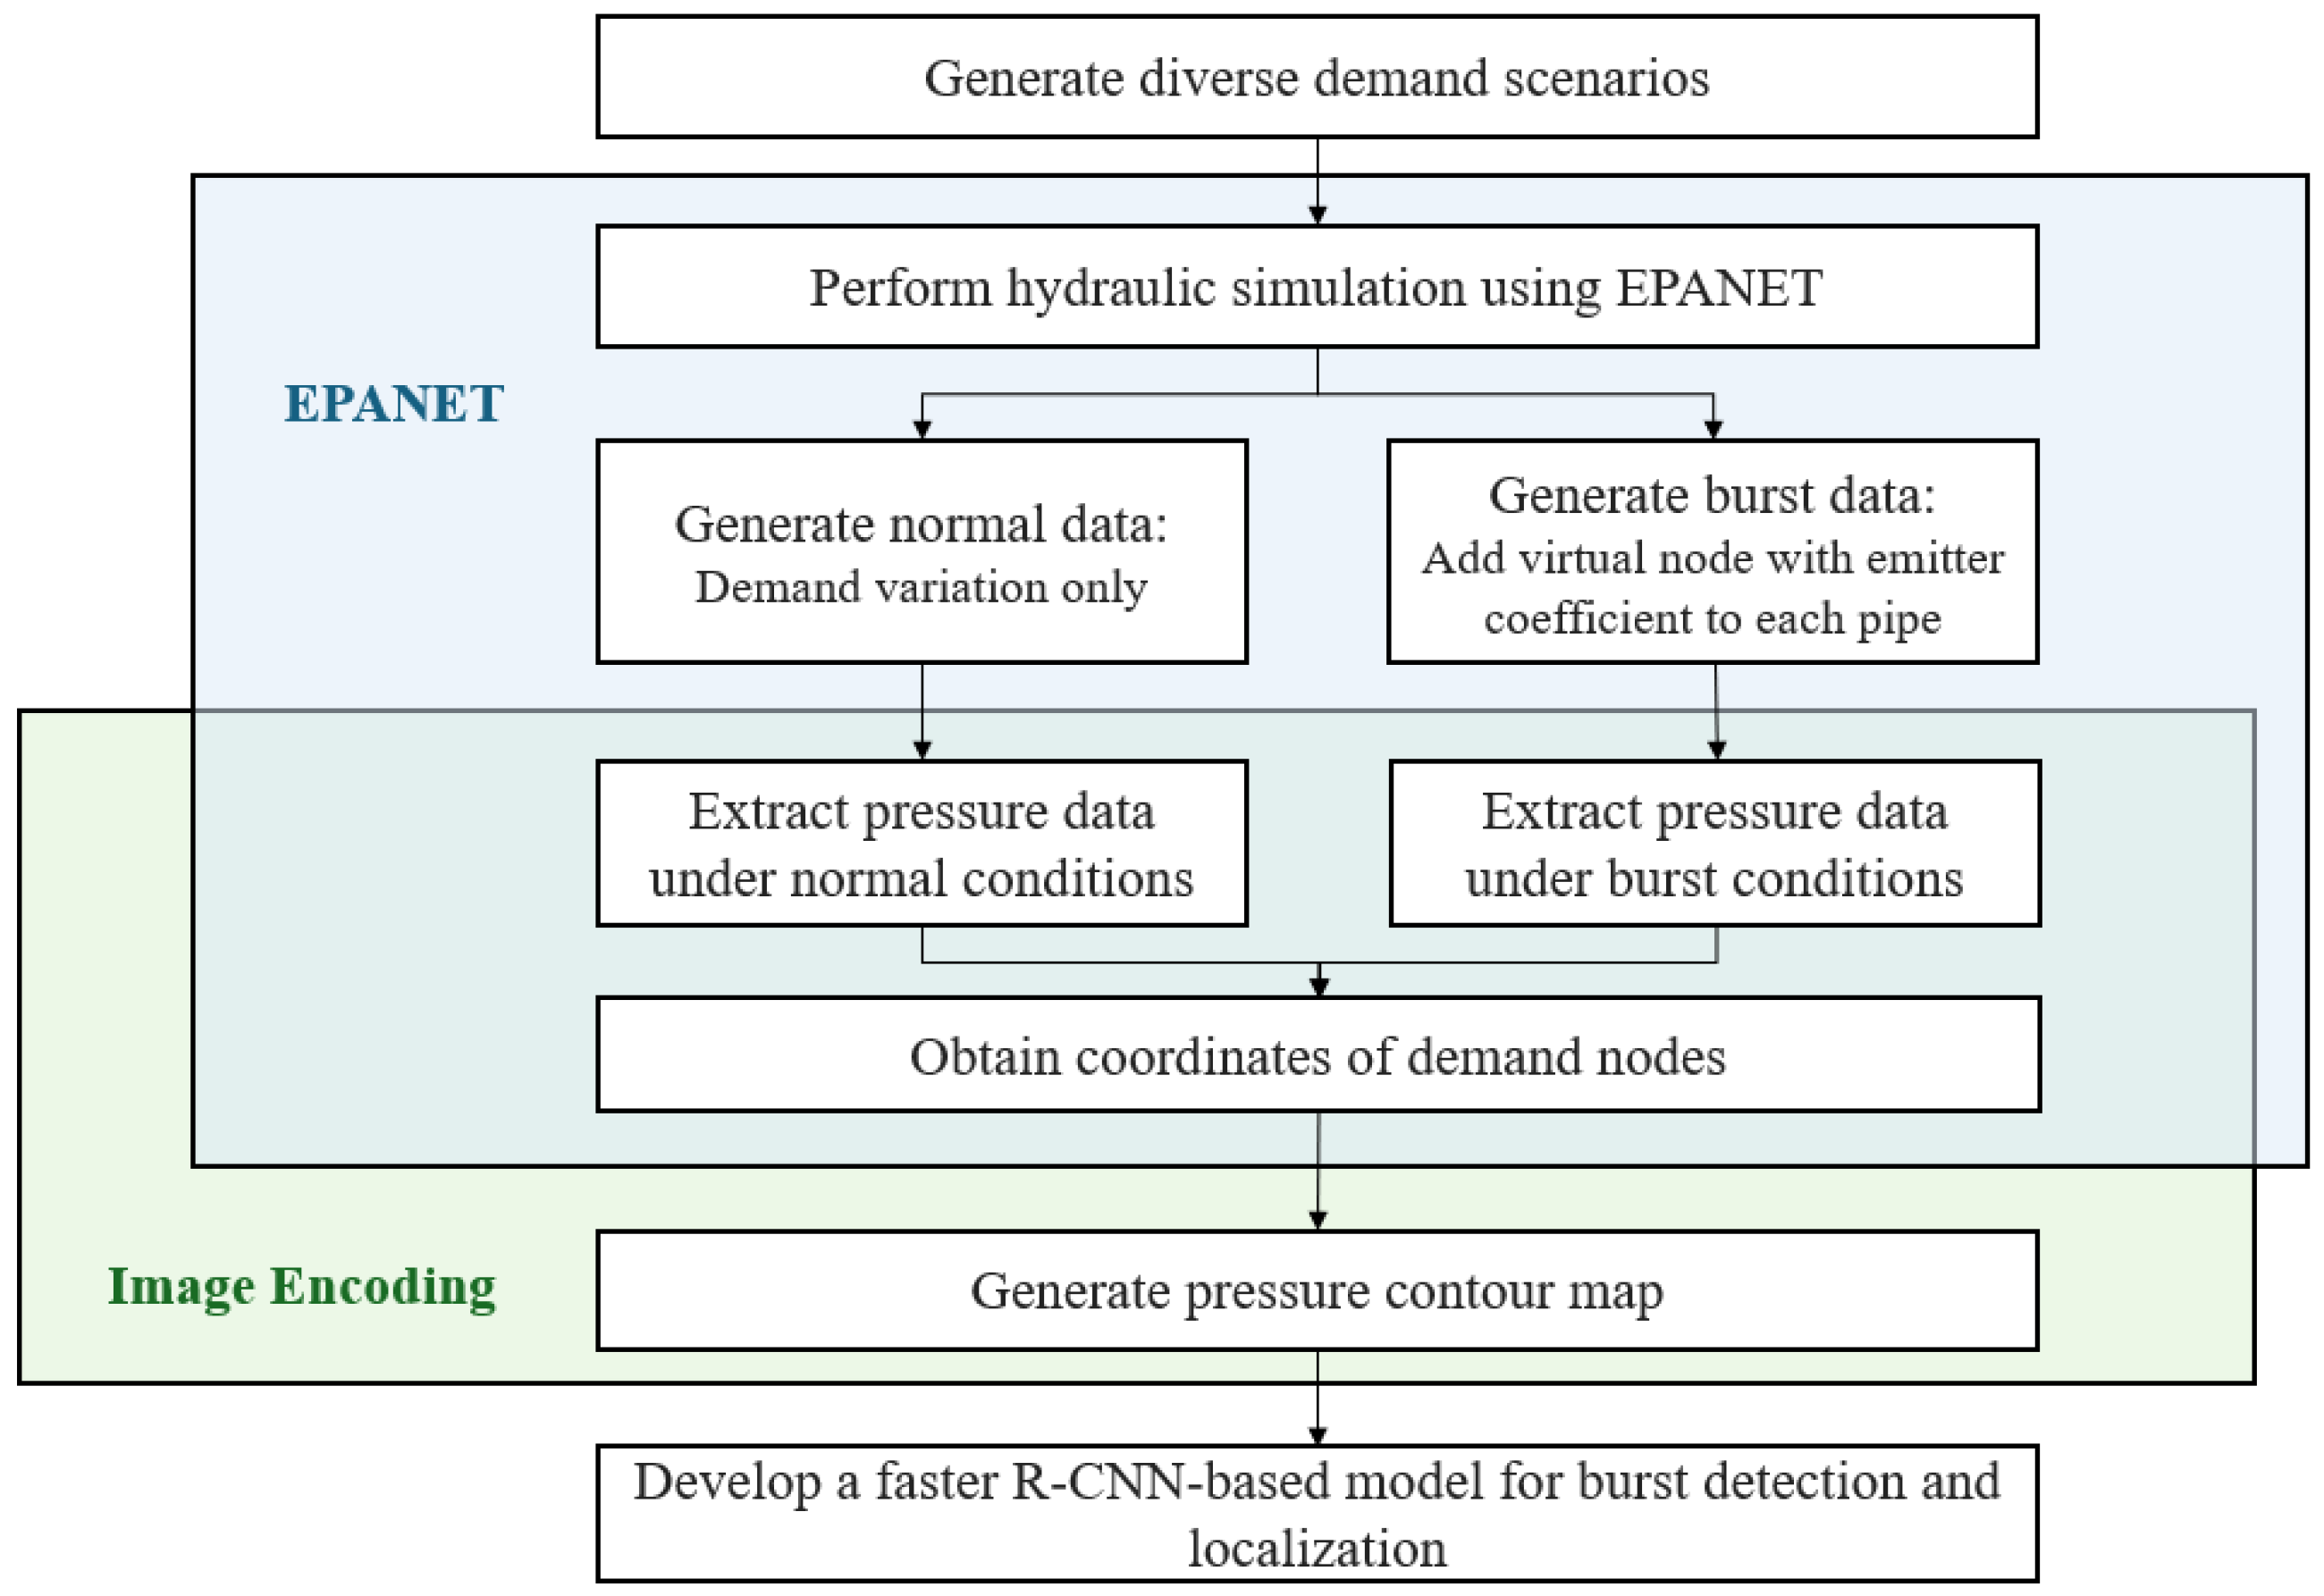
The overall framework for pipe burst detection and localization (PBD&L) in WDNs using the faster R-CNN model is shown in
Figure 1. This methodology comprises four sequential stages, each designed to ensure precise learning and reliable performance. Initially, we conducted a series of hydraulic simulations that considered both normal operational and burst events, thereby providing a diverse set of training conditions. Subsequently, the pressure data generated from these simulation scenarios were archived and transformed into two-dimensional contour images, which visually encode the spatial pressure distribution across the target WDNs. These pressure maps served as the training input for the faster R-CNN model, enabling it to identify and localize pipe bursts based on visual patterns. Finally, the trained model was evaluated using standard object detection metrics to quantitatively evaluate its detection accuracy and localization performance. Detailed procedures for each stage are presented in the following subsections.
2.1. Simulation of Hydraulic Scenarios Under Normal and Burst Conditions
A residential demand pattern was adopted to simulate realistic operational conditions. Among the variations in demand over 24 h, the multiplier at 4:00 AM—representing the time of lowest water consumption—was established at 0.15 and selected as the reference point for scenario generation. During these low-demand periods, system pressure is particularly sensitive to pipe leaks or bursts, rendering them easier to detect.
Simulation data were generated for normal and burst cases with an equal number of samples in each category to ensure balanced training and evaluation of the detection and localization models. Normal data were generated by applying a coefficient of variation of 0.9 to the base demand values, reflecting slight fluctuations in consumer usage with no burst or leakage.
For the burst scenario, pipe bursts were hypothetically simulated. Each pipe within the WDNs was virtually divided at its midpoint, and a fictitious demand node was introduced. An emitter coefficient was assigned to each fictitious node to simulate the burst-flow conditions. The burst scenarios were generated for every pipe in each WDN, meaning that each pipe served as an independent burst location. In this study, the discharge equation for sprinklers introduced by Puchovsky [
36], which models the outflow as a function of operational pressure and cross-sectional area, was used to simulate burst-flow rates. EPANET 2.0 [
37], a hydraulic and water quality simulation software developed by the U.S. environmental protection agency, approximates such abnormal discharges using the emitter function. In this function, the emitter (discharge) coefficient (denoted as
) models leakage and burst flows analogously to nozzle-orifice discharge, as expressed by Equation (1):
where
Q is the leakage or burst flow rate [
],
p is the operational pressure [
], and
is the emitter (discharge) coefficient, which has units of [
], representing the discharge through an emitter. For analytical leakage modeling, the emitter (discharge) coefficient
is defined as follows:
where
g is the gravitational acceleration [
],
is the specific weight of water [
], and
A is the rupture area [
] [
38].
Three levels of pressure sensor deployment (100%, 75%, and 50% of demand nodes) were used to analyze the effect of sensor coverage on burst detection. The 100% scenario corresponds to the idealized case where all demand nodes are monitored, whereas the 75% and 50% cases represent more practical settings with reduced sensor availability. For sensor selection under reduced coverage, a hypothetical burst was simulated at the midpoint of each pipe, and the pressure differences at all demand nodes were computed by comparing preburst and postburst conditions. Nodes that exhibited a residual pressure variation exceeding a threshold of 1.0 m were identified as sensitive nodes for that specific burst event. The repetition of this process for all pipes enabled the enumeration of how frequently each node sensitively responded to burst events. Nodes with higher counts indicate greater sensitivity to abnormal conditions and thus, higher diagnostic value. Accordingly, the top 75% and 50% of demand nodes, ranked by sensitivity count, were designated as sensor locations for the respective coverage scenarios.
2.2. Pressure Map Generation and Preprocessing
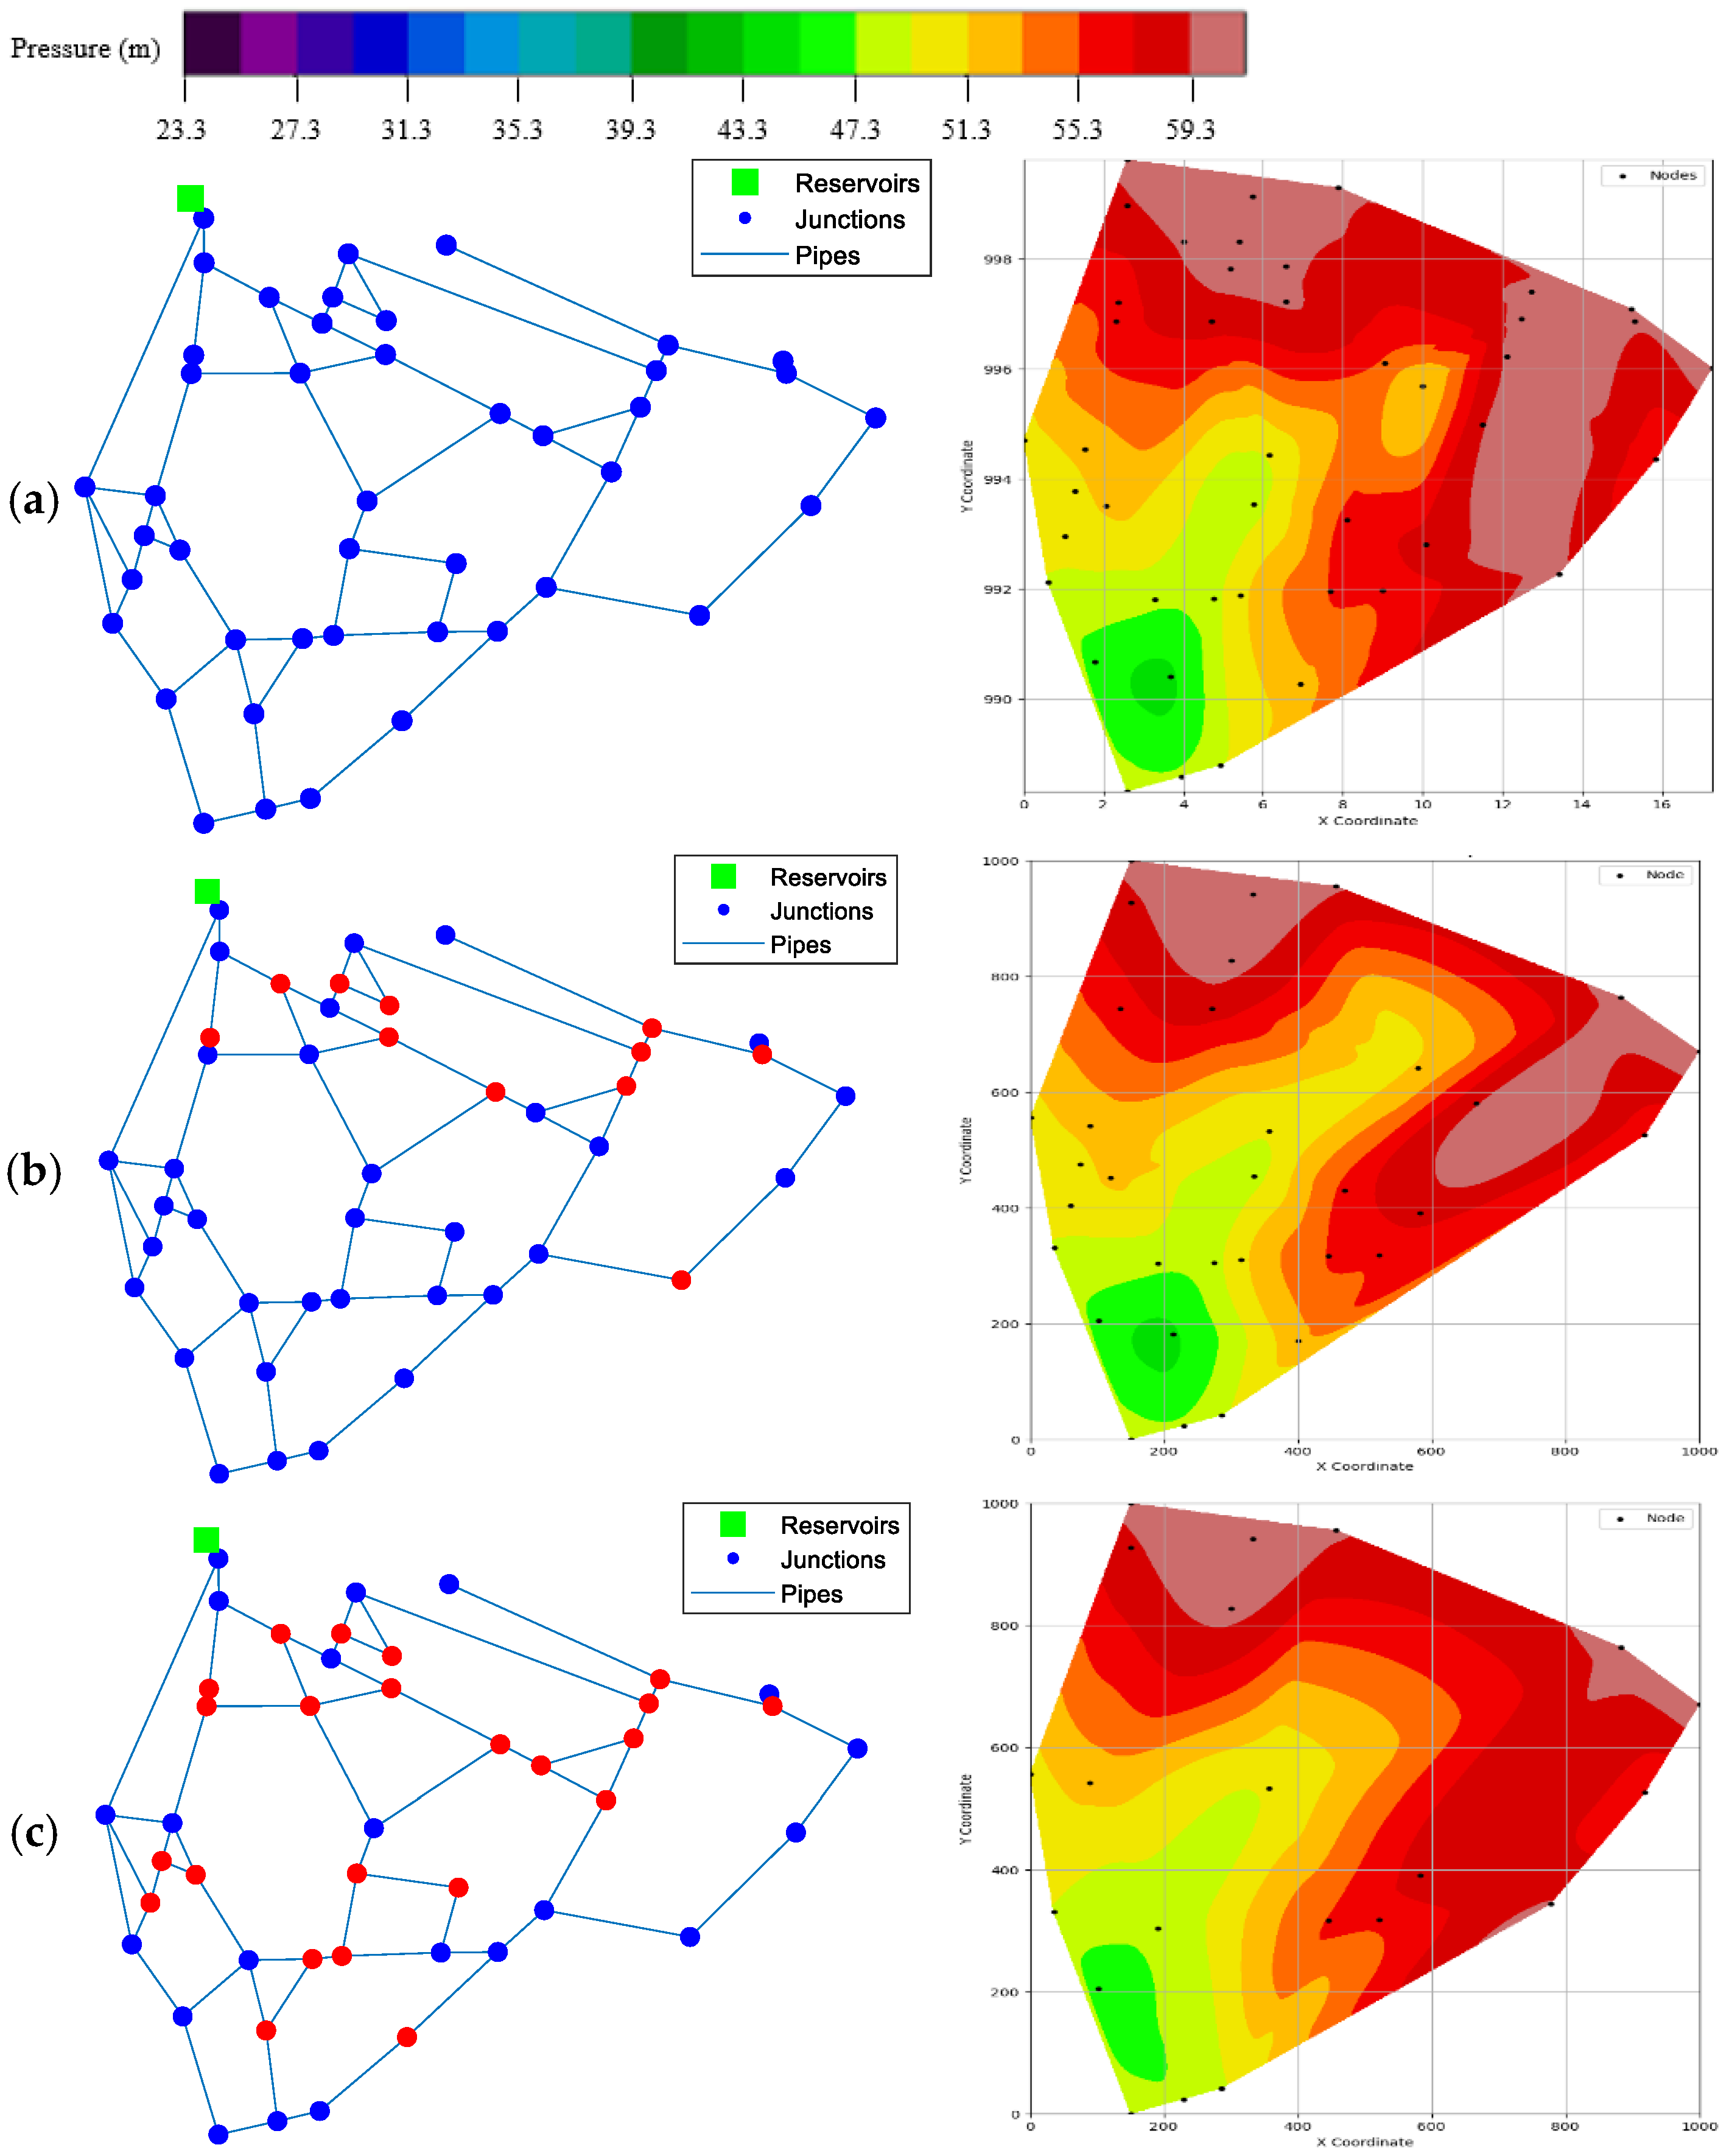
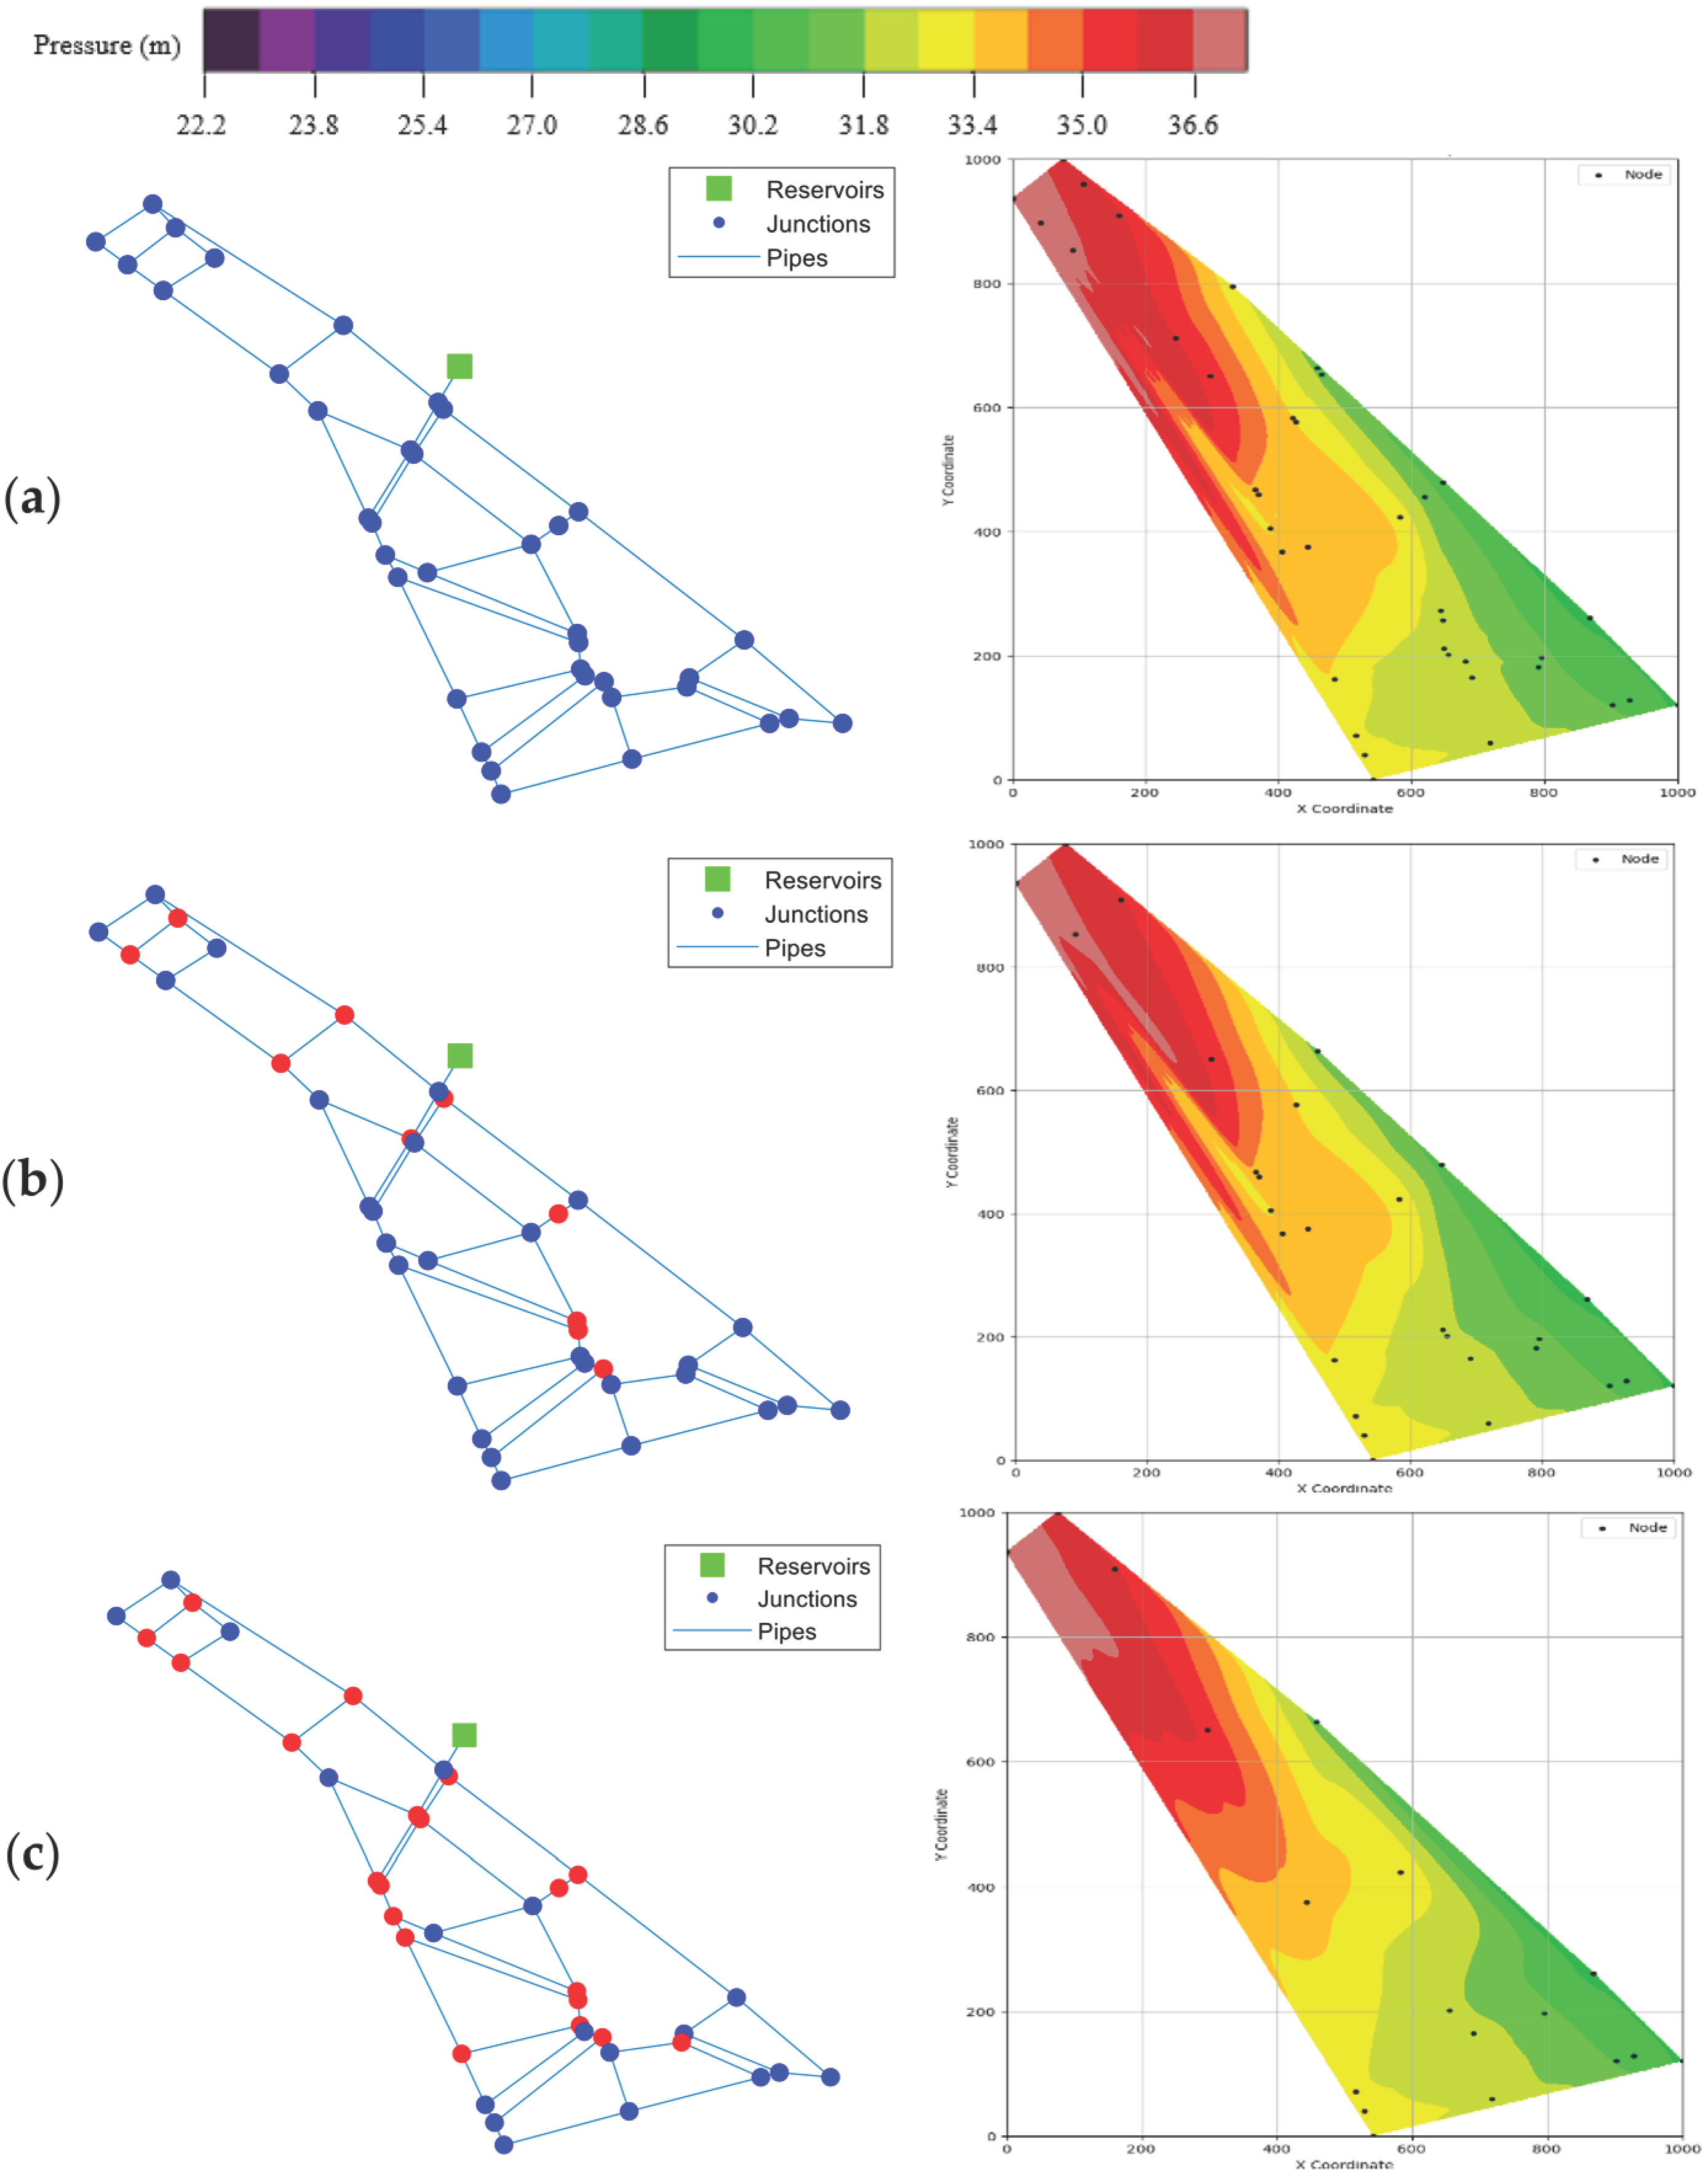
Following the generation of both normal and burst hydraulic scenarios, the simulation outputs were transformed into a visual dataset tailored for deep-learning-based classification and localization tasks. For each scenario, we extracted nodal pressure values and spatial coordinates of junction nodes from the EPANET hydraulic simulation results. These values were used to visualize a spatial pressure contour image at a single time step, specifically at 4:00 AM, when the water demand was at its minimum and pressure anomalies resulting from bursts were most pronounced. Spatial interpolation was performed to plot a continuous pressure map of the target WDN. In particular, a clough–tocher piecewise cubic interpolation (implemented in scipy.interpolate.griddata with the option method = ‘cubic’) was adopted. This ensured a smooth and continuous pressure surface for contour generation. The resulting interpolated pressure fields were visualized as contour maps using fixed color scales and resolution settings to ensure consistency across all samples. Each image was labeled as either “normal” or “burst” based on the simulation settings: images generated from scenarios where a burst was intentionally introduced into the hydraulic model were labeled as “burst,” while those generated from simulations without any burst condition were labeled as “normal.” In the case of burst scenarios, the location of the inserted emitter node was recorded and stored as the ground truth to facilitate localization tasks. All the images were saved as PNG files, each with a resolution of 224 × 224 pixels, aligning with the input requirements of standard CNNs. This process effectively converted the numerical hydraulic simulation data into a structured visual dataset, thereby enabling the application of advanced computer vision techniques for burst detection in WDNs.
2.3. Development of a Faster R-CNN-Based PBD&L Framework
The architecture of the proposed PBD&L framework, constructed using a faster R-CNN model, is shown in
Figure 2. The input to the framework comprised a pressure contour image generated from the hydraulic simulation results, which captured the spatial distribution of nodal pressure across the WDNs. Initially, this image was processed through a series of convolutional layers to extract feature maps that encoded spatial characteristics, such as pressure gradients, abrupt transitions, and localized anomalies. These extracted feature maps were subsequently input into an RPN that scanned the spatial features and generated proposals, with candidate bounding boxes likely to contain burst events. Each proposal was processed through a region of interest pooling layers, which standardized the feature representation to a fixed size, thereby facilitating uniform handling of proposals with varying dimensions. Subsequently, the pooled features were directed to two parallel components: a classifier and a bounding box regressor. The classifier determined whether a given region corresponded to a burst (indicating a pipe failure) or a normal state (indicating no burst), whereas the regressor refined the bounding box coordinates to improve localization accuracy. For training, total images with corresponding PASCAL VOC format annotations were used. Dataset allocations for the testing and training were 20% and 80%, respectively. During the training process, the model was optimized for 10 epochs using a stochastic gradient descent optimizer at a learning rate of 0.005, momentum of 0.9, and weight decay of 0.0005. A batch size of 2 was employed to effectively utilize GPU memory, and data preprocessing included image-to-tensor conversion to ensure compatibility with PyTorch. This end-to-end framework enabled both the detection and spatial localization of pipe bursts using pressure-based visual data, thereby providing a foundation for the automated monitoring of WDNs.
2.4. Performance Evaluation Metrics
Precision, Recall, AP@IoU = 0.5, normal average precision (AP), burst AP, mean AP, average intersection over union (IoU), and frames per second (FPS) were used to evaluate the performance of the proposed faster R-CNN-based PBD&L framework. These metrics collectively assessed the classification accuracy and localization quality of the proposed model. The evaluation was based on the confusion matrix summarized in
Table 1, which categorizes prediction outcomes as follows:
True Positives (TP): The number of burst events correctly detected by the model (actual bursts that were successfully predicted as bursts).
False Positives (FP): The number of normal conditions incorrectly classified as bursts (false alarms).
False Negatives (FN): The number of actual burst events that the model failed to detect (undetected bursts).
True Negatives (TN): The number of normal conditions correctly identified as nonbursts.
Table 1.
Confusion matrix.
Table 1.
Confusion matrix.
| | Predicted |
| Positive (Burst) | Negative (Normal) |
| Actual | Positive (Burst) | True Positive (TP) | False Negative (FN) |
| Negative (Normal) | False Positive (FP) | True Negative (TN) |
Precision and Recall were calculated as follows using this matrix.
Precision is defined as the proportion of conditions predicted as bursts that are true bursts. A precision value of 1.0 indicates the absence of FPs, signifying that no normal conditions were mistakenly classified as bursts. Recall measures the proportion of actual burst events successfully detected by the model. For example, a Recall of 0.97 indicates that 3% of true bursts were not detected. Both metrics range from 0.0 to 1.0, with values closer to 1.0 reflecting superior detection performance, whereas values approaching 0.0 indicate poor classification accuracy or high rates of detection failure.
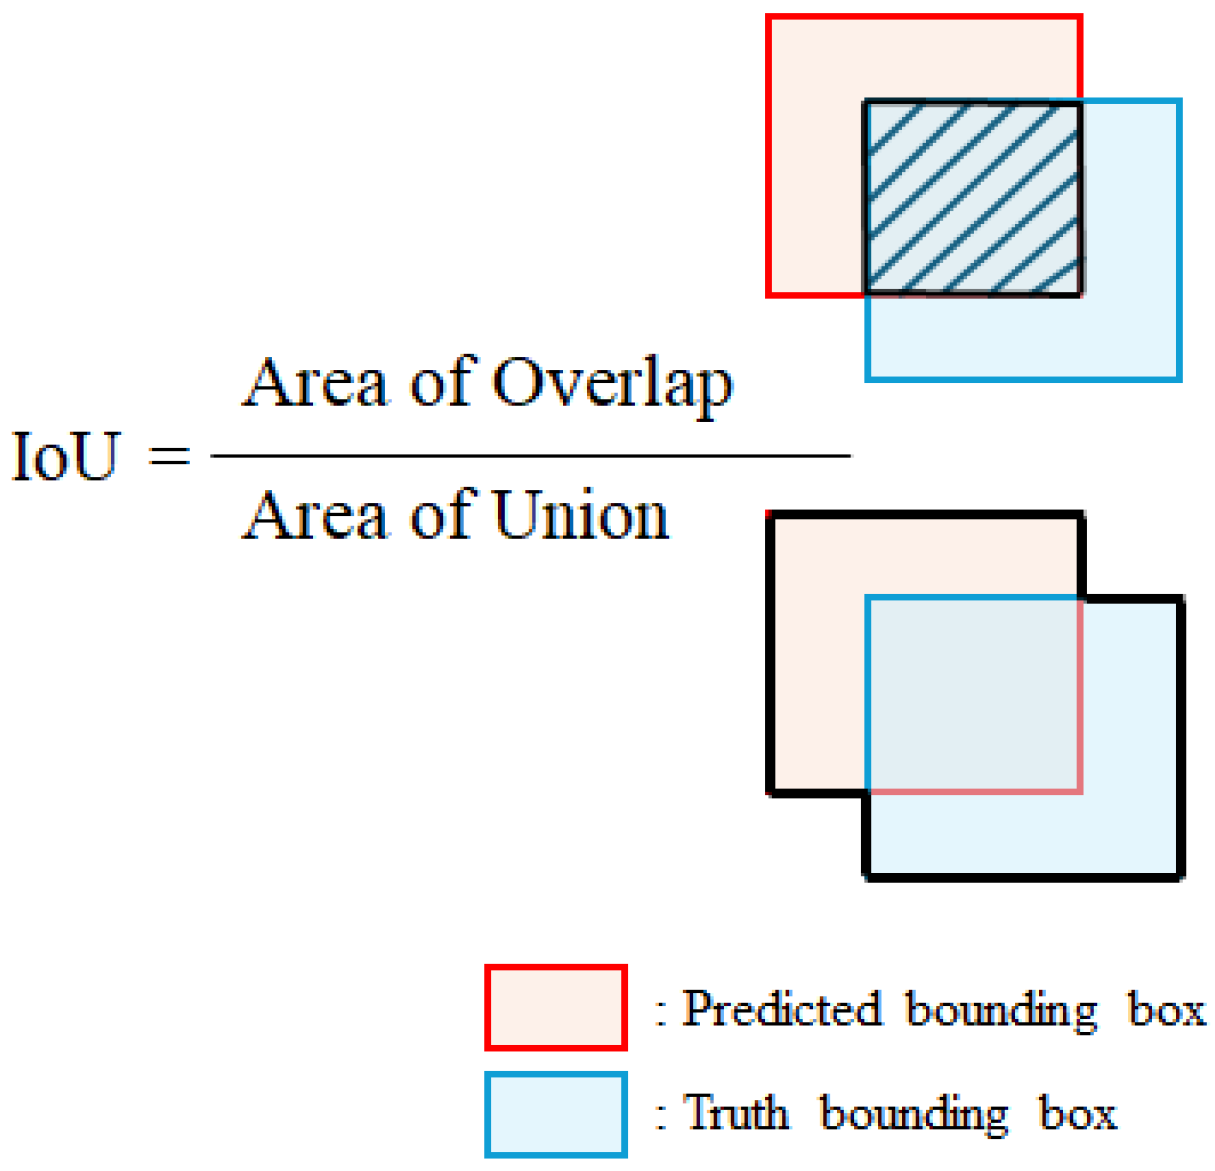
The IoU was used to evaluate the localization accuracy. This metric is defined as the ratio of the overlapping area between the predicted and ground truth bounding boxes to their union area (
Figure 3) and expressed as follows.
A detection was considered correct if the IoU exceeded a specified threshold. Following the widely adopted PASCAL visual object classes (VOC) evaluation protocol [
39], an IoU threshold of 0.5 was applied in this study to assess detection performance.
AP, specifically AP@IoU = 0.5, measures the average precision of predictions, where the IoU between the predicted and ground truth bounding boxes is at least 0.5. Initially, all predicted bounding boxes were sorted in descending order of their confidence scores, which represent the certainty of the model regarding the existence of a detected object. For each confidence threshold, predictions are classified as TP if the IoU ≥ 0.5 and the predicted class is accurate; otherwise, they are classified as FP. Cumulative precision (TP/[TP + FP]) and recall (TP/[TP + FN]) were calculated for all thresholds. These metrics were used to generate the precision–recall (PR) curve; the area under the PR curve yielded the AP value for that class. The burst AP and normal AP were calculated separately, focusing exclusively on images that demonstrate burst or normal conditions, respectively. For example, a burst AP of 0.9807 indicates that the model detected burst events with high confidence and spatial accuracy, whereas a normal AP of 0.9653 indicates that the model maintained strong performance in identifying non-burst images. Subsequently, these class-specific AP values were averaged to derive the mean AP (mAP), which provides a comprehensive measure of detection performance across all object classes. A high mAP value implies that the model performed consistently well under both burst and normal conditions.
Furthermore, the Average IoU was calculated to evaluate the spatial alignment accuracy between the predicted and ground truth bounding boxes. A higher average IoU indicates that the detected bounding boxes closely correspond to the actual object regions, thereby demonstrating enhanced localization performance.
Finally, the computational efficiency of the model was quantified using FPS, which measures the number of images that the model can process per second. A high FPS indicates that the model is appropriate for real-time deployment in practical monitoring systems.
4. Discussion
This study evaluated the effectiveness of a faster R-CNN-based burst detection framework across three distinct WDNs (Fossolo, PB23, and CM53) under various sensor coverage conditions (100%, 75%, and 50%). The model exhibited strong detection performance across all scenarios; however, significant differences emerged based on the structural characteristics of the WDNs and sensor density.
The model demonstrated the most consistent and superior performance for the Fossolo network, with an mAP consistently exceeding 0.95 across all sensor configurations. Additionally, the average IoU showed minimal variation, ranging from 0.46 to 0.44, underscoring the robustness of both the WDNs and detection model. These findings suggest that the well-balanced pressure distribution within the Fossolo network facilitates reliable pattern extraction and generalization, even for sparse sensor configurations.
For the PB23 network, the model maintained relatively steady mAP values (approximately 0.86) regardless of sensor coverage, with stable AP@IoU = 0.5 and minimal fluctuations in class-wise AP. This consistency implies that the pressure dynamics in PB23 are predictable and that the deployed sensors, despite a reduction in quantity, continue to capture sufficient features for accurate detection. Additionally, the elevated Burst AP further confirmed the sensitivity of the model to actual burst conditions.
In contrast, for the CM53 network, the model demonstrated an unexpected performance trend: the mAP increased as the sensor coverage decreased (from 0.77 at 100% to 0.85 at 50%). From the PR curves (
Figure 12b), although Precision remained high under full sensor coverage, Recall experienced a sharp decline at decreased thresholds. This suggests potential confusion arising from redundant or noisy pressure signals. The spatial detection results (
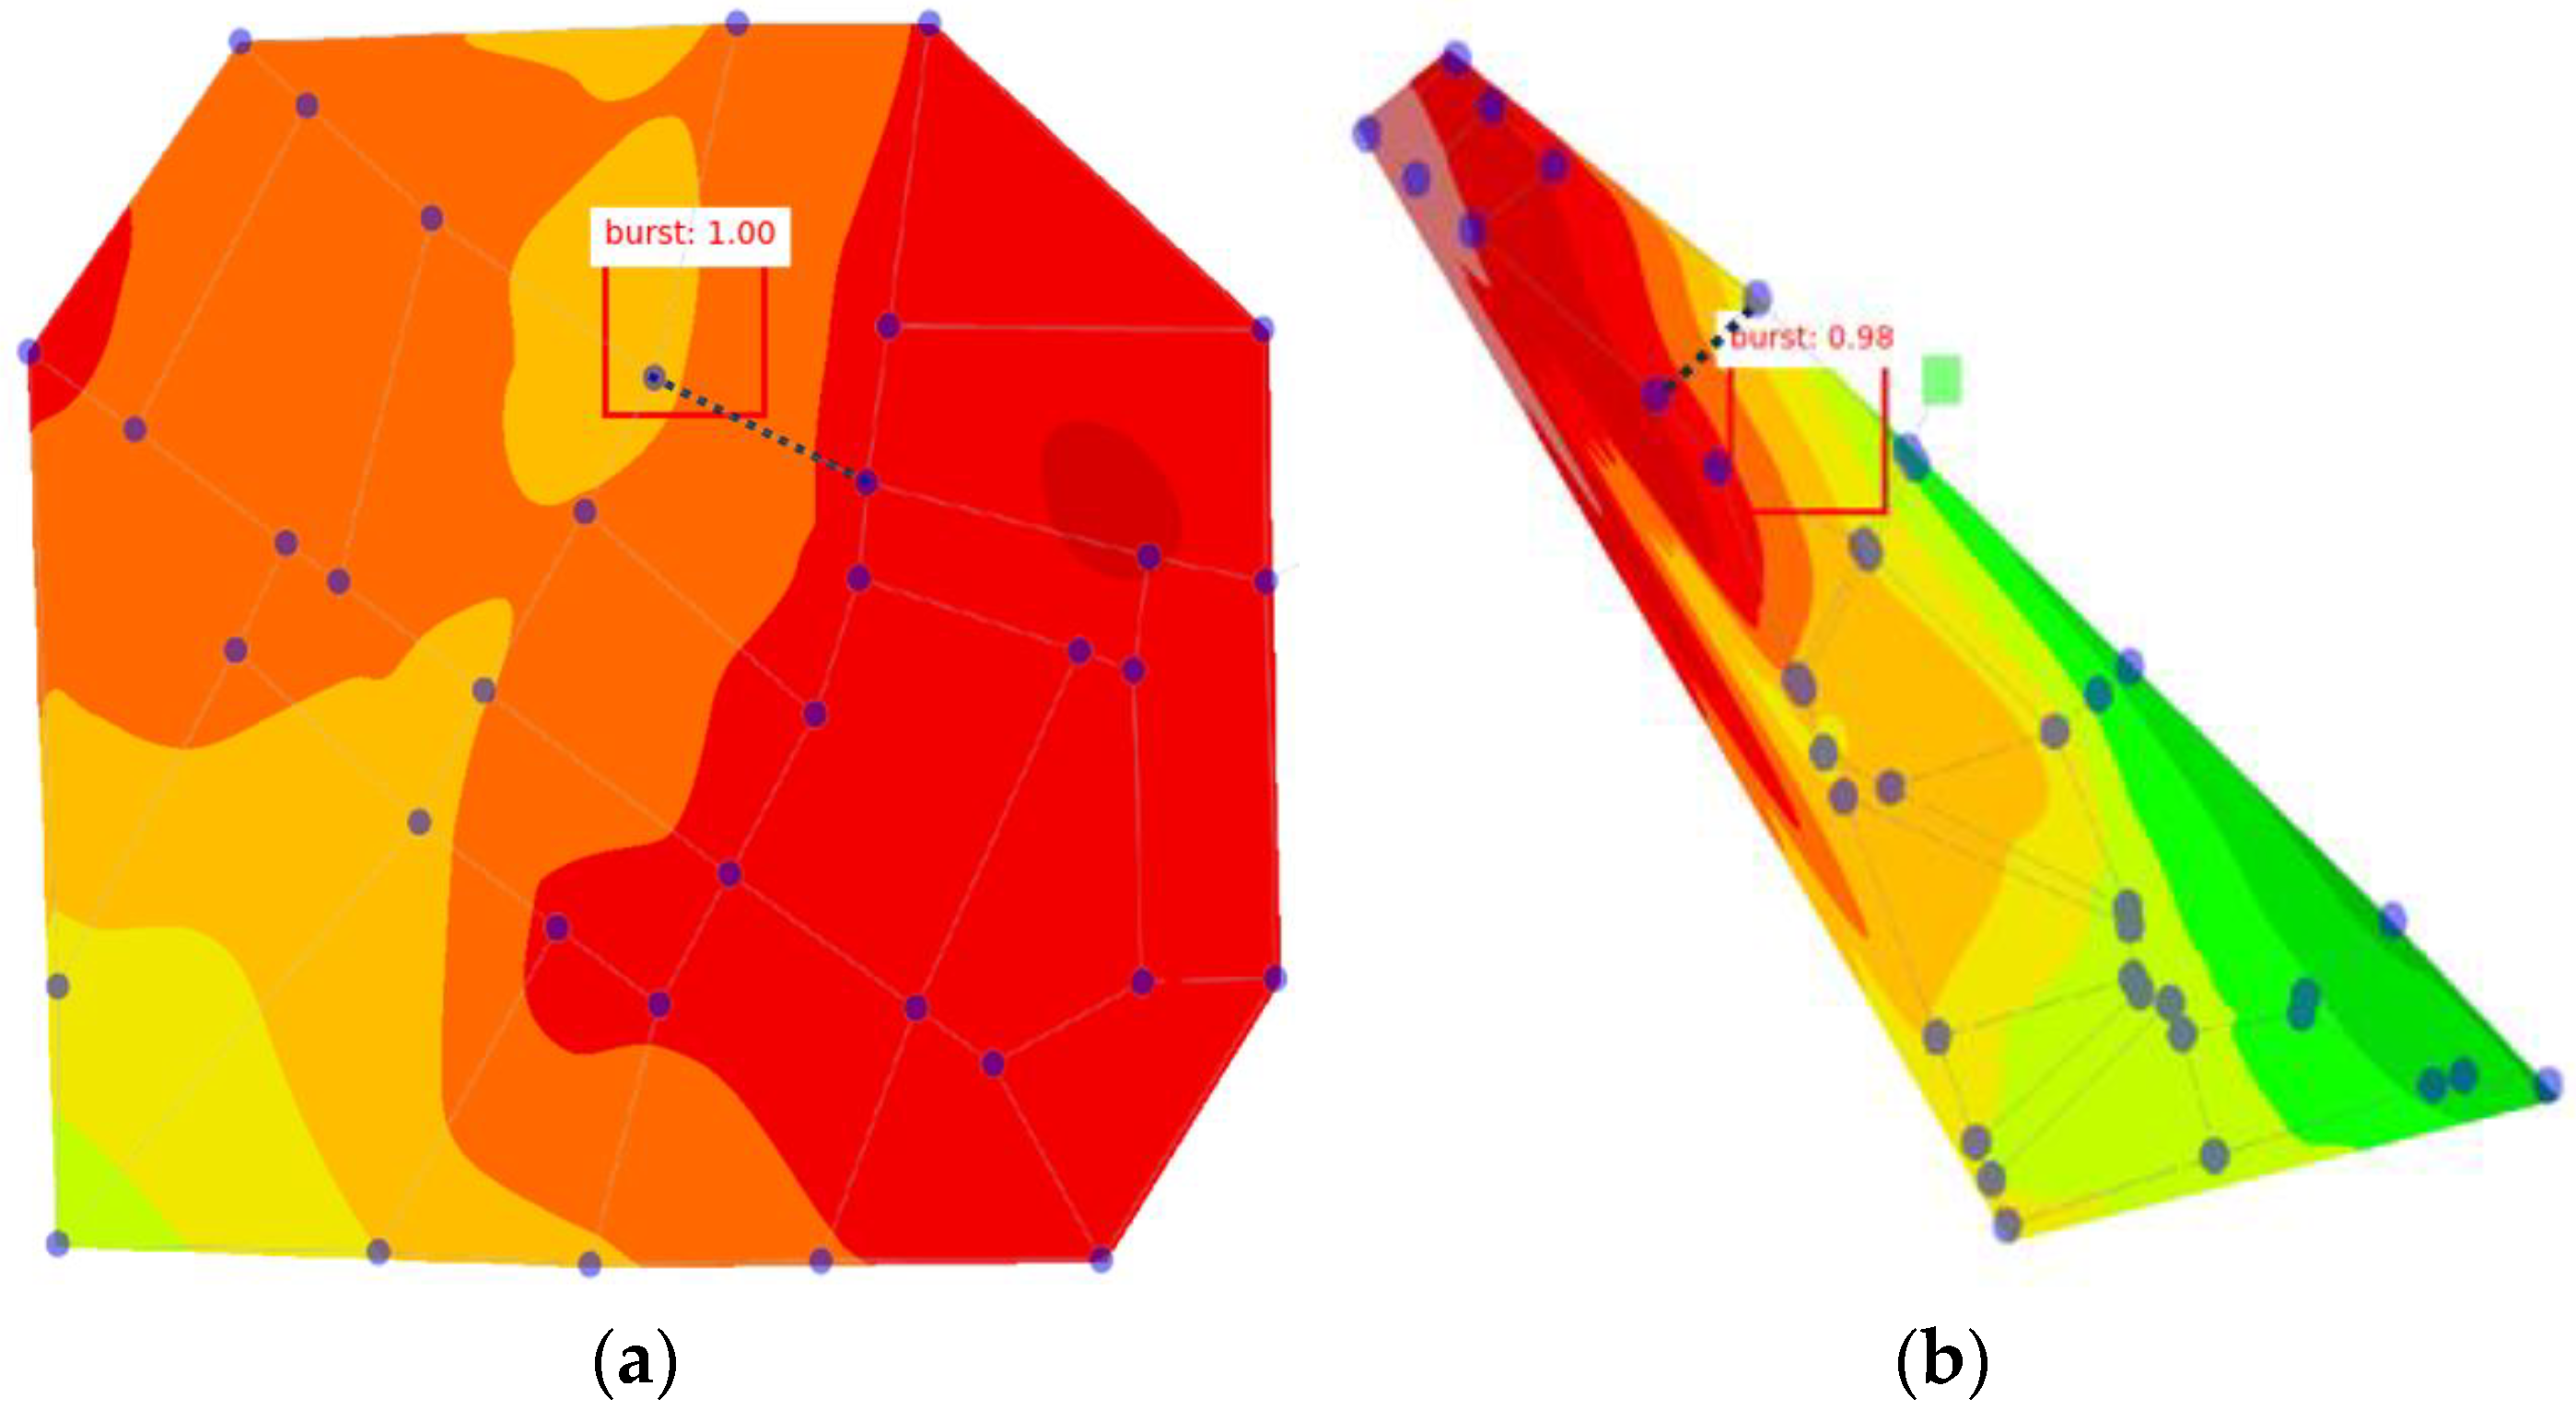
Figure 13b) further corroborated this observation, revealing a misalignment between the predicted and actual burst locations, despite the high confidence scores. These findings suggest overfitting or decreased generalization in highly instrumented and complex networks, such as CM53. The performance of the model improved with reduced sensor coverage, attributed to the elimination of noisy or conflicting features.
These contrasting behaviors based on the PR curves and spatial visualizations are shown in
Figure 12 and
Figure 13, respectively. The curve of the Fossolo network remained positioned near the top-right corner, even at a 50% sensor density, and its spatial detection (
Figure 13a) closely aligned with the actual burst pipe, validating strong generalization capabilities. In contrast, in the CM53 network, the bounding box predictions significantly deviated from the ground truth, highlighting that spatial complexity and signal overlap posed additional challenges for the model.
These insights reveal that merely increasing the number of sensors does not automatically improve detection performance. Rather, spatial informativeness and sensor placement are more critical than the number of sensors. In complex systems, optimal sensor configurations, rather than maximal density, should be prioritized to minimize redundancy and enhance generalization.
This study was based on simulation-generated data; however, hydraulic simulations of WDNs generally exhibit slight discrepancies from field measurements when the models are reasonably calibrated. Because WDNs typically operate under fully pressurized-pipe conditions, the governing hydraulic equations are well defined, and, when roughness coefficients and demand patterns are calibrated, the deviation between simulated and observed pressures is often within a few percentage points. Accordingly, training and validation in a simulated environment still ensure practical applicability in real-world settings. In addition, unlike previous CNN-based approaches that convert pressure data into simple time-series graphs or heatmaps—thereby mainly increasing data volume without preserving spatial dependencies—this study transformed pressure fields into contour images that simultaneously retained both magnitude and spatial distribution. This representation enables the preservation of localized pressure patterns and, when integrated with a region-based object detection algorithm such as Faster R-CNN, facilitates accurate burst localization and enhances interpretability. Furthermore, at the DMA-scale WDN considered in this study, the selected image resolution was sufficient to distinguish pipes and bursts without multiple elements overlapping into a single pixel, thus maintaining model generalization. The proposed framework specifically targeted single-burst scenarios within DMA-scale subnetworks, where its practical utility was convincingly demonstrated.
In summary, the proposed framework demonstrated scalability and adaptability to diverse WDN geometries and sensor layouts. Although all WDNs benefited from this approach, the degree of improvement was influenced by the topological simplicity, sensor deployment quality, and distinctiveness of the pressure signatures. Future research should focus on optimizing the sensor placement strategies and refining localization accuracy through the implementation of spatial attention mechanisms or advanced regression modules.
5. Conclusions
In this study, a novel framework for burst detection and localization in WDNs was developed by integrating hydraulic pressure image encoding with a faster R-CNN-based deep-learning model. The framework was validated on three real-world WDNs (Fossolo, PB23, and CM53) under different sensor coverages (100%, 75%, and 50%).
The results showed that the proposed model consistently achieved high detection accuracy and generalization performance, even under reduced sensor deployments. In the Fossolo and PB23 WDNs, the performance remained stable across all coverage scenarios, indicating robustness to sensor sparsity. In contrast, in the CM53 network, the model demonstrated enhanced performance as sensor coverage decreased, suggesting that excessive sensor density may introduce redundancy or noise, reducing model generalization. These findings indicate that burst detection performance is influenced not only by the number of sensors, but also by the spatial informativeness of sensor placement and network complexity. It should be emphasized that this study analyzed DMA-scale sub-networks under single-burst conditions, where sensor coverage assumptions of 100%, 75%, and 50% are realistic. This single-burst assumption is a methodological limitation, but it reflects realistic burst behavior in DMA-scale systems and aligns with the intended scope of establishing a baseline detection and localization framework. Extending the approach to simultaneous multi-burst scenarios remains a valuable direction for future research. Although larger real-world networks often exhibit lower sensor densities, the DMA-level analysis adopted in this study ensures that such coverage levels are not impractical. Overall, the proposed framework yielded an effective, scalable, and infrastructure-agnostic solution for automated burst detection in WDNs. Its ability to maintain strong performance under partial observability and across various network configurations highlights its practical utility for smart water management.
Future research should investigate the following: (1) optimization-based sensor placement to enhance performance with minimal instrumentation; (2) spatiotemporal extensions of the framework using models, such as 3D CNNs or Transformers to support multitime point or sequence-based detection; (3) improved localization through fine-grained bounding box regression or attention-based refinement modules; (4) real-world validation using supervisory control and data acquisition systems or field sensor data in operational settings; (5) extension of the applicability of the framework beyond DMA-scale and single-burst analysis to multiburst and large-scale networks with sparse instrumentation.
