Article

An Analytical Solution for the Stability Evaluation of Anti-Dip Layered Rock Slopes Under Water-Level Fluctuations in Reservoirs

1
State PowerChina Zhongnan Engineering Corporation Limited, Changsha 410014, China
2
State Key Laboratory of Hydraulic and Mountain River Engineering, College of Water Resource and Hydropower, Sichuan University, Chengdu 610065, China
*
Author to whom correspondence should be addressed.
Water 2025, 17(23), 3375; https://doi.org/10.3390/w17233375
Submission received: 9 October 2025 / Revised: 21 November 2025 / Accepted: 23 November 2025 / Published: 26 November 2025
(This article belongs to the Section Hydrogeology)

Abstract

Significant fluctuations in reservoir water levels occur seasonally during the flood period, adversely affecting the stability of bank slopes. In this paper, a modified mechanical model for the flexural toppling of anti-dip rock slopes under water level fluctuations is established, and an actual deflection equation for rock slabs is derived. The critical length for the flexural toppling failure of rock slabs is calculated, which can be used to evaluate slope stability. Multiple linear regression analysis reveals the relative degree of the influence of each parameter (such as rock slab thickness, rock layer dip angle, water level height, etc.) on the critical length. The results indicate that rock slab thickness plays a controlling role in slope stability. The failure mechanisms of the slope under the influence of water level fluctuations are revealed through fluid–solid coupling numerical simulations. The results indicate that the rise in water level reduces the strength of the rock mass in the submerged zone and generates significant water pressure on the rock mass at the slope toe, leading to its cracking. A rapid drop in water level generates seepage forces detrimental to slope stability and carries away fractured rock particles at the slope toe, ultimately causing slope failure. Finally, the reliability and applicability of the proposed method are validated through numerical simulations, case studies, and comparisons with existing analytical solutions.

1. Introduction

A rock slope characterized by layers whose strike is nearly parallel to the slope surface but with an opposing dip direction is known as an anti-dip slope [1]. Toppling failure is regarded as one of the significant types of slope failure [2] and frequently occurs in anti-dip layered rock slopes [3]. The concept of toppling was initially introduced by Ashby [4]. Subsequently, Goodman and Bray [5] classified toppling failure modes and identified three distinct patterns of primary toppling deformation, i.e., flexural toppling, block toppling, and block-flexural toppling. Toppling failures are commonly observed in engineering activities, e.g., hydropower development, mining, and road construction, which significantly influence these projects [6]. As a result, numerous studies have been carried out to reveal the failure mechanism of toppling and to evaluate their stability.
Physical model testing provides an effective method for exploring the flexural toppling failure mechanisms. Commonly used test methods include base friction experiments [4,6], shaking table experiments [7,8], and centrifuge model tests [9,10]. However, it is challenging to accurately replicate the mechanical properties of discontinuous materials during the model construction phase, and these experiments often require considerable time and resources [11]. Therefore, scholars usually employ numerical simulation methods to supplement relevant research.
Numerical simulation is also a common approach for studying toppling failure. Among these methods, the Finite Element Method (FEM) offers significant advantages in representing the internal stress distribution of toppled slopes. Adhikary and Dyskin [12] as well as Sarfaraz and Amini [13] employed this method to investigate the failure mechanism of toppling deformation. The Discrete Element Method (DEM) is effective in reproducing the failure patterns during the slope toppling process. Cui et al. [14] and You et al. [15] applied DEM to investigate the deformation mechanisms and modes of toppling slopes. In addition, the Discontinuous Deformation Analysis (DDA) method also exhibits significant advantages in the simulation of the toppling instability process [16].
Compared to physical model testing and numerical simulations, analytical methods require the least resources and are easier to parameterize. Two representative approaches have been proposed for calculating the stability of toppling. One method is the analytical method for block toppling, which was developed based on the limit equilibrium theory [5]. Another method, proposed by Aydan and Kawamoto [17], is based on the cantilever beam theory and is suitable for evaluating the flexural toppling stability. Building on the theory of Aydan and Kawamoto, researchers have further developed numerous calculation methods for flexural toppling stability [18].
Considering the differences in bending resistance across various rock layers, Amini et al. [19] and Wang et al. [20] proposed new stability evaluation methods based on the deformation coordination of the rock layers. Furthermore, Majdi and Amini [21] proposed an evaluation criterion to assess the flexural toppling stability of rock masses with geo-structural defects. Zhang et al. [22] classified toppling slopes into zones and developed an analytical method to calculate both the stability factor of slopes and the extent of each zone. Wang et al. [23] obtained the local failure probability of toppling slopes through iterative calculations. Sarfaraz [24] defined Sarma’s method and subsequently developed an analytical solution to assess the stability of flexural toppling based on it. Li et al. [25] presented a stability evaluation method for flexural toppling that combines the principle of energy conservation with catastrophe theory. Zheng et al. [26] explored the effect of seismic inertial forces on flexural toppling stability. Jin et al. [27] quantitatively assessed slope stability by calculating the critical length of the flexural toppling rock slab.
In recent years, with the construction of large-scale hydropower stations in China, the stability of reservoir bank slopes has attracted increasing attention. Water level fluctuations are considered one of the main triggering factors for the instability of reservoir bank slopes, and extensive research has been conducted in the academic community on this issue. In terms of experimental research, Zhu et al. [28] have indicated that the strength of water-saturated rock samples is reduced through laboratory experiments. In addition, many scholars have conducted wet–dry cycle experiments, suggesting that the tensile strength [29], compressive strength [30], deformation modulus [31], and shear strength [32] of rocks gradually decrease with the increase in the number of cycles. Teng et al. [33] investigated the softening effect of water injection on the sandstone roof using experimental and numerical simulation methods. At the same time, some scholars have explored the impact of reservoir water level fluctuations on slope stability through case studies. Cai et al. [34] and Jin et al. [35] suggested that reservoir impoundment leads to a reduction in the strength of slope rock masses, thereby exacerbating slope deformation. Pan et al. [36] and Shan et al. [37] proposed that fluctuations in reservoir water levels alter the internal stress state of the slope, thereby weakening the stability of the slope.
Additionally, certain progress has been made in the analytical methods for evaluating the stability of anti-dip slopes under reservoir water level fluctuation conditions. Roy and Maheshwari [38] established a probabilistic analysis method for calculating block toppling stability that considers pore water pressure. Bowa and Gong [39] derived an analytical solution for the calculation of slide head toppling stability in jointed rock slopes under the action of groundwater. Zhou et al. [40] developed a method for evaluating slope stability that accounts for the dynamic action of groundwater. Lin et al. [41] considered the strength softening of the geotechnical body and the water pressure between rock columns under the action of reservoir water, and they proposed a stability evaluation model for anti-dip slopes. Chaudhary et al. [42] explored the influence of three different hydraulic distribution forms on the block toppling stability of slopes and developed corresponding stability calculation formulas for each hydraulic distribution form.
It is worth noting that scholars primarily use trigonometric functions to approximate the deflection curves of rock slabs when establishing analytical methods to evaluate the stability of layered rock slopes [25,43,44]. Currently, no scholars have calculated the stability of anti-dip slopes on reservoir banks by solving the actual deflection equation of rock layers subjected to water level fluctuations. If the true deflection equation of rock layers can be derived, it would help improve the accuracy of slope stability calculations.
In this paper, an actual deflection equation of rock slabs under the influence of water level fluctuations is derived. Based on this deflection equation, the critical length of rock slabs is calculated to assess their failure potential. The relative degree of the influence of each parameter on the critical length is revealed through multiple linear regression analysis, thereby providing a theoretical basis for the optimized design of engineering support measures. The failure evolution process of the slope under conditions of water level fluctuations is investigated through a coupled simulation of the Discrete Element Method (DEM) and the finite volume method partial differential equation solver (Fipy). Finally, the reliability and applicability of the proposed method are validated through case studies, numerical simulations, and comparisons with existing analytical solutions. The novelty of this paper lies in the dynamic coupling of hydraulic–mechanical interactions, specifically in formulating time-dependent water pressure effects (hydrostatic and transient seepage forces) with the flexural toppling deformation of layered rock masses.

2. Theoretical Analyses

2.1. Mechanical Model

Reservoir bank slope stability is often affected by fluctuations in water levels. During the process of reservoir impoundment, water infiltration into the bank slope requires considerable time because of the rock’s low permeability. The submerged zone generates water pressure that is perpendicular to the rock layers and directed inward toward the slope (Figure 1b), which helps preserve the slope stability. However, water within the slope cannot be discharged promptly when the water level drops rapidly. Owing to the retention of water in the original submerged area, water pressure is generated perpendicular to the rock layers and directed outward from the slope (Figure 1c), which reduces the slope stability. The theoretical derivation in this paper primarily discusses the case of a rapid water level drop. For the case of rising water levels, it is sufficient to assign a negative value to the water pressure and analyze it using the same methodology.
The flexural toppling deformations under the influence of water level fluctuations are highly complex, and some reasonable assumptions should be employed to simplify the analysis. The mechanical model of the toppling slope is shown in Figure 1a. The fundamental assumptions are as follows: (1) Due to the fact that both the length and width of the flexural toppling rock slab are significantly greater than its thickness, flexural toppling can be regarded as a plane strain problem. (2) Rock slabs that undergo flexural toppling deformation are regarded as interacting cantilever beams [25,40]. (3) The basal plane of the slope (The fixed end of the cantilever beam) is perpendicular to the rock layers and originates at the toe [17,25]. (4) The maximum shear stress on the bedding plane is constrained by the Mohr-Coulomb criterion.

2.2. Deflection Equation

Jin et al. [27] derived the deflection equation for the rock slab under natural conditions. Based on this, the present study further extends the research by considering the effect of reservoir water fluctuations on the flexural toppling of the rock slab and deriving a new deflection equation that accounts for these fluctuations. The mechanical model of the rock slab, shown in Figure 2a, is used to derive the deflection equation. A unit width of 1 m was used in the study of the rock slab. The mechanical analysis of rock slabs above and below the water level is shown in Figure 2b and Figure 2c, respectively.
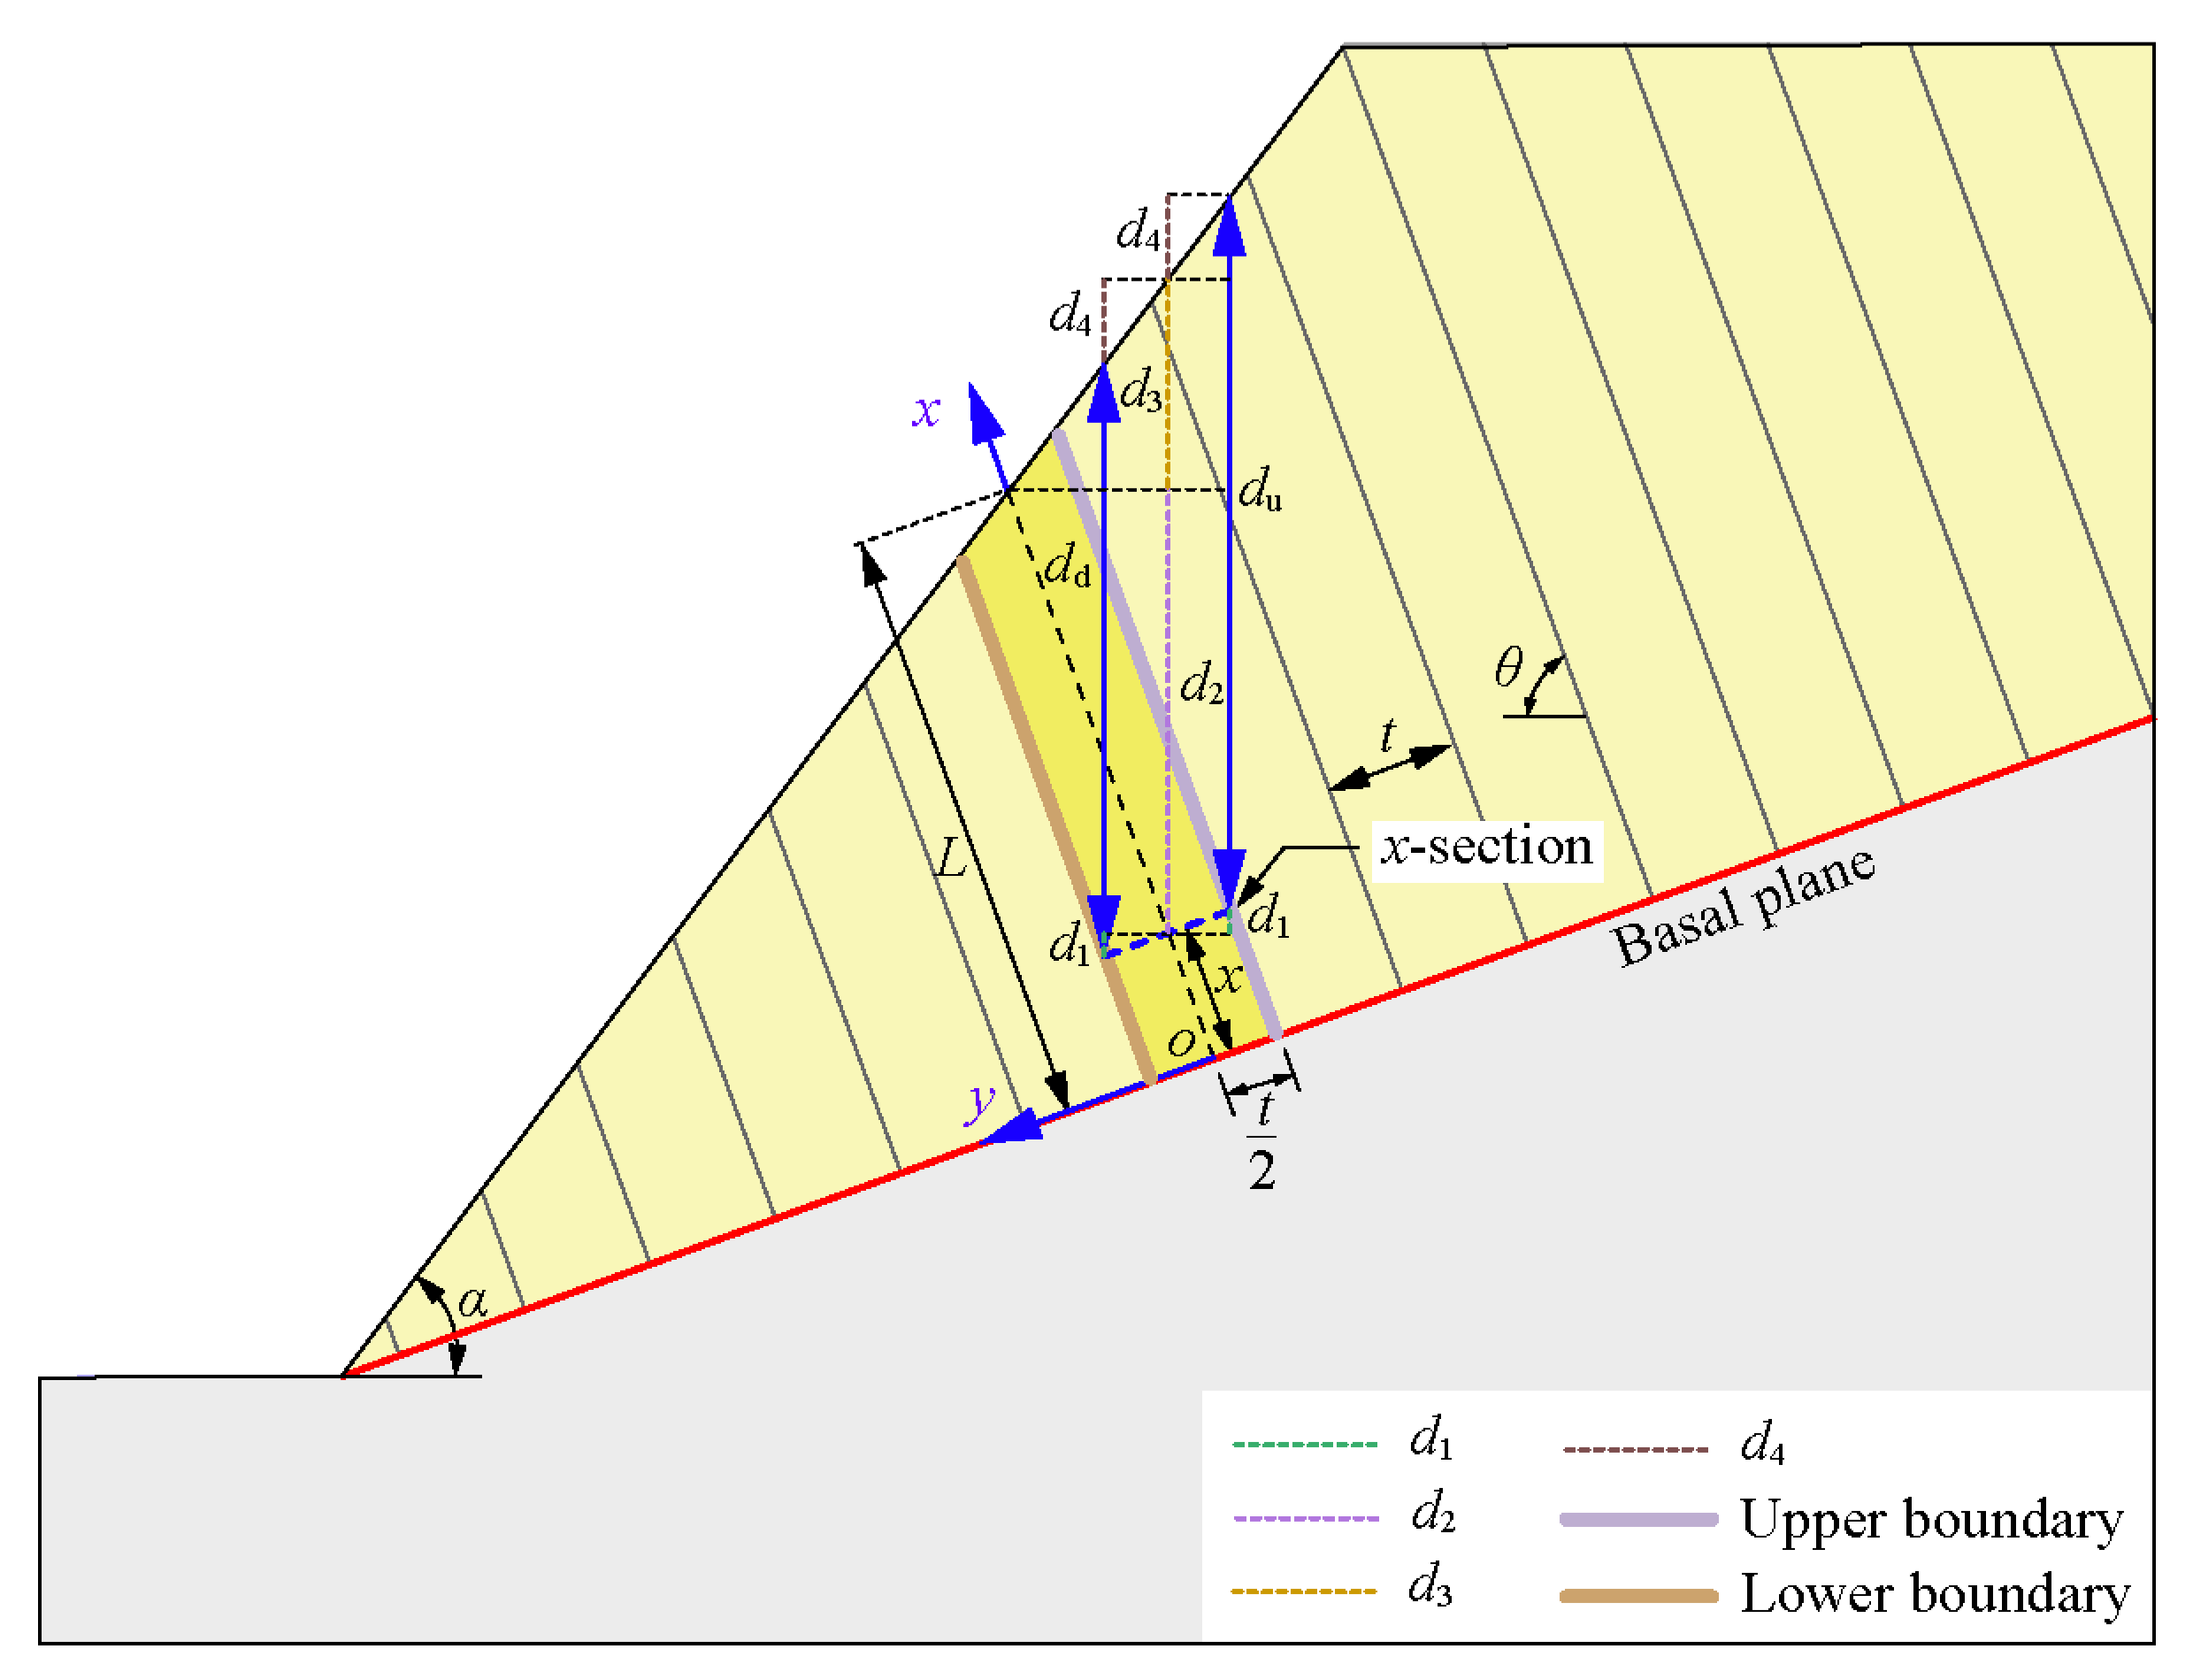
In nature, the self-weight of a slope is a primary factor contributing to its deformation. The stress state of the rock mass within the slope is related to its burial depth. The burial depth from the upper and lower boundaries of the x-section of the rock slab to the slope surface is represented by the vertical distance, as shown in Figure 1a and Figure 3.
According to the geometric analysis of Figure 3, the vertical distance from the slope surface to the x-section of the rock slab is divided into four parts, namely d1, d2, d3, and d4. The length of each part can be represented as
d 1 = t 2 cos θ d 2 = L x sin θ d 3 = L x cos θ tan α d 4 = t 2 sin θ tan α
Then, the vertical distance from the slope surface to the x-section of the rock slab can be represented as
d u x = d 2 + d 3 d 1 + d 4 = L x sin α + θ cos α t 2 cos θ + t 2 sin θ tan α d d x = d 2 + d 3 + d 1 d 4 = L x sin α + θ cos α + t 2 cos θ t 2 sin θ tan α .
where du(x) and dd(x) are the vertical distances from the slope surface to upper boundary and lower boundary of the rock slab, respectively, t is the single-layer rock slab thickness, θ is rock layer dip angle, L is the total length of the rock slab, and α is the slope angle.
The vertical stress acting on the boundaries of the rock slab can be expressed as
d σ vu = ρ g d u x d x d σ vd = ρ g d d x d x
where dσvu and dσvd are the vertical stress acting on the upper boundary and lower boundary of the rock slab, respectively, ρ is the rock mass density, and g is the acceleration of gravity.
The coefficient of lateral pressure is given by
K = μ 1 μ
where μ represents the rock Poisson’s ratio.
The horizontal stresses acting on the boundaries of the rock slab are expressed as
d σ hu = K d σ vu d σ hd = K d σ vd
where dσhu and dσhd are the horizontal stress acting on the upper boundary and lower boundary of the rock slab, respectively.
According to the above analysis, Mohr’s circle method in material mechanics can be applied to calculate the normal stress and shear stress acting on the boundaries of the rock slab. The stress acting on the upper boundary of the rock slab is
d σ u = d σ vu + d σ hu 2 + d σ vu d σ hu 2 cos 2 θ d τ u = d σ vu d σ hu 2 sin 2 θ
where dσu is the normal stress and dτu is the shear stress.
The stress acting on the lower boundary of the rock slab is
d σ d = d σ vd + d σ hd 2 + d σ vd d σ hd 2 cos 2 θ d τ d = d σ vd d σ hd 2 sin 2 θ
where dσd is the normal stress and dτd is the shear stress.
During the deformation process of the slope, the rock slabs undergo dislocation, and the frictional resistance at the boundaries of the rock slab will prevent its toppling. This frictional resistance can be expressed as
d f u = σ u tan φ + c d x d f d = σ d tan φ + c d x
where dfu and dfd are the frictional resistance acting on the upper boundary and lower boundary of the rock slab, respectively, φ is the bedding plane friction angle, and c is the bedding plane cohesion.
The self-weight is
d G = ρ g t d x
The water pressure acting on the upper boundary of the rock slab below the water level is
d w = L w x γ w sin θ d x
where Lw is the rock slab’s length below the water level, and γw is the volumetric weight of water.
The additional bending moment, generated by the combined effects of the self-weight, the normal stress and frictional resistance on the rock slab boundaries, and the water pressure, will induce deformation in the rock layer.
The bending moment induced by the self-weight is
M G = x L ρ g t cos θ L x d x
The bending moment induced by the normal stress is
M n = x L σ u σ d L x d x
The bending moment induced by the frictional resistance is
M f = x L f u + f d t 2 d x
Below the water level, the bending moment induced by the water pressure is
M w = x L W w L w x d x
In summary, the total bending moment at the x-section of the rock slab below the water level is
M d = M G + M w + M n M f
The total bending moment at the x-section of the rock slab above the water level is
M u = M G + M n M f
According to the principles of the mechanics of materials, the ratio of the bending moment to the stiffness is equal to the second derivative of the deflection equation, as shown in Equation (17).
d 2 y d x 2 = M E I
By substituting the total flexural moment equations for the rock slab below the water level and for the rock slab above the water level into Equation (17), the second-order differential equation of the rock slab can be obtained.
The differential equation of the rock slab below the water level is
d 2 y d x 2 = 1 E I x L ρ g t cos θ L x + σ u σ d L x t 2 f u + f d d x + x L w w L w x d x
The differential equation of the rock slab above the water level is
d 2 y d x 2 = 1 E I x L ρ g t cos θ L x + σ u σ d L x t 2 f u + f d d x
By solving the differential equation (Equation (18)), the deflection equation of the rock slab below the water level can be obtained, as shown in Equation (20).
y d ( x ) = C 1 + C 2 x + 1 240 E I α 1 x 2 + α 2 x 3 + α 3 x 4 + α 4 x 5
where
α 1 = 10 4 sin θ L w 3 γ w + 3 t sin θ L 2 γ 1 + K tan α K 1 sec α sin α + 2 θ 12 t c L + 3 t L 2 γ K cos 2 θ cos 2 θ K 1 sec α sin α + θ tan φ .                                                  
α 2 = 20 2 t c 2 sin θ L w 2 γ w t L γ sin θ K + 1 tan α K 1 sec α sin α + 2 θ + t L γ 1 + K K cos 2 θ + cos 2 θ sec α sin α + θ tan φ                                                                                                    
α 3 = 5 4 sin θ L w γ w t γ sin θ K 1 sec α sin α + 2 θ + t γ sin θ K + 1 tan α + t γ K cos 2 θ cos 2 θ K 1 sec α sin α + θ tan φ .                                                                                                
α 4 = 4 γ w sin θ
where C1 and C2 are undetermined coefficients.
By solving the differential equation (Equation (19)), the deflection equation of the rock slab above the water level can be obtained, as shown in Equation (25).
y u ( x ) = C 3 + C 4 x + 1 96 E I β 1 x 2 + β 2 x 3 + β 3 x 4
where
β 1 = 12 t L 1 + K L γ sin θ tan α 4 c L γ sec α K 1 sin θ sin α + 2 θ + L γ sec α K cos 2 θ cos 2 θ 1 K sin α + θ tan φ .                                                                      
β 2 = 8 t 2 c 1 + K L γ sin θ tan α + L γ sec α K 1 sin θ sin α + 2 θ + L γ sec α 1 + K K cos 2 θ + cos 2 θ sin α + θ tan φ .                                                              
β 3 = 2 t γ sec α 1 + K sin α sin θ K 1 sin θ sin α + 2 θ + K cos 2 θ cos 2 θ 1 K sin α + θ tan φ .                                                        
where C3 and C4 are undetermined coefficients.
According to the assumed conditions, the rock slab undergoing flexural toppling deformation is regarded as a cantilever beam. Therefore, at the fixed end of the cantilever beam, both the deflection and the deflection angle must be zero. Therefore, the deflection equation below the water level should satisfy the following boundary conditions when x equals zero:
y d ( 0 ) = 0 y d ( 0 ) = 0
By substituting the boundary condition Equation (29) into the deflection equation, Equation (20), below the water level, it can be concluded that C1 = 0 and C2 = 0.
The deflection equation must be continuous at the water level interface. Therefore, the deflection equation above the water level should satisfy the following boundary conditions when x = Lw.
y u ( L w ) = y d ( L w ) = ς y u ( L w ) = y d ( L w ) = υ
where ς is the deflection value at section Lw, and υ is the deflection angle at section Lw.
By substituting the boundary condition Equation (30) into the deflection equation, Equation (25), above the water level, it can be concluded that
C 3 = 1 48 E I 8 t c L w 2 2 L w 3 L + 6 E I ς L w υ + 6 L 2 8 L L w + 3 L w 2 t L w 2 ζ
C 4 = 1 12 E I 6 t c L w 2 L L w + 12 E I υ 3 L 2 3 L L w + L w 2 t L w ζ
where
ζ = γ sec α K cos 2 θ cos 2 θ 1 K sin α + θ tan φ K 1 sin θ sin α + 2 θ + 1 + K sin θ tan α .                                          
On the basis of the above analysis, the complete deflection equation for flexural toppling deformation under water pressure is a piecewise function, as shown below.
y ( x ) = y d ( x ) x L w y u ( x ) x > L w

2.3. Critical Length

Owing to variations in the deflection equation and stress conditions of the rock slab above and below the water level, it is essential to consider two separate cases when calculating the critical length of a flexural toppling rock slab. One scenario is when the water level is sufficiently high, resulting in the critical length Lcr being less than the rock slab’s length below the water level Lw. In this case, it can be determined that the rock slab will fail, and only the portion below the water level needs to be analyzed. The other scenario is when the water level is relatively low, resulting in the critical length Lcr being greater than the rock slab’s length below the water level Lw. In this case, an analysis of the complete rock slab is required.
(1) Below the water Level
According to the principle of energy conservation, the strain energy of the rock slab is equal to the sum of the work done by the external forces. During the deformation process of the rock slab, the strain energy produced by shear or axial compression is minimal and is typically negligible [25,27].
The bending strain energy of the rock slab below the water level can be expressed as
V d = 0 x M d 2 2 E I d x
When the rock slab is curved, the displacement along the x-axis at any point below the water level is
Δ dx = 0 x 1 2 y d ( x ) 2 d x
The work performed by the self-weight in the x-direction is
W dGx = 0 x ρ g t sin θ Δ d x d x
The work performed by the self-weight in the y-direction is
W dGy = 0 x ρ g t cos θ y d ( x ) d x
The displacement at the boundaries of the rock slab below the water level is approximately equal to
Δ dy = t 2 y d ( x )
The work performed by the frictional resistance is
W df = 0 x f u + f d Δ dy d x
The work performed by the normal stress is
W dn = 0 x σ u σ d y d ( x ) d x
For the rock slab below the water level, the work performed by the water pressure is
W w = 0 x w y d ( x ) d x
The total work performed by external forces can be expressed as
W d = W dGx + W dGy + W d f + W dn + W w
The potential energy equation of the rock slab is as follows:
d ( x ) = 0 x M d 2 2 E I ρ g t sin θ Δ dx ρ g t cos θ y d ( x ) + f u + f d Δ dy σ u σ d y d ( x ) w y d d x
When the potential energy equation equals zero, the rock slab reaches the limit equilibrium state, from which the critical length for flexural toppling failure can be calculated.
d ( L dr ) = 0
The critical length for flexural toppling can be obtained by solving Equation (45). According to the calculation results, if Ldr < Lw, it indicates that the slab will undergo flexural toppling failure. If the equation has no solution or if Ldr > Lw, the stability of the slab cannot be determined, and an analysis of the complete rock slab is required.
(2) Analysis and calculation of the complete rock slab
The bending strain energy of the complete rock slab is
V i = 1 2 0 L w M d 2 E I d x + 1 2 L w x M u 2 E I d x
When the rock slab is slightly curved, the displacement along the x-axis at any point above the water level is
Δ ux = 0 x 1 2 y u ( x ) 2 d x
The work performed by the self-weight along the x-direction for the complete rock slab is
W iGx = 0 L w ρ g t sin θ Δ dx d x + L w x ρ g t sin θ Δ ux d x
The work performed by the self-weight along the y-direction for the complete rock slab is
W iGy = 0 L w ρ g t cos θ y d ( x ) d x + L w x ρ g t cos θ y u ( x ) d x
The displacement at the boundaries of the rock slab above the water level is approximately equal to
Δ uy = t 2 y u ( x )
For the complete rock slab, the work performed by the frictional resistance is
W i f = 0 L w f u + f d Δ d y d x + L w x f u + f d Δ uy d x
For the complete rock slab, the work performed by the normal stress is
W in = 0 L w σ u σ d y d ( x ) d x + L w x σ u σ d y u ( x ) d x
For the complete rock slab, the work performed by the water pressure is
W iw = 0 L w w y d ( x ) d x
The potential energy equation of the complete rock slab is as follows:
i ( x ) = V i W iGx W iGy + W i f W in W iw
When the potential energy equation equals zero, the critical length for flexural toppling failure can be calculated.
i ( L   cr ) = 0
The critical length for flexural toppling (Lcr) can be obtained by solving Equation (55). When Lcr < L, the rock slab is unstable; otherwise, it is in a stable state.
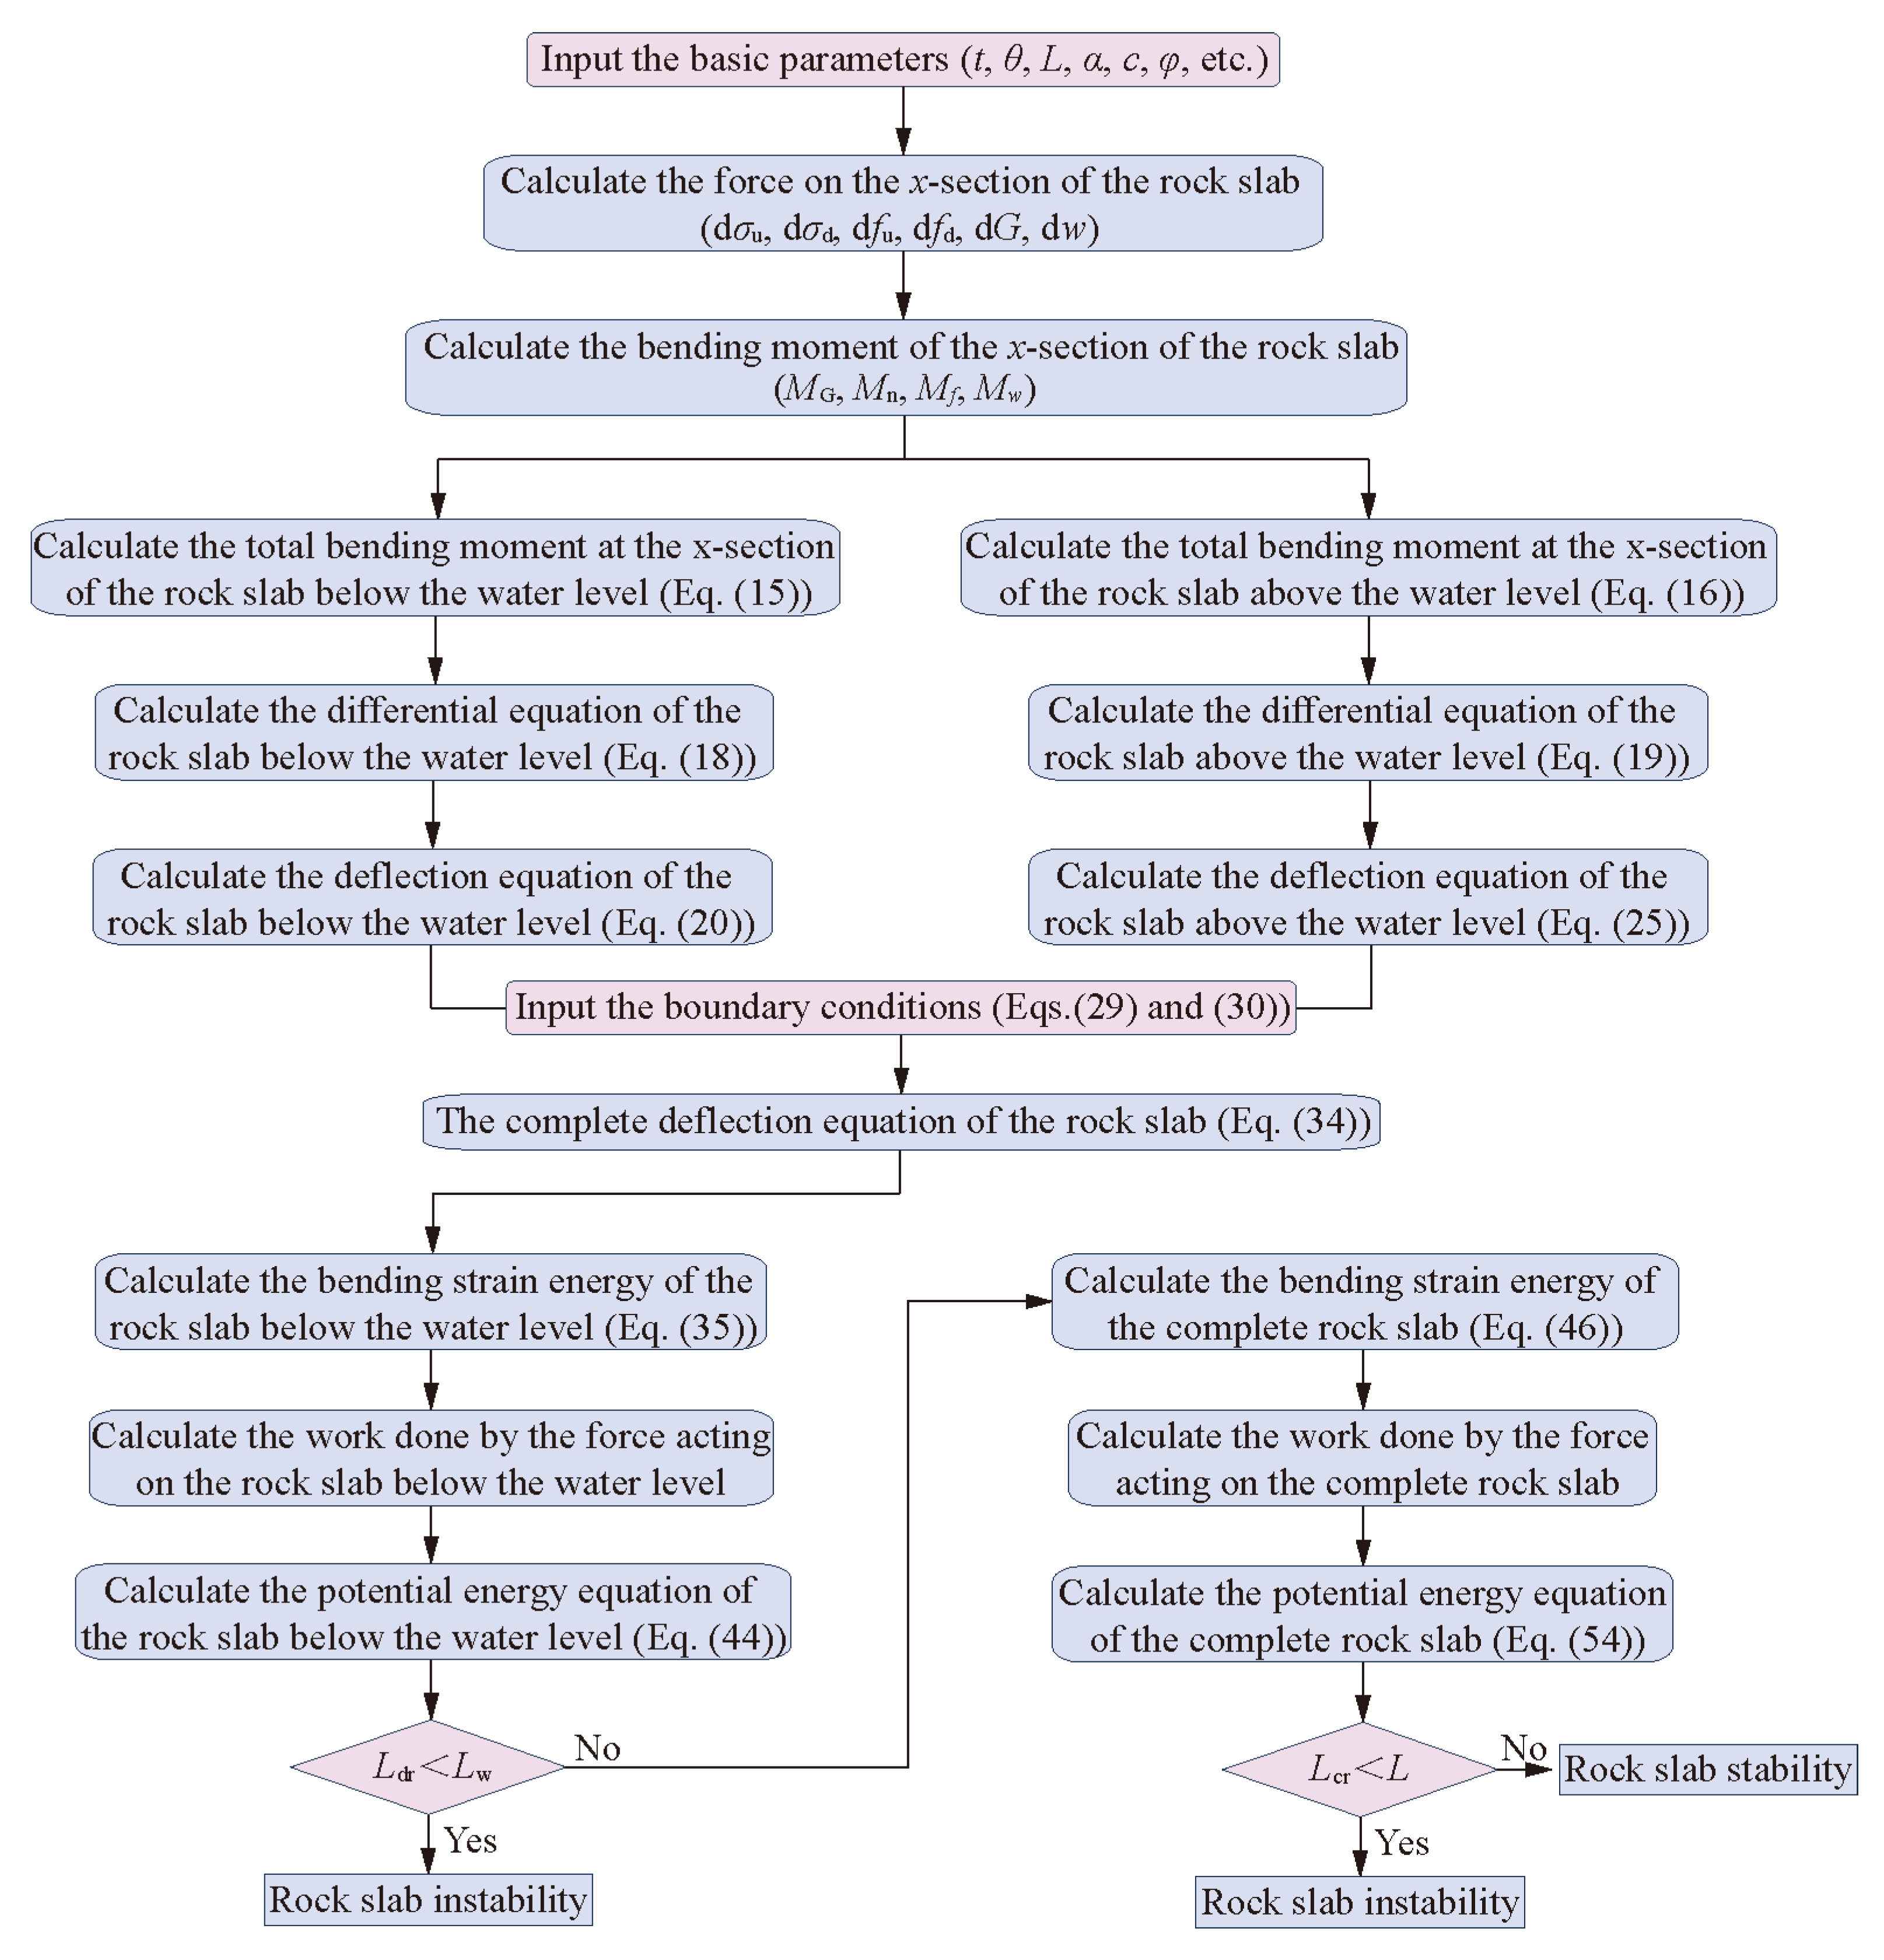
The flowchart of the computational process for the analytical method proposed in this paper is shown in Figure 4.

3. Parameter Analysis

3.1. Qualitative Discussion

The above analysis reveals that the critical length for the flexural toppling failure is affected by multiple parameters associated with the slope. The influence of each parameter on slope stability was revealed through the method of controlling variables. The results are shown in Figure 5. The variation trends between the parameters and the critical length are as follows:
(1) The critical length increases with the bedding plane friction angle and cohesion, and the rate of increase accelerates.
(2) The critical length gradually decreases with increasing slope angle and rock layer dip angle, and the rate of decrease diminishes.
(3) The critical length increases rapidly, but at a decreasing rate, as the rock slab thickness and the rock elastic modulus increase.
To clarify the impact of water level fluctuations on the critical length, a sensitivity analysis of the water level height was conducted using the method of controlling variables. The results are shown in Figure 6. The figure shows that the reductions in critical length are 0.79 m, 3.21 m, 6.86 m, and 8.00 m for each 10 m increase in the rock slab’s length below the water level. This indicates that the critical length decreases as the water level height increases, and the rate of change increases gradually.

3.2. Quantitative Discussion

To quantitatively evaluate the influence of each parameter, the multiple regression analysis method was used to construct mathematical models that relate multiple independent variables to the critical length. The extents of each parameter’s influence on the critical length were evaluated through the magnitude of the regression coefficients.
The relationship between the influencing factors and the critical length can be represented by the following multiple linear regression model.
L cr n = β 0 + β 1 c n + β 2 φ n + β 3 α n + β 4 θ n + β 5 t n + β 6 E n + β 7 L wn + ε n
where Lcrn is the critical length; cn, φn, αn, θn, tn, En and Lwn are the bedding plane cohesion, the bedding plane friction angle, the slope angle, the rock layer dip angle, the rock slab thickness, the rock elastic modulus, and the rock slab’s length below the water level, respectively; β1, β2, β3, β4, β5, β6 and β7 are the regression coefficients, which represent the weight of each parameter’s influence on the critical length; β0 is the intercept; and εn is the error term, which represents the unexplained random variable.
The regression coefficients were calculated using the least squares method. The formula is as follows:
β = X T X 1 X T Y
where
X = 1 c 1 φ 1 α 1 θ 1 t 1 E 1 L w 1 1 c 2 φ 2 α 2 θ 2 t 2 E 2 L w 2             1 c n φ n α n θ n t n E n L wn
Y = L cr 1   L cr 2     L cr n T
β = β 0   β 1   β 2   β 3   β 4   β 5   β 6   β 7 T
where β is the vector containing all the regression coefficients (including the intercept), X is the data matrix containing all the independent variables (including the intercept term 1), Y is the vector of dependent variables (critical length Lcr).
By substituting Equations (58) and (59) into Equation (57), the regression coefficient can be solved as
β = 87.7221 0.0272 0.6466 0.0780 0.6558 18.3950 0.2221 0.4838
According to the analysis of the regression coefficient matrix (Equation (61)), the bedding plane cohesion, the bedding plane friction angle, the rock slab thickness, and the rock elastic modulus are positively correlated with the critical length, whereas the slope angle, the rock layer dip angle, and the rock slab’s length below the water level are negatively correlated with the critical length. These findings are consistent with the conclusions of the previous qualitative analysis. Through a comparative analysis of the regression coefficients, the degree of influence of each parameter on the critical length can be clarified. The order of their importance is as follows: t > θ > φ > Lw > E > α > c.
The above study indicates that the influence of water pressure on slope stability is significant. When evaluating the stability of reservoir bank slopes, water pressure should be considered a crucial factor that cannot be overlooked. It is worth noting that the rock slab thickness has the most significant impact on slope stability. When the rock slab thickness increases by 1 m, the critical length will increase by 18.395 m. This result provides important insights for the treatment of flexural toppling deformation in anti-dip slopes. In practice, by effectively connecting multiple rock layers into an integrated whole using techniques such as rock bolts, the stability of the slope can be greatly enhanced. Additionally, optimizing slope gradient design and employing techniques such as shotcrete and grouting to fill bedding planes and enhance their bond strength are all effective measures to improve slope stability.

4. Numerical Simulation

4.1. Numerical Simulation Method

The failure evolution process of the slope under conditions of gradual water level rise followed by an instantaneous drop is investigated through the coupled simulation of the DEM and FiPy. The principle of the coupled simulation is as follows: In FiPy, the governing equations are established based on Darcy’s law and the continuity equation to solve for the spatial distribution of water head and its evolution over time. The Van Genuchten model is used to describe the unsaturated characteristics of the medium, calculate key hydrological parameters (such as saturation, water content, seepage force, etc.), and dynamically assign these values to DEM for coupling. Subsequently, iterations are performed in DEM to obtain the mechanical response of the particles under the current hydraulic conditions, and the results are fed back to FiPy to update the hydraulic parameters. This cyclical process enables real-time bidirectional coupling simulation of the water migration process and particle motion driven by hydraulic forces, thereby simulating the evolution of anti-dip rock slopes under the influence of reservoir water fluctuations.

4.2. Numerical Model

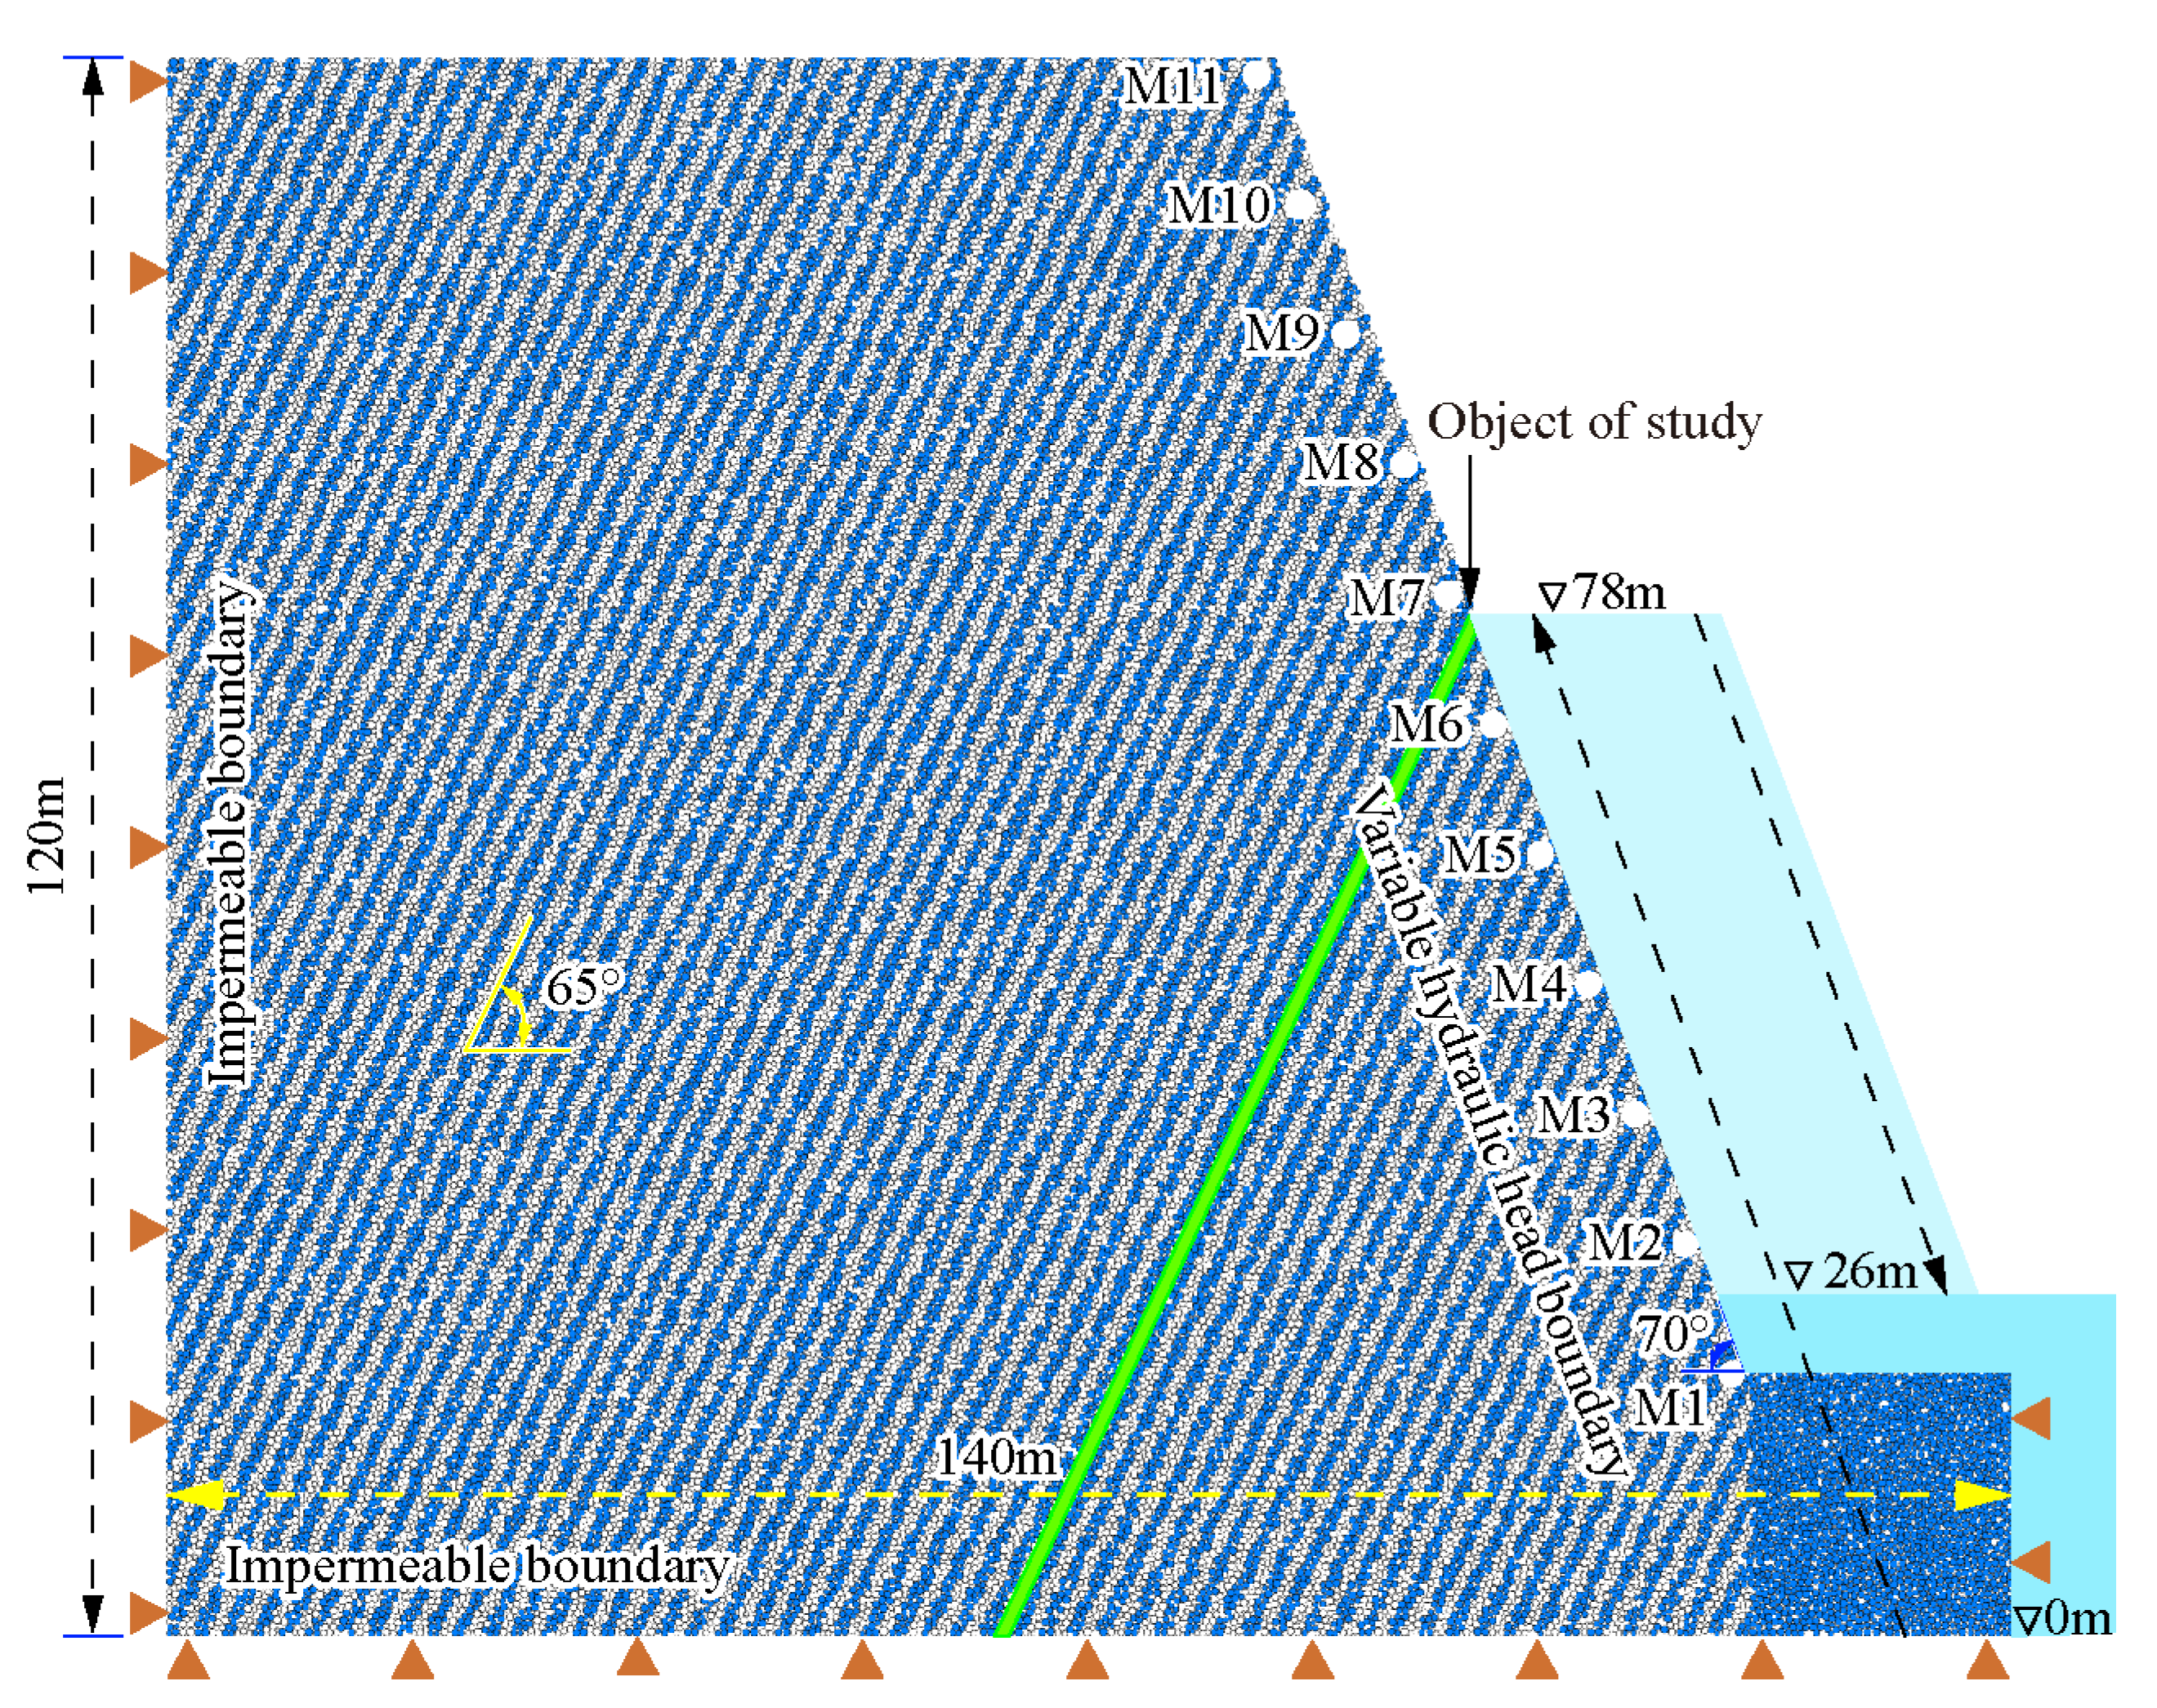
Firstly, a slope particle model of 120 m × 140 m is constructed. The rock slab thickness is 1.0 m, the slope angle is 70°, and the rock layer dip angle is 65°. In this model, the rock mass is set as a Linear Parallel Bond Model, and the bedding planes are set as a Linear Model. The interior of the model is filled with particles ranging in diameter from 0.2 m to 0.32 m, with a porosity of 0.1. Subsequently, a finite volume seepage network corresponding to the particle model is constructed. The final numerical model obtained by coupling the two is shown in Figure 7. During the computation process, the normal displacements at the bottom boundary and the left and right boundaries of the model are constrained by the base plate and side walls, respectively. In addition, to simulate water level fluctuations, the left and bottom boundaries are set as impermeable boundaries, while the right slope surface is set as a variable hydraulic head boundary.

4.3. Parameter Calibration

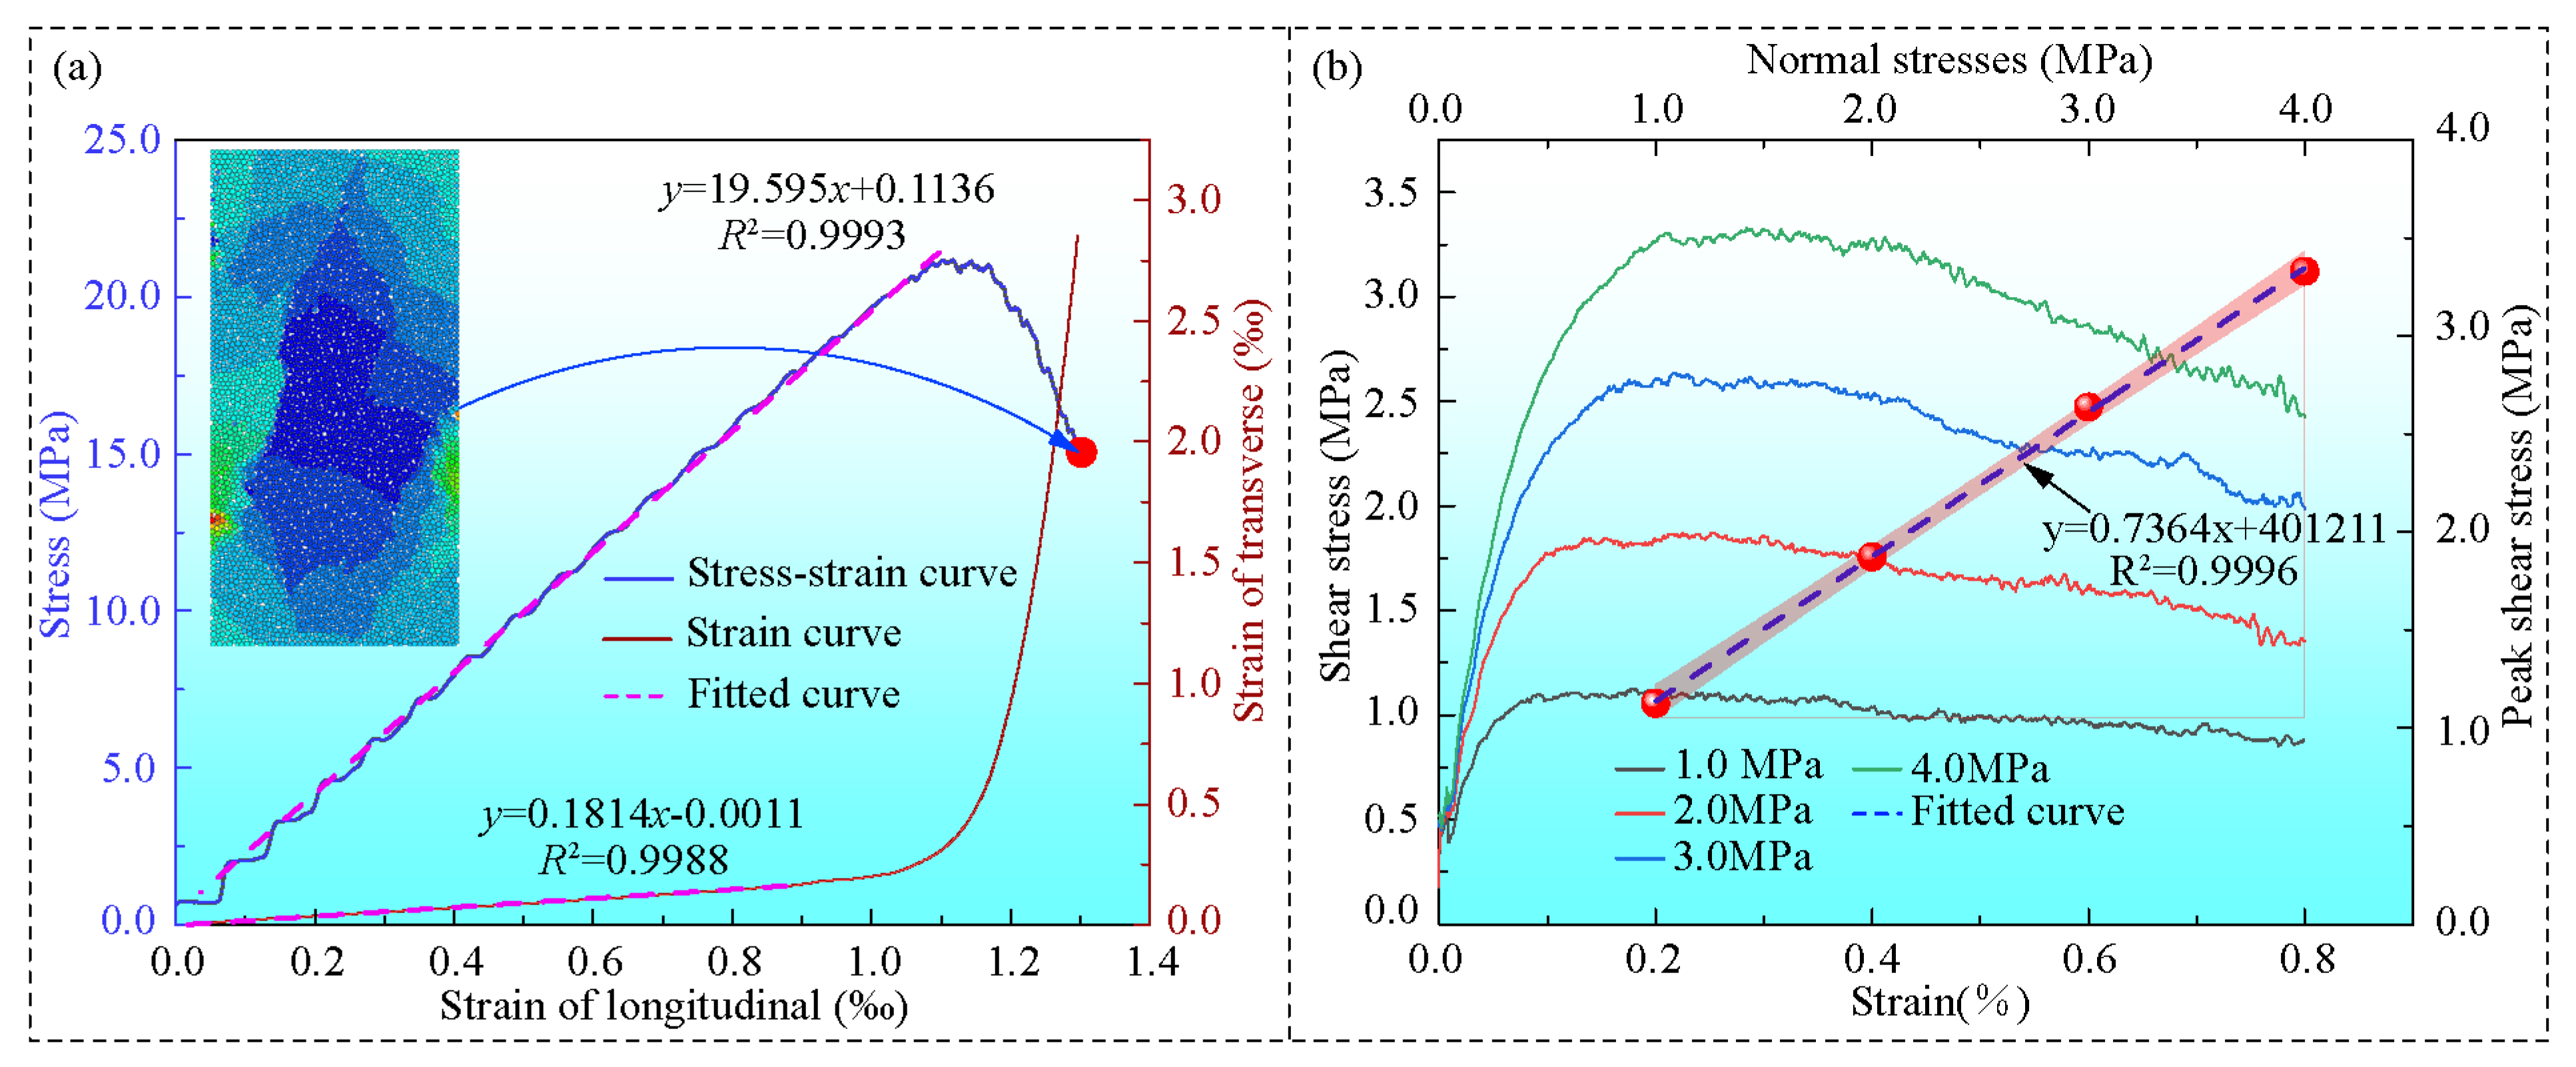
In numerical simulations of the DEM, the microscopic parameters of the particles are used to characterize the deformation characteristics and mechanical behavior of the research object. Therefore, properly configuring the microscopic parameters of the particles is key to ensuring the accuracy and reliability of the simulation results. To this end, a large number of numerical uniaxial compression tests were conducted. Through the method of trial and error, parameter values consistent with the actual mechanical properties of the rock mass were obtained. The results are shown in Figure 8a. The parameters of the rock are detailed in Table 1.
A numerical shear test was designed, and experiments were conducted under four distinct normal stress conditions to obtain the mechanical parameters of the bedding plane. Figure 8b shows the test results. The bedding plane friction angle and cohesion were determined through linear fitting of the peak strengths from the four sets of experiments, as shown in Figure 8b. The relevant parameters are listed in Table 2.

4.4. Simulated Results

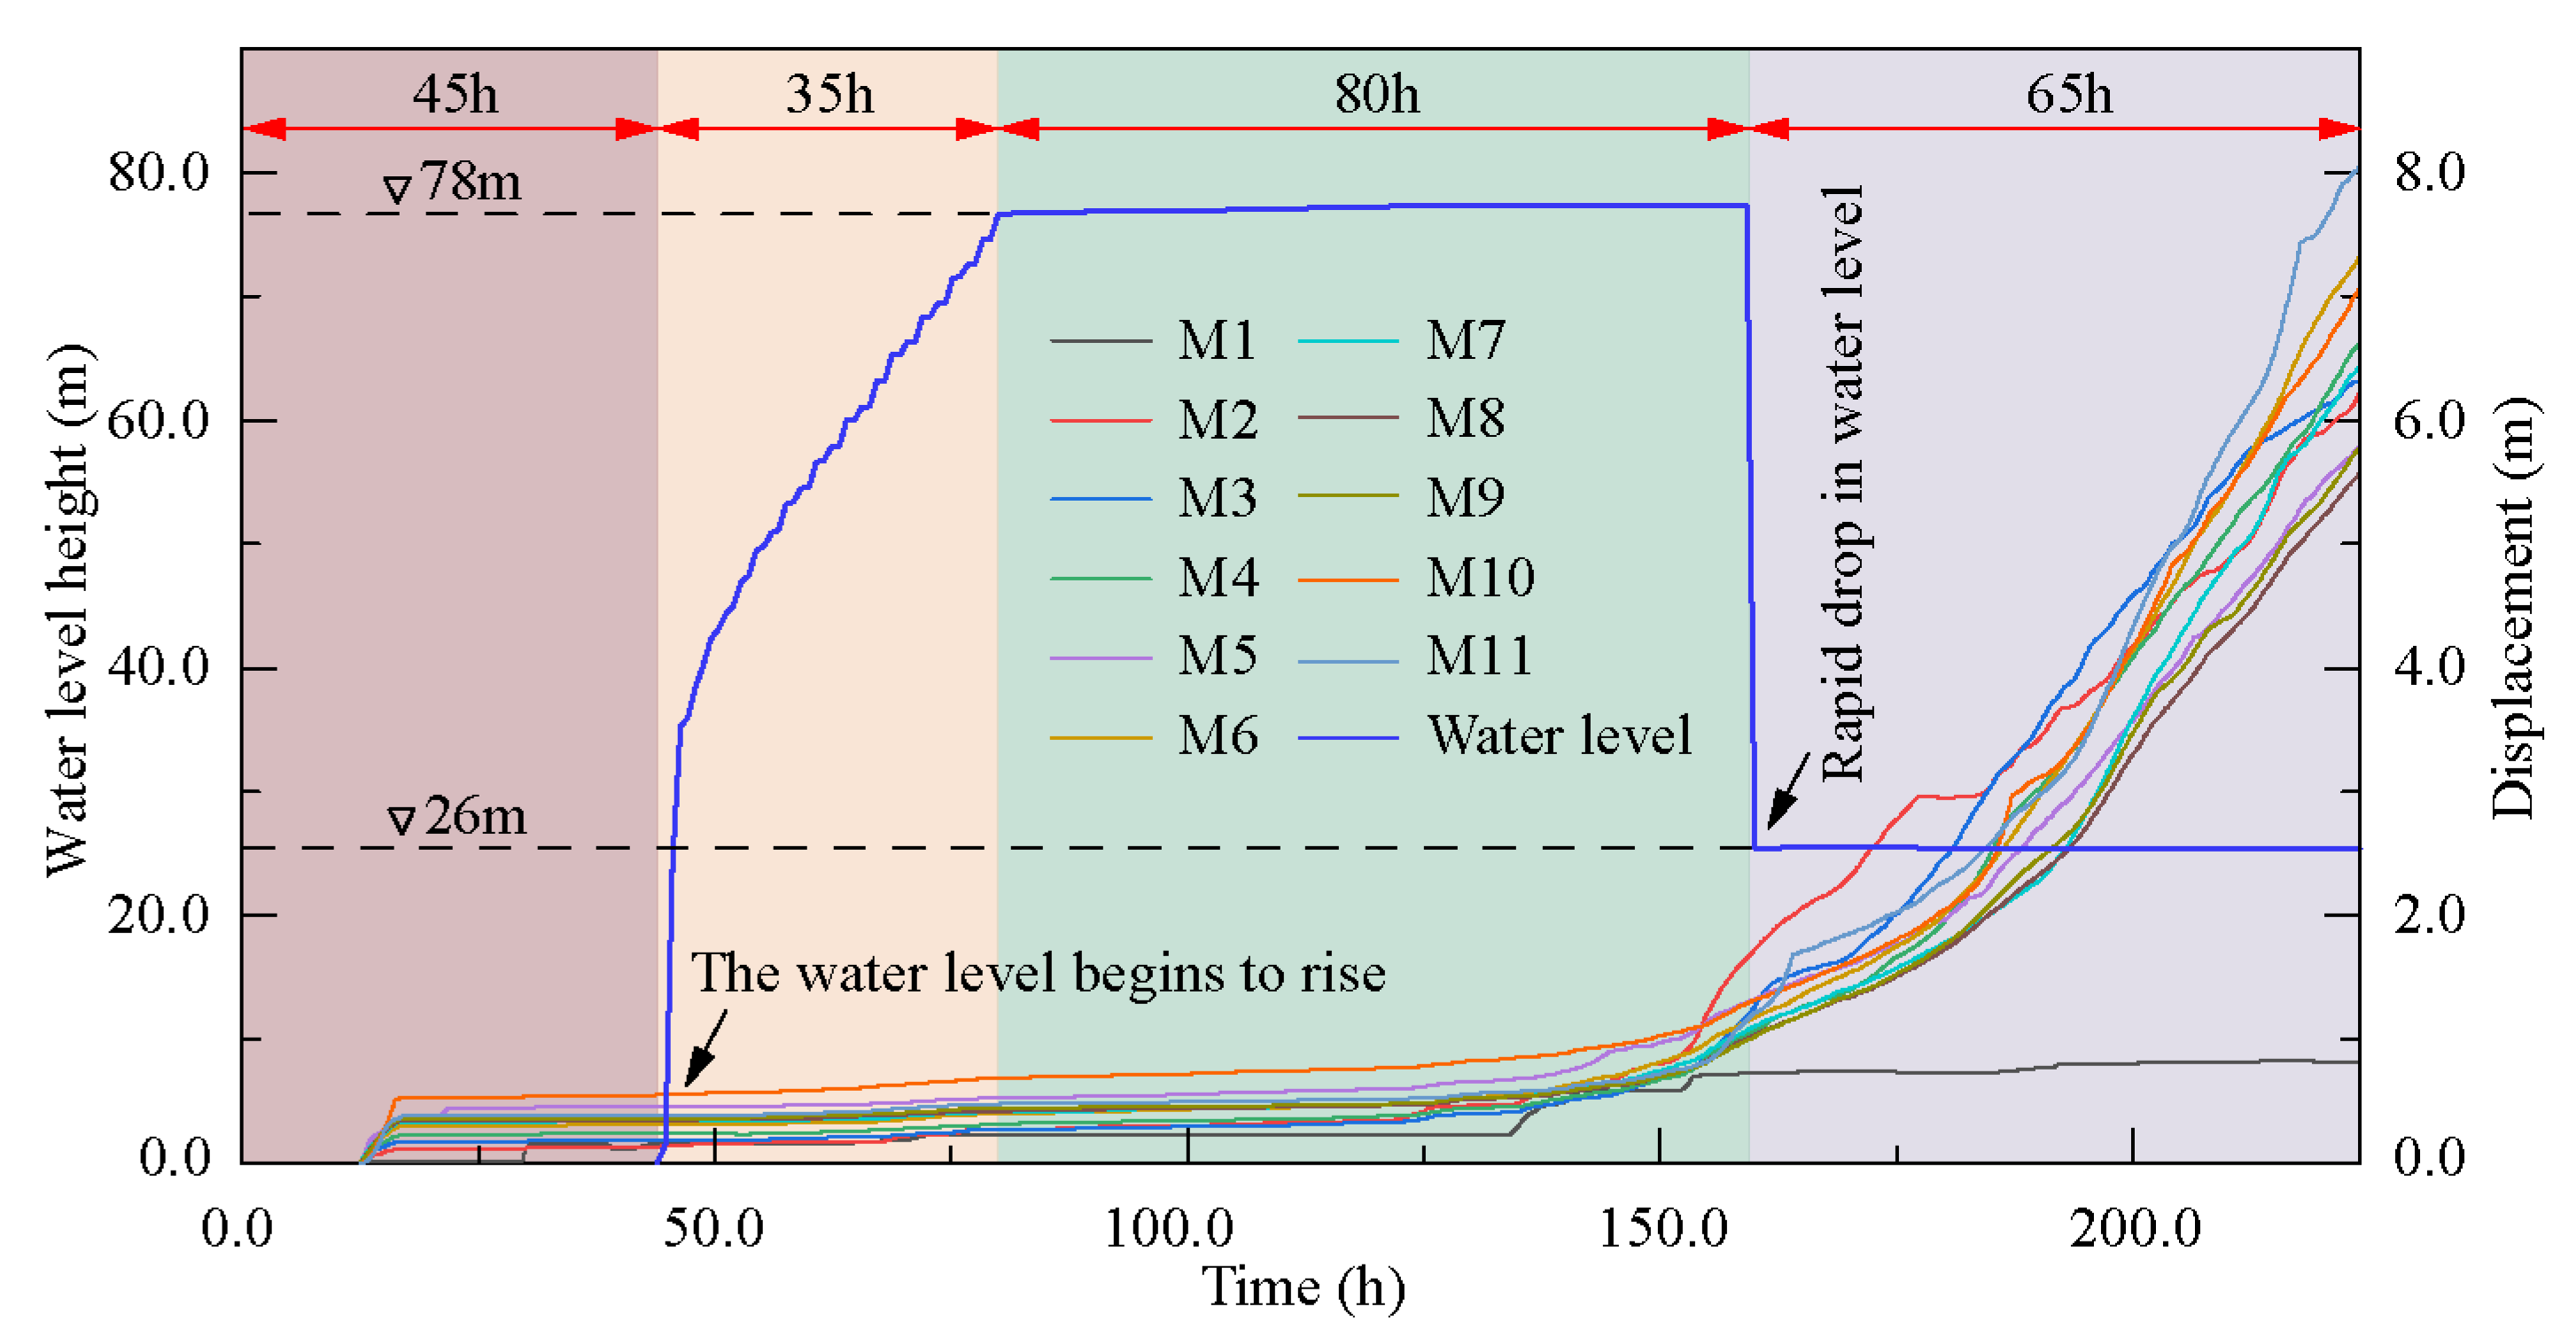
The total duration of the water level fluctuation simulation is 225 h. At hour 45, the water level begins to rise from the slope toe (0 m) and reaches 78 m after 35 h. Subsequently, the water level is maintained at 78 m for 80 h. At hour 160, the water level plummets to 26 m and remains at this level until the end of the simulation. During the simulation process, the mechanical strength of the rock mass is automatically and iteratively reduced as its degree of saturation increases. The time history of the water level fluctuations is shown in Figure 9.
Eleven monitoring points (M1–M11) are set in the slope numerical model, with their locations shown in Figure 7. The displacement monitoring results of each monitoring point are shown in Figure 9. As shown in Figure 9, deformation first occurs at monitoring points M2 to M11 at 12.5th hour, with the deformation increasing as the points approach the slope shoulder. By the 30th hour, the rock mass at M1 also showed initial displacement. After the 45th hour, influenced by the reservoir water, the deformation rate at each monitoring point slightly increased, but the overall deformation was relatively small. At the 134th hour, the deformation of the rock mass at M1 significantly intensified, and it ultimately failed at the 154th hour. At this point, the deformation at monitoring points M2 to M11 began to accelerate. Particularly, at the 160th hour, following the instantaneous drop in water level, the deformation rate at various points on the slope increased significantly, and the slope began to fail.
The displacement contour of the flexural toppling and the simulation results of the permeation forces under the fluctuation of water level are shown in Figure 10 and Figure 11, respectively. In the early stages of the simulation, the most significant toppling deformation occurred at the slope shoulder, and localized collapse and block detachment were observed on the slope surface (Figure 10a). During the rise of the water level, seepage forces directed towards the interior of the slope were generated (Figure 11a), while the rock mass strength was reduced as its immersion time increased (Figure 12). The rise in reservoir water level can also cause the rock mass in the submerged area to be affected by buoyant forces, thereby reducing the effective stress of the rock mass in that region, weakening the slope’s resistance to sliding, and triggering slope deformation (Figure 10b). The toppling of the upper rock mass and the high water level applied significant stress to the rock mass at the slope toe (Figure 13), which, combined with the reduction in strength, led to its cracking and failure (Figure 10c). After the instantaneous drop in the water level, a permeation force directed outward from the slope was generated (Figure 11c), which carried away particles of the fractured rock mass at the slope toe. This weakened the supporting capacity of the rock mass at the slope toe, further aggravating the slope deformation (Figure 10d,e), ultimately leading to slope instability (Figure 10f).

5. Validation

5.1. Simulation Result Validation

In the numerical model, the stability of each rock slab can be calculated using the approach provided in this paper. In this study, a rock slab at the highest water level was selected as a representative (Figure 7), and its stability was calculated using the mechanical parameters obtained from numerical uniaxial compression and shear tests. The calculated critical length of this rock slab is 39.25 m, which is shorter than its actual length of 43.59 m, suggesting that the rock slab will be unstable. The calculation results are consistent with the numerical simulation results, validating the effectiveness of the proposed analytical method.

5.2. Laohuzui Slope

5.2.1. Engineering Settings

A large slope with a total volume of approximately 6 × 10⁶ m3 was discovered at the inlet of the flood discharging tunnel on the right bank of the Laohuzui Hydropower Station project, as shown in Figure 14. The slope exhibits a characteristic of being narrower at the upper part and wider at the lower part in the plane (Figure 14a), which plays a significant controlling role in the tunnel inlet construction.
Prior to excavation, the natural slope was in a stable condition, exhibiting no signs of deformation or cracking, except for ancient unloading cracks that formed in the shallow surface of the slope during its long-term evolution. After excavation, significant cracking and intensified deformations were observed above the excavation line at the rear edge of the slope, at an elevation of approximately 3320 m to 3360 m. The maximum crack width reached 1.2 m (Figure 14b). Typical flexural toppling phenomena were discovered through field investigation at the top of the diversion tunnel (Figure 14c) and the exterior of the inlet of the flood discharging tunnel (Figure 14d).
Through the analysis of geological survey data and field investigations, it was found that the lithology of the slope is sandy slate with a thinly layered structure, and it is relatively soft, exhibiting poor bending strength. The strength parameters of the rock mass, as obtained from both indoor and outdoor tests, are shown in Table 3. The overall strike of the slope is NW 305°~315°, with the dip direction toward the NE. The strike of the normal rock layers is NW 280°~290°, with a dip direction toward the SW and a dip angle of 75°~80°. It can be observed that the slope’s strike is generally consistent with the strike of the rock layers, while the dip directions are opposite. The inlet slope of the flood discharging tunnel is an anti-dip layered rock slope, which possesses the fundamental conditions for the formation of flexural toppling deformation. The dip angles of the rock layers change significantly at different slope depths. In the vicinity of the surface, the dip angles range from 10° to 30° and gradually increase to 30° to 50° at greater depths, with the deepest layers typically having dip angles of approximately 75° to 80°. The variation characteristics of the dip angles at different depths indicate that the inlet slope of the flood discharging tunnel is a typical flexural toppling deformation body with a bending–cracking mechanism.
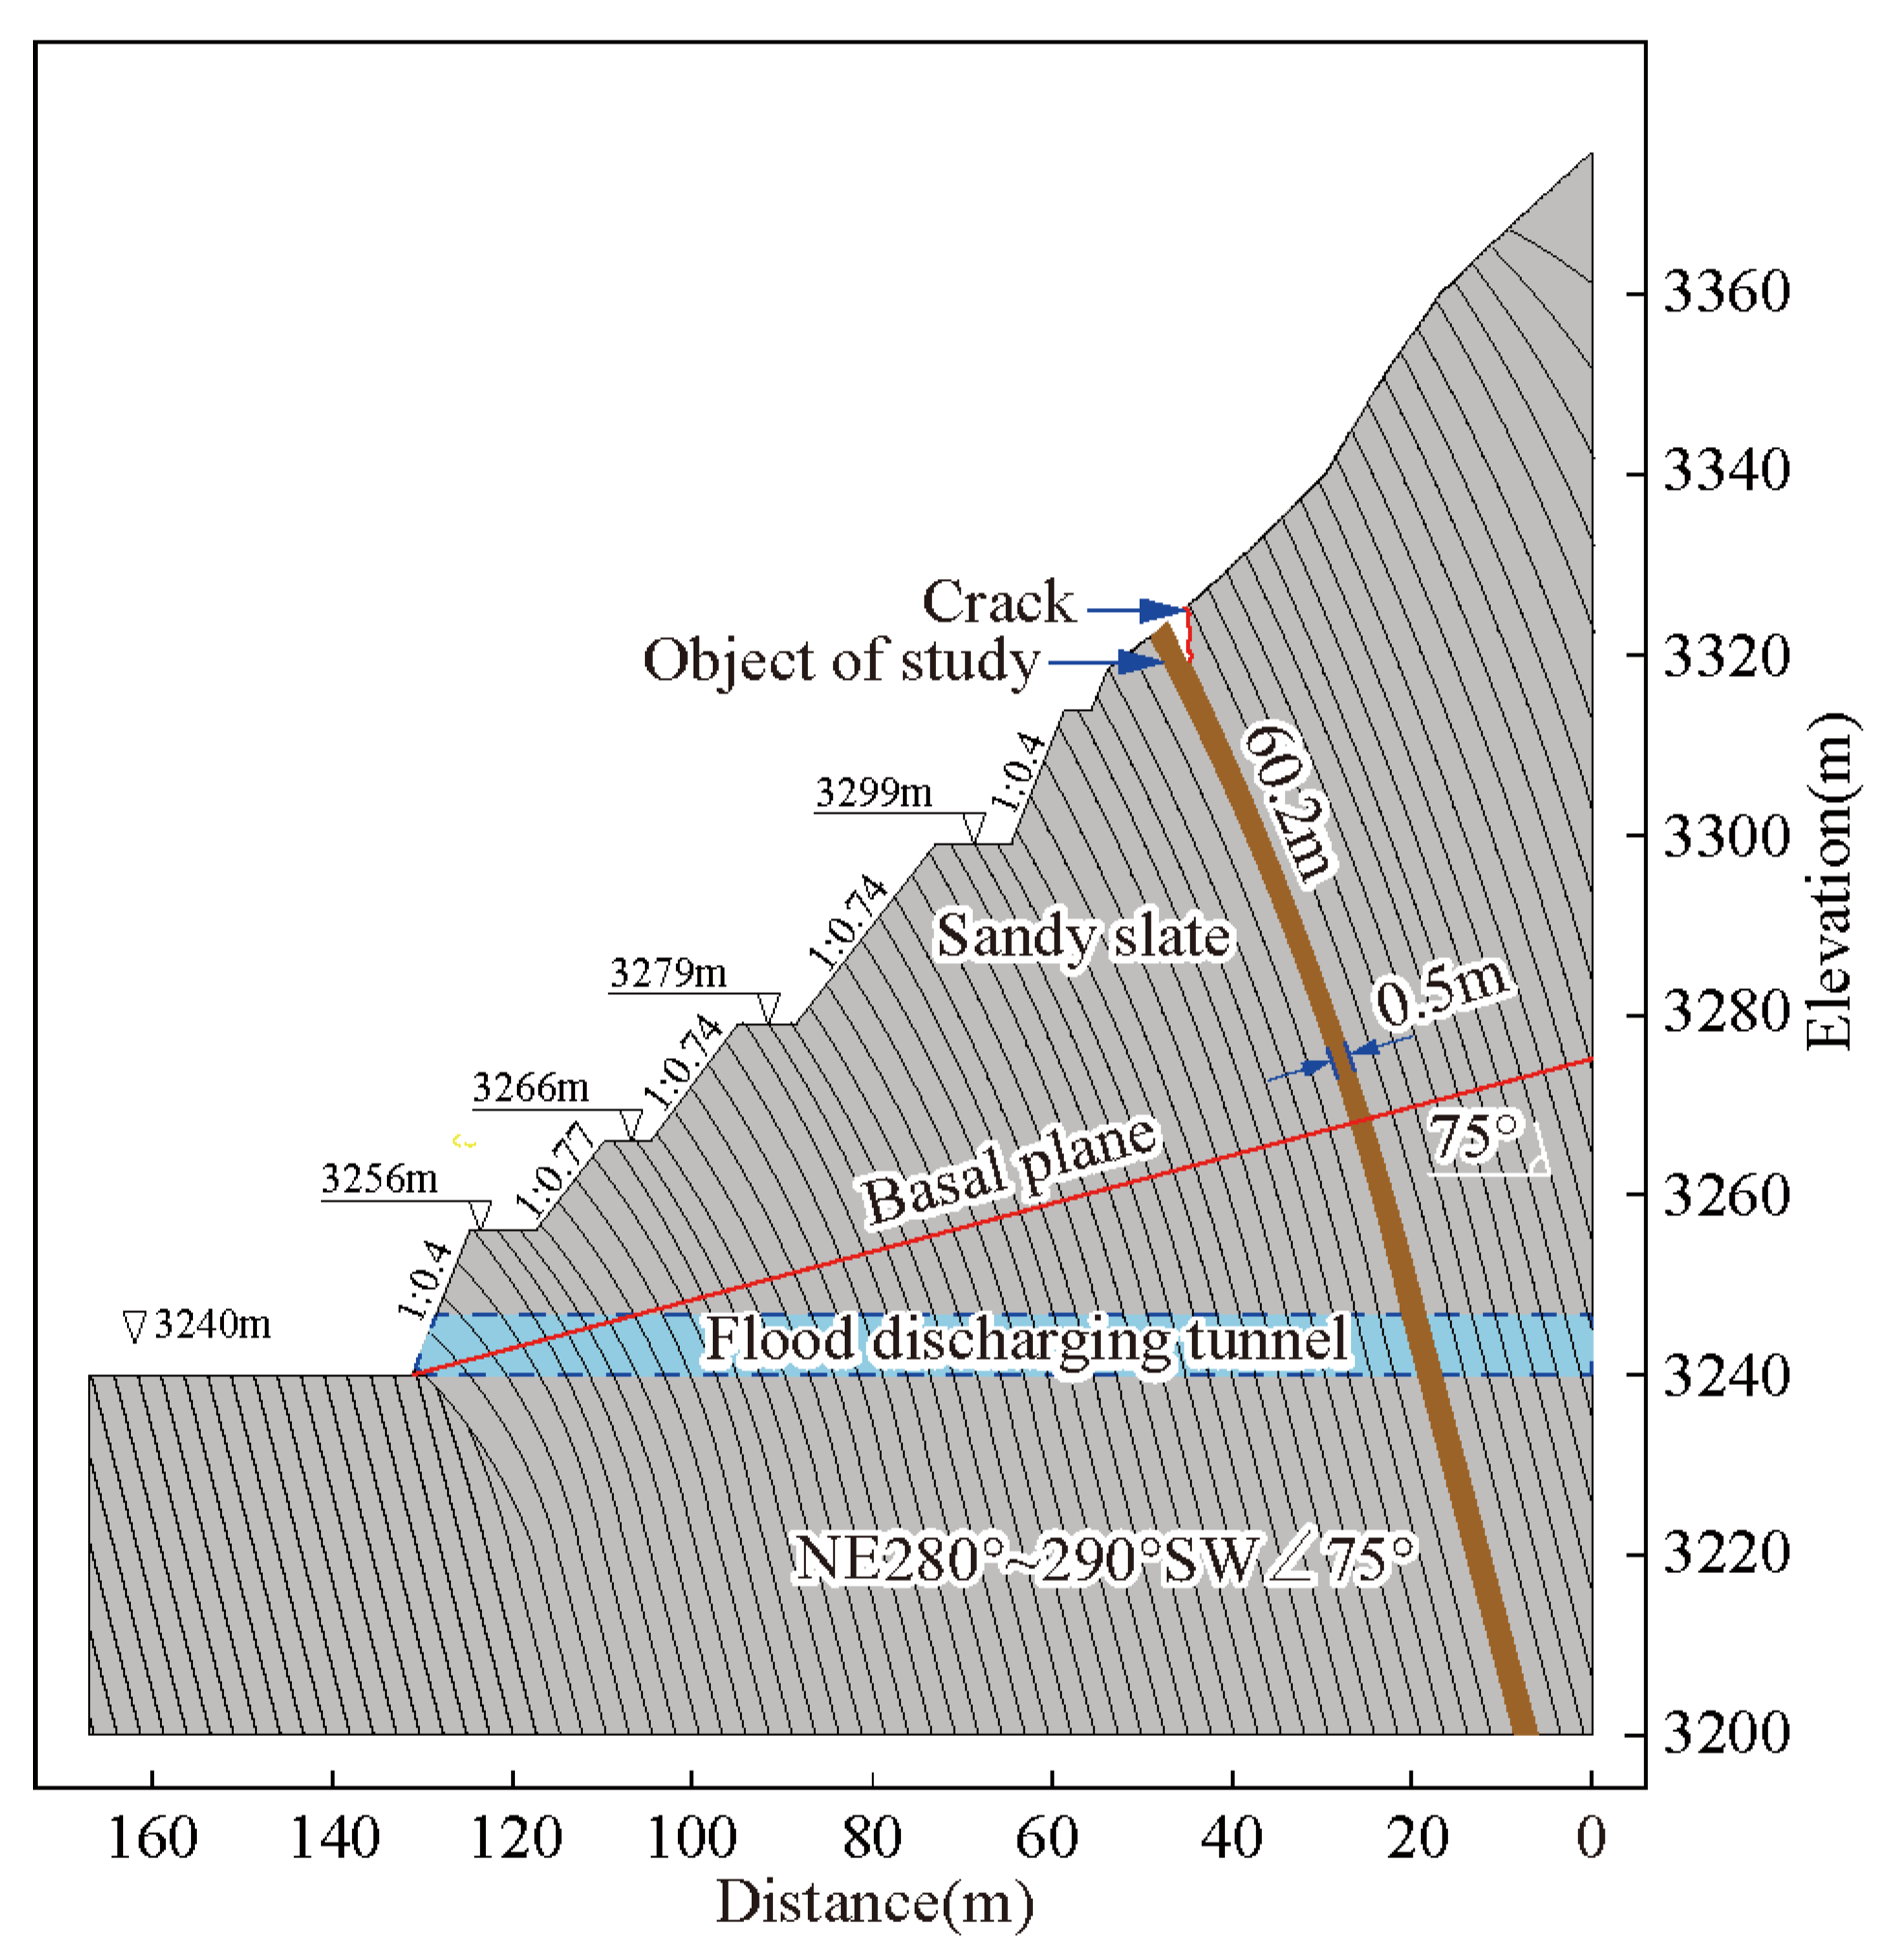
According to the survey results of the adits and boreholes, combined with the site investigation, a geological profile of the inlet slope of the flood discharge tunnel on the right bank of the Laohuzui Hydropower Station, after excavation, was drawn, as shown in Figure 15.

5.2.2. Calculation Results

A rock slab located at the site of fissure formation behind the excavation surface was selected as the study object, and its stability was evaluated using the approach provided in this study. The relevant calculation parameters of the slope, obtained through field surveys and tests, are listed in Table 3.
The calculation results indicate that the critical length is 54.12 m, which is shorter than its actual length. This indicates that there is a possibility of instability in the slope, which aligns with the actual conditions.

5.2.3. Comparison Validation

Wang et al. [20] proposed a method to determine the safety factor of rock layers by calculating the ratio of the rock strength to the magnitude of internal forces acting on the rock. This method simultaneously considers the tensile strength and shear strength of the rock material. The safety factor of the rock slab is equal to the minimum value of the calculated safety factor. The calculation formula is as follows. The specific definitions and explanations of each parameter in the following equations can be found in the paper of Wang et al. [20].
F s t j = σ t j 6 M * j b j 2 γ j h j sin α
F s s j = b j c j + γ j h j sin α tan φ j Q j *
F s = min ( F s t j , F s s j )
Using the same principles, the stability of the Laohuzui slope is calculated by considering the tensile strength and shear strength of the rock mass. The calculation parameters are given in Table 3. The calculated safety factor of the target rock slab is 0.127, and the rock slab is in an unstable state. It can be seen that when the same parameters are applied to analyze the stability of the Laohuzui slope, the results from both methods are consistent, and these results align with the field survey findings, further validating the accuracy of the method presented in this paper.

6. Discussion and Conclusions

(1) Considering the adverse effects of reservoir water fluctuations on the stability of anti-dip layered rock slopes, a modified mechanical model for the flexural toppling of these slopes under water level fluctuations is established, and an actual deflection equation for the rock slabs is derived. Based on this deflection equation, the critical length of rock slabs is calculated to assess their failure potential, providing a theoretical foundation for the stability evaluation of reservoir bank slopes.
(2) The relative degree of the influence of each parameter on the critical length is revealed through multiple linear regression analysis, effectively highlighting the controlling factors that play a key role in the stability of anti-dip slopes. The results indicate that the critical length is most sensitive to changes in rock layer thickness. The use of techniques such as bolts to effectively connect multiple rock layers into an integrated mass can significantly enhance slope stability. Additionally, the impact of water pressure on slope stability is significant and should not be overlooked in the evaluation of reservoir bank slope stability.
(3) A numerical simulation method for unsaturated bidirectional fluid–solid coupling is developed by combining the DEM with Fipy. The failure evolution process of an anti-dip slope under conditions of gradual water level rise followed by an instantaneous drop is investigated. The results indicate that the rise in water level reduces the strength of the rock mass in the submerged zone and generates significant water pressure on the rock mass at the slope toe, which in turn leads to its cracking. A rapid drop in water level generates seepage forces detrimental to slope stability and carries away the fractured rock particles at the slope toe, further exacerbating the deformation of the slope, ultimately leading to slope failure.
(4) The reliability and universality of the proposed method are validated through numerical simulations, case studies, and comparisons with existing analytical solutions.
The analytical method proposed in this paper can effectively assess the stability of anti-dip slopes on reservoir banks under the influence of water level fluctuations, but it also has certain limitations. Specifically, this method does not consider the influence of structural planes, such as joints and fissures, commonly present in the rock mass, and overlooks the anisotropic characteristics of the anti-dip layered rock masses, which may lead to an underestimation of the actual deformation risks of the slope. Future research could obtain the stress distribution of the slope body through finite element analysis and incorporate it into the calculation model. Additionally, the influence of structural planes on slope stability could be analyzed using fracture mechanics theory to further improve the method, enhance its computational accuracy, and expand its range of applicability. Furthermore, a systematic analysis of the mechanical behavior and response characteristics of the rock mass under periodic water level fluctuations (with small amplitude and a period of 1–3 days) could be conducted, providing a more comprehensive and realistic representation of the failure evolution process of anti-dip slopes on reservoir banks under the influence of reservoir water fluctuations.

Author Contributions

Writing—original draft, Visualization, Software, Methodology, Formal analysis, N.S.; Writing—original draft, Validation, Methodology, Data curation, S.Y.; Writing—review & editing, Investigation, Project administration, Resources, L.J.; Methodology, Writing—review & editing, Software, W.F.; Writing—review & editing, Formal analysis, Resources, Y.W.; Conceptualization, Supervision, Funding acquisition, F.Y.; Writing—review & editing, Supervision, Z.W. All authors have read and agreed to the published version of the manuscript.

Funding

This research was supported by the National Nature Science Foundation of China (Grant Nos. 42377145), the Fundamental Research Funds for the Central Universities (Grant No. 2024SCUQJTX033), the Science and Technology Projects of China Huaneng Group Co., Ltd. (HNKJ22-H109) and the Academician and Expert Workstation Project of Yunnan Province (202305AF150207).

Data Availability Statement

The data presented in this study are available upon request from the corresponding author. The data are not publicly available due to privacy or ethical restrictions.

Conflicts of Interest

Author Ning Sun was employed by the company State PowerChina Zhongnan Engineering Corporation Limited. The remaining authors declare that the research was conducted in the absence of any commercial or financial relationships that could be construed as a potential conflict of interest. The authors declare that this study received funding from Science and Technology Projects of China Huaneng Group Co., Ltd. The funder was not involved in the study design, collection, analysis, interpretation of data, the writing of this article or the decision to submit it for publication.

References

  1. Gong, Y.F.; Yao, A.J.; Li, Y.L.; Li, Y.Y.; Li, Y.N.; Sun, Y.T. Model test study on sliding-toppling composite deformation evolution of anti-dip layered rock slope. Bull. Eng. Geol. Environ. 2023, 82, 194. [Google Scholar] [CrossRef]
  2. Zheng, Y.; Wang, R.Q.; Chen, C.X.; Meng, F. Analysis of flexural toppling failure in rock slopes using discrete element method. Front. Earth Sci. 2021, 9, 773088. [Google Scholar] [CrossRef]
  3. Weng, M.C.; Peng, C.H.; Hung, W.Y.; Guo, Y.J. Exploring failure evolution of anti-dip slate slope using centrifuge test and discrete element method. Bull. Eng. Geol. Environ. 2024, 83, 457. [Google Scholar] [CrossRef]
  4. Ashby, J. Sliding and Toppling Modes of Failure in Models and Jointed Rock Slopes; Imperial College, University of London: London, UK, 1971. [Google Scholar]
  5. Goodman, R.E.; Bray, J.W. Toppling of rock slopes. In Proceedings of the ASCE Specialty Conference on Rock Engineering for Foundations and Slopes, Boulder, CO, USA, 15–18 August 1976; pp. 201–234. [Google Scholar]
  6. Beng, X.T.; Zhan, G.C.; Yang, Y.C.; Zhu, C.; Murat, K.; Wang, D.S. Flexural toppling characteristics of anti-dip soft rock slope with base friction test. Bull. Eng. Geol. Environ. 2023, 82, 21. [Google Scholar] [CrossRef]
  7. Yan, K.M.; Wang, G.H.; Nikitas, N.; Bao, N.; Doi, I.; Tao, Z.G. Time-frequency analysis on seismic response and pre-toppling damage evolution of anti-dip rock slope under earthquake sequences by shaking table tests. Eng. Geol. 2025, 355, 108220. [Google Scholar] [CrossRef]
  8. Liu, H.D.; Zhao, Y.W.; Dong, J.Y.; Wang, Z.F. Experimental study of the dynamic response and failure mode of anti-dip rock slopes. Bull. Eng. Geol. Environ. 2021, 80, 6583–6596. [Google Scholar] [CrossRef]
  9. Zhang, H.N.; Chen, C.X.; Zheng, Y.; Yu, Q.Q.; Zhang, W. Centrifuge modeling of layered rock slopes susceptible to block-flexure toppling failure. Bull. Eng. Geol. Environ. 2020, 79, 3815–3831. [Google Scholar] [CrossRef]
  10. Jin, L.L.; Dong, H.K.; Ye, F.; Wei, Y.F.; Liu, J.F.; Wang, C.K. Investigation of the block toppling evolution of a layered model slope by centrifuge test and discrete element modeling. J. Rock Mech. Geotech. 2024, 16, 112–122. [Google Scholar] [CrossRef]
  11. Lian, J.J.; Li, Q.; Deng, X.F.; Zhao, G.F.; Chen, Z.Y. A numerical study on toppling failure of a jointed rock slope by using the distinct lattice spring model. Rock Mech. Rock Eng. 2018, 51, 513–530. [Google Scholar] [CrossRef]
  12. Adhikary, D.P.; Dyskin, A.V. Modelling of progressive and instantaneous failures of foliated rock slopes. Rock Mech. Rock Eng. 2007, 40, 349–362. [Google Scholar] [CrossRef]
  13. Sarfaraz, H.; Amini, M. Numerical simulation of slide-toe-toppling failure using distinct element method and finite element method. Geotech. Geol. Eng. 2020, 38, 2199–2212. [Google Scholar] [CrossRef]
  14. Cui, Z.; Chen, P.Z.; Chu, W.J.; Zhou, Y.; Liu, N.; Sheng, Q. Deformation mechanism and reinforcement design for the flexural toppled slope of Miaowei HPP. Bull. Eng. Geol. Environ. 2023, 82, 39. [Google Scholar] [CrossRef]
  15. You, M.L.; Tong, D.F.; Tan, F.; Lv, J.H. Discrete element-based numerical simulation and failure mechanism analysis of anti-dip rock slopes. Bull. Eng. Geol. Environ. 2024, 83, 399. [Google Scholar] [CrossRef]
  16. Gong, W.J.; Tao, Z.G.; He, M.C.; Hou, H.J. Feasibility analysis on the support of rock slopes against flexural toppling failure using the DDA Method-A case study. KSCE J. Civ. Eng. 2022, 26, 3847–3862. [Google Scholar] [CrossRef]
  17. Aydan, O.; Kawamoto, T. The stability of slopes and underground openings against flexural toppling and their stabilization. Rock Mech. Rock Eng. 1992, 25, 143–165. [Google Scholar] [CrossRef]
  18. Azarafza, M.; Bonab, M.H.; Akgun, H. Numerical analysis and stability assessment of complex secondary toppling failures: A case study for the south pars special zone. Geomech. Eng. 2021, 27, 481–495. [Google Scholar] [CrossRef]
  19. Amini, M.; Majdi, A.; Aydan, Ö. Stability analysis and the stabilisation of flexural toppling failure. Rock Mech. Rock Eng. 2009, 42, 751–782. [Google Scholar] [CrossRef]
  20. Wang, R.Q.; Zheng, Y.; Chen, C.X.; Zhang, W. Theoretical and numerical analysis of flexural toppling failure in soft-hard interbedded anti-dip rock slopes. Eng. Geol. 2023, 312, 106923. [Google Scholar] [CrossRef]
  21. Majdi, A.; Amini, M. Analysis of geo-structural defects in flexural toppling failure. Int. J. Rock Mech. Min. 2011, 48, 175–186. [Google Scholar] [CrossRef]
  22. Zhang, G.C.; Wang, F.; Zhang, H.; Tang, H.M.; Li, X.H.; Zhong, Y. New stability calculation method for rock slopes subject to flexural toppling failure. Int. J. Rock Mech. Min. 2018, 106, 319–328. [Google Scholar] [CrossRef]
  23. Wang, D.J.; Tang, H.M.; Zhang, Y.Q.; Shen, P.W. Local failure probability of the anti-dip slope susceptible to flexural toppling. Stoch. Environ. Res. Risk A 2019, 33, 1187–1202. [Google Scholar] [CrossRef]
  24. Sarfaraz, H. Stability analysis of flexural toppling failure using the Sarma’s method. Geotech. Geol. Eng. 2020, 38, 3667–3682. [Google Scholar] [CrossRef]
  25. Li, A.; Dai, F.; Liu, Y.; Du, H.B.; Jiang, R.C. Dynamic stability evaluation of underground cavern sidewalls against flexural toppling considering excavation-induced damage. Tunn. Undergr. Space Technol. 2021, 112, 103903. [Google Scholar] [CrossRef]
  26. Zheng, Y.; Chen, C.X.; Liu, T.T.; Ren, Z.H. A new method of assessing the stability of anti-dip bedding rock slopes subjected to earthquake. Bull. Eng. Geol. Environ. 2021, 80, 3693–3710. [Google Scholar] [CrossRef]
  27. Jin, L.L.; Fu, W.X.; Wang, Y.; Xiao, Q.F.; Li, Y.J.; Ye, F. A novel method for evaluating stability and mechanism of flexural toppling based on energy conservation principle and numerical simulation. Int. J. Rock Mech. Min. 2024, 183, 105896. [Google Scholar] [CrossRef]
  28. Zhu, J.; Deng, J.H.; Chen, F.; Huang, Y.M.; Yu, Z.Q. Water saturation effects on mechanical and fracture behavior of marble. Int. J. Geomech. 2020, 20, 04020191. [Google Scholar] [CrossRef]
  29. Sun, Q.; Zhang, Y.L. Combined effects of salt, cyclic wetting and drying cycles on the physical and mechanical properties of sandstone. Eng. Geol. 2019, 248, 70–79. [Google Scholar] [CrossRef]
  30. Gratchev, I.; Pathiranagei, S.V.; Kim, D.H. Strength properties of fresh and weathered rocks subjected to wetting-drying cycles. Geomech. Geophys. Geo 2019, 5, 211–221. [Google Scholar] [CrossRef]
  31. Zhao, Y.B.; Yang, C.Q.; Qu, F.; Wu, Z.R.; Ding, K.J.; Liang, Z.S. Effect of wet-dry cycles on the mechanical performances and microstructure of pisha sandstone. Molecules 2025, 28, 2533. [Google Scholar] [CrossRef]
  32. He, L.P.; Yu, J.Y.; Hu, Q.J.; Cai, Q.J.; Qu, M.F.; He, T.J. Study on crack propagation and shear behavior of weak muddy intercalations submitted to wetting-drying cycles. Bull. Eng. Geol. Environ. 2020, 79, 4873–4889. [Google Scholar] [CrossRef]
  33. Teng, T.; Chen, Y.L.; Wang, S.G.; Jia, W.J.; Wang, Y.M.; Liu, K.; Li, Z.L. Water injection softening modeling of hard roof and application in Buertai coal mine. Environ. Earth Sci. 2025, 84, 54. [Google Scholar] [CrossRef]
  34. Cai, J.C.; Ju, N.P.; Huang, R.Q.; Zheng, D.; Zhao, W.H.; Li, L.Q.; Huang, J. Mechanism of toppling and deformation in hard rock slope: A case of bank slope of Hydropower Station, Qinghai Province, China. J. Mt. Sci. 2019, 16, 924–934. [Google Scholar] [CrossRef]
  35. Jin, L.L.; Wei, Y.F.; Ye, F.; Fu, W.X.; Liu, J.F.; Li, S.W. Large-scale toppling slope under water level fluctuation of reservoir: A case of Yunnan Province, China. J. Rock Mech. Geotech. 2024, 16, 3034–3046. [Google Scholar] [CrossRef]
  36. Pan, S.T.; Gao, W.; Hu, R.L. Physical modeling for large-scale landslide with chair-shaped bedrock surfaces under precipitation and reservoir water fluctuation conditions. Water 2022, 14, 984. [Google Scholar] [CrossRef]
  37. Shan, Z.G.; Lv, J.Q.; Zhang, F.M.; Chen, L.; Yin, F.; Dong, M.L. Different toppling bank slope failures under hydrodynamic action during impoundment of the Miaowei hydropower station reservoir. Water 2022, 14, 2126. [Google Scholar] [CrossRef]
  38. Roy, D.; Maheshwari, P. Probabilistic analysis of rock slopes against block toppling failure. Indian Geotech. J. 2018, 48, 484–497. [Google Scholar] [CrossRef]
  39. Bowa, V.M.; Gong, W.P. Analytical technique for stability analyses of the rock slope subjected to slide head toppling failure mechanisms considering groundwater and stabilization effects. Int. J. Geo-Eng. 2021, 12, 4. [Google Scholar] [CrossRef]
  40. Zhou, W.J.; Xu, W.Y.; Ning, Y.; Xiao, H.B.; Xie, W.C. Analytical method of stability analyses of toppling rock slopes subjected to flexural toppling failure damage. Eur. J. Environ. Civ. Eng. 2023, 27, 2373–2387. [Google Scholar] [CrossRef]
  41. Lin, Y.S.; Zhao, X.T.; Wu, Q.H.; Ding, G.Z.; Yang, R.T.; Wen, T. Calculation method for toppling stability of layered counter-tilt rock slope considering the effect of reservoir water and its application. In Applied Mathematics, Modeling and Computer Simulation; IOS Press: Amsterdam, The Nederland, 2023; Volume 42, pp. 1046–1056. [Google Scholar] [CrossRef]
  42. Chaudhary, N.; Metya, S.; Sharma, K.K. Influence of Hydraulic Distribution Pattern on the Rock Slope Stability under Block Toppling Failure. KSCE J. Civ. Eng. 2024, 28, 1253–1266. [Google Scholar] [CrossRef]
  43. Qin, S.; Jiao, J.J.; Wang, S. A cusp catastrophe model of instability of slip-buckling slope. Rock Mech. Rock Eng. 2001, 34, 119–134. [Google Scholar] [CrossRef]
  44. Zhou, Z.K.; Yao, X.; Li, R.J.; Jiang, S.; Zhao, X.M.; Ren, K.Y.; Zhu, Y.F. Deformation characteristics and mechanism of an impoundment-induced toppling landslide in Baihetan Reservoir based on multi-source remote sensing. J. Mt. Sci. 2023, 220, 3614–3630. [Google Scholar] [CrossRef]
Figure 1. Mechanical model: (a) mechanical model of the flexural toppling slope; (b) situation of a sudden rise in water levels; (c) situation of a sudden decrease in water levels.
Water 17 03375 g001
Figure 2. Mechanical analysis: (a) mechanical model of the rock slab; (b) mechanical analysis of the rock slab above the water level; and (c) mechanical analysis of the rock slab below the water level.
Water 17 03375 g002
Figure 3. Geological geometric model of anti-dip slope.
Water 17 03375 g003
Figure 4. The flowchart for the analytical method proposed in this paper.
Water 17 03375 g004
Figure 5. Influence of the various factors on the critical length: (a) bedding plane cohesion; (b) bedding plane friction angle; (c) slope angle; (d) rock layer dip angle; (e) rock slab thickness (f) rock elastic modulus.
Water 17 03375 g005
Figure 6. Influence of water level height on the critical length.
Water 17 03375 g006
Figure 7. Numerical model of an anti-dip layered rock slope.
Water 17 03375 g007
Figure 8. Results of parameter calibration: (a) uniaxial compression test; and (b) shear test.
Water 17 03375 g008
Figure 9. Water-level fluctuation history and displacement monitoring results.
Water 17 03375 g009
Figure 10. Displacement contours of numerical simulation at different times: (a) at hour 45, the water level begins to rise; (b) at hour 80, the water level rises to 78 m; (c) at hour 140; (d) at hour 160, the water level suddenly drops to 26 m; (e) at hour 180; and (f) at hour 225, end of the calculation.
Water 17 03375 g010
Figure 11. Simulation results of the permeation forces: (a) at hour 80; (b) at hour 140; (c) at hour 160.
Water 17 03375 g011
Figure 12. Deterioration of rock mass strength: (a) at hour 80; (b) at hour 140; (c) at hour 160.
Water 17 03375 g012
Figure 13. Simulation results of pressure head in the slope: (a) at hour 80; (b) at hour 140; (c) at hour 160.
Water 17 03375 g013
Figure 14. The characteristics of the Laohuzui slope. (a) Overview of the Laohuzui landslide; (b) crack at the rear edge of the slope; (c) flexural toppling phenomenon at the top of diversion tunnel entrance; and (d) flexural toppling phenomenon outside the inlet of the flood discharging tunnel.
Water 17 03375 g014
Figure 15. Profile I-I of the slope after excavation.
Water 17 03375 g015
Table 1. Calculation parameters of the rock mass in the numerical simulation.
Parametric ClassificationParameterValue
Linear Parallel Bond Model (Microscopic parameters)Bond modulus (Pa)1.05 × 10¹⁰
Normal-to-shear stiffness ratio (-)1.53
Friction coefficient (-)0.5
Normal critical damping ratio (-)0.2
Density (kg/m3)2600
Damping (Ns/m)0.7
contact gap (m)1 × 10⁻⁵
Tensile strength (Pa)6.5 × 10⁶
Cohesion (Pa)1.4 × 10⁷
Friction angle (°)45
Rock mass
(Macroscopic parameters)
Modulus of deformation (GPa)19.595
Poisson (-)0.1814
Table 2. Calculation parameters of the bedding plane in the numerical simulation.
Parametric ClassificationParameterValue
Linear Model
(Microscopic parameters)
Normal stiffness (N/m)1 × 108
Shear stiffness (N/m)1 × 108
Normal critical damping ratio (-)0.5
Bedding plane
(macroscopic parameters)
Cohesion (Pa)401,211
Friction angle (°)36.37
Table 3. Calculation parameters of the Laohuzui slope.
ParameterSymbolUnitValue
Rock elastic modulus EGPa17.0
Bedding plane friction angle φ°38.0
Rock slab thickness tm0.5
Rock densityρkg/m32750.0
Rock layer dip angleθ°75.0
Bedding plane cohesioncMPa0.06
Actual length of the rock slabLm60.2
Poisson’s ratioμ/0.25
Tensile strength of rockσtMPa7.4
Friction angle of the rockφ’°52.0
Cohesion of the rockc’MPa2.33
Disclaimer/Publisher’s Note: The statements, opinions and data contained in all publications are solely those of the individual author(s) and contributor(s) and not of MDPI and/or the editor(s). MDPI and/or the editor(s) disclaim responsibility for any injury to people or property resulting from any ideas, methods, instructions or products referred to in the content.