1. Introduction
In many low-income countries, particularly in Sub-Saharan Africa, most urban residents rely on on-site sanitation systems such as ventilated improved pit (VIP) latrines and unlined pits [
1]. These systems generate fecal sludge (FS), a semi-solid mixture of human excreta, water, and solid waste, which accumulates in pits over time and poses significant public health and environmental risks if not properly managed [
2]. Urban informal settlements, which are often unplanned and overcrowded, face challenges in safely emptying, transporting, and treating FS due to inadequate infrastructure, space constraints, and high population density.
Treatment of FS is a challenge due to its variation both within and between pit latrines [
3]. FS treatment technologies were adapted from those developed for wastewater treatment [
4] or sewage sludge treatment [
5,
6,
7]. Such methods were developed based on the hypothesis that the incoming sludge will freely flow when introduced into the treatment system. However, such is not the case with FS, especially from dry pit latrines. Pit latrine FS is aged and hence loses its ability to flow due to the low moisture content [
8]. Conventional sludge treatment technologies such as drying beds, composting, and anaerobic digestion (AD) are often slow, land-intensive, or dependent on stable operational conditions. These constraints necessitate exploring alternative, compact, and rapid FS treatment options that can be integrated into decentralized or mobile treatment systems. Several technologies have been developed and tested under field conditions, demonstrating significant reductions in pathogens and organic matter while complying with ISO 30500 standards [
9,
10,
11] as well as achieving improved FS drying rates [
12,
13,
14]. In addition, other technologies have been evaluated off-site at laboratory and pilot scales, with findings indicating complete FS sanitization, increased volume reduction, and enhanced drying rates [
15,
16], along with the potential for plant nutrient recovery [
17,
18] and energy recovery and storage [
17,
19,
20].
Among emerging technologies, MW irradiation has shown promising results due to its ability to rapidly heat and sanitize organic waste materials through volumetric and dielectric heating. MW treatment also induces both thermal and athermal effects that can break down complex organic matter and enhance solubilization of key constituents such as chemical oxygen demand (COD), nutrients, and volatile solids [
21,
22].
While the application of MW technology for municipal and sewage sludge has been explored in recent years [
21,
23,
24], its use for treating FS from VIP latrines remains poorly understood. Existing studies have primarily focused on the sanitization, volume reduction, nutrient and solid energy recovery, and drying effects of MW treatment on FS [
15,
16,
17,
20,
25], with limited investigation into its role as a pretreatment step for enhancing downstream resource recovery processes such as AD. In particular, the potential of MW treatment to increase the solubilization of organic matter and improve methane recovery has not been adequately assessed for FS with high heterogeneity, variable moisture content, and low degradability, typical of VIP latrine sludge in informal settlements. This study addressed this gap by investigating the effects of MW treatment on the solubilization of organic matter and nutrients in FS collected from VIP latrines in eThekwini Municipality, South Africa.
2. Materials and Methods
This section presents the methodology we followed. The research methodology was approved by the University of KwaZulu-Natal Biomedical Research Ethics Committee (BREC) with the reference number BREC/00000831/2019.
2.1. Fecal Sludge Collection and Processing
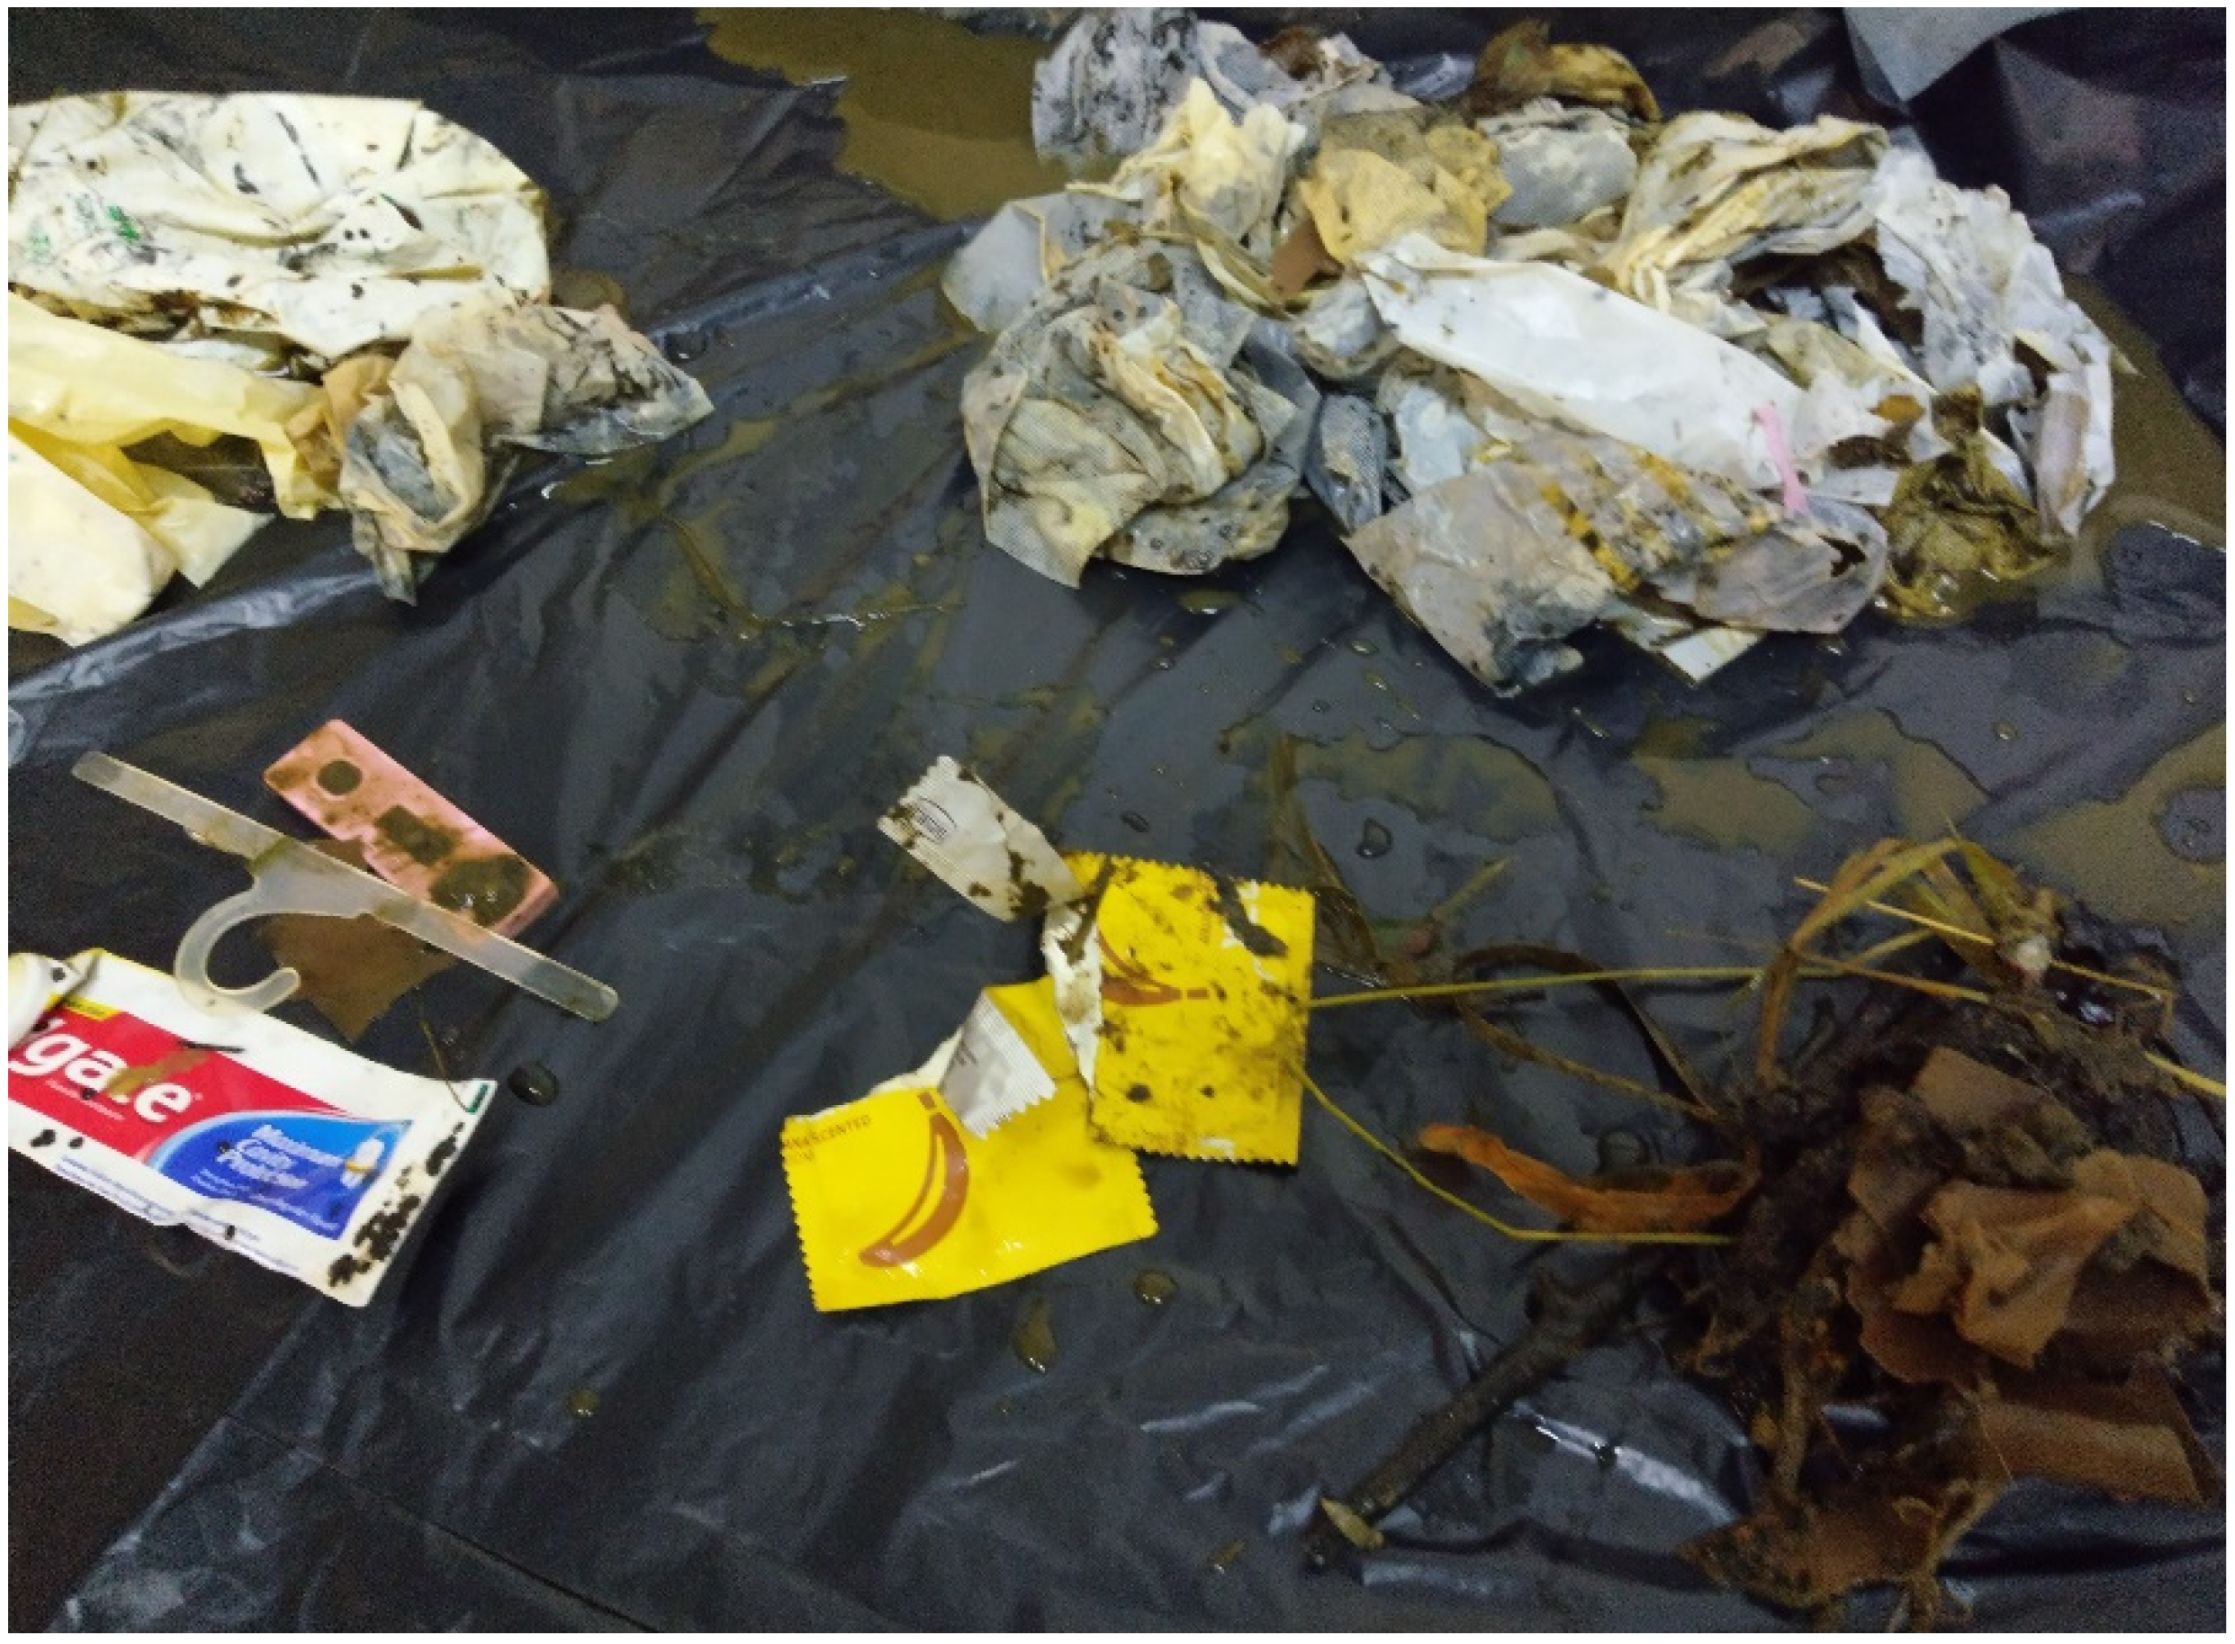
This study used fecal sludge (FS) in laboratory experiments to evaluate the influence of MW treatment on various sludge parameters. The FS was collected from five ventilated improved pit (VIP) latrines during pit emptying in the informal settlements of eThekwini Municipality. A VIP latrine is the most basic form of sanitation prescribed in South Africa and is widely used in the study area. Most VIP latrines in the study area had reached their full-service life and required emptying. Fecal sludge sampling and sample preparation followed standard operating procedures developed by the Water, Sanitation and Hygiene Research and Development (WASH R&D) Centre at the University of KwaZulu-Natal. Between 2 and 5 kg of FS were collected in 5 L plastic buckets lined with plastic paper. Individual grab samples were mixed to form a composite sample of about 15 kg. Samples were transported to the WASH R&D Centre’s specialized sanitation laboratory, where they were screened to remove trash (
Figure 1).
The screened FS was homogenized and stored at 4 °C till required for use.
2.2. Experimental Design and MW Treatment
Approximately 200 g of a well-mixed sample was placed in a 250 mL beaker and covered with microwave-safe wrap paper. The samples were treated by MW irradiation at 630, 720, and 810 W for 1, 2, 3, 4, 5, 6, 8, and 10 min. The mass and temperature of the samples were recorded using a benchtop analytical balance and an infrared thermometer, respectively. Using an infrared thermometer, the temperature of the samples was measured immediately after MW treatment (within 5–10 s). The samples were then cooled to room temperature and weighed before further physicochemical analyses. Volume reduction was determined from the difference between the initial and final weight of the sample. The weight loss was mainly attributed to the water evaporating from the FS during MW treatment. Three replicates were prepared for each MW treatment.
2.3. Description of the MW Instrument
All MW treatments were performed in a Hisense domestic MW oven (H28MOMME, Hisense SA, Cape Town, South Africa). The MW oven operates at a frequency of 2.45 GHz with MW power ranging from 0 to 900 W with 11 power increment levels at 10% intervals. The MW oven was operated under a fume hood at the WASH R&D Centre laboratory. A total of 200 mL of water was heated at 900 W for 5 min in the MW oven before using it to treat samples.
2.4. Analytical Methods
Untreated (raw) and MW-treated samples were analyzed for solids (total and volatile) and several chemical parameters using modified methods adapted from standard methods for examining water and wastewater [
26].
Chemical analyses were performed on a solution prepared by diluting 2 g of a well-mixed FS sample in 1000 mL of distilled water. To analyze soluble components, about 40 mL of the prepared stock solution was centrifuged at 500 rpm for 15 min (Universal High-Speed Centrifuges, HERMLE Labortechnik GmbH, Wehingen, Germany). The supernatant was decanted, and aliquots of it were filtered through 0.45 µm syringe filters.
2.4.1. Solids
Clean crucibles were prepared by igniting them in a furnace at 550 °C for 1 h. Cooled crucibles were weighed, and the mass was recorded. Total solids (TS) were determined by measuring the mass loss of the sample (~20 g) after 24 h of oven heating at 105 °C. Volatile solids (VS) were determined from the residue of the TS determination by measuring mass loss after igniting the sample in a furnace at 550 °C for 2 h.
2.4.2. Chemical Oxygen Demand (COD)
Using a commercial COD kit, the dichromate method determined total and soluble chemical oxygen demand. Total chemical oxygen demand (TCOD) was determined on the stock solution, while soluble chemical oxygen demand (sCOD) was determined on the centrifuged and filtered sample. Exactly 2 mL of a sample was pipetted into a COD vial and digested at 150 °C for 2 h. After cooling, the sample was scanned thrice using a portable Hach photometer, DR 900 (Hach
®, Johannesburg, South Africa). The degree of solubilization was determined using Equation (1) [
21]:
2.4.3. Elemental Composition
Carbon (C) and nitrogen (N) were determined using a Leco TruMac CNS determinator (LECO Corporation, St Joseph, MO, USA). The C:N ratio was determined from the values of C and N.
The values of COD, C, and N were normalized to g/kg TS to eliminate the influence of dilution.
Table 1 shows the characteristics of the untreated sludge. The values reported here were in line with the characteristics of raw sludge collected from the same study area [
3].
2.5. Fourier Transform Infrared Spectroscopy and Scanning Electron Microscopy Analysis
The effect of MW treatment on the structural and morphological changes in the FS (S3 samples) was evaluated by comparing the Fourier transform infrared (FTIR) spectra and scanning electron microscope (SEM) images, respectively. The untreated and MW-treated FS were frozen in a household-scale freezer for 24 h and then freeze-dried for a further 24 h using a VirTis Bench Top Pro freeze drier (SP Scientific, Warminster, PA, USA). The freeze-dried samples were ground to a fine powder and used for the FTIR and SEM analyses.
An IRSpirit (Shimadzu Corporation, Kyoto, Japan) equipped with a QATR 10 single reflection ATR accessory (diamond crystal) collected the spectra at 4000 cm−1 to 400 cm−1. Each sample was scanned 16 times, and the average spectra were recorded, which were processed using the LabSolutions IR software Version 2.24.
A Zeiss Ultra Plus FEGSEM (Carl Zeiss Microscopy GmbH, Oberkochen, Germany) coated with Quorum Q150R ES Sputter Coater (Quorum Technologies Ltd., Laughton, OK, USA) captured the images of the untreated and MW-treated samples. The dried sample was mounted onto the SEM stubs with double-sided adhesive carbon tape and imaged on the Zeiss Ultra Plus FEGSEM (Germany) operating at 20 keV. Micrographs were acquired at a magnification of 10,000×, corresponding to a scale bar of 2.5 µm.
2.6. Anaerobic Digestion
The effect of MW treatment on methane production and the biochemical methane potential (BMP) of FS was evaluated using untreated and MW-treated samples. The MW-treated sample for AD was treated at 630 W for 4 min. The AD batch assays were carried out using the AMPTS II system (Bioprocess Control, Lund, Sweden) in 500 mL bottles with an effective volume of 400 mL.
The experimental setup was constructed in RStudio (Version 4.0.1) software using the “biogas” R package (Version 1.23.2). When the “biogas” package was loaded, a “PlanBMP” function calculated the required inoculum and substrate masses based on an inoculum to substrate ratio (ISR) of 2:1 and the VS concentration.
The BMP assays were conducted following standard protocols for anaerobic biodegradability testing. Each treatment was performed in triplicate to ensure reproducibility. Due to logistical constraints, the BMP test was terminated after 26 days, slightly earlier than the conventional 30-day period.
The inoculum and substrates (untreated FS and MW-treated FS) were added to the serum bottles of 500 mL. A blank containing the inoculum only was carried out to subtract the contribution of the inoculum to methane production in substrate bottles. The inoculum was collected from an active mesophilic anaerobic digester treating waste-activated sludge in Delft, Netherlands. All bottles were flushed with N2 for 2 min to create an anaerobic condition and then incubated in a water bath operated at 35 ± 2 °C. The biogas that was produced passed through a 100 mL bottle filled with a 3M NaOH solution mixed with a 0.4% Thymolpthalein pH indicator solution to absorb CO2, leaving methane, which was recorded automatically and normalized to standard conditions.
The digestate from all the reactors was collected. Aliquots of 40 mL from each reactor were centrifuged for 30 min at 4000 rpm. The centrifuged samples were allowed to stand overnight before the supernatant liquid was decanted.
2.7. Statistical Analysis
All experiments were conducted in triplicate, and results are expressed as mean ± standard deviation. Statistical significance was established at p < 0.05. Error bars shown in the Figures represent standard deviations.
3. Results and Discussion
3.1. Effect of MW Treatment on FS Temperature
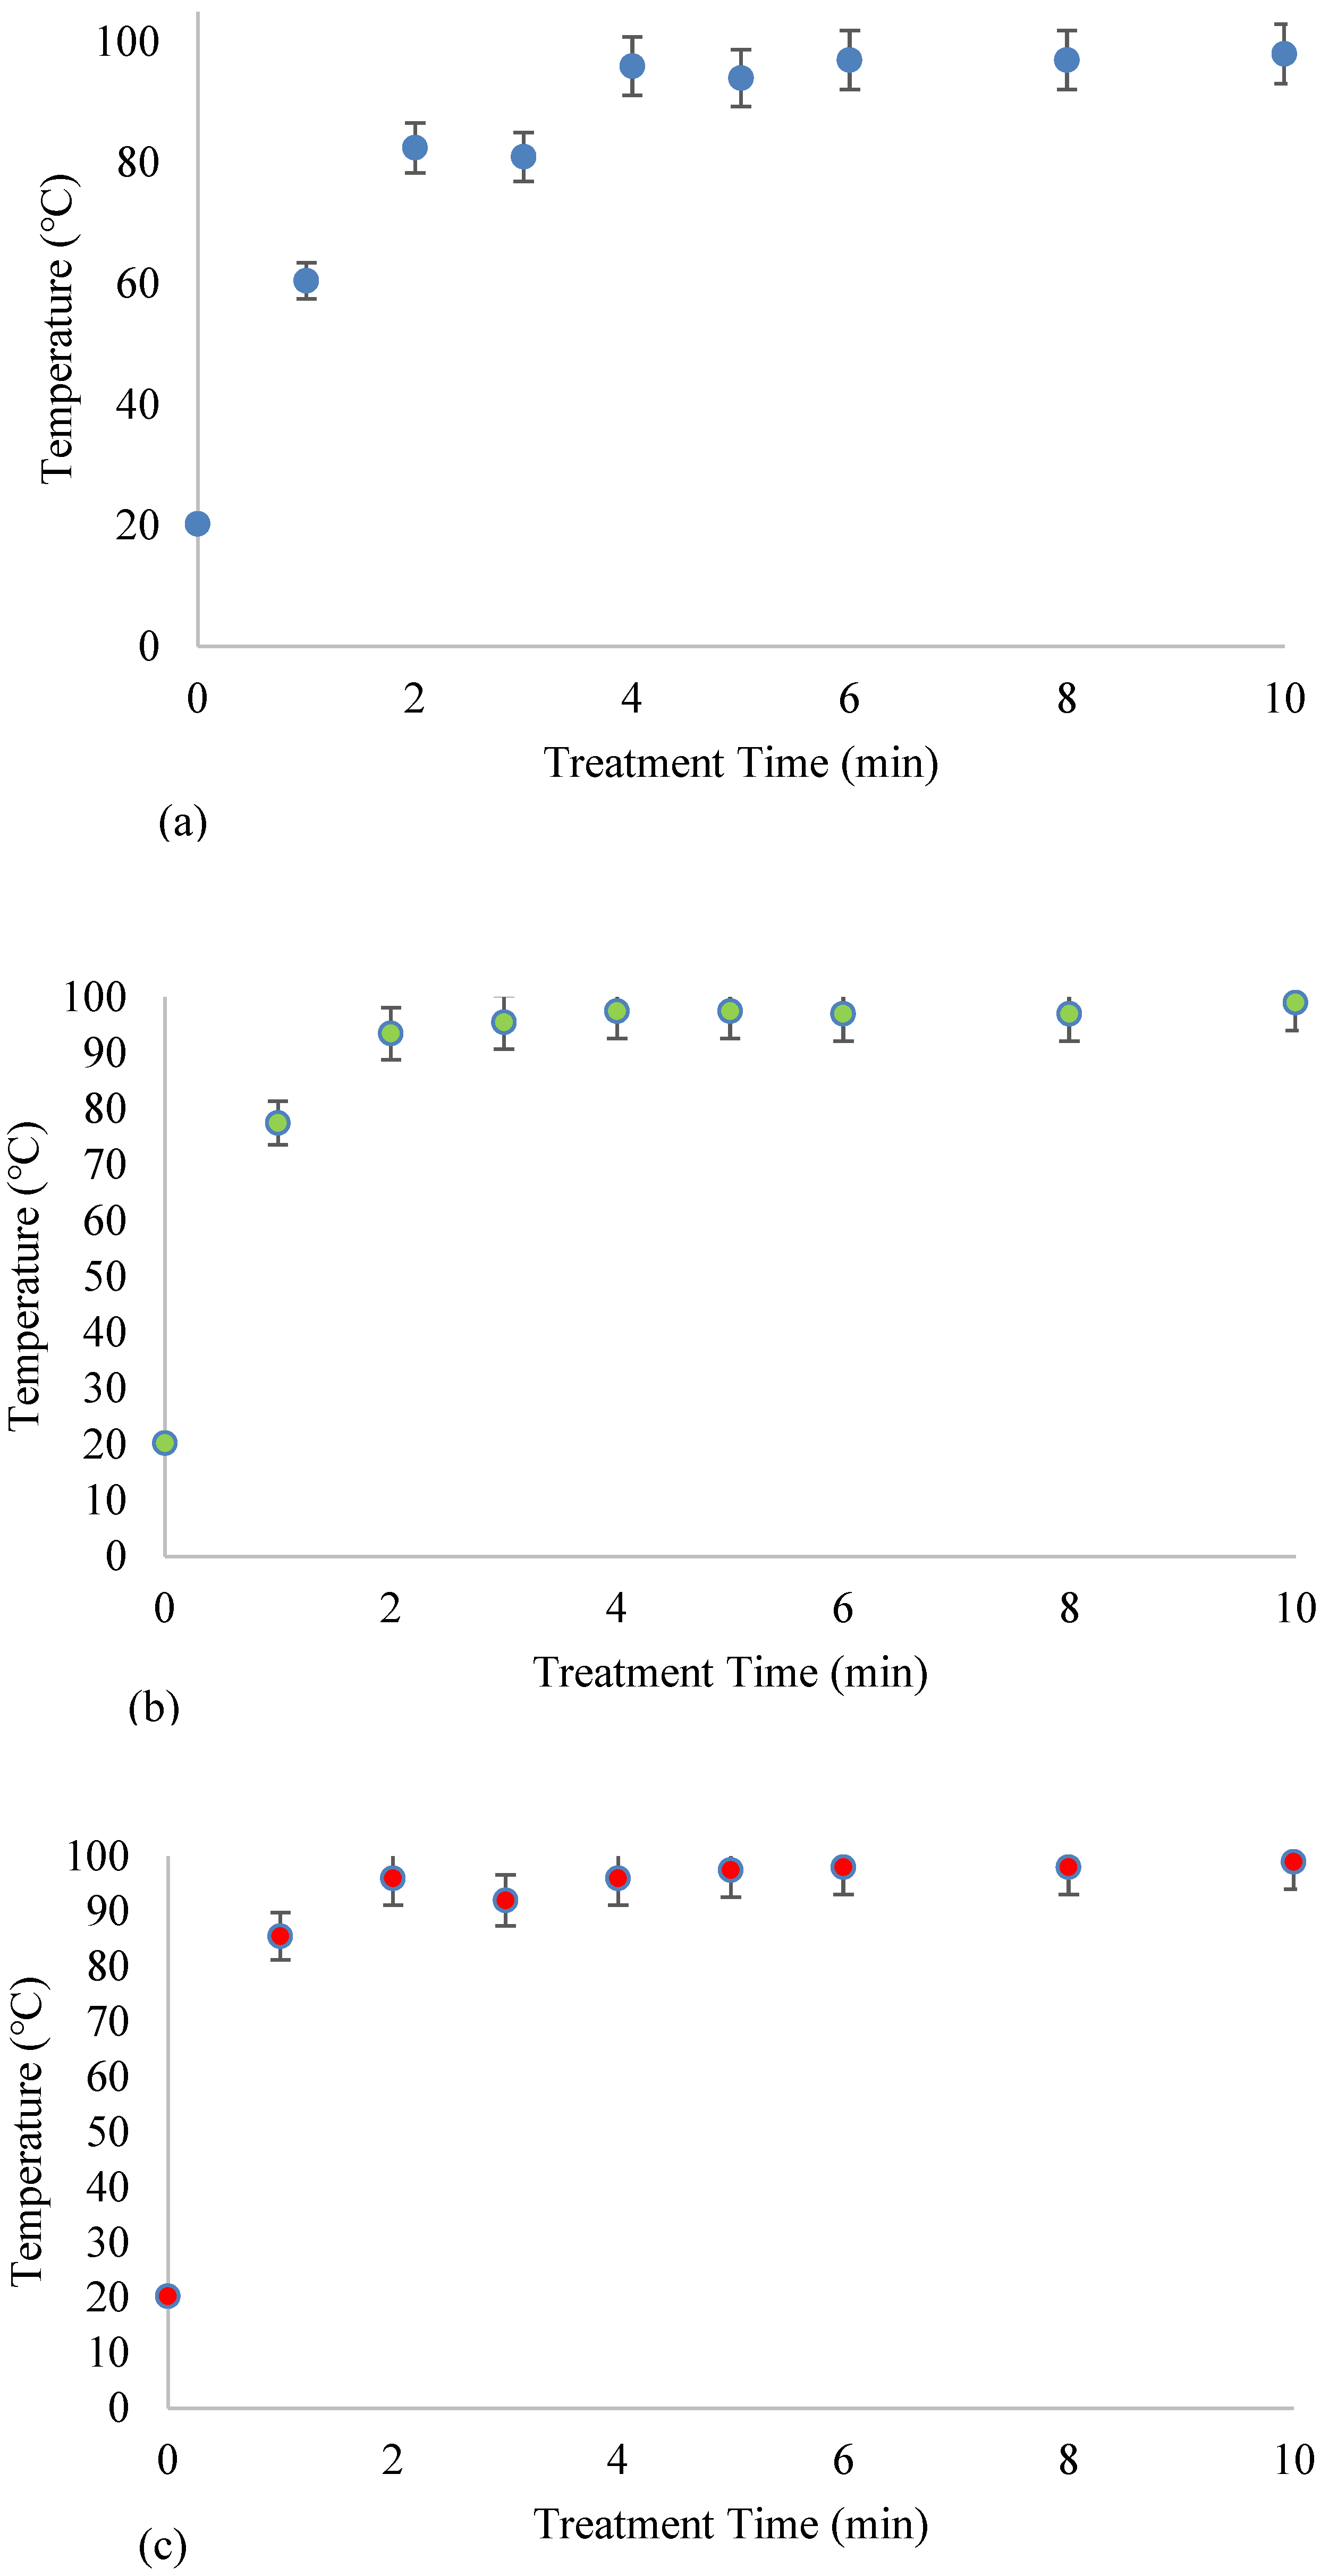
Temperature was measured immediately before and after removing the sample from the MW oven. The maximum temperature recorded (~99 °C) was below the volatilization temperature (~550 °C).
Figure 2 shows the temperature profiles of FS treated at 630 W, 720 W, and 810 W for 1, 2, 3, 4, 5, 6, 8, and 10 min. In general, MW treatment caused a rise in FS temperature from ~20 °C (raw FS) to between 61 ± 0.71 °C and 99 ± 0.00 °C. Two temperature regions were distinguished in
Figure 2, i.e., a rapid linear temperature rise and a constant temperature region. The rapid linear temperature rise was observed until the FS temperature reached ~96 °C, after which the temperature stabilized.
FS treated at the lowest MW power (630 W) took the longest time (4 min) to reach the boiling temperature, while those treated at 720 W and 810 W reached the boiling point after 2 min, suggesting that the energy supplied influenced temperature increase rates. This observation was validated by computing the temperature increase rates for the different treatments. The results showed that the temperature increase rate was 13.8 °C/min (R
2 = 0.81), 16.8 °C/min (R
2 = 0.70), and 37.5 °C/min (R
2 = 0.86) when MW power of 630 W, 720 W, and 810 W was applied, respectively. Similar observations were recorded for blackwater sludge [
25], waste-activated sludge, and septage sludge [
16]. Sludge requires a shorter process time to reach the boiling point for higher MW power [
21].
Temperature profiles are essential in designing thermal sludge treatment processes as they directly relate to the specific sludge-drying phases [
15]. Also, temperature is a critical operating parameter to optimize the MW treatment process to achieve several objectives, e.g., pathogen inactivation to ensure safe handling and land application. The final temperatures achieved in this study were within the range reported to achieve complete inactivation of pathogens, including E coli [
27] and Ascaris eggs [
28].
3.2. Effect of MW Treatment on FS Volume Reduction
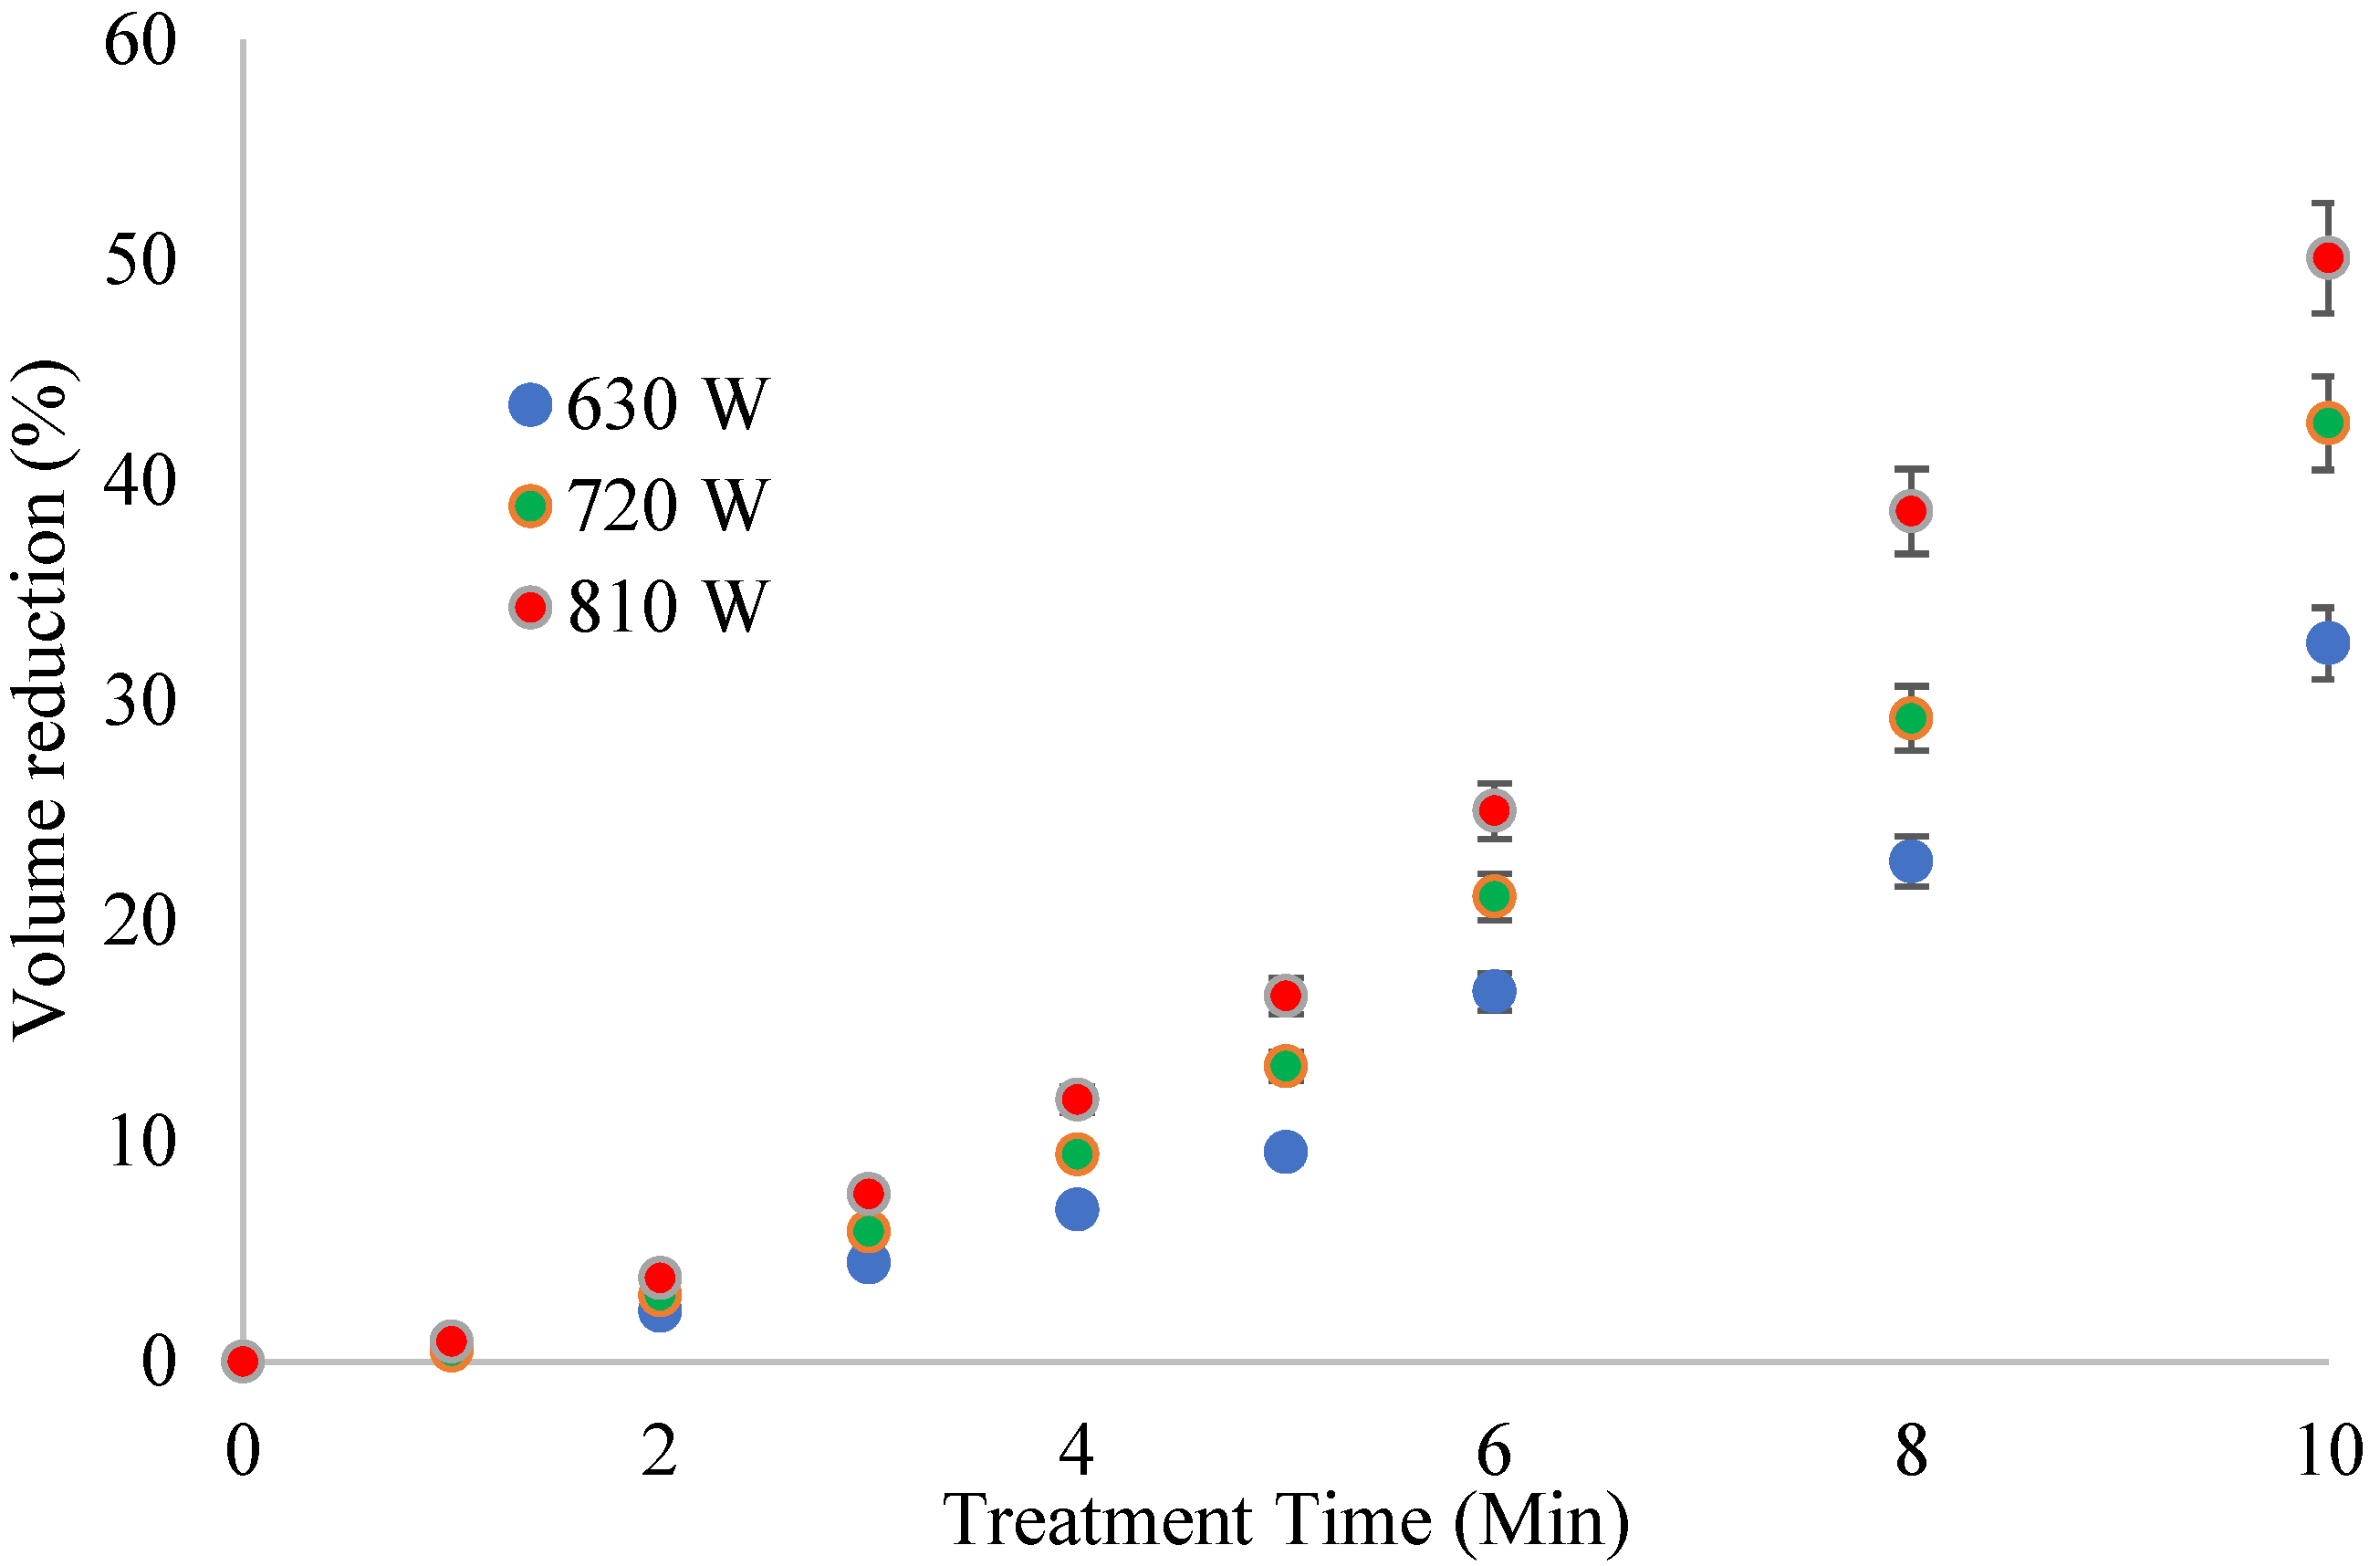
Sludge volume reduction is an important treatment objective as it relates to the volume of solids that can be transported, treated, or disposed of. As stated earlier, MW treatment did not induce volatilization temperatures. Hence, the volume change resulted mainly from removing free water from the FS. Further, the VS content increased in the treated samples due to water loss. Volume reduction varied with the input of MW power and contact time (
Figure 3).
The volume reduction for each level of MW power was similar to the temperature profiles. The highest volume reduction was 50% at 810 W and 10 min. The remaining FS residue at this stage was porous, with a sponge-like structure. The specific energy was critical in the volume reduction in FS. Accordingly, the operating conditions were normalized to specific energy and plotted against volume reduction (
Figure 4).
A linear relationship was observed between the volume reduction and specific energy (R2 = 0.96). This relationship is essential in sludge treatment, where the main aim is to reduce the volume of FS. The fitted regression model can predict the extent of volume reduction during MW treatment of FS. The reduced FS volume means less FS requiring handling, transportation, and disposal.
3.3. Effect of MW Treatment on FS VS/TS Ratio
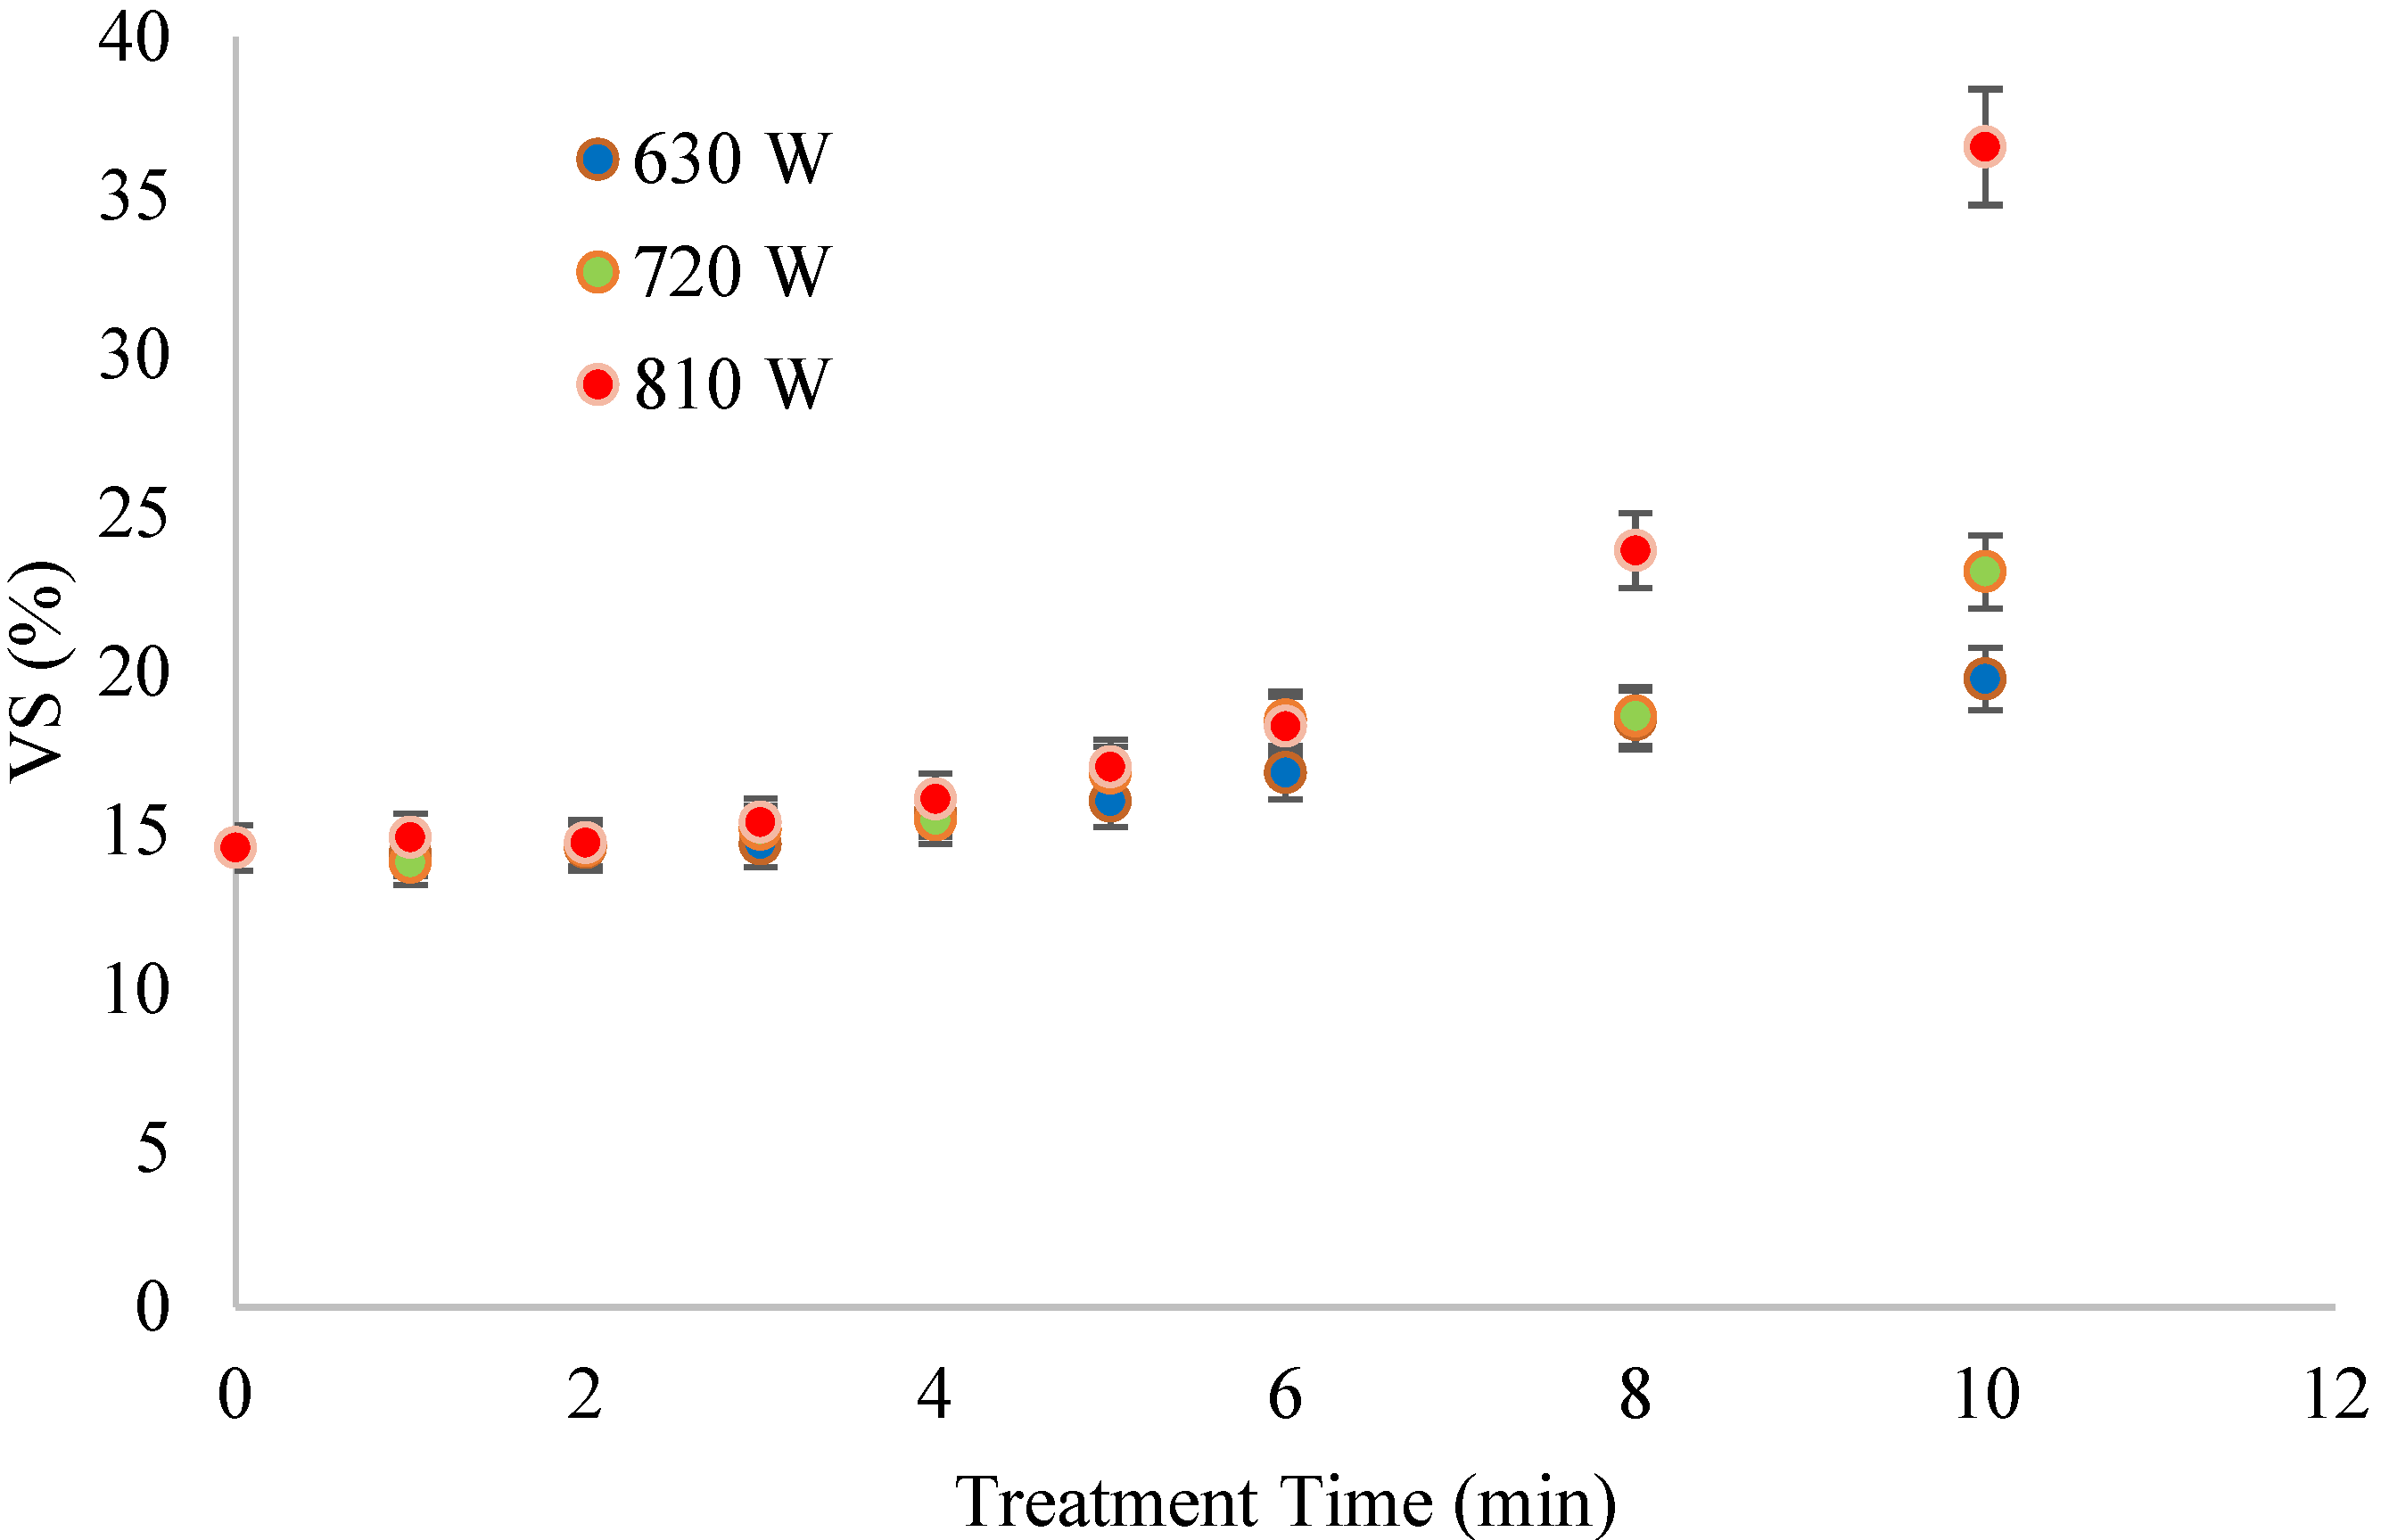
The VS in the treated FS were virtually similar to those in the raw FS, possibly due to the temperatures achieved during treatment compared to the volatilization temperature. Despite this observation, there was a general increase in VS with contact time at each MW power level. The lowest increments were observed at 630 and 720 W, while treatment at 810 W showed a remarkable increase in VS after 6 min (
Figure 5).
The supplied energy disintegrated the flocs and released VS components without volatizing them. Thus, FS retained the organic matter that microorganisms could utilize during anaerobic digestion. The VS/TS ratio ranged from 56% to 68%, within the range of stable sludges.
3.4. The Effect of MW Treatment on Organic Matter Solubilization
The change in sCOD evaluated the effect of MW treatment on FS solubilization. The raw FS had a sCOD of 113.44 ± 4.42 gO
2/kg.TS, which increased with MW treatment. The increase varied according to the MW power used. MW treatment at 630 W for 4 min achieved the highest (162%) sCOD release, lower than those reported by [
29,
30] and higher than that reported by [
31]. The difference could be attributed to the nature of the sludge used. Sewage sludge is relatively fresh (sCOD/TCOD ~ 3%), while FS is generally stabilized as it has stayed in the pit latrine for a long time (~5 years) before it is emptied [
31].
Two sCOD phases were identified for samples treated at 630 W and three for samples treated at 720 and 810 W (
Figure 6), i.e., initial sCOD release phase, degradation of sCOD, and a slight sCOD release (only at 720 and 810 W).
The sCOD release and degradation varied across the treatments used. The initial sCOD release was rapid at 810 W and slowest at 630 W. Also, the initial sCOD release duration varied according to the MW power. Maximum solubilization was achieved after 4 (29.82 ± 1.29%), 3 (27.54 ± 1.19%), and 1 (24.05 ± 1.06%) minutes at 630, 720, and 810 W, respectively. The rate of sCOD release was determined to be 3.9 gO
2/kg.TS.min (R
2 = 0.92) and 5.6 gO
2/kg TS.min (R
2 = 0.95) at 630 W and 720 W, respectively. At 630 W, the decrease phase continued until 6 min and remained similar afterwards. The decrease phase was followed by a slight sCOD release phase for FS treated at 720 and 810 W. The maximum sCOD coincides with the FS boiling temperature (~96 °C) in all treatments. The highest sCOD/TCOD (29.82 ± 1.29%) was achieved at 630 W, where the temperature increase rate was 13.8 °C/minute. A low temperature ramp gives enough time for the MWs to interact with the sample, allowing a slow but efficient release of biopolymers [
32,
33].
The initial sCOD release could have resulted from the MW effect that disintegrated FS flocs, disrupted cell walls, and transferred soluble organics into solution [
21]. A sCOD degradation phase could have resulted from gelatinization of lignocellulose, recapturing of the solubilized organics within flocs (agglomeration), cell damage, or local thermal reactions due to the rapid increase in temperature from room temperature (~20 °C) to higher temperatures [
34,
35]. It is crucial to understand the evolution of organic matter solubilization during MW treatment to identify the critical operating parameters. Although there was a second phase of sCOD release during MW treatment, its increment was not higher than the first. Therefore, MW treatment could be stopped once the first peak was reached. Any further treatment will only waste energy because it will not result in meaningful sCOD release.
3.5. Correlation Between sCOD and Macromolecules
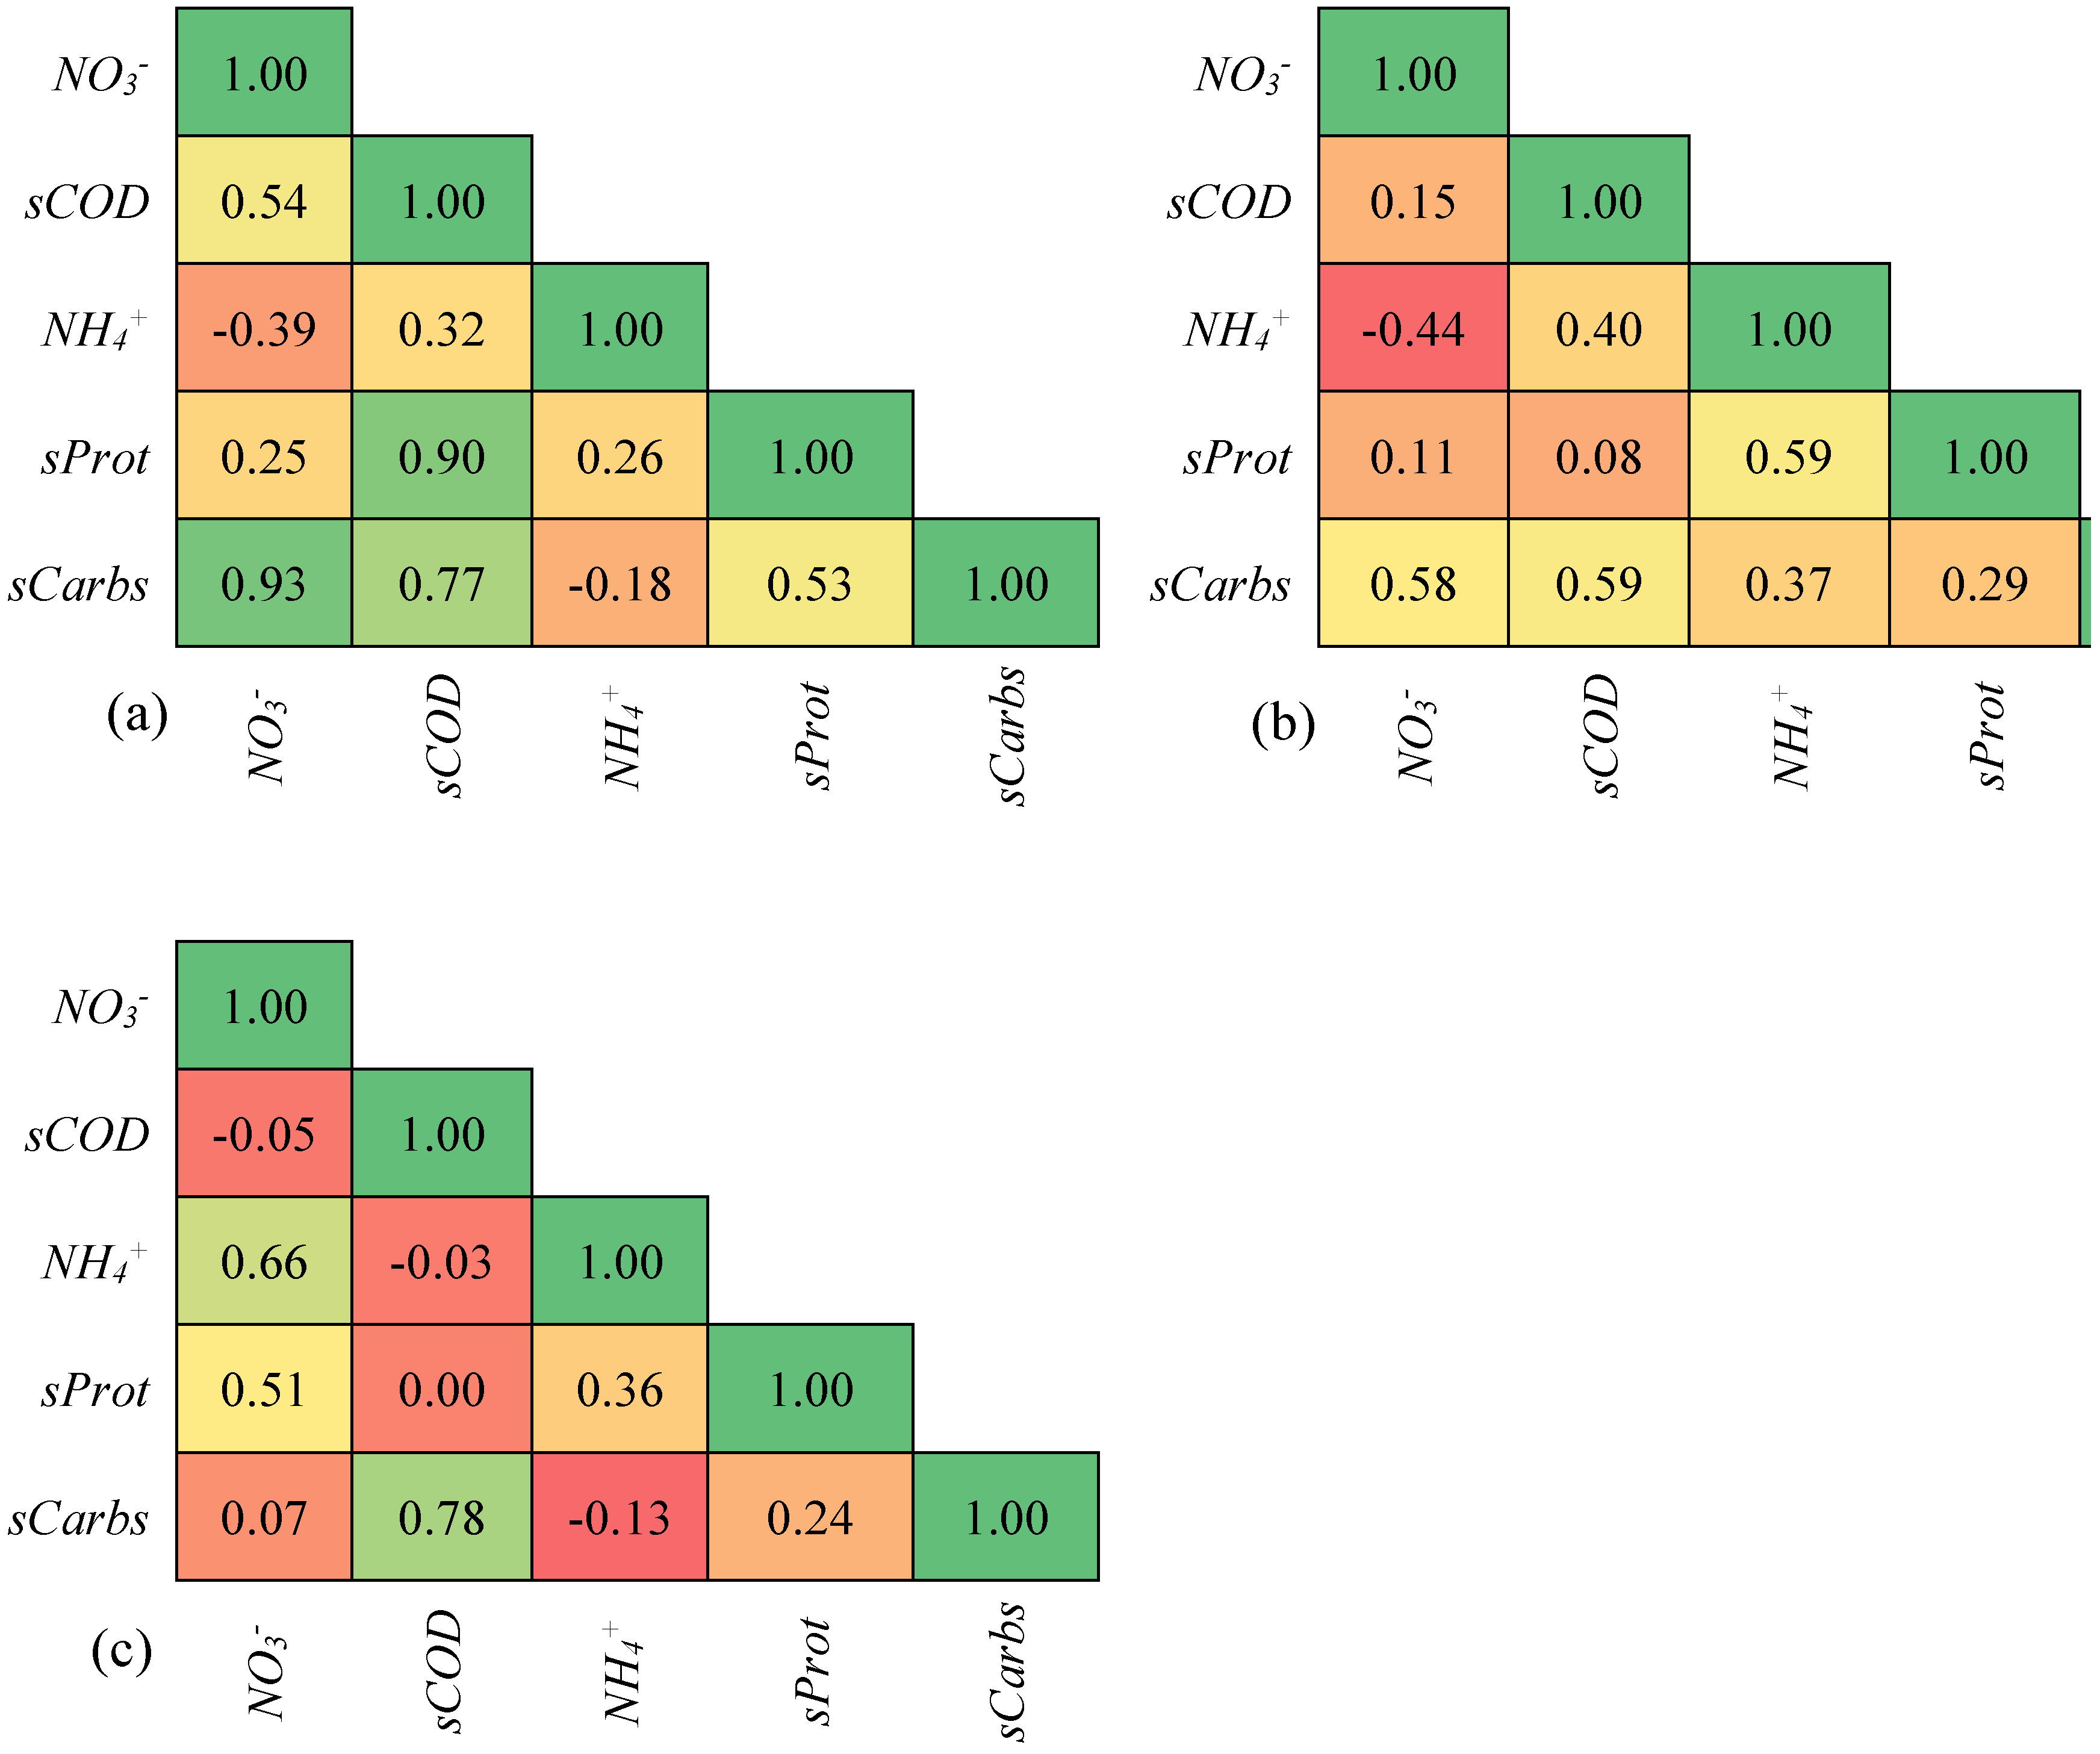
Pearson’s r correlation, presented as a heat map between sCOD and its predictors (sProt, sCarbs, ammonium, and nitrate), is shown in
Figure 7a–c. The concentration of sCOD increased with an increase in sProt (r = 0.9) and sCarbs (r = 0.8) (
Figure 7a). NH
4+-N and NO
3−-N also contributed to the increase in sCOD, though to a much lesser extent. The increase in sProt, sCarbs, NH
4+-N, and NO
3−-N confirms the MW effect on disrupting sludge flocs. Their increase is a result of the transfer of biopolymers in solution, which increased the sCOD, leading to a positive correlation.
The contribution of sProt diminished at MW powers of 720 W and 810 W. There was virtually no sProt contribution to sCOD at 810 W (r = 0.0). The observation was supported by the negative correlation between sCOD with NH
4+-N and NO
3−-N at 810 W. Also, supporting this observation are the sCOD profiles in
Figure 6. Therefore, the observed increase in sCOD is mainly due to the increase in sProt and sCarbs.
3.6. FTIR Spectra Analysis of Untreated and MW-Treated VIP Latrine Sludge
FTIR analysis was used to understand the major functional groups in the untreated FS samples and their transformation during MW treatment. The interpretation of the observed spectra and their spectral band allocation was based on the literature on FTIR of human biowastes and reference materials [
20,
36]. The observed functional groups and their band allocation are presented in
Table 2.
Several peaks were observed in different regions of the IR spectrum. Absorption bands in the region of 3500–3200 cm−1 were attributed to the presence of O-H and N-H stretch functional groups present in alcohols, amines, and amides. The O-H functional group was also present in the 3300–2500 cm−1 region. The C-H stretch functional group was also present in this band. These functional groups were attributed to carboxylic acids and alkanes. Other peaks were observed between 2260 and 2100 cm−1 and were attributed to the C=C stretch in alkenes. The N-H bend functional group was present in the region of 1650–1580 cm−1, which indicated the presence of primary amines. Absorption bands in the range of 1550–1475 cm−1 and 1390–1300 cm−1 indicated the presence of N-O asymmetric and symmetric stretches, respectively. The N-O functional groups in these regions indicated the presence of nitro compounds in the FS. A C-C stretch associated with aromatic hydrocarbons was observed between 1500 and 1400 cm−1. Also, functional groups associated with aromatic amines were observed at 1335–1250 cm−1. Finally, the C-O stretch was observed at 1320–1000 cm−1.
The presence of O-H functional groups could be attributed to OH groups in cellulose, hemicellulose, and starch, which are principal components of carbohydrates. The presence of the C-C and C-O functional groups in the region of 13,200–1000 cm
−1 (which is the fingerprint region for carbohydrates) supports the above conclusion [
37]
MW treatment did not change the structure of the compounds in the FS, as most functional groups were present in both the raw and treated samples. This observation was expected because the temperatures achieved during MW treatment were not high enough to induce structural changes. However, spectral intensities diminished after treatment, which implied that the FS stabilized.
3.7. Surface Morphology
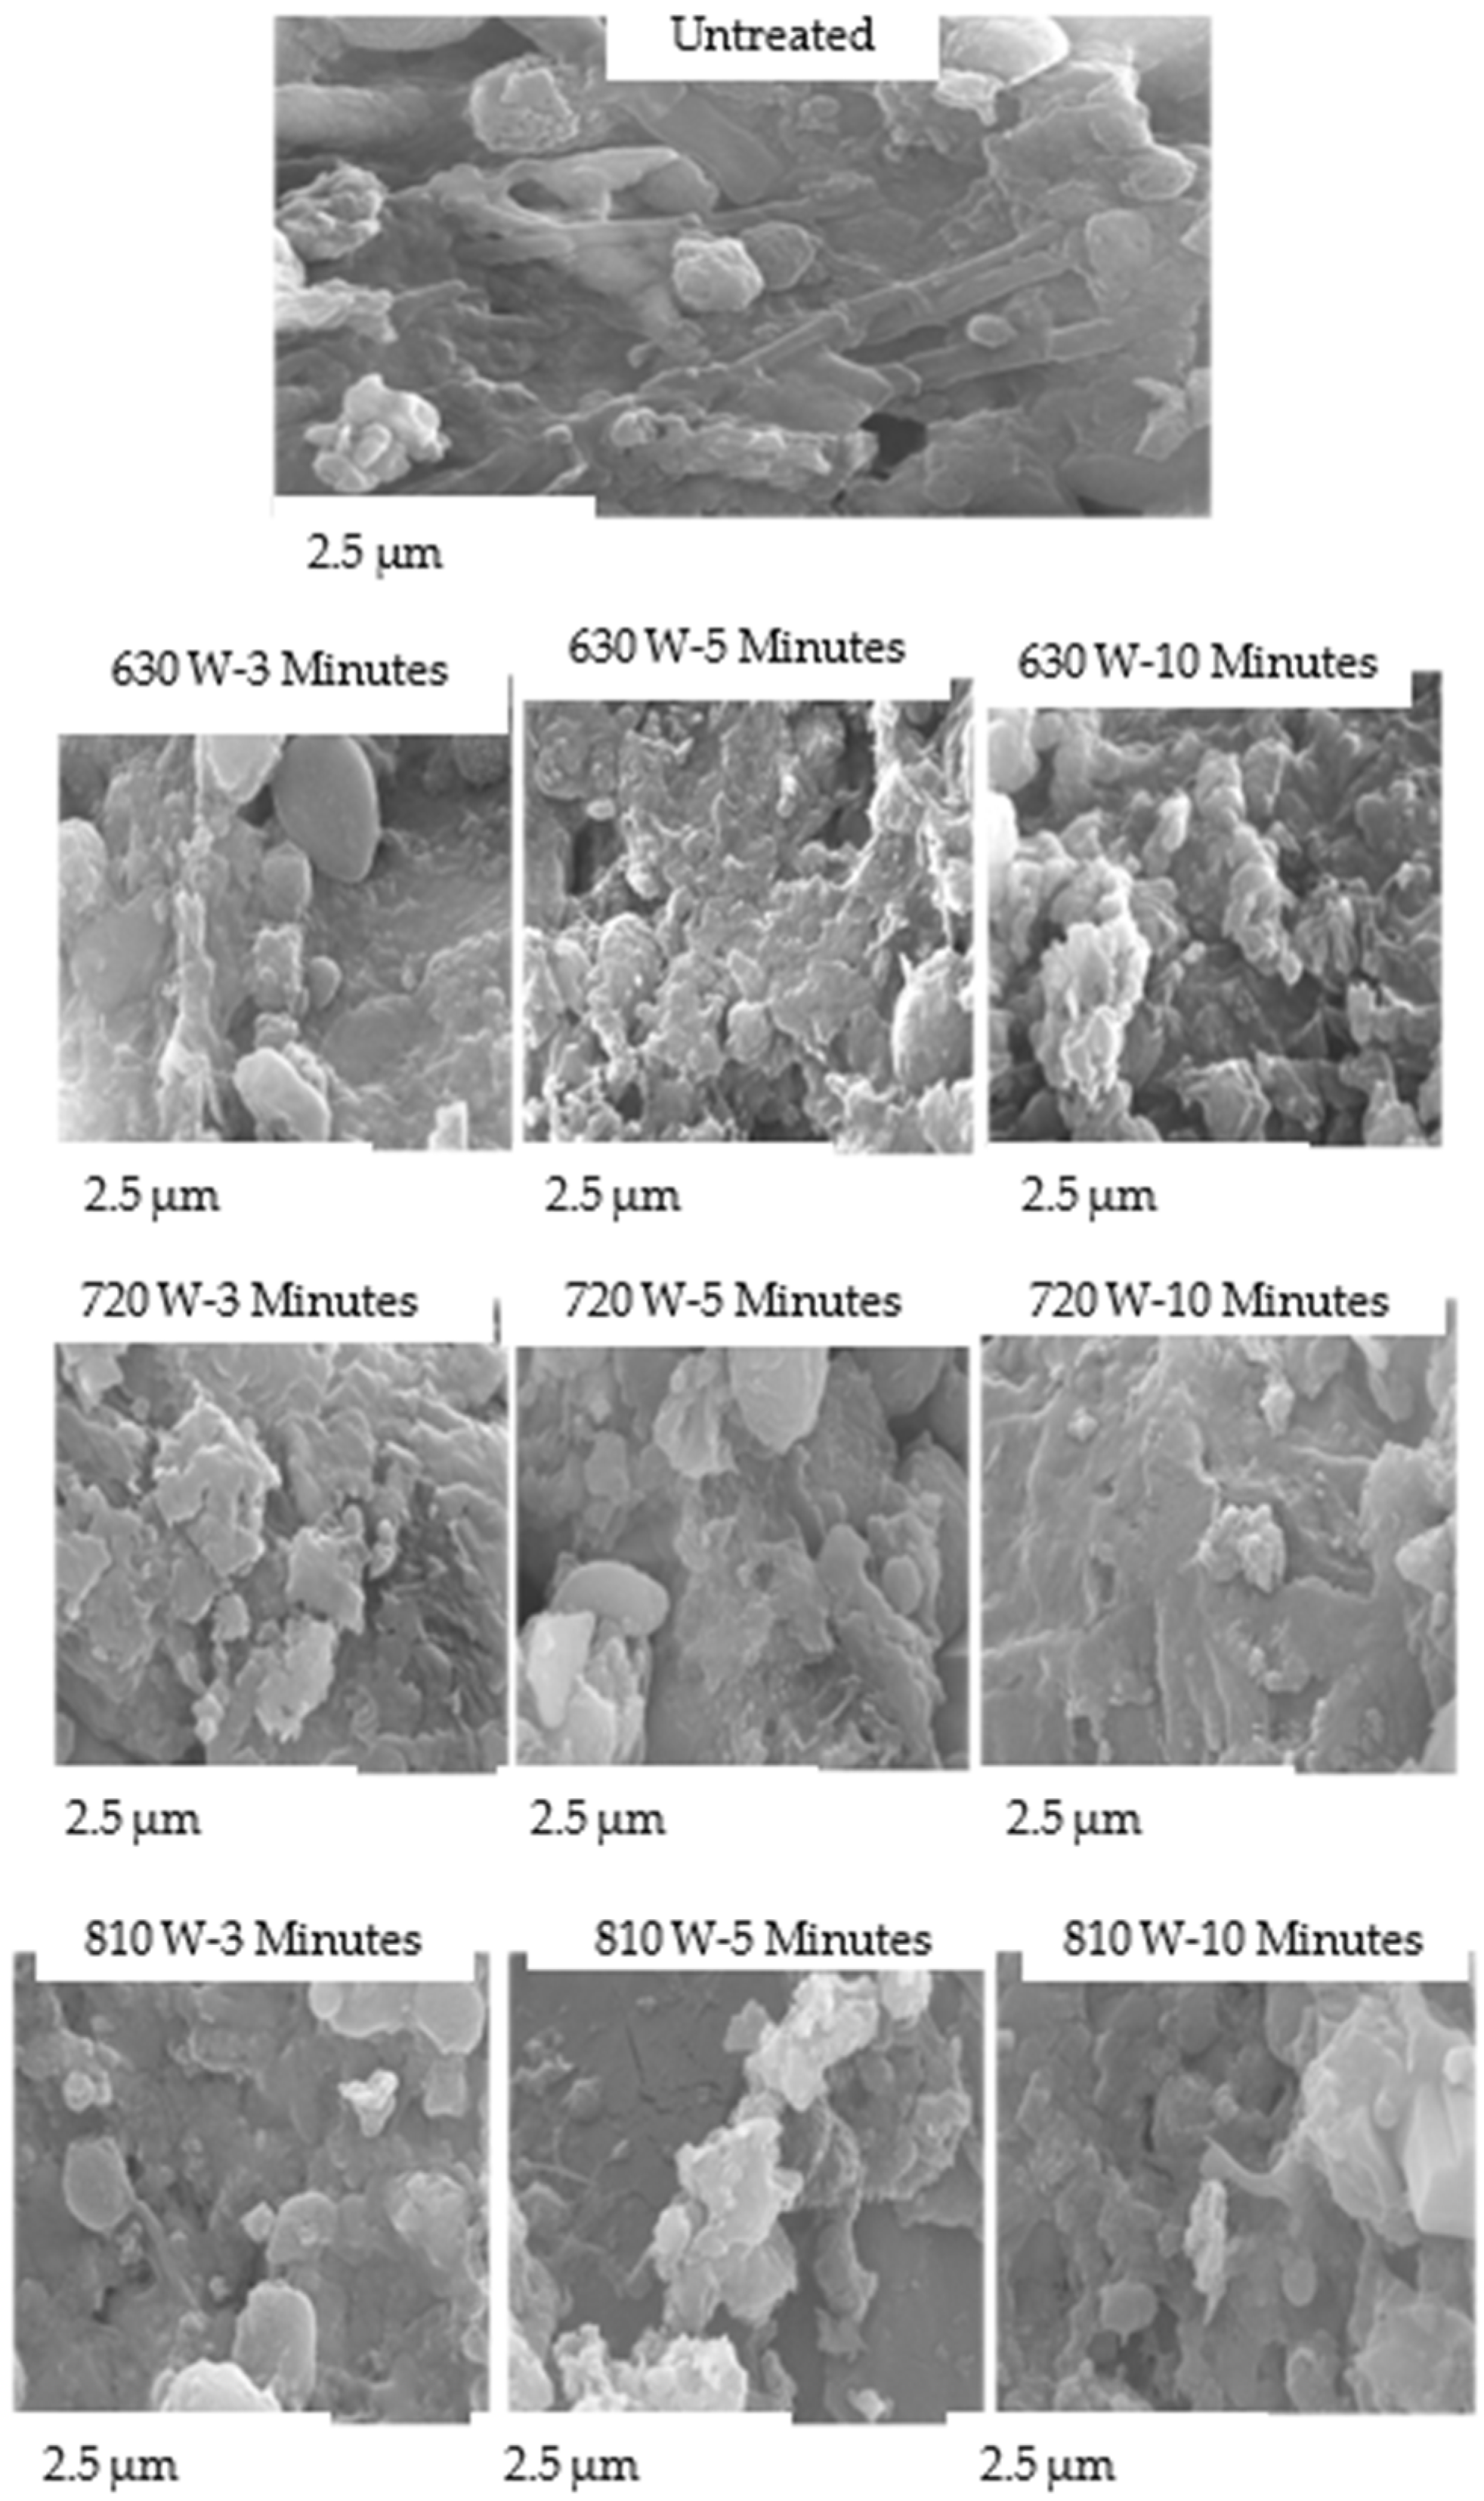
The SEM micrographs of the FS floc structure provided visual evidence of the series of changes induced by MW treatment. Raw FS samples had an undisturbed structure with fewer observable pores, while the treated samples were more porous, fibrous, rough, and agglomerated (
Figure 8).
The degree of morphological transformation increased with longer treatment durations. At shorter treatment times, only minor surface roughness and initial crack formation were observed, indicating partial dehydration. With extended treatment time, the microstructure became more fragmented and porous, and the aggregates disintegrated into smaller particles. This progressive structural change reflected continuous thermal stress and vapour expansion within the FS as the exposure time increased. The gradual loss of surface cohesion corresponds to increased volatile release and reduction in organic matter, as observed in the physicochemical analyses (
Figure 6).
Similarly, increasing MW power increased structural modification. Low MW power (630 W) treatment caused slight deformation, while intermediate- (720 W) and high-power (810 W) treatments produced extensive rupturing, porosity, and localized carbonization due to strong dielectric heating.
The porous microstructures may have resulted from MW selective heating of polar molecules, which resulted in the dissociation of bound water. MW volumetric heating, causing a rapid transfer of free water from the core to the surface, could have left a porous structure. Roughness and agglomeration can also be caused by fracturing bonds and forming disulfide or isopeptide bonds [
38]. The rough and agglomerated structures could explain the sCOD degradation phase (
Figure 6), as they could have entrapped the solubilized organics. Porous structures could be advantageous during FS dewatering and drying because the pores would make water flow more easily and result in quicker drying and dewaterability of the digestate [
17]. Improved porosity is also advantageous because it enhances air distribution during combustion of MW-derived FS solid chars and results in their fast reactivity during thermal decomposition [
17].
These findings indicate that both treatment time and microwave power significantly influence the extent of FS disintegration, dehydration, and surface restructuring, consistent with trends observed in the physicochemical analyses (
Figure 6).
3.8. The Effect of MW Treatment on Carbon (C), Nitrogen (N), and Sulphur (S)
The ultimate analysis of raw and MW-treated FS was performed to determine the effect of MW treatment on C, N, and S. These elements did not significantly change during MW treatment. The concentrations of C, N, and S ranged between 264–371 gC/kg. TS, 32–50 gN/kg.TS and 3–9 gS/kg. TS, respectively, and were within the range found in FS [
18,
39]. The nutrient content of the treated FS was within the range of compost and manure [
40]. The C:N ratio was computed from the C and N and ranged between 4.2:1–10:1, within the range for human feces and dried FS, but below the ideal C:N for biological treatment [
41]. Co-composting or co-digestion with carbon-rich dry material should be considered to improve the biological treatment of FS.
3.9. Effect of MW Pretreatment on Methane Production and Yield Kinetics
Biochemical methane potential (BMP) tests were used to determine the digestibility of the raw and MW-treated FS samples. FS pretreatment was carried out at 630 W for 4 min, as this was determined from the sCOD increases to be the optimum pretreatment conditions.
3.9.1. Cumulative Methane and Specific Methane Production
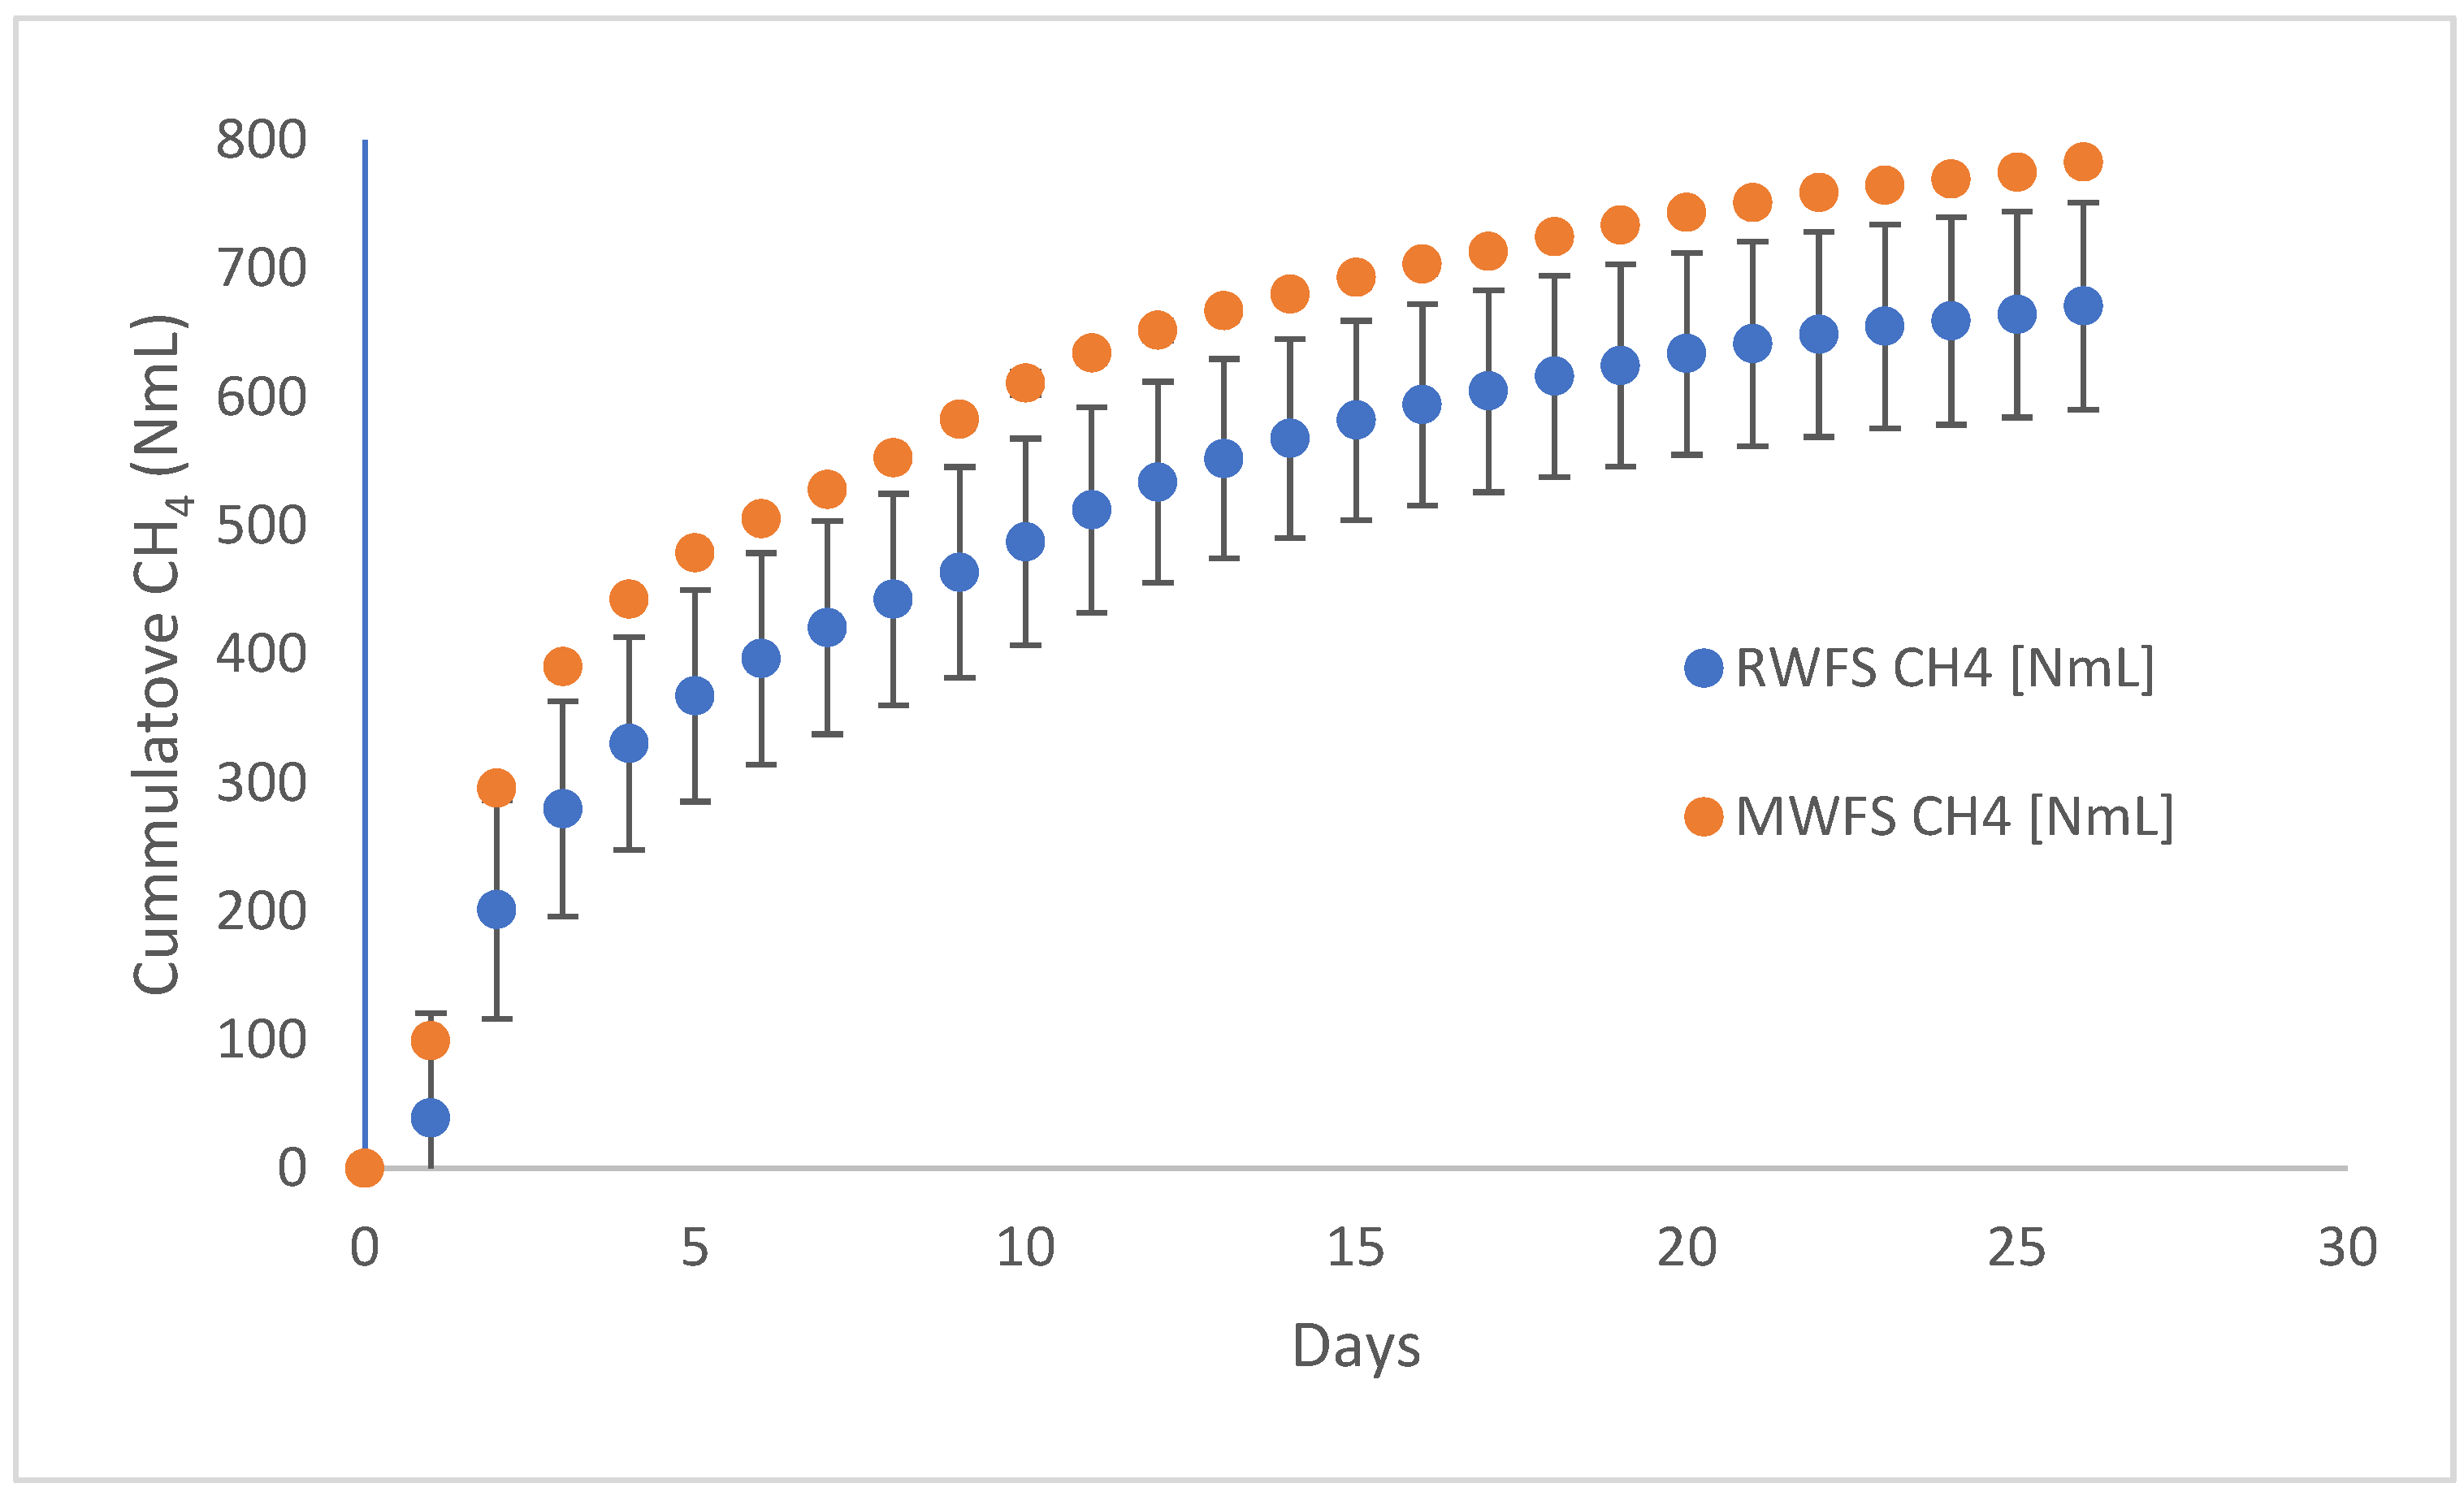
The cumulative and specific methane production of the raw and MW-treated FS and their co-substrates were determined from batch tests. The batch tests were run for 26 days due to logistical issues. The cumulative methane production was higher in MW-pretreated FS than in the raw FS (
Figure 9).
Cumulative methane production from MW-pretreated FS was 783 NmL, while the raw FS produced 672 NmL of methane, which was significantly lower (
p < 0.05). The specific methane production of raw FS was lower than the MW-treated FS. While MW treatment resulted in a specific methane production of 128 NmL CH
4/g.VS, it was only 110 NmL CH
4/g.VS in the untreated FS. The enhancements in cumulative and specific methane production were approximately 17% and 16% over the untreated FS, respectively. The untreated and MW-treated FS samples had comparable VS/TS ratios. Thus, the observed differences in methane production were attributed to the MW effect, which liberated extracellular and intracellular biopolymers and made them more easily accessible to microorganisms during anaerobic digestion [
42]. Although the methane production results in this work were higher than those reported by [
43] (using FS from the same area), they were within the range reported for various types of sludges using different pretreatment methods [
44].
3.9.2. Organic Loading Rate and Methane Production Rate
The organic loading rate (OLR) and methane production rate (rG) relate to the amount (VS) of substrate added to the reactor, with reactor volume (L) and time (days). Although low values of methane production may indicate that pretreatment is not a viable step, the OLR and methane production rate should also be considered when evaluating the viability of pretreatment. The OLR was calculated from the VS added to the reactor and the time required to reach 80% of the cumulative methane for each feed substrate [
30,
45].
Table 3 presents the values of OLR and methane production rate for the various feed materials used in this study.
MW treatment increased the OLR and methane production rate by 18% and 33%, respectively. These results showed that the MW treatment of FS can increase the amount of material treated per unit volume of the reactor and increase methane production. Consequently, smaller reactor volumes could be used, reducing the land footprint. The enhanced rate of methane production showed that the digestion process was faster. Hence, more material can be digested within a given period.
3.9.3. Digestate Analysis
Carbon (C) and nitrogen (N) content were analyzed on the digestate cake and the supernatant (
Table 4).
MW treatment influenced the partitioning of C and N between the solid and liquid fractions of the digestate. In the raw FS, ~95% of the C and ~97% of N were retained in the solid fraction. Following MW treatment, the digestate retained 90% of C and 99.8% of the N, indicating a slight reduction in C retention and enhanced N fixation in the solids. This observation confirmed that MW treatment made C and N easily accessible to microorganisms, leading to a higher utilization [
46]. The lower C retention suggests more C was utilized by microorganisms during AD, thereby reducing the C/N ratio of the MW-treated digestate. This reduction may limit the direct suitability of digestate as a soil conditioner, as materials with low C/N ratios can lead to nitrogen losses through ammonia volatilization or cause phytotoxic effects if applied unamended. Conversely, the higher N retention implies that MW treatment enhances the stability of nitrogenous compounds within the solid phase but also raises the risk of ammonia release during post-treatment handling and storage. To minimize these risks, MW-treated digestate could be co-composted or blended with C-rich bulking agents to restore an optimal C/N balance, while any N-rich liquid fraction should be directed to sidestream polishing units prior to discharge or reuse. Overall, the observed C/N partitioning highlights important implications for digestate management, both in terms of valorization potential and environmental safeguards.
4. Conclusions
The challenge of extending conventional sewerage infrastructure to informal settlements continues to pose significant public health and environmental risks. This study explored the potential of MW treatment as a novel FS management strategy in densely populated urban areas. The findings revealed that MW treatment resulted in substantial volume reduction (>50%), enhanced solubilization of organic matter, and improved nutrient content. Furthermore, BMP tests demonstrated that MW-treated FS produced higher methane yields and supported increased organic loading rates compared to untreated samples.
The findings of this study demonstrate that MW treatment is a promising pretreatment or stand-alone technology within urban sanitation value chains. In real-world applications, MW systems could be integrated into existing fecal sludge treatment plants to enhance drying prior to composting, co-treatment, or AD, thereby reducing treatment time and improving energy recovery efficiency. At a decentralized level, compact MW units could serve container-based sanitation systems or emergency response setups where rapid sludge stabilization is required. The adoption of MW technology, combined with renewable energy sources, offers a pathway toward energy-efficient and safe FSM that supports circular economy objectives. However, scaling MW treatment in low-resource settings presents practical challenges, including high energy demand, limited grid reliability, and the relatively high capital and maintenance costs of MW systems compared to conventional treatment options.
Future research should prioritize detailed energy balance and techno-economic analysis to evaluate the feasibility and scalability of MW-assisted FS treatment, particularly in resource-constrained urban contexts. Such analyses should incorporate co-benefits, including reduced treatment time, improved sanitation outcomes, and enhanced resource recovery potential.
MW technology offers a promising, scalable, and context-appropriate solution for FS management in informal settlements, addressing critical gaps in sanitation infrastructure while contributing to circular economy objectives and public health improvements.
