1. Introduction
Western China is rich in coal resources. Its main stratigraphic sedimentary structures are shallowly buried coal seams (with a burial depth of less than 100 m in some mining areas), thin bedrock and an overlying thin unconsolidated layer [
1]. These features make large-scale underground mining with full-seam mining in one pass or open-pit mining possible. However, the region has a dry and infertile climate with fragile ecological environment. Under the combined effect of intense mining activities and special engineering geological conditions, it is highly prone to sudden water and sand inrush disasters. The water and sand would inundate the workers and equipment, and often accompany surface subsidence accidents [
2,
3,
4,
5]. A notable example is the water and sand inrush caused by boreholes at the Longde Coal Mine in Shaanxi Province [
6], where the total surface subsidence volume was approximately 16,354.2 m
3, with an average collapse flow rate of 3270.8 m
3/h (see
Figure 1). Coal seam roof collapse accidents and surface subsidence caused by coal seam disturbance exacerbate the imbalance of the regional water and soil environment, severely hindering the development of regional coal resources and the sustainable development of the ecological environment [
7,
8,
9].
Due to the concealed nature of underground engineering, it is difficult to study the mechanisms by which water and sand inrush cause disasters through on-site observations. Therefore, many scholars have analyzed the evolution of these disasters via methods such as similar model tests, laboratory tests and numerical simulations. Zeng et al. [
10] conducted a similar modeling experiment, dividing the process of disaster caused by the water and sand inrush into three stages: overlying rock fracture development, water-sand channel formation and evolution of the channels. Liu et al. [
11] have clarified that the degree of compaction, water pressure and confining pressure all regulate the duration and intensity. Wang et al. [
12] proposed that there is a positive correlation between the thickness of the sand layer and the particle size of the sand and the critical hydraulic gradient.
Yang et al. [
13] proposed that, in the Neogene Pliocene Series N
2 red soil stratum, there are two types of water and sand inrush. The type of inrush depends on the relationship between the initial fracture width and the thickness of the soil layer. Shen et al. [
14] investigated the localization characteristics of strain rate, dissipated energy, and particle spin rate during ground disturbance propagation in the context of tunnel water and sand inrush under dual-stratum conditions. Jiang et al. [
15] analyzed water-sandy dolomite tunnels and, through fluid-solid coupling model experiments, revealed three types of water inrush mechanism.
The evolution process of water and sand inrush is synergistically regulated by multiple factors, and scholars have conducted studies on factors such as clay content, water pressure conditions, sand particle size, and porous media channels. Regarding the influence of clay content: Chen et al. [
16] clarified the differences in the evolution paths of water and sand inrush and the characteristics of collapse pits under different clay contents by controlling the clay content of the unconsolidated layer and combining it with the morphological analysis of collapse pits; Yuan et al. [
17] pointed out that the initial rate of water and sand inrush is mainly determined by water pressure, and classified settlement funnels into two types based on clay content.
Regarding sand particle size and porous media channels, the migration characteristics of water and sand inside porous media channels have been obtained by controlling the particle size of fractured rock, porosity, and sand particle size [
18,
19,
20]. Liang et al. [
21] found that there are two migration modes—“seepage-driven” and “force-driven”—for the flow of sand-mud-water mixtures in porous media; Xu et al. [
22] pointed out that the porosity and skeleton structure of fractured rock mass are key disaster-causing factors; Zhang et al. [
23] indicated that fractured rock mass has a certain sand-filtering capacity, and when its load-bearing limit is exceeded, the sand gushing volume shows a significant increasing trend with the initial sand mass; Liang et al. [
24] clarified the quantitative relationship between sand flow velocity and caving zone height. PU et al. [
25] pointed out that, before entering the fissure, the sand grains formed a funnel shape with a gradually increasing radius, which eventually stabilized. Zhang et al. [
26,
27] pointed out the morphological characteristics of mining-induced fractures in different stratigraphic sedimentary structures, and indicated that the ratio of fracture width to sand particle size is the initiating condition that determines the occurrence of water and sand inrush disasters.
Regarding the flow characteristics of water and sand: Sui et al. [
28] pointed out that the sand flow velocity first decreases with the increase in the height of the glass bead pore bed, and tends to stabilize once the pore bed height approaches a certain critical value. Zhao et al. [
29] established critical criteria for water and sand inrush and obtained the characteristics of water and sand inrush under different water pressure changes through laboratory tests. Qiu et al. [
30] indicated that the larger the fracture dip angle and width, the higher the probability of water and sand inrush, the shorter the disaster duration, and the more intense the disaster process. Li et al. [
31] established a correlation model between flow rate, fracture inlet pressure, pore inlet pressure, and water-sand mass through correlation analysis, realizing the quantitative prediction of water-sand outflow. Yuan et al. [
32] found that water pressure has the greatest impact on the intensity of sudden water gushing and sand discharge.
Current research has conducted in-depth discussions on three aspects of water and sand inrush: disaster stage; influencing factors; and the flow characteristics. However, although the existing results focus on key factors such as clay content and water pressure, there are two limitations. First, the range of key disaster-causing factors selected is insufficient. Second, the specific mechanism by which they trigger surface subsidence still needs to be studied further. Based on a water and sand inrush test system, this study conducts water and sand inrush experiments by controlling factors including fracture width, aquifer thickness, sand particle size composition and stratigraphic sedimentary structure. It reveals the mechanism of surface collapse funnels induced by water and sand inrush, providing a reference for the coordinated development of coal resource development and ecological environmental protection in Western China.
3. Analysis of Collapse Funnel Destruction Forms and Influencing Factors
3.1. Fracture Width
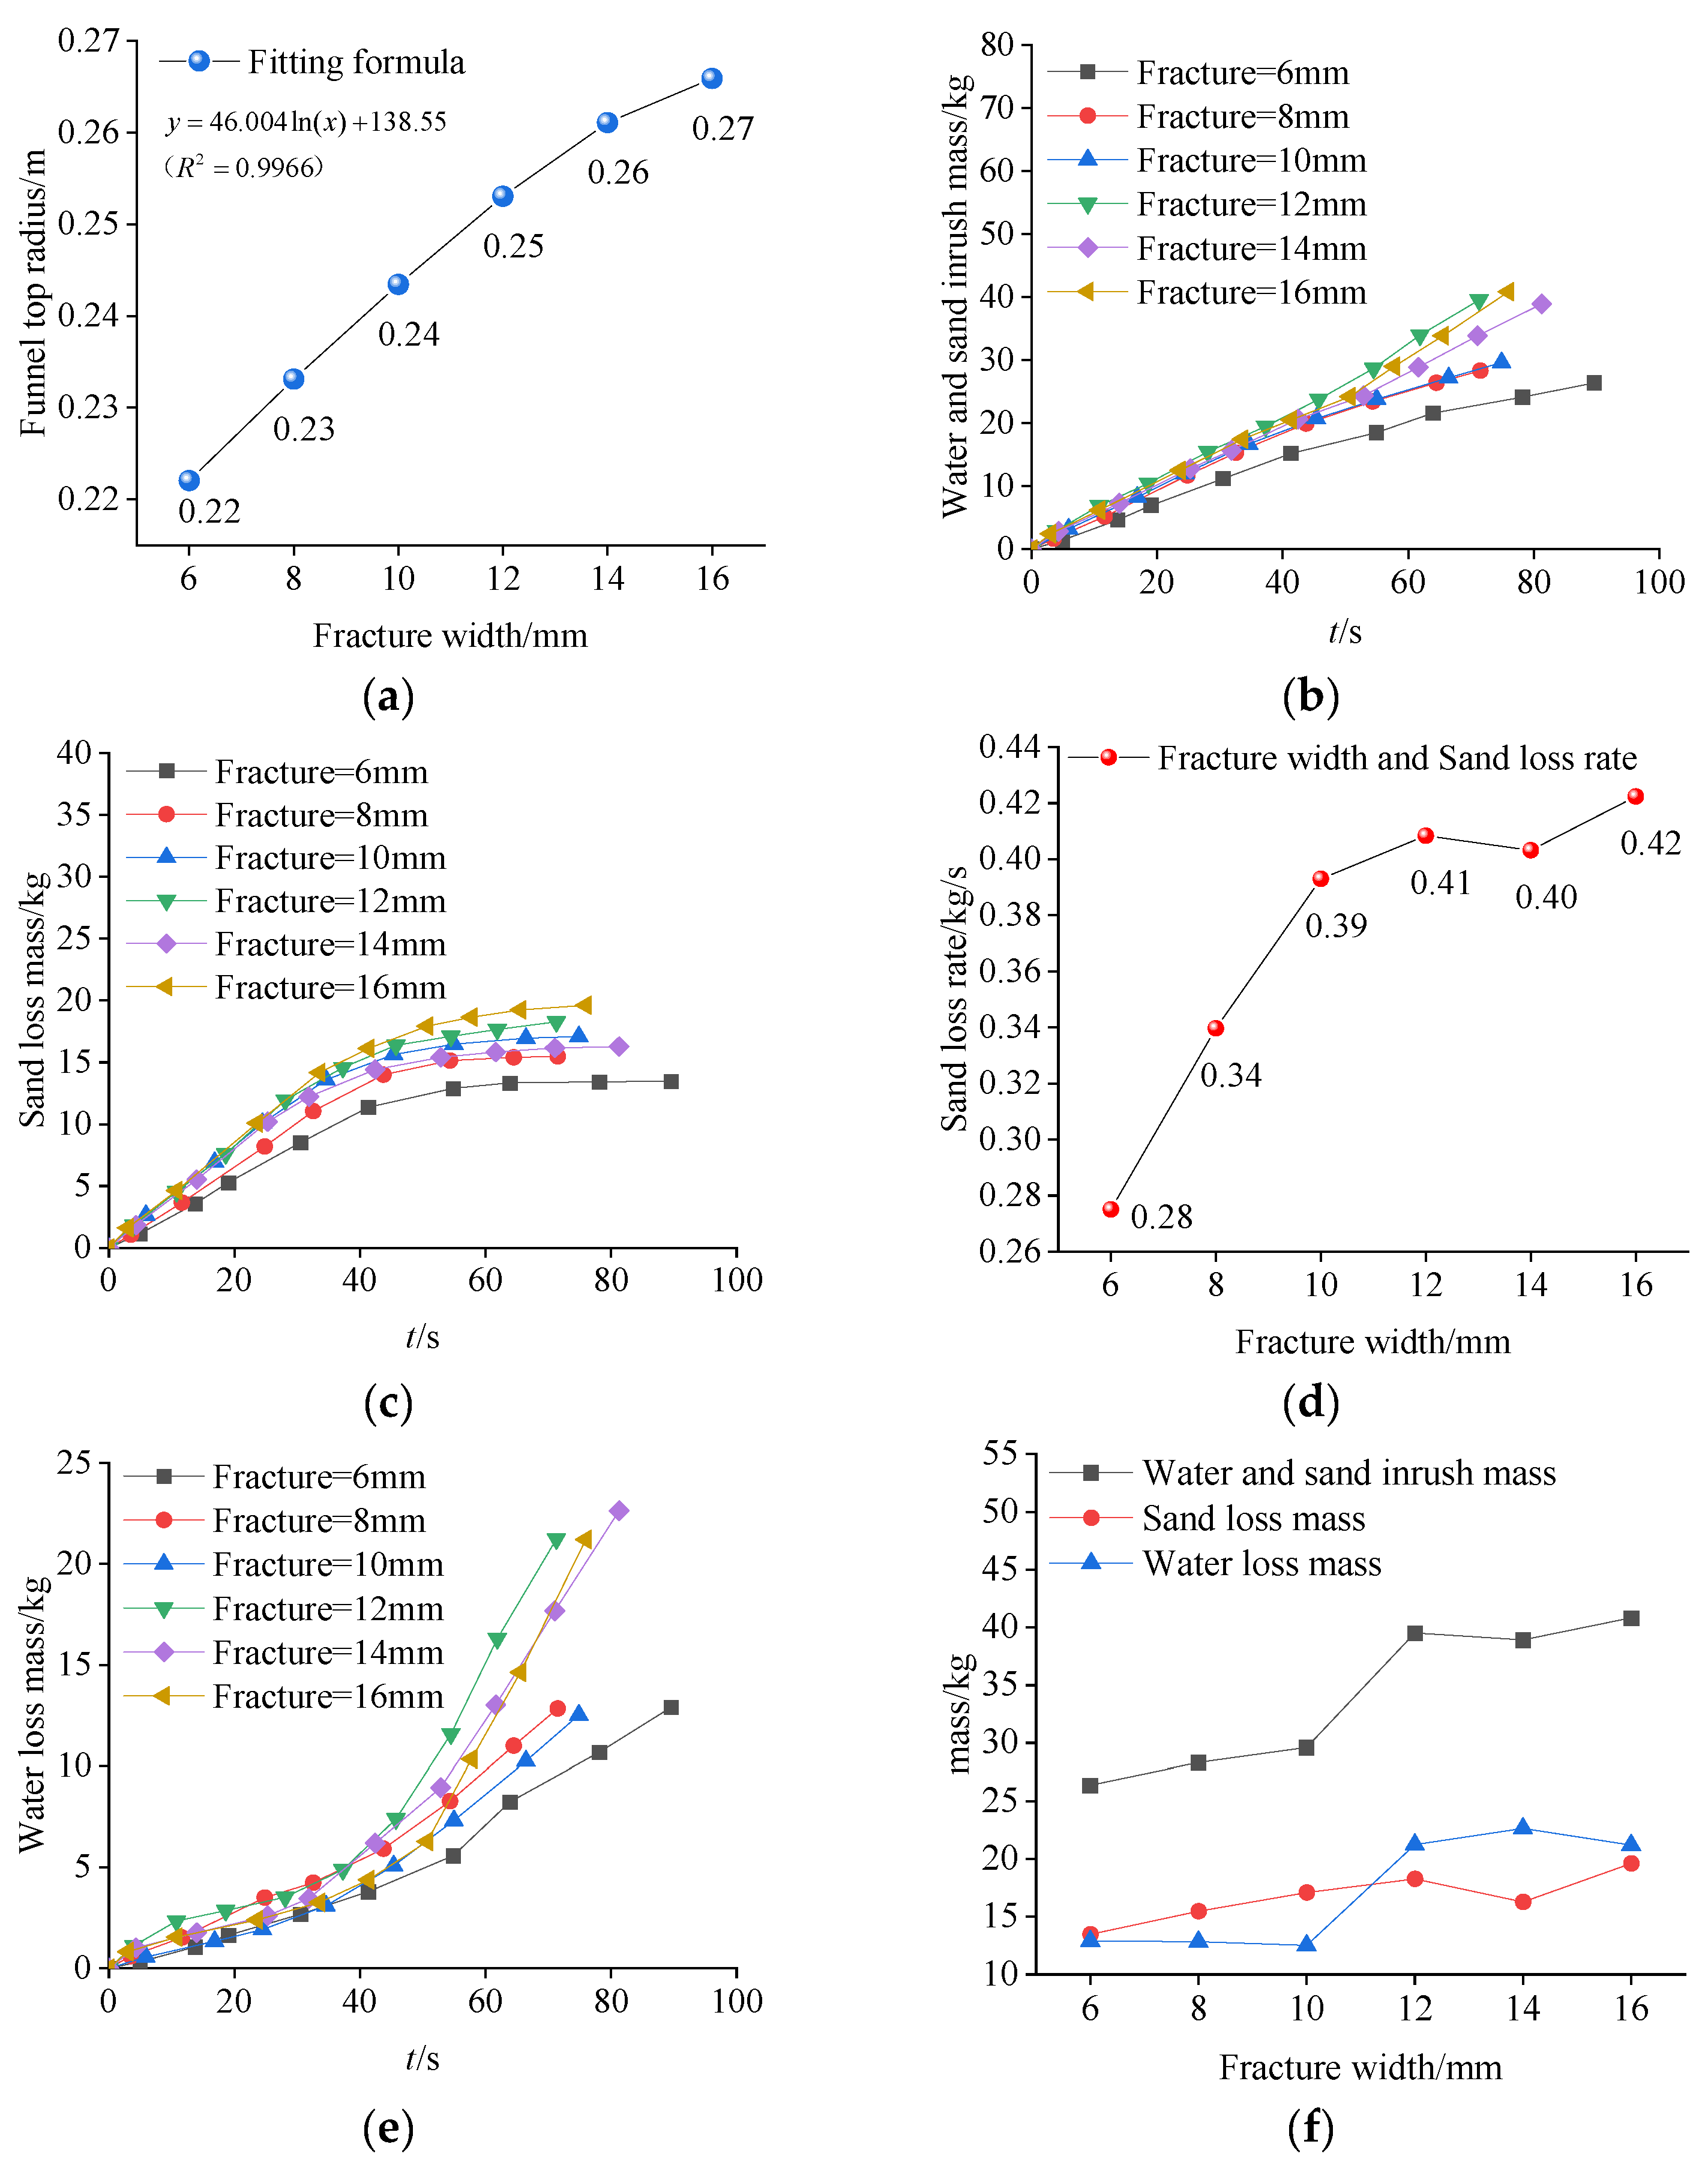
Medium sand samples were used for the tests, and water and sand inrush tests with different fracture widths were conducted under the conditions of an aquifer thickness of 150 mm and a water pressure of 0.03 MPa. The test results are presented in
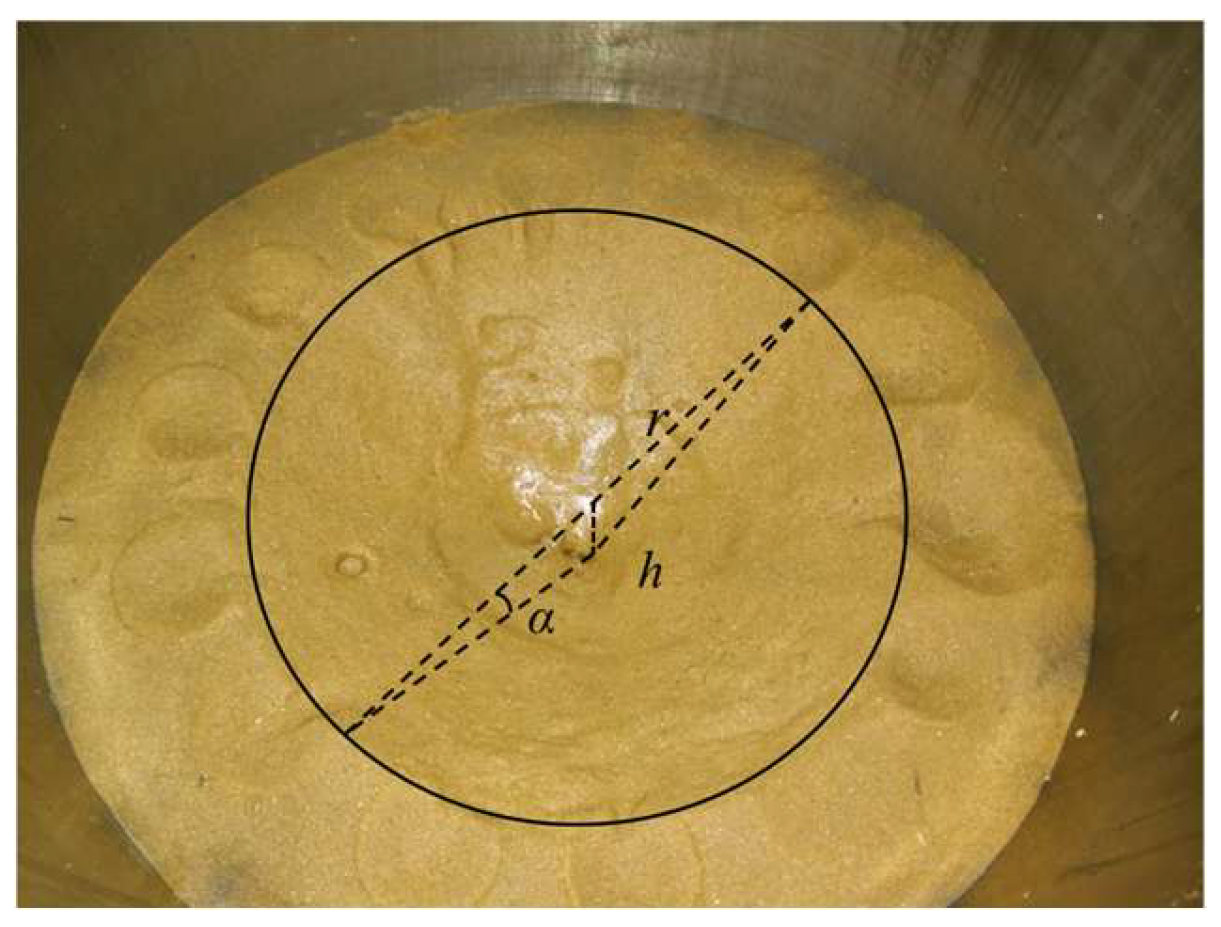
Table 3. Based on the average measured funnel slope angle, the funnel top radius was estimated. Regression fitting showed that the fracture width had a positive logarithmic correlation with the funnel top radius, as shown in
Figure 6a.
Table 3.
Test results of collapse funnels under different fracture widths.
Table 3.
Test results of collapse funnels under different fracture widths.
| Serial Number | Fracture Width/mm | Average Measured Funnel Slope Angle/° | Funnel Top Radius/mm | Collapse Funnel Volume/m3 |
|---|
| A1 | 6 | 34.04 | 222.05 | 7.745 × 10⁻³ |
| A2 | 8 | 32.76 | 233.11 | 8.536 × 10⁻³ |
| A3 | 10 | 31.64 | 243.44 | 9.309 × 10⁻³ |
| A4 | 12 | 30.66 | 253.03 | 1.006 × 10⁻² |
| A5 | 14 | 29.88 | 261.07 | 1.071 × 10⁻² |
| A6 | 16 | 29.43 | 265.88 | 1.111 × 10⁻² |
In the formula, where x is fracture width, mm; r is funnel top radius, mm.
The collapse funnel volume was calculated based on the funnel top radius, as presented in
Table 3. Data indicate that as the fracture width increases, the funnel top radius gradually increases—resulting in a larger collapse funnel volume and consequently a greater degree of hazard. However, the magnitude of this increase (in both radius and volume) gradually diminishes as the fracture width increases further.
Figure 6.
The relationship between fracture width and various parameters: (a) Fracture width and funnel top radius; (b) Different fracture width and water and sand inrush mass; (c) Different fracture width and sand loss mass; (d) Fracture width and sand loss rate; (e) Different fracture width and water loss mass; (f) Fracture width and content.
To investigate the influence of fracture width on the morphological evolution mechanism of collapse funnels and the water-sand migration characteristics during their formation process, the formation process of the collapse funnel is presented in
Table 4 and
Figure 6.
An increase in fracture width facilitates water flow, significantly enhancing the drag force of the water. Once the drag force exceeds the shear strength of the sand, it can no longer maintain stability and continuously collapses towards the center of the funnel. During this process, the drag force of the water remains greater than the shear strength of the sand, causing it to expand both vertically (into deeper layers) and laterally. Ultimately, this leads to a gradual decrease in the funnel’s slope angle.
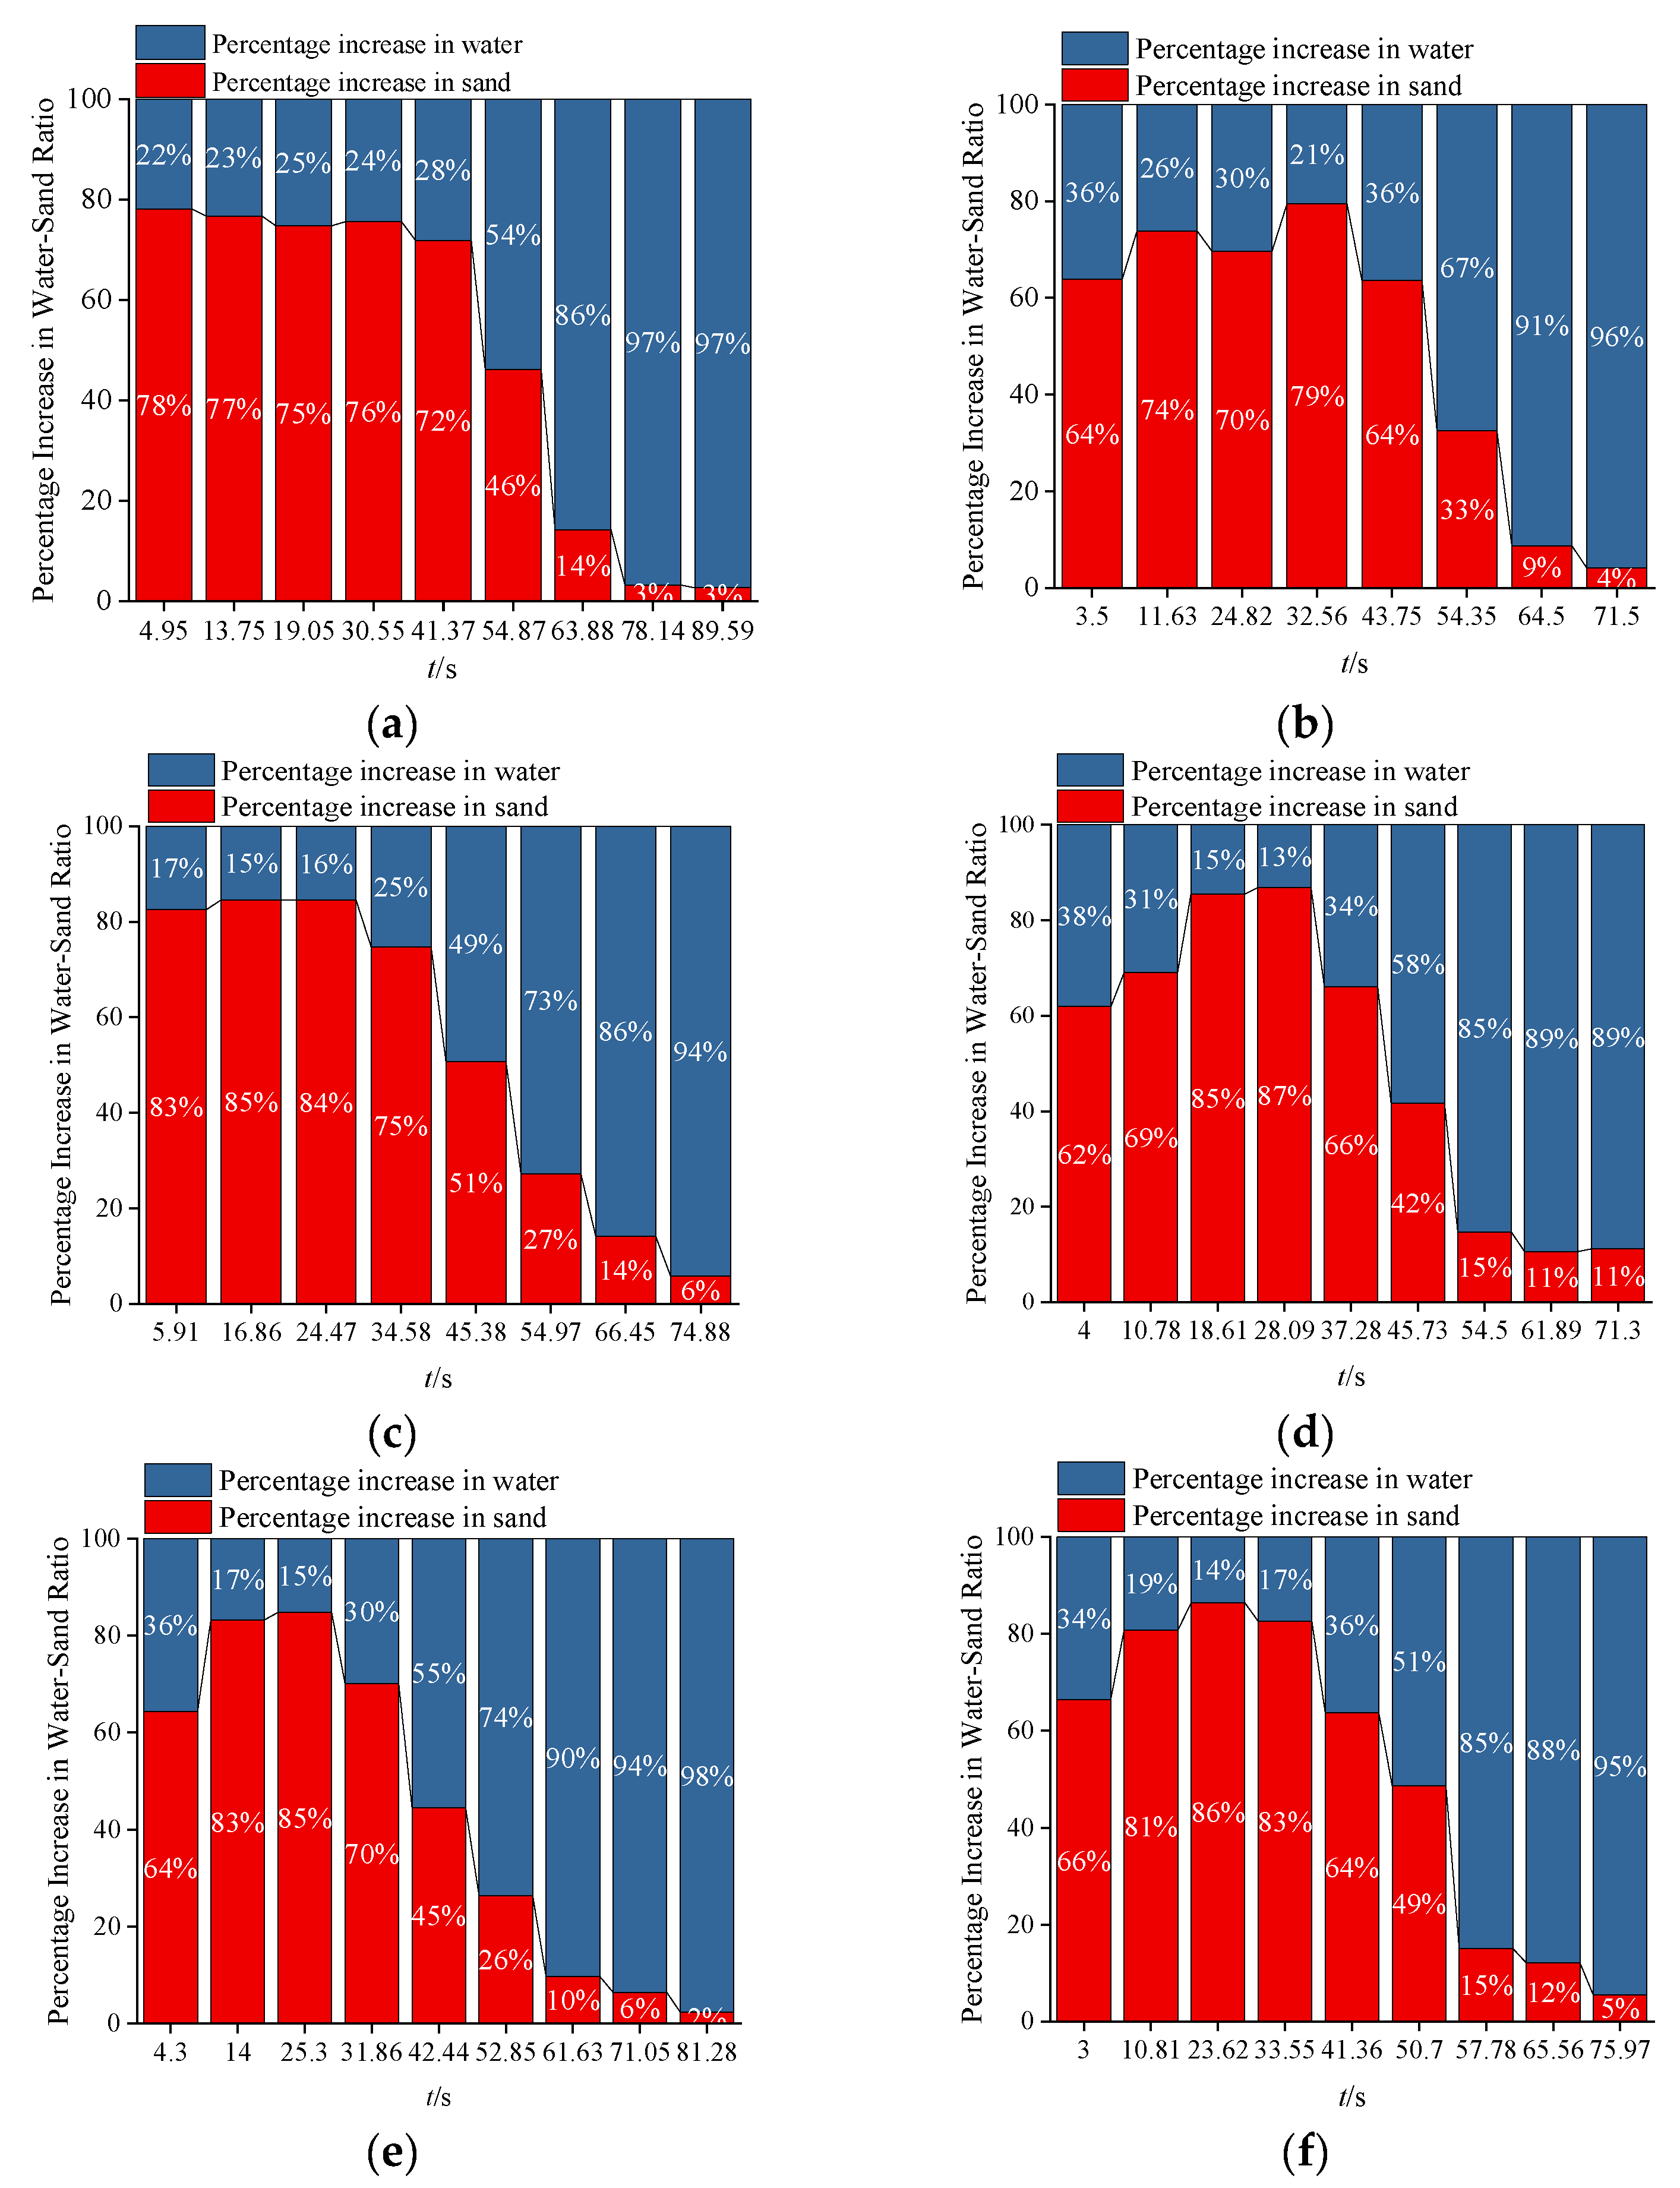
Based on the fracture width range, water and sand inrush is classified into two types: the slow-increase type and the stable-increase type. Their water-sand migration mechanisms are analyzed with reference to
Figure 6f and
Figure 7. When the fracture width ranges from 6 mm to 10 mm (see
Figure 7a–c), in the initial stage, the increment of sand loss is higher than that of water loss (with sand accounting for 64–85%). The ratio of water mass increment to sand mass increment is relatively stable, and the promoting effect of water on sand movement is weak. Sand occupy the channel space, restricting water flow to only “local scouring” and resulting in a small water loss mass. As time progresses until the sand loss mass reaches an inflection point, the supply of sand decreases, and the proportion of water mass increment rises rapidly. At this stage, the space of the fracture channel is limited, the change in water loss rate is not significant, the water flow drag force is weak, and the lateral expansion of the collapse funnel is restricted.
When the fracture width ranges from 12 mm to 16 mm (see
Figure 7d–f), at the initial stage of water and sand inrush, the sand is rapidly flushed out under the combined action of water flow and gravity. This causes the proportion of sand in the water-sand mixture to increase continuously until it reaches a peak (sand accounting for 85–87%), which corresponds to the inflection point of the sand loss mass. After this point, the proportion of the water mass increment rises. Meanwhile, the decrease in sand loss mass increases the available space for water flow in the fracture channel. At this stage, the water loss rate surges sharply; the sufficient water flow carries the sand, causing the sand to collapse both laterally and vertically. This ultimately results in a decrease in the funnel slope angle and an increase in the funnel top radius.
3.2. Aquifer Thickness
Water and sand inrush tests were conducted using sand samples and under a water pressure of 0.03 MPa, with the aquifer thicknesses set to 70 mm, 150 mm, and 250 mm, respectively.
As shown in
Table 5, with the increase in aquifer thickness, the funnel slope angle decreases. This expands the affected range of the collapse funnel and increases the hazard degree of water and sand inrush.
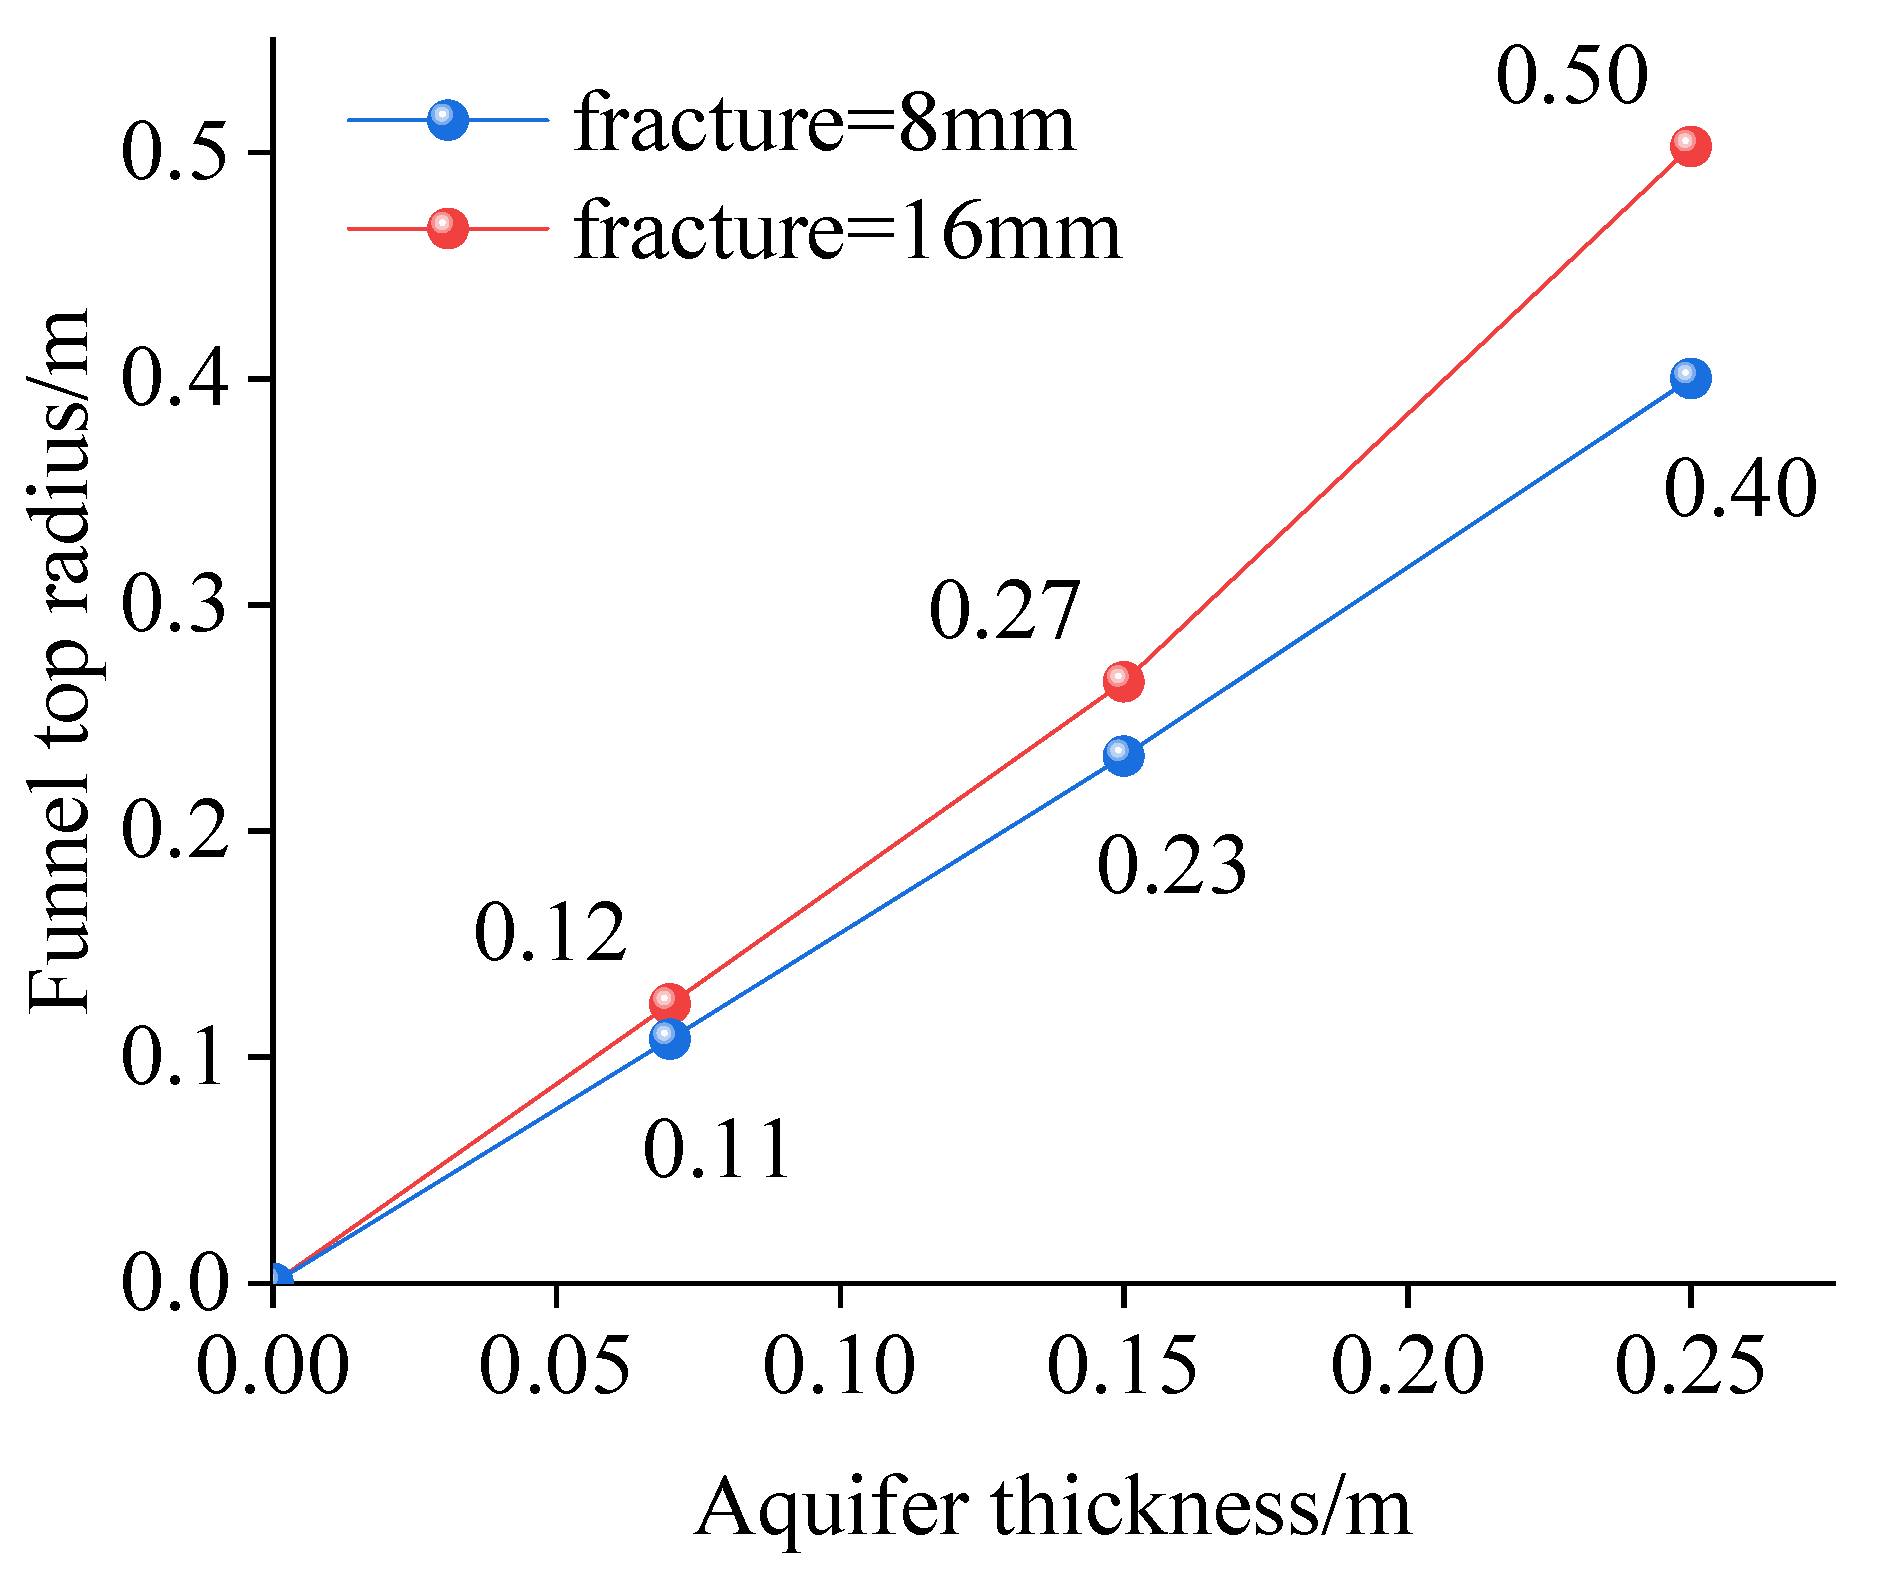
The funnel top radius was estimated based on its average measured funnel slope angle. A nearly linear positive correlation was observed between the aquifer thickness and the funnel top radius, as shown in
Figure 8. The reason for this correlation requires further analysis of changes in water-sand migration.
Through statistical analysis of the test results, relationship diagrams between different aquifer thicknesses and water and sand inrush mass were obtained under three fracture width conditions.
As can be seen from
Figure 9, the aquifer thickness has a significant impact on the water and sand inrush mass—that is, the greater the aquifer thickness, the larger the water and sand inrush mass. Under different aquifer thicknesses, the water and sand inrush mass all exhibit a nearly linear increase with increasing time, as shown in
Table 5. In such cases, each regression formula has a high degree of fitting, and the coefficients of determination (R
2) are all greater than 0.98.
Reference [
27] states that the flow velocity of dry sand is independent of the sand layer thickness, whereas the water-sand inrush rate varies depending on the aquifer thickness, with differences relating to fracture width and pore water pressure. The influence of pore water pressure can be reflected by changes in water loss mass over time.
As can be seen from
Figure 10a,b, at fracture widths of 6 mm and 8 mm, the water and sand inrush rate is low. In the thick aquifer (250 mm), the seepage path of water in the sand layer is longer, the sand supply is sufficient, and the pore water pressure can continuously drive the sand to inrush at a higher rate. In the thin aquifers (70 mm and 150 mm), the water and sand inrush rate is similar to that in the thick aquifer (250 mm) in the initial stage; however, due to insufficient sand supply, the water and sand inrush mass decreases, ultimately leading to a decline in the water and sand inrush rate.
As can be seen from
Figure 10c, at a fracture width of 16 mm, a large amount of sand loss from the thick aquifer (250 mm), occupying the space of the fracture channel. The water flow drag force is small, resulting in a poor promotion effect on the water and sand inrush rate. In contrast, the sand supply in the thin aquifers (70 mm and 150 mm) is small, making it difficult to form a large accumulation of sand that blocks the fracture channel space. The water flow drag force is large here, which plays a promoting role in increasing the water and sand inrush rate.
Thus, it can be concluded that when water and sand inrush flows unimpeded, the water and sand inrush mass is significantly affected by the aquifer thickness, while the water and sand inrush rate is jointly affected by both the fracture width and the aquifer thickness.
3.3. Sandy Particle Size Composition
Basic sand samples with three grain size compositions—coarse sand, medium sand, and fine-grained sand—were prepared. Constant test conditions were set, including a fracture opening of 8 mm, an aquifer thickness of 150 mm, a water pressure of 0.03 MPa, and a single vertical fracture.
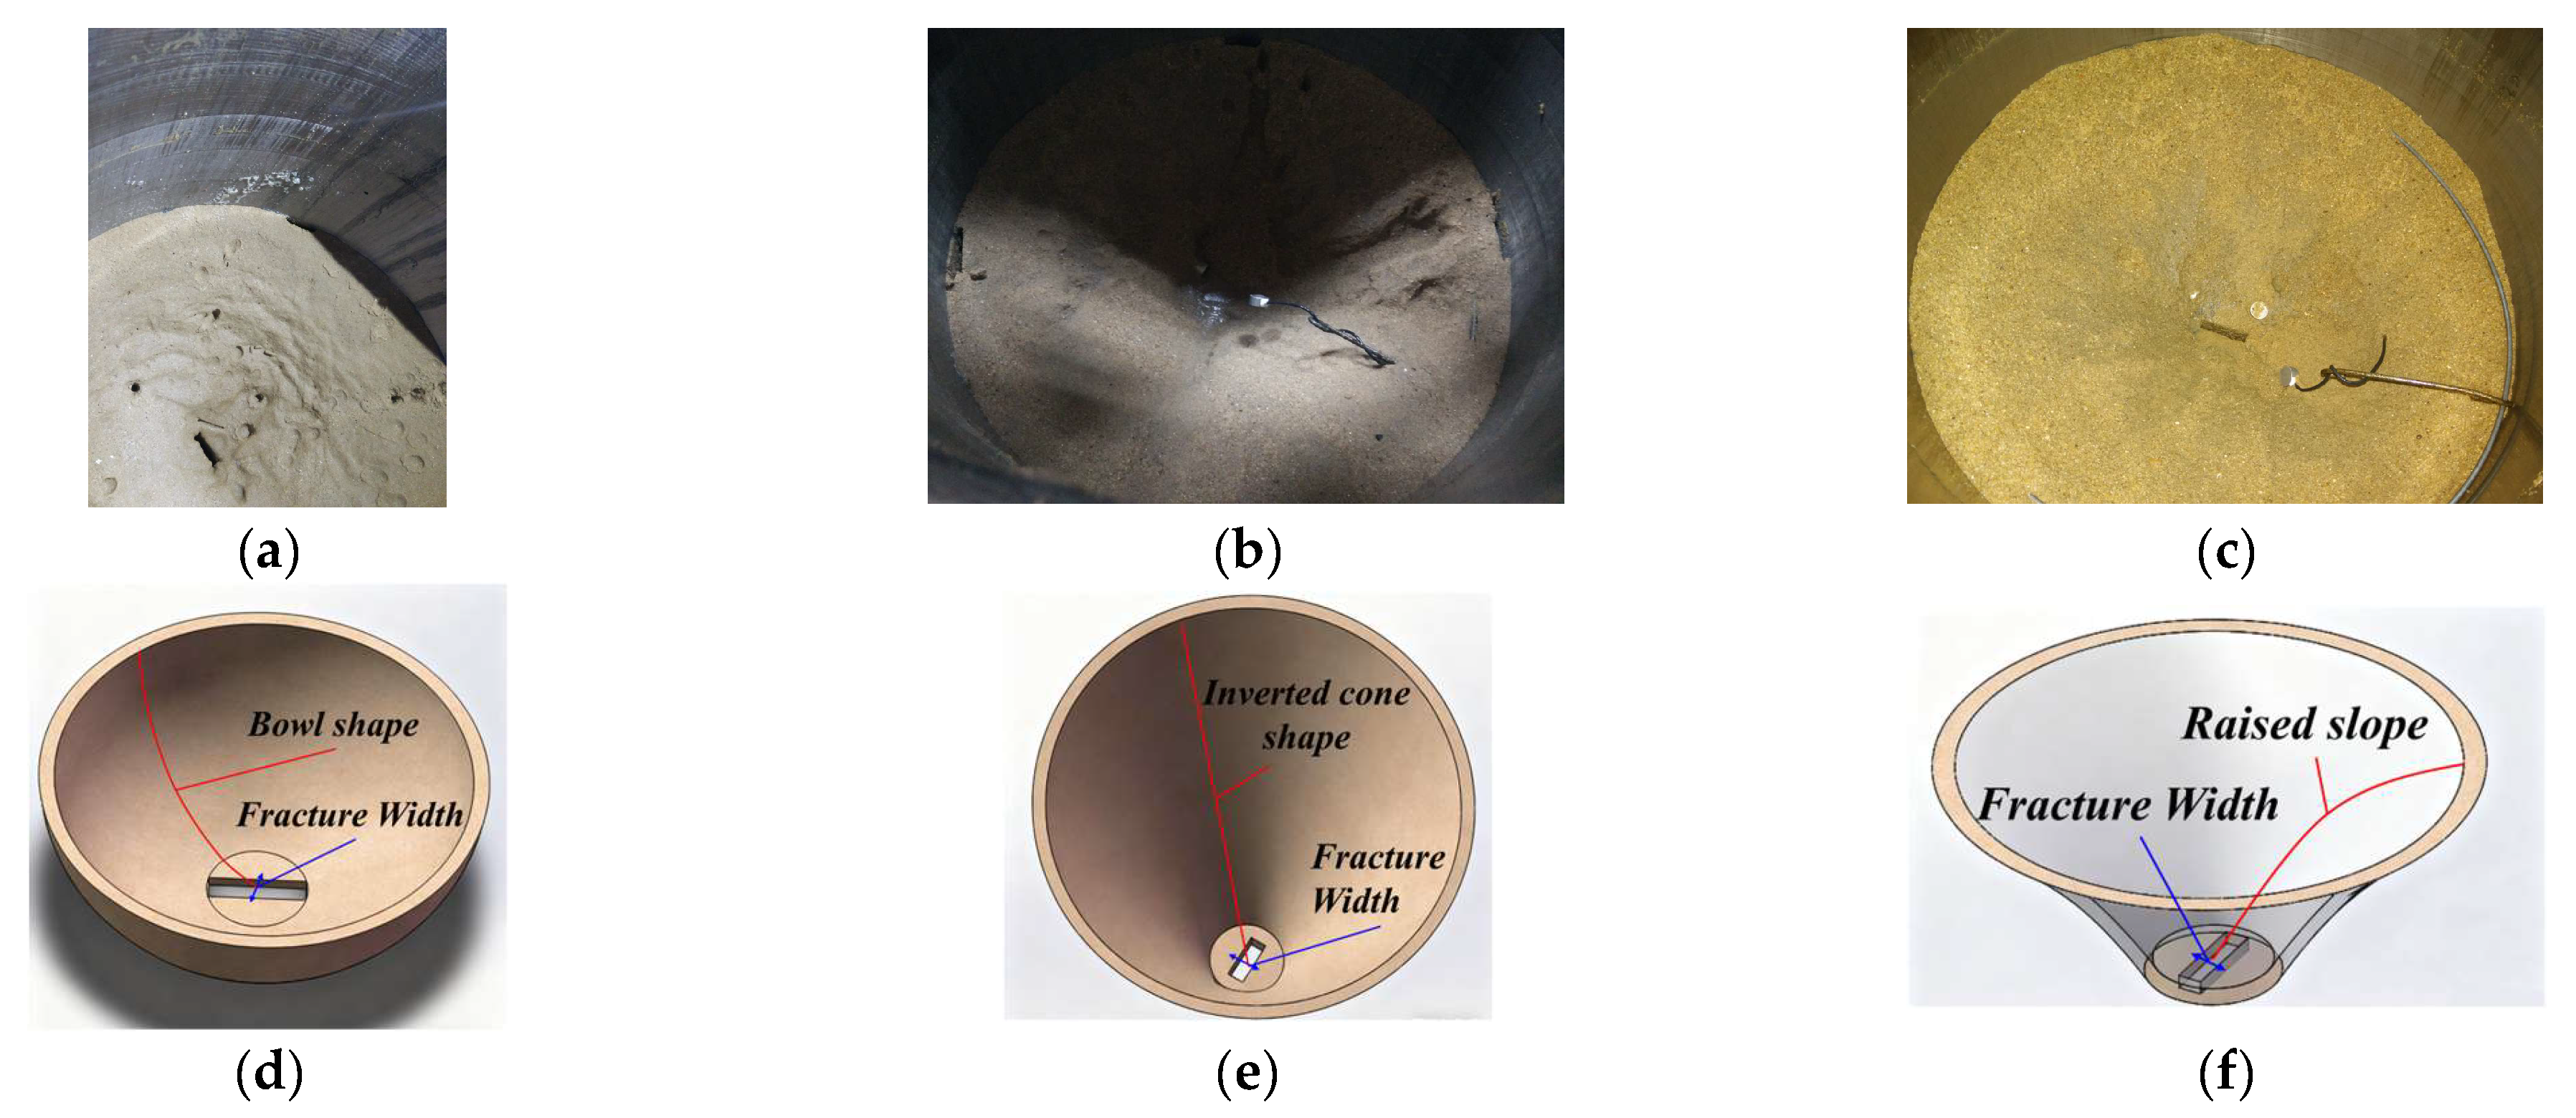
The collapse funnel morphologies and their parameters formed by sand of the three grain size compositions under the same test conditions are detailed in
Figure 11a–f and
Table 6.
Regarding morphological characteristics: For medium sand, during funnel collapse, sand is gradually flushed out from the center to the edges, with no obvious local accumulation or retention. Its morphology is most similar to an inverted cone. For fine-grained sand, due to its fine particles and high fluidity, the central area first settles under the combined action of water pressure and gravity during collapse. Additionally, the edge sand has strong accumulation properties; coupled with its poor permeability (which prevents water in the central area from draining easily), the pore water pressure offsets part of the sand’s self-weight. Thus, a bowl-shaped funnel is formed, featuring a “deep center and shallow, gentle edges,” with the smallest central depth (
Figure 11d). For coarse sand, its large particles interlock and provide mutual support, forming a well-structured soil skeleton with good permeability. During collapse, water in the central area can drain quickly; under its own gravity, the sand is more likely to settle downward, creating a relatively deep central depression. In contrast, the coarse particles in the slope area are less prone to sliding downward with the central settlement due to the supporting force of the soil skeleton. Instead, local accumulation occurs, forming slope protrusions (
Figure 11f).
With the increase in coarse sand particle content, the collapse funnel slope angle gradually increases, and its central depth increases with the increase in skeleton particle size, as shown in
Table 6.
From the above, it can be inferred that under the same conditions, the collapse funnel formed by silty-fine sand has the largest size, followed by that formed by medium sand, and the smallest by coarse sand. This pattern also indicates that the smaller the sand particle size, the more prone the sand is to movement, and the larger the sand inrush volume.
The water and sand inrush characteristics of the three sand samples with different grain size compositions exhibit a similar overall variation pattern, but with certain differences, as shown in
Figure 12a.
The common characteristics are as follows: during the stable sand loss stage, the water and sand inrush rates of the three sand types are basically the same; moreover, in this stage, the sand content in the inrush mixture is high, with sand loss as the dominant process, as shown in
Figure 13.
The differences are mainly reflected in: (1) The stable sand loss duration of fine-grained sand (approximately 53 s) is longer than that of medium sand and coarse sand (approximately 28 s), and the sand loss mass of fine-grained sand is significantly greater than that of coarse sand and medium sand, as shown in
Figure 12b.
(2) During the stable sand loss stage, the data show that the coarse sand has the highest sand content percentage (82%), followed by the medium sand (72%), with the fine sand having the lowest proportion (71%). In terms of loss performance, the fine sand has the largest loss mass and the longest stable sand loss time (67.73 s), while the medium sand (43.75 s) and coarse sand (35.54 s) decrease successively. See
Figure 13 and
Figure 14.
(3) The water loss mass of fine-grained sand is significantly greater than that of medium sand and coarse sand. Its water loss rate first decreases slowly and then maintains a stable state; while the water loss rates of medium sand and coarse sand first increase slowly and then stabilize after reaching a certain level, as shown in
Figure 12c.
The causes of the above phenomena can be analyzed from the differences in sand particle properties and force-bearing laws: Compared with coarse-grained sand, fine-grained sand has lower weight, larger specific surface area, greater contact area with water, stronger water buoyancy and drag force acting on it, and smaller interparticle friction force; thus, it is more likely to be driven by water flow. In the initial stage of water inrush, the rapid migration of fine-grained sand leads to the sudden expansion of local pores and a sharp increase in water permeability, causing the water loss mass to significantly exceed that of medium-coarse sand in a short period. This is accompanied by the expansion of the collapse funnel and an increase in sand loss mass. Therefore, under the same water environment, fine-grained sand is more prone to movement with water flow.
Under otherwise identical conditions, the higher the proportion of fine-grained components in the aquifer, the greater the risk of water and sand inrush. Its water and sand inrush rate, sand loss mass, and scale of the collapse funnel are all greater than those of aquifers with a high proportion of coarse-grained components. If a water and sand inrush disaster occurs under the same conditions, the hazard degree of fine-grained sand aquifers is significantly higher.
3.4. Stratigraphic Sedimentary Structure
Different from previous methods that analyze surface subsidence induced by water and sand inrush by adjusting clay particle content, due to the complex and variable stratigraphic sedimentary structure of unconsolidated strata, establishing a composite stratigraphic sedimentary structure can more realistically reproduce the morphological evolution characteristics of the collapse funnel during mining. The experimental design and results are shown in
Table 7.
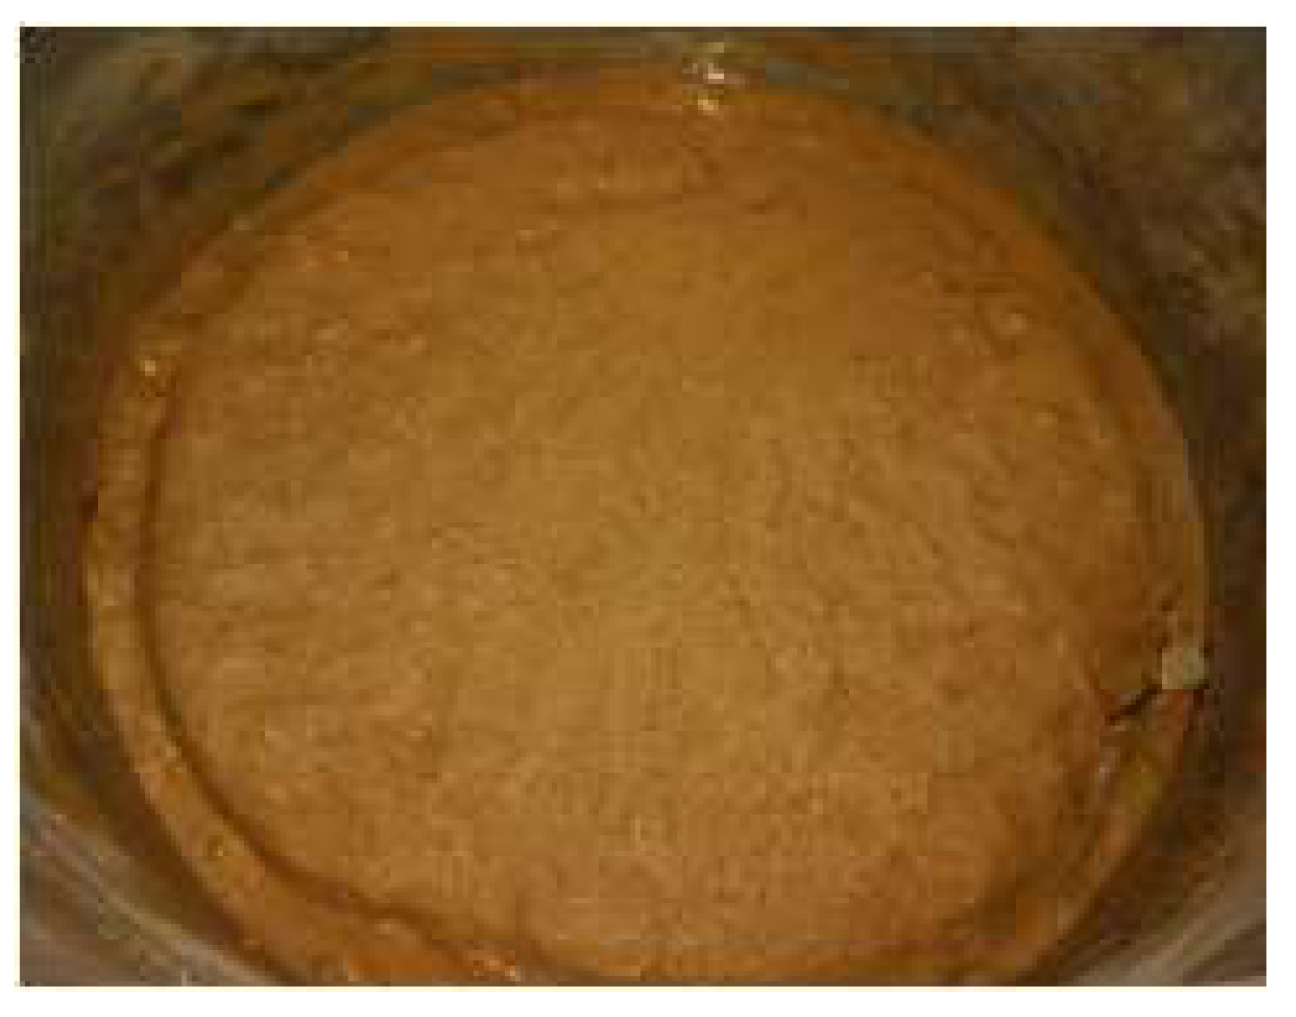
During the test, the water in the test chamber was supplied by the upper water head. Considering the hydraulic recharge issue of the aquifer at the bottom of the uncemented strata (which has a multi-layered composite structure with interbedded layers), when laying the clay layers between the aquifers, a certain space was reserved between the boundary of the clay layers and the inner wall of the test chamber (a 30 mm gap was reserved in this test). This space served as a natural hydraulic recharge channel connecting the upper aquifer and the bottom aquifer. Subsequently, the upper aquifer with the corresponding thickness was laid in accordance with the test design requirements. The specific laying process is shown in
Figure 15.
Test Phenomenon Description:
Scheme D1: After the channel was opened, a small amount of sand flowed out, and basically no further sand inrush phenomenon occurred—only a small amount of clear water seeped out. A sand pit with a diameter of 130 mm and a depth of 13 mm was formed on the surface of the sand layer inside the chamber, as shown in
Figure 16a.
Scheme D2: The phenomena in the early stage of the test were basically the same as those in Scheme D1. When only clear water seeped out, the water pressure was gradually increased from 0.035 MPa to 0.13 MPa, but no water and sand inrush phenomenon was induced. A sand pit with a depth of approximately 15 mm and a diameter of 190 mm was formed inside the chamber.
Scheme D3: A penetrating funnel appeared in the center of the test chamber, with a top diameter of 140 mm. The clay layer was damaged, and vertical water-sand recharge occurred between the upper and lower aquifers, as shown in
Figure 16b.
Scheme D4: A penetrating funnel appeared in the center of the test chamber, with a top diameter of approximately 100 mm. Cavities of different sizes formed between the two clay layers. Vertical water-sand recharge occurred between the upper and lower aquifers, and the boundary thickness of the bottom aquifer remained unchanged.
Since the bottom aquifer in Schemes D1 and D2 had a small thickness, the downward movement space for the upper clay layer was limited after water and sand inrush occurred in the bottom aquifer. Fracture channels were blocked by the downward-moving clay, preventing sand from entering the channels—only a small amount of water seeped out. Additionally, the critical seepage hydraulic gradient for the seepage deformation and failure of clay is extremely high; under such conditions, even increasing water pressure is difficult to induce water and sand inrush disasters. Moreover, due to the high plasticity of clay, it rapidly undergoes corresponding downward deformation as the space for sand gushing from the bottom aquifer forms, hindering the lateral recharge of water and sand. This inhibits the expansion of the funnel in the bottom aquifer, resulting in the sand pit shown in
Figure 16a.
In contrast, a larger thickness of the bottom aquifer provides greater downward movement space for the clay layer. When the downward movement exceeds the clay’s own ultimate strength, the clay layer is damaged; and as the downward displacement increases, the degree of clay damage intensifies. This leads to the connection between the upper aquifer and the bottom aquifer, allowing water and sand to inrush along the fracture channels—thus forming the penetrating funnel shown in
Figure 16b.
The difference between Scheme 4 and Scheme 3 in terms of stratigraphic combination structure lies in that Scheme 4 consists of 5 sets of strata (3 aquifers and 2 clay layers). Since water can only enter the test chamber through the upper water head, the vertical recharge between aquifers is achieved via the hydraulic recharge channels reserved between the clay layers and the test chamber wall.
As can be seen from
Figure 16e, the funnel slope of the top aquifer is relatively small. Due to the large thickness of the bottom aquifer, the upper clay layer at the mining-induced fractures in the bedrock is severely damaged under the combined action of hydrodynamic force and its own gravity, with a penetrating cavity forming in the center. Fractures can be clearly observed around this cavity. From
Figure 16f, it can be seen that a large amount of clay accumulates above the fractures. After removing the strata above the bottom aquifer inside the chamber, it is found that the funnel formed in the bottom aquifer has a small size (the collapse funnel has an upper diameter of 130 mm and a depth of 70 mm) and a steep slope.
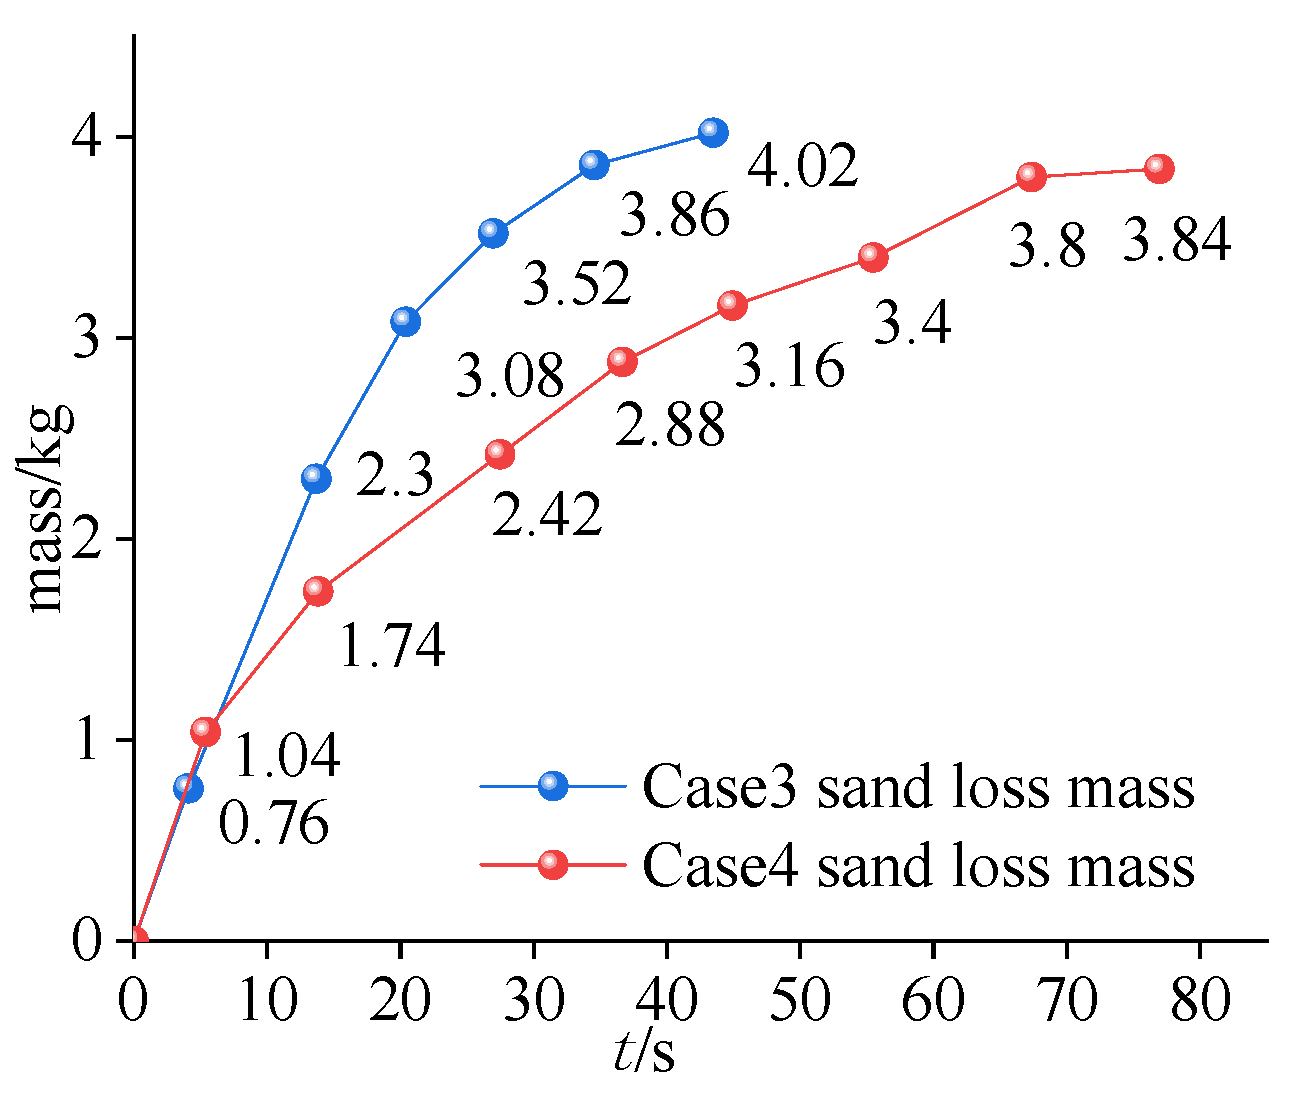
As shown in
Figure 17, both the sand loss mass and the sand loss mass rate of Scheme D3 are higher than those of Scheme D4. Scheme D4 (0.22 kg/s) has a slightly higher water mass loss rate than Scheme D3 (0.17 kg/s). This indicates that an increase in the number of clay layers makes the bottom containing the upper clay layer more prone to clogging due to water flow. This increases the resistance to sand movement, resulting in a slower recharge sand rate for the bottom aquifer. At the same time, if the fracture channels are partially clogged by the clay, the flow passage area is reduced and the local flow velocity increases. Ultimately, the water loss mass rate of Scheme D4 is slightly higher than that of Scheme D3.
At the moment the fracture widths, the sand in the bottom aquifer above the fracture inrush from the fracture driven by the power source. As the inrush space expands, the upper clay layer undergoes tensile and shear failure under the action of water pressure and gravity. At this point, the upper and lower aquifers are directly connected. Due to the limited water supply in the test, the water and sand from the upper aquifer inrush directly along the vertical channel, and the recharge mass at the test chamber wall decreases instantaneously—this further leads to a reduction in sand recharge into the bottom aquifer, which is also one of the reasons for the small size of the bottom aquifer’s funnel.
The clay layer above the bottom aquifer exerts a certain inhibitory effect on water and sand inrush. Moreover, the greater the thickness and number of such clay layers, the more significant the effect—whether in blocking the fracture channels or hindering the lateral inflow of water and sand into the fractures. In addition, the water recharge conditions of the aquifer or its own water richness have a certain impact on the characteristics of water and sand inrush.
4. Discussion
4.1. Prevention Measures for Water and Sand Inrush
By analyzing how each of the above factors influences surface subsidence, we can conclude that sand particle size composition is the primary factor affecting underground subsidence. The ‘safest condition’ for preventing subsidence is when the clay layer above the underlying aquifer fully blocks fractures and maintains its structural integrity. The specific reasons are as follows:
The sand particle size composition is the dominant factor determining the form and severity of the collapse funnel, and therefore directly determines its morphological characteristics and hazard level.
The width of the fractures is a key controlling factor. Fractures serve as the main channels for the flow of water and sand. An increase in fracture width means an expansion of the channels’ cross-sectional area, which directly enhances the flow capacity of water and sand. This intensifies the occurrence and scale of water and sand inrush.
An increase in the thickness of the aquifer will directly exacerbate the collapse disaster. However, the thickness of the bottom aquifer and the upper clay layer jointly determine the development of the collapse funnel and the severity of the disaster. On the one hand, the thickness of the bottom aquifer directly affects the stability of the upper clay layer. If the bottom aquifer is thin, the clay layer cannot sink sufficiently to block the rock fractures effectively. On the other hand, if the bottom aquifer is too thick, the clay layer will lose stability and collapse due to insufficient strength, thereby triggering severe subsidence.
Taking into account the geological characteristics of shallow-buried coal seams, thin bedrock and a simple stratum structure in the western region, as well as the action mechanisms of the various influencing factors, preventive techniques for surface subsidence caused by water and sand inrush can be developed in two ways:
Artificial grouting creates a protective layer. By injecting a cementitious slurry into the stratum, the slurry solidifies and enhances the stratum’s mechanical properties, thereby achieving anti-seepage and reinforcement effects.
Pre-mining shotcrete reinforcement. Combining anchor rod support with grouting reinforces the base rock, controlling the width of fractures and reducing disturbance to the coal seam roof during mining. This prevents fractures from extending to the water-bearing layer, reducing the risk of subsidence.
4.2. Limitations
The research provides theoretical guidance on how to prevent and control surface subsidence disasters caused by water and sand inrush. However, the study is limited by the experimental conditions and has the following main limitations: Firstly, this study is based on the theory of natural cessation angle of sand subsidence, using an inverted conical funnel model to calculate the collapse volume and correcting the deviations caused by size effects. However, this method still requires further verification. In addition, the collapse radius and volume in the paper were calculated based on the inverted conical funnel model under medium sand conditions. However, in actual engineering, the shape of the collapse funnel is significantly affected by the composition of sand particles. Moreover, the study only analyzed the dominant role of a single factor and lacked multi-factor interaction analysis. In the future, the inverted conical funnel formula will be corrected through numerical simulation, and a multi-factor interaction analysis will be conducted using random forests.
