Article

Incorporating IPCC RCP4.5 and RCP8.5 Precipitation Scenarios into Semi-Distributed Hydrological Modeling of the Upper Skawa Mountainous Catchment, Poland

by
Paweł Gilewski
1,2,*,
Arkadii Sochinskii
2 and
Magdalena Reizer
1
1
Faculty of Environmental Engineering, Warsaw University of Technology, 00-661 Warsaw, Poland
2
Polytech’Lab, Université Côte d’Azur, UPR UniCA 7494, 06903 Sophia-Antipolis, France
*
Author to whom correspondence should be addressed.
Water 2025, 17(21), 3128; https://doi.org/10.3390/w17213128
Submission received: 24 September 2025 / Revised: 21 October 2025 / Accepted: 27 October 2025 / Published: 31 October 2025

Abstract

Mountain catchments in Central Europe are highly susceptible to flash floods. To inform local adaptation, this study quantifies the future flood response of a Polish Carpathian catchment (Upper Skawa, 240.4 km2) to Intergovernmental Panel on Climate Change (IPCC) scenarios. A semi-distributed HEC-HMS model was calibrated and validated using observed flood events (2014–2019). Future hydrographs were then simulated using the delta change method for RCP4.5 and RCP8.5 (near- and long-term horizons). The validated model showed high predictive accuracy. Results indicate a consistent trend towards a polarized hydrological regime, with increased spring/autumn flood peaks and decreased summer flows. This trend is significantly amplified under the RCP8.5 scenario, with long-term peak flood increases approximately double those of RCP4.5. The catchment’s non-linear response further compounds these impacts. These findings suggest a future of heightened seasonal flood risk and emerging summer water scarcity, implying that existing infrastructure, designed for historical stationarity, may be insufficient. This study provides a quantitative evidence base for re-evaluating regional flood risk policies and developing integrated adaptation strategies.

1. Introduction

Climate change constitutes one of the most critical global environmental challenges, and its impact on precipitation patterns is particularly significant for Central Europe [1,2]. Large-scale hydrological projections based on EURO-CORDEX data indicate a growing risk of both floods and droughts in this region [3]. At the foundation of these changes lies a fundamental thermodynamic principle: a warmer atmosphere has a greater capacity to hold water vapor, which, in accordance with the Clausius–Clapeyron relation, leads to an intensification of the hydrological cycle and more frequent, intense precipitation events [4,5]. This phenomenon, combined with a projected increase in total seasonal precipitation, creates a growing flood hazard, especially in sensitive environments such as mountain catchments, which are characterized by a rapid hydrological response [5,6,7].
The Polish Carpathians, due to their geomorphological and hydrographic characteristics, is a region exceptionally susceptible to flash floods, which poses a serious challenge for risk management [2,6,7,8,9]. Catchments such as the Upper Skawa are characterized by steep slopes, deep valleys, and a predominance of low-permeability soils overlying Flysch formations [3,8,9,10]. This combination limits infiltration and promotes rapid surface runoff, resulting in a very short hydrological response time of approximately 2.5 h [6,8,11,12]. Flash floods, often triggered by intense, orographically enhanced, convective rainfall that can reach 100–300 mm per day, have immense destructive potential, as documented during historical flood events (e.g., in 1997, 2001, 2010) [2,5]. Extreme events, such as the flood in the Jamne and Jaszcze catchments in 2018, reached specific discharges of 4.1–4.8 m3 s−1 km−2 and caused significant geomorphic changes, placing them among the largest recorded floods in the region. These characteristics of the Polish Carpathians create unique and severe challenges for risk management, requiring advanced forecasting strategies. Contemporary hydrology utilizes models such as SWAT and HEC-HMS as standard tools for assessing the impact of climate change on water systems. They are widely used in conjunction with IPCC climate scenarios (e.g., from the CMIP5 and EURO-CORDEX projects) to simulate future hydrological conditions.
Despite this broad application, a significant research gap exists. There is a scarcity of high-resolution, prognostic studies at the small catchment scale that specifically quantify changes in flood characteristics generated by intense rainfall in the Outer Carpathians. These limitations stem from the insufficient density of measurement networks in the mountains, complex topography, issues with the accuracy of radar data in varied terrain, and the high uncertainty of regional climate model projections. This knowledge gap hinders the development of precise, evidence-based adaptation strategies.
To address the identified research gap, this study has the following objectives: (1) to develop and validate a semi-distributed HEC-HMS hydrological model for the Upper Skawa catchment as a representative case study for a mountainous, rainfall-dominated catchment prone to flash floods; (2) to implement processed IPCC precipitation scenarios for both a moderate (RCP4.5)- and a high (RCP8.5)-emissions pathway to simulate future hydrological response; and (3) to quantitatively assess and compare the projected changes in peak flows and hydrograph shapes to provide data essential for regional flood risk management and adaptation planning.

2. Materials and Methods

2.1. Study Area

The Upper Skawa catchment area lies in the northern part of the Outer Carpathians in southern Poland near the Czech Republic border (Figure 1). Covering 240.4 km2, this mountainous headwater region serves as a prime example of a small mountain catchment in Central Europe. It is a populated area, including parts of towns such as Jordanów and Maków Podhalański, and is characterized by high susceptibility to flash floods, with a history of catastrophic events recorded since the 15th century.
The catchment’s hydrology is fundamentally governed by its pronounced topographic heterogeneity, with elevations ranging from 435 to 1038 m above sea level. The terrain is characterized by a mean slope of approximately 15%, with valley slopes often exceeding 30%. The complex orography, culminating in the Babia Góra massif to the southwest, creates substantial spatial variability in meteorological conditions and hydrological processes [8,9].
The basin’s rapid flood response is a direct consequence of its geomorphological and hydrographic characteristics. Topographic analysis divides the area into six sub-catchments, drained by a dense river network of 1.9 km/km2. The main channel of the Skawa River within the study area is approximately 25 km long. The network consists of short, steep-gradient streams that promote rapid runoff transmission, resulting in an exceptionally short average time to peak of approximately 2.5 h [7,11]. This rapid response is further exacerbated by the dominance of low-permeability soils, which, combined with steep terrain, favor Hortonian overland flow over infiltration-dominated processes.
Climatically, the area transitions from a warm to a cold temperate climate with increasing altitude. The mean annual precipitation ranges from 1000 to 1200 mm, which is significantly higher than the national average for Poland (approx. 600 mm), underscoring the region’s distinct mountain climate. The highest rainfall is concentrated in the highest elevations around the Babia Góra region. However, quantifying this crucial input is a significant challenge. The sparse network of only four rain gauges—with just one located directly within the catchment—presents a considerable obstacle for accurately estimating the spatio-temporal distribution of areal precipitation in such complex terrain. This combination of a flash-flood-prone environment and data scarcity underscores the necessity for a robust modeling approach to accurately simulate the catchment’s hydrological response [11,13,14].

2.2. Data

2.2.1. Precipitation and Discharge

Precipitation data were obtained from the telemetric rain gauge network operated by the Institute of Meteorology and Water Management—National Research Institute. Precipitation measurements were recorded at 10-min intervals and then aggregated into hourly intervals for use in hydrological modelling. All measurements underwent quality control procedures, including range verification according to climatological values, as well as spatio-temporal consistency checks [15].
The precipitation monitoring network consists of four rain gauges located within or in close proximity to the study area. These stations are characterized by significant elevation differences, ranging from 367 m a.s.l. in Maków Podhalański to 1184 m a.s.l. in Markowe Szczawiny. However, only one rain gauge is located directly within the boundaries of the investigated catchment, which makes accurate estimation of areal precipitation challenging due to the sparse distribution of the network.
Discharge data were provided by the Institute of Meteorology and Water Management—National Research Institute from the Osielec gauging station, which is located downstream of the study area. The discharge measurements were recorded at hourly intervals and cover the same period as the precipitation data.
Both the precipitation and discharge datasets span the period from 2014 to 2019. This period was strategically selected to capture a series of significant flash flood events suitable for robust model calibration and validation. To ensure a comprehensive assessment of the model’s performance under diverse meteorological conditions, the most extreme and varied flood events available in the record were chosen. Four flood events from 2014–2016 were designated for model calibration, and another four from 2017–2019 were reserved for validation (Table 1). This temporal division ensures that the calibration and validation datasets are independent, which is a prerequisite for a reliable assessment of the model’s predictive capabilities.

2.2.2. DEM and Land-Cover

The study utilized a 100 m resolution DEM provided by the Head Office of Geodesy and Cartography in Poland. This dataset was critical for deriving topographic features such as slope and elevation gradients, which influence hydrological processes like runoff generation and routing. The DEM’s resolution impacts the accuracy of hydrological derivatives; coarser resolutions may underestimate peak flows and overestimate baseflow in mountainous terrain. For the Upper Skawa catchment, the DEM was also used to delineate sub-catchments and analyze channel slopes, which are essential for configuring the Muskingum–Cunge routing method in the HEC-HMS model. While higher-resolution digital elevation models can offer more detailed topographic representation, the 100 m grid was deemed a suitable compromise between accuracy and computational efficiency for a catchment of this scale [16,17].
Land-use and land-cover information was obtained from the CORINE Land Cover Project (CLC2018 datasets). These datasets classify land cover into categories such as forests, agricultural areas, and urban zones, which were used to estimate weighted Curve Numbers (CN) for the Soil Conservation Service (SCS) rainfall-loss method. The spatial distribution of land cover, combined with soil permeability characteristics, helped parameterize the hydrological response of sub-catchments, particularly for modeling antecedent moisture conditions and surface runoff. Previous studies in the area confirm that CORINE data effectively captures the dominance of low-permeability soils and forested regions, key factors in flash flood susceptibility [2,18,19].

2.3. Climate Scenarios

2.3.1. IPCC RCP4.5 & RCP8.5 Precipitation Scenarios

The evolving climate scenarios developed by the Intergovernmental Panel on Climate Change (IPCC) reflect our growing understanding of the climate system and its drivers, as well as the system’s increasing complexity. These scenarios are crucial for predicting future climate conditions and evaluating their potential impact on hydrological processes, such as the dynamics of river discharge [20].
The earliest sets of scenarios, including SA90 and IS92, were primarily emissions-based, focusing on projecting greenhouse gas emissions resulting from demographic and economic trends. These scenarios were used in the IPCC’s Second and Third Assessment Reports [21,22], providing a basis for evaluating the potential scale of anthropogenic climate change. However, they did not fully consider the socioeconomic and technological factors influencing emissions pathways.
A significant advancement came with the publication of the Special Report on Emissions Scenarios (SRES) in 2000 [23]. The SRES introduced four narrative ‘storylines’ (A1, A2, B1 and B2), each representing a different trajectory for global development, population growth, technological change and environmental priorities. These storylines were structured along two key dimensions: the axis of economic versus environmental priorities and the axis of globalization versus regionalization. Rather than predicting a single outcome, these storylines were designed to illustrate a broad range of possible futures and were widely used in the IPCC’s Third and Fourth Assessment Reports.
With the Fifth Assessment Report (AR5), the IPCC adopted the Representative Concentration Pathways (RCPs), marking a paradigm shift in scenario development [24]. This shift involved moving from a sequential process—where socioeconomic scenarios dictated emissions, which then drove climate models—to a parallel one. In the new approach, climate modelers and integrated assessment modelers (IAMs) worked concurrently, starting from a prescribed set of concentration pathways to explore the resulting climate responses and the socioeconomic developments that could lead to them [25]. Unlike previous generations of scenarios, the RCPs are defined by their radiative forcing values (in watts per square metre, W/m2) by the year 2100 rather than by specific socio-economic or emissions trajectories. Crucially, the term “pathway” emphasizes that the entire trajectory of concentration changes over time is important, not just the 2100 endpoint [26]. The four main RCPs are:
  • RCP2.6: strong mitigation and low emissions (optimistic),
  • RCP4.5 and RCP6.0: intermediate stabilisation pathways,
  • RCP8.5: high emissions, business-as-usual (pessimistic).
In the context of hydrological modelling for the Skawa River catchment, RCP4.5 and RCP8.5 were selected to represent a range of plausible futures, from an intermediate to a high-emissions pathway. This selection aligns with common practice in climate impact studies, which often use these scenarios to bracket a range of potential outcomes for risk assessment [5,6]. This allows us to assess the potential impact on river discharge and flood risk, providing a solid basis for planning adaptation and mitigation strategies in water resource management.

2.3.2. Downscaling and Scenarios Generation

Global Climate Models (GCMs), which provide the foundation for IPCC scenarios, operate at coarse spatial resolutions (typically 100–300 km). While effective for simulating continental and global climate dynamics, their direct output is unsuitable for assessing hydrological impacts in small, topographically complex catchments like the Upper Skawa, where local processes dominate runoff generation. To bridge this scale mismatch, a process known as downscaling is required to translate large-scale climate projections into high-resolution data appropriate for local impact models.
Downscaling techniques are broadly categorized into two families: dynamical and statistical [4]. Dynamical downscaling uses high-resolution Regional Climate Models (RCMs) nested within a GCM to simulate physical processes at a finer scale. Projects like EURO-CORDEX provide such dynamically downscaled climate projections for Europe [12]. Statistical downscaling, on the other hand, develops quantitative relationships between large-scale atmospheric variables from GCMs and observed local climate variables. This approach is computationally less intensive and widely used in hydrological impact studies [4,27].
For this study, the ‘delta change’ or change factor (CF) method was selected. This widely adopted statistical downscaling technique was chosen for two primary reasons. First, it preserves the high-frequency temporal structure of observed local precipitation events. This is a critical attribute for flash flood modeling, where the shape and sub-daily intensity patterns of storm hyetographs—features often poorly replicated by climate models—are key drivers of the peak hydrological response. Second, the CF method effectively bypasses the issue of systematic biases inherent in raw RCM outputs, which would otherwise require additional, complex bias-correction procedures that introduce their own sources of uncertainty.
The method itself involves modifying the observed historical hourly precipitation time series using climate change signals projected by an ensemble of GCMs. To ensure an objective and replicable procedure, the percentage change factors for precipitation were derived from the aggregated data presented in the Intergovernmental Panel on Climate Change (IPCC) Fifth Assessment Report (AR5). Specifically, data were extracted for the Central Europe (CEU) region using the WGI AR5 Interactive Atlas tool. The median projected change in monthly precipitation was extracted from the CMIP5 model ensemble for two Representative Concentration Pathways (RCP4.5 and RCP8.5) and two future horizons: a near-term period (2046–2065) and a long-term period (2081–2000), relative to the 1986–2005 baseline. The resulting percentage change factors utilized in this analysis are summarized in Table 2.
The analysis was limited to the months from April to October as this period covers the warm season when flood events in the Polish Carpathians are predominantly driven by intense rainfall rather than snowmelt. The derived change factors reveal a distinct seasonal pattern that intensifies over time and with higher emissions. A consistent trend towards drier summers is projected, with precipitation decreasing by 10% to 20% across the summer months (June–August). Conversely, the shoulder seasons of spring and autumn are projected to become significantly wetter. The magnitude of these changes is consistently greater for the long-term period (2081–2100) compared to the near-term, and more pronounced under the high-emissions RCP8.5 scenario. For instance, the projected precipitation increase for October by the end of the century is +35% under RCP8.5, compared to +20% under RCP4.5. This projected shift towards drier summers and wetter autumns has significant hydrological implications, potentially increasing the risk of both summer droughts and autumn floods in the catchment.

2.4. HEC-HMS Model Setup

2.4.1. Parametrization

To simulate the rainfall-runoff processes in the Upper Skawa catchment, the Hydrologic Engineering Center’s Hydrologic Modeling System (HEC-HMS), version 4.2.1, was employed. Developed by the US Army Corps of Engineers, HEC-HMS is a widely recognized and versatile model designed for both event-based and continuous hydrological simulations. For this study, it was configured as a semi-distributed model, which allows for a more detailed representation of the catchment’s spatial variability by dividing it into six sub-catchments, while maintaining computational efficiency. This approach is well-suited for simulating flood hydrographs in response to specific storm events.
The parametrization of the HEC-HMS model involves selecting appropriate methods to represent the key components of the hydrological cycle and defining their governing parameters based on the physical characteristics of the catchment. The selected methods and their rationale are summarized in Table 3 and described in detail below. These methods were chosen as they represent a standard and effective conceptual framework for event-based flood modeling, which is the primary focus of this study, rather than continuous water balance simulation.
The Soil Conservation Service Curve Number (SCS-CN) method was selected to calculate precipitation losses and estimate the volume of direct runoff. This empirical method is particularly effective for event-based modeling in ungauged or sparsely gauged catchments. It integrates the effects of soil type, land use, and antecedent moisture conditions into a single parameter—the Curve Number (CN). For each of the six sub-catchments, a weighted CN value was derived from the CORINE Land Cover (CLC2018) data and soil maps, reflecting the dominance of low-permeability soils and forested areas in the region.
The transformation of precipitation excess into a direct runoff hydrograph was accomplished using the Snyder Unit Hydrograph method. This synthetic unit hydrograph approach is a standard technique used when detailed, high-resolution rainfall and streamflow data are insufficient to derive a unit hydrograph directly from observations, which is the case for the Upper Skawa catchment. The key parameters, such as the standard lag and peaking coefficient, were initially estimated based on the physiographic characteristics of each sub-catchment.
The contribution of groundwater to the total streamflow was modeled using the Recession Baseflow method. This method provides a robust representation of the gradual depletion of water from catchment storage following a flood event. It defines the shape of the hydrograph’s falling limb after the cessation of direct runoff and is well-suited for event-based simulations where the focus is on the flood peak and volume.
The movement of the flood wave through the river network was simulated using the Muskingum–Cunge routing method. This physically based approach uses channel properties, such as slope, length, and cross-sectional geometry, to account for both translation and attenuation of the flood hydrograph. Channel slopes were derived from the 100 m DEM, making this method appropriate for representing the steep and dynamic flow conditions characteristic of the mountainous Skawa River.

2.4.2. Calibration and Validation

The calibration and validation procedure was undertaken to evaluate the hydrological model’s capability to accurately replicate the hydrological response of the Upper Skawa catchment. The calibration phase consisted of the systematic adjustment of key model parameters to minimize the discrepancy between simulated and observed discharge. Subsequently, a validation was performed on an independent dataset to assess the model’s predictive performance on events not utilized during the calibration.
The procedure was executed using the optimization tools integrated within the HEC-HMS 4.11 software. Four flood events from the 2014–2016 period constituted the calibration dataset, while four independent events from 2017–2019 were used for validation, in accordance with the data partitioning presented in Table 1. The optimization process focused on parameters associated with the methods described in Section 2.4.1; specifically, those which cannot be directly measured and are characterized by the greatest uncertainty. These included the SCS-CN loss method parameters (Curve Number, Initial Abstraction) and the Snyder Unit Hydrograph transformation parameters (Standard Lag, Peaking Coefficient). Minimization of the Peak-Weighted Root Mean Square Error (PWRMSE) was established as the objective function for the automated calibration process. This function was selected to align with the study’s primary objective of accurately simulating peak flows, which are of critical importance for flood risk analysis. Finally, the model’s goodness-of-fit for both the calibration and validation phases was evaluated using the set of statistical metrics defined in Section 2.6. The final set of calibrated parameter values for each sub-catchment is provided in Appendix A (Table A1).

2.5. Scenario Simulations

The primary objective of the scenario simulations was to assess the impact of projected precipitation changes on the hydrological response of the Upper Skawa catchment. To isolate the effects of climate projections, the analysis was conducted using an independent set of five validation flood events from the 2017–2019 period. For these simulations, the previously calibrated and validated HEC-HMS model parameters, representing the catchment’s current hydrological characteristics, were held constant. Consequently, the sole modified input variable was the precipitation time series.
The simulation procedure was performed in two main steps:
  • First, the observed precipitation hyetograph for each baseline validation event was substituted with four corresponding future precipitation scenarios: RCP4.5 near-term, RCP4.5 long-term, RCP8.5 near-term, and RCP8.5 long-term.
  • Subsequently, the HEC-HMS model was run for each event-scenario combination, thereby generating a total of 20 future hydrograph simulations (5 validation events × 4 future scenarios).
This methodological approach facilitates a direct comparison between the simulated discharge under historical precipitation and the projected discharge under future climate scenarios. Therefore, by maintaining constant model parameters and utilizing an independent validation dataset, any observed differences in the resulting hydrographs can be largely attributed to the influence of the applied climate change signal on precipitation.

2.6. Performance Metrics

The performance of the HEC-HMS model was quantitatively assessed by comparing simulated and observed discharge for each flood event using a set of statistical metrics. A multi-metric approach was adopted to ensure a comprehensive evaluation, as reliance on a single metric can potentially mask specific model deficiencies. Consequently, the evaluation focused on the model’s fidelity in reproducing the overall hydrograph shape, total runoff volume, and peak flow magnitude. The selected metrics comprised the Nash–Sutcliffe Efficiency (NSE), Percent Bias (PBIAS), and Root Mean Square Error (RMSE).
The Nash–Sutcliffe Efficiency (NSE) is a prevalent metric in hydrology for evaluating the goodness-of-fit of simulated hydrographs [28]. It quantifies the relative magnitude of the residual variance compared to the variance in the observed data. NSE values range from -∞ to 1, where 1 represents a perfect match, 0 indicates that the model’s predictive power is equivalent to the mean of the observations, and negative values suggest that the observational mean is a better predictor than the model. Due to its sensitivity to high flows, this metric is particularly relevant for flood event analysis.
Percent Bias (PBIAS) quantifies the average tendency of the simulated data to be larger or smaller than their observed counterparts, thereby providing a clear indication of the model’s volumetric bias [29]. A value of 0 indicates no bias, whereas positive and negative values signify overestimation and underestimation, respectively.
While the Root Mean Square Error (RMSE) quantifies the absolute magnitude of model error, its direct interpretation is hampered by its dependence on the scale of the observed data. Therefore, for a normalized and objective assessment, this study employs the RMSE-observation standard deviation ratio (RSR), as recommended by Moriasi et al. [29]. This metric, calculated by dividing the RMSE by the standard deviation of observations, provides a dimensionless measure of performance. An RSR value of 0 indicates a perfect simulation, with performance judged to be increasingly satisfactory as the value approaches zero.
Finally, the classification of the model’s performance for each event was conducted in accordance with the guidelines proposed by Moriasi et al. [29], as summarized in Table 4.

3. Results and Analysis

3.1. Calibration and Validation Performance

The performance of the HEC-HMS model was evaluated in two distinct phases: calibration, utilizing four flood events from the 2014–2016 period, and validation, using an independent set of five events from 2017–2019. This approach was employed to facilitate a robust assessment of the model’s predictive capabilities prior to its application in scenario analysis.
  • Calibration results
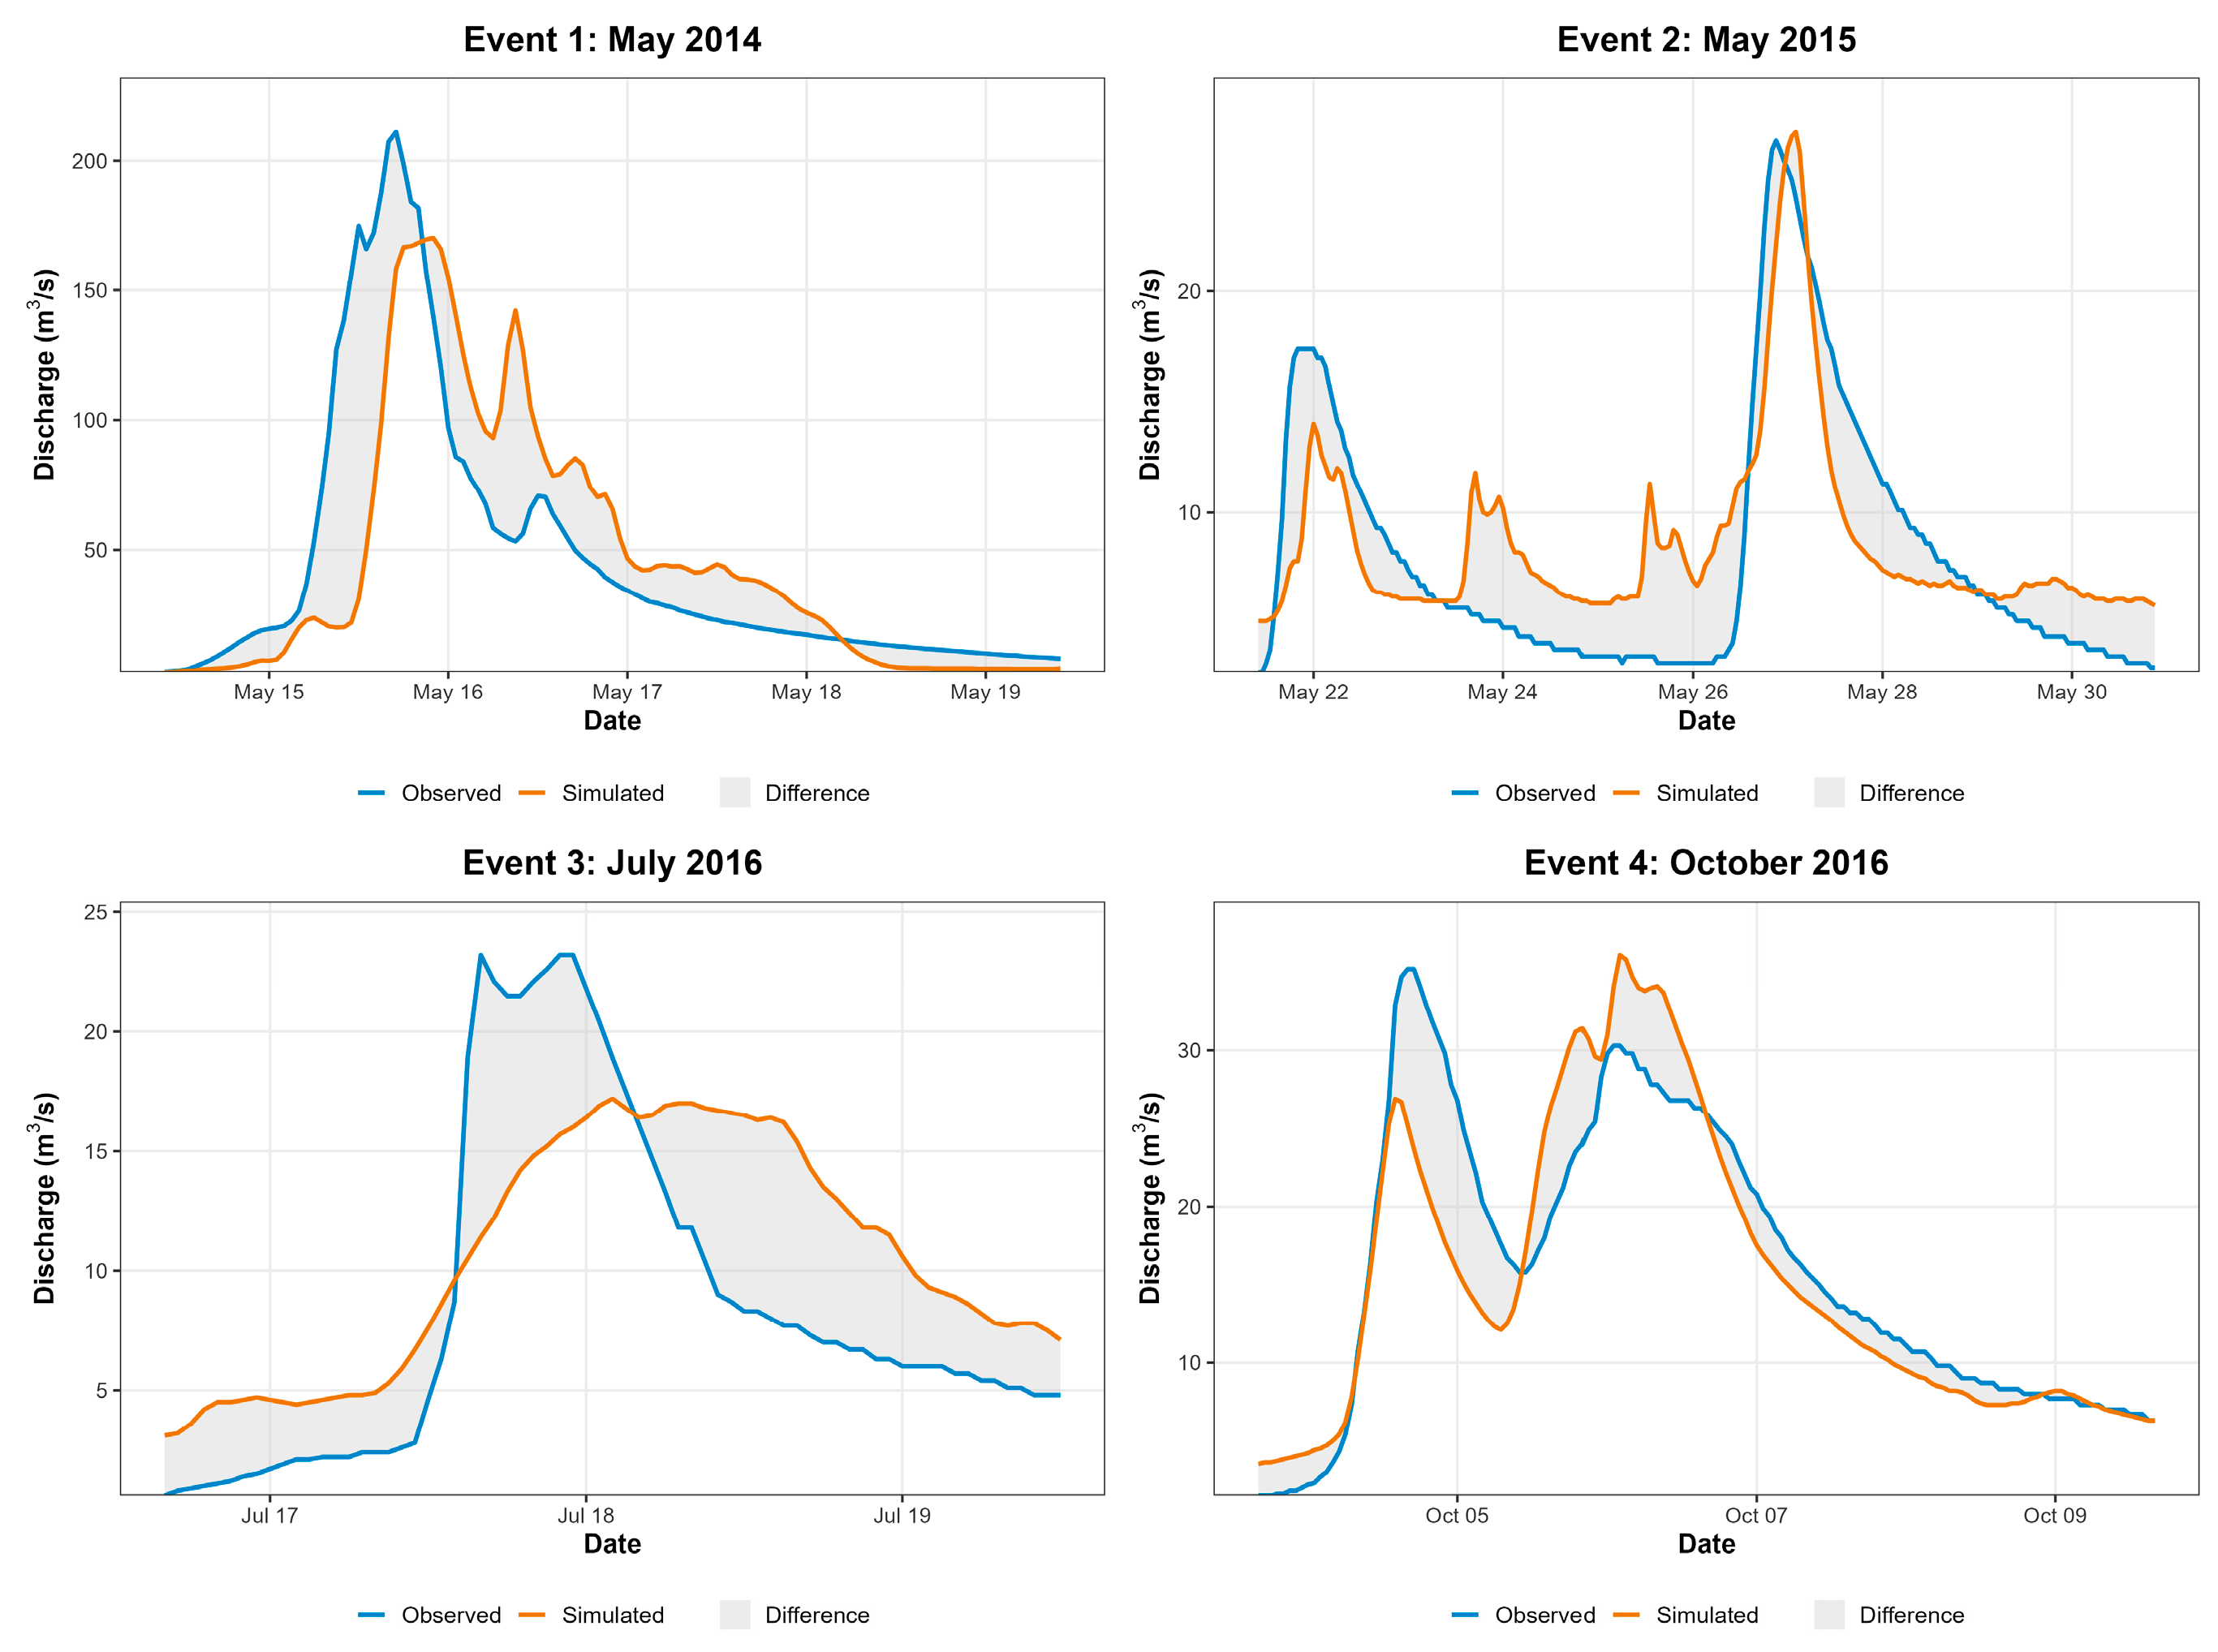
During the calibration phase, the model exhibited a generally strong performance, with metrics ranging from “satisfactory” to “very good” based on the classification guidelines by Moriasi et al. A comparison of hydrographs for the four calibration events is presented in Figure 2, and the corresponding performance statistics are detailed in Table 5.
In general, the model appeared to replicate the timing and magnitude of the observed flood peaks with reasonable accuracy. The model’s performance was quantitatively robust, with Nash–Sutcliffe Efficiency (NSE) values ranging from 0.52 to 0.77 and RSR values from 0.42 to 0.76. The best performance was observed for Event 4 (October 2016), which achieved a “very good” rating across all key metrics, with an NSE of 0.77, a minimal volumetric error (PBIAS = −4.28%), and an excellent RSR of 0.42. This combination indicates an outstanding match in hydrograph shape, runoff volume, and residual error magnitude. Strong performance was also noted for Event 2 (May 2015), achieving “good” ratings for both NSE (0.65) and RSR (0.55), coupled with a “very good” volumetric match (PBIAS = +5.04%).
The model’s performance for the remaining events was more varied. Event 1 (May 2014) was classified as “satisfactory” based on both NSE (0.52) and RSR (0.70). The most significant discrepancies were identified for Event 3 (July 2016), which, despite a “satisfactory” NSE of 0.54, yielded an “unsatisfactory” RSR of 0.76. This disparity highlights that while the model captured the event’s general dynamics, the magnitude of the model error was large relative to the low standard deviation of the observed flow during this event. This conclusion is further supported by the notable volumetric overestimation (PBIAS = +23.18%) recorded for this event, which is visually apparent in Figure 2, where the simulated runoff consistently exceeds the observed flow.
Nevertheless, the model’s overall capacity to replicate the dynamics of diverse flood events was deemed sufficient for the study’s objectives.
  • Validation results
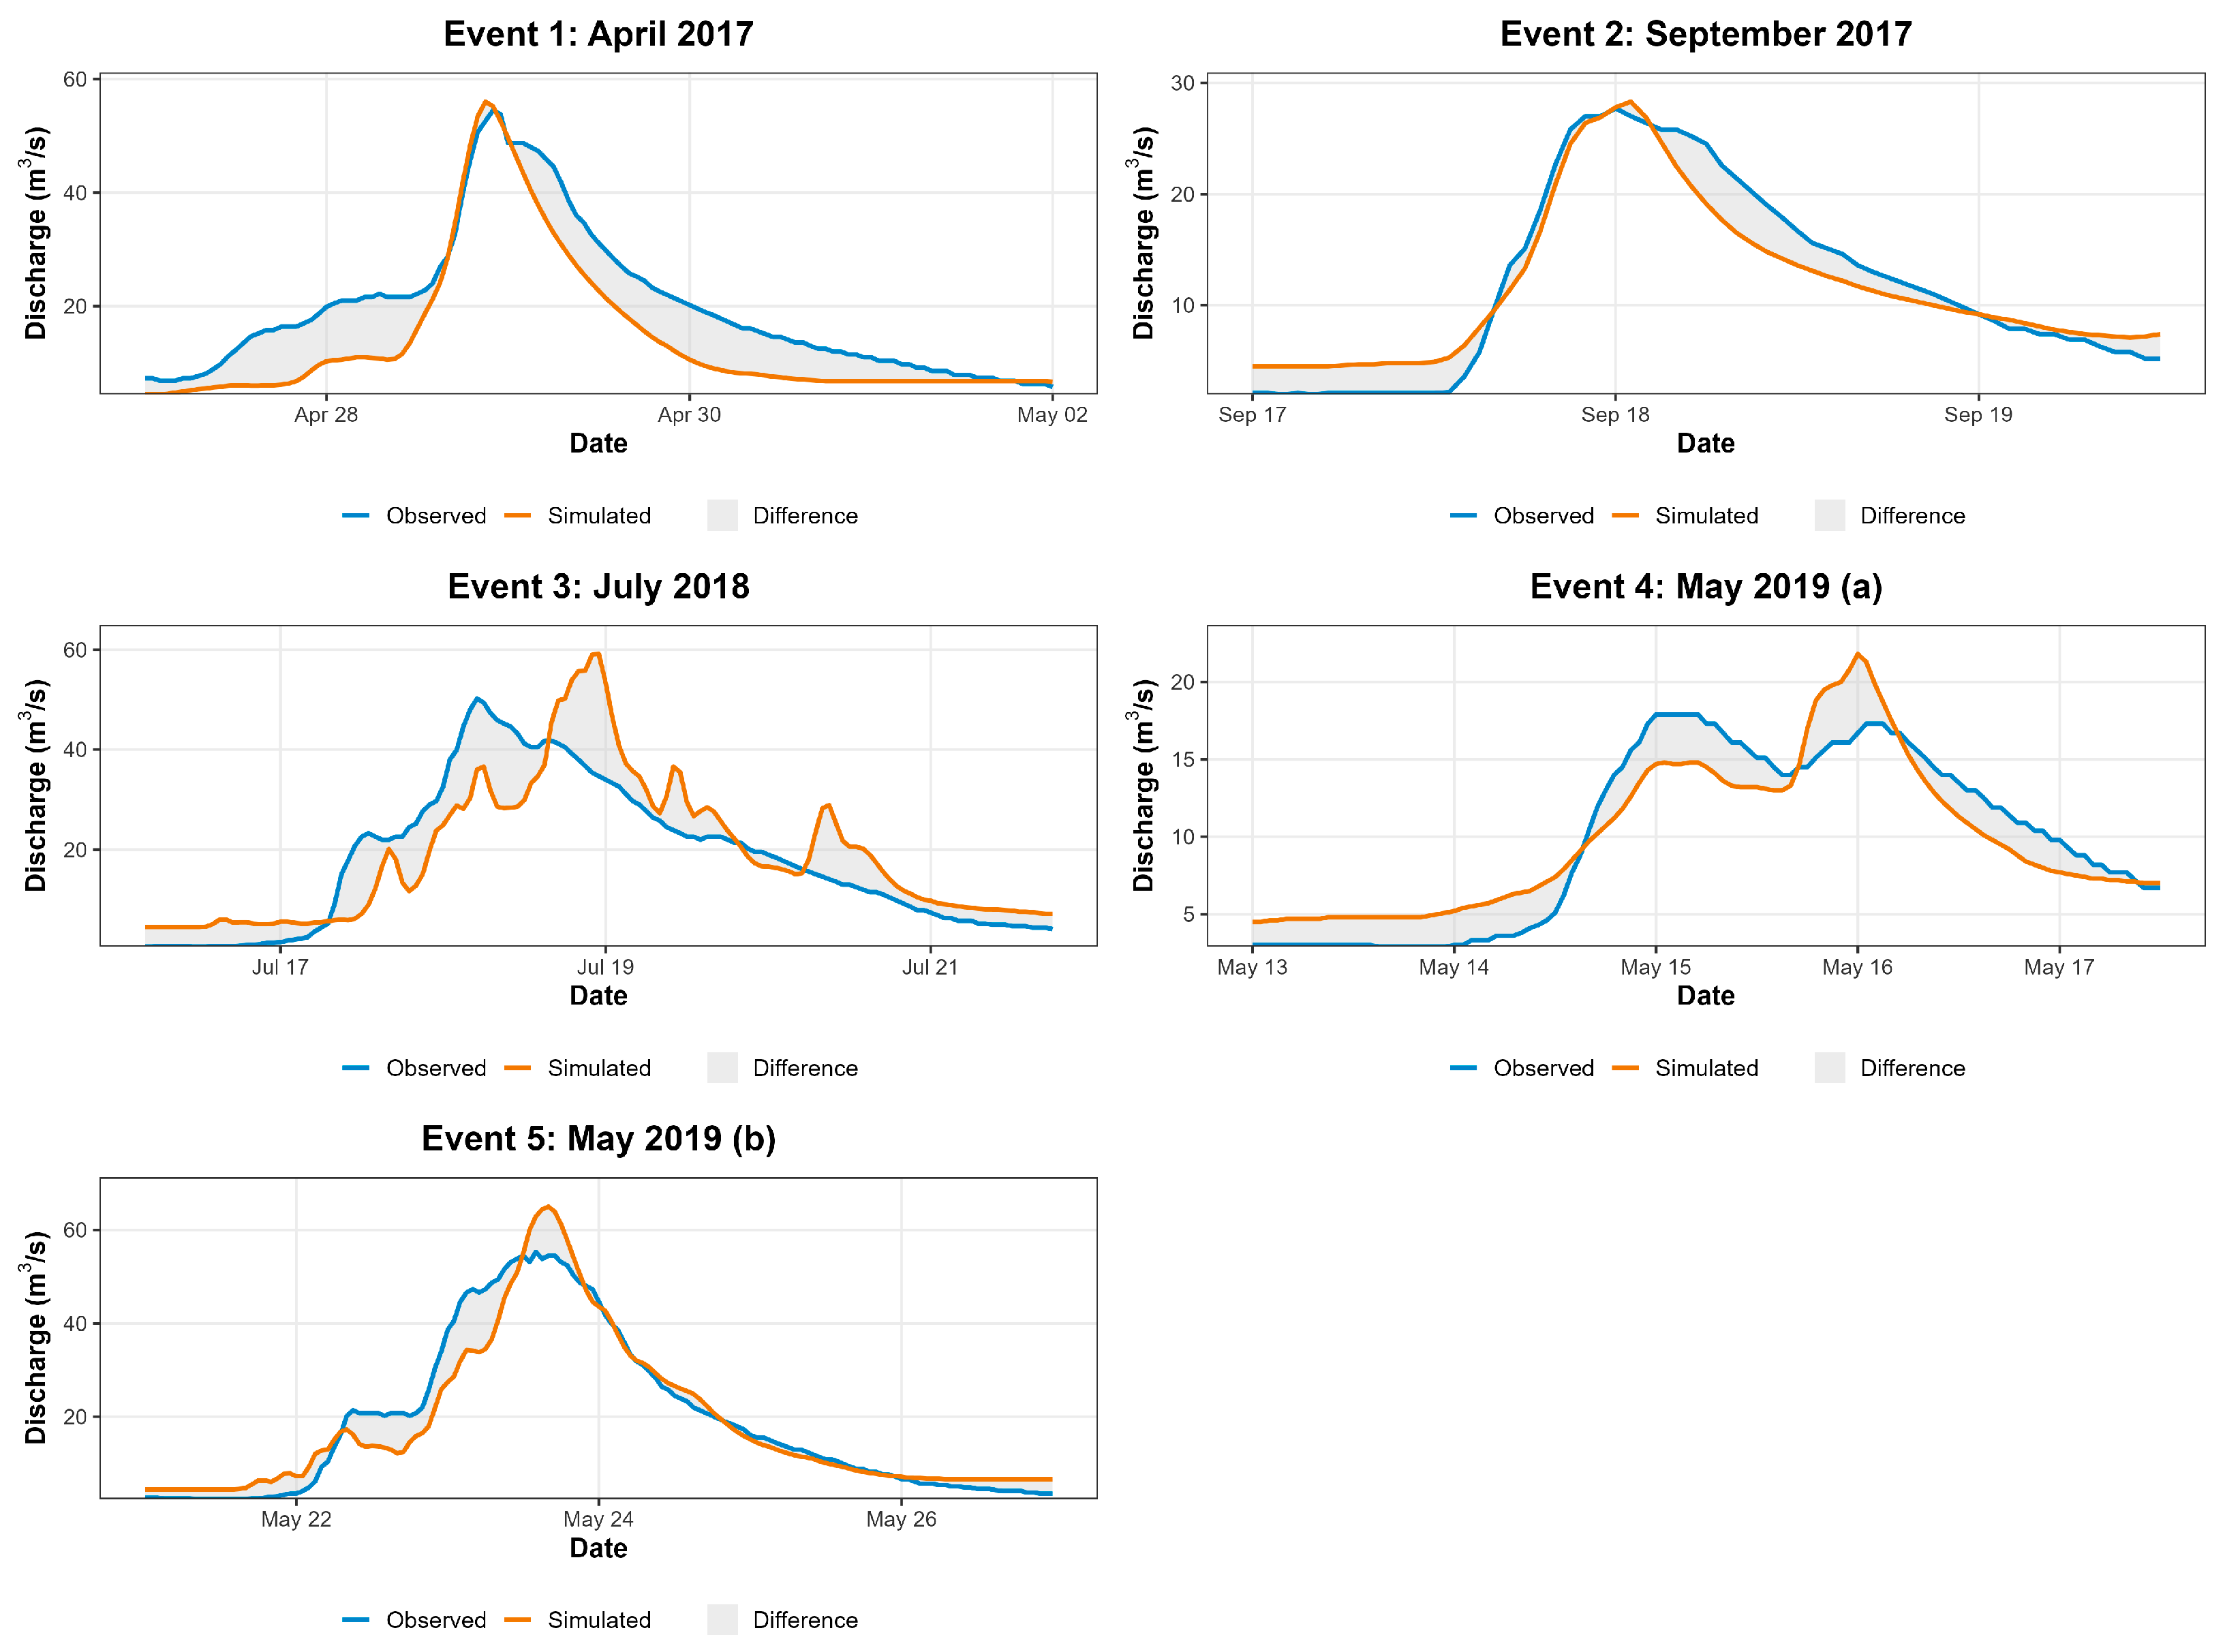
The predictive capability of the model was further corroborated during the validation phase, in which its performance was predominantly classified as “good” to “very good” across the four independent flood events. The visual comparison of hydrographs is presented in Figure 3, with performance metrics summarized in Table 6.
The predictive capability of the model was confirmed during the validation phase, in which four of the five independent flood events achieved “good” or “very good” ratings across key performance metrics. Specifically, Events 2, 4, and 5 demonstrated exceptional performance, achieving “very good” ratings for NSE, PBIAS, and the newly included RSR metric. Event 3 also showed a robust fit, with “Good” ratings for NSE and RSR, alongside a “very good” volumetric match. This high level of performance on an independent dataset underscores the model’s robustness and reliability.
A notable exception was Event 1 (April 2017). Despite a “good” NSE of 0.71, the model yielded an “unsatisfactory” volumetric bias (PBIAS = −28.20%). However, the RSR metric provides a more nuanced picture. The resulting value of 0.53 (“good”) suggests that while the total runoff volume was underestimated, the magnitude of the residual errors was acceptable in relation to the high standard deviation of this particular flood event. An examination of the hydrograph (Figure 3) supports this interpretation, revealing that while the model accurately replicated the timing of the peak flow, it systematically underestimated the flow on the rising and falling limbs, which explains the volumetric discrepancy.
In summary, the calibration and validation results, assessed using a comprehensive suite of metrics including RSR, indicate that the HEC-HMS model, as configured for this study, possesses strong predictive power for simulating flood events in the Upper Skawa catchment. The model was found to be well-calibrated and robust, establishing it as a reliable tool for the subsequent assessment of climate change impacts on the catchment’s hydrological response.

3.2. Discharge Under RCP4.5

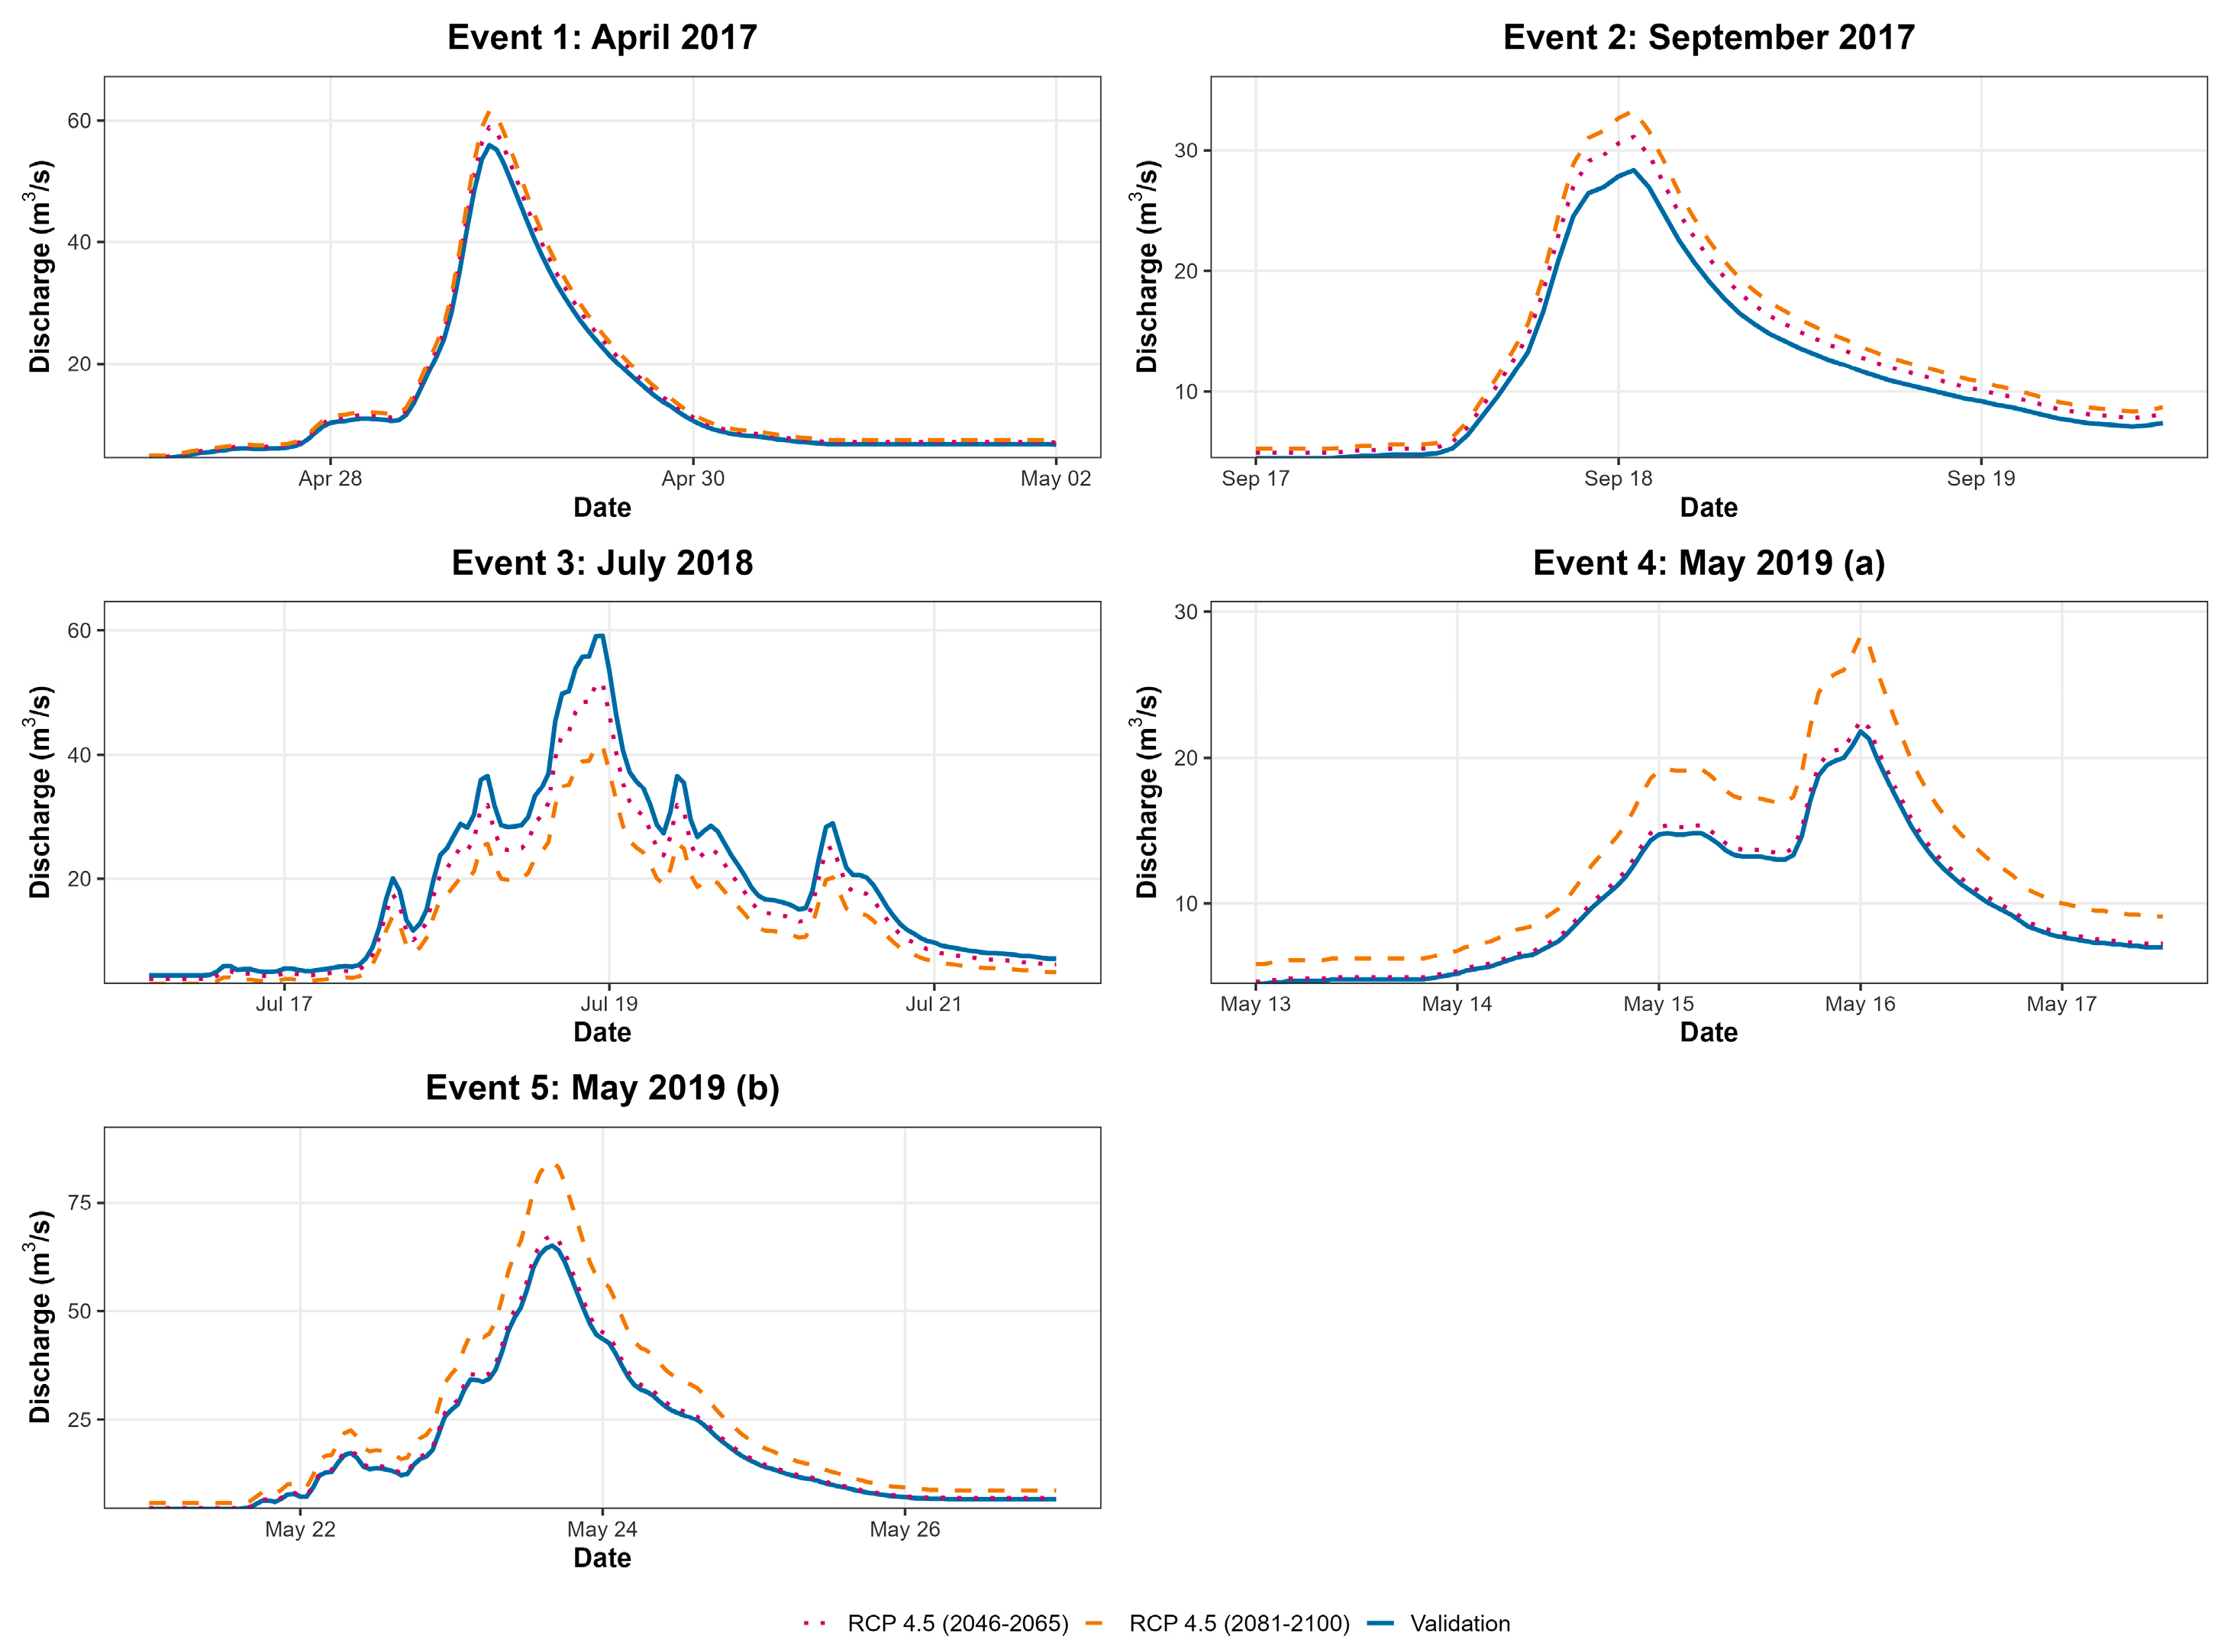
The assessment of the hydrological response of the Upper Skawa catchment to future climate conditions was conducted through the simulation of validation flood events, utilizing precipitation time series adjusted in accordance with the RCP4.5 scenario. The simulation results, presented in Figure 4, indicate a distinct seasonal pattern in flood characteristics. Furthermore, they suggest that the magnitude of these changes is likely to intensify toward the end of the century.
The assessment of the hydrological response to future climate conditions under the RCP4.5 scenario reveals a distinct seasonal pattern in flood characteristics, with the magnitude of these changes intensifying toward the end of the century (Figure 4). The primary driver of this divergence is the seasonality of the applied “delta change” factors, which projected wetter conditions for the transitional seasons and drier conditions for the summer.
For flood events occurring in spring and autumn (Events 1, 2, 4, and 5), the simulations project a consistent amplification of flood risk. This systematic increase in both flood peaks and volumes points to a heightened flood hazard during these months. In stark contrast, the primary summer flood event (Event 3, July 2018) exhibited a marked reduction in its hydrological response. This finding implies a potential mitigation of summer flood risk but concurrently elevates the concern for more frequent or severe hydrological droughts during this period. A detailed quantitative breakdown of these changes is provided in Section 3.4.

3.3. Discharge Under RCP8.5

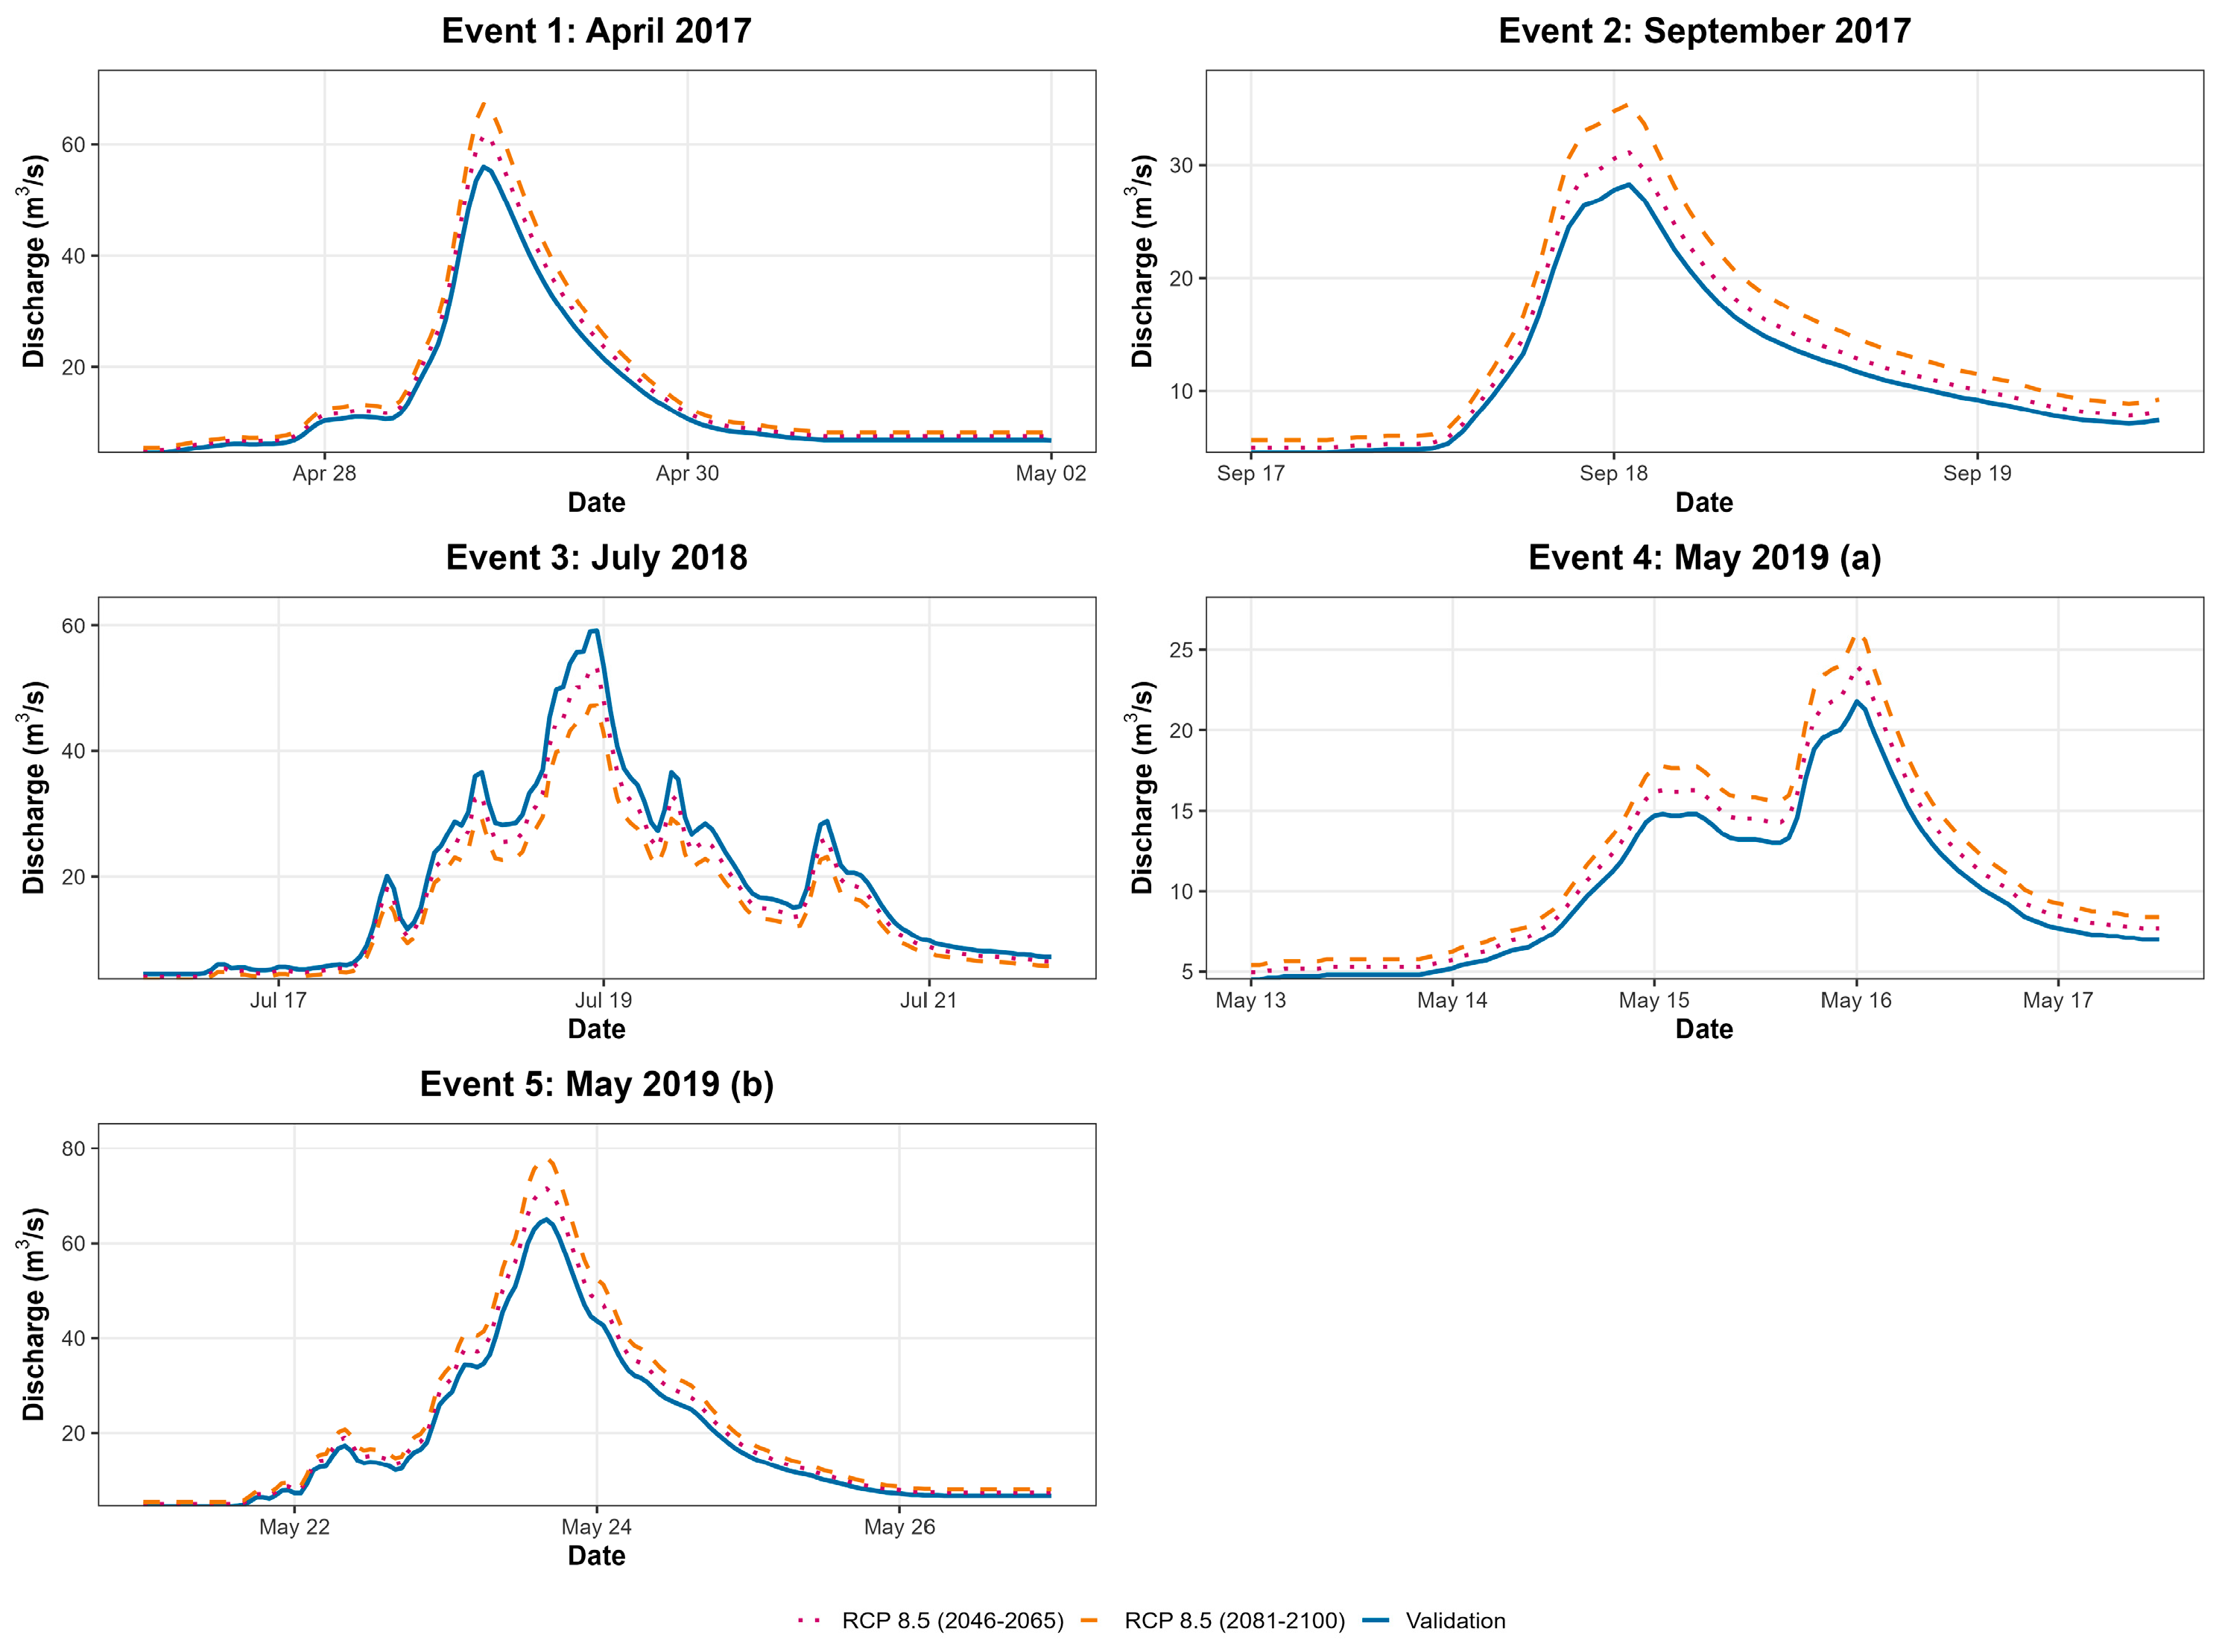
Simulations under the high-emissions RCP8.5 scenario indicate a significant amplification of the seasonal hydrological extremes previously identified under the moderate RCP4.5 pathway. The projected changes, illustrated in Figure 5, suggest a future characterized by a more pronounced polarization of the water regime, with substantially higher flood peaks in the transitional seasons and significantly lower flows during the summer.
Further analysis of the spring and autumn flood events (Events 1, 2, 4, and 5) reveals that the increase in peak discharge is considerably more pronounced than in the RCP4.5 scenario. Conversely, a more severe reduction in flow is observed for the summer flood event (Event 3).
A direct comparison with the moderate-emissions pathway confirms that while the RCP8.5 scenario follows a similar seasonal pattern, it also leads to a significant intensification of its magnitude. The projected long-term increase in spring and autumn flood peaks under RCP8.5 is approximately twofold greater than that projected under RCP4.5. Therefore, these findings imply a severe amplification of flood risk during the wetter months and an exacerbated risk of hydrological droughts and water scarcity during the summer. The specific percentage changes for peak flow and runoff volume for all events are summarized in Section 3.4.

3.4. Comparative Analysis

To provide a quantitative summary of the projected hydrological changes, the percentage change in peak discharge (Qpeak) and total runoff volume was calculated for each scenario relative to the baseline validation simulation. These results are summarized in Table 7.
The quantitative results presented in Table 7 appear to support the key findings of this study. A dose–response relationship is suggested, whereby the high-emissions RCP8.5 scenario generally produces changes of a greater magnitude than the moderate RCP4.5 scenario, particularly for the long-term horizon. This effect is particularly pronounced for spring and autumn events (Events 1, 2, 4, 5), where the projected increases in both peak discharge and total runoff volume indicate a substantial amplification of potential flood hazard. Furthermore, the table highlights the potentially non-linear response of the catchment. For instance, in Event 5, a +32.0% increase in runoff volume under RCP8.5 (long-term) is associated with a disproportionately larger +38% increase in peak discharge. Conversely, the significant percentage decrease observed in summer flows (Event 3) suggests a substantial and potentially growing risk of hydrological drought.

4. Discussion

4.1. Interpretation of Results and Hydrological Implications

The findings of this investigation provide quantitative evidence that the Upper Skawa catchment will likely experience a future of increased hydrological volatility. This projection is consistent with broader assessments of climate change impacts in the mountainous regions of Central Europe. The simulated polarization of the hydrological regime—characterized by a significant increase in spring and autumn flood magnitudes and a concurrent decrease in summer flows—represents a key finding. While large-scale studies have projected similar seasonal shifts, this research provides a high-resolution, catchment-specific quantification of these changes, which is fundamental to local risk assessment.
Furthermore, a primary observation is the catchment’s non-linear response to changes in precipitation. The amplification of flood peaks, where the percentage increase in discharge exceeds that of rainfall, highlights the critical role of the catchment’s physiographic characteristics. The steep slopes and low-permeability soils of the Outer Carpathians are shown to act as amplifiers of the climate change signal. This observation suggests that the inherent vulnerability of the catchment may be exacerbated under future climatic conditions and that linear extrapolations of rainfall changes are insufficient for accurate flood risk forecasting. Consequently, this non-linear behavior underscores the necessity of using physically based or conceptual hydrological models for impact assessment.
The projected changes have significant implications for regional water resource and flood risk management. The severe amplification of spring and autumn flood risk, particularly under the high-emissions RCP8.5 scenario, indicates that existing flood protection infrastructure and land-use planning regulations may prove inadequate for future conditions. Concurrently, the projected decrease in summer precipitation and the resulting reduction in low flows suggest an intensified risk of hydrological drought. This creates a dual challenge for water managers, who will be required to manage both higher flood peaks in wetter seasons and greater water scarcity in the summer.
Such conditions could impact not only drinking water supplies but also local agriculture and the ecological health of the river. Moreover, the findings suggest that antecedent moisture conditions (AMCs) will become more extreme. For instance, while wetter springs could lead to more saturated soil conditions, this effect may be rapidly offset by projected decreases in summer rainfall, resulting in a more complex and highly variable soil moisture regime.
These findings support a transition from reactive to proactive and adaptive management strategies. The results provide a strong rationale for the implementation of integrated approaches that address both flood and drought risk. This includes not only the potential reinforcement of “hard” infrastructure but also the promotion of “soft” solutions, such as natural water retention measures (NWRMs), floodplain restoration, and the development of sophisticated, scenario-based early warning systems. Ultimately, these quantitative projections provide a substantive evidence base for initiating such a re-evaluation of water management policies in the region.

4.2. Comparison with Other Studies and Adaptation Implications

The projected increase in flood risk for the Upper Skawa catchment is consistent with broader regional assessments for the Polish Carpathians. For instance, Wypych & Ustrnul [5], who analyzed historical data and future projections for several Carpathian catchments, also identified a strong link between extreme precipitation and runoff, suggesting an elevated future flood risk. This regional consensus on elevated risk is further supported by studies utilizing advanced, multi-criteria spatial modeling methods for flash flood susceptibility in steep terrain, which consistently identify a strong link between physiographic criteria and flash flood hazard [30]. Our findings provide a high-resolution, event-based quantification of this risk, demonstrating that long-term peak flows in transitional seasons could increase by as much as 35% under a high-emissions scenario. While our study focuses on a mountainous, rainfall-driven system, its findings stand in contrast to studies of lowland catchments in Poland, such as those analyzed by Marcinkowski et al. [3], where changes in snowmelt, evapotranspiration, and groundwater percolation play a more dominant role in the future water balance. This comparison underscores the unique vulnerability of small mountain catchments, where rapid runoff processes amplify the climate signal in ways not observed in lowland systems [7].
The projected increase in flood risk for the Upper Skawa catchment appears consistent with broader regional assessments for the Polish Carpathians. For instance, Wypych & Ustrnul [5], who analyzed historical data and future projections for several Carpathian catchments, also identified a significant link between extreme precipitation and runoff, suggesting an elevated future flood risk. Our findings advance this understanding by providing a high-resolution, event-based quantification of this risk at an hourly time step. This is particularly relevant for flash floods, where daily models often fail to capture the rapid hydrological response (approx. 2.5 h) characteristic of the region.
Furthermore, our results highlight a critical distinction between mountain and lowland hydrology. While our study focuses on a mountainous, rainfall-driven system, its findings appear to stand in contrast to studies of lowland catchments in Poland, such as those analyzed by Marcinkowski et al. [3]. In lowland systems, changes in snowmelt, evapotranspiration, and groundwater percolation reportedly play a more dominant role in the future water balance. In contrast, our results indicate that in steep, low-permeability catchments like the Upper Skawa, rapid runoff processes dominate, leading to a non-linear amplification of the flood peak that exceeds the percentage change in precipitation volume (as shown in Table 7). This comparison underscores the apparent unique vulnerability of small mountain catchments, where inherent physiographic characteristics may amplify the climate signal in ways not observed in lowland systems.
This demonstrated amplification of flood peaks suggests that generic adaptation policies may be insufficient and that specific, local strategies are likely necessary—a need echoed in similar risk assessments across European mountain regions. The severe amplification of spring and autumn flood risk (Table 7), particularly under the RCP8.5 scenario, strongly indicates that existing engineering design standards for hydraulic structures (e.g., bridges, culverts), which are often based on historical stationarity, may be inadequate and will likely necessitate re-evaluation.
Therefore, these findings lend support to a transition from reactive to proactive and adaptive management. The results provide a strong rationale for supplementing traditional “hard” infrastructure with “soft” solutions, such as Natural Water Retention Measures (NWRMs) and floodplain restoration, particularly in the upper parts of the catchment to attenuate runoff generation. Ultimately, these quantitative projections provide a substantive, evidence-based foundation for initiating a critical re-evaluation of local flood risk maps and spatial planning policies in the region.

4.3. Model Limitations and Future Research Directions

Notwithstanding the insights provided by this investigation, an acknowledgement of several limitations is necessary to frame directions for future research. The primary source of uncertainty in this study stems from the chosen downscaling methodology. The application of the “delta change” method, despite being a robust and widely used technique, is subject to two significant constraints. First, this approach assumes that the sub-daily temporal structure of precipitation events (i.e., storm hyetograph shape and intensity patterns) will remain unchanged in the future, with only the total monthly volume being altered. This is a critical simplification, as future warming may also affect the dynamics and convective nature of storm events themselves, a factor of particular importance for flash flood assessments. Second, the use of a single, median change factor derived from the CMIP5 model ensemble provides only a deterministic projection. This approach does not capture the full range of projection uncertainty that arises from the variability and spread among different Global Climate Models (GCMs).
The decision to employ the delta change method was a deliberate methodological trade-off. It was chosen primarily to preserve the realistic, locally observed characteristics of storm events at a high temporal resolution (hourly), features which are often poorly replicated by climate models and are key drivers of peak hydrological response in flash-flood-prone catchments. Furthermore, this method effectively bypasses the issue of systematic biases inherent in raw RCM outputs, which would otherwise require complex bias-correction procedures that introduce their own sources of uncertainty. However, future research should aim to address these limitations. A crucial next step would be the application of dynamically downscaled, bias-corrected precipitation data from an ensemble of Regional Climate Models (RCMs), such as those from the EURO-CORDEX project. This would not only provide more physically consistent projections of future changes in sub-daily precipitation intensity but also enable a comprehensive, probabilistic assessment of uncertainty in future flood risk.
Furthermore, the hydrological model structure itself, despite its demonstrated robustness for event-based simulation, is characterized by certain simplifications. The employed HEC-HMS configuration, based on the SCS-CN method, does not dynamically model key temperature-driven processes, such as evapotranspiration (ET). Antecedent moisture conditions (AMCs) are simplified to a function of antecedent precipitation, which does not explicitly account for the influence of rising temperatures on accelerated catchment drying, particularly during summer periods. This omission has a direct impact on runoff volume generation. Subsequent studies could therefore employ energy-balance-based or continuous simulation models that provide a more accurate representation of these processes. Such an approach would also allow for the expansion of the analysis beyond single flood events to a continuous, multi-year simulation of the catchment’s water balance, which would facilitate a more thorough understanding of the severity and duration of projected summer droughts.
The CLC2018 land-use data was the most current, consistent pan-European dataset available during model development. While newer, high-resolution datasets (e.g., ESRI 10 m) are now available, the land use in this predominantly forested and rural catchment is relatively stable, suggesting a marginal impact on the results compared to the strong climate signal. This, however, remains a source of uncertainty and should be verified in future studies. Similarly, the 100 m DEM used for topographic analysis was the best available consistent national dataset at the time of model inception. While higher-resolution datasets (e.g., EU-DEM) exist, the impact of DEM resolution is less pronounced in semi-distributed models (which use averaged sub-catchment parameters) than in fully distributed models. Nonetheless, future work should re-evaluate parameterization using higher-resolution elevation data.

5. Conclusions

This study successfully developed and validated a semi-distributed HEC-HMS model for the Upper Skawa catchment to assess its hydrological response to climate change under the RCP4.5 and RCP8.5 emissions scenarios. The primary conclusions are as follows:
  • The calibrated model demonstrated strong predictive capabilities, establishing its reliability for scenario analysis with performance ratings ranging from “satisfactory” to “very good”.
  • A consistent trend towards a more polarized hydrological regime was identified, characterized by a significant increase in flood magnitude in spring and autumn and a concurrent decrease in summer flows.
  • The intensity of the hydrological response is strongly correlated with the emissions pathway, with the RCP8.5 scenario projecting flood peak increases approximately double the magnitude of those under RCP4.5.
  • The impacts of climate change are projected to intensify throughout the century, with long-term projections (2081–2100) showing a substantially greater deviation from the baseline than near-term projections.
  • The catchment exhibits a non-linear response, where the percentage increase in peak discharge frequently exceeds the percentage increase in precipitation forcing, highlighting the role of physiographic characteristics in amplifying the climate signal.
Collectively, these findings indicate a future of increased hydrological volatility for the Upper Skawa catchment, presenting a complex, dual-natured challenge of both heightened flood risk and emerging drought risk. These quantitative projections provide a crucial, evidence-based foundation for the re-evaluation of regional water management policies and the development of integrated, climate-resilient adaptation strategies.

Author Contributions

Conceptualization, P.G., A.S. and M.R.; methodology, P.G.; software, P.G.; validation, P.G.; formal analysis, P.G.; investigation, P.G.; resources, P.G.; data curation, P.G.; writing—original draft preparation, P.G.; writing—review and editing, P.G., A.S. and M.R.; visualization, P.G.; supervision, P.G.; project administration, P.G.; funding acquisition, P.G. All authors have read and agreed to the published version of the manuscript.

Funding

This research received no external funding.

Data Availability Statement

The data presented in this study are available on request from the corresponding author due to legal reasons.

Conflicts of Interest

The authors declare no conflicts of interest.

Appendix A

Table A1. Final calibrated parameter values for the HEC-HMS model for each sub-catchment. Source: Own elaboration.
Sub-Catchment (SC)Curve Number (CN) [–]Initial Abstraction (Ia) [mm]Snyder Lag (tp) [h]Peaking Coeff. (Cp) [–]Initial Discharge [m3/s]Recession Constant [–]Threshold Flow [m3/s]
SC-170.6826.572.750.360.800.970.82
SC-277.2021.243.090.510.671.000.70
SC-387.1115.232.960.260.671.000.92
SC-476.7519.472.440.240.591.000.94
SC-581.7112.922.160.320.501.001.41

References

  1. Chyon, M.S.A.; Biswas, S.; Mondal, M.S.; Roy, B.; Rahman, A. Integrated Assessment of Flood Risk in Arial Khan Floodplain of Bangladesh under Changing Climate and Socioeconomic Conditions. J. Flood Risk Manag. 2023, 16, e12876. [Google Scholar] [CrossRef]
  2. Gilewski, P. Application of Global Environmental Multiscale (GEM) Numerical Weather Prediction (NWP) Model for Hydrological Modeling in Mountainous Environment. Atmosphere 2022, 13, 1348. [Google Scholar] [CrossRef]
  3. Marcinkowski, P.; Piniewski, M.; Kardel, I.; Szcześniak, M.; Benestad, R.; Srinivasan, R.; Ignar, S.; Okruszko, T. Effect of Climate Change on Hydrology, Sediment and Nutrient Losses in Two Lowland Catchments in Poland. Water 2017, 9, 156. [Google Scholar] [CrossRef]
  4. Fowler, H.J.; Blenkinsop, S.; Tebaldi, C. Linking Climate Change Modelling to Impacts Studies: Recent Advances in Downscaling Techniques for Hydrological Modelling. Int. J. Climatol. 2007, 27, 1547–1578. [Google Scholar] [CrossRef]
  5. Wypych, A.; Ustrnul, Z. Precipitation and Hydrological Extremes during the Warm Season in Response to Climate Change: The Example from the Polish Carpathians. Reg. Environ. Change 2024, 24, 52. [Google Scholar] [CrossRef]
  6. Badora, D.; Wawer, R.; Król-Badziak, A.; Nieróbca, A.; Kozyra, J.; Jurga, B. Hydrological Balance in the Vistula Catchment under Future Climates. Water 2023, 15, 4168. [Google Scholar] [CrossRef]
  7. Bucała-Hrabia, A.; Kijowska-Strugała, M.; Bryndal, T.; Cebulski, J.; Kiszka, K.; Kroczak, R. An Integrated Approach for Investigating Geomorphic Changes Due to Flash Flooding in Two Small Stream Channels (Western Polish Carpathians). J. Hydrol. Reg. Stud. 2020, 31, 100731. [Google Scholar] [CrossRef]
  8. Douinot, A.; Roux, H.; Garambois, P.A.; Dartus, D. Using a Multi-Hypothesis Framework to Improve the Understanding of Flow Dynamics during Flash Floods. Hydrol. Earth Syst. Sci. 2018, 22, 5317–5340. [Google Scholar] [CrossRef]
  9. Iosub, M.; Minea, I.; Chelariu, O.E.; Ursu, A. Assessment of Flash Flood Susceptibility Potential in Moldavian Plain (Romania). J. Flood Risk Manag. 2020, 13, e12588. [Google Scholar] [CrossRef]
  10. Stocker, T.F. (Ed.) Climate Change 2013: The Physical Science Basis: Working Group I Contribution to the Fifth Assessment Report of the Intergovernmental Panel on Climate Change; Cambridge University Press: Cambridge, UK, 2014. [Google Scholar]
  11. Gilewski, P. Impact of the Grid Resolution and Deterministic Interpolation of Precipitation on Rainfall-Runoff Modeling in a Sparsely Gauged Mountainous Catchment. Water 2021, 13, 230. [Google Scholar] [CrossRef]
  12. Jacob, D.; Petersen, J.; Eggert, B.; Alias, A.; Christensen, O.B.; Bouwer, L.M.; Braun, A.; Colette, A.; Déqué, M.; Georgievski, G.; et al. EURO-CORDEX: New High-Resolution Climate Change Projections for European Impact Research. Reg. Environ. Change 2014, 14, 563–578. [Google Scholar] [CrossRef]
  13. Sleziak, P.; Jančo, M.; Danko, M.; Méri, L.; Holko, L. Accuracy of Radar-Estimated Precipitation in a Mountain Catchment in Slovakia. J. Hydrol. Hydromech. 2023, 71, 111–122. [Google Scholar] [CrossRef]
  14. Pluntke, T.; Pavlik, D.; Bernhofer, C. Reducing Uncertainty in Hydrological Modelling in a Data Sparse Region. Environ. Earth Sci. 2014, 72, 4801–4816. [Google Scholar] [CrossRef]
  15. Szturc, J.; Ośródka, K.; Jurczyk, A.; Otop, I.; Linkowska, J.; Bochenek, B.; Pasierb, M. Quality Control and Verification of Precipitation Observations, Estimates, and Forecasts; Elsevier: Amsterdam, The Netherlands, 2021; ISBN 9780128229736. [Google Scholar]
  16. Chaubey, I.; Cotter, A.S.; Costello, T.A.; Soerens, T.S. Effect of DEM Data Resolution on SWAT Output Uncertainty. Hydrol. Process. 2005, 19, 621–628. [Google Scholar] [CrossRef]
  17. Lin, S.; Jing, C.; Chaplot, V.; Yu, X.; Zhang, Z.; Moore, N.; Wu, J. Effect of DEM Resolution on SWAT Outputs of Runoff, Sediment and Nutrients. Hydrol. Earth Syst. Sci. Discuss. 2010, 7, 4411–4435. [Google Scholar]
  18. Gilewski, P.; Węglarz, A. Impact of Land-Cover Change Related Urbanization on Surface Runoff Estimation. In Proceedings of the E3S Web of Conferences, Warsaw, Poland, 15–17 November 2018; Volume 196, p. 03014. [Google Scholar]
  19. Gilewski, P.; Nawalany, M. Inter-Comparison of Rain-Gauge, Radar, and Satellite (IMERG GPM) Precipitation Estimates Performance for Rainfall-Runoff Modeling in a Mountainous Catchment in Poland. Water 2018, 10, 1665. [Google Scholar] [CrossRef]
  20. Vetter, T.; Reinhardt, J.; Flörke, M.; van Griensven, A.; Hattermann, F.; Huang, S.; Koch, H.; Pechlivanidis, I.G.; Plötner, S.; Seidou, O.; et al. Evaluation of Sources of Uncertainty in Projected Hydrological Changes under Climate Change in 12 Large-Scale River Basins. Clim. Change 2017, 141, 419–433. [Google Scholar] [CrossRef]
  21. Houghton, J.T. (Ed.) Climate Change 1995: The Science of Climate Change: Contribution of Working Group I to the Second Assessment Report of the Intergovernmental Panel on Climate Change; Cambridge University Press: Cambridge, UK, 1996. [Google Scholar]
  22. Houghton, J.T.; Ding, Y.; Griggs, D.J.; Noguer, M.; van der Linden, P.J.; Dai, X.; Maskell, K.; Johnson, C.A. (Eds.) Climate Change 2001: The Scientific Basis: Contribution of Working Group I to the Third Assessment Report of the Intergovernmental Panel on Climate Change; Cambridge University Press: Cambridge, UK, 2001. [Google Scholar]
  23. Nakicenovic, N.; Alcamo, J.; Davis, G.; de Vries, B.; Fenhann, J.; Gaffin, S.; Gregory, K.; Grübler, A.; Jung, T.Y.; Kram, T.; et al. Special Report on Emissions Scenarios; Cambridge University Press: Cambridge, UK, 2000. [Google Scholar]
  24. Stocker, T.F.; Qin, D.; Plattner, G.K.; Tignor, M.; Allen, S.K.; Boschung, J.; Nauels, A.; Xia, Y.; Bex, V.; Midgley, P.M. (Eds.) Climate Change 2013: The Physical Science Basis. Contribution of Working Group I to the Fifth Assessment Report of the Intergovernmental Panel on Climate Change; Cambridge University Press: Cambridge, UK, 2013. [Google Scholar]
  25. Moss, R.H.; Edmonds, J.A.; Hibbard, K.A.; Manning, M.R.; Rose, S.K.; van Vuuren, D.P.; Carter, T.R.; Emori, S.; Kainuma, M.; Kram, T.; et al. The next Generation of Scenarios for Climate Change Research and Assessment. Nature 2010, 463, 747–756. [Google Scholar] [CrossRef]
  26. van Vuuren, D.P.; Edmonds, J.; Kainuma, M.; Riahi, K.; Thomson, A.; Hibbard, K.; Hurtt, G.C.; Kram, T.; Krey, V.; Lamarque, J.F.; et al. The Representative Concentration Pathways: An Overview. Clim. Change 2011, 109, 5–31. [Google Scholar] [CrossRef]
  27. Wilby, R.L.; Wigley, T.M. Downscaling General Circulation Model Output: A Review of Methods and Limitations. Prog. Phys. Geogr. 1997, 21, 530–548. [Google Scholar] [CrossRef]
  28. Nash, J.E.; Sutcliffe, J.V. River Flow Forecasting through Conceptual Models Part I—A Discussion of Principles. J. Hydrol. 1970, 10, 282–290. [Google Scholar] [CrossRef]
  29. Moriasi, D.N.; Arnold, J.G.; Van Liew, M.W.; Bingner, R.L.; Harmel, R.D.; Veith, T.L. Model Evaluation Guidelines for Systematic Quantification of Accuracy in Watershed Simulations. Trans. ASABE 2007, 50, 885–900. [Google Scholar] [CrossRef]
  30. Vujović, F.; Valjarević, A.; Durlević, U.; Morar, C.; Grama, V.; Spalević, V.; Milanović, M.; Filipović, D.; Ćulafić, G.; Gazdić, M.; et al. A Comparison of the AHP and BWM Models for the Flash Flood Susceptibility Assessment: A Case Study of the Ibar River Basin in Montenegro. Water 2025, 17, 844. [Google Scholar] [CrossRef]
Figure 1. Location and topography of the Upper Skawa River catchment. The map illustrates the delineation of the study area into six sub-catchments (SCs), the locations of the gauging station and meteorological stations (MSs), and the surface elevation derived from a Digital Elevation Model (DEM). Source: Own elaboration, based on data from the Head Office of Geodesy and Cartography (DEM) and IMGW-PIB (gauges).
Water 17 03128 g001
Figure 2. Comparison of observed and simulated discharge hydrographs for the four calibration events (2014–2016). Source: Own elaboration.
Water 17 03128 g002
Figure 3. Comparison of observed and simulated discharge hydrographs for the five validation events (2017–2019). Source: Own elaboration. Note: (a) and (b) distinguish two separate flood events in the same month—May 2019.
Water 17 03128 g003
Figure 4. Projected discharge hydrographs for the five validation events under the RCP4.5 scenario for near-term (2046–2065) and long-term (2081–2100) horizons compared to the baseline validation simulation. Source: Own elaboration. Note: (a) and (b) distinguish two separate flood events in the same month—May 2019.
Water 17 03128 g004
Figure 5. Projected discharge hydrographs for the five validation events under the RCP8.5 scenario for near-term (2046–2065) and long-term (2081–2100) horizons compared to the baseline validation simulation. Source: Own elaboration. Note: (a) and (b) distinguish two separate flood events in the same month—May 2019.
Water 17 03128 g005
Table 1. Characteristics of selected flood events for model calibration and validation. Source: Own elaboration.
UseStart DateEnd DateDuration [hours]Peak Discharge [m3/s]
Calibration14 May 201419 May 2014126211.7
Calibration21 May 201530 May 201522426.8
Calibration16 July 201619 July 20166923.2
Calibration3 October 20169 October 201614735.2
Validation27 April 20171 May 201712254.5
Validation17 September 201719 September 20176027.7
Validation17 July 201821 July 201812550.2
Validation13 May 201917 May 201910917.9
Validation21 May 201926 May 201914755.3
Table 2. Monthly percentage change factors (%) applied to observed precipitation for future scenario generation. Source: Own elaboration.
MonthRCP 4.5 (2046–2065)RCP 4.5 (2081–2100)RCP 8.5 (2046–2065)RCP 8.5 (2081–2100)
April+5%+5%+5%+5%
May+5%+5%+5%+5%
June−10%−10%−10%−10%
July−10%−10%−10%−10%
August−10%−10%−10%−10%
September+5%+5%+5%+5%
October+15%+15%+15%+15%
Table 3. Summary of HEC-HMS parametrization for the Upper Skawa catchment. Source: Own elaboration.
Hydrological ProcessHEC-HMS Method SelectedKey ParametersRationale/Data Source
Rainfall lossesSCS Curve Number (SCS-CN)Curve Number (CN), Initial AbstractionIntegrates land use (CORINE) and soil type; effective for event-based modeling in sparsely gauged catchments.
Runoff transformationSnyder Unit HydrographStandard Lag, Peaking CoefficientStandard synthetic method suitable for catchments where a unit hydrograph cannot be derived from observations.
BaseflowRecession BaseflowInitial Discharge, Recession ConstantProvides a robust representation of hydrograph recession for event-based flood simulations.
Channel routingMuskingum–CungeChannel Geometry (Length, Slope)Physically based approach using DEM-derived properties, suitable for the steep channels of the Skawa River.
Table 4. General performance ratings for the applied statistics. Source: Adapted from Moriasi et al. [29].
Performance RatingNSEPBIAS [%]RSR
Very good0.75 < NSE ≤ 1.00PBIAS < ±100.00 ≤ RSR ≤ 0.50
Good0.65 < NSE ≤ 0.75±10 ≤ PBIAS < ±150.50 < RSR ≤ 0.60
Satisfactory0.50 < NSE ≤ 0.65±15 ≤ PBIAS < ±250.60 < RSR ≤ 0.70
UnsatisfactoryNSE ≤ 0.50PBIAS ≥ ±25RSR > 0.70
Table 5. Performance metrics of the HEC-HMS model for the calibration events. Source: Own elaboration. Source: Own elaboration.
Events NSEPBIAS [%]RSREvaluation
Event 1: May 20140.52−0.980.70NSE: Satisfactory
PBIAS: Very good
RSR: Satisfactory
Event 2: May 20150.65+5.040.55NSE: Good
PBIAS: Very good
RSR: Good
Event 3: July 20160.54+23.180.76NSE: Satisfactory
PBIAS: Satisfactory
RSR: Unsatisfactory
Event 4: October 20160.77−4.280.42NSE: Very good
PBIAS: Very good
RSR: Very good
Table 6. Performance metrics of the HEC-HMS model for the validation events. Source: Own elaboration. Source: Own elaboration.
EventsNSEPBIAS [%]RSREvaluation
Event 1: April 20170.71−28.200.53NSE: Good
PBIAS: Unsatisfactory
RSR: Good
Event 2: September 20170.92−1.640.29NSE: Very good
PBIAS: Very good
RSR: Very good
Event 3: July 20180.65+6.480.56NSE: Good
PBIAS: Very good
RSR: Good
Event 4: May 2019 (a)0.84+0.570.44NSE: Very good
PBIAS: Very good
RSR: Very good
Event 5: May 2019 (b)0.92−1.430.28NSE: Very good
PBIAS: Very good
RSR: Very good
Table 7. Percentage change in peak discharge (Qpeak) and total runoff volume for each validation event under the RCP4.5 and RCP8.5 scenarios. Source: Own elaboration.
EventsScenarioTime Horizon% Change in Peak Discharge (Qpeak)% Change in Runoff Volume
Event 1: April 2017RCP4.5Near-term8%+6.5%
Long-term+13%+10.5%
RCP8.5Near-term+15%+12.5%
Long-term24%+20.0%
Event 2: September 2017RCP4.5Near-term+9%+7.5%
Long-term+16%+13.0%
RCP8.5Near-term+18%+15.0%
Long-term+27%+22.0%
Event 3: July 2018RCP4.5Near-term−18%−22.0%
Long-term−25%−31.0%
RCP8.5Near-term−22%−27.5%
Long-term−31%−38.0%
Event 4: May 2019 (a)RCP4.5Near-term+7%+5.5%
Long-term+28%+23.0%
RCP8.5Near-term+15%+12.0%
Long-term+35%+29.0%
Event 5: May 2019 (b)RCP4.5Near-term+10%+8.0%
Long-term+20%+17.0%
RCP8.5Near-term+22%+18.0%
Long-term+38%+32.0%
Disclaimer/Publisher’s Note: The statements, opinions and data contained in all publications are solely those of the individual author(s) and contributor(s) and not of MDPI and/or the editor(s). MDPI and/or the editor(s) disclaim responsibility for any injury to people or property resulting from any ideas, methods, instructions or products referred to in the content.