Article

Parameter Optimization of Bionic Hydrofoil System and Its Application in Algal Bloom Control in Plain River Networks

College of Mechanical Engineering, Zhejiang University of Technology, Hangzhou 310023, China
*
Author to whom correspondence should be addressed.
Water 2025, 17(20), 3012; https://doi.org/10.3390/w17203012
Submission received: 5 September 2025 / Revised: 30 September 2025 / Accepted: 16 October 2025 / Published: 20 October 2025
(This article belongs to the Section Hydraulics and Hydrodynamics)

Abstract

The bionic pumping system can effectively improve the hydrodynamic conditions in plain river networks, thereby mitigating the frequent algal blooms in these regions. This study employs numerical simulations to investigate how heave amplitude and chord length affect the hydrodynamic performance of both multi-hydrofoil and single-hydrofoil systems. The operating frequencies for the two configurations are selected by combining these results with the flow velocity threshold required to suppress algal blooms. The results show that the pumping efficiency of the multi-hydrofoil system increases with chord length and heave amplitude, and the optimal parameter combination is c = 0.18W and hmax = 0.7c. For the single-hydrofoil system, efficiency first rises and then falls, peaking at c = 0.16 W and hmax = 0.6c. Under the algal bloom suppression threshold of 0.15 m/s, the multi-hydrofoil system meets the criterion across the entire cross-section at 0.10 Hz, making it suitable for raising flow velocity throughout the water body and for comprehensive bloom suppression. By contrast, the single-hydrofoil system produces an uneven wake with lower velocities in the upper region, so even at higher operating frequencies, it cannot cover the entire cross-section; it is therefore more appropriate for localized velocity enhancement and localized suppression of algal accumulation.

1. Introduction

Plain river network regions are characterized by intricate water systems, extensive coverage, dense channels, varied flow directions, and low gradients. These features result in poor water mobility, frequent backflows, and stagnant zones, which in turn intensify nutrient accumulation [1,2,3] and promote eutrophication [4]. Under natural conditions, the principal controllable factors are nutrient concentration and flow velocity, with the latter being more easily controlled. To enhance velocity, this group proposed a fish-tail-inspired pumping device. Previous work systematically compared the pumping performance of multi-hydrofoil and single-hydrofoil configurations and showed that both markedly increased water mobility [5,6]. Building on the distinct structural features of each system, this paper examines how chord length and heave amplitude affect their hydrodynamic behavior and, guided by the velocity requirements for algal-bloom control, identifies suitable operating frequencies—a contribution of both theoretical and practical significance.
The bionic pumping system induces water motion by generating a reverse von Kármán vortex street downstream of the hydrofoil trailing edge. Consequently, the evolution of the wake structure is widely regarded as a key indicator of pumping capacity when assessing hydrofoil propulsion [7,8]. To improve propulsive performance, numerous researchers have extended the single-hydrofoil baseline [9,10,11] to multi-hydrofoil configurations [12,13,14] and systematically investigated their hydrodynamic behavior. These studies demonstrate that the combined effects of vortex interactions between foils and wall interference can significantly enhance the overall propulsive efficiency of the system. Dewey et al. [15] investigated the propulsive performance of tandem hydrofoils under different phase lags, finding that in-phase flapping increases system efficiency but decreases thrust, whereas out-of-phase motion enhances thrust yet yields no clear efficiency gain. Gungor et al. [16] examined side-by-side pitching foils and showed that wake merging can increase thrust without a significant energy penalty, thereby improving propulsive efficiency. Kurt et al. [17] combined theoretical analysis and experiments to study eel-like swimmers in straight-line and staggered formations; they reported that followers positioned between the upper and lower momentum jets or directly within a single jet can increase thrust by 63–80% and markedly improve swimming efficiency. Huera-Huarte et al. [18] experimentally quantified the propulsive performance of dual hydrofoils over varying lateral and longitudinal spacings, concluding that side-by-side arrangements generally outperform single foils, whereas staggered arrays suffer efficiency losses due to wake asymmetry and the resulting lateral forces.
Algal bloom formation and evolution are closely linked to hydrodynamic conditions [19], and flow velocity, as the core hydrodynamic parameter, is a key factor in both triggering and suppressing blooms [20,21]. The prevailing consensus is that a moderate increase in velocity is one of the most effective strategies for controlling algal bloom outbreaks. Wang et al. [22] investigated algal growth in a small laboratory flume and observed that phytoplankton proliferation was markedly suppressed when the flow velocity exceeded 0.14 m/s. Jiao et al. [23] conducted outdoor enclosure experiments and found that the critical velocity for algal inhibition varies spatiotemporally; owing to changes in water temperature, light, and nutrient concentration, the threshold velocity required to suppress algae differs for the same water body across time and space. Li et al. [24] performed simulations in an annular Plexiglas tank and reported that at velocities of 0.06 and 0.10 m/s the overall inhibition rate of phytoplankton was approximately 50%, with cyanobacteria being the most strongly suppressed, whereas green algae and diatoms were actually promoted within this velocity range. Zhang et al. [25] carried out enclosure experiments in an artificial lake on Chongming Island and further demonstrated that raising the velocity to 0.15 m/s yielded a maximum relative inhibition rate of 54%, whereas at 0.06 m/s the inhibition was minimal. Zhu et al. [26] conducted field enclosure tests in the central lake of Qianwei Village, Chongming County, Shanghai; when surface velocities were set at 0.10, 0.15, and 0.30 m/s, the Chl-a concentrations inside the enclosures were only 45%, 54%, and 26% of those in the corresponding static enclosures.
In summary, although previous studies have systematically explored the effects of hydrofoil arrangement, spacing, and phase lag on the hydrodynamic performance of multi-hydrofoil systems, the synergistic interactions between chord length and heave amplitude across different hydrofoil configurations remain insufficiently analyzed, and the selection of operational parameters for algal bloom mitigation is still unclear. To fill these research gaps, this study investigates both multi- and single-hydrofoil systems using a numerical simulation approach based on overset mesh techniques, focusing on the hydrodynamic responses under various combinations of chord lengths and heave amplitudes. By incorporating the critical flow velocity threshold required to suppress algal blooms, the study proposes optimal frequency settings for each configuration to achieve target performance in practical applications. This research contributes to a deeper theoretical understanding of the operating mechanisms of both systems and provides a feasible technical basis and methodological support for enhancing water circulation and mitigating algal blooms in eutrophic water bodies.

2. Physical Model

2.1. Hydrofoil System Model and Performance Parameters

Because biological hydrofoils exhibit a streamlined chordwise profile resembling fixed NACA-series airfoils, the present study models them as a rigid NACA0012 section, whose geometry is shown in Figure 1. The chord length c is the primary control parameter, and its specific range is given in Section 2.2. Based on prior research, the optimal pumping efficiency occurs when the pitching axis is located at 0.2c [27]; therefore, the pivot position in this work is set to L = 0.2 c .
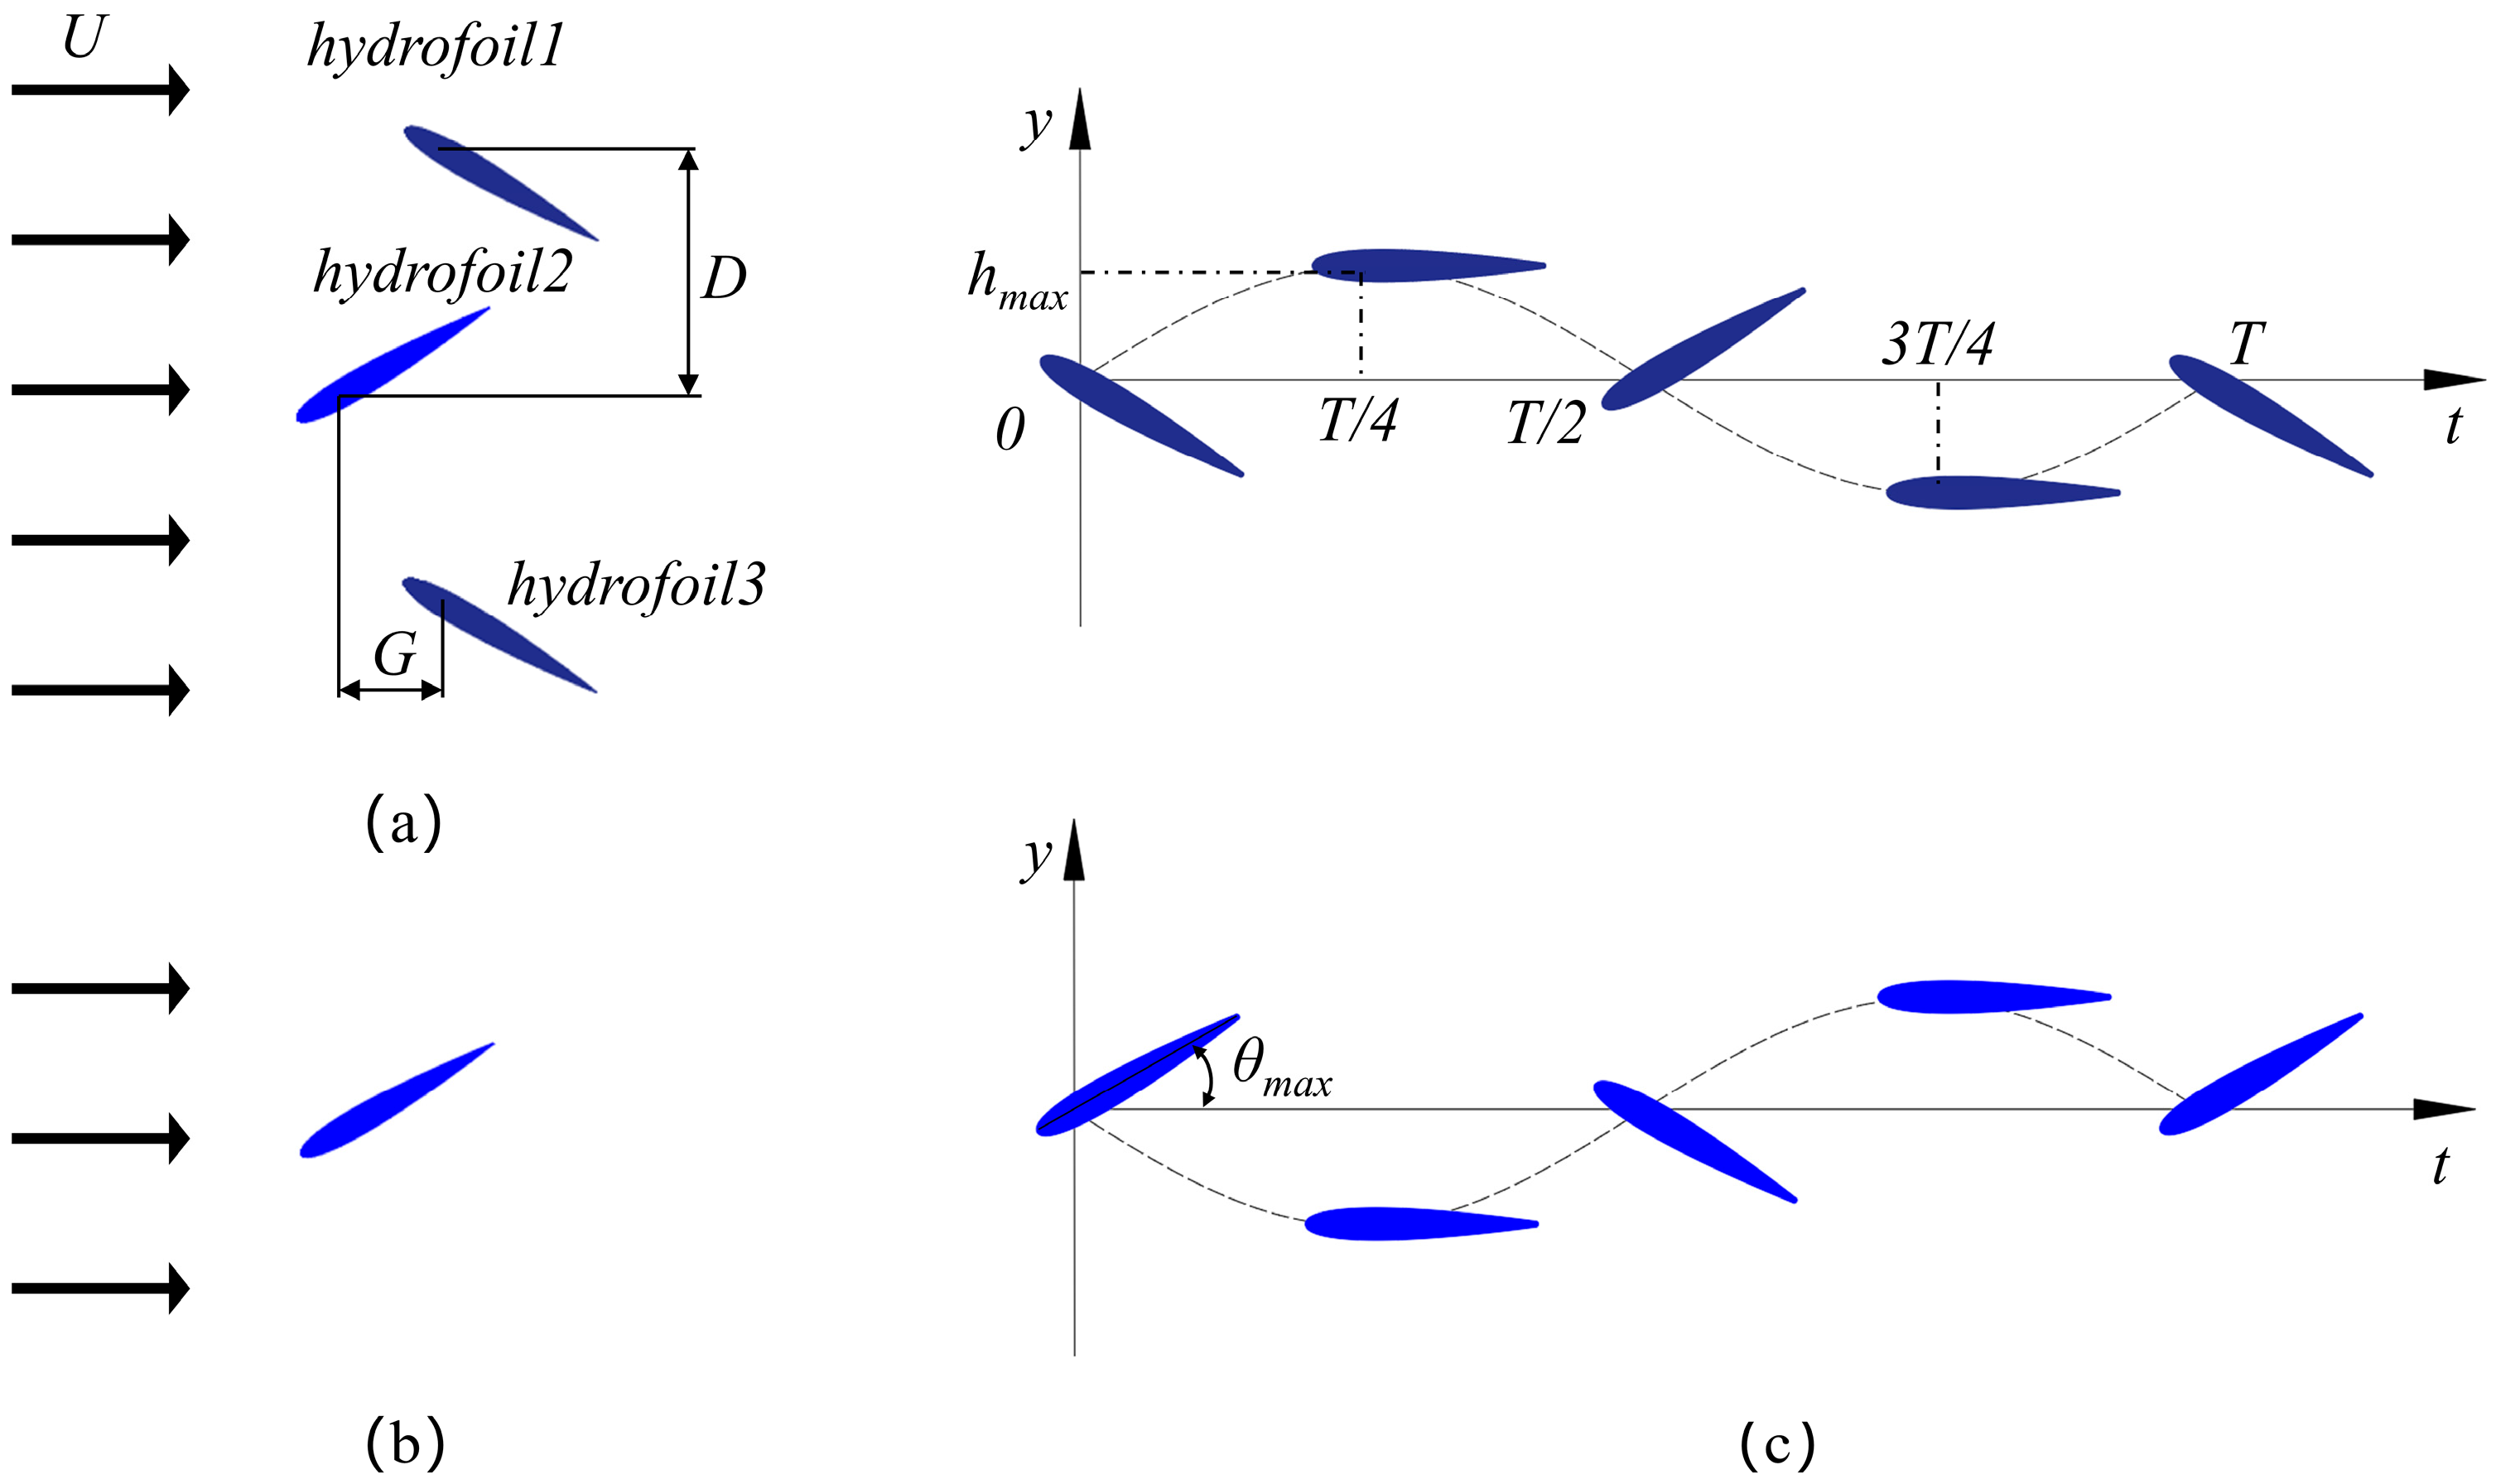
Figure 2 shows the structure and schematics of the multi-hydrofoil and single-hydrofoil systems used in this study. Figure 2a shows the multi-hydrofoil formation. U denotes the flow velocity at the inlet of the flow field. Building on previous work, the positive-triangle formation exhibits superior hydrodynamic performance at low frequencies [6]; therefore, the present study employs a positive-triangle layout with a ratio of G / D = 2 : 9 , where G denotes the longitudinal spacing and D denotes the lateral spacing, and adjacent foils oscillate 180° out of phase [28], and the two phase states are distinguished by different colors in the figure. Figure 2b shows the single-hydrofoil system. Figure 2c shows instantaneous foil positions at different phases, with h m a x representing the heave amplitude and θ m a x the pitch amplitude.
The motion of the rigid hydrofoil can be decomposed into a simple harmonic heave oscillation along the y-axis and a pitch rotation about the pivot. The governing equations are as follows [6]:
h i ( t ) = h max sin ( 2 π f t + φ i ) θ i ( t ) = θ max sin ( 2 π f t + ϕ + φ i )
In the equations, h i ( t ) and θ i ( t ) denote the heave displacement and pitch displacement of the ith hydrofoil, respectively; ϕ is the phase difference between heave and pitch; φ i is the motion phase difference between the ith hydrofoil and hydrofoil 1.
To comprehensively evaluate the pumping performance of the bionic system, this study examines the thrust coefficient, lift coefficient, input power and pumping efficiency as key parameters.
  • Single-hydrofoil system dynamic coefficients
For the ith hydrofoil, the instantaneous thrust coefficient C T , i , lift coefficient C L , i , and moment coefficient C M , i are calculated as follows [6]:
C T , i ( t ) = 2 F T , i ( t ) ρ U ¯ 2 s c C L , i ( t ) = 2 F L , i ( t ) ρ U ¯ 2 s c C M , i ( t ) = 2 M i ( t ) ρ U ¯ 2 s c 2
In the equations, F T , i and F L , i denote the instantaneous thrust and lift of the ith hydrofoil, respectively; M i is the instantaneous pitching moment of the ith hydrofoil; ρ is the fluid density; and U ¯ is the time-averaged outlet velocity after the flow field stabilizes.
2.
Multi-hydrofoil system dynamic coefficients
For a system consisting of N hydrofoils, after k complete motion cycles, the cycle-averaged dynamic coefficients of all foils are combined to yield the overall thrust coefficient C T ¯ , lift coefficient C L ¯ , and moment coefficient C M ¯ of the system [6]:
C T ¯ = 1 k N T ( n k ) T n T i = 1 N C T , i ( t ) dt C L ¯ = 1 k N T ( n k ) T n T i = 1 N C L , i ( t ) dt C M ¯ = 1 k N T ( n k ) T n T i = 1 N C M , i ( t ) dt
3.
Input power calculation
After determining the above dynamic coefficients, the average input power during one motion cycle for a single hydrofoil is calculated to characterize the energy input during operation. The formula is as follows [6]:
p i ¯ = 1 T ( 0 T F L , i ( t ) h ( t ) d t + 0 T M i ( t ) θ ( t ) d t )
4.
Pumping performance metrics
To quantify the pumping capability of the bionic pump, this study employs flow rate, head rise, and pumping efficiency as metrics for evaluating the hydrodynamic performance of the system.
The mean flow rate Q ¯ is determined from the cross-sectional area of the channel and the mean flow velocity. The formula is as follows [5]:
Q ¯ = U ¯ b s
In the formula, b is the channel width, s is the span.
The average head rise H ¯ is defined by the pressure difference Δ P ¯ between the inlet and outlet of the computational domain. The formula is as follows [5]:
H ¯ = Δ P ¯ ρ g
The pumping efficiency η w is a key indicator of the bionic pump system’s performance. The formula is as follows [5]:
η w = Δ P ¯ Q ¯ i = 1 N p i ¯
p i denotes the input power of the ith hydrofoil.

2.2. Motion Parameter Settings

To ensure the bionic pumping system operates without interference, the minimum clearance between foils and between any foil and the channel wall must be at least 0.2c at all times. Under this constraint, different geometric dimensions and ranges of motion parameters are assigned to the multi-hydrofoil and single-hydrofoil systems as follows:
  • In the multi-hydrofoil system, to avoid inter-foil interference, relatively small ranges of chord length and heave amplitude are adopted. The chord length c is set to 0.18W, 0.16W, 0.14W, and 0.12W (where W is the channel width), while the heave amplitude h m a x is set to 0.4c, 0.5c, 0.6c, and 0.7c;
  • In the single-hydrofoil system, because there is no inter-foil interference, the parameter ranges can be extended. The chord length c is set to 0.12W, 0.14W, 0.16W, 0.18W, 0.20W, and 0.25W, while the heave amplitude remains the same as in the multi-hydrofoil system.

2.3. Flow Velocity Requirements for Algal Bloom Control

To select the key control parameters of the bionic pumping system for algal bloom suppression, a reference velocity relevant to field-scale bloom control must be established first. Previous studies have demonstrated that flow velocity strongly influences algal growth: laboratory flume experiments [29,30,31] commonly report critical velocities of 0.3–0.5 m/s, whereas field enclosure experiments [22,24,25] consistently yield lower critical values, typically ranging from 0.01 to 0.15 m/s. Considering that laboratory conditions cannot fully capture the complexity of natural water bodies, this study adopts velocity data from field enclosure experiments to improve the practical relevance of the evaluation. In addition, to account for the spatiotemporal variability of velocity thresholds, priority was given to experimental data from plain river network regions to ensure representativeness of the study context. Zhang et al. [25] conducted enclosure experiments in an artificial lake on Chongming Island, a typical plain river network area, and found that the algal inhibition rate reached 54% at 0.15 m/s. Because of the strong similarity between these field conditions and the application scenarios considered in this paper, using 0.15 m/s as the reference threshold velocity is both representative and feasible. Therefore, 0.15 m/s is adopted as the threshold velocity for algal bloom suppression. The operating frequencies required for the multi-hydrofoil and single-hydrofoil systems to achieve this velocity under different parameter configurations are analyzed accordingly.

3. Numerical Methods

3.1. Governing Equations and Turbulence Model

This study employs ANSYS Fluent 2024R1 to simulate hydrofoil oscillation in water, which is characterized by viscous incompressible flow. The governing equations are formulated based on the Reynolds-averaged Navier–Stokes (RANS) model [32]:
1.
Continuity equation
u i x i = 0
In the equation, u i denotes the velocity component of the fluid along the ith coordinate axis, and x i represents the coordinate in the ith direction.
2.
Momentum equation
u i t + u j u i x j = 1 ρ p x i + x j μ u i x j + u j x i u i u j + f i
In the equation, ρ denotes the density of water; t denotes time; P denotes pressure; μ denotes the kinematic viscosity of the fluid; f i denotes the body force in the ith direction; and u i u j denotes the Reynolds stress term.
3.
Turbulence model
The realizable k–ε turbulence model improves upon the standard k–ε formulation by reformulating the dissipation-rate (ε) equation and incorporating rotational and curvature corrections into the eddy-viscosity formulation, thereby improving predictive accuracy for rotating homogeneous shear flows, free shear flows such as jets and mixing layers, and flows characterized by strongly curved streamlines. During the unsteady oscillation of a hydrofoil, vortices are periodically generated and shed from its leading and trailing edges, resulting in a complex flow field characterized by rotation and separation. The realizable k–ε turbulence model is advantageous in resolving such transient flows involving vortex transport and separation [33], making it particularly suitable for the flow features considered in this study. Accordingly, the realizable k–ε model is employed to solve the Reynolds-averaged Navier–Stokes equations. The specific equations are as follows:
Turbulent kinetic energy (k) equation [34]:
ρ k t + x j ρ u j k x j μ + μ t σ k k x j = τ t i j S i j ρ ε + ϕ k
Dissipation rate (ε) transport equation [34]:
ρ ε t + x j ρ u j ε μ + μ t σ ε ε x j = c ε 1 ε k τ t i j S i j c ε 2 f 2 ρ ε 2 k + ϕ ε
In the equation, the terms on the right-hand side are the production, dissipation, and wall terms, respectively. The constants are defined as c ε 1 = 1.45 , c ε 2 = 1.92 , σ k = 1.0 , σ ε = 1.3 , and μ t = ρ c μ k 2 / ε .

3.2. Mesh Generation and Computational Setup

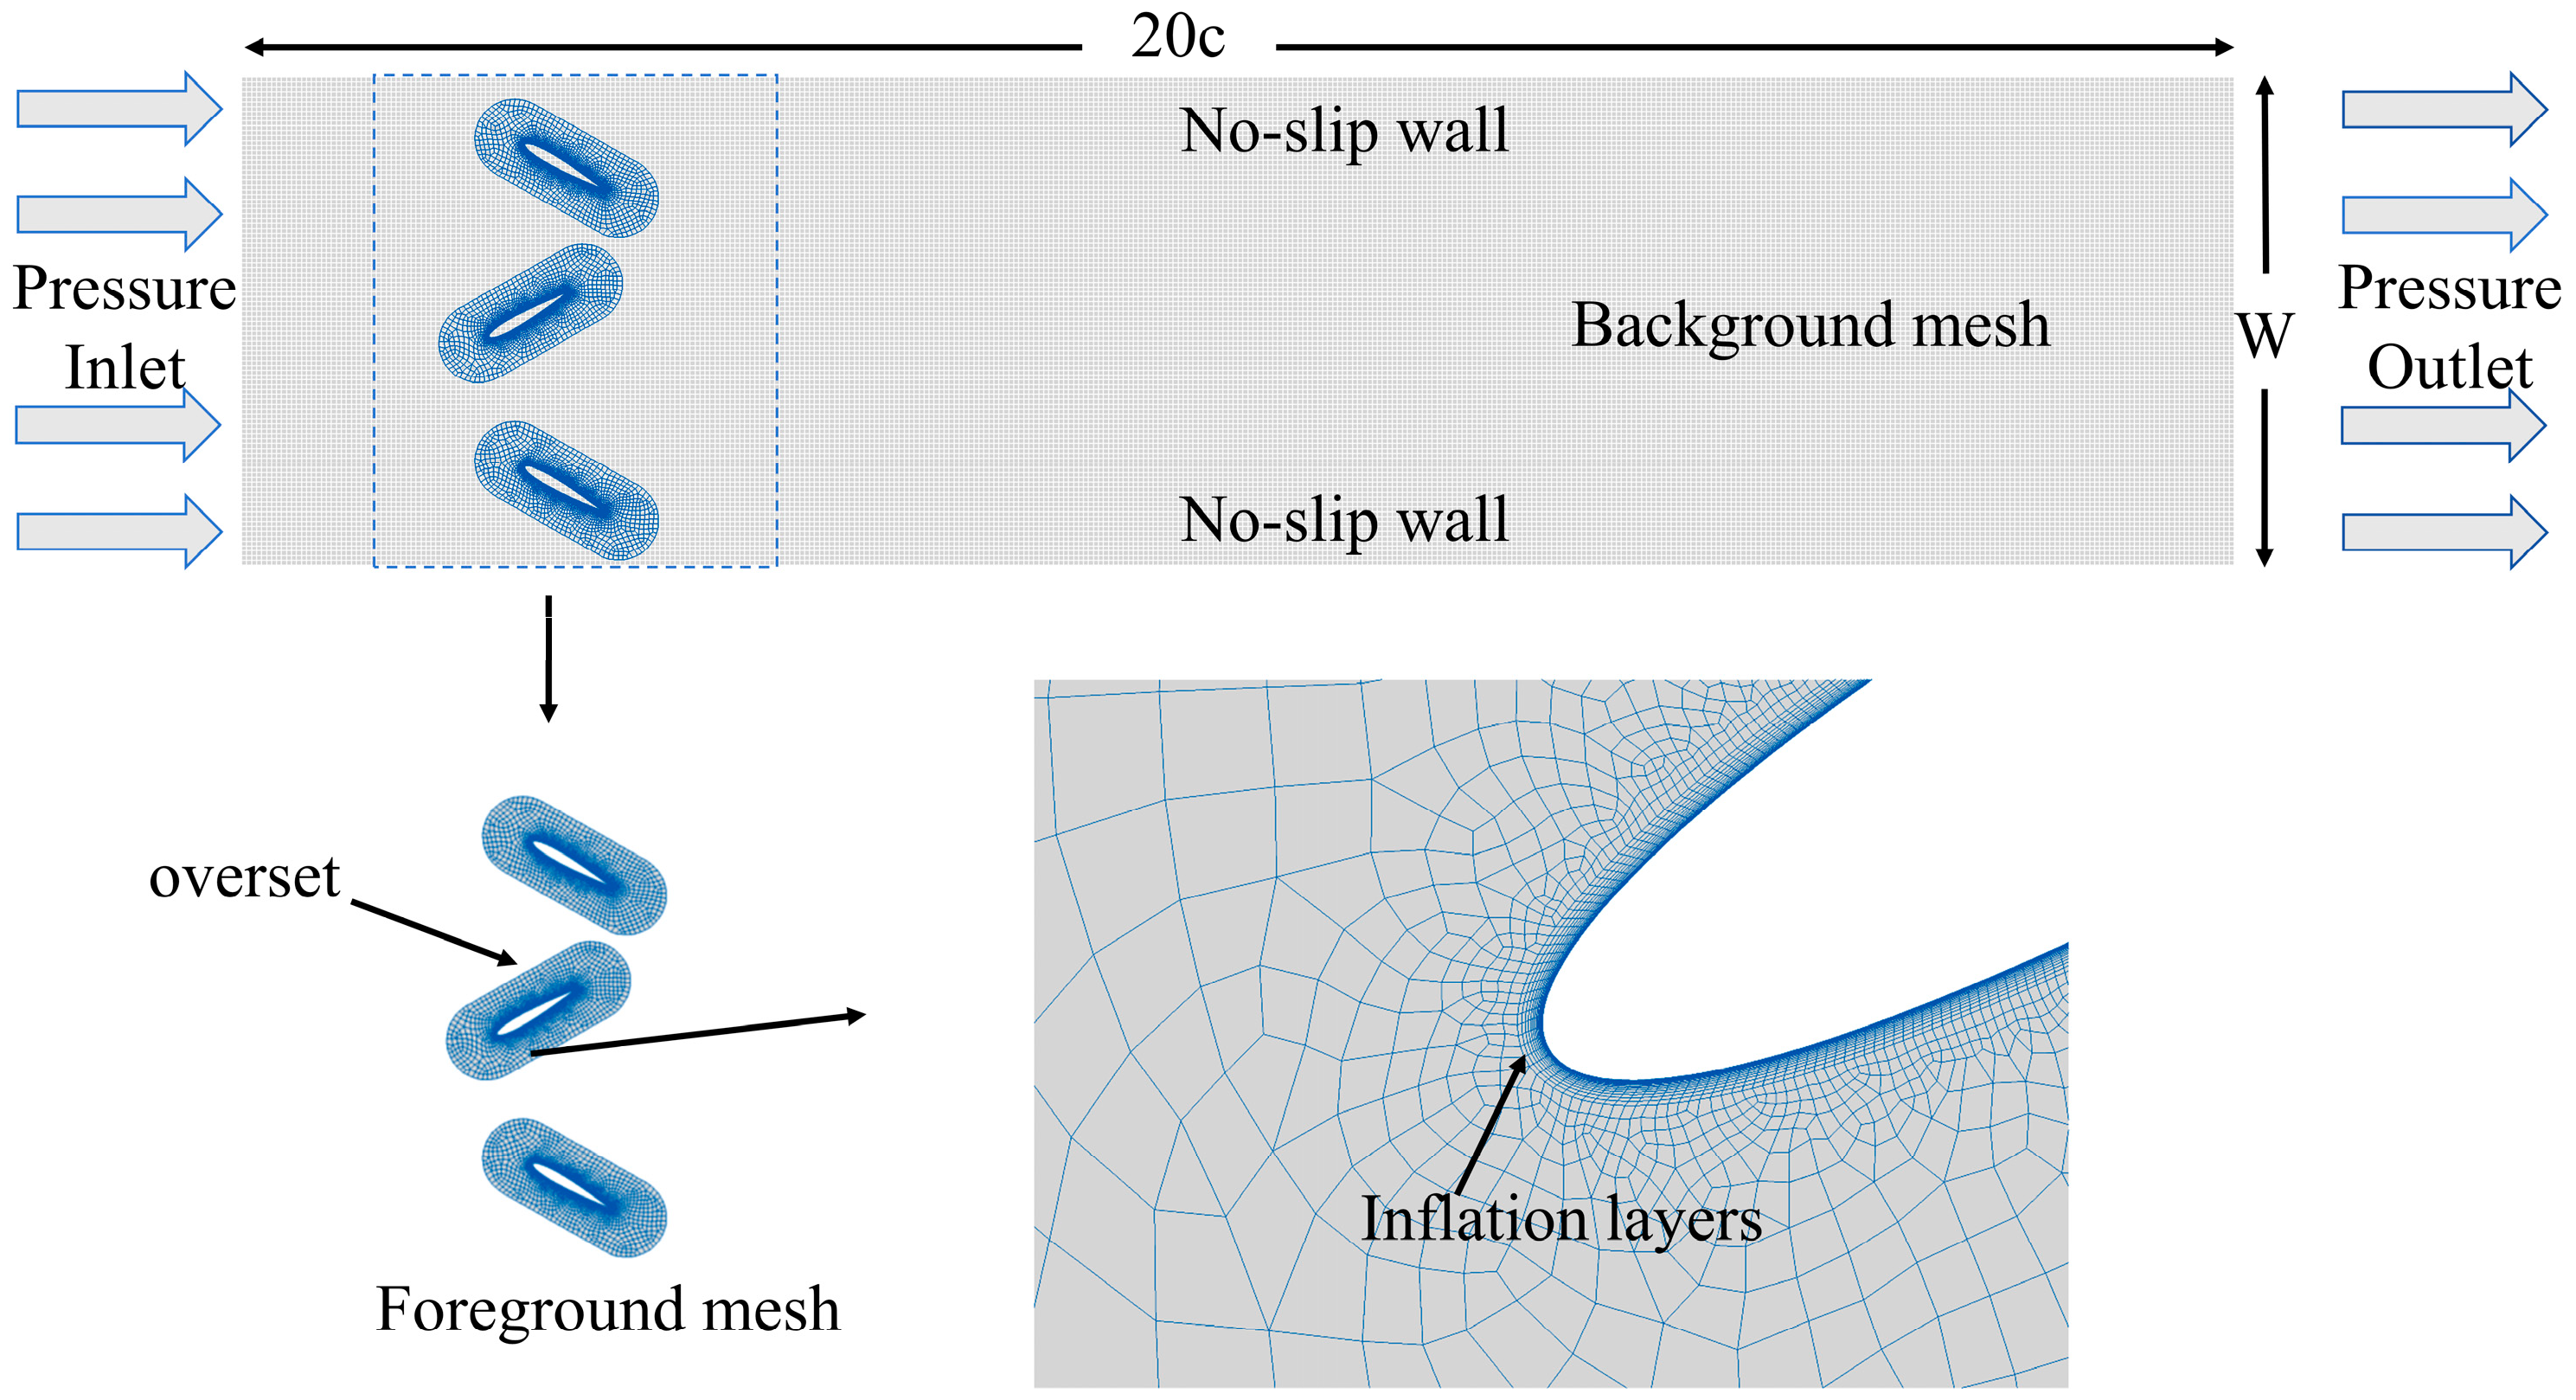
To simulate the reciprocating motion of hydrofoils in still water within the bionic pumping system, an overset mesh technique is employed to capture the relative motion between the flow field and the foils. As shown in Figure 3, the computational domain is a rectangular region measuring 5c × 20c, with the channel width W equal to 5c. Structured meshes are used throughout the domain, with a global cell size of 0.005 m. An elliptical structured foreground mesh is embedded within the background mesh and oscillates harmonically with the hydrofoil. Local refinement is applied to the foreground mesh near the foil to capture the boundary-layer characteristics and wake flow. The cell size of the outer boundary layer matches that of the background mesh, ensuring interpolation accuracy in the overlapping region and overall computational stability.
The boundary conditions are specified as follows. The left boundary of the domain is set as a pressure inlet and the right boundary as a pressure outlet. The top, bottom, and hydrofoil surfaces are treated as no-slip walls, while the outer boundary of the foreground mesh is defined as the overset region. The prescribed foil motion is implemented using a User-Defined Function (UDF). To enhance near-wall resolution, boundary-layer meshes are generated on both the foil and channel walls, and the enhanced wall treatment is applied to ensure that the first mesh node lies within the viscous sublayer (y+ < 1). The first-layer height is 0.0464 mm, and the mesh growth ratio is 1.2.

3.3. Numerical Model Validation

To ensure the accuracy and stability of the numerical results, the effects of mesh density and time-step size on the simulation must be examined so that parameter settings that satisfy the convergence requirements can be established. Using the multi-hydrofoil system operating at chord length c = 0.2W, heave amplitude h m a x = 0.5 c , pitch amplitude θ 0 = 30 ° , and frequency f = 1 Hz as a representative case, mesh- and time-step-independence studies are performed in this section.
For mesh convergence, Table 1 compares four mesh densities with cell counts of approximately 68,773, 79,012, 111,896, and 232,452, along with the corresponding mean thrust coefficients. The results show a pronounced change in the mean thrust coefficient when the cell count increases from 68,773 to 111,896, whereas the variation remains within about 1% between 111,896 and 232,452 cells. This indicates that the 111,896-cell mesh satisfies the accuracy requirement. To balance accuracy and computational efficiency, the 111,896-cell mesh is adopted for all subsequent simulations.
For the time-step independence verification, Table 2 presents a comparison of the mean thrust coefficient using four time-step sizes: T / 10 , T / 20 , T / 100 , and T / 1000 , with the 111,896-cell mesh employed for all cases. The results reveal noticeable differences in the mean thrust coefficient between T / 10 and T / 100 . When the time step is reduced to T / 1000 , the deviation from the T / 100 result is about 2%, indicating that Δ t = T / 100 satisfies the accuracy requirement. Therefore, all subsequent computations are performed with a time step of Δ t = T / 100 .

3.4. Validation of the Method

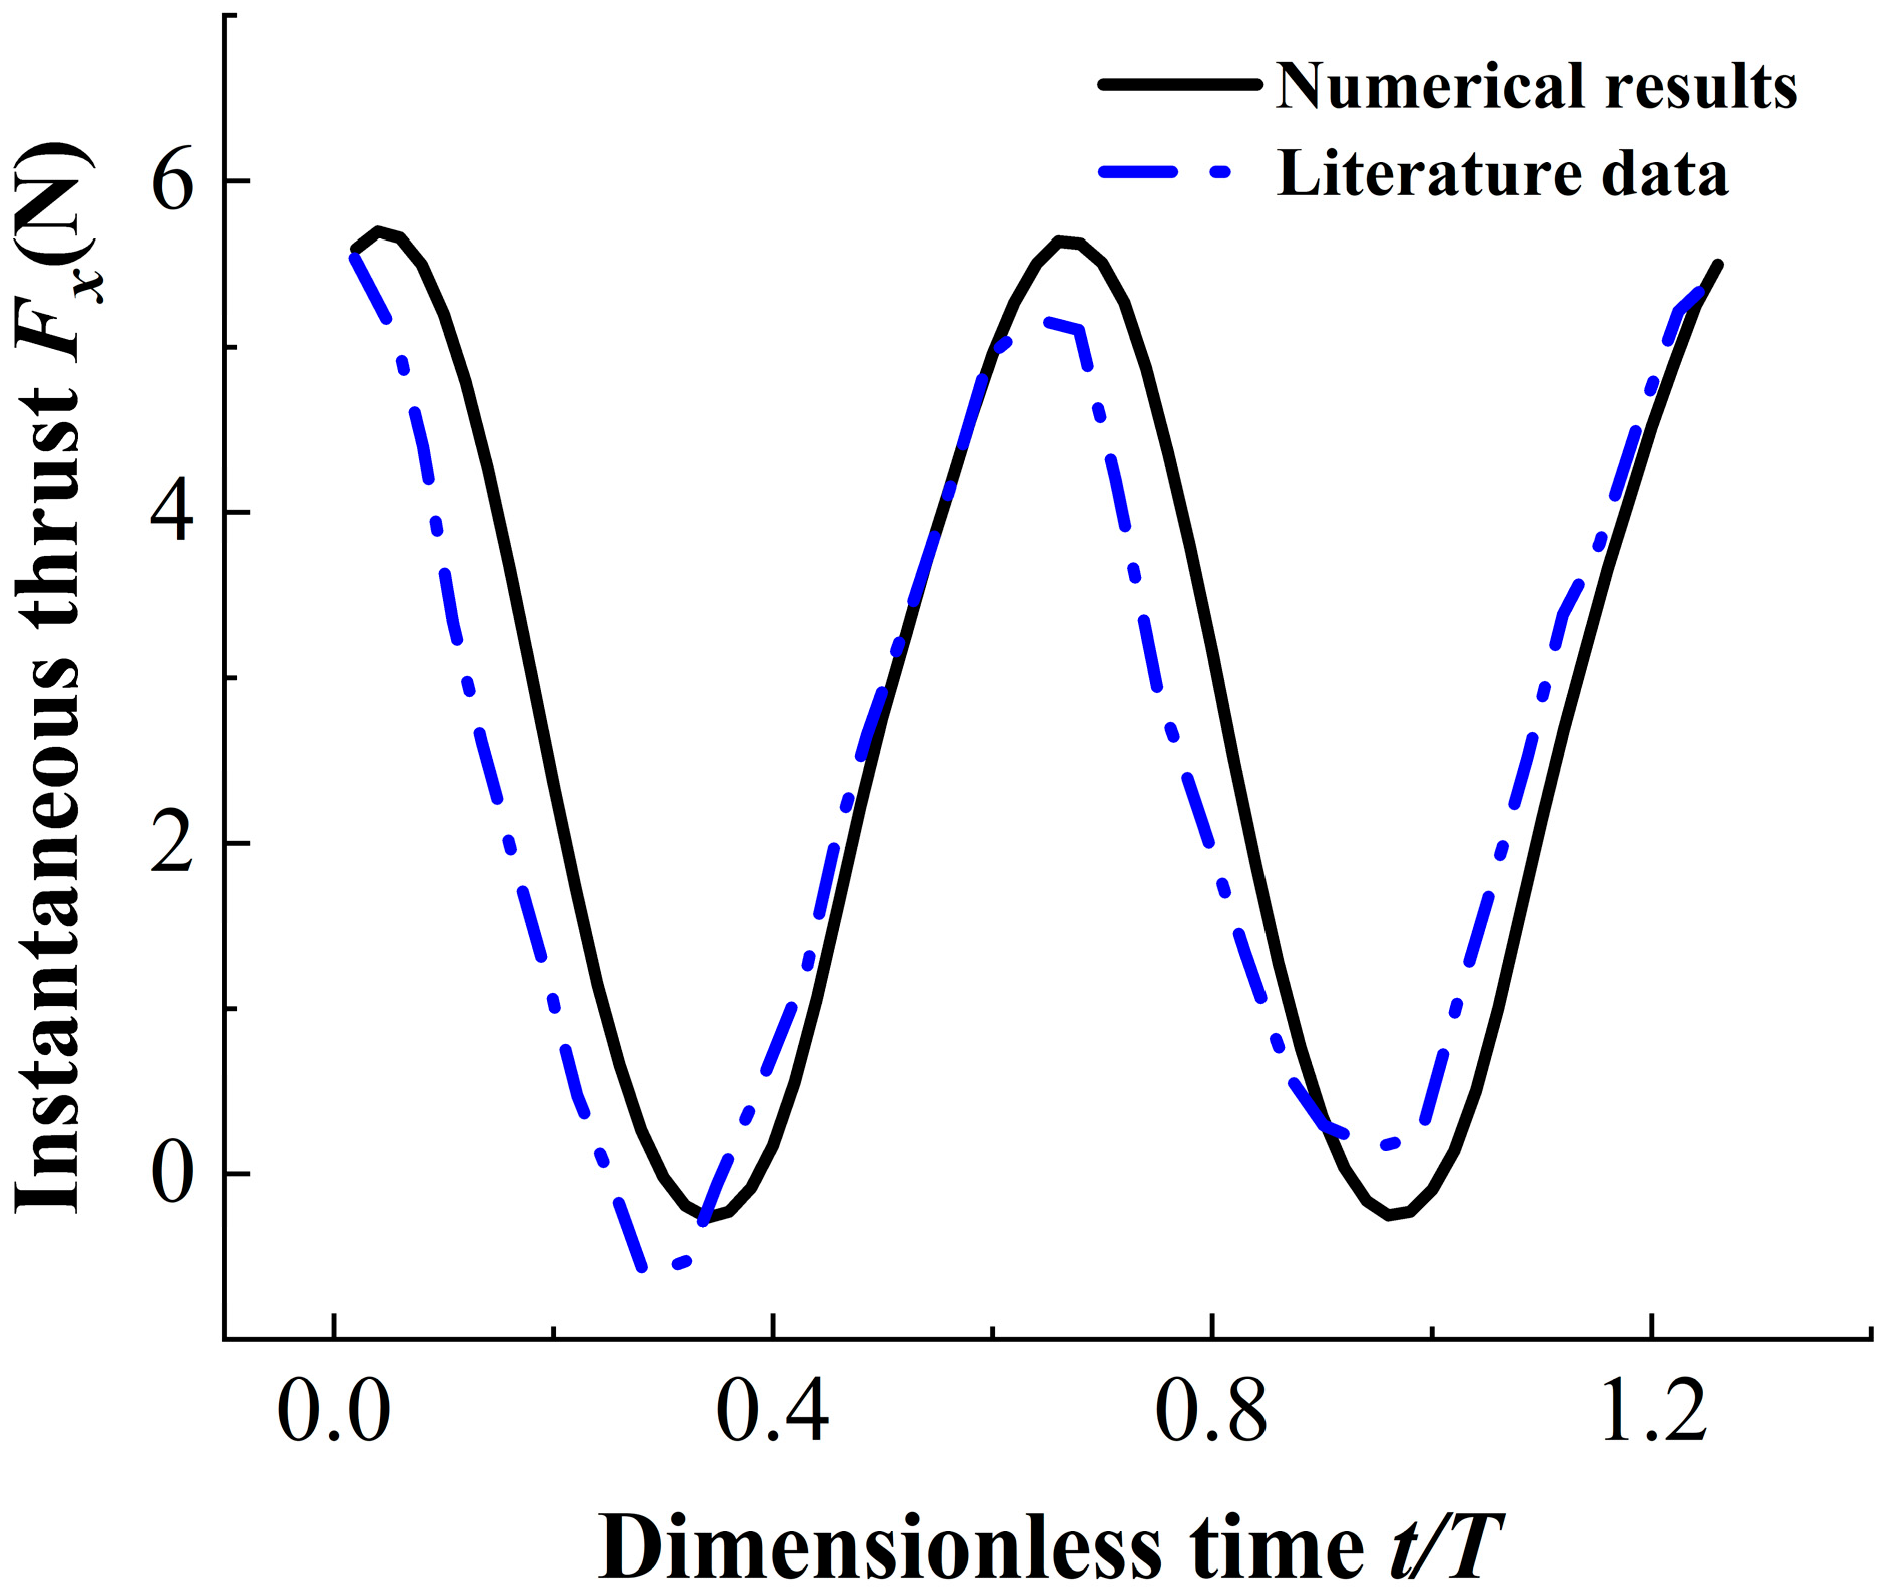
To validate the numerical approach, a simulation model was developed to reproduce the experimental conditions reported by Schouveiler et al. [35] in the MIT towing tank for a NACA0012 foil. The computational domain measures 12c laterally and 60c longitudinally, with an inlet velocity of 0.2 m/s. The foil has a chord length of 0.1 m, a span of 0.6 m, a pivot at 0.25c, a phase lag of 90° between heave and pitch, a pitch amplitude of 15°, a heave amplitude of 0.35c, and a motion frequency of 1 Hz. As shown in Figure 4, the maximum deviation between the present numerical results and the reference data is less than 5%, confirming the validity of the numerical method used in this study.
To further verify the applicability of the proposed numerical method to multi-hydrofoil configurations, a simulation model was developed under the same operating conditions as the outlet velocity measurements obtained from the multi-hydrofoil experimental platform constructed by Hua et al. In the experiment [28], a rigid NACA0012 hydrofoil was used, and the computational domain was set to 16c in the transverse direction and 5c in the streamwise direction. The phase lag between heave and pitch was 90°, the pitching amplitude was 30°, and the heaving amplitude was 0.5c, while the operating frequency f was sequentially set to 0.2 Hz, 0.4 Hz, 0.6 Hz, and 0.8 Hz. As shown in Table 3, the maximum deviation between the numerical and experimental results remained within 5%, further confirming the suitability of the proposed numerical method for multi-hydrofoil formations.

4. Results and Discussion

This section investigates the influence of chord length and heave amplitude on the hydrodynamic performance of both multi-hydrofoil and single-hydrofoil systems. By comparing the performance under different parameter combinations, the optimal configuration for each system is determined. Building on these findings, the operating frequencies required to achieve the target velocity for algal bloom suppression are evaluated. These results provide theoretical guidance for the design and operation of the pumping devices in field applications.

4.1. Influence of Heave Amplitude and Chord Length on the Multi-Hydrofoil System

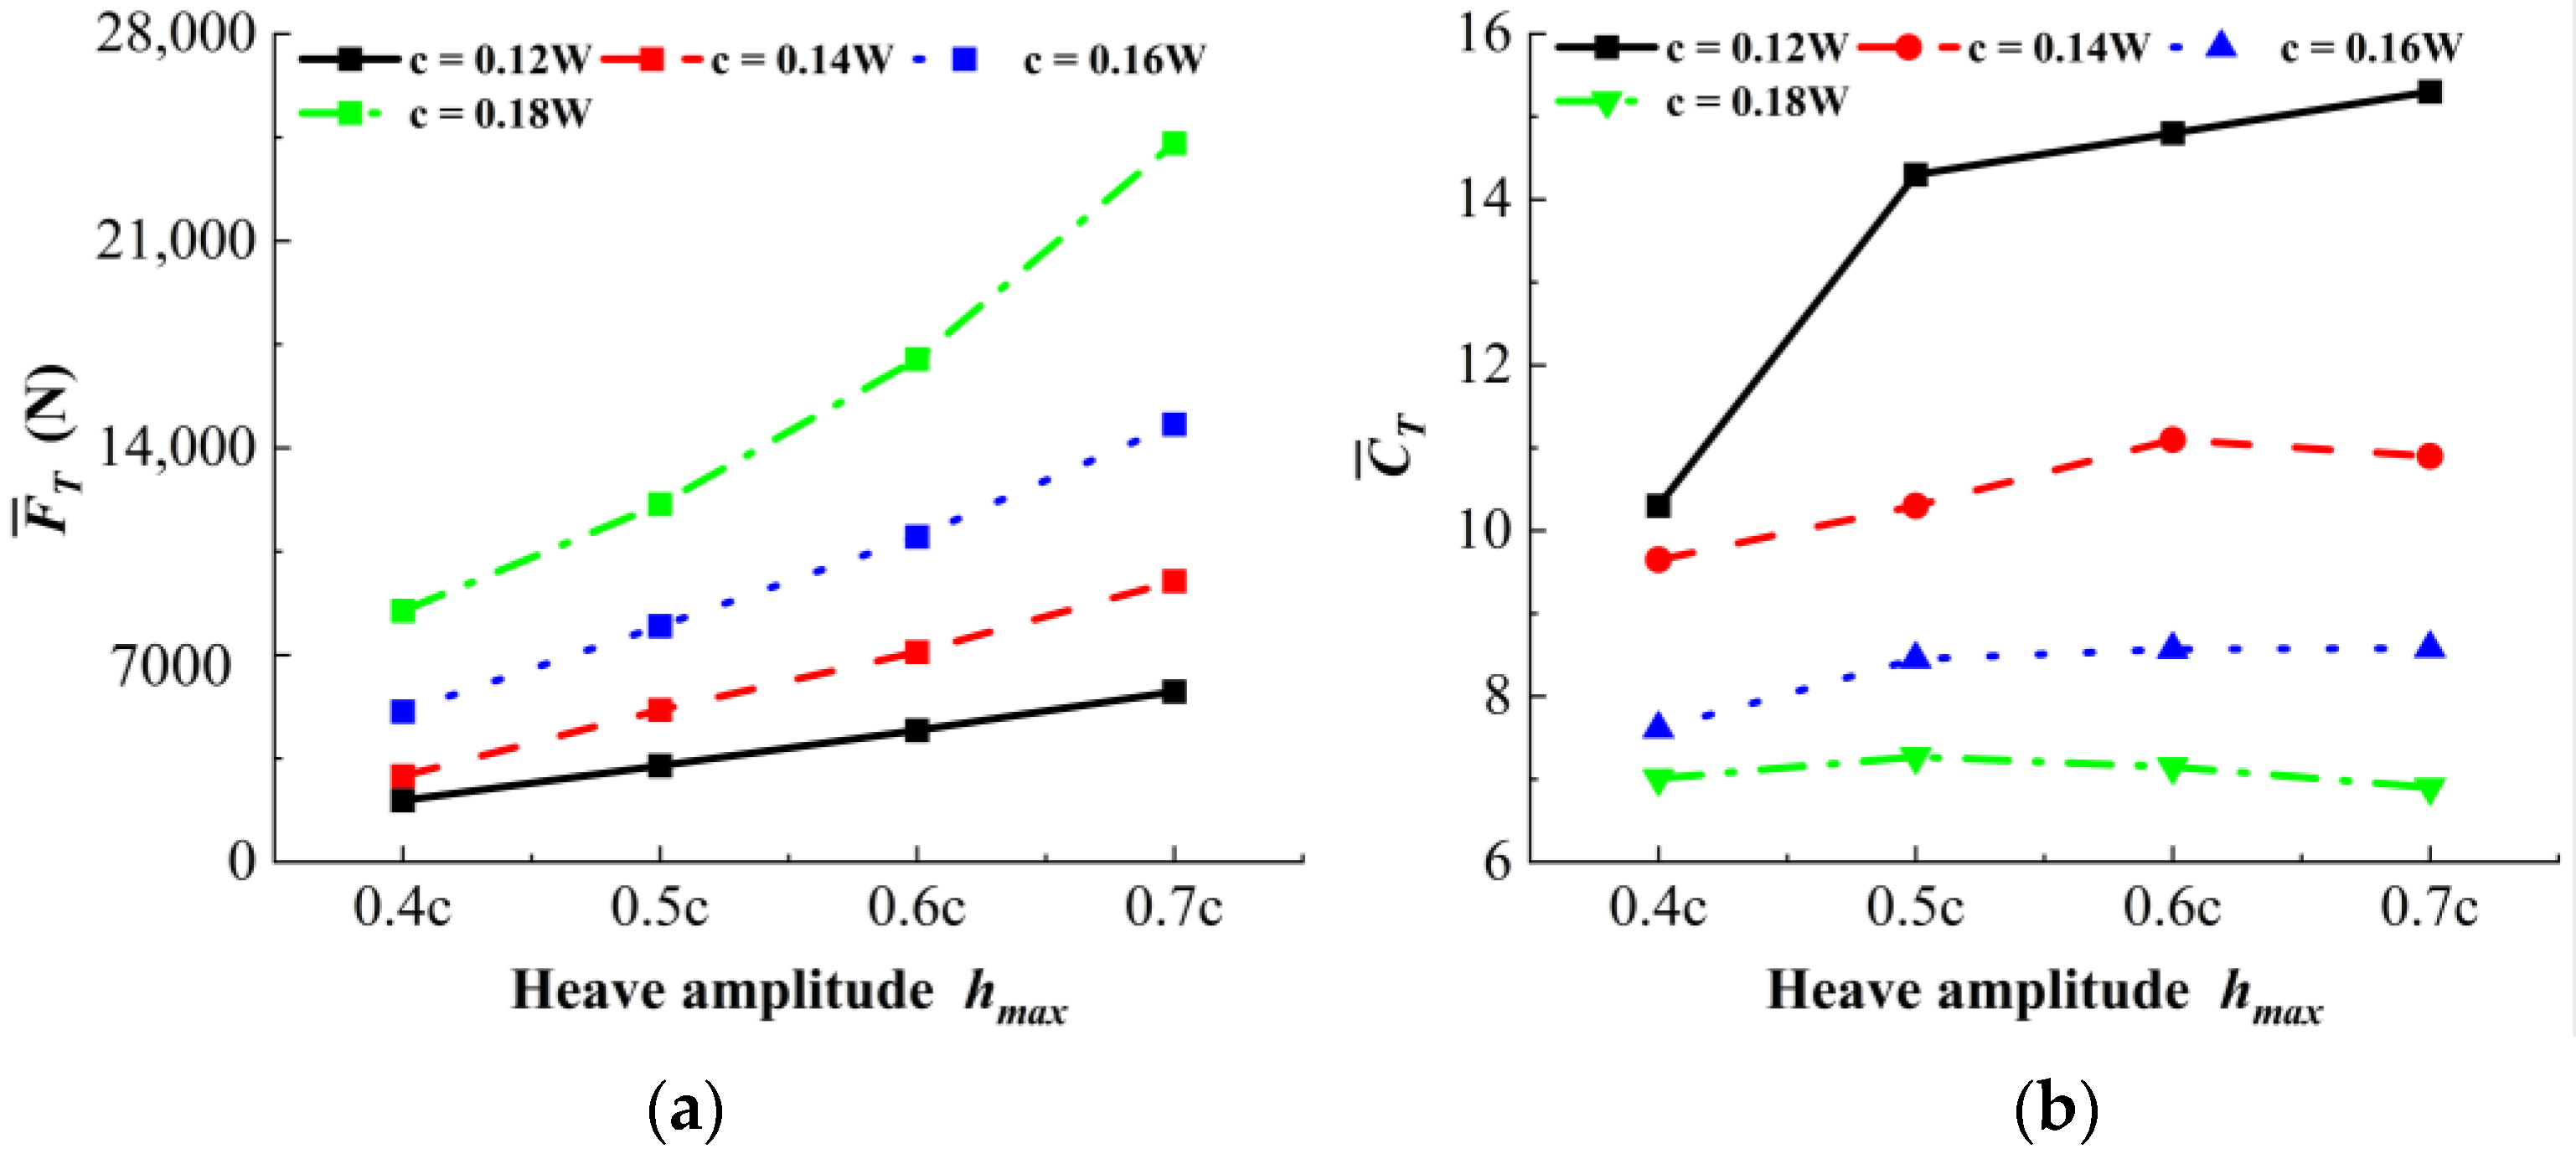
Figure 5 shows the variations in mean thrust and mean thrust coefficient of the multi-hydrofoil system under different heave amplitudes and chord lengths. Overall, the mean thrust increases with heave amplitude, and this trend becomes more pronounced at larger chord lengths. This indicates that larger chord lengths and heave amplitudes can effectively enhance the thrust of the system. However, the overall assessment must also account for the input power and the evolution of vortices in the wake. At large chord lengths and heave amplitudes, thrust increases but is accompanied by greater power demands. Moreover, if the wake vortices do not contribute effectively to propulsion, the thrust gain may not translate into improved system efficiency. Unlike mean thrust, the mean thrust coefficient shows little variation or even declines slightly in most cases, and this trend becomes more pronounced for larger chord lengths (e.g., 0.18W). The drop in thrust coefficient mainly results from the reference velocity U ¯ used in the calculation. For large chord lengths and heave amplitudes, the outlet velocity in the wake increases significantly, such that the growth of the normalized denominator U ¯ 2 exceeds that of the mean thrust (the numerator), leading to a lower thrust coefficient. This decline does not indicate reduced hydrodynamic performance; rather, it reflects the stronger pumping capability of the multi-hydrofoil system. In summary, simultaneous increases in heave amplitude and chord length enhance the hydrodynamic performance of the multi-hydrofoil system.
Pressure rise, flow rate, and input power are critical factors that affect pumping efficiency. To clarify why efficiency varies under different operating conditions, this study investigates how these parameters vary with chord length and heave amplitude.
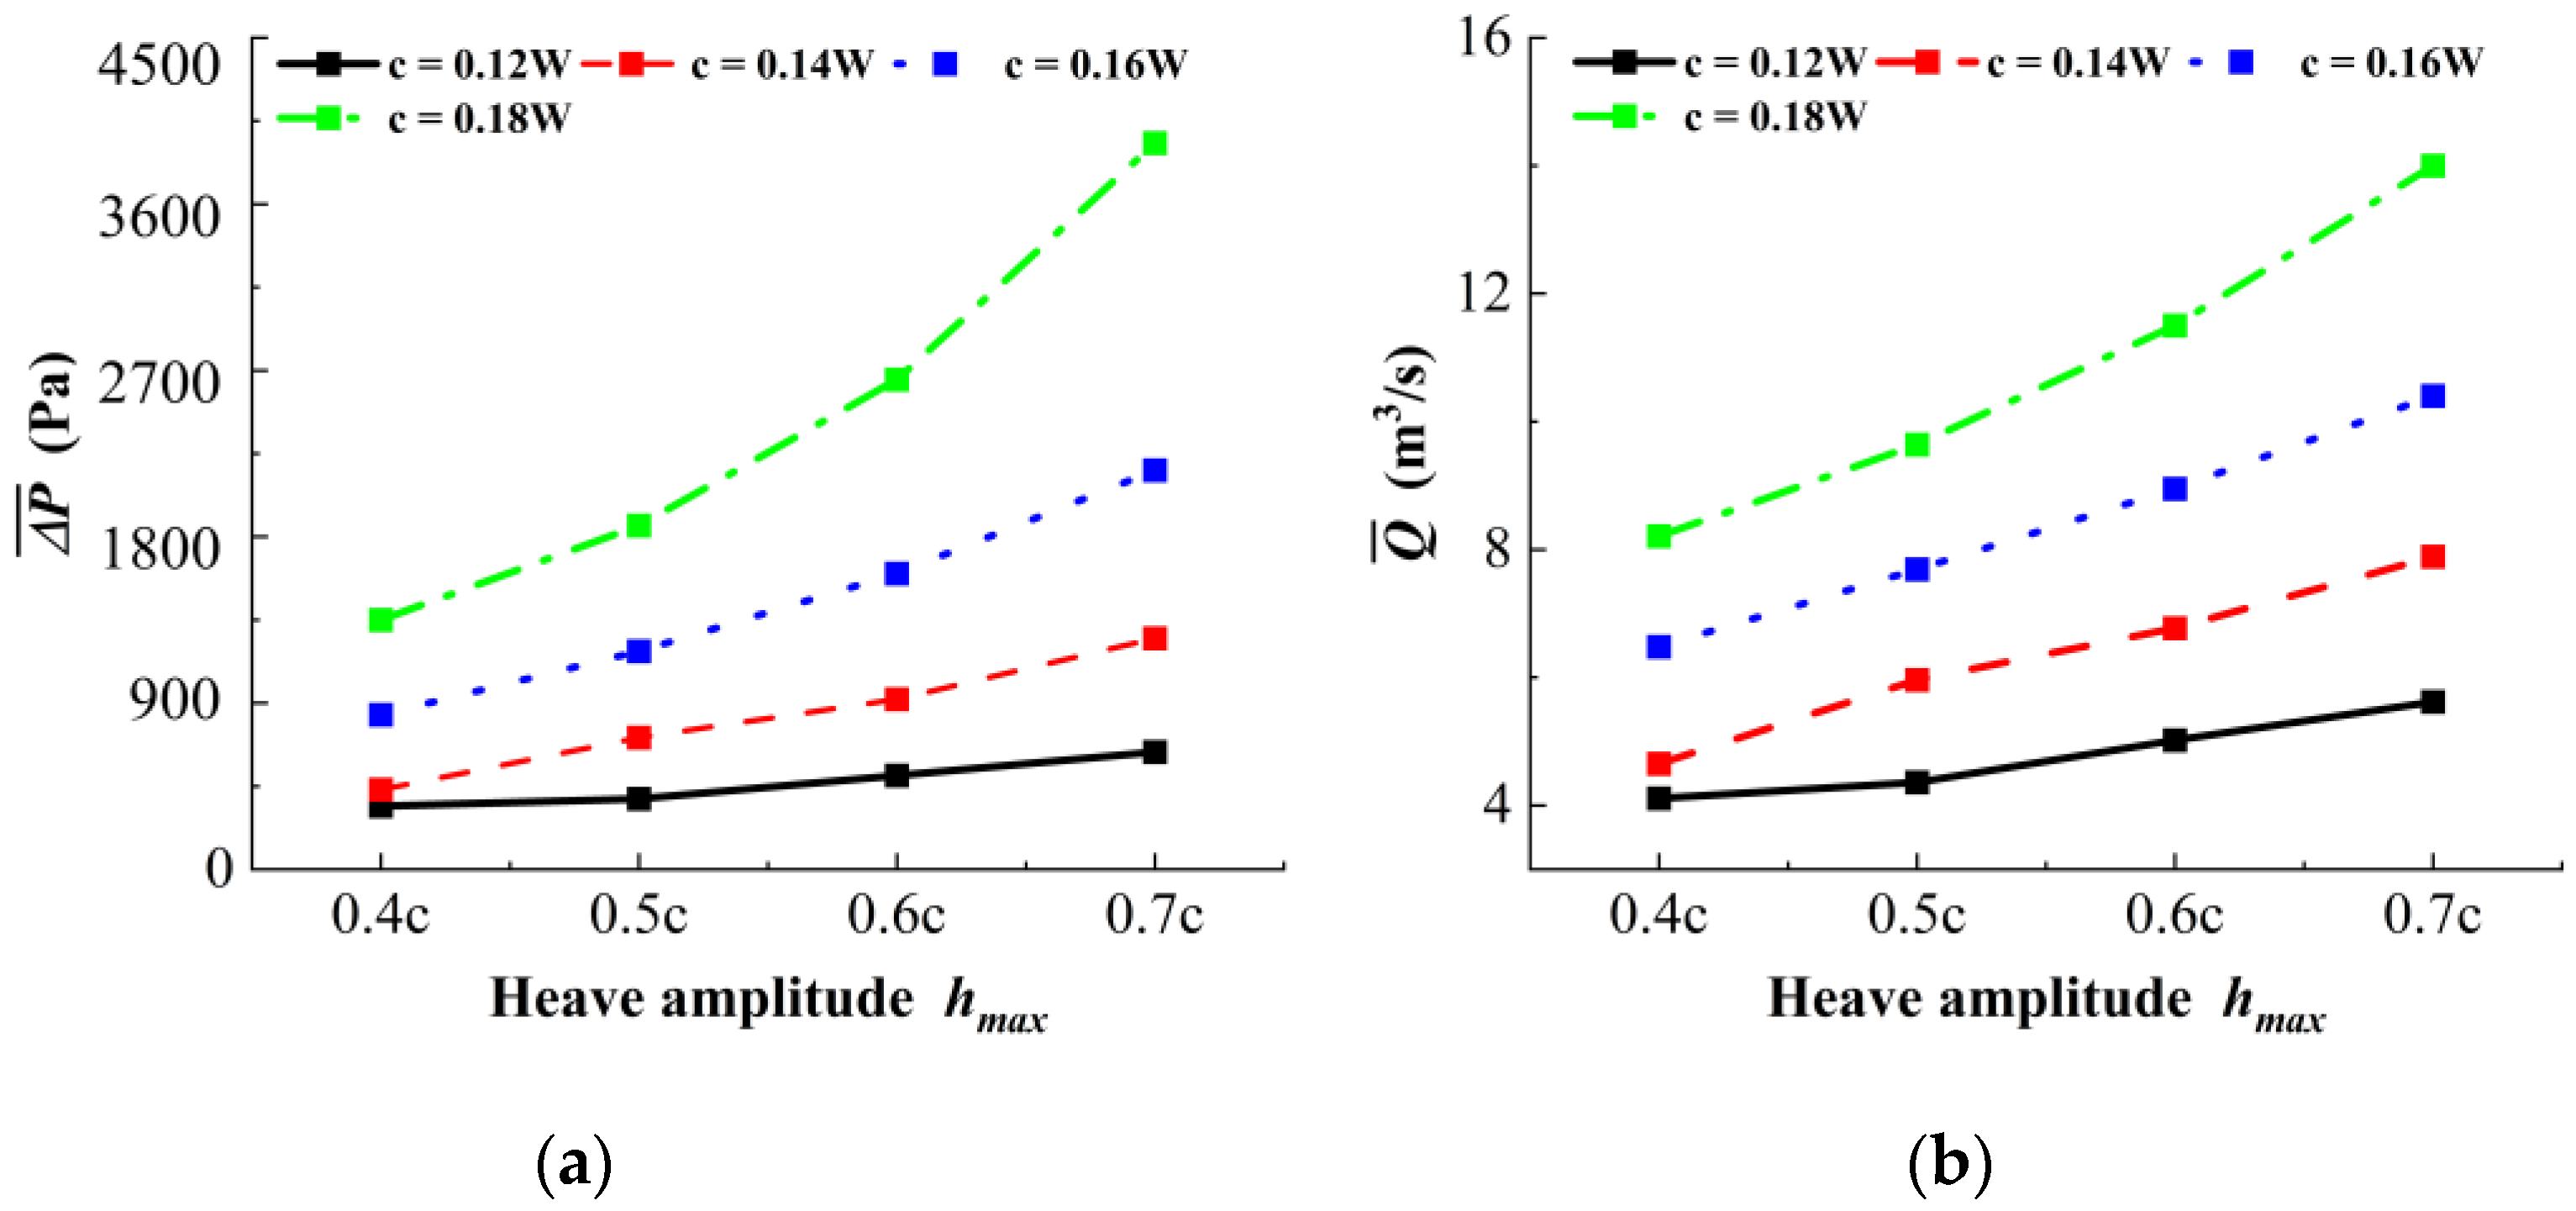
Figure 6 shows the variations in mean pressure rise and mean flow rate for the multi-hydrofoil system under different heave amplitudes and chord lengths. Both quantities exhibit similar trends, increasing with heave amplitude and rising more sharply at larger chord lengths. For example, when the chord length is 0.18W, increasing the heave amplitude from 0.4c to 0.7c raises the mean pressure rise by approximately 191% and the mean flow rate by about 71%. In contrast, when the chord length is 0.12W, the same increase in heave amplitude yields only an 85% rise in mean pressure rise and a 37% rise in mean flow rate. These results demonstrate that greater chord lengths and heave amplitudes establish a pronounced pressure gradient across the channel and drive a larger flow volume, thereby enhancing the hydrodynamic performance of the multi-hydrofoil system.
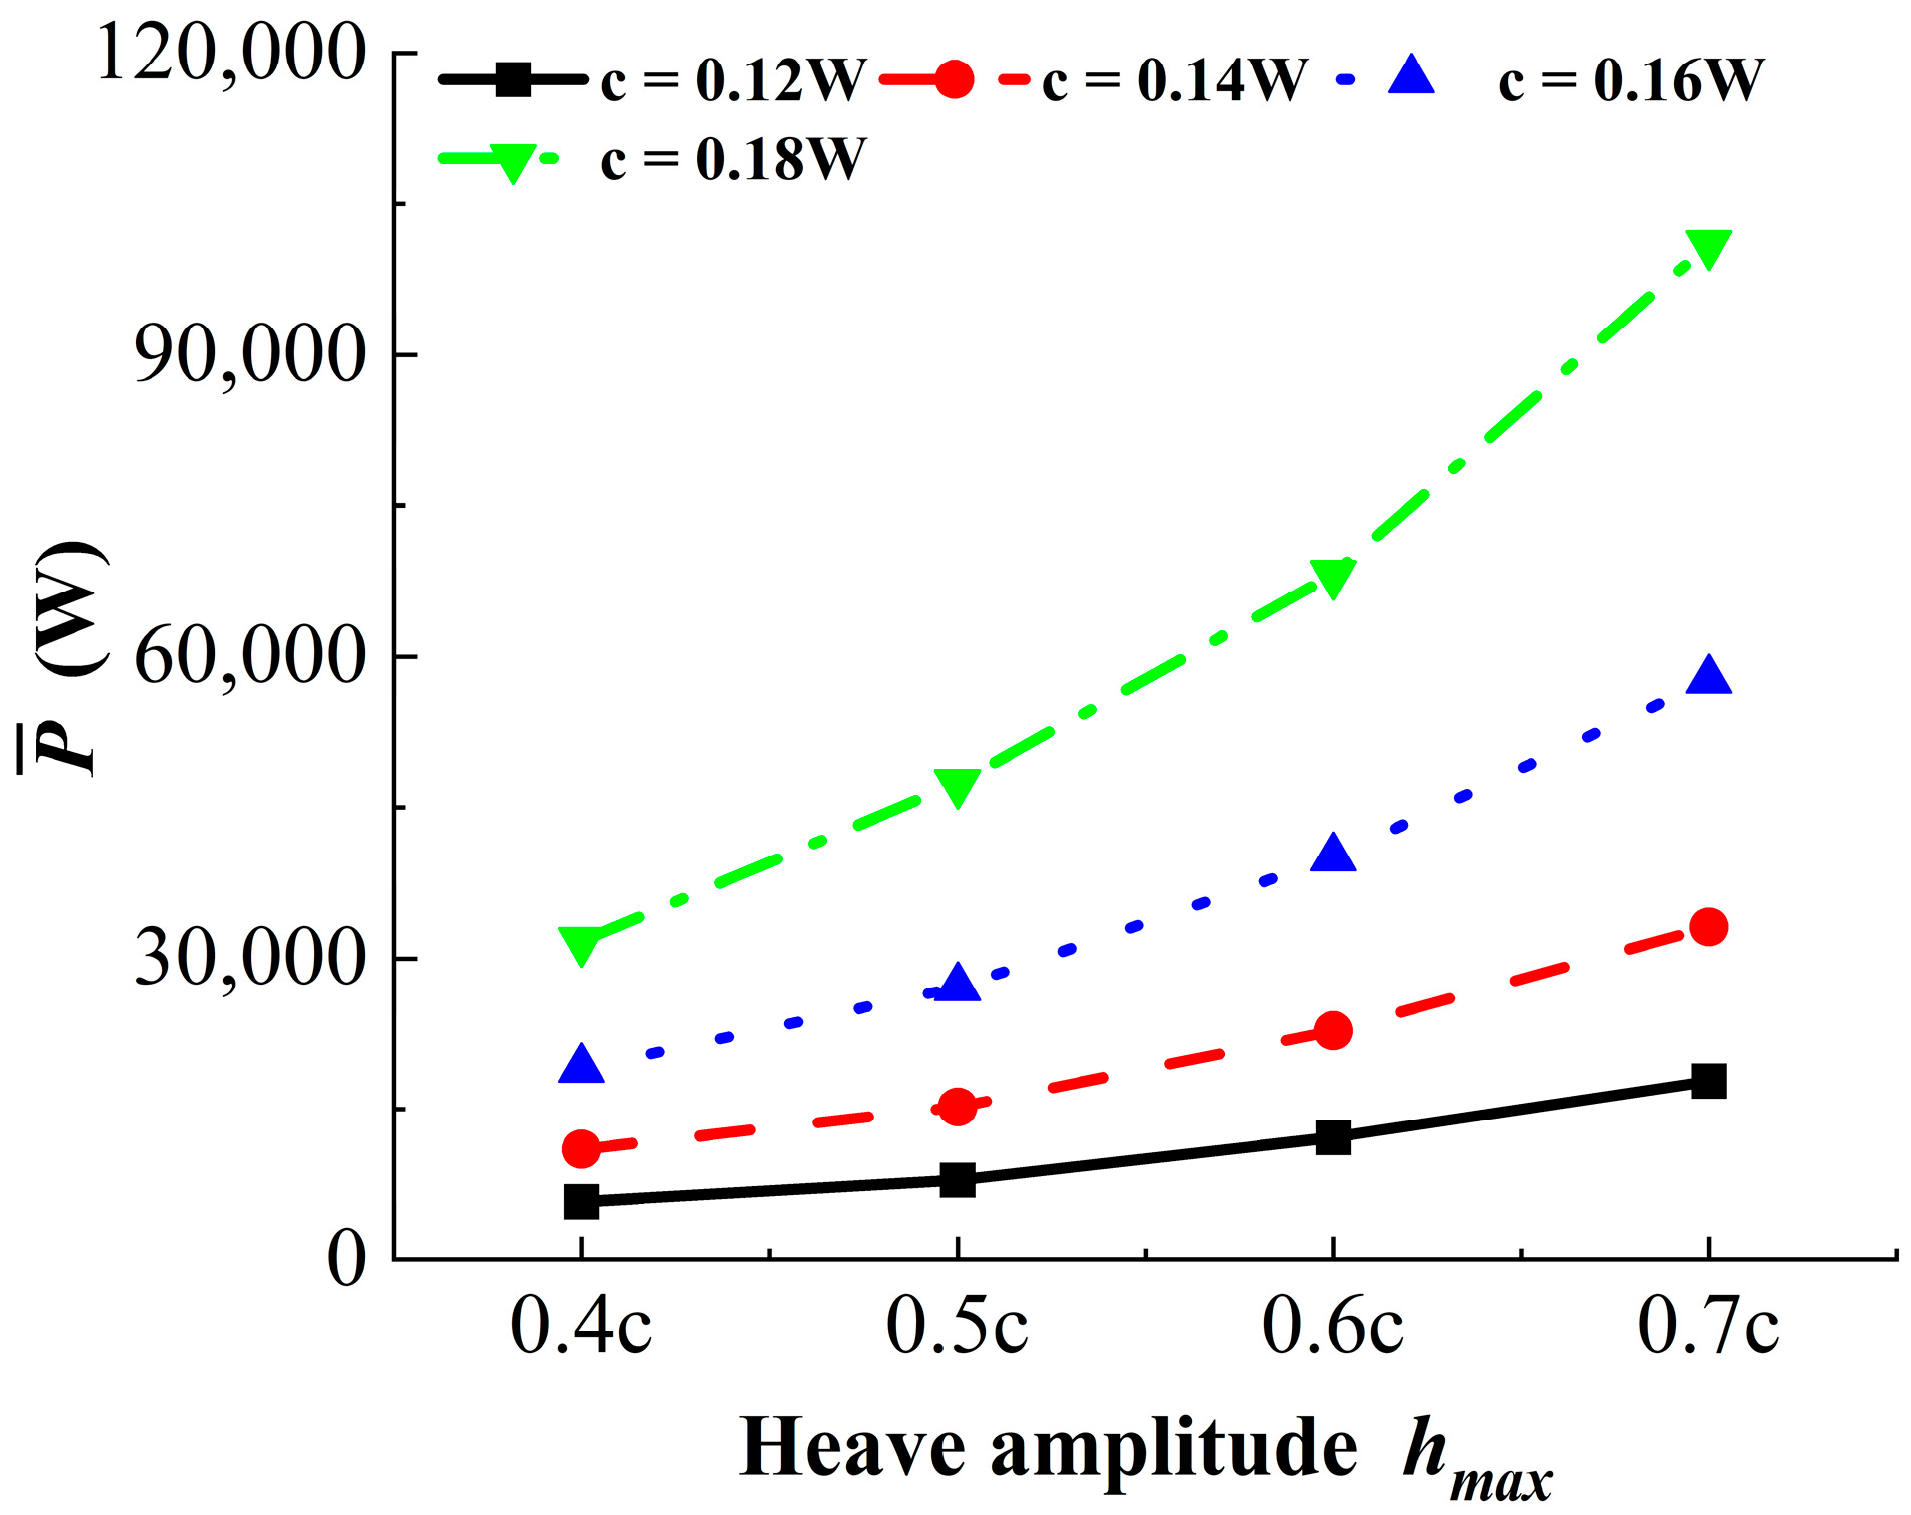
Figure 7 shows the average input power curves under different operating conditions. The input power increases with heave amplitude, indicating that larger heave excursions require greater energy and thus higher input power to sustain the motion. The rate of increase also varies significantly with chord length, demonstrating that longer chords require more input power to maintain higher thrust output. It should be noted, however, that although greater input power produces higher thrust, energy losses—such as vortex formation and turbulent dissipation in the wake—may prevent this additional power from being fully converted into effective propulsion.
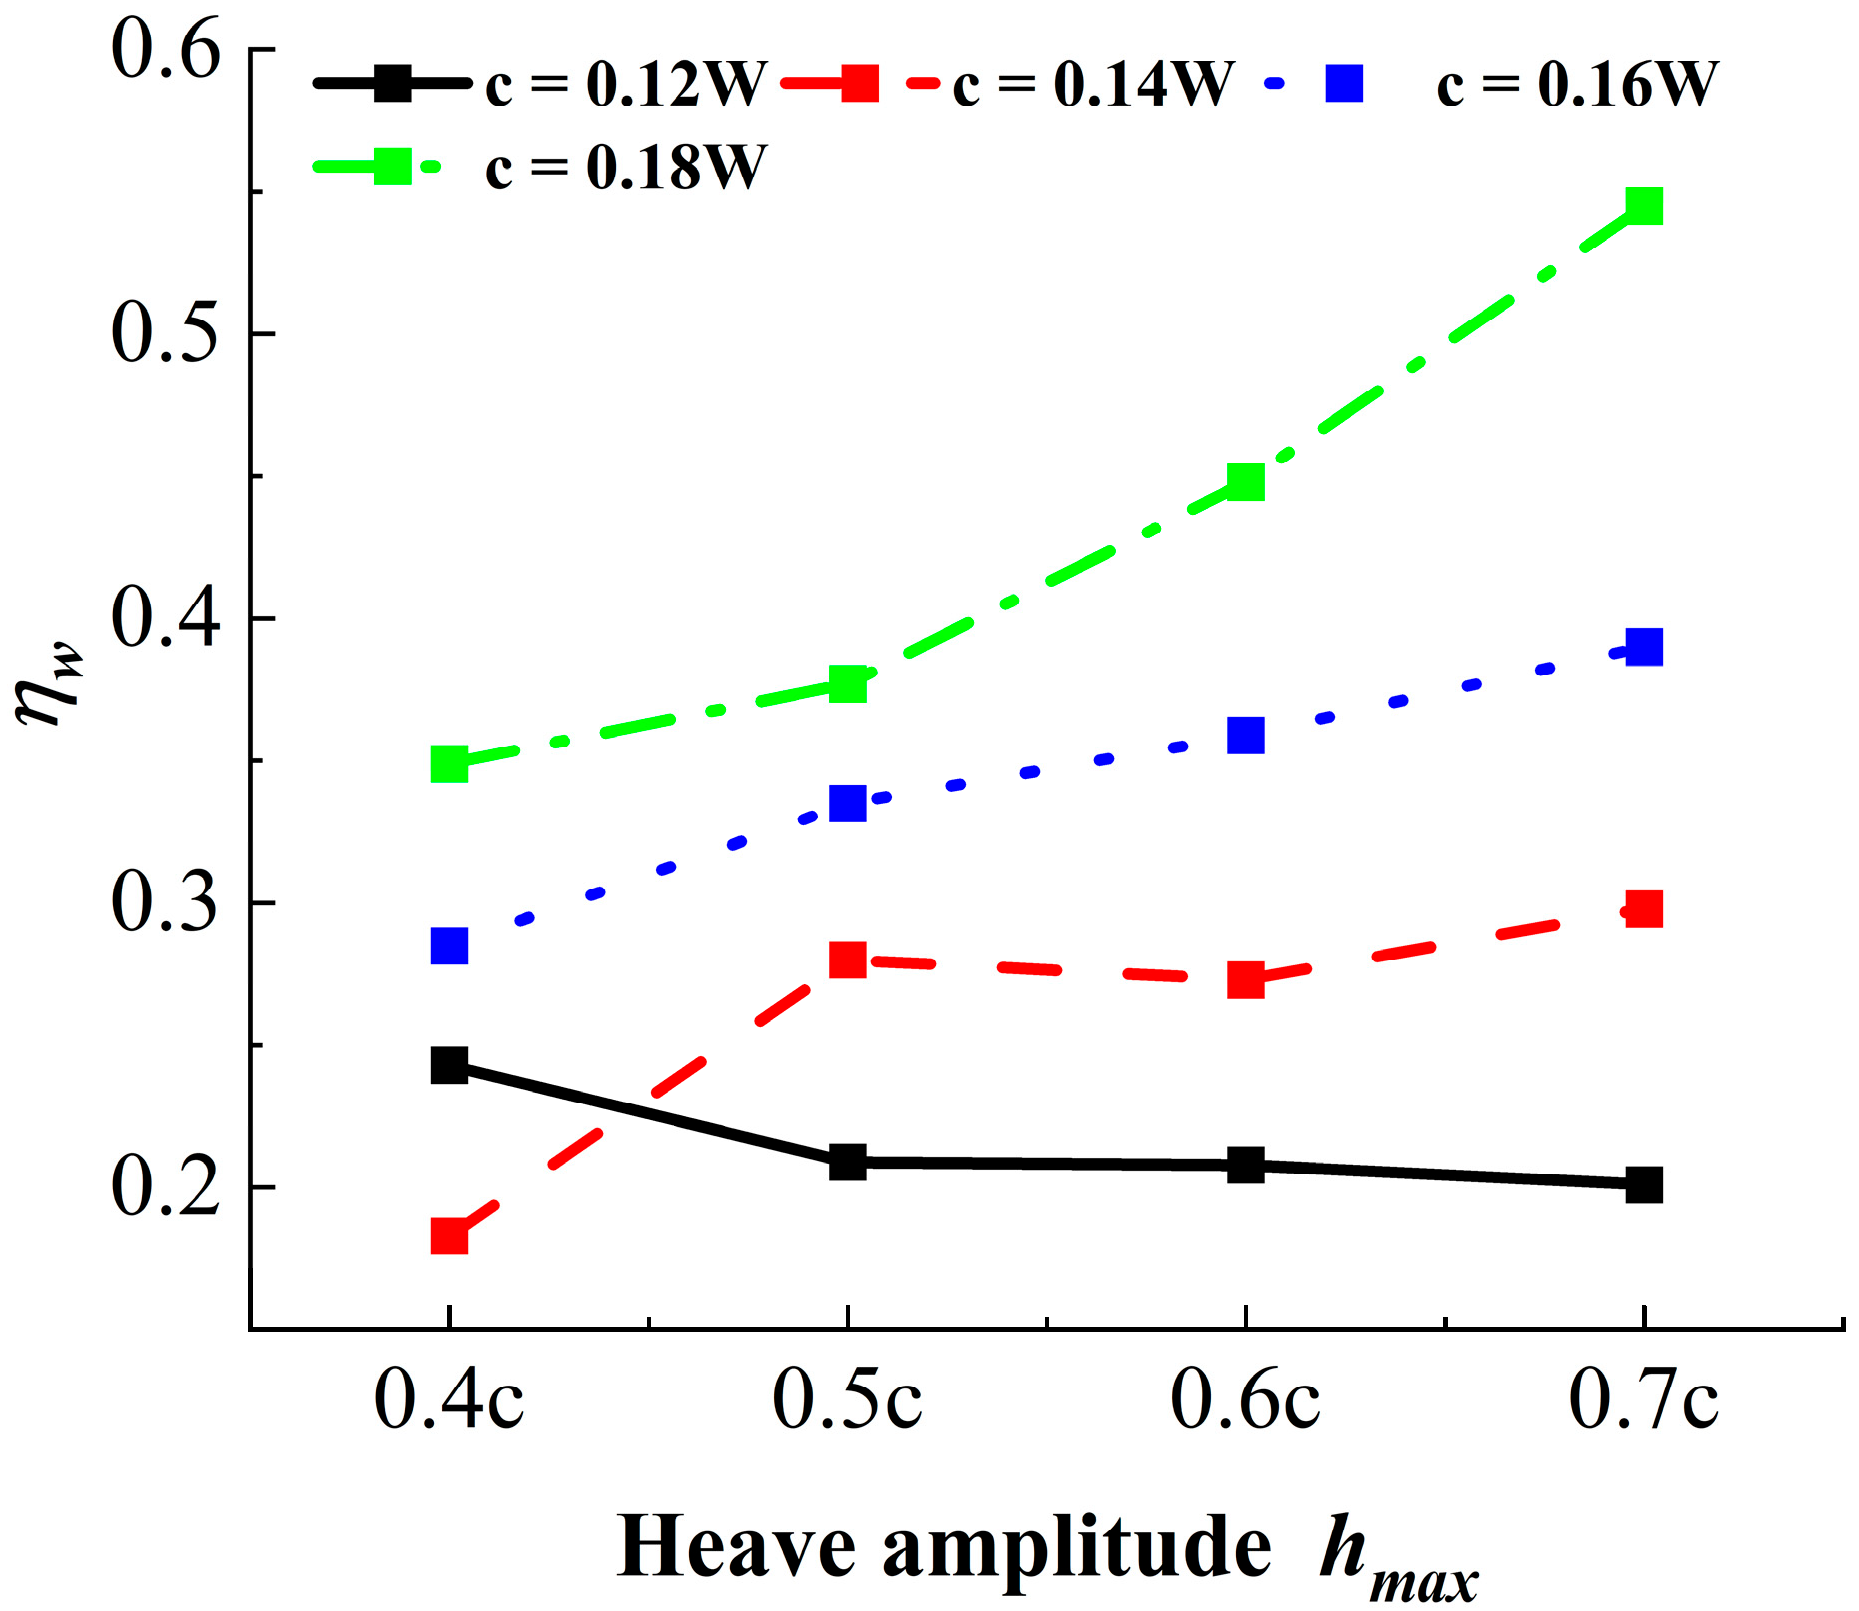
Figure 8 shows the variation in pumping efficiency for the multi-hydrofoil system under different heave amplitudes and chord lengths. Overall, except for the 0.12W chord, efficiency rises with heave amplitude, though the magnitude of the increase differs by chord length. For the 0.18W chord, increasing heave amplitude from 0.4c to 0.7c raises efficiency by approximately 56%. The 0.14W chord yields the largest gain, about 61%, whereas the 0.16W chord shows only a 36% improvement. Notably, when the chord is 0.12W, efficiency declines by about 17% as heave amplitude increases. The primary reason is that the smaller chord limits the effective wetted area. Larger heave amplitudes markedly increase input energy, yet the corresponding gains in pressure rise and flow rate are modest. As a result, the effective volume pumped per unit energy decreases, leading to the observed efficiency drop.
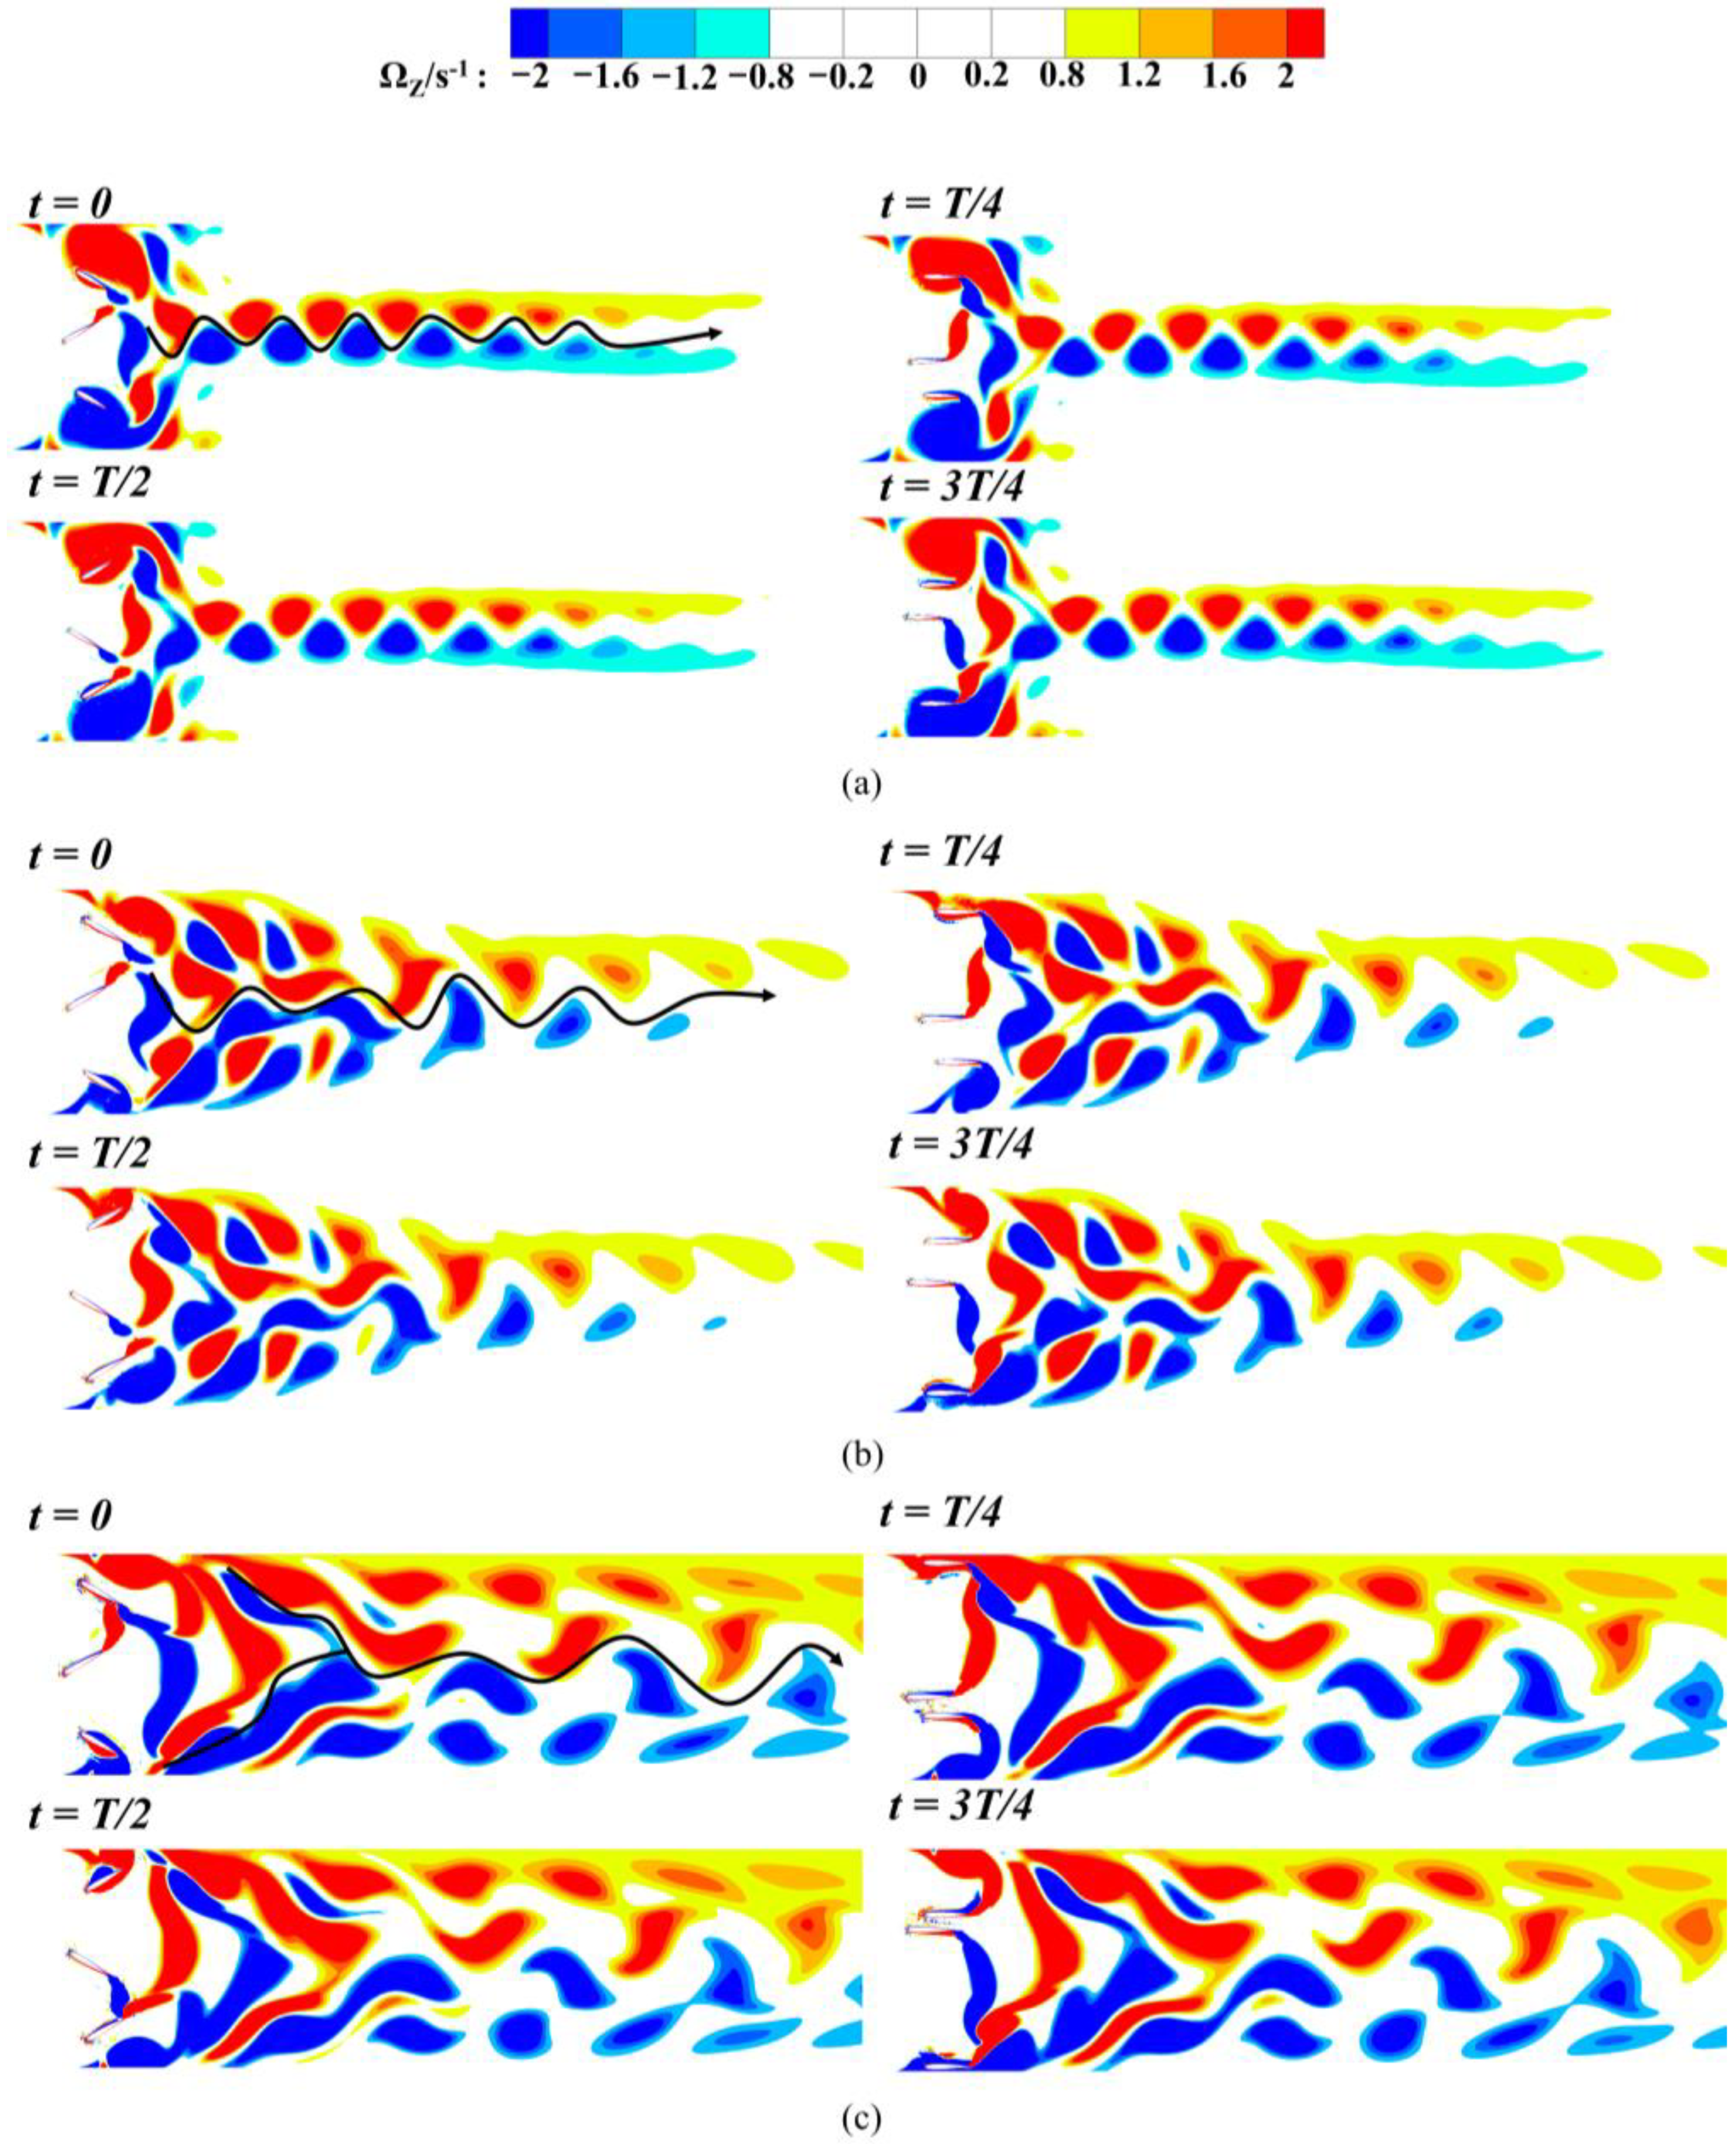
As shown above, different combinations of chord length and heave amplitude substantially affect the pressure rise, flow rate, and input power of the multi-hydrofoil system, as a consequence of the distinct evolution of vortex structures. To elucidate the mechanisms underlying the observed differences in pumping efficiency, three representative cases are selected: one with the same chord length but different heave amplitudes, and the other with the same heave amplitude but different chord lengths. Table 4 summarizes the specific settings for these cases.
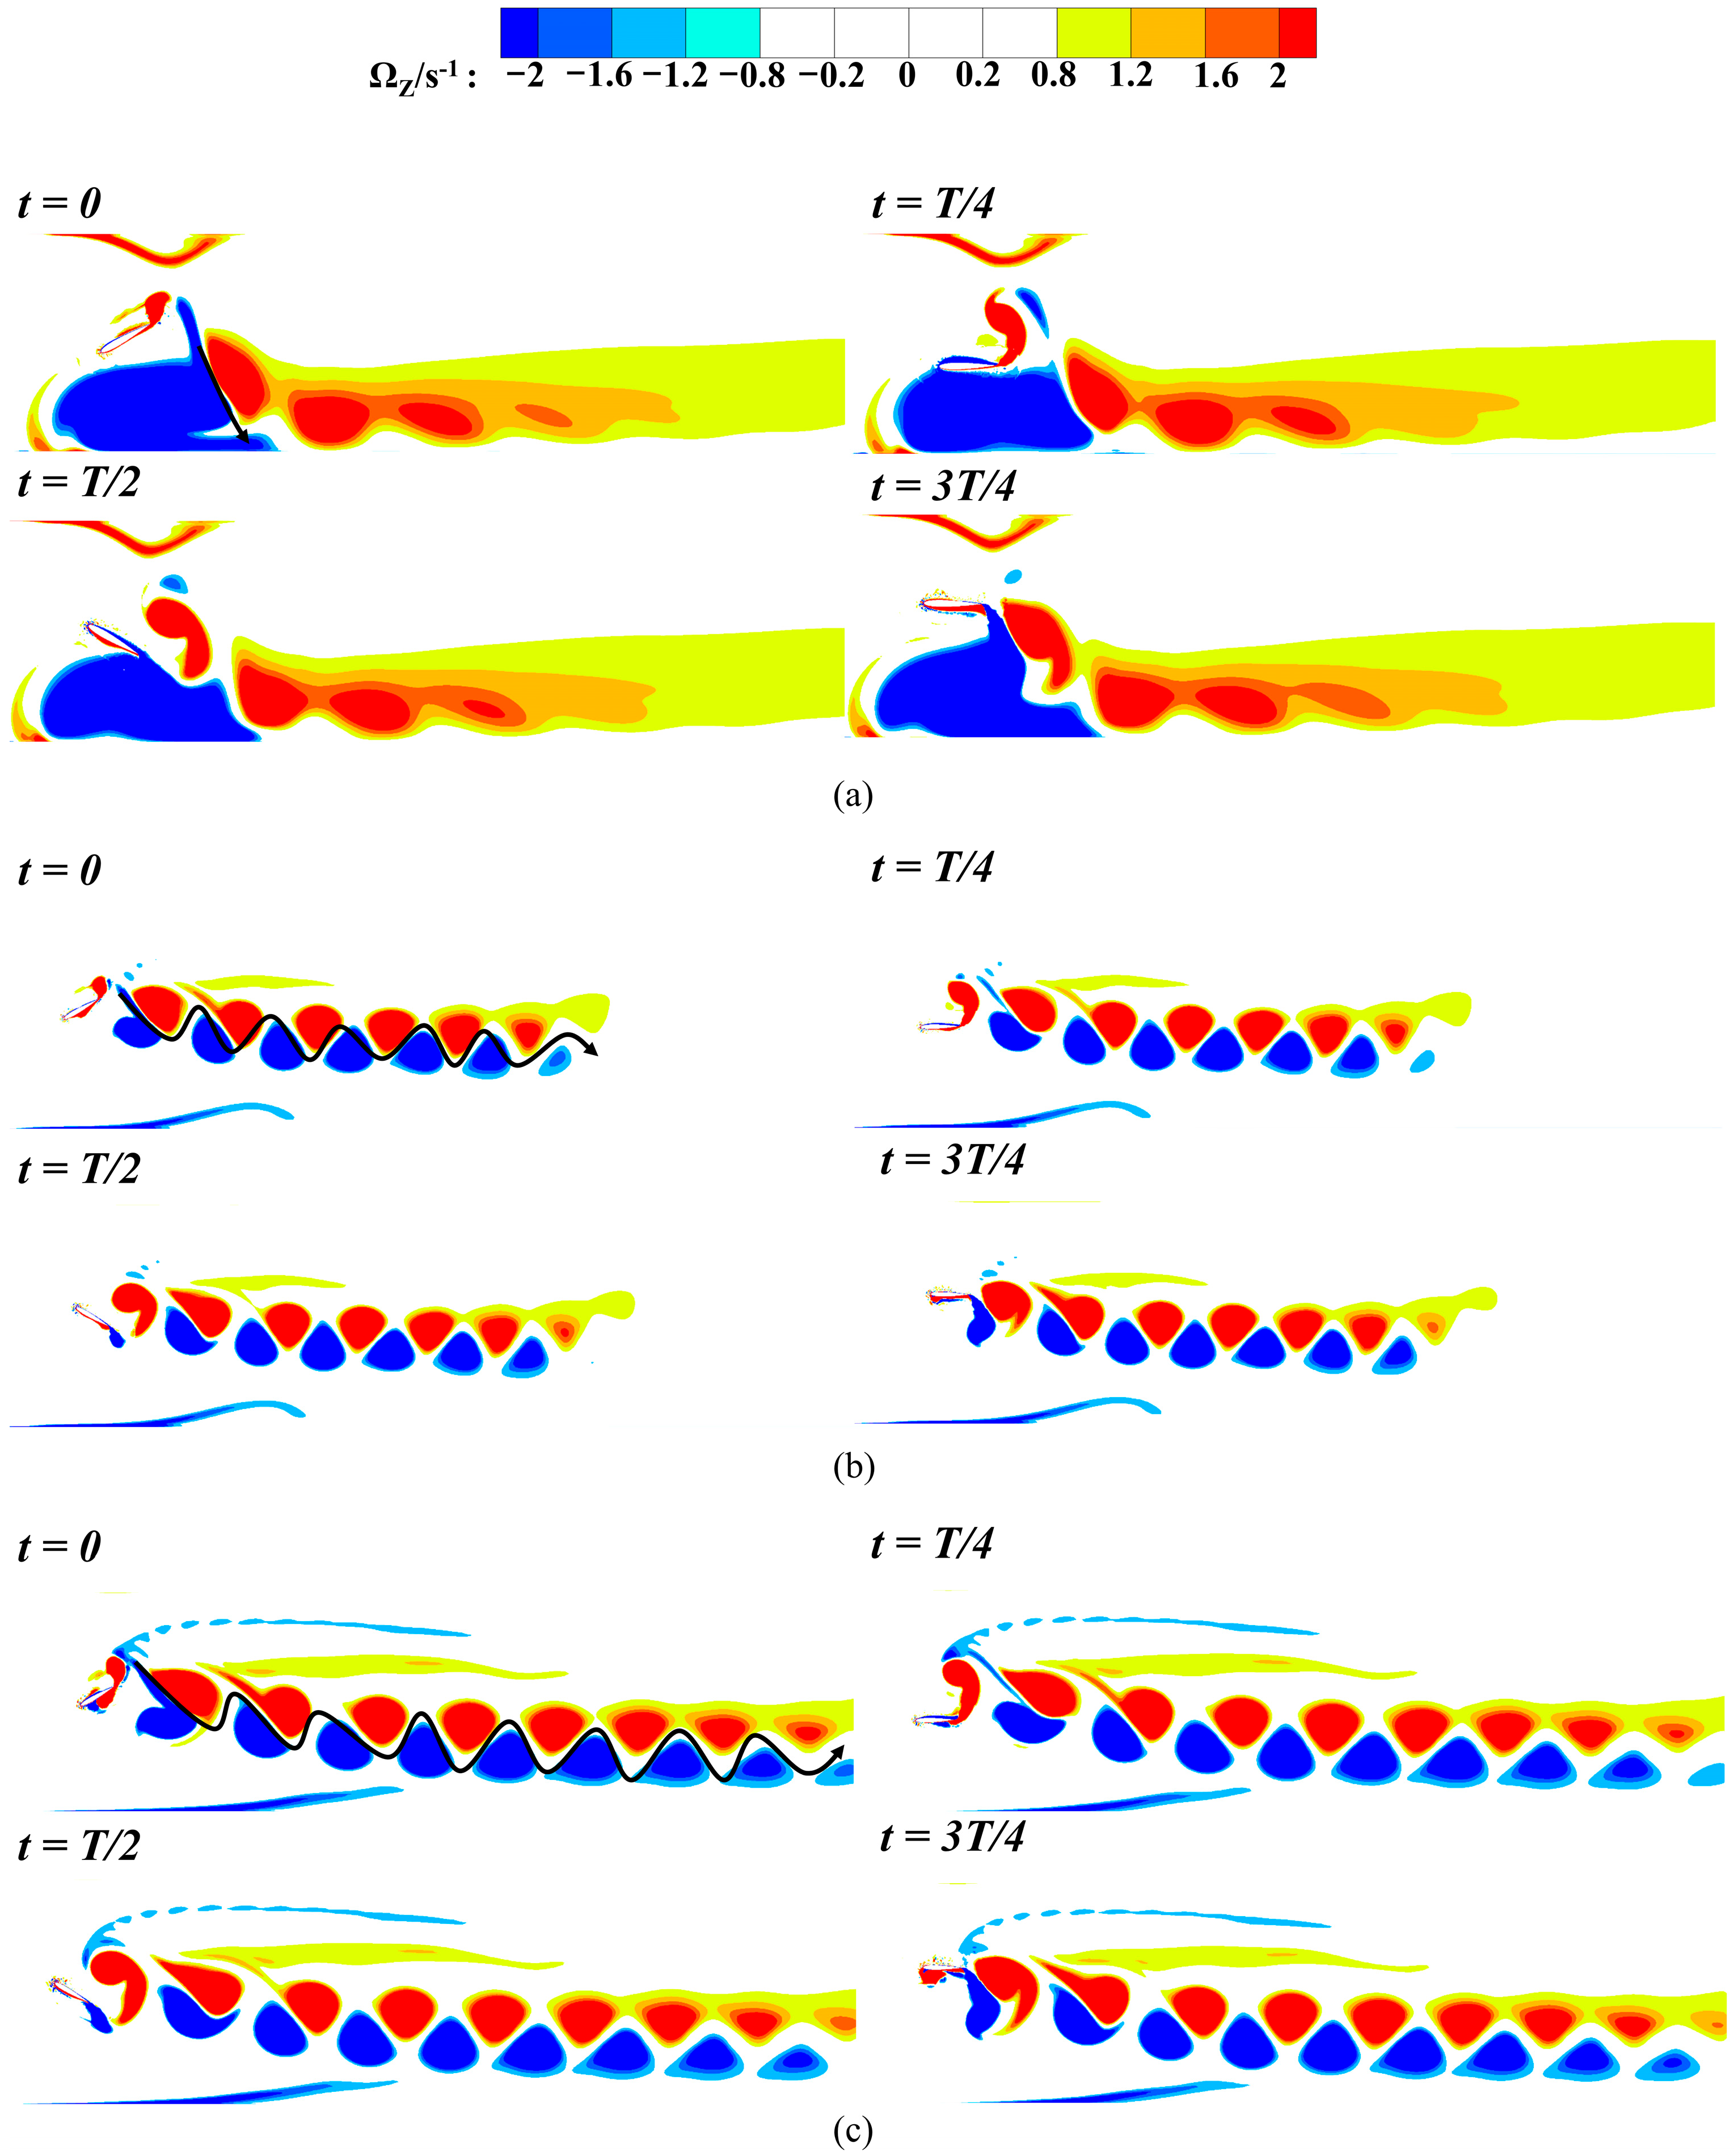
These cases are used for a comparative analysis of the vorticity fields over one cycle, as illustrated in Figure 9. In Case A, the clockwise vortex shed from sub-hydrofoil 1 collides immediately with the counter-clockwise vortex shed during the previous cycle, so part of the vorticity is dissipated in the interaction. Induced by the velocity field of that counter-clockwise vortex, the downstream trajectory deviates from the wake axis: instead of propagating downstream, the vortex migrates toward the wall, collides with it, and eventually decays. The counter-clockwise vortex shed from sub-hydrofoil 1 remains trapped above the foil because of the wall constraint; its core lingers in the upper flow field and interacts strongly with the clockwise vortex generated in the next cycle, accelerating vorticity dissipation. Sub-hydrofoil 3 sheds clockwise and counter-clockwise vortices in exactly the same manner as sub-hydrofoil 1; these vortices interact near the front of the wake and dissipate without propagating far downstream. Ultimately, the wake is dominated by the reverse von Kármán vortex street formed by the clockwise and counter-clockwise vortices shed from sub-hydrofoil 2.
In Case B, the clockwise vortex shed from sub-hydrofoil 1 is situated between counter-rotating vortices. Subjected to bidirectional shear and stretching, it rapidly decays in the near wake: its core fragments and loses its ability to propagate downstream. This decay mechanism is identical to that observed in Case A. The subsequent evolution of the counter-clockwise vortex, however, differs markedly. Wall confinement is substantially weaker, and thus its core migrates away from the wall into the main flow. During convection, it is attracted to the counter-clockwise vortex generated by sub-hydrofoil 2 through their mutual induced-velocity fields. The two vortices ultimately merge to form a larger, more concentrated counter-clockwise structure. Similarly, the clockwise vortices shed by sub-hydrofoils 2 and 3 coalesce into an intensified clockwise vortex. Far downstream, these two large-scale, oppositely signed vortices arrange alternately to create a reverse von Kármán vortex street. Compared with Case A, this street possesses higher vorticity and exhibits no transverse induced velocity, thereby eliminating wall-normal jetting and yielding superior hydrodynamic performance in Case B.
In Case C, the larger heave amplitude generates vortices of larger scale and higher vorticity than in Case B. The clockwise vortex shed from sub-hydrofoil 1 is positioned between the counter-clockwise vortices shed from the same foil and from sub-hydrofoil 2. Subjected to bidirectional shear from these opposite-sign vortices, it dissipates rapidly in the near wake. Similarly, the counter-clockwise vortex shed from sub-hydrofoil 3 fails to propagate downstream and decays close to the foil. Ultimately, the far wake is dominated by a counter-clockwise vortex formed through the merger of the counter-clockwise structures from sub-hydrofoils 1 and 2. In addition, a clockwise vortex results from the coalescence of the clockwise structures from sub-hydrofoils 2 and 3. This yields a reverse von Kármán vortex street composed of large-scale, alternating vortices. Compared with Case B, the street exhibits larger-scale structures, higher intensity, and covers a broader high-velocity region, thereby delivering superior hydrodynamic performance.

4.2. Influence of Heave Amplitude and Chord Length on the Single-Hydrofoil System

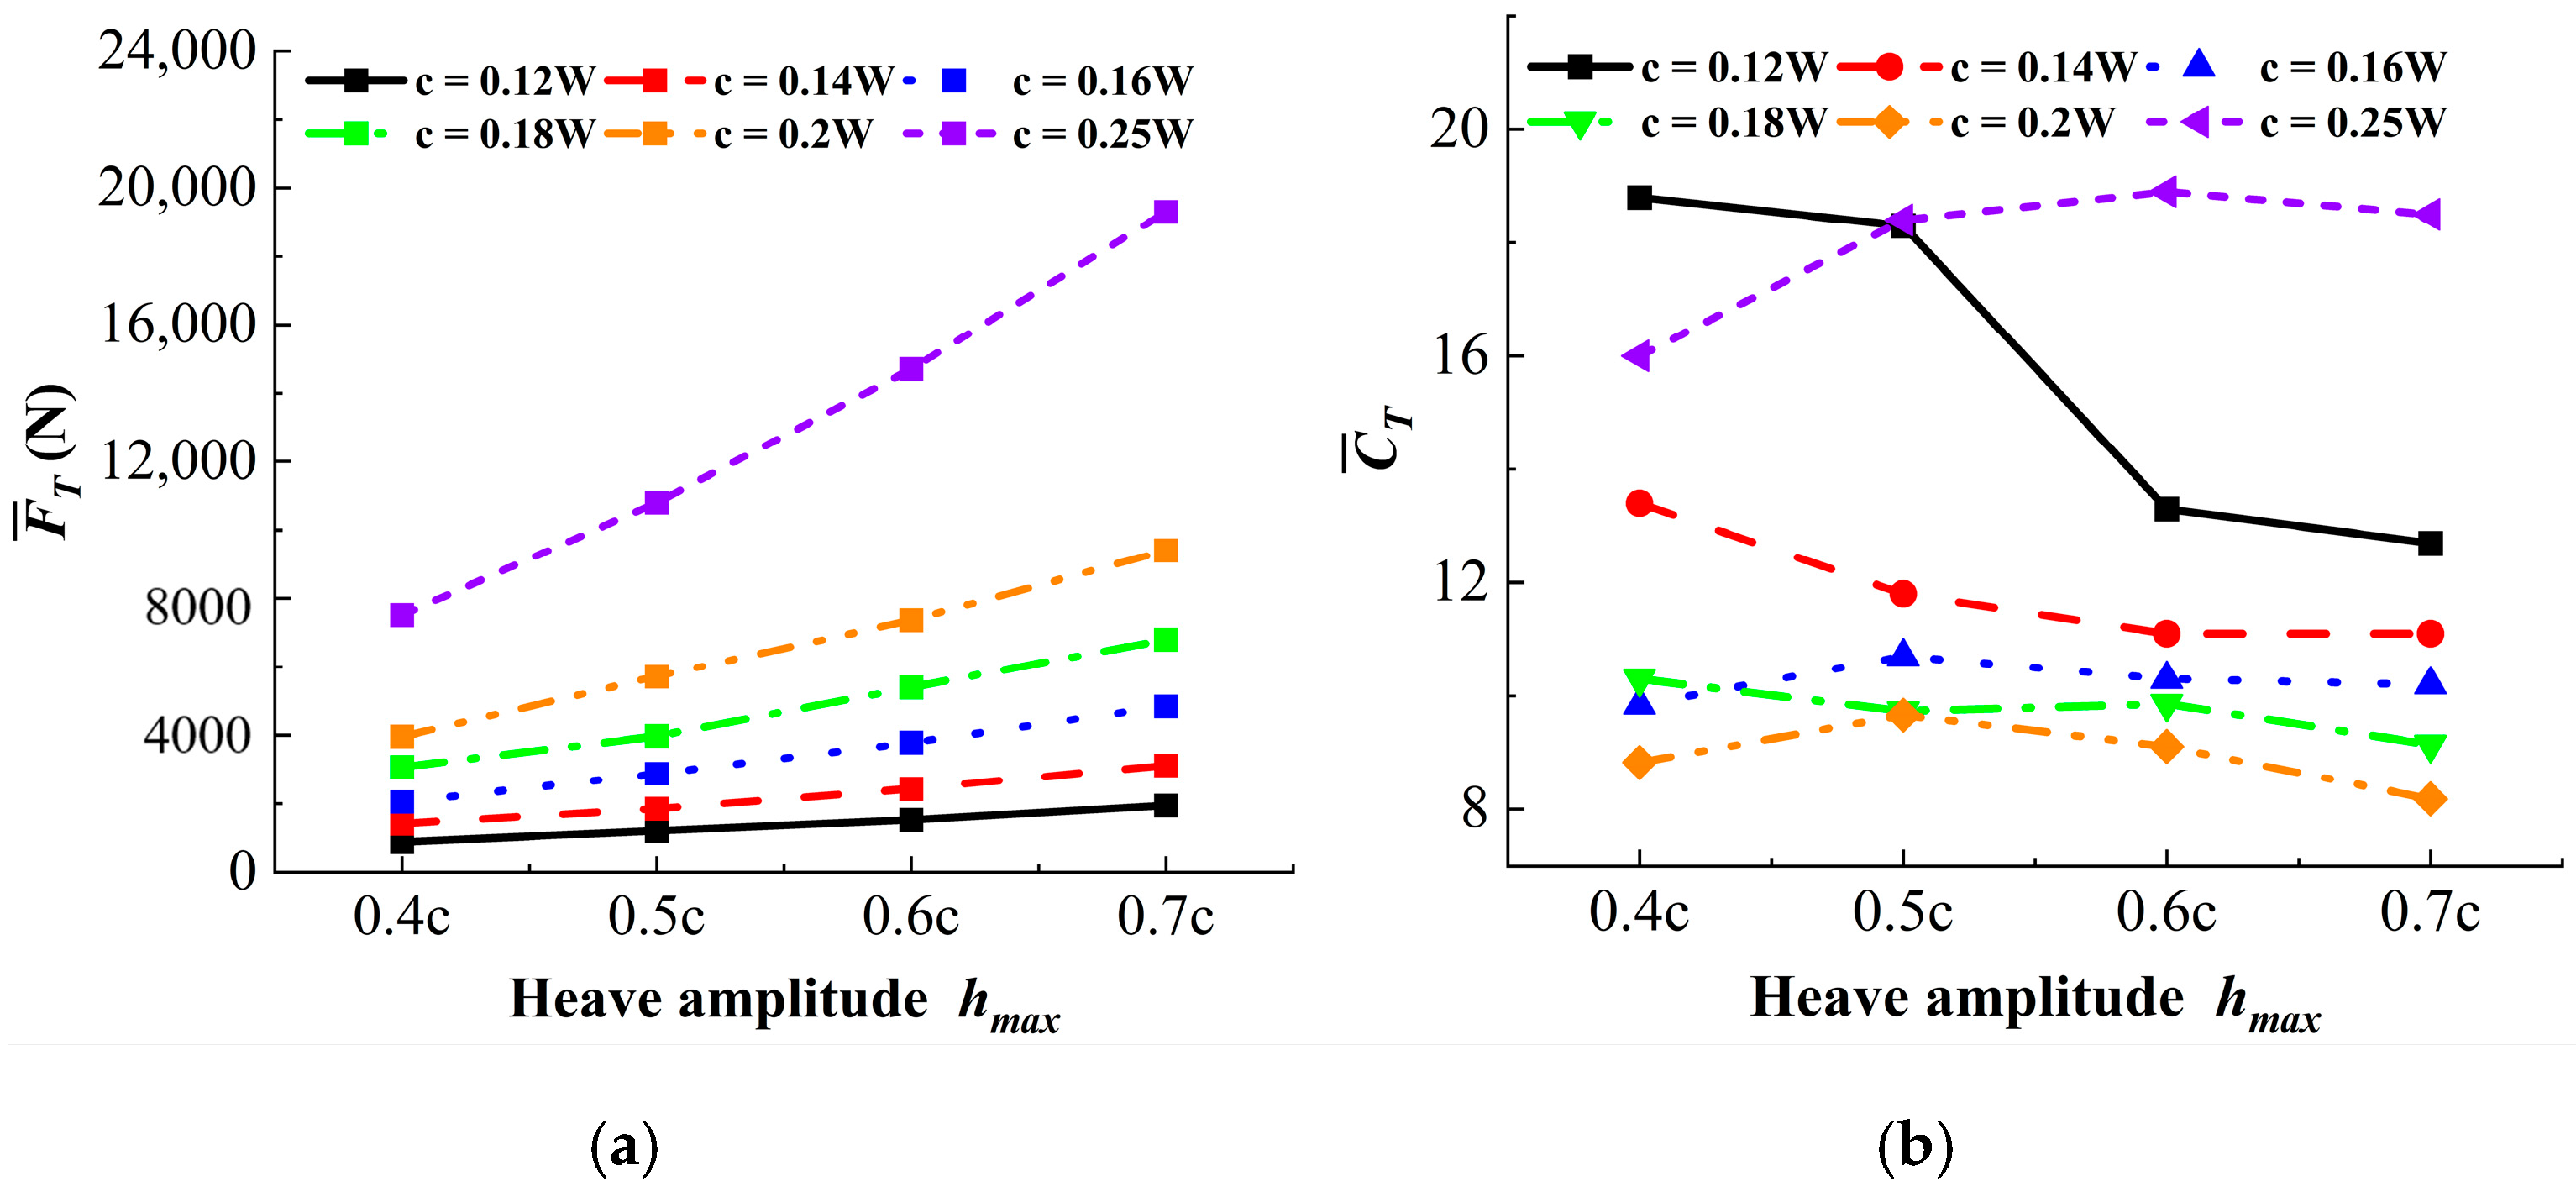
Figure 10 shows the variation in mean thrust and mean thrust coefficient for the single-hydrofoil system under different heave amplitudes and chord lengths. Overall, mean thrust increases steadily with heave amplitude, and the improvement becomes more pronounced at larger amplitudes, mirroring the trend observed in the multi-hydrofoil system. For a chord length of 0.25W, increasing heave amplitude from 0.14c to 0.7c raises mean thrust by 157%, whereas for 0.12W, the same amplitude change yields only a 119% increase. Unlike the multi-hydrofoil system, the mean thrust coefficient generally decreases with increasing chord length and also declines as heave amplitude grows, except for the 0.25W chord, where the coefficient rises markedly. This anomaly arises from the fact that, at this chord length, the increase in outlet velocity is significantly smaller than the gain in mean thrust. Consequently, the additional thrust is not fully converted into effective propulsion. Part of the energy is dissipated in the wake, suppressing pumping performance and potentially lowering the system’s pumping efficiency.
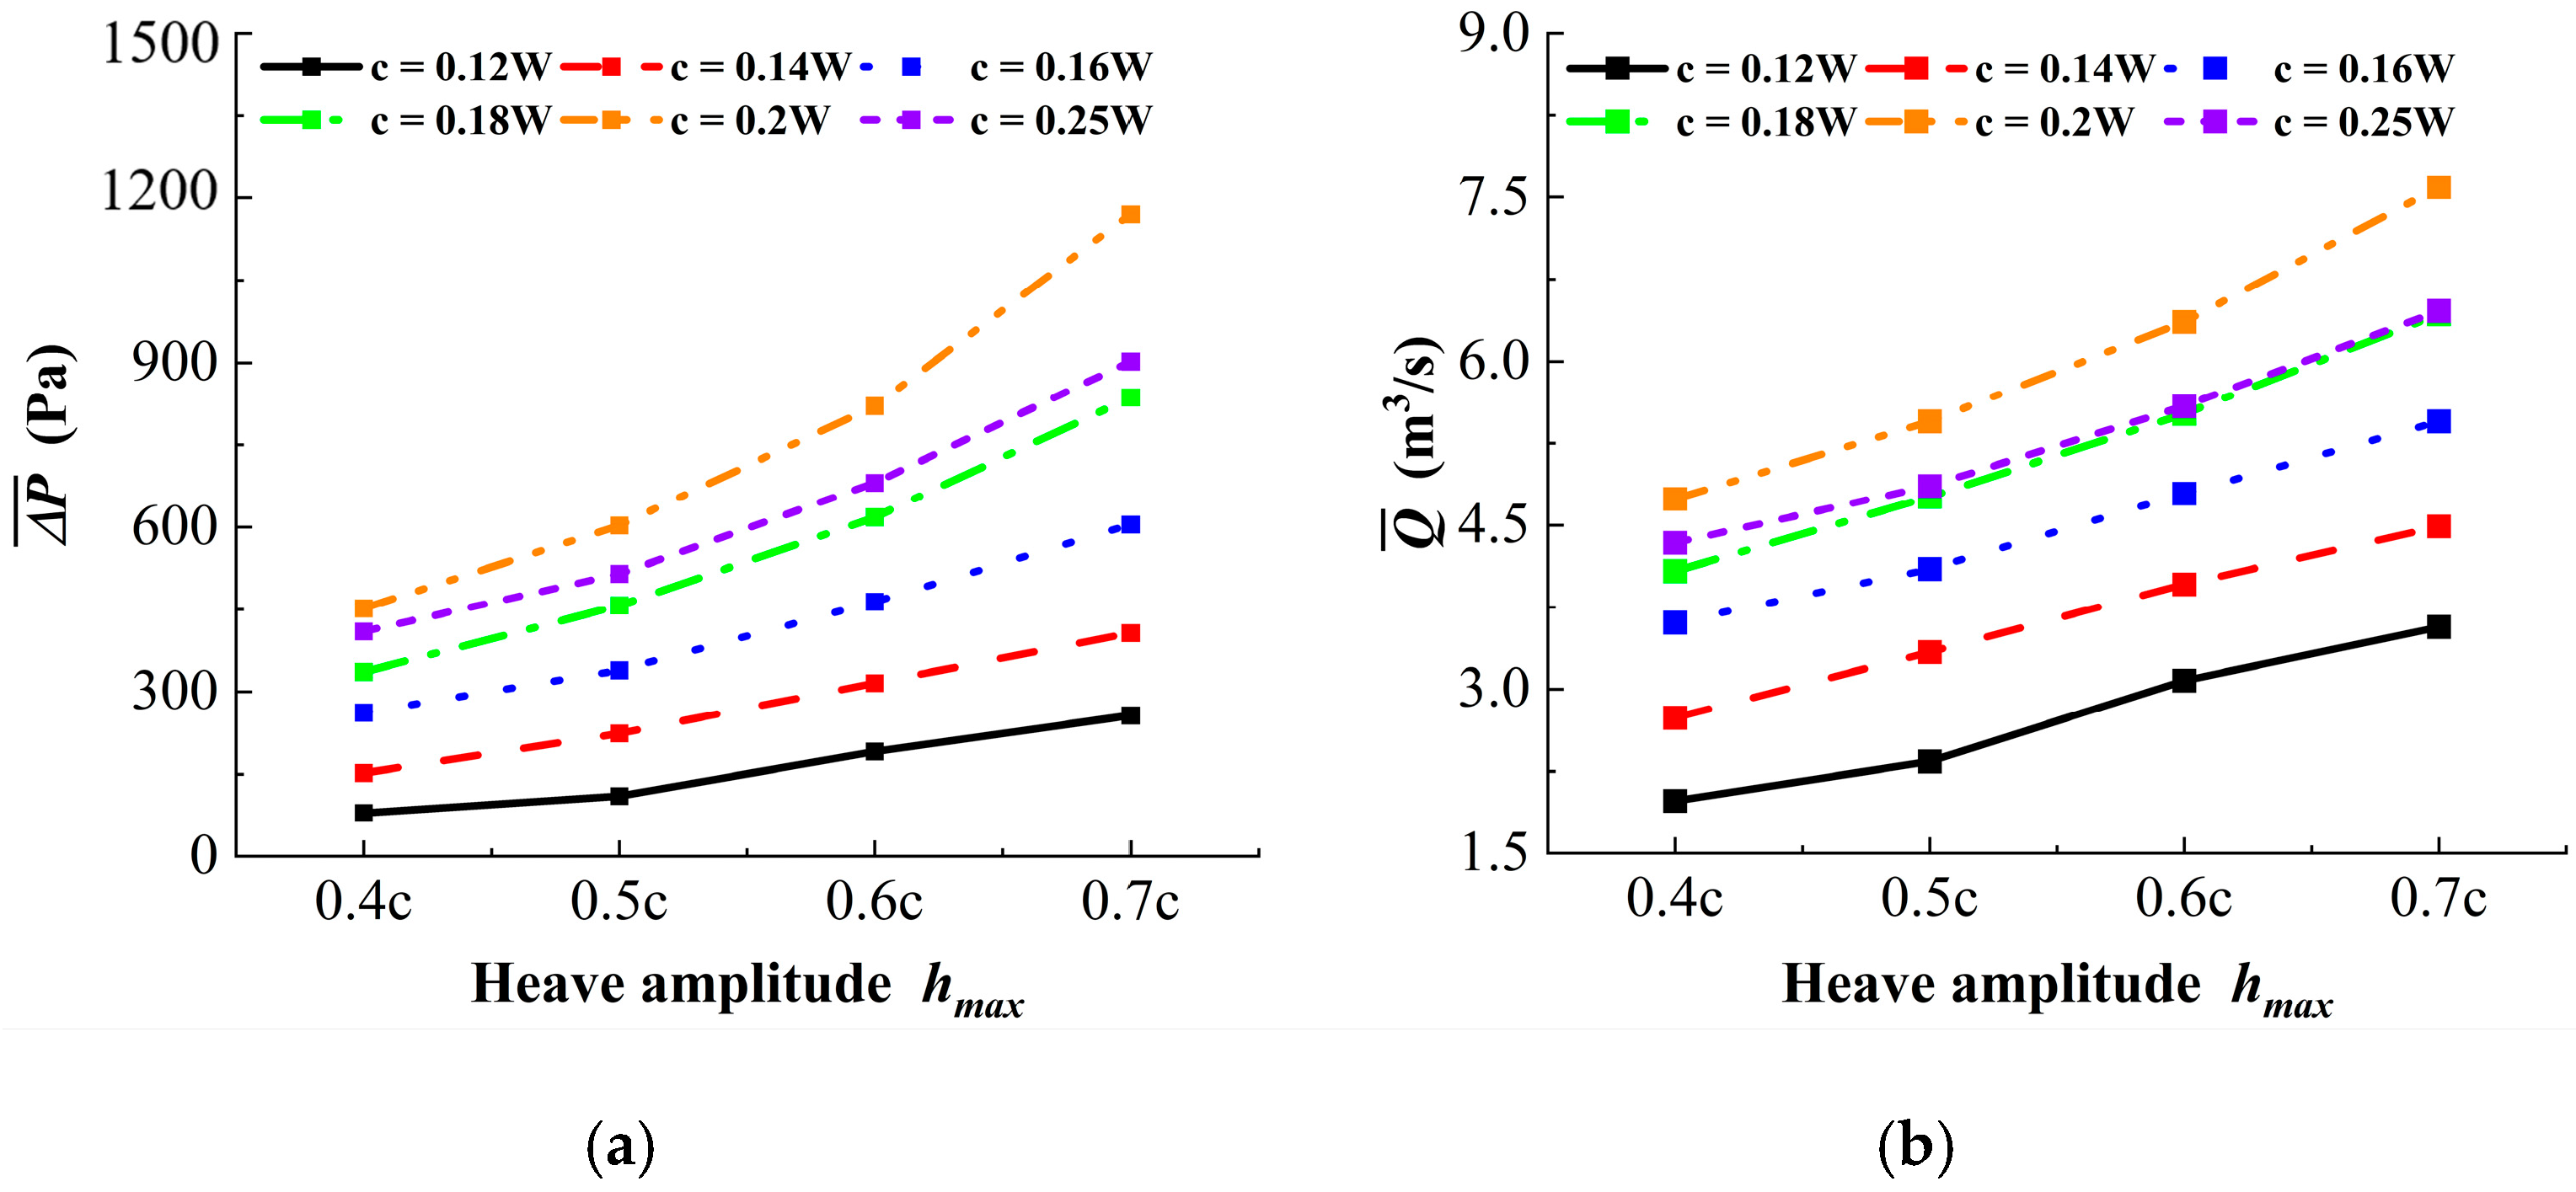
Figure 11 shows the variation in mean pressure rise and mean flow rate for the single-hydrofoil system under different heave amplitudes and chord lengths. Both variables follow the same trend: they increase with heave amplitude, and the increase is more pronounced for larger chord lengths. However, when the chord length is 0.25W, the mean pressure rise and mean flow rate are lower than the corresponding values for 0.20W. Notably, according to the mean thrust plot, the 0.25W chord produces significantly higher thrust than the 0.20W chord. This indicates that, at 0.25W, the additional thrust is not effectively converted into propulsion. Most of the energy is dissipated in the wake. For the single-hydrofoil system, larger chord lengths and heave amplitudes do not necessarily lead to better hydrodynamic performance. If the increased thrust cannot be translated into effective propulsion, the overall performance will not improve.
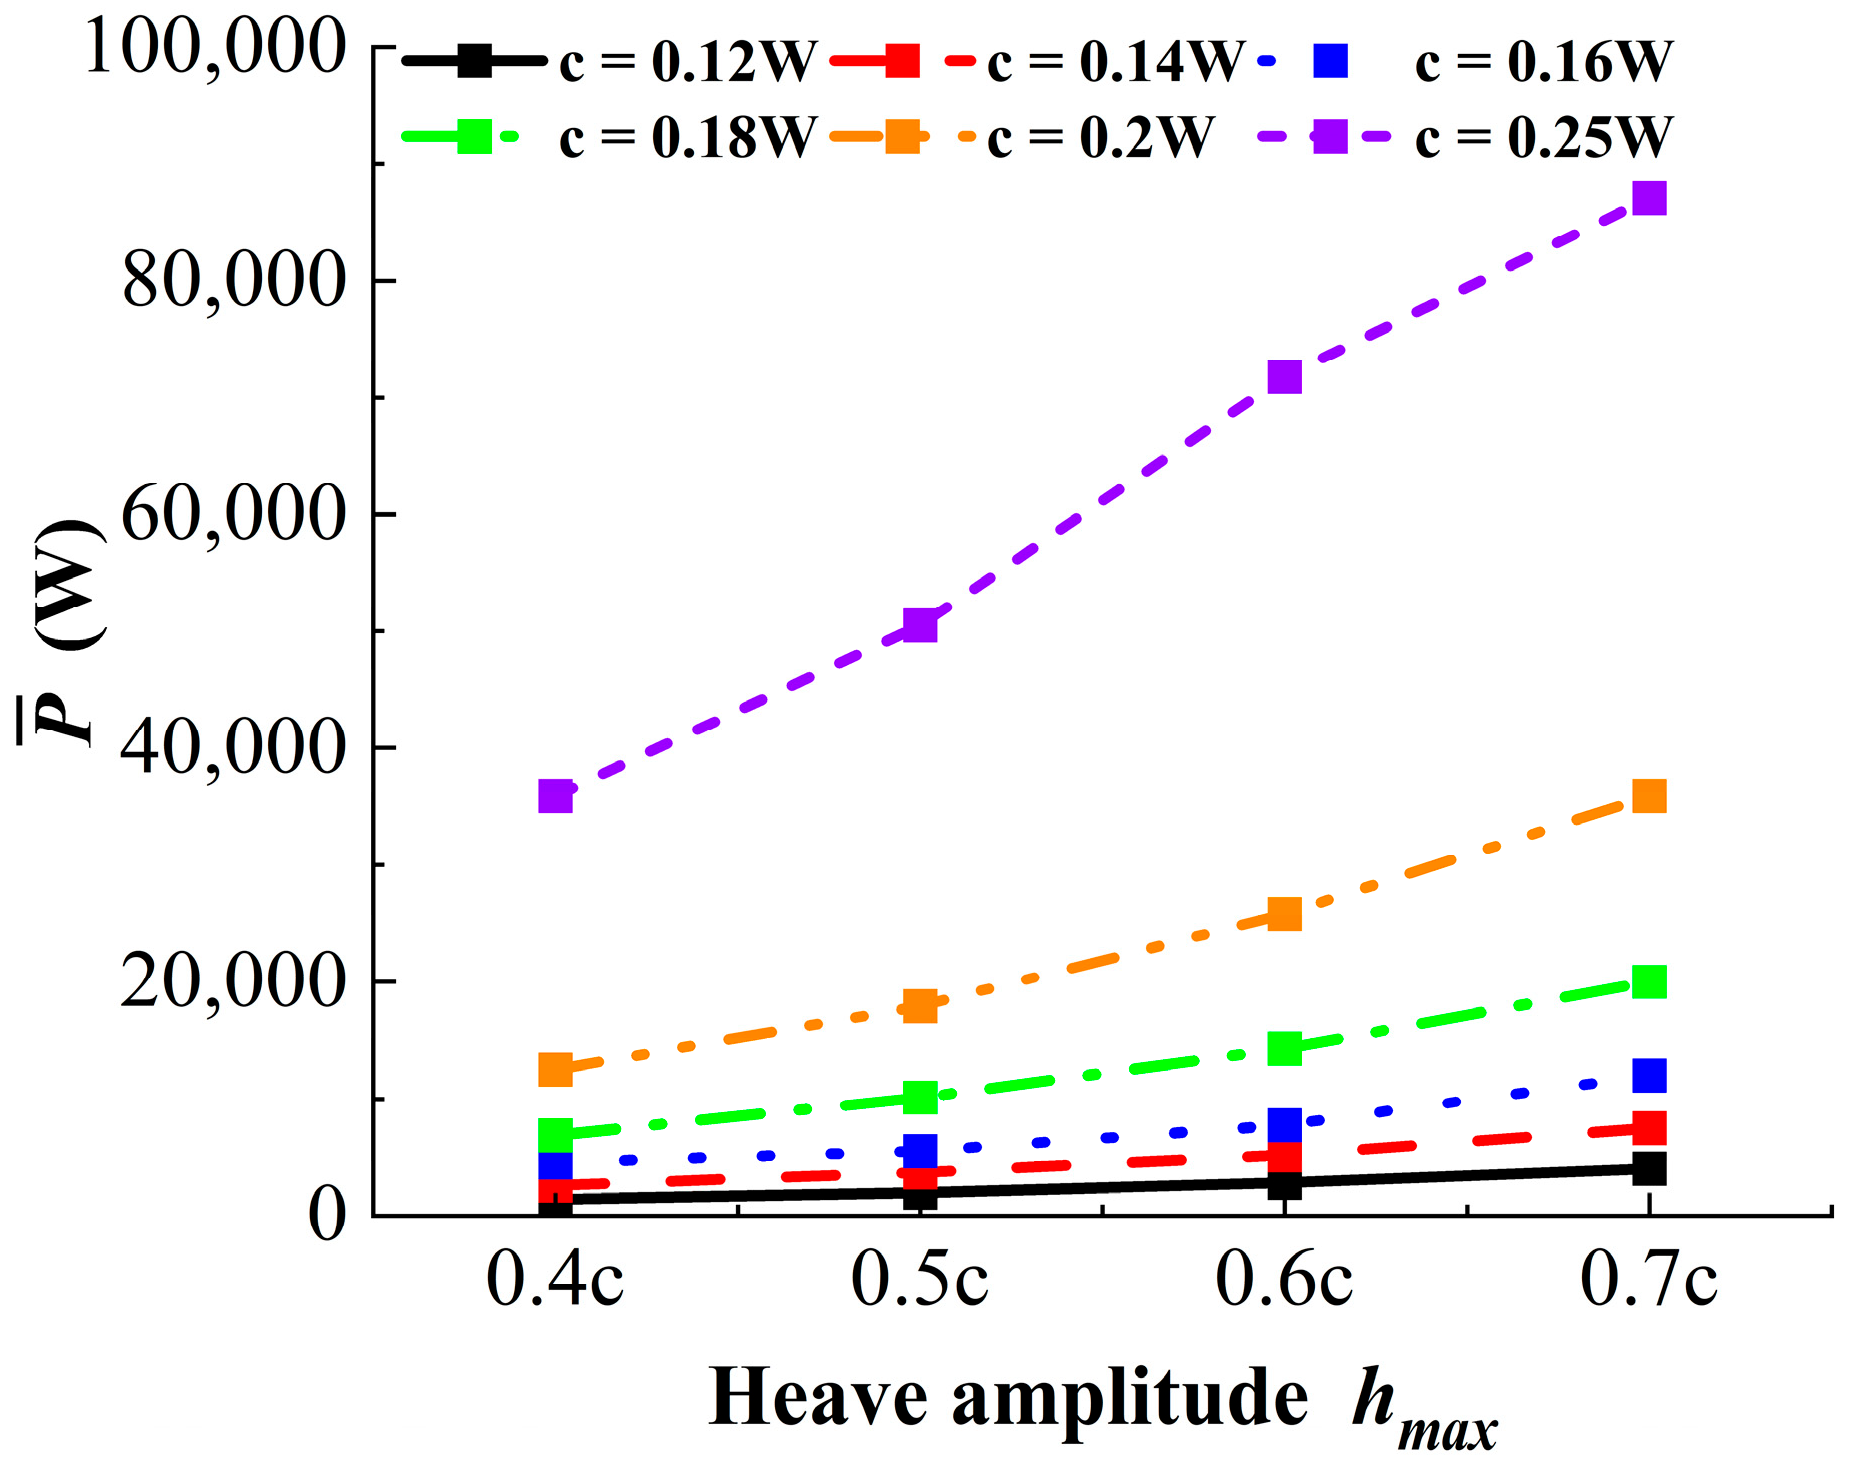
Figure 12 shows the mean input power curves under different operating conditions. The input power rises with increasing heave amplitude, and the increase is more pronounced for larger chord lengths, a trend consistent with that observed in the multi-hydrofoil system.
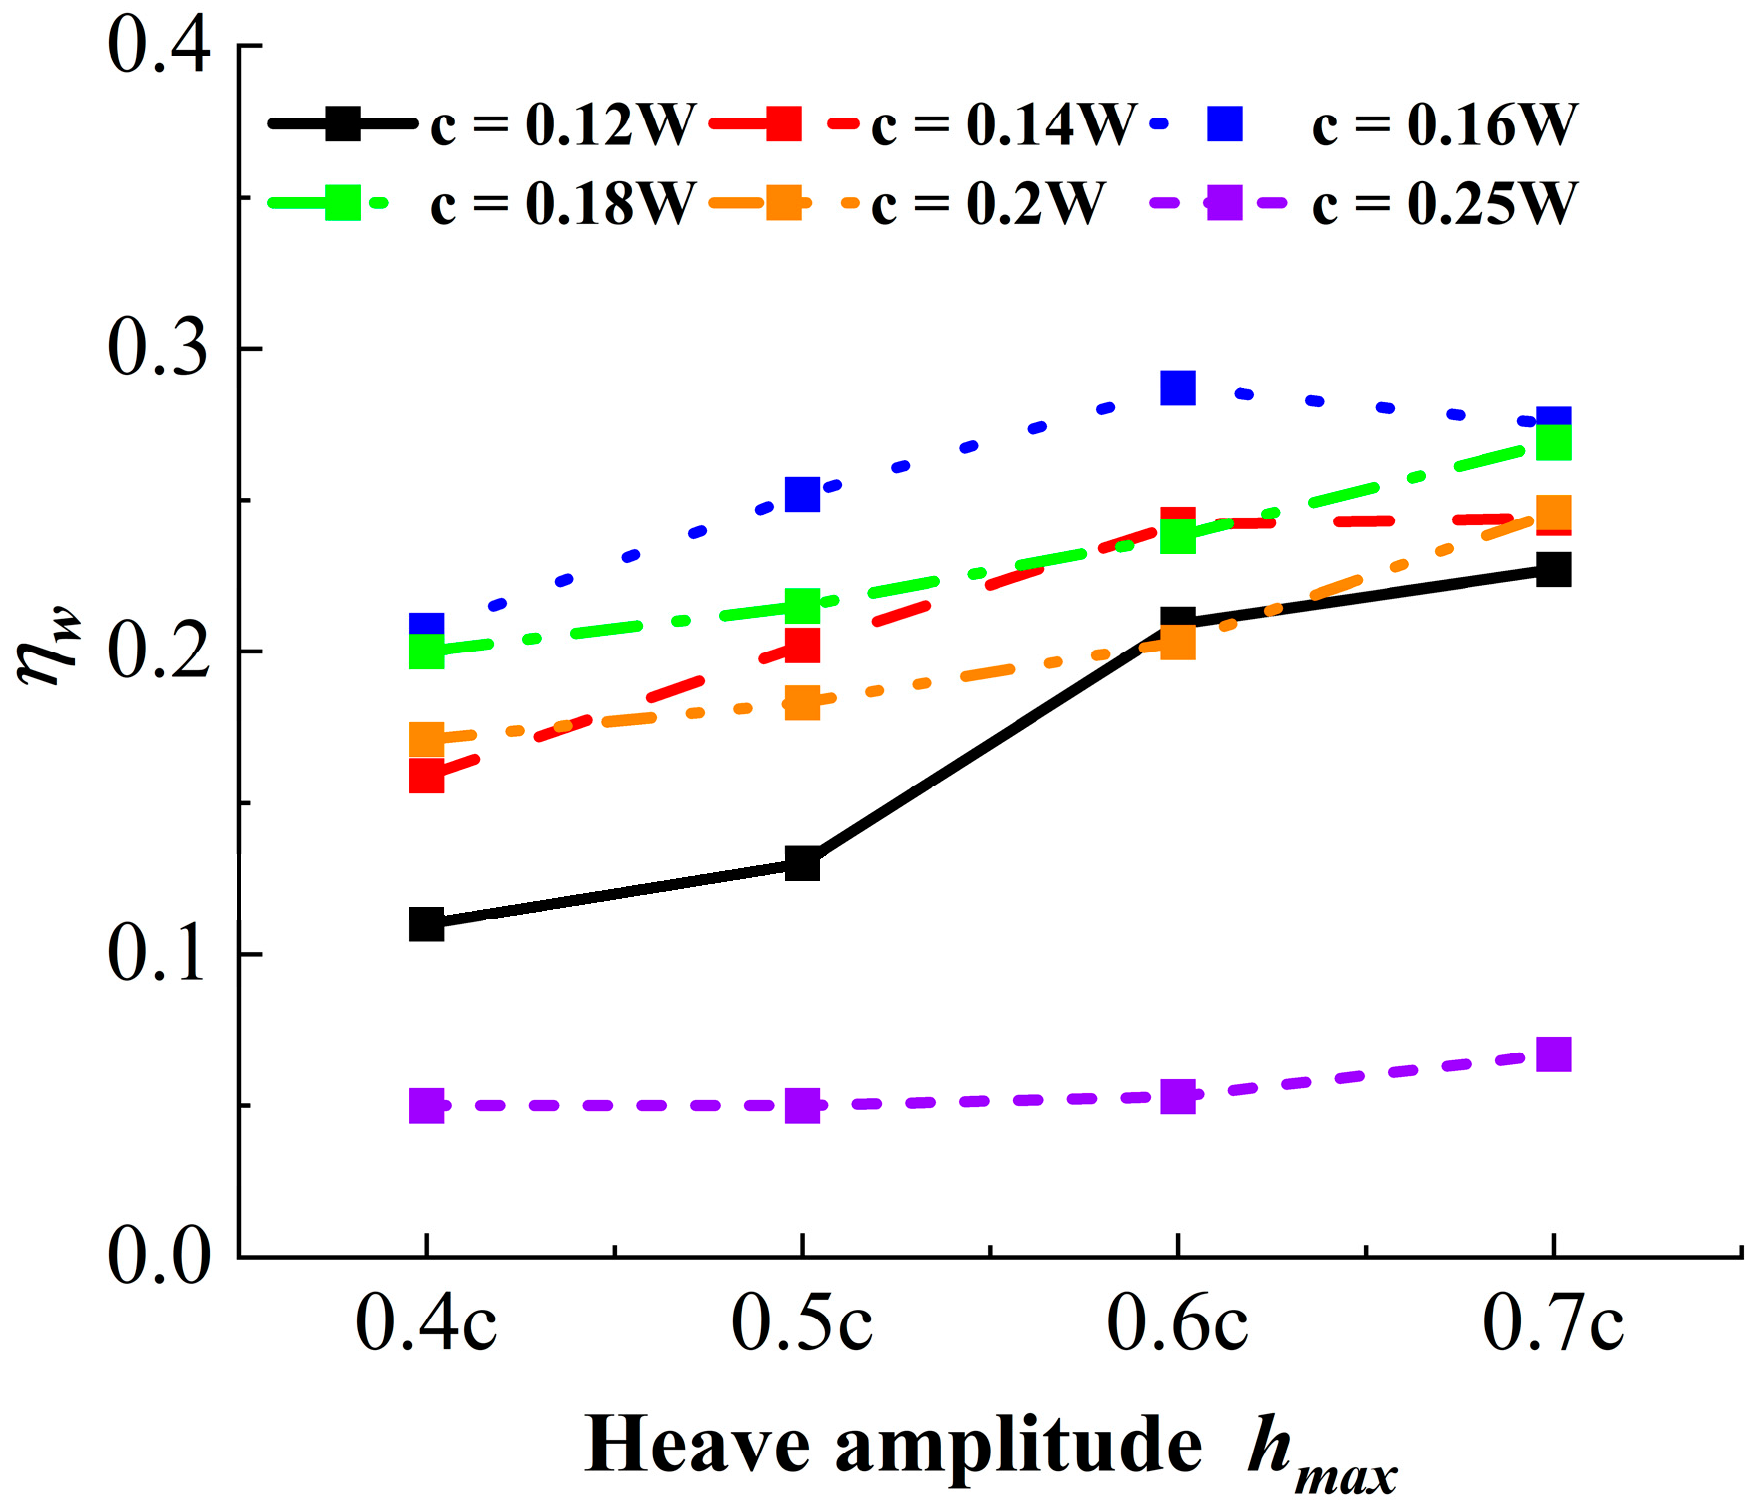
Figure 13 shows the variation in pumping efficiency for the single-hydrofoil system under different heave amplitudes and chord lengths. As heave amplitude increases, pumping efficiency first rises and then either declines or levels off. Increasing chord length produces a similar trend of rising followed by falling. At a chord length of 0.16W, efficiency peaks for every heave amplitude, reaching a maximum of 28.7% when h m a x = 0.6 c . The 0.25W chord gives the lowest efficiency; as explained earlier, at this chord length, the system’s power input rises sharply, yet the mean pressure rise and flow rate show little improvement or even fall below those for 0.20W. Although the larger power input generates greater thrust, this thrust is not effectively converted into propulsion.
To elucidate the mechanism underlying the observed differences in pumping efficiency, three representative cases are selected: one with the same chord length but different heave amplitudes, and the other with the same heave amplitude but different chord lengths. Table 5 summarizes the specific settings for these cases.
These cases are used for a comparative analysis of the vorticity fields over one cycle, as illustrated in Figure 14. In Case A, the larger chord causes the clockwise–counter-clockwise vortex pair shed from the hydrofoil to deflect sharply downward. The pair immediately strikes the wall. Because the clockwise vortex remains in close contact with the lower foil surface, it is trapped near the foil after impact and fails to enter the wake. The counter-clockwise vortex, which does not touch the lower surface, continues downstream after colliding with the wall. However, the vortex pair is effectively destroyed. The clockwise vortex lingers beside the foil, obstructing the formation of the reverse von Kármán vortex street in the wake. The vorticity contours reveal that the flow deviates markedly from the streamwise direction and collides with the wall. This ultimately produces a pronounced reduction in hydrodynamic performance. In Case B, the vortex pair also exhibits deflection compared with Case A, but the deflection angle is markedly smaller. This reduced angle minimizes energy loss and allows more momentum to be effectively transferred to the wake region. Consequently, an ordered reverse von Kármán vortex street develops in the wake, yielding hydrodynamic performance far superior to that in Case A. In Case C, relative to Case B, the larger heave amplitude produces markedly stronger vortices. Their lower dissipation rate allows more energy to be converted into propulsive force. Consequently, although greater input power is required, the corresponding gains in mean pressure rise and mean flow rate are more pronounced, yielding superior hydrodynamic performance.

4.3. Comparative Analysis and Parameter Selection Based on the Inhibition Velocity

The preceding analyses yield the respective optimal configurations for the two systems: c = 0.18 W and h m a x = 0.7 c for the multi-hydrofoil system, and c = 0.16 W and h m a x = 0.6 c for the single-hydrofoil system. This section examines the flow-field characteristics and outlet velocities of both configurations at five discrete frequencies—0.05, 0.10, 0.15, 0.20, and 0.25 Hz—under their respective optimal parameters.
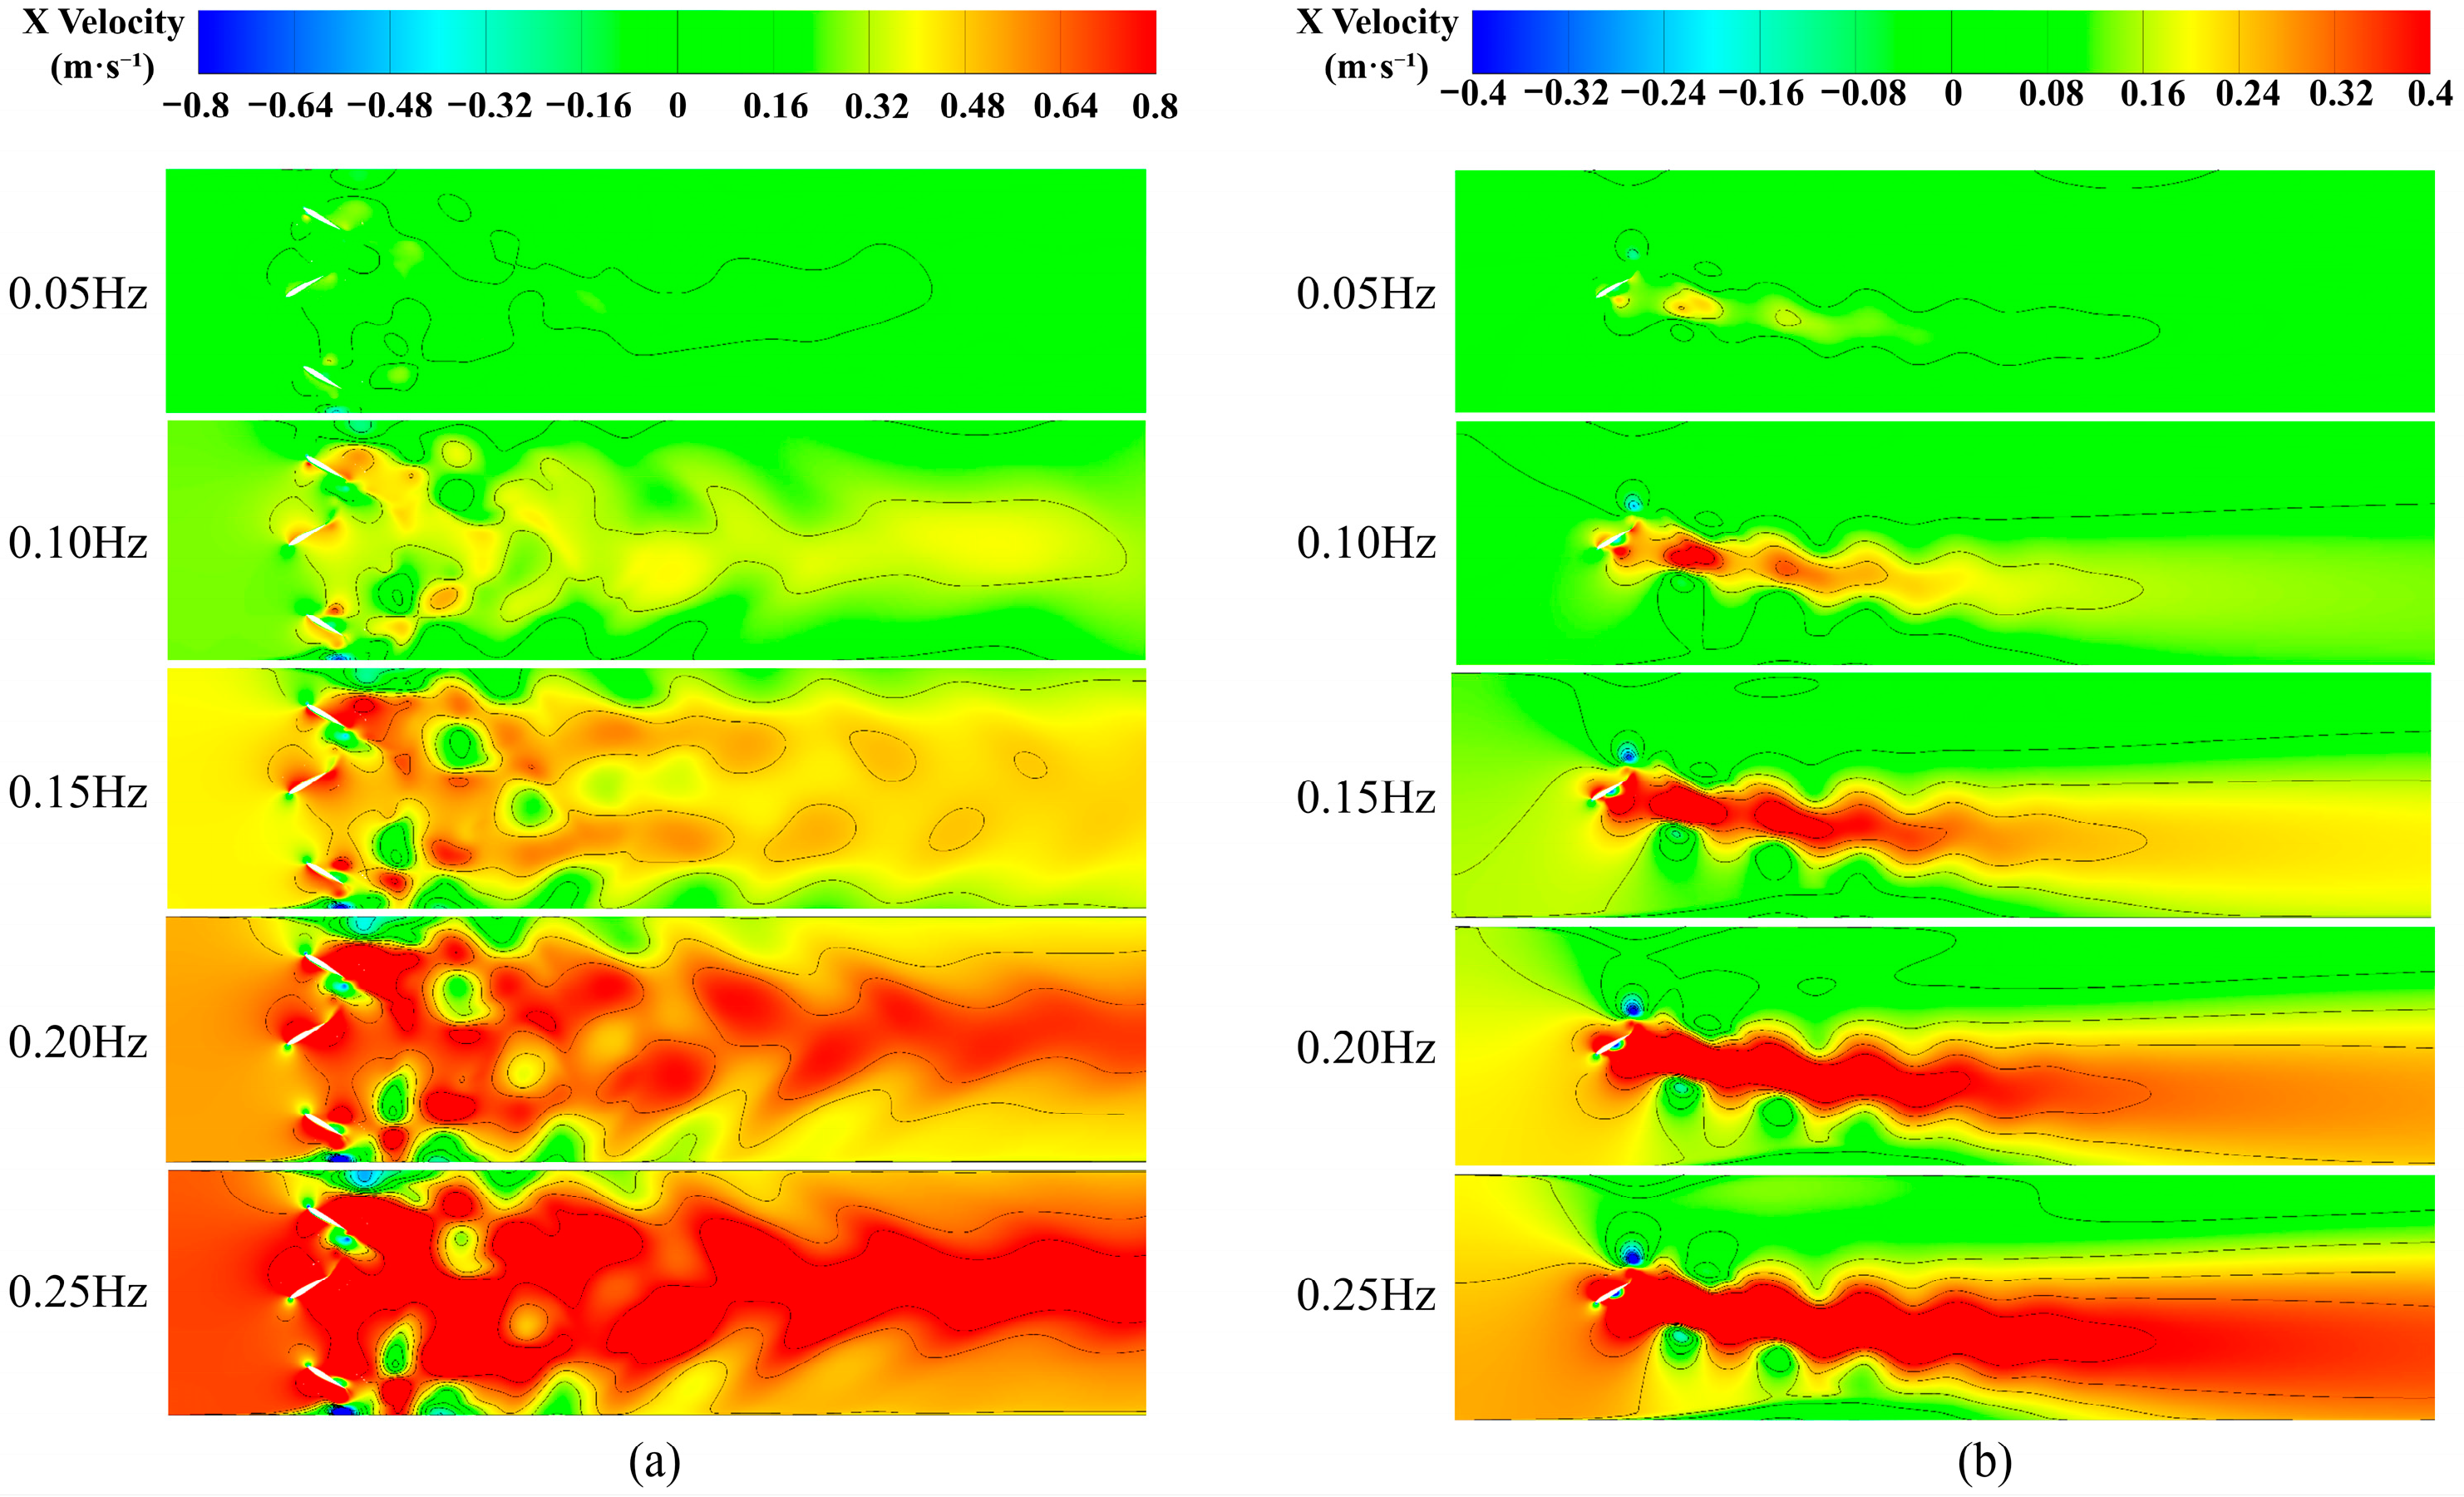
Figure 15 shows the velocity contours at different frequencies. For the multi-hydrofoil system, the overall velocity level in the wake rises steadily with frequency, and the distribution remains fairly uniform. A distinct high-speed jet appears in the mid-plane, and both its magnitude and spatial extent grow as frequency increases. The surrounding fluid on either side of this jet is simultaneously entrained, yielding an increasingly homogeneous velocity field. In contrast, the single-hydrofoil system also exhibits higher wake velocities at higher frequencies, but its high-speed jet is biased toward the lower part of the channel, leaving the upper region with markedly lower velocities and a pronounced non-uniform distribution. Consequently, when assessing algal-bloom suppression in the single-hydrofoil system, it is necessary not only to consider whether the mean outlet velocity meets the inhibition threshold but also to examine the overall velocity field, ensuring that the upper water column satisfies the required conditions.
Table 6 lists the mean outlet velocities in the wake for each system at different frequencies. Relative to the algal-bloom suppression threshold of 0.15 m s−1, the multi-hydrofoil system produces a nearly uniform velocity distribution after the flow stabilizes, with the high-speed region spanning the entire cross-section. At 0.10 Hz, the threshold velocity is attained across the full section. In contrast, the single-hydrofoil system exhibits pronounced non-uniformity: high velocities are concentrated in the lower region, while velocities in the upper region remain low. At 0.15 Hz, only the lower part meets the suppression criterion, whereas the upper part remains below the threshold. Even when the frequency is raised to 0.25 Hz, the upper region still fails to satisfy the requirement, indicating an inherent limitation in achieving full-section bloom suppression.
Thanks to a nearly uniform wake-velocity distribution, the multi-hydrofoil system can exceed the suppression threshold across the entire cross-section even at low operating frequencies, enabling comprehensive algal-bloom control and making it suitable for applications requiring whole-field velocity enhancement and strict bloom suppression. In contrast, the single-hydrofoil system produces a markedly non-uniform wake: high velocities are concentrated in the lower flow region, while those in the upper region remain low, preventing the threshold from being met across the full section. Consequently, this configuration is better suited for improving circulation and controlling blooms in localized water areas.

5. Conclusions

Using an overset mesh approach, this study investigates the effects of heave amplitude and chord length on the hydrodynamic performance of multi-hydrofoil and single-hydrofoil systems. Guided by the algal-bloom suppression velocity threshold of 0.15 m s−1, the suitability of each system for whole-field and localized water-body management is examined. The main conclusions are as follows:
  • Multi-hydrofoil system performance: The multi-hydrofoil system exhibits a consistent enhancement in performance. As chord length and heave amplitude increase, the size and strength of the shed vortices grow accordingly, while their vorticity dissipation rate decreases. This enables thrust to be converted more efficiently into propulsion, thereby improving pumping efficiency. When the chord length is 0.18W and the heave amplitude is 0.7c, the maximum efficiency reaches 54.5%.
  • Single-hydrofoil system performance: The single-hydrofoil system shows a distinct performance peak. Although larger chord lengths and amplitudes generate higher thrust, vortex deflection causes the momentum to deviate from the streamwise direction, with most of the energy dissipated near the wall. As a result, pumping efficiency follows a “rise–then–fall” trend. The highest efficiency of 28.7% is achieved when the chord length is 0.16W and the heave amplitude is 0.6c.
  • Applicability to algal-bloom containment: Based on the suppression threshold of 0.15 m s−1, the multi-hydrofoil system reaches the required velocity across the entire flow section at only 0.10 Hz due to its uniform wake-velocity distribution. It is therefore suitable for large-scale applications requiring full-section velocity enhancement and whole-water-body algal-bloom suppression. In contrast, the single-hydrofoil system produces high velocities primarily in the lower part of the flow field; even at 0.25 Hz, the upper region remains below the threshold. Accordingly, it is more appropriate for localized circulation improvement and targeted inhibition of algal aggregation.
This study examined how heave amplitude and chord length affect the performance of multi-hydrofoil and single-hydrofoil systems and evaluated the suitability of each system under various operating conditions. The results demonstrate that pumping performance is governed primarily by the evolution of vortices in the wake. To date, all simulations have been based on a two-dimensional rigid hydrofoil model. Future work should extend the analysis to three-dimensional flow and account for hydrofoil flexibility. In a three-dimensional flow field, the generation of transverse and tip vortices will significantly alter the evolution of the vortex system, while a flexible hydrofoil will produce flow characteristics near its surface that differ markedly from those of a rigid foil. Therefore, future investigations will focus on the combined influence of three-dimensional effects and hydrofoil flexibility on the flow field and hydrodynamic performance, providing a more accurate theoretical basis for optimizing bionic pumping systems.

Author Contributions

Conceptualization, E.H. and X.W.; methodology, X.W.; software, X.W.; validation, E.H., X.W. and Y.L.; formal analysis, S.L.; investigation, Y.L.; resources, X.W.; data curation, S.L.; writing—original draft preparation, X.W.; writing—review and editing, E.H.; visualization, S.L.; supervision, X.W.; project administration, Y.L.; funding acquisition, E.H. All authors have read and agreed to the published version of the manuscript.

Funding

This research was funded by the Zhejiang Provincial Key Research and Development Project (Grant No. 2021C03019).

Data Availability Statement

Data are contained within the article.

Acknowledgments

The authors gratefully thank the Zhejiang Provincial Key Research and Development Project for their financial support.

Conflicts of Interest

The authors declare no conflicts of interest.

References

  1. Liang, C.; Wang, J.; Zhang, X.; Liu, L.; Wu, F. Research on Simulation of Drainage in Plain River Network Areas Based on Hydrological and Hydrodynamic Models. China Rural. Water Hydropower 2025, 67, 17–23. [Google Scholar]
  2. Liao, Y.; LI, D.; Li, Y.; Su, Y.; Fan, Z. Research on Hydrodynamic Regulation Schemes for Water Environment Improvement in Plain Urban River Networks. Hydro-Sci. Eng. 2024, 46, 14–23. [Google Scholar]
  3. Wang, T.; Hou, J.; Luan, G.; Shen, T.; Zhang, R.; Shen, J.; Sun, X. Study on Response Relationship between Hydrodynamic Optimization Scheduling and Water Environment Improvement in Plain River Networks. J. Hydroelectr. Eng. 2024, 43, 98–111. [Google Scholar]
  4. Li, Y.; Pan, Y.; Zhang, L.; Chen, X.; Qin, T.; Lv, L.; Li, S. Apparent Pollution Evaluation and Source Analysis of River Water Bodies in Thetidal River Network Area of the Plains. J. Environ. Eng. 2023, 13, 1839–1848. [Google Scholar]
  5. Hua, E.; Chen, W.; Tang, S.; Xie, R.; Guo, X.; Xu, G. Water Pushing Flow Characteristics of Flapping Hydrofoil Device in Small River. Trans. Chin. Soc. Agric. Mach. 2022, 53, 154–162. [Google Scholar]
  6. Hua, E.; Wu, X.; Xiang, M.; Li, S.; Lin, Y. The Hydrodynamic Performance of Multi-Hydrofoil Formations in Plain River Networks Based on Fish Schooling Dynamics. Phys. Fluids 2025, 37, 087134. [Google Scholar] [CrossRef]
  7. Lu, K.; Xie, Y.H.; Zhang, D. Numerical Study of Large Amplitude, Nonsinusoidal Motion and Camber Effects on Pitching Airfoil Propulsion. J. Fluids Struct. 2013, 36, 184–194. [Google Scholar] [CrossRef]
  8. Xiong, Z.; Liu, X. Numerical Investigation on Evolutionary Characteristics of the Leading-Edge Vortex Induced by Flapping Caudal Fin. Phys. Fluids 2019, 31, 125117. [Google Scholar] [CrossRef]
  9. Krishnadas, A.; Ravichandran, S.; Rajagopal, P. Analysis of Biomimetic Caudal Fin Shapes for Optimal Propulsive Efficiency. Ocean Eng. 2018, 153, 132–142. [Google Scholar] [CrossRef]
  10. Esfahani, J.A.; Barati, E.; Karbasian, H.R. Fluid Structures of Flapping Airfoil with Elliptical Motion Trajectory. Comput. Fluids 2015, 108, 142–155. [Google Scholar] [CrossRef]
  11. Kelly, J.M.; Khalid, M.S.U.; Han, P.; Dong, H. Geometric Characteristics of Flapping Foils for Enhanced Propulsive Efficiency. J. Fluids Eng. 2023, 145, 061104. [Google Scholar] [CrossRef]
  12. Wei, C.; Hu, Q.; Li, S.; Shi, X. Hydrodynamic Interactions and Wake Dynamics of Fish Schooling in Rectangle and Diamond Formations. Ocean Eng. 2023, 267, 113258. [Google Scholar] [CrossRef]
  13. Daghooghi, M.; Borazjani, I. The Hydrodynamic Advantages of Synchronized Swimming in a Rectangular Pattern. Bioinspir. Biomim. 2015, 10, 056018. [Google Scholar] [CrossRef] [PubMed]
  14. Ambolkar, M.; Arumuru, V. Propulsive Performance of a Pitching Foil in a Side-by-Side Arrangement with Auxiliary Pitching Foil. J. Fluids Struct. 2022, 110, 103537. [Google Scholar] [CrossRef]
  15. Dewey, P.A.; Quinn, D.B.; Boschitsch, B.M.; Smits, A.J. Propulsive Performance of Unsteady Tandem Hydrofoils in a Side-by-Side Configuration. Phys. Fluids 2014, 26, 041903. [Google Scholar] [CrossRef]
  16. Gungor, A.; Khalid, M.S.U.; Hemmati, A. Classification of Vortex Patterns of Oscillating Foils in Side-by-Side Configurations. J. Fluid Mech. 2022, 951, A37. [Google Scholar] [CrossRef]
  17. Kurt, M.; Eslam Panah, A.; Moored, K.W. Flow Interactions Between Low Aspect Ratio Hydrofoils in In-Line and Staggered Arrangements. Biomimetics 2020, 5, 13. [Google Scholar] [CrossRef]
  18. Huera-Huarte, F.J. Propulsive Performance of a Pair of Pitching Foils in Staggered Configurations. J. Fluids Struct. 2018, 81, 1–13. [Google Scholar] [CrossRef]
  19. Wu, X.; Li, Q. Reviews of Influences from Hydrodynamic Conditions on Algae. Ecol. Environ. Sci. 2010, 19, 1732–1738. [Google Scholar]
  20. Wei, Z.; Jia, H.; Jiang, Q.; Meng, D.; Yang, S. Simulation Experiment of Phytoplankton Growth Induced by Flow Velocity in Rivers Replenished with Reclaimed Water. Chin. J. Environ. Eng. 2017, 11, 6540–6546. [Google Scholar]
  21. Cao, C.; Xu, Z.; Long, Y.; Zhu, H. Effect of Flow Velocity on Algal Bloom in Landscape Water Replenished with Reclaimed Water. China Water Wastewater 2023, 39, 65–69. [Google Scholar]
  22. Wang, L. Research on the Relevant Factors of the Algal Growth in Hydrodynamic Condition. Master’s Thesis, Chongqing University, Chongqing, China, 2006. [Google Scholar]
  23. Jiao, S. The Effects of Velocity of Glow to the Growth of Algae in Low Current Area of the Three Gorges. Master’s Thesis, Southwest University, Chongqing, China, 2007. [Google Scholar]
  24. Li, F.; Gao, Y.; Zhang, H.; Xiao, Y.; Chen, L. Simulation Experiment on the Effect of Flow Velocity on Phytoplankton Growth and Composition. J. Lake Sci. 2015, 27, 44–49. [Google Scholar]
  25. Zhang, H.; Chen, R.; Li, F.; Chen, L. Effect of Flow Rate on Environmental Variables and Phytoplankton Dynamics: Results from Field Enclosures. Chin. J. Ocean. Limnol. 2015, 33, 430–438. [Google Scholar] [CrossRef]
  26. Zhu, Y.; Zhang, H.; Li, F.; Chen, L. Enclosure Experiments About the Hydrodynamics Effects on the Plankton. Environ. Sci. 2010, 31, 69–75. [Google Scholar]
  27. Hua, E.; Su, Z.; Xie, R.; Chen, W.; Tang, S.; Luo, H. Optimization and Experimental Verification of Pivot Position of Flapping Hydrofoil. J. Hydroelectr. Eng. 2023, 42, 128–138. [Google Scholar]
  28. Hua, E.; Qiu, L.; Xie, R.; Su, Z.; Zhu, W. Comparative Analysis of the Hydrodynamic Performance of Dual Flapping Foils with In-Phase and Out-of-Phase Oscillations. Water 2023, 15, 3275. [Google Scholar] [CrossRef]
  29. Zhang, Y.; Zhang, Y.; Zhang, L.; Gao, Y.; Zhao, Y. The Influence of Lake Hydrodynamics on Blue Algal Growth. China Environ. Sci. 2007, 27, 707–711. [Google Scholar]
  30. Song, Y.; Zhang, L.L.; Li, J.; Chen, M.; Zhang, Y. Mechanism of the Influence of Hydrodynamics on Microcystis Aeruginosa, a Dominant Bloom Species in Reservoirs. Sci. Total Environ. 2018, 636, 230–239. [Google Scholar] [CrossRef]
  31. Lin, L.; Zhu, W.; Cheng, F.L.; Wang, T.; Tan, X. Effects of Continuous Water Flow on Growth of the Microcystis Aeruginosa under High Nutrient Levels. Energy Procedia 2012, 17, 1793–1797. [Google Scholar] [CrossRef]
  32. He, G.; Xie, H.; Wang, W.; Mo, W.; Yang, H. Influence of Wing-in-Surface-Effect on Power Extraction of Parallel Oscillating Hydrofoils. J. Vib. Shock 2023, 42, 58–64+86. [Google Scholar]
  33. Ding, H.; Song, B.; Tian, W. Exploring Propulsion Performance Analysis of Bionic Flapping Hydrofoil. J. Northwest. Polytech. Univ. 2013, 31, 150–156. [Google Scholar]
  34. Du, X.; Zhang, Z. Numerical Analysis of Influence of Four Flapping Modes on Propulsion Performance of Underwater Flapping Foils. Eng. Mech. 2018, 35, 249–256. [Google Scholar]
  35. Schouveiler, L.; Hover, F.S.; Triantafyllou, M.S. Performance of Flapping Foil Propulsion. J. Fluids Struct. 2005, 20, 949–959. [Google Scholar] [CrossRef]
Figure 1. Hydrofoil geometric model.
Water 17 03012 g001
Figure 2. Hydrofoil system configurations and motion modes: (a) Multi-hydrofoil system configuration; (b) Single-hydrofoil system configuration; (c) Hydrofoil motion at different phases.
Water 17 03012 g002
Figure 3. Mesh generation and boundary condition setup.
Water 17 03012 g003
Figure 4. Validation of the numerical method.
Water 17 03012 g004
Figure 5. Influence of different heave amplitudes and chord lengths on the mean thrust and thrust coefficient of the multi-hydrofoil system: (a) mean thrust; (b) mean thrust coefficient.
Water 17 03012 g005
Figure 6. Influence of different heave amplitudes and chord lengths on the mean pressure rise and flow rate of the multi-hydrofoil system: (a) mean pressure rise; (b) mean flow rate.
Water 17 03012 g006
Figure 7. Influence of different heave amplitudes and chord lengths on the mean input power of the multi-hydrofoil system.
Water 17 03012 g007
Figure 8. Influence of different heave amplitudes and chord lengths on the pumping efficiency of the multi-hydrofoil system.
Water 17 03012 g008
Figure 9. Vorticity contours of the multi-hydrofoil system at successive time instants: (a) Case A: c = 0.14W, hmax = 0.4c; (b) Case B: c = 0.18W, hmax = 0.4c; (c) Case C: c = 0.18W, hmax = 0.7c.
Water 17 03012 g009
Figure 10. Influence of different heave amplitudes and chord lengths on the mean thrust and thrust coefficient of the single-hydrofoil system: (a) mean thrust; (b) mean thrust coefficient.
Water 17 03012 g010
Figure 11. Influence of different heave amplitudes and chord lengths on the mean pressure rise and flow rate of the single-hydrofoil system: (a) mean pressure rise; (b) mean flow rate.
Water 17 03012 g011
Figure 12. Influence of different heave amplitudes and chord lengths on the mean input power of the single-hydrofoil system.
Water 17 03012 g012
Figure 13. Influence of different heave amplitudes and chord lengths on the pumping efficiency of the single-hydrofoil system.
Water 17 03012 g013
Figure 14. Vorticity contours of the multi-hydrofoil system at successive time instants: (a) Case A: c = 0.25W, hmax = 0.4c; (b) Case B: c = 0.16W, hmax = 0.4c; (c) Case C: c = 0.16W, hmax = 0.6c.
Water 17 03012 g014
Figure 15. Velocity contours for the multi-hydrofoil and single-hydrofoil systems at different frequencies: (a) Multi-hydrofoil system; (b) Single-hydrofoil system.
Water 17 03012 g015
Table 1. Mesh independence verification.
Mesh CountForeground Mesh CountBackground Mesh CountMean Thrust Coefficient
68,77355,56913,2046.17
79,01257,24921,7636.98
111,89658,62753,2695.89
232,45264,093168,3595.83
Table 2. Time-step independence verification.
Time StepMean Thrust Coefficient
Δ t = T / 10 9.21
Δ t = T / 50 8.07
Δ t = T / 100 5.89
Δ t = T / 1000 5.76
Table 3. Validation of the numerical method for the multi-hydrofoil system.
Frequency (Hz)Simulation Velocity (m/s)Experimental Velocity (m/s)
0.200.0460.05
0.400.010.096
0.600.1430.147
0.800.2110.205
Table 4. Chord length and heave amplitude settings for the three representative cases of the multi-hydrofoil system.
CaseChord LengthHeave Amplitude
A0.14W0.4c
B0.18W0.4c
C0.18W0.7c
Table 5. Chord length and heave amplitude settings for the three representative cases of the single-hydrofoil system.
CaseChord LengthHeave Amplitude
A0.25W0.4c
B0.16W0.4c
C0.16W0.6c
Table 6. Variation of mean outlet velocity with frequency for each system.
Multi-/Single-Hydrofoil SystemFrequency (Hz)Mean Outlet Velocity (m/s)
Multi-hydrofoil system0.050.133
0.100.268
0.150.413
0.200.552
0.250.691
Single-hydrofoil system0.050.049
0.100.096
0.150.144
0.200.192
0.250.241
Disclaimer/Publisher’s Note: The statements, opinions and data contained in all publications are solely those of the individual author(s) and contributor(s) and not of MDPI and/or the editor(s). MDPI and/or the editor(s) disclaim responsibility for any injury to people or property resulting from any ideas, methods, instructions or products referred to in the content.