Article

Integrating Eco-Index and Hydropower Optimization for Cascade Reservoir Operations in the Lancang–Mekong River Basin

1
ZJU-UIUC Institute, International Campus, Zhejiang University, Haining 314400, China
2
College of Civil Engineering and Architecture, Zhejiang University, Hangzhou 310058, China
*
Author to whom correspondence should be addressed.
Water 2025, 17(20), 2966; https://doi.org/10.3390/w17202966
Submission received: 27 August 2025 / Revised: 13 October 2025 / Accepted: 14 October 2025 / Published: 15 October 2025
(This article belongs to the Section Water Resources Management, Policy and Governance)

Abstract

This study develops a coupled hydropower–ecological optimization model to balance energy production and ecosystem sustainability. The ecological objective is quantified by a composite Eco-Index, derived via Principal Component Analysis from seven key parameters of 32 Indicators of Hydrologic Alteration, enhancing representativeness while reducing computational complexity. Hydrological years are classified into wet, normal, and dry types using the Standardized Runoff Index and runoff quantiles, showing that wet years exhibit the strongest hydropower–ecology coupling, followed by normal and dry years. The optimized average annual hydropower revenues are 3.75 billion USD in wet years, 3.10 billion USD in normal years, and 2.70 billion USD in dry years, with average EI values being 0.35, 0.27 and 0.26, respectively. Spatial analysis identifies Xiaowan and Nuozhadu reservoirs as critical control points sensitive to hydrological variability. Moreover, optimization substantially enhances system resilience and reduces vulnerability. These results demonstrate that coordinated cascade reservoir operation can improve system robustness while signaling a caveat for careful trade-offs between economic and ecological objectives.

1. Introduction

International river basins are increasingly confronted with the complex challenge of balancing competing interests for water resource management, including but not limited to agricultural water use, municipal water supply, energy production and ecosystem integrity [1,2]. With intensifying climate variability and escalating socio-economic pressures, transboundary rivers have emerged as hotspots of resource competition, geopolitical tension, and environmental risk [3,4]. For example, hydropower development on the Nile has triggered disputes between upstream Ethiopia and downstream Egypt, while the Mekong River faces tensions among multiple riparian countries over water allocation and dam construction [5,6]. Over the past few decades, rapid hydropower expansion—particularly in the upper Lancang region—has significantly altered the natural flow regime, raising serious concerns about ecological degradation, sediment disruption, and reduced resilience in downstream ecosystems [7,8]. Rising demand for low-carbon electricity further exacerbates allocation conflicts in cascade reservoir systems with multiple, often conflicting objectives [9,10]. To address these challenges, increasing attention has been given worldwide to the development and optimization of integrated reservoir operation strategies, aiming not only to maximize economic benefits but also to safeguard ecological health and enhance system resilience under hydroclimatic, socioeconomic and environmental uncertainties [11,12]. Building on these approaches, this study focuses on the Lancang–Mekong River Basin, integrating hydropower and ecological objectives to evaluate system performance under variable hydrological conditions.
Despite significant progress in multi-objective reservoir operation models, most existing approaches continue to prioritize hydropower production or economic gains, with limited consideration of ecological objectives. In many studies, ecological flows have been incorporated primarily through simplified formulations, most commonly minimum flow constraints; however, such approaches overlook the temporal variability and ecological functions that are fundamental to sustaining aquatic ecosystems [13]. This reductionist approach overlooks critical aspects of ecological responses, including the timing, frequency, duration, and rate of change of flow events. Furthermore, climate change has amplified the frequency and intensity of hydrological extremes such as droughts and floods, placing additional stress on water resource systems [14,15]. While some recent studies have incorporated non-stationary hydrological inputs, very few have evaluated system performance under extreme conditions or quantified the resilience of coupled water–energy–ecology systems [16,17]. Additionally, conventional ecological indicators often rely on high-dimensional, redundant datasets. For instance, the widely used Indicators of Hydrologic Alteration (IHA) include more than 30 metrics, making explicit integration of such indicators into optimization frameworks a daunting challenge [18]. The resilience assessment of the system under extreme conditions is also indispensable, which is of great significance in adaptive management and long-term planning [19].
Beyond the Mekong Basin, similar trade-offs between hydropower development and ecological integrity have been observed in other major river systems worldwide. In the Danube Basin [20], transboundary cooperation frameworks have been established to reconcile hydropower, navigation, and biodiversity conservation across multiple riparian countries. While the Amazon highlights the ecological vulnerability of tropical rivers to dam-induced flow alterations, where large-scale hydropower expansion has been demonstrated to threaten biodiversity and ecosystem services at the basin scale [21]. Castello et al. have emphasized the need for cumulative impact assessments and basin-scale planning to reduce adverse ecological and social consequences [22]. Lessons from these basins suggest that the Principal Component Analysis (PCA)-based Eco-Index and Reliability–Resilience–Vulnerability (RRV)-based resilience framework proposed in this study hold potential for transferability to other transboundary rivers. Therefore, future research should integrate comparative analyses across multiple river systems, providing broader insights for sustainable water–energy–ecology governance under hydrological uncertainty. To address these challenges, researchers have proposed a variety of frameworks and indicators. Among them, the IHA provides a quantitative basis to evaluate changes in flow regimes, covering five groups of metrics (i.e., magnitude, timing, frequency, duration, rate of change) [23]. However, the high dimensionality and redundancy among indicators hinder directly incorporating it in optimization models. PCA has been effectively used to reduce the dimensionality of ecological metrics and to extract key composite indicators [24]. The Eco-Index (EI) obtained through PCA can retain ecological significance while simplifying the model structure. In addition, the Standardized Runoff Index (SRI) offers a statistical framework to characterize hydrological variability, allowing classification of wet, dry, and normal years based on runoff anomalies [25,26]. This provides a foundation for identifying extreme years and testing the robustness of reservoir operation strategies under variable water availability. The RRV framework has become a standard approach for evaluating water system performance under stress. It captures three critical dimensions: the probability of meeting targets (reliability), the speed of recovery from failure (resilience), and the magnitude of failure (vulnerability) [23,24,27,28]. Building upon the coupled hydropower–EI model, this study integrates these approaches and metrics into a unified analytical framework tailored to the specific context of the Lancang–Mekong River Basin, with the aim of simultaneously quantifying the relationship between system operational performance and ecological flow variations, and evaluating the reliability, resilience, and vulnerability of the system for both long-period and extreme-year scenarios, thereby providing a robust decision-making basis for sustainable reservoir operation.
In this paper, we develop an integrated model for the Lancang–Mekong River Basin (LMRB) and code it up using the General Algebraic Modeling System (GAMS, https://www.gams.com, accessed on 26 August 2025), a widely used optimization platform, to explicitly couples hydropower objectives with an EI. Using a 40-year hydrological series (1980–2019), the SRI is applied to identify representative wet, dry, and normal years, while the RRV framework evaluates both average system performance and robustness under extreme conditions. The main contributions of this study are: (1) A comprehensive EI is developed by applying PCA to 32 IHA metrics, which is then used as an explicit constraint in a multi-objective optimization model to ensure ecological health in optimized decisions. (2) A hydropower–ecological optimization framework is set up and applied to both long period and SRI-identified extreme years, revealing the long-term trade-offs between energy production and ecological objectives, as well as the system responses under extreme hydrological conditions. (3) A systematic resilience assessment is performed using the RRV framework, allowing the model to evaluate not only average system performance but also robustness under climate-induced hydrological extremes. The integrated modeling framework proposed in this study offers a scientific foundation and practical reference for improving reservoir operation strategies, enhancing ecological sustainability, and strengthening climate resilience in complex transboundary river systems such as the LMRB.

2. Study Area and Data

2.1. Overview of the Basin and Cascade Reservoir System

The Lancang–Mekong River Basin (LMRB) spans six Asian countries, including China, Myanmar, Laos, Thailand, Cambodia, and Vietnam, as shown in Figure 1. It extending approximately 4909 km in length and draining a catchment area of over 790,000 km2 [29]. As one of the most important transboundary river systems in the world, the LMRB sustains the livelihoods, food security, and energy needs of more than 60 million people [30]. The upper reaches of the river, known as the Lancang River within China, originates from the Tanggula Mountains on the Qinghai–Tibet Plateau at an elevation exceeding 5000 m. It flows through Qinghai, Tibet, and Yunnan provinces, traversing diverse climatic and ecological zones before entering Laos and becoming the Mekong River [31,32]. Despite accounting for only 21% of the total basin area [33], the Lancang sub-basin contributes disproportionately to downstream dry-season flows, with its share reaching up to 35% [34], thereby emphasizing its pivotal hydrological and ecological role in sustaining downstream systems.
The Lancang River is characterized by steep topography, high runoff yield, and substantial hydropower potential, making it a focal area for large-scale cascade hydropower development [35,36]. Over the past two decades, a series of major reservoirs and run-of-river stations, including including Xiaowan, Nuozhadu, Dachaoshan, and Jinghong, have been constructed, forming a tightly regulated cascade reservoir [37]. This infrastructure has played a crucial role in providing low-carbon electricity, supporting economic development, and improving regional flood control. However, the intensification of regulation has also raised concerns about altered flow regimes, sediment retention, and ecological degradation downstream [38]. The operations of the Lancang cascade have thus become central to regional water governance and ecological sustainability, particularly under the compounded pressures of climate change, rising water demand, and geopolitical factors.
Hydrologically, the LMRB exhibits a pronounced monsoonal climate, with approximately 85% of annual precipitation occurring during the wet season (May–October), and a markedly dry season from November to April [39]. This seasonal asymmetry profoundly influences both hydrological processes and ecosystem functioning across the basin. Many endemic aquatic species, particularly long-distance migratory fish such as Probarbus jullieni and Henicorhynchus [2,40], rely on predictable flood pulses for spawning, accessing floodplain habitats, and completing critical stages of their life cycles. Alterations to the magnitude, timing, frequency, or duration of these flows can lead to the loss of ecological connectivity, reduced reproductive success, and long-term declines in biodiversity [41,42]. Preserving natural flow variability is thus essential to maintain the ecological integrity and adaptive capacity of the river system.
To better understand the trade-offs between hydropower operations and ecological flow requirements, an ecological monitoring node was established on the lower Lancang River, downstream of the last hydropower station on the Lancang hydropower cascade, Jinghong, and before the river flows across the China–Myanmar border. This node serves as a key point for assessing the impacts of cascade reservoir regulation on flow variability and its cascading effects on aquatic habitats, fish migration corridors, and riparian ecosystems in the lower reaches of the river. It provides an empirical basis for analyzing the ecological consequences of upstream cascade reservoir operations and supports the development of integrated, ecologically informed water management strategies across the transboundary basin.

2.2. Data Sources and Processing

This study integrates multiple data sources, including hydrological records, hydropower infrastructure parameters, and ecological indicators, to construct a comprehensive evaluation framework.

2.2.1. Hydrological Data and Year Classification

Daily natural streamflow data from 1980 to 2019 at the upstream boundary of the Lancang cascade system were obtained from the hydrological simulations by Zhang et al. [43], using validated THREW model for the mainstem and major tributaries of the LMR. Based on annual average runoff (Q), hydrological years are categorized into three classes: dry years (Q < Q25), normal years (Q25 < Q < Q75), and wet years (Q75 < Q). Here, Q25 and Q75 refer to the 25th and 75th percentiles of the entire historical annual runoff series, providing a statistical basis to distinguish low, normal, and high-flow years for evaluating reservoir operations under varying hydrological conditions.
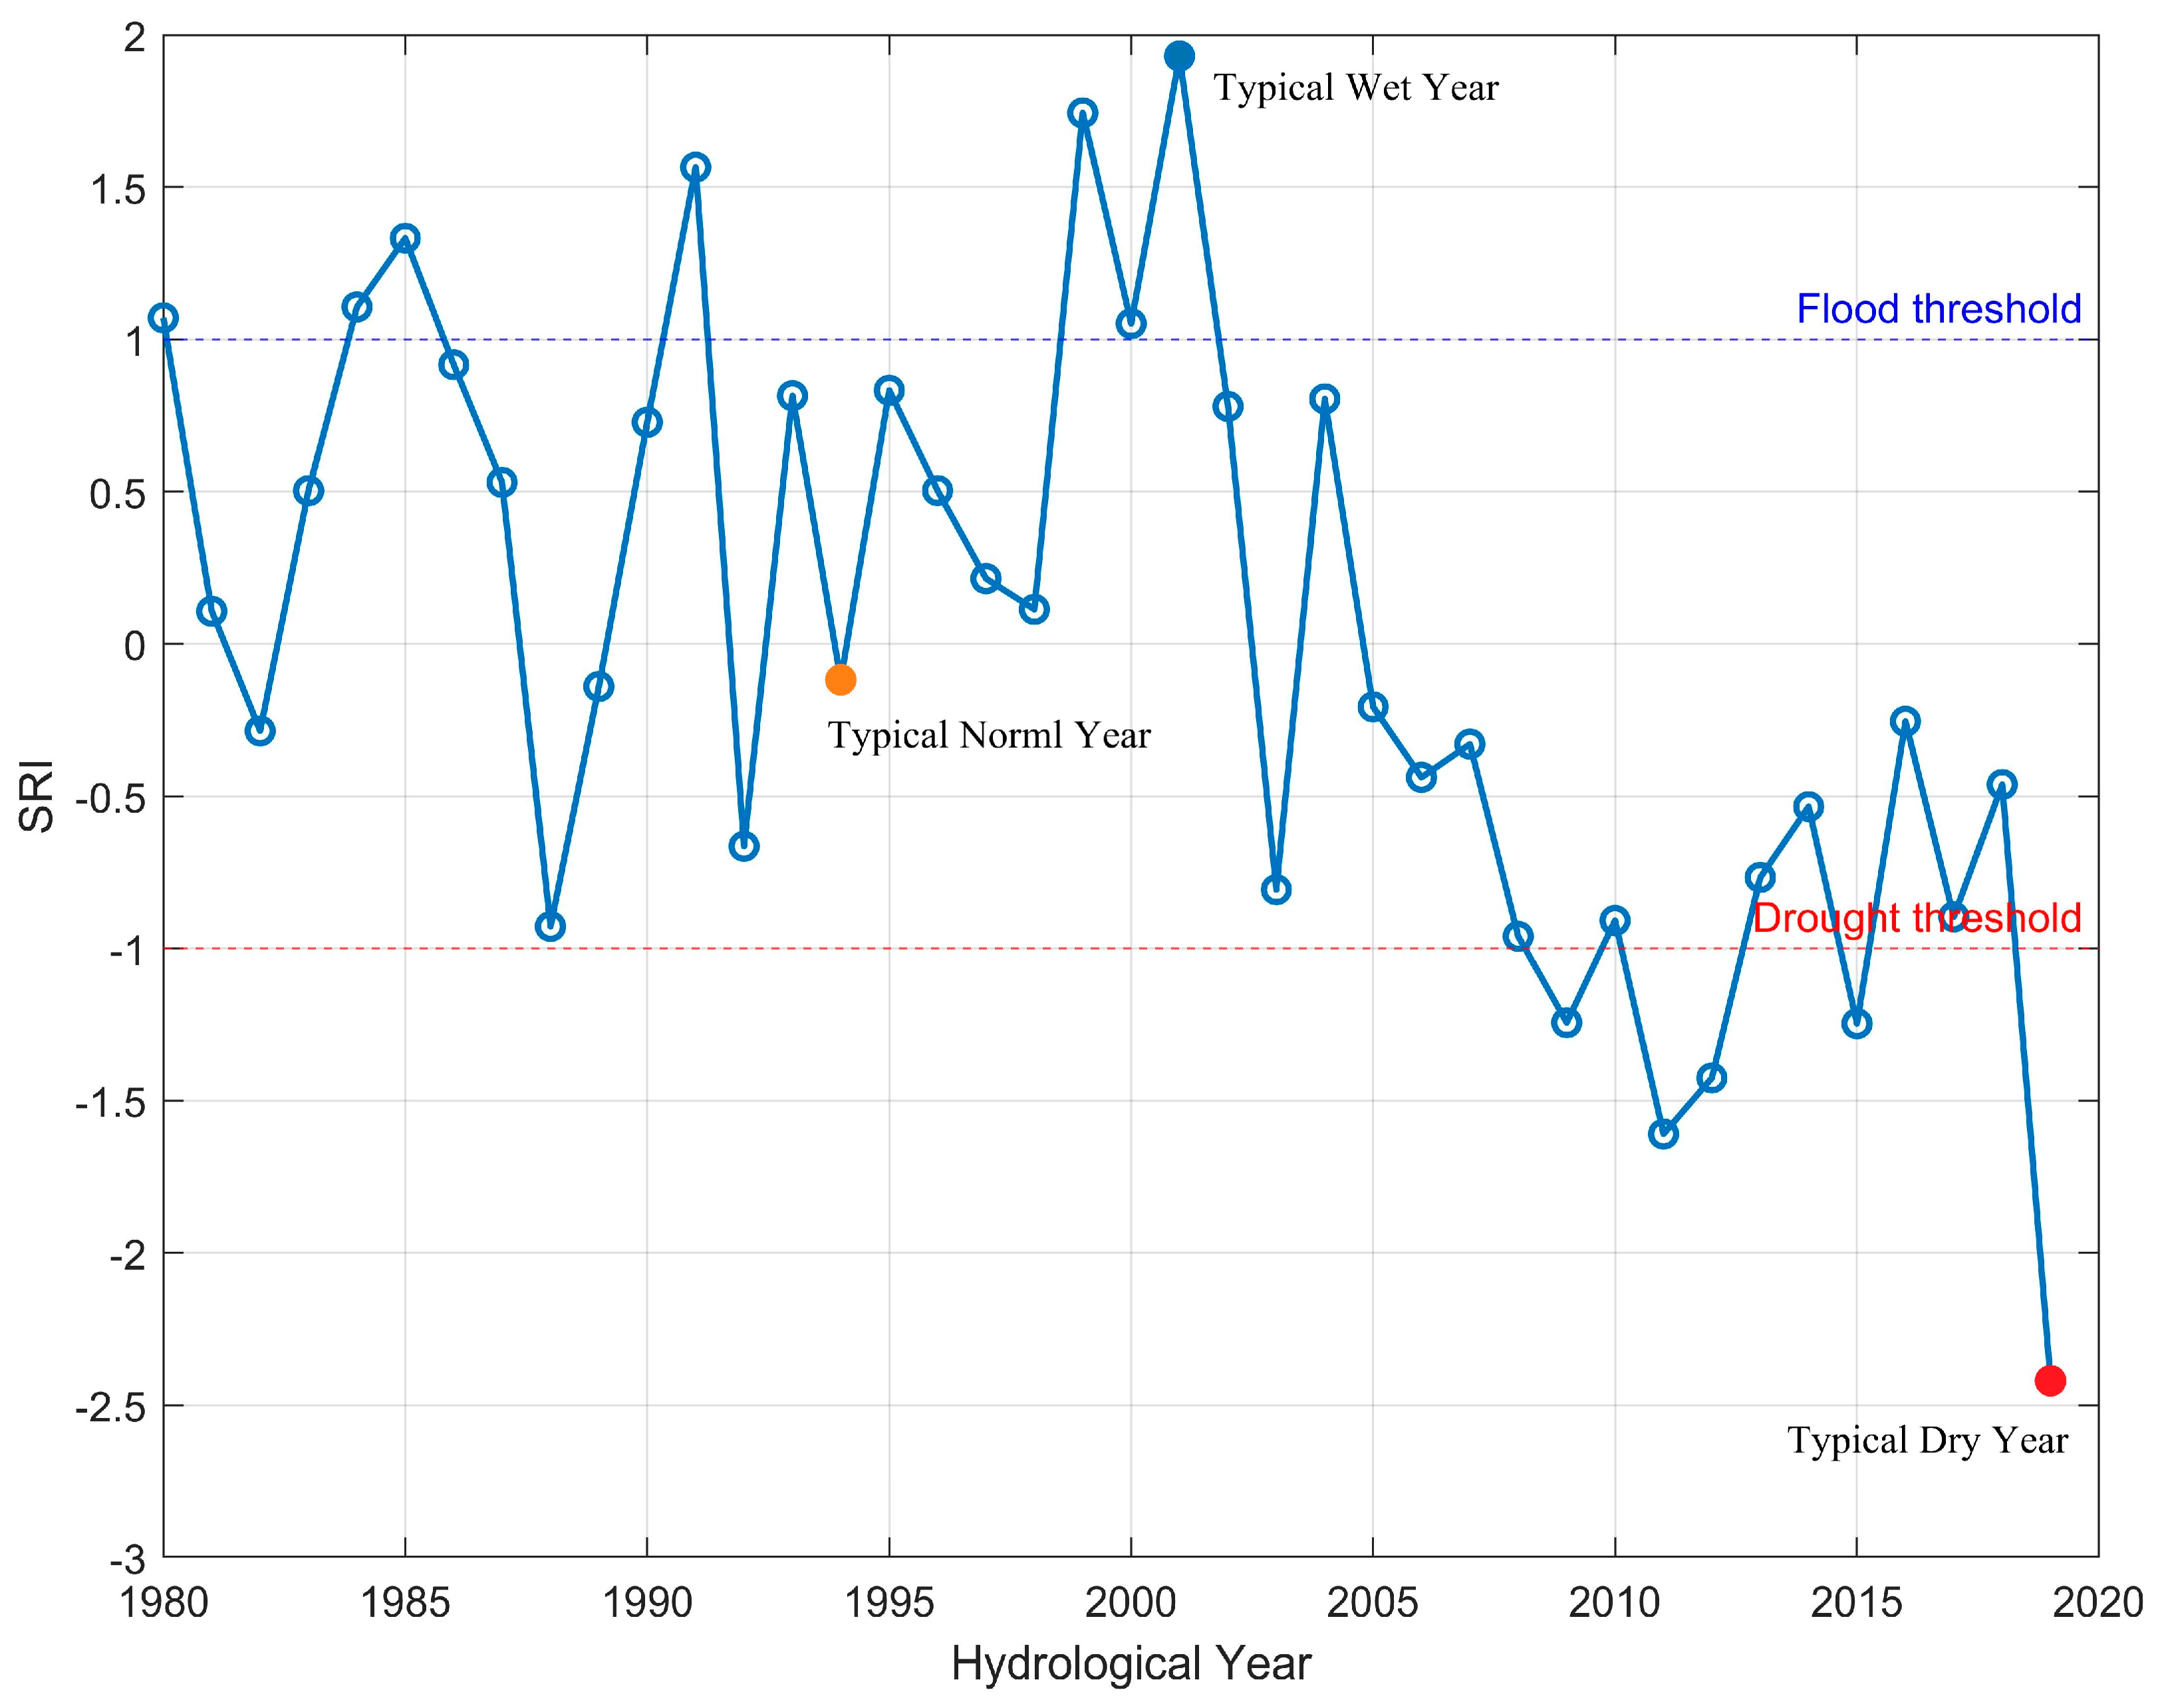
To identify typical extreme years, the Standardized Runoff Index (SRI) is applied to the runoff time series. The SRI is a statistical measure that standardizes annual runoff relative to its long-term mean and variability, allowing both unusually low (dry) and high (wet) years to be identified and classified in a consistent, comparable manner. The equations related to SRI are provided in Section 4.2. Based on this analysis, three representative years were chosen: dry year (2019), normal year (1994), and wet year (2001). These years were selected for focused analysis of system performance and resilience under extreme conditions.

2.2.2. Ecological Indicator (EI)

A total of 32 Indicators of Hydrologic Alteration (IHA) were calculated to capture the multi-dimensional characteristics of flow regimes. These indicators are grouped into five categories: magnitude of monthly flows, magnitude and duration of extreme conditions, timing of annual extreme flows, frequency and duration of high/low pulses, rate and frequency of flow changes [44]. Beyond their statistical significance, IHA indicators are closely linked to critical ecological processes [45], including aquatic habitat [46], riparian vegetation, terrestrial water supply, water temperature [47], and sediment [48] transport, and are therefore widely recognized as a fundamental set of hydrological metrics. However, the IHA framework involves 32 parameters altogether, some of which are redundant—for instance, the annual maximum 1-day, 3-day, and 7-day mean flows are strongly correlated. To reduce redundancy and avoid the risk of “curse of dimensionality” in optimization model, this study applied PCA to the IHA dataset. Based on the resulting components, a weighted composite EI was developed and incorporated as an explicit ecological objective in the optimization model. A lower EI value indicates that the flow regime is closer to its natural condition, suggesting small ecological disturbance.

2.2.3. Hydropower System Parameters

Technical parameters for each hydropower station in the cascade system were compiled from official design documents and various publications. Key parameters and paired data sets include total storage capacity, dead storage, reservoir storage-elevation relationships, reservoir storage-area relationships, installed hydropower capacity, firm power, generation efficiency, and other policy constraints. These data were used to parameterize the multi-reservoir optimization model.

3. Methodology

3.1. Eco-Index Construction Method

To quantitatively assess the degree of hydrological alteration induced by reservoir regulation, this study adopted the Indicators of Hydrologic Alteration (IHA) proposed by Richter et al. (1996) [49]. The IHA framework comprises 32 biologically relevant hydrological parameters, encompassing magnitude, frequency, duration, timing, and rate of change in streamflow. These indicators consist of 12 monthly flow parameters and 21 daily flow parameters, which can be further classified into six groups: (1) mean monthly flows, (2) magnitude and duration of annual extreme flows, (3) timing of annual extreme flows, (4) frequency and duration of high and low pulses, (5) rate and frequency of flow changes, and (6) zero-flow events. The IHA values are calculated for both natural and reservoir-regulated streamflow series.
Given the high degree of correlation and redundancy among the IHA parameters, PCA was applied to reduce dimensionality while preserving the most relevant hydrological information. PCA extracts principal components (PCs) representing the directions of maximum variance in the dataset, enabling the identification of key parameters that best capture streamflow pattern variability [50]. The Kaiser–Guttman criterion was employed, retaining only components with eigenvalues greater than 1 [51]. The selected parameters were assigned weights proportional to their contribution rates derived from the PCA loadings.
Based on the identified key hydrological parameters, a composite EI was constructed to represent the ecological objective in the optimization model. The EI quantifies the deviation of the regulated flow regime from the natural condition and is defined as [52]:
E I = p = 1 P w p A r , p A n , p A n , p
where p is the number of selected parameters, w p is the weight of the pth parameter derived from the PCA contribution rate, A r , p denotes the value of the pth parameter under reservoir-regulated conditions, and A n , p represents its value under natural conditions. Prior to aggregation, all parameters were normalized to eliminate unit inconsistencies. A lower EI value indicates a smaller deviation from the natural flow regime, implying a lower ecological impact of reservoir operations.

3.2. Multi-Objective Coupled Optimization Model

To coordinate hydropower production with ecological flow requirements, a multi-objective coupled optimization model was developed. The framework explicitly links the hydropower generation objective with the ecological objective quantified by EI constructed in Section 3.1. It incorporates hydropower production, water balance, reservoir storage dynamics, and ecological flow regulation into a unified decision-making framework, enabling the coordinated operation of cascade reservoirs. This formulation allows for a systematic assessment of the trade-offs between maximizing energy production and minimizing deviations from the natural flow regime.
The objective function of the model is to maximize hydropower revenue of the cascade, as follows:
M a x   R V H p = t = 1 T i = 1 I P r i c e t × P i , t
where R V H p is the total hydropower revenue over the scheduling horizon, and P r i c e t refers to electricity price in time interval t. The integer parameter I refers to the total number of hydropower stations in the cascade. The power output of the i-th hydropower station in time interval t, P i , t , is
P i , t = 9.81 η i H i , t Q i , t
where η i is the turbine-generator efficiency of hydropower station i; 9.81 is gravitational acceleration, m/s2; Q i , t is flow through turbine; and H i , t is the effective water head, which equals the difference between reservoir water elevation and tailwater elevation.
The optimization is subject to several hydrological and operational constraints. First, Equations (1) and (14), which are used in computing EI, are included in the model as constraints. Equation (3) specifies reservoir water balance,
V i , t + 1 = V i , t + I i , t R i , t E i , t
where V i , t + 1 and V i , t are reservoir storage at the beginning of the time intervals t + 1 and t, respectively; I i , t refers to inflow, R i , t total release, and E i , t evaporation loss, of the reservoir i.
Equation (4) states that reservoir storage in any time interval t has to be within the range of storage capacity V i m a x and dead storage V i m i n .
V i m i n V i , t V i m a x
Turbine discharge must be within the lower and upper limits of generation flow throw the i-th power station, Q i m i n and Q i m a x .
Q i m i n Q i , t Q i m a x
Hydropower output limits are specified as
P i m i n P i , t P i m a x
where P i m i n and P i m a x represent firm capacity and installed capacity of the i-th hydropower plant, respectively.

3.3. Resilience and Robustness Analysis Framework

To evaluate the adaptive capacity of ecological reservoir operation strategies under varying hydrological conditions, a resilience–robustness analysis framework was established. The framework incorporates the Reliability–Resilience–Vulnerability (RRV) indices, which have been widely applied in water resources system performance assessment [53]. These three indices are defined as follows [27,54].
Reliability (Rel) is defined as the probability that the system meets the target ecological flow requirements during the operation period.
R e l = 1 j = 1 M d ( j ) T
In Equation (9), M denotes the number of failure events, and d ( j ) represents the duration of the jth failure events, expressed as the number of months in that state. T is the total number of time steps.
Resilience (Res) represents the ability of the system to recover from a failure state to a satisfactory state:
R e s = j = 1 M d ( j ) M 1
Vulnerability (Vul) is defined as the average magnitude of deviation from the ecological flow target during failure time intervals:
V u l = 1 M t = 1 T L o b s t L s t d t L s t d ( t ) × H × L o b s t L s t d t
where L o b s t is the Standardized Runoff Index (SRI) at time interval t; and L s t d t are the SRI value and its corresponding threshold, which is −1 for drought years and 1 for wet years. M denotes the number of time steps during which the ecological flow target is not met.
H is the Heaviside function defined as:
H L o b s t L s t d t = 1 ,   L o b s t > L s t d t ( f a i l u r e )   0 ,   L o b s i t L s t d t ( s a t i s f i e d )
It ensures that only deviations occurring under unsatisfactory ecological flow conditions are counted, so that Vul reflects the average magnitude of failure deviations only.
To integrate these dimensions into a single measure of operational adaptability, the Integrated Sustainability–Resilience Index (ISRI) was extended to an ISRI–RRV composite index. The ISRI–RRV formulation combines the desirable properties of high reliability, rapid recovery, and low vulnerability into a single normalized metric:
I S R I R R V = R e l × R e s × ( 1 V u l ) 3
This formulation ensures that all three components, including system reliability, recovery capability, and low vulnerability, are jointly considered, and it penalizes poor performance in any single dimension. The robustness indicator I S R I R R V ranges from 0 to 1, with values closer to 1 indicating that the system exhibits stronger robustness in the corresponding year. Such systems can maintain stable and efficient performance under hydrological disturbances. Conversely, values approaching 0 suggest a higher risk of functional degradation, and in extreme cases, potential system instability.

4. Results and Discussions

4.1. Eco-Index Based on IHA Metrics

Thirty-two hydrologically relevant parameters specified in the Indicators of Hydrologic Alteration (IHA) framework were initially considered. Principal Component Analysis (PCA) was then applied to reduce the dimensionality of the IHA dataset and to identify key flow regime indicators for ecological assessment. Only components with eigenvalues (λ) greater than 1 were retained. In this study, the first seven principal components (PCs) explained 88.2% of the flow variation. The weight coefficient of each component ( ω P ) represents its contribution rate to the composite ecological index (EI), indicating the relative importance of each principal component. Table 1 summarizes the selected parameters and their corresponding weights used in the EI calculation.
Based on the PCA results, an integrated EI was constructed to quantitatively represent the degree of flow regime alteration. The EI is determined by those principle components identified by PCA, weighted by their respective contributions (Table 1):
E I = 0.49 × A r , 17 A n , 17 A n , 17 + 0.14 × A r , 4 A n , 4 A n , 4 + 0.1 × A r , 11 A n , 11 A n , 11 + 0.1 × A r , 24 A n , 24 A n , 24 + 0.06 × A r , 29 A n , 29 A n , 29     + 0.05 × A r , 32 A n , 32 A n , 32 + 0.04 × A r , 26 A n , 26 A n , 26
The formulation normalizes the values of each parameter before and after optimization, ensuring comparability across different hydrological metrics. The weighted summation effectively captures the cumulative impact of flow alterations on ecological health, with larger EI values indicating greater deviation from the natural flow regime and, hence, higher ecological stress.

4.2. Typical Years Identified with SRI Index

The Standardized Runoff Index (SRI), derived from annual runoff data across multiple gauging stations, serves as a normalized indicator of deviations from the long-term mean and provides an objective basis for classifying hydrological years into dry, normal, and wet categories. The procedure is as follows:
Assume the runoff amount at a given time scale is x, and F(x) is the probability density function following a Gamma distribution:
F x = 0 x 1 γ β Γ β x β 1 e x γ
where γ and β are the scale and shape parameters, respectively, with x > 0, γ > 0, and β > 0. These parameters can be estimated using the maximum likelihood method. Γ(β) denotes the Gamma function. Once the distribution is determined, the cumulative probability is transformed into a standardized normal variable to obtain the SRI value, which can be approximated as follows [55]:
SRI = W C 0 + C 1 t + C 2 t 2 1 + d 1 t + d 2 t 2 + d 3 t 3 , W = ln 1 F x 2 , 0 < F x 0.5 W C 0 + C 1 t + C 2 t 2 1 + d 1 t + d 2 t 2 + d 3 t 3 ,   W = ln 1 1 F x 2 , 0.5 < F x 1
In the above equation, F(x) is the cumulative distribution function. The constants are given as: C0 = 2.515517, C1 = 0.802853, C2 = 0.010328, d1 = 1.432788, d2 = 0.189269, and d3 = 0.001308. According to the Meteorological Drought Classification standard (GB/T 20481-2017) [56], the classification of SRI is consistent with that of the Standardized Precipitation Index (SPI). Thresholds of SRI values (−2, −1.5, −1, 1, 1.5, 2) correspond to extreme drought, severe drought, moderate drought, normal, moist, very moist, and extremely moist runoff conditions, respectively.
In Figure 2, the SRI was calculated over the study period to identify representative hydrological years reflecting extreme and average flow conditions. Based on the SRI values, three typical years were selected to represent dry year (2019), normal year (1994), and wet year (2001), respectively. These years correspond respectively to conditions characterized by significantly below-average runoff, near-average runoff, and above-average runoff, providing a comprehensive basis for assessing the system’s response under varying water availability.

4.3. Analysis of Optimization Scheduling Results over the Entire Period

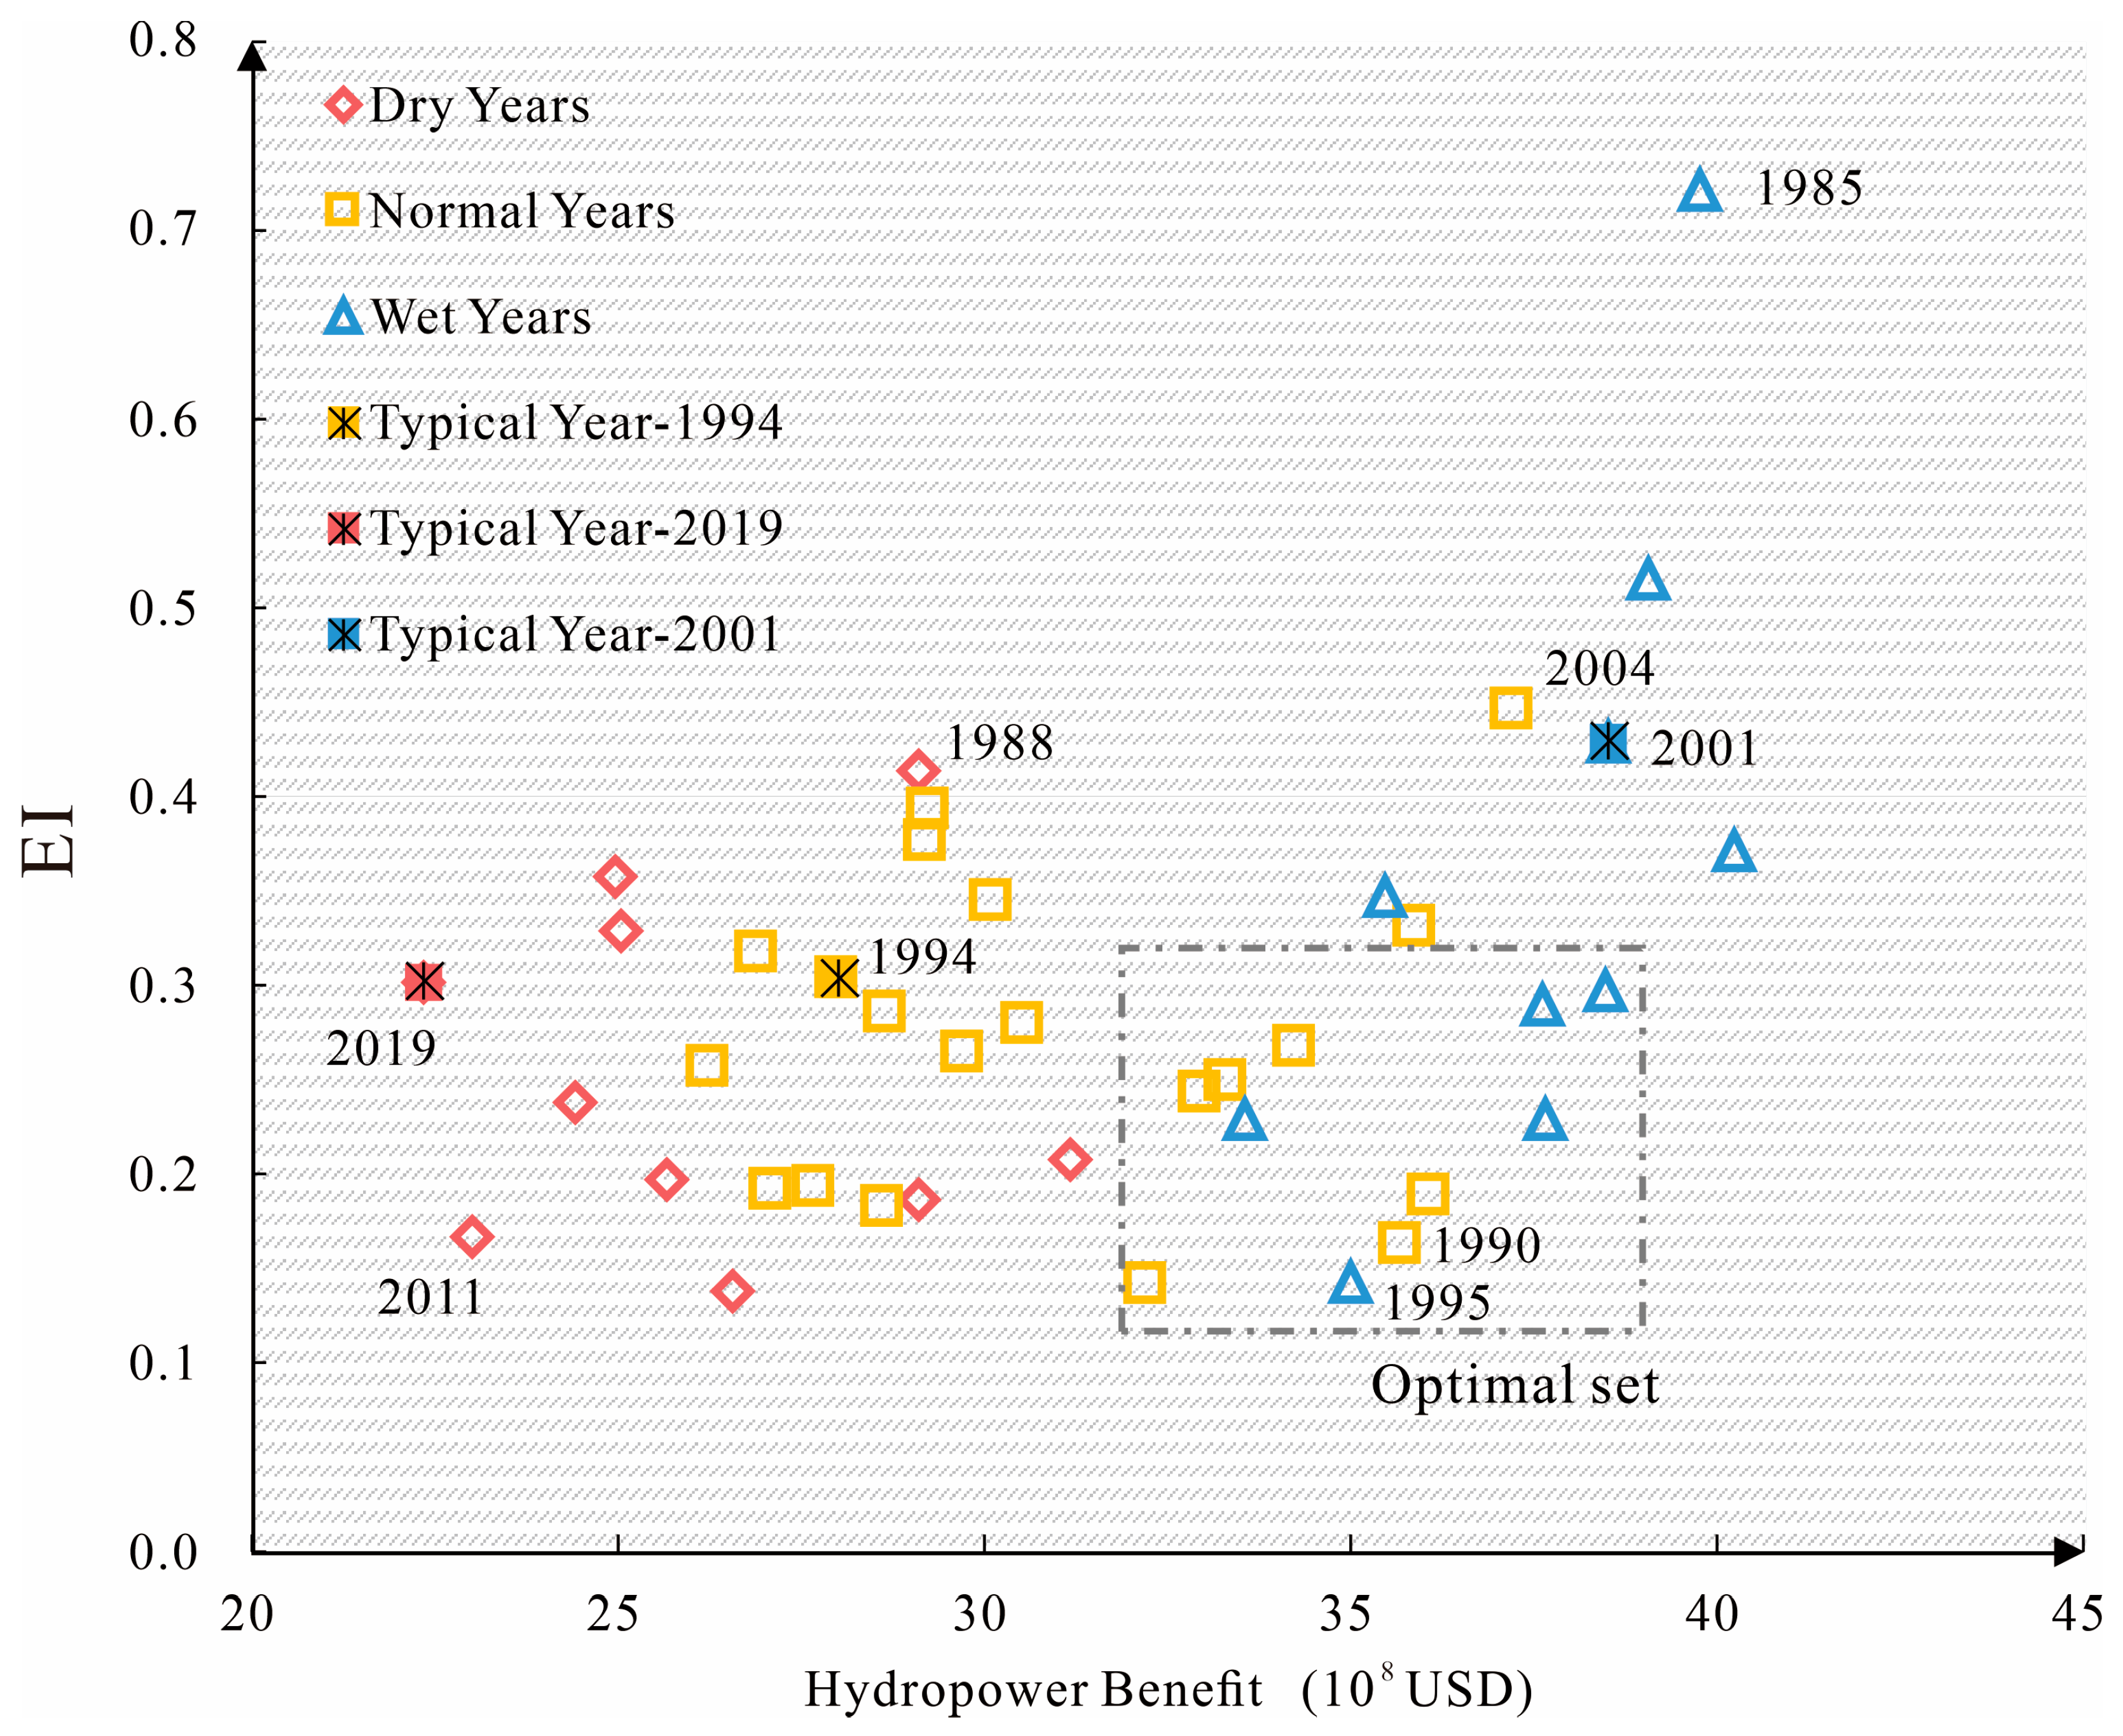
Figure 3 illustrates the relationship between hydropower revenue and EI across different hydrological year types. In this context, lower EI values indicate smaller ecological disturbance and thus better ecological outcomes, while higher hydropower benefits correspond to greater economic returns. Ideally, optimal solutions cluster in the lower-right region of the plot, representing a synergy of “high power generation with low ecological disturbance.”
On average, the EI value in a wet year is greater than that of a normal year, which is subsequently greater than that of a dry year. A more detailed analysis reveals significant differences in optimization outcomes across hydrological year types. In dry years (orange dots), most data points concentrate in the left, indicating relatively low hydropower benefits (below 30 × 108 USD) but relatively high EI values (above 0.2). This suggests that under water-scarce conditions, the system struggles to implement hydropower generation schedules, often compromising ecological objectives to satisfy minimum power generation requirements. In normal years (gray dots), the data points are more dispersed across the left half of the plot, while those in the right half resemble the distribution seen during wet years. This indicates a better balance between hydropower benefits and ecological alterations. For wet years (blue dots), the distribution is more uniform, with several data points located in the lower-right corner, exhibiting both high hydropower benefits (exceeding 32 × 108 USD) and low EI values (below 0.3). With high streamflow, wet years reduce trade-offs between energy production and ecological protection, since reservoirs can generate more electricity while still maintaining stable downstream releases. This surplus water provides greater operational flexibility, enabling managers to satisfy both power demand and ecological flow requirements more effectively. As a result, wet years offer critical opportunities to achieve a “win–win” outcome. Furthermore, the optimal set enclosed within the dashed box simultaneously achieves maximum hydropower revenue and minimum EI. These solutions represent the system’s optimal operating strategies under current hydrological conditions and provide important references for developing “ecologically friendly” scheduling schemes.
In summary, the coupled optimization results of EI and hydropower production reveal a strong sensitivity of scheduling strategies to hydrological conditions. Water availability directly governs the extent to which ecological protection and power generation objectives can be reconciled. Among these scenarios, wet years provide the most favorable external environment for simultaneously enhancing ecological and energy system performance, whereas dry years demand greater attention to ecological constraints and the design of robust scheduling strategies.

4.4. Response Characteristics of Hydropower Scheduling on EI Under Different Hydrological Year Types

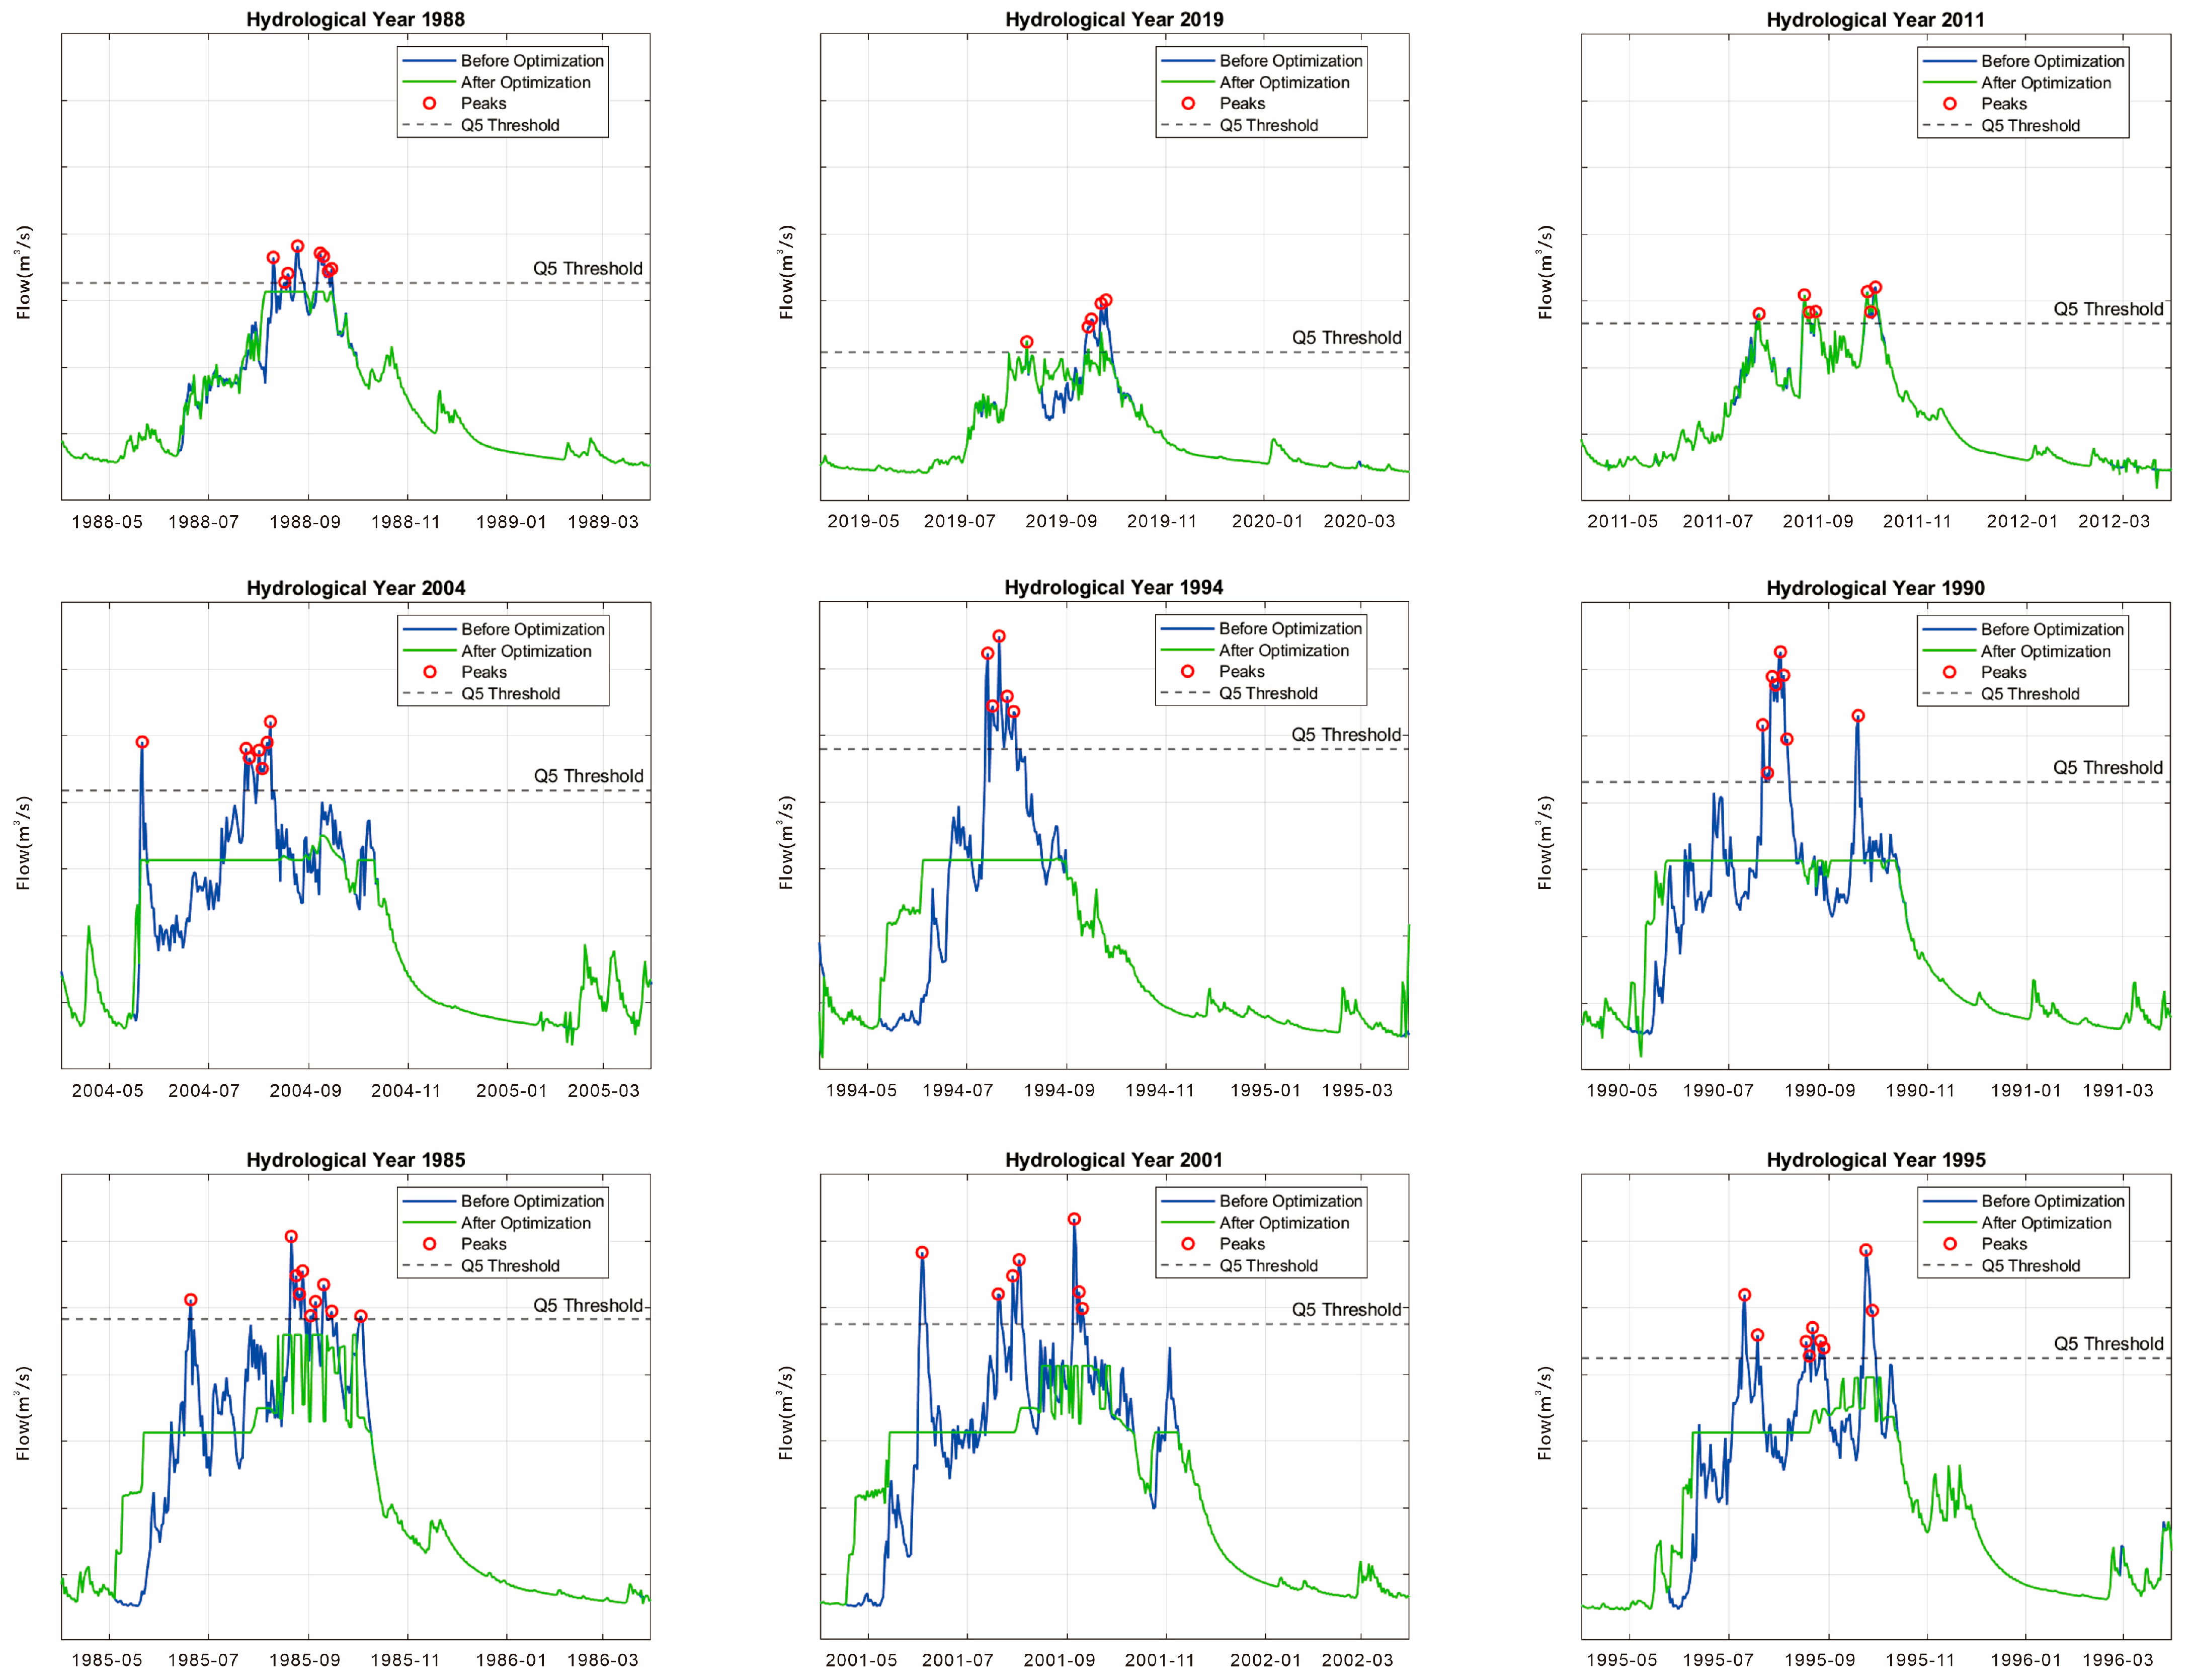
To investigate the relationship between hydropower generation and EI in depth, this study selected representative years exhibiting high, medium, and low EI values within each of the three typical hydrological year types identified in Figure 3. Specifically, for dry year types, the selected years are 1988 (EI = 0.41), 2019 (EI = 0.30), and 2011 (EI = 0.17); for normal year types, 2004 (EI = 0.44), 1994 (EI = 0.30), and 1990 (EI = 0.16); and for wet year types, 1985 (EI = 0.72), 2001 (EI = 0.43), and 1995 (EI = 0.14). These selections cover a wide range of flow conditions within each hydrological category, providing a robust basis for assessing hydropower scheduling impacts.
Figure 4 illustrates the daily flow regimes before and after reservoir operation optimization for each of these typical years. The natural hydrological patterns generally feature one or multiple sharp flood peaks predominantly occurring between July and September, with peak discharge rates varying from approximately 3012 to 6333 m3/s. These peaks, marked with red circles, exceed the Q5 threshold, indicating extreme high-flow events with potential ecological and hydrological significance. With reservoir operation optimization, the magnitude of these flood peaks was substantially reduced, and the flow diagrams become noticeably smoother. Additionally, the duration of medium to high flows is extended, reflecting a classic “peak shaving and valley filling” effect. This transformation is primarily driven by the coordinated operation of cascade reservoirs, which strategically redistribute floodwaters over time to alleviate downstream flood risks. Although this coordinated scheduling enhances flood control performance, it inevitably modifies the timing, magnitude, and frequency of flood pulses in the downstream. Such alterations may have downstream ecological consequences, potentially affecting floodplain inundation regimes, fish spawning habitats, and sediment transport processes. This highlights the fundamental trade-offs inherent in multi-objective basin management, where maximizing hydropower generation and flood mitigation must be carefully balanced against preserving ecological flow needs to maintain riverine ecosystem integrity.
Beyond the influence of annual mean runoff volumes, the temporal patterns and morphology of the flow regime play a crucial role in determining EI values. Longitudinal comparisons across the subplots in Figure 4 reveal a consistent pattern: irrespective of hydrological year types—dry, normal, or wet—years characterized by highly concentrated flood peaks within a brief time span, and minimal intervening low-flow periods, experience pronounced flow variability with limited opportunities for ecological recovery. Such flow regimes complicate reservoir scheduling and are associated with relatively high EI values, indicating greater ecological disruption. Conversely, years exhibiting flood peaks interspersed with distinct low-flow valleys offer more favorable conditions for balancing hydropower production and ecological protection. In these cases, reservoir operators can exploit the high flows during peak periods for energy generation while leveraging the intervening valleys to replenish reservoir storage. This strategy preserves modifiable water volumes for subsequent flood events, enhancing hydropower benefits and simultaneously reducing EI values. Notably, wet years tend to display this advantageous “peak-valley alternating” flow pattern, which facilitates both maximization of hydropower revenues and mitigation of ecological disturbances. Such conditions represent an optimal operational state that effectively reconciles economic and environmental objectives.
A particularly illustrative example is the 2011 hydrological year, a dry year with a relatively low EI value of 0.17, when the flow regimes before and after reservoir operation optimization are almost indistinguishable, as indicated by nearly overlapping discharge curves. This outcome stems mainly from the limited overall inflows and relatively subdued flood peaks characteristic of that year, which constrain the adjustable capacity of cascade reservoirs. Moreover, the original flow regime already displayed notable low-flow valleys between peaks, naturally exhibiting the “peak-valley alternating” pattern that balances flood control and ecological considerations. Consequently, the scope for optimization to further improve hydropower scheduling or ecological outcomes was minimal, resulting in a low EI and little margin for adjustment.
Overall, the results demonstrate that, beyond total inflow volume, the temporal dynamics of the flow regime—particularly the concentration and distribution of flood peaks—exert a significant influence on the EI across most hydrological year types. This underscores that effective hydropower scheduling must consider not only water quantity but also the detailed morphology of flow patterns to achieve a balanced optimization of ecological integrity and energy production.

4.5. Spatial Distribution Characteristics of Cascade Hydropower Generation and Key Control Station Analysis Under Different Hydrological Year Types

As shown in Figure 5, both the spatial distribution and magnitude of cascade hydropower generation exhibit pronounced variations under different hydrological year types, with Xiaowan Station emerging as the primary turning point in these patterns. In wet years (e.g., 2001), the average annual total cascade generation reaches 98.79 TWh, compared with the average annual generation of 71.81 TWh in normal years (e.g., 1994) and 57.36 TWh in dry years (e.g., 2019), reflecting substantial inter-annual differences.
Overall, upstream stations such as Wunonglong, Lidi, and Tuoba show relatively stable hydropower generation outputs, largely unaffected by inter-annual inflow variability. In contrast, mid- to downstream large-scale stations—particularly Xiaowan, Nuozhadu, and Jinghong—are highly sensitive to hydrological changes. In wet years, abundant inflows enable Xiaowan and Nuozhadu to fully exploit their substantial storage and peak-regulation capacities, significantly boosting downstream generation and driving the cascade’s total output to its maximum. Under normal-year conditions, both inflow and generation display a more balanced spatial distribution across the stations. In the dry year, however, sharp reductions in downstream inflows (below Xiaowan) constrain reservoir regulation capacity, leading to pronounced declines in output from key large stations. Although not all stations experience reductions—some upstream plants, such as those above Gongguoqiao, even generate more electricity than in normal years—the overall cascade production remains markedly limited. The close alignment between the trends of bar charts (hydropower generation) and line graphs (streamflow) confirms that hydrological conditions are the dominant driver of generation differences across the cascade.
From a scheduling perspective, wet years should prioritize unlocking the full generation potential of large downstream stations to maximize total cascade output, whereas in dry years, operational strategies should focus on securing essential downstream power supply to mitigate the risks of energy shortages. Xiaowan and Nuozhadu, due to their storage and firm capacity, function as pivotal control nodes in all hydrological scenarios, making their operation a key determinant of system-wide performance.

4.6. Resilience and Robustness Analysis of the System in a Typical Extreme Year

Using the representative hydrological years of 2019 (dry year), 1994 (normal year), and 2001 (wet year), the variations in system reliability, recovery capacity, and vulnerability before and after optimization (Figure 6) reveal distinct responses under different hydrological conditions. These results provide insights into the adaptability and robustness of the optimization-based scheduling strategy.
For the normal year 1994, optimization led to a notable improvement in system performance: reliability increased from 0.386 to 0.463, recovery capacity rose from 0.75 to 1.00, and vulnerability decreased from 0.218 to 0.189. These changes indicate that the optimization strategy substantially strengthened the system’s ability to withstand failures, enhanced its recovery speed, and reduced the magnitude of water supply deficits. Similarly, the wet year 2001 exhibited clear optimization benefits, with reliability improving by approximately 6% and vulnerability reduced by about 22%. Although the recovery capacity remained unchanged, the overall system performance became more stable. In contrast, the dry year 2019 showed minimal differences across the three indicators, with reliability even declining slightly by 0.002, and recovery capacity and vulnerability remaining nearly unchanged. This suggests that under extremely unfavorable inflow conditions, the ability of the optimization strategy to enhance system regulation is limited, potentially due to inherent constraints in water availability or a lack of adaptability in the strategy itself.
Overall, the optimization model demonstrated the capability to improve system reliability and reduce vulnerability in normal and wet years. However, its effectiveness in dry years remains limited, highlighting the need to further enhance its adaptability to extreme low-flow conditions.
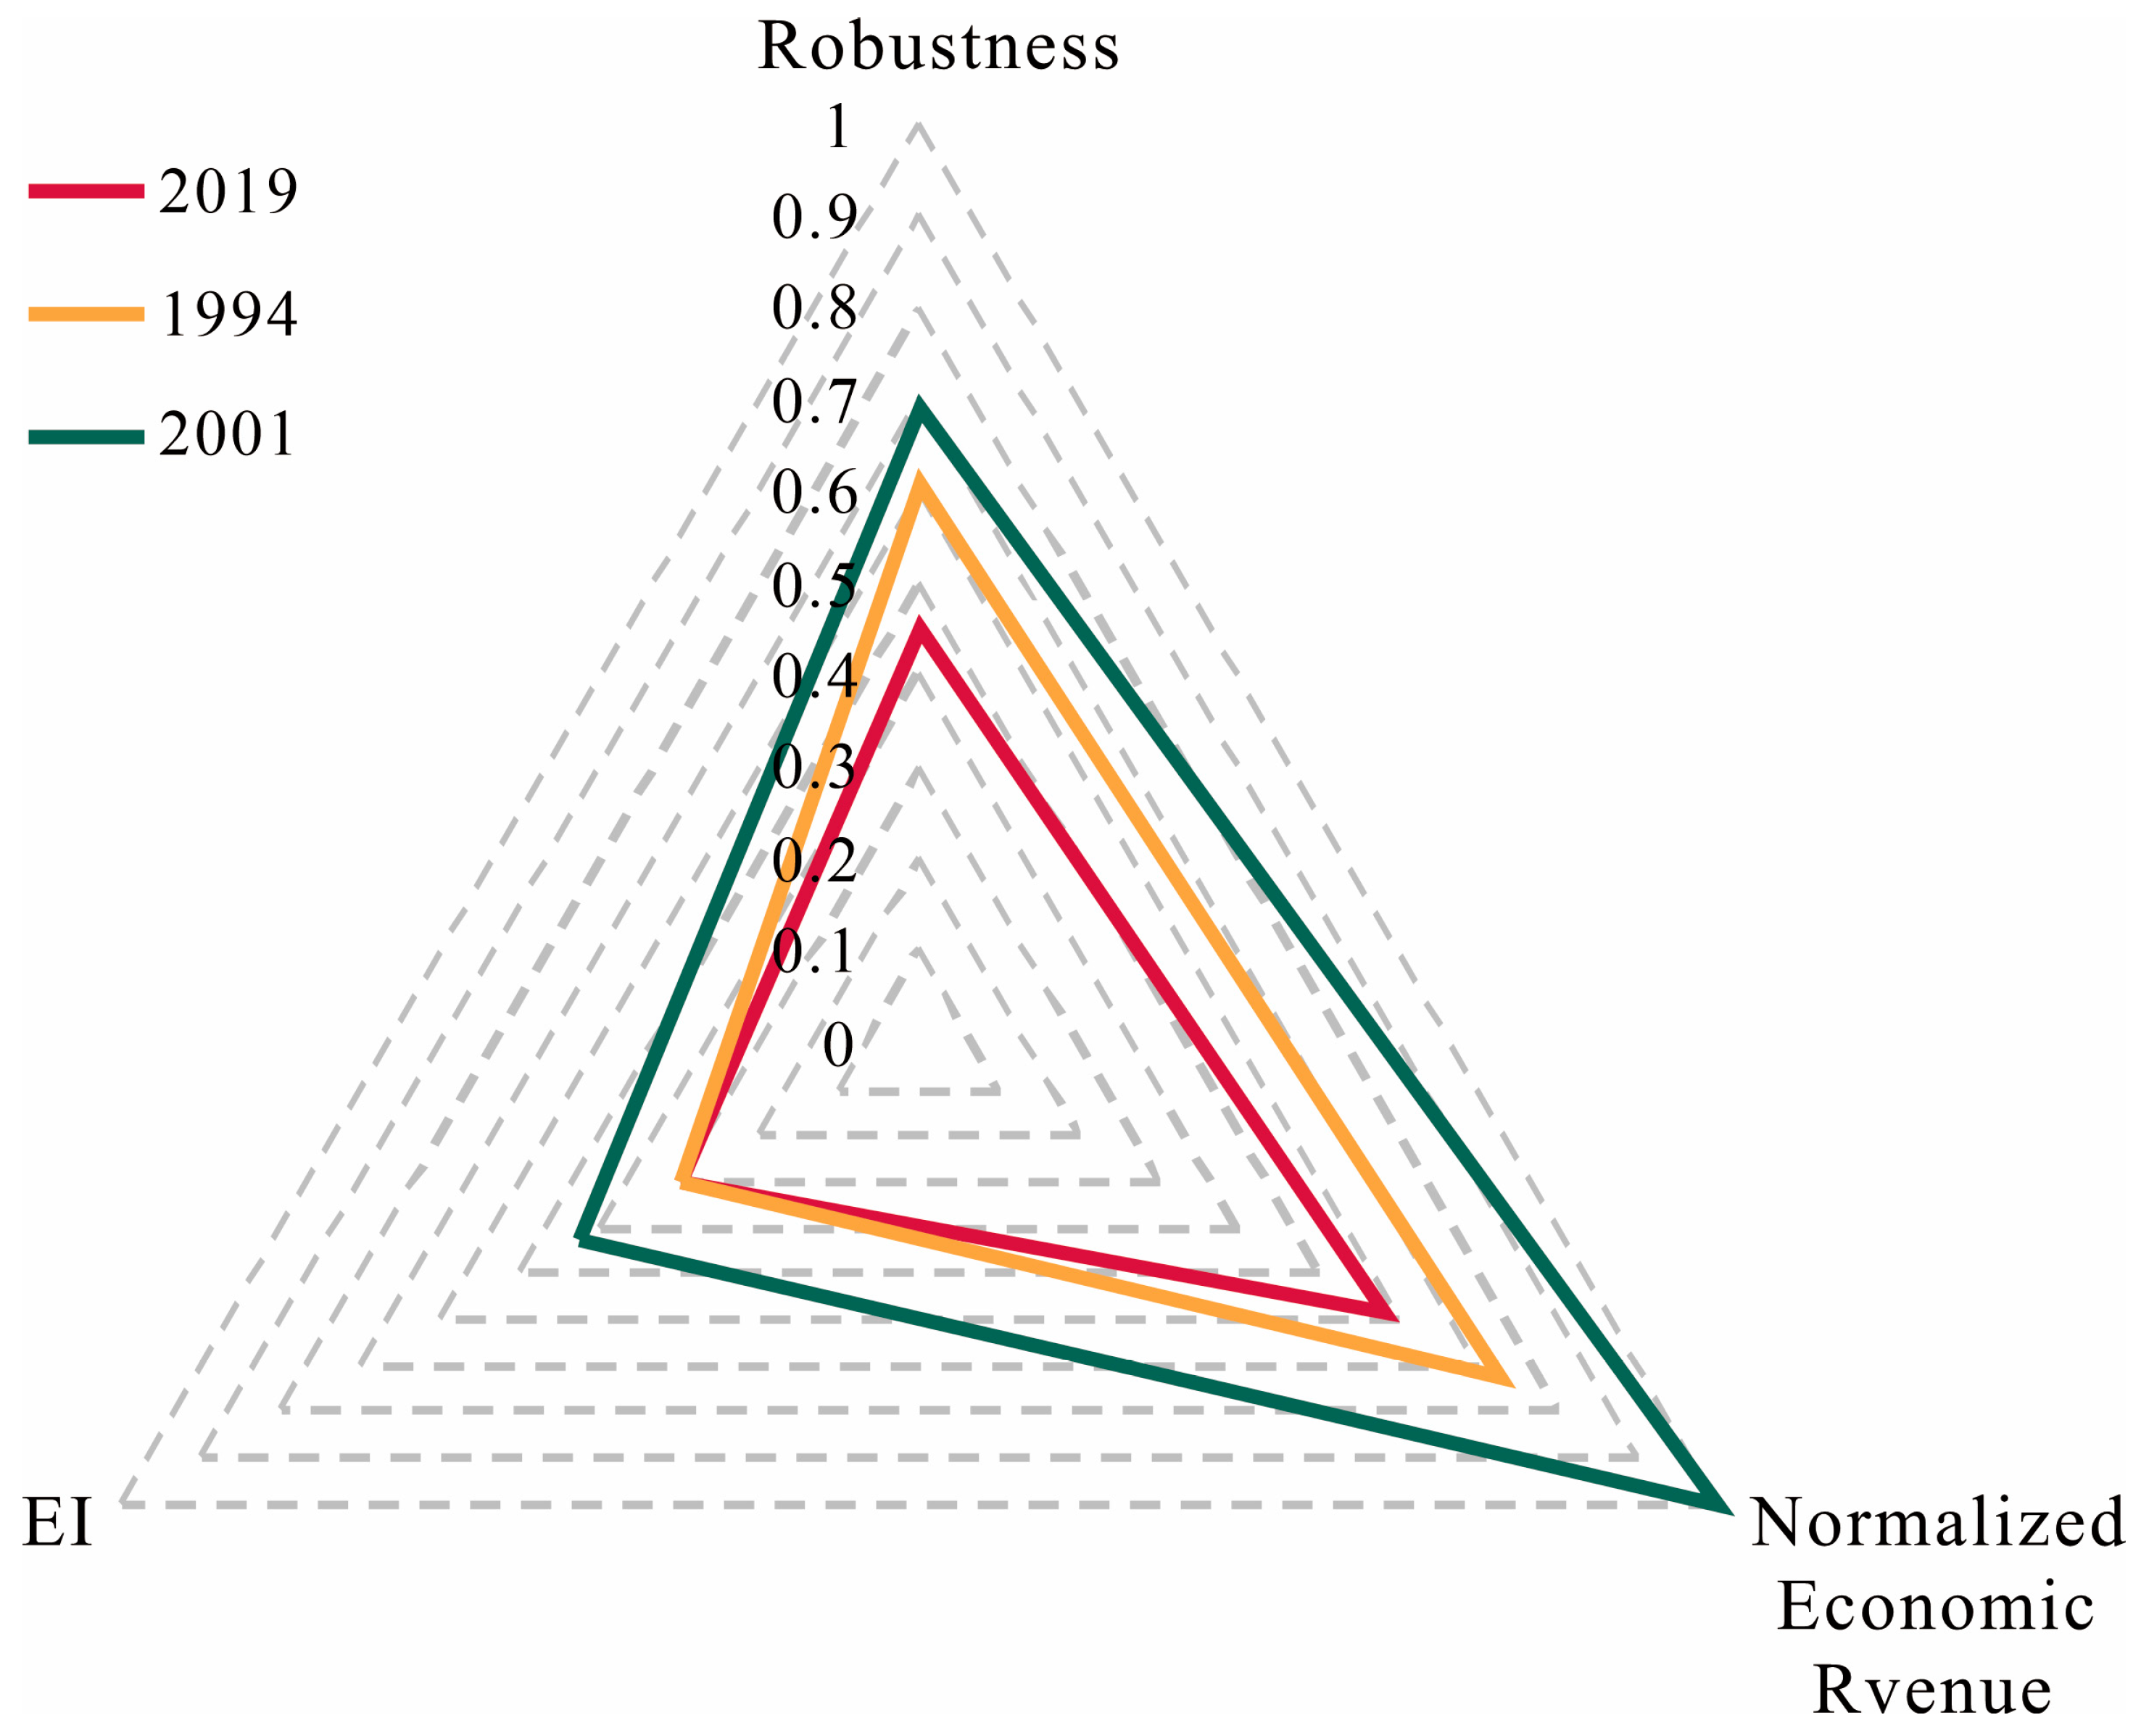
Figure 7 compares system performance in 1994, 2001, and 2019 based on three evaluation metrics: system robustness, normalized economic benefits, and EI. The results indicate that in 2001, the system achieved the highest robustness (≈0.75) and economic benefits (≈1), but also recorded the highest EI value, implying that riverine ecosystems experienced the greatest disturbance that year, with the highest ecological cost. In contrast, although robustness and economic benefits in 2019 were relatively low, the EI value was the lowest, suggesting that operations in this year were more oriented toward ecological protection, causing the minimal ecological disturbance. In 1994, all three metrics were at moderate levels, reflecting a relatively balanced and coordinated system state. Overall, the triangular radar chart clearly illustrates the significant trade-offs among economic, ecological, and robustness objectives across different hydrological years, emphasizing the need for dynamic, year-specific adjustments in scheduling strategies to achieve an optimal balance among these performance dimensions.

5. Conclusions

This study presents a coupled hydropower–ecological optimization model for cascade reservoirs incorporating an Eco-Index (EI) to balance energy production with ecosystem health. By applying PCA to 32 Indicators of IHA, seven representative ecological parameters were identified, enhancing the representativeness of the ecological objective while reducing computational complexity. Hydrological years were classified using the SRI and runoff quantiles (Q25, Q75) into wet, normal, and dry types. The analysis revealed that wet years exhibited the strongest coupling between hydropower generation and ecological objectives, followed by normal years, whereas dry years showed the weakest correlation due to limited water availability which constrains ecologically sustainable power scheduling.
Further investigation into runoff dynamics before and after optimization demonstrated that the temporal concentration of flood peaks significantly influenced EI values. Years characterized by tightly clustered flood peaks without notable intervening low-flow periods tended to have elevated EI values, whereas flow regimes exhibiting alternating peak–valley patterns corresponded to substantially lower EI values. This peak–valley alternation not only optimizes hydropower revenue but also mitigates ecological disturbances, representing an ideal operational regime balancing economic and ecological goals.
Spatial analysis identified Xiaowan and Nuozhadu as pivotal cascade reservoirs whose generation outputs are highly sensitive to hydrological variability. Resilience and robustness evaluations using RRV metrics indicated that the optimization model substantially improves system reliability and reduces vulnerability in wet and normal years but offers limited benefits during dry years, highlighting the need for enhanced model adaptability under extreme drought conditions.
Finally, assessment of the optimization outcomes based on economic performance, ecological impact, and system robustness revealed inherent trade-offs: maximizing economic returns and stability often comes at the expense of ecological integrity. These findings underscore the necessity of dynamic, year-specific scheduling strategies to achieve sustainable water–energy–ecology management in transboundary basins. Future research should incorporate climate projections, adaptive reservoir rules, and transboundary coordination to enhance model applicability under increasing hydrological uncertainty.

Author Contributions

Conceptualization, C.L.; methodology, C.L.; software, C.L.; validation, C.L.; formal analysis, C.L.; investigation, C.L.; resources, T.Z.; data curation, C.L.; writing—original draft preparation, C.L.; writing—review and editing, T.Z.; visualization, C.L.; supervision, T.Z.; project administration, T.Z.; funding acquisition, T.Z. All authors have read and agreed to the published version of the manuscript.

Funding

This study was supported by the National Natural Science Foundation of China (Grant No. 51961125204) and the Start-up Fund provided by the International Campus of Zhejiang University.

Data Availability Statement

The original hydrological data that support the findings of this study are not publicly available due to data use agreements, but are available from the corresponding author upon reasonable request. Information about dams can be found in the CGIAR Research Program on Water, Land, and Ecosystems at https://archive.iwmi.org/wle/thrive/2018/02/13/dams-data-and-decisions/ (accessed on 26 August 2025). and Mekong River Commission (MRC) Hydropower Database at https://portal.mrcmekong.org/, accessed on 26 August 2025. Additionally, for any other data, models, or codes supporting the findings of this study, interested parties may request them from the first and corresponding authors of the paper upon a reasonable inquiry.

Conflicts of Interest

The authors declare no conflicts of interest.

References

  1. Grill, G.; Lehner, B.; Thieme, M.; Geenen, B.; Tickner, D.; Antonelli, F.; Babu, S.; Borrelli, P.; Cheng, L.; Crochetiere, H.; et al. Mapping the world’s free-flowing rivers. Nature 2019, 569, 215–221. [Google Scholar] [CrossRef]
  2. Ziv, G.; Baran, E.; Nam, S.; Rodriguez-Iturbe, I.; Levin, S.A. Trading-off fish biodiversity, food security, and hydropower in the Mekong River Basin. Proc. Natl. Acad. Sci. USA 2012, 109, 5609–5614. [Google Scholar] [CrossRef]
  3. De Stefano, L.; Duncan, J.; Dinar, S.; Stahl, K.; Strzepek, K.M.; Wolf, A.T. Climate change and the institutional resilience of international river basins. J. Peace Res. 2012, 49, 193–209. [Google Scholar] [CrossRef]
  4. de Bruin, S.P.; Schmeier, S.; van Beek, R.; Gulpen, M. Projecting conflict risk in transboundary river basins by 2050 following different ambition scenarios. Int. J. Water Resour Dev. 2024, 40, 7–32. [Google Scholar] [CrossRef]
  5. Soukhaphon, A.; Baird, I.G.; Hogan, Z.S. The impacts of hydropower dams in the mekong river basin: A review. Water 2020, 13, 265. [Google Scholar] [CrossRef]
  6. Mlambo, V.H.; Masuku, M.M. Trouble in the Nile Basin: Ethiopia, Egypt, and Sudan and the Nile stalemate. Cogent Soc. Sci. 2025, 11, 2491851. [Google Scholar] [CrossRef]
  7. Räsänen, T.A.; Someth, P.; Lauri, H.; Koponen, J.; Sarkkula, J.; Kummu, M. Observed river discharge changes due to hydropower operations in the Upper Mekong Basin. J. Hydrol. 2017, 545, 28–41. [Google Scholar] [CrossRef]
  8. Fan, H.; He, D.; Wang, H. Environmental consequences of damming the mainstream lancang-mekong river: A review. Earth-Sci. Rev. 2015, 146, 77–91. [Google Scholar] [CrossRef]
  9. Liu, Z.; He, X. Balancing-oriented hydropower operation makes the clean energy transition more affordable and simultaneously boosts water security. Nature Water 2023, 1, 778–789. [Google Scholar] [CrossRef]
  10. Ma, Y.; Zhong, P.-A.; Xu, B.; Bing, J.; Zhang, Y. Multiobjective and Joint Operation Model for Multistakeholder Cascade Hydropower System. J. Water Resour. Plan. Manag. 2020, 146, 04020083. [Google Scholar] [CrossRef]
  11. Ortiz-Partida, J.P.; Kahil, T.; Ermolieva, T.; Ermoliev, Y.; Lane, B.; Sandoval-Solis, S.; Wada, Y. A Two-Stage Stochastic Optimization for Robust Operation of Multipurpose Reservoirs. Water Resour. Manag. 2019, 33, 3815–3830. [Google Scholar] [CrossRef]
  12. Lin, N.M.; Rutten, M. Optimal Operation of a Network of Multi-purpose Reservoir: A Review. Procedia Eng. 2016, 154, 1376–1384. [Google Scholar] [CrossRef]
  13. Arthington, A.H.; Bunn, S.E.; Poff, N.L.; Naiman, R.J. The challenge of providing environmental flow rules to sustain river ecosystems. Ecol. Appl. 2006, 16, 1311–1318. [Google Scholar] [CrossRef] [PubMed]
  14. Ficklin, D.L.; Null, S.E.; Abatzoglou, J.T.; Novick, K.A.; Myers, D.T. Myers. Hydrological Intensification Will Increase the Complexity of Water Resource Management. Earth’s Future 2022, 10, e2021EF002487. [Google Scholar] [CrossRef]
  15. Asadieh, B.; Krakauer, N.Y. Global change in streamflow extremes under climate change over the 21st century. Hydrol. Earth Syst. Sci. 2017, 21, 5863–5874. [Google Scholar] [CrossRef]
  16. Slater, L.J.; Anderson, B.; Buechel, M.; Dadson, S.; Han, S.; Harrigan, S.; Kelder, T.; Kowal, K.; Lees, T.; Matthews, T.; et al. Nonstationary weather and water extremes: A review of methods for their detection, attribution, and management. Hydrol. Earth Syst. Sci. 2021, 25, 3897–3935. [Google Scholar] [CrossRef]
  17. Xie, Y.; Guo, S.; Xiong, L.; Tian, J.; Xiong, F. Nonstationary design flood estimation in response to climate change, population growth and cascade reservoir regulation. Water 2021, 13, 2687. [Google Scholar] [CrossRef]
  18. Olden, J.D.; Poff, N.L. Redundancy and the choice of hydrologic indices for characterizing streamflow regimes. River Res. Appl. 2003, 19, 101–121. [Google Scholar] [CrossRef]
  19. Wang, C.-H.; Blackmore, J.M. Resilience Concepts for Water Resource Systems. J. Water Resour. Plan. Manag. 2009, 135, 528–536. [Google Scholar] [CrossRef]
  20. Sommerwerk, N.; Bloesch, J.; Paunović, M.; Baumgartner, C.; Venohr, M.; Schneider-Jacoby, M.; Hein, T.; Tockner, K. Managing the world’s most international river: The Danube River Basin. Mar. Freshw. Res. 2010, 61, 736–748. [Google Scholar] [CrossRef]
  21. Winemiller, K.O.; McIntyre, P.B.; Castello, L.; Fluet-Chouinard, E.; Giarrizzo, T.; Nam, S.; Baird, I.G.; Darwall, W.; Lujan, N.K.; Harrison, I.; et al. Balancing hy-dropower and biodiversity in the Amazon, Congo, and Mekong. Science 2016, 351, 128–129. [Google Scholar] [CrossRef] [PubMed]
  22. Castello, L.; Macedo, M.N. Reducing adverse impacts of Amazon hydropower expansion. Environ. Conserv. 2016, 43, 107–117. [Google Scholar] [CrossRef]
  23. Zhou, X.; Huang, X.; Zhao, H.; Ma, K. Development of a revised method for indicators of hydrologic alteration for analyzing the cumulative impacts of cascading reservoirs on flow regime. Hydrol. Earth Syst. Sci. 2020, 24, 4091–4107. [Google Scholar] [CrossRef]
  24. Jolliffe, I.T.; Cadima, J. Principal component analysis: A review and recent developments. Philos. Trans. R. Soc. A Math. Phys. Eng. Sci. 2016, 374, 2065. [Google Scholar] [CrossRef]
  25. Shukla, S.; Wood, A.W. Use of a standardized runoff index for characterizing hydrologic drought. Geophys. Res. Lett. 2008, 35. [Google Scholar] [CrossRef]
  26. Wang, Y.; Duan, L.; Liu, T.; Li, J.; Feng, P. A Non-stationary Standardized Streamflow Index for hydrological drought using climate and human-induced indices as covariates. Sci. Total Environ. 2020, 699, 134278. [Google Scholar] [CrossRef]
  27. Sediqi, M.N.; Komori, D. Assessing Water Resource Sustainability in the Kabul River Basin: A Standardized Runoff Index and Reliability, Resilience, and Vulnerability Framework Approach. Sustainability 2023, 16, 246. [Google Scholar] [CrossRef]
  28. Asefa, T.; Clayton, J.; Adams, A.; Anderson, D. Performance evaluation of a water resources system under varying climatic conditions: Reliability, Resilience, Vulnerability and beyond. J. Hydrol. 2014, 508, 53–65. [Google Scholar] [CrossRef]
  29. Tangi, M.; Schmitt, R.; Almeida, R.; Bossi, S.; Flecker, A.; Sala, F.; Castelletti, A. Robust Hydropower Planning Balances Energy Generation, Carbon Emissions and Sediment Connectivity in the Mekong River Basin. Earth’s Future 2024, 12, e2023EF003647. [Google Scholar] [CrossRef]
  30. Sabo, J.L.; Ruhi, A.; Holtgrieve, G.W.; Elliott, V.; Arias, M.E.; Ngor, P.B.; Räsänen, T.A.; Nam, S. Designing river flows to improve food security futures in the Lower Mekong Basin. Science 2017, 358, 6368. [Google Scholar] [CrossRef]
  31. Adamson, P.T.; Rutherfurd, I.D.; Peel, M.C.; Conlan, I.A. The Hydrology of the Mekong River, 1st ed.; Elsevier Inc.: Amsterdam, The Netherlands, 2008. [Google Scholar] [CrossRef]
  32. Sun, Q.; Song, W.; Han, Z.; Song, W.; Wang, Z. Assessment of Flood Disaster Risk in the Lancang–Mekong Region. Water 2024, 16, 3112. [Google Scholar] [CrossRef]
  33. Chen, D.; Liu, J.; Tang, Q. Water Resources in the Lancang-Mekong River Basin: Impact of Climate Change and Human Interventions; Springer: Singapore, 2024. [Google Scholar] [CrossRef]
  34. Hecht, J.S.; Lacombe, G.; Arias, M.E.; Dang, T.D.; Piman, T. Hydropower dams of the Mekong River basin: A review of their hydrological impacts. J. Hydrol. 2019, 568, 285–300. [Google Scholar] [CrossRef]
  35. Kondolf, G.M.; Rubin, Z.K.; Minear, J.T. Dams on the Mekong: Cumulative sediment starvation. Water Resour. Res. 2014, 50, 5375–5377. [Google Scholar] [CrossRef]
  36. Ang, W.J.; Park, E.; Pokhrel, Y.; Tran, D.D.; Loc, H.H. Dams in the Mekong: A comprehensive database, spatiotemporal distribution, and hydropower potentials. Earth Syst. Sci. Data 2024, 16, 1209–1228. [Google Scholar] [CrossRef]
  37. Vu, D.T.; Dang, T.D.; Galelli, S.; Hossain, F. Satellite observations reveal 13 years of reservoir filling strategies, operating rules, and hydrological alterations in the Upper Mekong River basin. Hydrol. Earth Syst. Sci. 2022, 26, 2345–2364. [Google Scholar] [CrossRef]
  38. Chen, Q.; Shi, W.; Huisman, J.; Maberly, S.C.; Zhang, J.; Yu, J.; Chen, Y.; Tonina, D.; Yi, Q. Hydropower reservoirs on the upper Mekong River modify nutrient bioavailability downstream Qiuwen. Natl. Sci. Rev. 2020, 7, 1449–1457. [Google Scholar] [CrossRef] [PubMed]
  39. Fan, X.; Luo, X. Precipitation and flow variations in the Lancang-Mekong River Basin and the implications of monsoon fluctuation and regional topography. Water 2019, 11, 2086. [Google Scholar] [CrossRef]
  40. Ngor, P.B.; McCann, K.S.; Grenouillet, G.; So, N.; McMeans, B.C.; Fraser, E.; Lek, S. Evidence of indiscriminate fishing effects in one of the world’s largest inland fisheries. Sci. Rep. 2018, 8, 8947. [Google Scholar] [CrossRef] [PubMed]
  41. Poff, N.L.; Allan, J.D.; Bain, M.B.; Karr, J.R.; Prestegaard, K.L.; Richter, B.D.; Sparks, R.E.; Stromberg, J.C. The natural flow regime: A paradigm for river conservation and restoration. Bioscience 1997, 47, 769–784. [Google Scholar] [CrossRef]
  42. Poff, N.L.; Zimmerman, J.K.H. Ecological responses to altered flow regimes: A literature review to inform the science and management of environmental flows. Freshw. Biol. 2010, 55, 194–205. [Google Scholar] [CrossRef]
  43. Zhang, K.; Morovati, K.; Tian, F.; Yu, L.; Liu, B.; Olivares, M.A. Regional contributions of climate change and human activities to altered flow of the Lancang-mekong river. J. Hydrol. Reg. Stud. 2023, 50, 101535. [Google Scholar] [CrossRef]
  44. Pardo-Loaiza, J.; Solera, A.; Bergillos, R.J.; Paredes-Arquiola, J.; Andreu, J. Improving indicators of hydrological alteration in regulated and complex water resources systems: A case study in the duero river basin. Water 2021, 13, 2676. [Google Scholar] [CrossRef]
  45. Timpe, K.; Kaplan, D. The changing hydrology of a dammed Amazon. Sci. Adv. 2017, 3, e1700611. [Google Scholar] [CrossRef]
  46. DeGasperi, C.L.; Berge, H.B.; Whiting, K.R.; Burkey, J.J.; Cassin, J.L.; Fuerstenberg, R.R. Linking Hydrologic Alteration to Biological Impairment in Urbanizing Streams of the Puget Lowland, Washington, USA. J. Am. Water Resour. Assoc. 2009, 45, 512–533. [Google Scholar] [CrossRef]
  47. Vishwakarma, D.K.; Ali, R.; Bhat, S.A.; Elbeltagi, A.; Kushwaha, N.L.; Kumar, R.; Rajput, J.; Heddam, S.; Kuriqi, A. Pre- and post-dam river water temperature alteration prediction using advanced machine learning models. Environ. Sci. Pollut. Res. 2022, 29, 83321–83346. [Google Scholar] [CrossRef]
  48. Van Binh, D.; Kantoush, S.A.; Saber, M.; Mai, N.P.; Maskey, S.; Phong, D.T.; Sumi, T. Long-term alterations of flow regimes of the Mekong River and adaptation strategies for the Vietnamese Mekong Delta. J. Hydrol. Reg. Stud. 2020, 32, 100742. [Google Scholar] [CrossRef]
  49. Richter, B.D.; Baumgartner, J.V.; Powell, J.; Braun, D.P. A method for assessing hydrologic alteration within ecosystems. Conserv. Biol. 1996, 10, 1163–1174. [Google Scholar] [CrossRef]
  50. Ringnér, M. What is principal component analysis? Nat. Biotechnol. 2008, 26, 303–304. [Google Scholar] [CrossRef] [PubMed]
  51. Jackson, D.A. Stopping Rules in Principal Components Analysis: A Comparison of Heuristical and Statistical Approaches. Ecology 1993, 74, 2204–2214. [Google Scholar] [CrossRef]
  52. He, W.; Ma, C.; Zhang, J.; Lian, J.; Wang, S.; Zhao, W. Multi-objective optimal operation of a large deep reservoir during storage period considering the outflow-temperature demand based on NSGA-II. J. Hydrol. 2020, 586, 124919. [Google Scholar] [CrossRef]
  53. Hashimoto, T.; Stedinger, J.R.; Loucks, D.P. Loucks. Reliability, Resiliency, and Vulnerability Criteria. Water Resour. Res. 1982, 18, 14–20. [Google Scholar] [CrossRef]
  54. Zeng, P.; Sun, F.; Liu, Y.; Che, Y. Future river basin health assessment through reliability-resilience-vulnerability: Thresholds of multiple dryness conditions. Sci. Total Environ. 2020, 741, 140395. [Google Scholar] [CrossRef]
  55. Zou, L.; Xia, J.; She, D. Analysis of Impacts of Climate Change and Human Activities on Hydrological Drought: A Case Study in the Wei River Basin, China. Water Resour. Manag. 2018, 32, 1421–1438. [Google Scholar] [CrossRef]
  56. GB/T 20481-2017; Meteorological Drought Classification. Chinese Standardization Administration; Standards Press of China: Beijing, China, 2017.
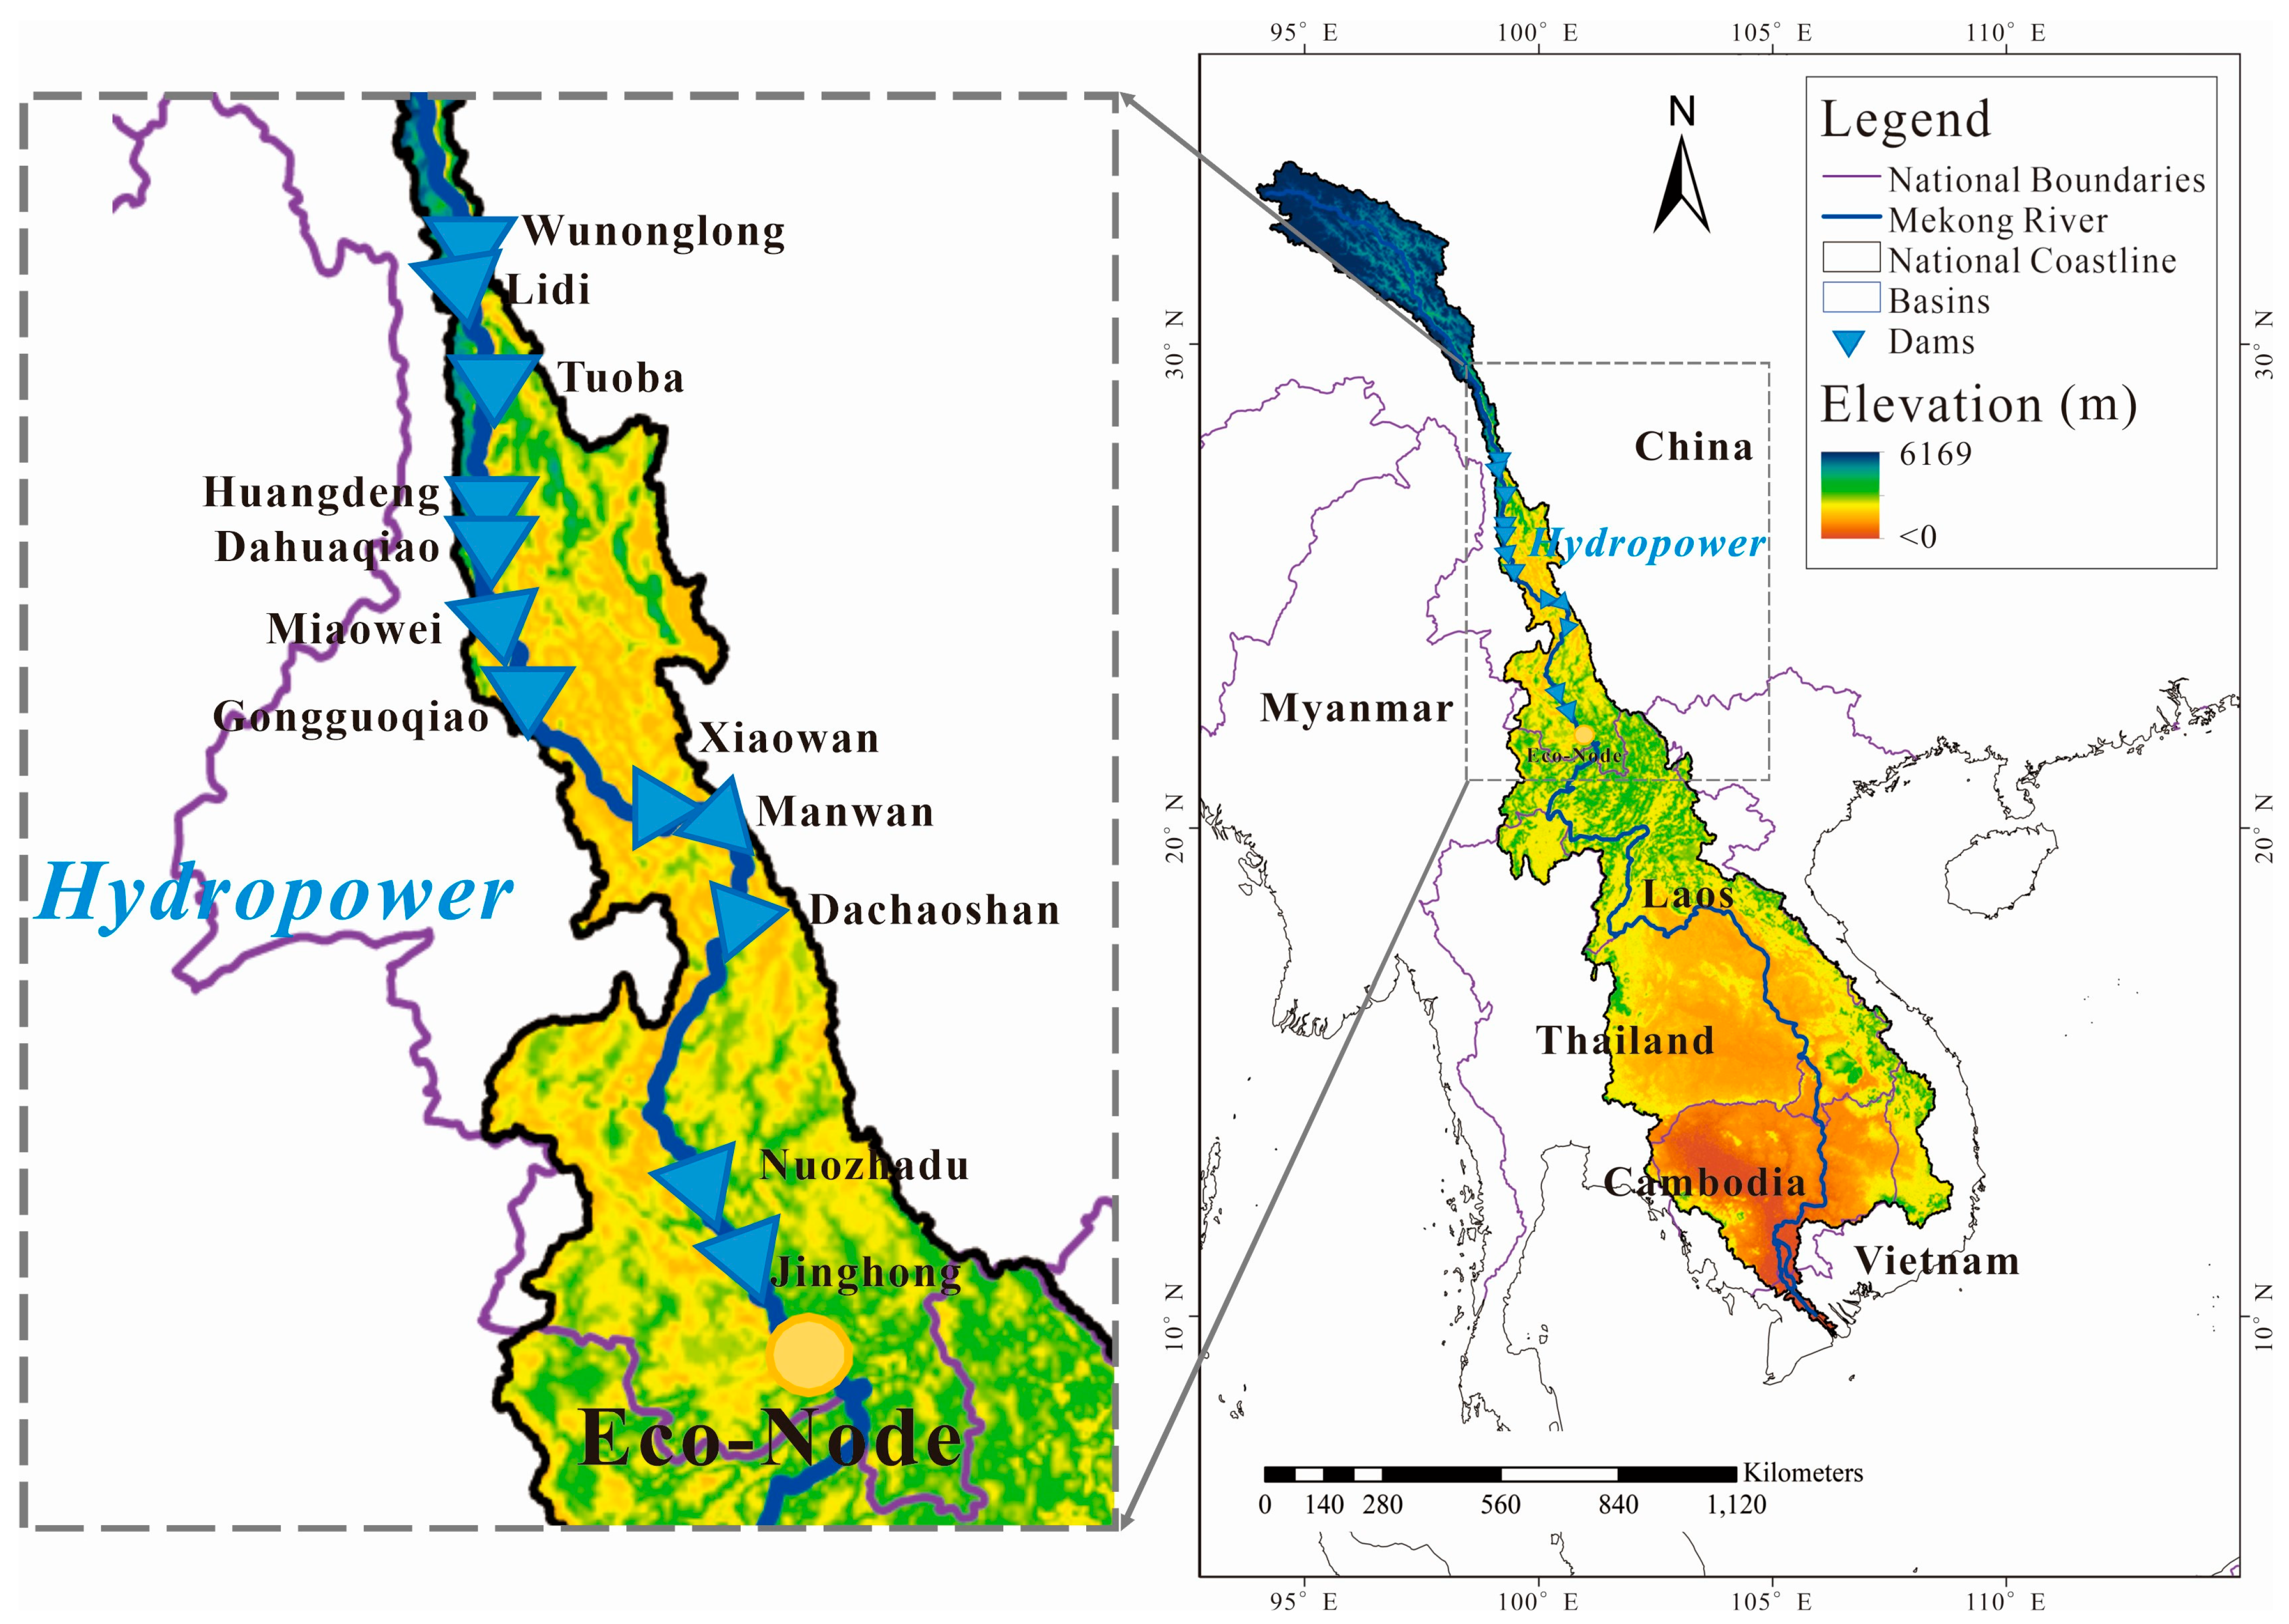
Figure 1. Hydropower cascade and modeled eco-node in the upstream Lancang–Mekong River Basin. Eco-Index is determined with streamflow series at the eco-node. Magnified figure on the left displays hydropower station names.
Water 17 02966 g001
Figure 2. The SRI results for hydrological years 1980–2019.
Water 17 02966 g002
Figure 3. Scatter plot of optimized hydropower revenue versus EI across dry, normal, and wet year types, highlighting system-level trade-offs between energy production and ecological integrity.
Water 17 02966 g003
Figure 4. Flow regimes at Jinghong before and after optimization for the represent years. The blue lines represent the natural flow before optimization, the green lines show reservoir release from the optimization model, red circles mark the occurrences of flow peaks, and the dashed black line indicates the Q5 threshold, corresponding to the 5-th percentile of annual flow.
Water 17 02966 g004
Figure 5. Power generation and annual average streamflow at each hydropower station along the Lancang River, from upstream to downstream.
Water 17 02966 g005
Figure 6. Visualization of system resilience indicators—RRV.
Water 17 02966 g006
Figure 7. Ternary objective diagram of “Economic–Ecological–Robustness” trade-offs in typical hydrological year types.
Water 17 02966 g007
Table 1. Principal components and associated weights identified with PCA from 32 IHA Parameters for the Eco-node on the Lancang–Mekong River.
ComponentRepresentative ParameterλOriginal Contribution (%)Corrected Contribution ( ω P ,   % )
PC 190-day Maximum (A17)13.93 43.5 49
PC 2Mean flow in April (A4)4.09 12.8 14
PC 3Mean flow in November (A11)2.95 9.2 10
PC 4Date of maximum (A24)2.85 8.9 10
PC 5Low pulse duration (A29)1.83 5.7 6
PC 6Number of reversals (A32)1.31 4.1 5
PC 7High pulse count(A26)1.25 3.9 4
Total 88.2100
Disclaimer/Publisher’s Note: The statements, opinions and data contained in all publications are solely those of the individual author(s) and contributor(s) and not of MDPI and/or the editor(s). MDPI and/or the editor(s) disclaim responsibility for any injury to people or property resulting from any ideas, methods, instructions or products referred to in the content.