Article

Integrated Assessment of Anthropogenic Carbon, Nitrogen, and Phosphorus Inputs: A Panjin City Case Study

1
School of Chemical Engineering, Ocean and Life Sciences, Dalian University of Technology, Panjin 124221, China
2
National Marine Environmental Monitoring Center, Dalian 116023, China
*
Author to whom correspondence should be addressed.
Water 2025, 17(20), 2962; https://doi.org/10.3390/w17202962
Submission received: 1 September 2025 / Revised: 11 October 2025 / Accepted: 13 October 2025 / Published: 15 October 2025
(This article belongs to the Special Issue Science and Technology for Water Purification, 2nd Edition)

Abstract

Energy consumption and environmental pollution pose significant challenges to sustainable development. This study develops a comprehensive coupled framework model that advances the quantitative integration of carbon (C), nitrogen (N), and phosphorus (P) cycles driven by multiple anthropogenic pollution sources. This paper used Panjin city as a case study to analyze the dynamic changes and interconnections among C, N, and P. Results indicated that net anthropogenic carbon inputs (NAIC) increased by 33% from 2016–2020, while net anthropogenic nitrogen inputs (NAIN) and net anthropogenic phosphorus inputs (NAIP) decreased by 14% and 28%, respectively. The primary driver of NAIC was energy consumption, while wetlands were the dominant carbon sequestration sink. Agricultural production was identified as the primary source of NAIN and NAIP, and approximately 4.5% of NAIN and 2.9% of NAIP were discharged into receiving water bodies. We demonstrate that human activities and natural processes exhibit dual attributes, producing positive and negative environmental effects. The increase in carbon emissions drives economic growth and industrial restructuring; however, the enhanced economic capacity also strengthens the ability to mitigate pollution through environmental protection measures. Similarly, natural ecosystems, including forests and grasslands, contribute to carbon sequestration and the release of non-point source pollution. The comprehensive environmental impact assessment of C, N, and P revealed that the comprehensive environmental index for Panjin city exhibited an improved trend. The factors of energy structure, energy efficiency, and economic scale promoted NAIC growth, with the economic scale factor alone accounting for 93% of the total increment. Environmental efficiency factor and population size factor were the primary drivers in reducing NAIN and NAIP discharges into the receiving water bodies. We propose a novel management model, ecological restoration, clean energy utilization, resource recycling, and pollution source reduction to achieve systemic governance of C, N, and P inputs.

1. Introduction

Carbon (C), nitrogen (N), and phosphorus (P) are critical elements that shape societal development, environmental sustainability, and climate dynamics [1]. The intensive consumption of fossil fuels during economic and social development has become a major driver of global warming [2]. Substantial carbon emissions contributed to 86 days in 2023 during which global average temperatures surpassed 1.5 °C above pre-industrial levels, highlighting the growing urgency of the climate crisis [3]. Additionally, a report by the United Nations Environment Programme (UNEP) titled Wastewater: Turning Problems into Solutions showed that only 11% of treated wastewater is reused globally, while approximately half of untreated wastewater continues to be discharged into rivers, lakes, and oceans (https://www.unep.org/; accessed on 23 August 2023). Consequently, an accurate assessment of carbon, nitrogen, and phosphorus dynamics driven by human activities is essential for achieving regional sustainable development. Current research has focused on the individual processes of carbon, nitrogen, and phosphorus under the influence of human activities, confirming the significant impact of anthropogenic actions on climate and environmental change [4,5].
In terms of carbon emission accounting, fossil fuel carbon emissions are commonly quantified using fossil fuel consumption data and carbon emission factors, which reflect the emission impacts of different fossil fuel types [2]. Furthermore, carbon emissions are allocated across distinct sectors and regions to enable enhanced precision in management [6]. The Global Carbon Project indicated that global carbon emissions from fossil fuel consumption in 2020 were quantified at 9500 million tons (https://www.globalcarbonproject.org/; accessed on 11 December 2020). Tian et al. [7] found that the primary carbon emission source in Liaoning province is industrial activities, followed by the transportation, storage, and postal service sector. Fossil fuel consumption is typically associated with carbon emissions from construction land use [6]. In contrast, carbon emissions from non-construction land uses include agriculture, forests, grasslands, and wetlands. Estimating carbon emissions in these areas typically involves field surveys and experimental analyses to determine emission factors or coefficients, followed by calculations based on the area of each land use type [8]. Similarly, carbon emissions from livestock are commonly estimated using coefficient-based methods [9]. Studies have reported that agriculture accounted for approximately 40% of total anthropogenic methane emissions and that global methane emissions from livestock have increased fourfold over the past 130 years [10,11,12,13,14]. Regarding nitrogen and phosphorus calculations, the net anthropogenic nitrogen input (NANI), net anthropogenic phosphorus input (NAPI), Soil and Water Assessment Tool (SWAT), and Spatially Referenced Regressions on Watershed Attributes (SPARROW) models were developed to assess pollution inputs [15,16,17,18,19]. NANI and NAPI are statistical models that quantify nitrogen and phosphorus inputs and outputs by analyzing multiple sources, including dietary intake, atmospheric deposition, fertilizer application, and other anthropogenic activities, and then determine net nitrogen and phosphorus inputs at the catchment or regional scale [20,21,22]. The SWAT model calculates nitrogen and phosphorus losses for each response unit based on hydrological processes [23]. The SPARROW model uses nonlinear regression equations to simulate pollution processes within a watershed [18]. Wang et al. [19] found that the net anthropogenic phosphorus input in the Liao river was 785.53 kg P km−2 yr−1, using the NAPI model. Similarly, Deng et al. [24] applied the NANI model and determined that net anthropogenic nitrogen input in the Yangtze river economic belt was 7292 kg N km−2 yr−1. Zhang et al. [25] used the SWAT model to quantify non-point nitrogen sources in Luoyang (2009–2018), and indicated that agricultural fertilizer, atmospheric deposition, and soil nitrogen reservoirs were the primary contributors. Kim et al. [26] employed the SPARROW model to assess watershed-scale phosphorus fluxes, and showed that exceptionally high urban non-point source TP export (120 kg km−2 yr−1) in the Kint bay basin.
The impact of human activities on carbon, nitrogen, and phosphorus is not isolated. Energy consumption emits substantial amounts of greenhouse gases while simultaneously supporting socioeconomic development [27]. This growth drives increasing demands for a higher quality of life, including the construction of wastewater treatment facilities, increased water usage, and improved diets. These shifts influence the economic structure and lead to adjustments in agriculture, livestock, and industry, which, in turn, further affect energy consumption. In parallel, human activities exert dual impacts on the natural environment. Ecological restoration efforts contribute to the recovery of green spaces, while urban expansion reduces the extent of wetlands, forests, grasslands, and other natural ecosystems [28]. Currently, studies that simultaneously quantify carbon, nitrogen, and phosphorus inputs at the urban scale and link them to economic and environmental indicators have received little attention. Therefore, it is important to assess the carbon, nitrogen, and phosphorus inputs driven by human activities and their associated environmental impacts.
Panjin city, located in Liaoning province, is an important energy and agricultural base in northern China. Furthermore, as a coastal city, Panjin serves as a terminal for pollutant discharge, and environmental problems have consistently attracted considerable attention. This study selects Panjin city as a case study to analyze carbon, nitrogen, and phosphorus inputs and their environmental impacts under the influence of human activities and natural processes, providing a reference for sustainable development. The specific objectives of this study are to: (1) develop a framework model to evaluate the dynamic changes in net anthropogenic carbon, nitrogen, and phosphorus inputs; (2) investigate the interconnections among carbon, nitrogen, and phosphorus inputs; and (3) comprehensively assess the environmental impacts of carbon, nitrogen, and phosphorus inputs and propose corresponding control measures.

2. Materials and Methods

2.1. Study Area

Panjin city is a major grain and energy base in northern China and faces significant energy and environmental challenges. In 2020, the population, GDP, grain production, and petroleum refining volume of the city were 1.29 million people, 128.41 billion yuan, 1.17 million t, and 27.61 million t, respectively. Panjin contains 21 rivers with a total length of 634 km. The Liao river, one of China’s seven major rivers, flows through Panjin city before discharging into Liaodong Bay. Notably, the water qualities of the Shazi river were classified as worse than Class V according to standards (GB 3838-2002; Environmental quality standards for surface water; Beijing; China; 2002) [29], indicating severe pollution. Panjin hosts the headquarters of the Liaohe oilfield and has abundant wetland resources. The Red beach wetland, one of the best-preserved wetlands in the region, serves as an important ecological barrier.

2.2. Developed Framework Model for Net Anthropogenic C, N, and P Inputs

2.2.1. Framework Model

We developed a framework model to evaluate net anthropogenic C, N, and P inputs by integrating the influences of human activities and natural processes (Figure 1). Human activities include human consumption, agricultural production, and livestock farming, while natural processes involve atmospheric deposition and emissions from non-construction land uses. Total inputs are calculated as the sum of these two components. The export coefficient method is then applied to estimate pollutant discharges into receiving water bodies. Human consumption refers to carbon emissions from fossil fuel use and nitrogen and phosphorus inputs from dietary intake. In addition to contributing to pollution, human activities can also reduce pollution through the construction of wastewater treatment facilities. Urban wastewater is primarily discharged as point-source pollution, whereas rural domestic wastewater is mainly discharged through non-point-source pathways. Agricultural production generates greenhouse gas emissions, while rainfall-driven nutrient transport introduces nitrogen (N) and phosphorus (P) into water bodies via non-point-source runoff. Livestock farming emits greenhouse gases from animal enteric fermentation and manure management, contributing to non-point source pollution, similar to agricultural production. However, both agricultural production and livestock farming can create a positive feedback loop by providing food. The environmental impact of natural processes is dual too. Atmospheric deposition contributes to nitrogen and phosphorus inputs. Forests, grasslands, and wetlands have carbon sequestration capabilities, but they also release non-point source pollution. The current models like SWAT and SPARROW can effectively simulate nitrogen and phosphorus flux loads at watershed outlets. The NAIN and NAIP models are designed to quantify net anthropogenic nitrogen and phosphorus inputs, respectively. However, these models lack integrated carbon cycle processes. Moreover, current carbon emission accounting primarily relies on emission factor methods at regional scales, without coupling carbon with nitrogen and phosphorus cycles. Compared to traditional models, our proposed framework model can describe the interconnected C, N, and P processes across diverse pollution sources, providing valuable insights for environmental management strategies and climate change adaptation. The detailed calculations are as follows.
NAIK = HIK + AIK + LIK + NIK
NAI-RL = HI-RL + AI-RL + LI-RL + NI-RL
where NAIK is the net anthropogenic pollutant inputs, K represents the Kth pollution input, HIK is the pollutant inputs from human consumption, AIK is the pollutant inputs from agricultural production, LIK is pollutant inputs from livestock, and NIK is pollutant inputs from natural processes. The subscript K corresponds to the pollutants C, N, and P. Similarly, NAI-RL is net anthropogenic pollutant inputs discharged into receiving water bodies, L represents the Lth pollutant discharged into receiving water bodies, HI-RL is pollutant discharges from human consumption, AI-RL is pollutant discharges from agricultural production, LI-RL is pollutant discharges from livestock, and NI-RL is pollutant discharges from natural processes. The subscript L corresponds to pollutants N, and P. For a detailed example of the calculation process, refer to the relevant literature [24,30].

2.2.2. Human Consumption (HI)

Carbon emissions from human inputs are calculated by multiplying energy consumption by the carbon emission coefficient. Energy consumption data is sourced from Panjin Statistical Yearbook, while the carbon emission coefficient is determined based on literature [31,32]. The net nitrogen and phosphorus inputs are estimated by subtracting the amount treated from the total intake. The total intake amount is calculated by multiplying the population by the nitrogen and phosphorus intake coefficients. Population data is sourced from Panjin Statistical Yearbook, with the intake coefficients being 4.58 kg N per capita per year and 1.15 kg P per capita per year [33,34]. The treated nitrogen and phosphorus amounts are calculated by multiplying the wastewater treatment volume by the pollutant removal rates. The wastewater treatment volume is sourced from Liaoning Statistical Yearbook, and the pollutant removal rates is determined by the China’s Water Supply & Drainage Design Manual.
HIK = OHIK − HTIK
where HIK is the Kth pollutant input from human consumption, OHIK is the Kth pollutant consumption or intake, and HTIK is the reduction amount of the Kth pollutant. Notably, carbon inputs are excluded from the reduction calculation.
Pollutants discharged into receiving water bodies from human activities include urban point source pollution, rural non-point source pollution, and non-point-source discharges from construction land. Urban point-source pollution is estimated by multiplying the volume of treated wastewater by the tailwater concentration, with tailwater concentration values sourced from China’s Water Supply & Drainage Design Manual. Non-point source discharges from construction land are determined by multiplying the area by the export coefficient, with the N and P export coefficients being 7.39 kg N ha−1 yr−1 and 0.25 kg P ha−1 yr−1, respectively. Rural non-point-source discharges are calculated by multiplying the rural population by the corresponding non-point-source export coefficients, with the N and P coefficients being 1.57 kg N person−1 year−1 and 0.44 kg P person−1 year−1, respectively [33,35]. Population and construction land area data are sourced from Panjin Statistical Yearbook.
HI-RL = Urban-RL + Rural-RL + Construction-RL
where Urban-RL is the Lth pollutant from urban point-source, Rural-RL is the Lth pollutant from rural non-point source, and Construction-RL is the Lth pollutant from construction land source.

2.2.3. Agricultural Production (AI)

Carbon emissions from agricultural production are determined by multiplying the sowing area by the emission coefficient, with the emission coefficient value being 49.7 kg ha−1 yr−1 [36]. Agricultural nitrogen inputs are calculated as the sum of seed nitrogen, fertilizer nitrogen, and biological nitrogen fixation, minus the nitrogen in the crops. The coefficients are determined based on referenced literature. Agricultural phosphorus (P) inputs are calculated similarly to nitrogen inputs, excluding biological fixation. The coefficients are referenced from the literature. The nitrogen and phosphorus discharges into receiving water bodies from agricultural production are calculated by the export coefficient method, with the nitrogen and phosphorus export coefficients being 18.56 kg N ha−1 yr−1 and 1.55 kg P ha−1 yr−1, respectively [33,37]. The data required for the calculations are sourced from Panjin Statistical Yearbook and Liaoning Statistical Yearbook.

2.2.4. Livestock (LI)

Carbon emissions from livestock are determined by multiplying the number of animals by the corresponding emission coefficient. The carbon emission coefficients for pigs, cattle, sheep, and poultry are 2.12 kg individual−1 yr−1, 91.53 kg individual−1 yr−1, 9.56 kg individual−1 yr−1 and 0.01 kg individual−1 yr−1, respectively [38,39]. The nitrogen and phosphorus inputs from livestock are determined by multiplying the number of animals by the corresponding coefficients. The number of livestock is sourced from Panjin Statistical Yearbook. The nitrogen and phosphorus discharges into receiving water bodies from livestock are obtained by the export coefficient method, with the export coefficients for pigs, cattle, sheep, and poultry being 6.34 kg N individual−1 yr−1, 42.76 kg N individual−1 yr−1, 4.65 kg N individual−1 yr−1, 0.17 kg N individual−1 yr−1 and 3.17 kg P individual−1 yr−1, 9.78 kg P individual−1 yr−1, 1.06 kg P individual−1 yr−1, 0.12 kg P individual−1 yr−1, respectively [40,41].

2.2.5. Atmospheric Deposition

Data on atmospheric nitrogen and phosphorus deposition are obtained from the National Science & Technology Infrastructure of China (http://www.nesdc.org.cn/; accessed on 18 December 2019), with missing values estimated using the linear interpolation method.

2.2.6. Forests, Grasslands, and Wetlands

Carbon sequestration by forests, grasslands, and wetlands is calculated by multiplying the area by the corresponding carbon sequestration coefficients, with the values in Equation (1) converted to negative numbers during the calculation [42,43]. Pollutant discharges into receiving water bodies from forests and grasslands are estimated by the export coefficient method. The areas of different land uses are obtained from the Panjin Statistical Yearbook. The carbon sequestration coefficients for forests, grasslands, and wetlands are 58.1 kg ha−1 yr−1, 2.1 kg ha−1 yr−1 and 2.45 kg ha−1 yr−1, respectively. The pollution export coefficients for forests and grasslands are 2.98 kg N ha−1 yr−1, 0.25 kg P ha−1 yr−1 and 7.04 kg N ha−1 yr−1, 0.84 kg P ha−1 yr−1, respectively [44,45,46].

2.3. Comprehensive Environmental Impact Assessment Model for Anthropogenic C, N, and P Inputs

The anthropogenic C, N, and P inputs are interrelated, with various pollution sources that may simultaneously exhibit both positive and negative effects. This study uses a variable fuzzy model to assess the comprehensive environmental impact of C, N, and P under the influence of human activities. This paper selects 16 indicators for assessment, consider various pollutants and environmental impacts. The detailed indicators are human energy consumption (X1), carbon emissions from agricultural production (X2), carbon emissions from livestock (X3), carbon sequestration by forests (X4), carbon sequestration by grasslands (X5), and carbon sequestration by wetlands (X6), net human nitrogen inputs (X7), agricultural nitrogen inputs (X8), livestock nitrogen inputs (X9), atmospheric deposition nitrogen inputs (X10), net anthropogenic nitrogen inputs discharged into receiving water bodies(X11), net human phosphorus inputs (X12), agricultural phosphorus inputs (X13), livestock phosphorus inputs (X14), atmospheric deposition phosphorus inputs (X15), net anthropogenic phosphorus inputs discharged into receiving water bodies(X16). The weights of the indicators are determined using the Analytic Hierarchy Process (AHP) and equal-weight methods. The assessment model is as follows.
To eliminate differences in dimensions of indicator values and standard values, it is necessary to standardize the data into a uniform format.
r ij = 0 ,   x ij = x min ( p o s i t i v e   i n d e x )   o r   x ij = x max   ( i n v e r s e   i n d e x ) x ij   -   x min x max   -   x min ( p o s i t i v e   i n d e x )   o r   x max   -   x ij x max   -   x min ( i n v e r s e   i n d e x ) 1 ,   x ij = x max ( p o s i t i v e   i n d e x )   o r   x ij = x min ( i n v e r s e   i n d e x )
where rij is the standardized indicator value, and xij is the indicator value.
To ensure more stable evaluation results, the indicator weights wi and standardized values rij are input into four variable fuzzy models. By adjusting model parameters, the membership degrees Uhj corresponding to each evaluation level h are calculated, where a is the optimization criterion parameter, p is the distance parameter, and m is the number of evaluation indicators.
1.
When a = 1 and p = 1, the relative membership degree of sample j is represented by the fuzzy comprehensive evaluation model.
U 1 j = i = 1 m w i r ij
2.
When a = 1 and p = 2, the relative membership degree of sample j is determined by the TOPSIS ideal point model.
U 2 j = 1 + i = 1 m w i ( r ij   -   1 ) 2 i = 1 m ( w i r ij ) 2 1
3.
When a = 2 and p = 1, the relative membership degree of sample j is represented by the incentive function model.
U 3 j = 1 + 1 - i = 1 m w i r ij i = 1 m w i r ij 2 1
4.
When a = 2 and p = 2, the relative membership degree of sample j is defined by the fuzzy optimization model.
U 4 j = 1 + i = 1 m w i ( r ij   -   1 ) 2 i = 1 m ( w i r ij ) 2 1
After applying the evaluation samples to the four models, the average of the four relative membership degrees is taken as the comprehensive environmental index for carbon, nitrogen, and phosphorus. A higher index indicates greater overall environmental benefit.
U = U 1 j + U 2 j + U 3 j + U 4 j 4

2.4. Log-Mean Divisia Index Model

The Log-Mean Divisia Index (LMDI) model can establish a mathematical relationship between carbon emissions caused by human activities and factors such as the economy, policy, and population [47]. This paper uses the LMDI method to identify the driving forces of carbon emissions. According to a Kaya-type identity, the carbon emissions are decomposed as follows.
C = C E × E G D P × G D P P × P
C I = C E
E I = E G D P
G = G D P P
where C, E, GDP, and P represent carbon emissions, energy consumption, Gross Domestic Product (GDP), and total population, respectively. The factors CI, EI, G, and P represent the energy structure factor, energy efficiency factor, economic scale factor, and population scale factor, respectively.
Similarly, the LMDI model is employed to analyze the driving factors of net anthropogenic pollutant inputs discharged into receiving water bodies.
N A I R L = N A I R L N A I K × N A I K G D P × G D P P × P
N A I R L = P I R × P I × G × P
P I R = N A I R L N A I K
P I = N A I K G D P
G = G D P P
where N A I R L means net anthropogenic pollutant inputs discharged into receiving water bodies, NAIK means net anthropogenic pollutant inputs, K represents the Kth pollution input, k = N or P, PIR indicate the pollution structure factor, pollution intensity factor, economic scale factor, and population scale factor, respectively.

3. Results

3.1. Dynamic Changes in Net Anthropogenic C, N, and P Inputs

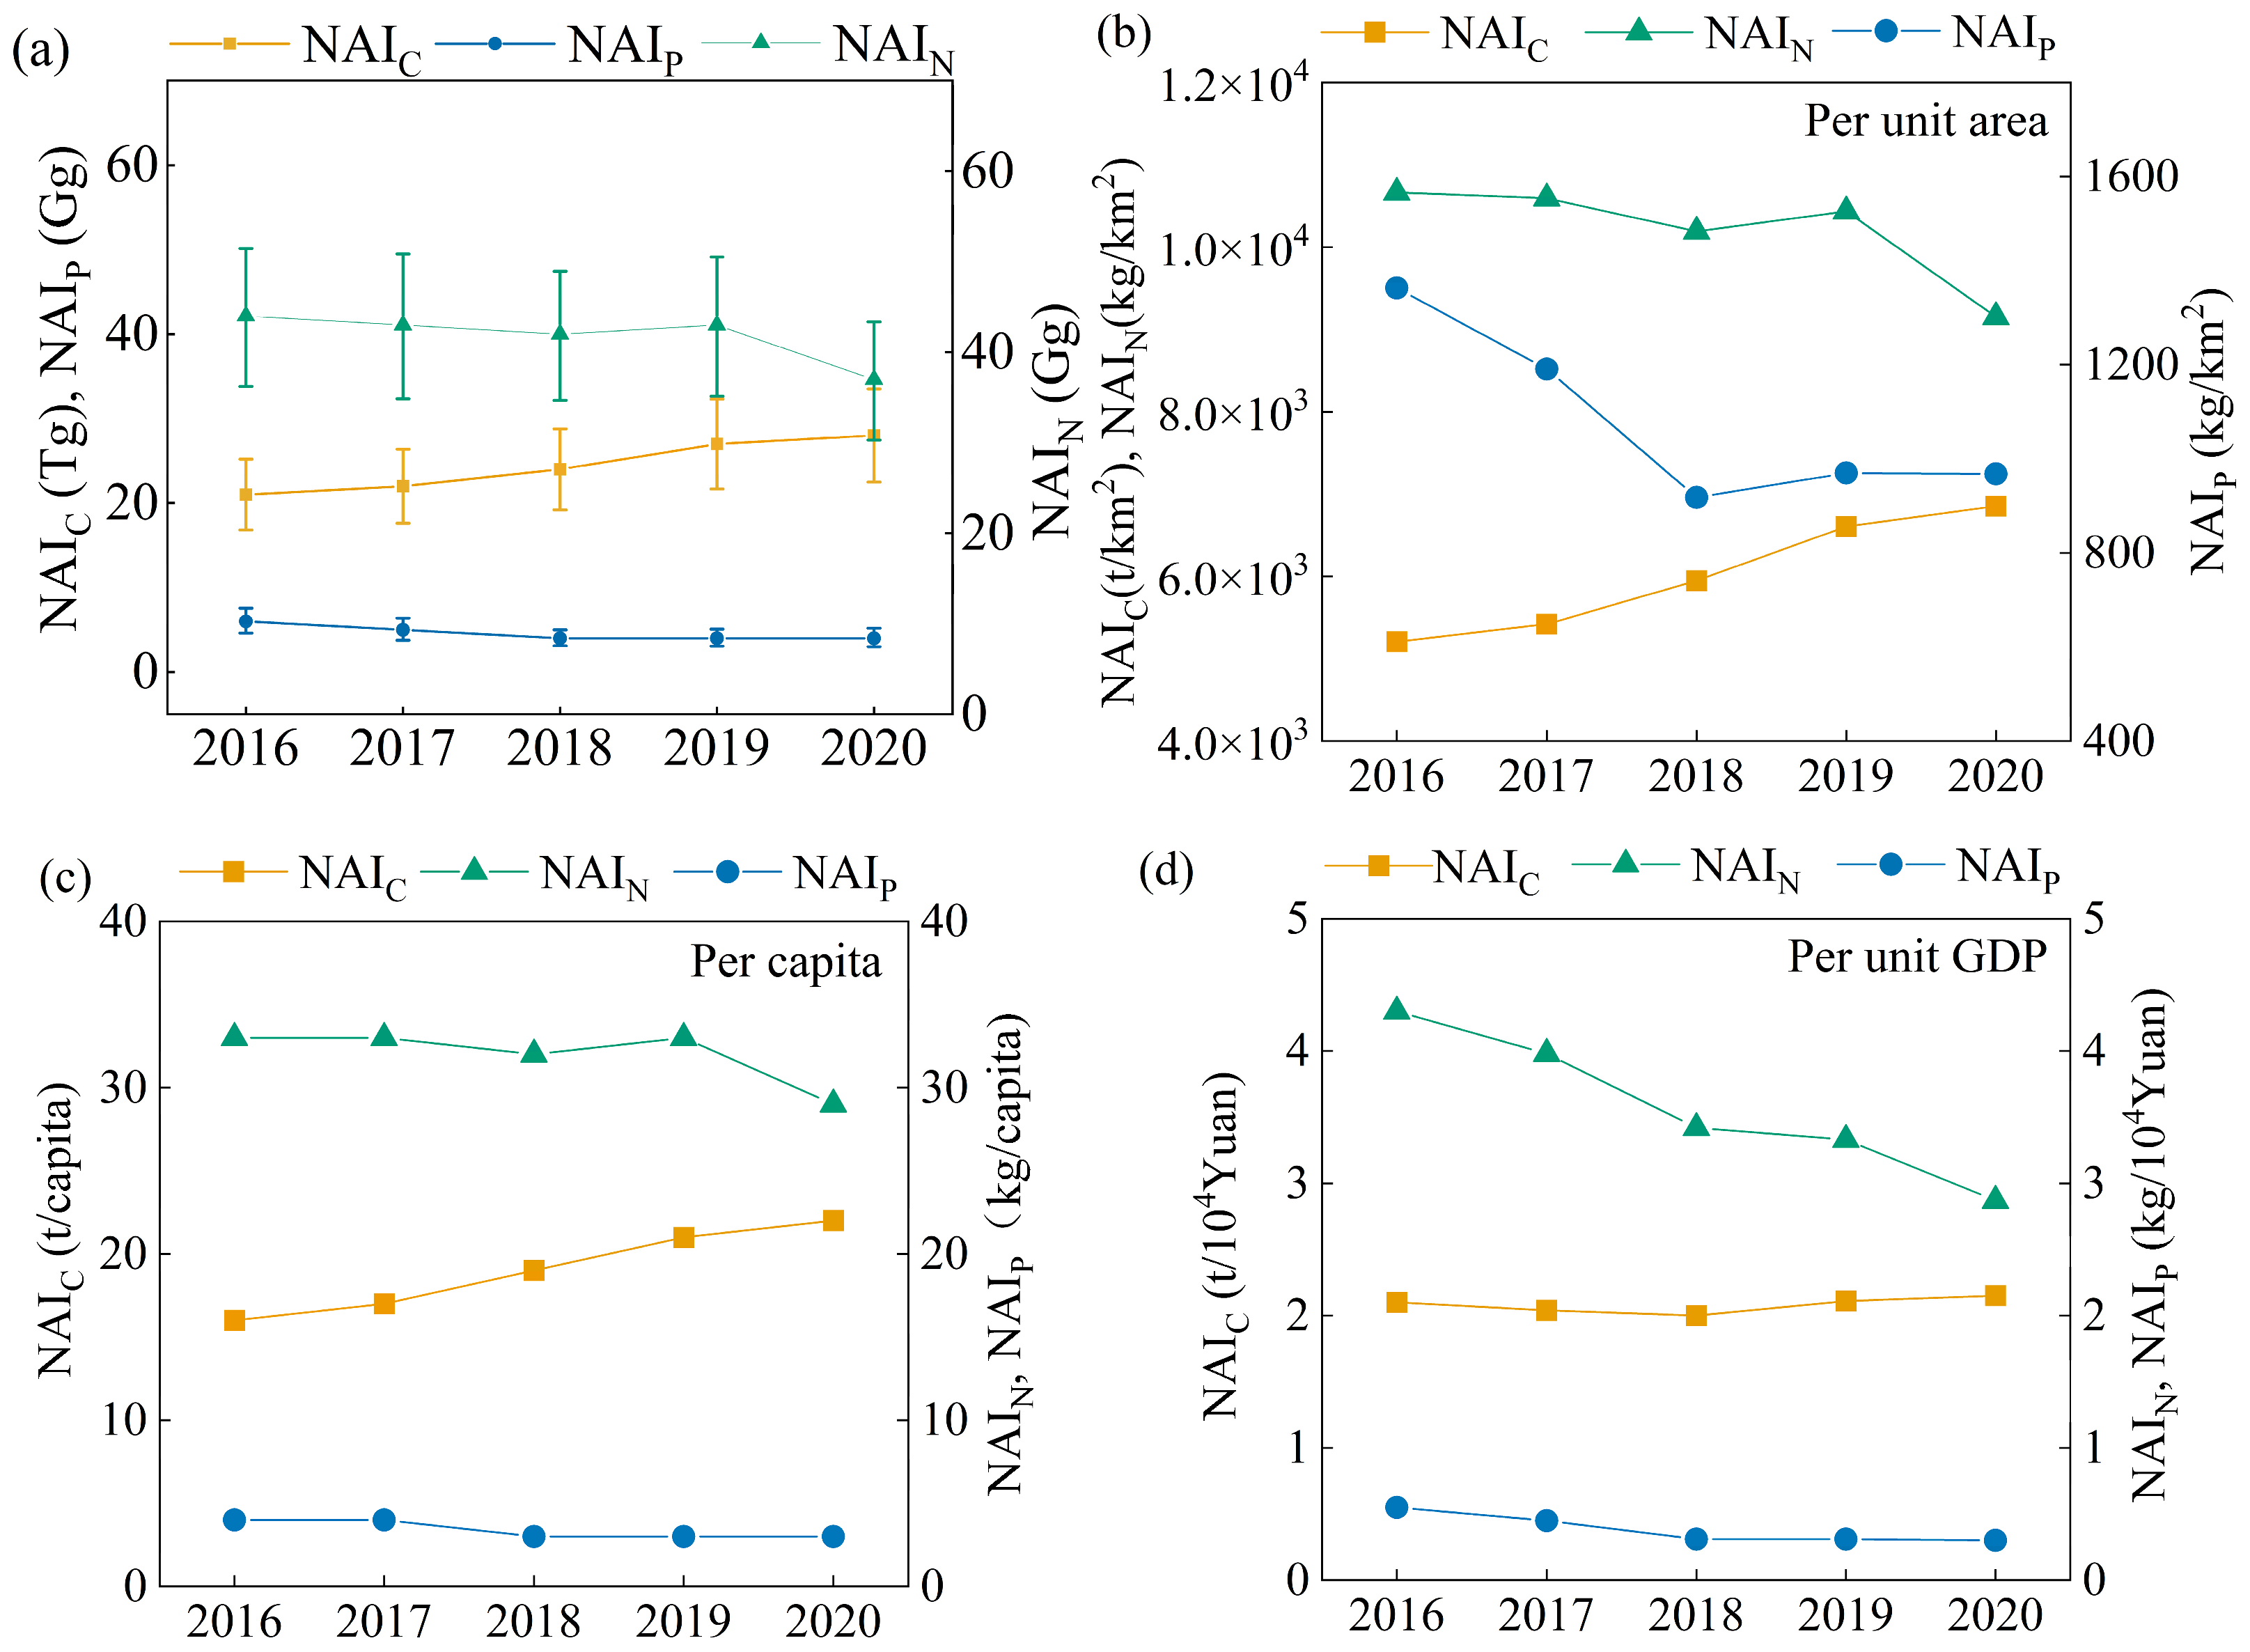
From 2016 to 2020, NAIC in Panjin city exhibited an increasing trend, while NAIN and NAIP inputs showed declines (Figure 2a). The C:N:P ratio shifted from 3820:7.8:1 in 2016 to 7081:9.5:1 in 2020, reflecting a disproportionate rise in carbon inputs relative to nitrogen and phosphorus, with phosphorus showing the smallest change. NAIC increased from 21 Tg in 2016 to 28 Tg in 2020, representing a 33% growth with an average annual increase of 1.68 Tg. Conversely, NAIN declined from 43.5 Gg to 37.4 Gg, a reduction of 14% with an average annual decrease of 1.54 Gg. Similarly, NAIP decreased from 5.6 Gg to 4.0 Gg, representing a 28% reduction at an average rate of 0.4 Gg per year. A Monte Carlo simulation was employed for sensitivity analysis, with an uncertainty factor of 0.1 selected based on data sources [48,49]. The parameter configuration was as follows: means (μ) were set at Xij with standard deviations (σ) of 0.1Xij to examine varying deviation degrees, running 1000 simulations. It is evident that the actual and simulated results are closely aligned, with both falling within the 95% confidence interval.
Furthermore, the net anthropogenic pollutant inputs were normalized by land area, population, and GDP to provide a more comprehensive understanding of their dynamic characteristics (Figure 2b–d). The results showed that both NAIC per unit area and NAIC per capita followed the overall increasing trend of NAIC. Specifically, NAIC per unit area rose from 5207 t/km2 in 2016 to 6853 t/km2 in 2020, while NAIC per capita increased from 16.3 t/capita to 21.6 t/capita over the same period. In contrast, NAIC per unit GDP exhibited relatively minor fluctuations, remaining stable at approximately 2.1 t GDP (10,000 yuan). Similarly, with the exception of NAIN and NAIP per unit GDP, the normalized trends of NAIN and NAIP were generally consistent with their overall declines. NAIN per unit area decreased from 10,661 kg/km2 in 2016 to 9153 kg/km2 in 2020, while NAIP per unit area declined from 1363 kg/km2 to 968 kg/km2. On a per capita basis, NAIN dropped from 33.5 kg to 28.9 kg, and NAIP decreased from 4.3 kg to 3.1 kg. In terms of economic intensity, NAIN per unit GDP fell from a peak of 4.3 kg per 10,000 yuan to 2.9 kg per 10,000 yuan in 2020, while NAIP per unit GDP declined from 0.55 kg to 0.3 kg per 10,000 yuan in the same span.
Due to the influence of population, agriculture, livestock, and land use, the net C, N, and P inputs under human activities showed significant regional differences. Most research on carbon emissions focused on fossil fuel consumption. Studies indicated that carbon emission per unit area in Liaoning province was approximately 3500 t/km2, which was lower than those in Panjin city. This difference reflected the characteristics of Panjin as an energy-oriented city. In addition, we compared our results with the comprehensive urban emission inventory compiled by Shan et al. [50]. The average carbon emission intensity per unit area from this study (6008 t/km2 for 2016–2020) aligns well with their reported value (6094 t/km2 for 2013–2017). The average NAIN per unit area for Panjin City calculated in this study was 10,438.6 kg/km2 (2016–2020). This figure is comparable to the average level calculated by Han et al. [51]. for Liaoning Province in 2009 (9414 kg N/km2). Moreover previous studies reported that NAIN per unit area in mainland China, Baiyangdian, Huaihe river, Taihu lake, Chaohu lake, Dianchi lake, and Erhai lake ranged from 5283 to 27,186 kg/km2 [33,45,52,53,54]. The average NAPI per unit area for Panjin City (2016–2020) calculated in this study was 1082.03 kg /km2, exceeding the 2009 provincial average for Liaoning calculated by Han et al. (564 kg P/km2) [55]. The difference may be attributed to Panjin’s status as an intensive agricultural zone and a major industrial city within the province. The NAIN per unit area in Panjin city fell within this range and was comparable to that of the Erhai Lake region. Likewise, NAIP per unit area in mainland China, Baiyangdian, and Huaihe river ranged from 465 to 2741 kg /km2 [23,33,56]. In the future, greater attention should be paid to comparing the calculated results with observed river pollution data to verify the reliability of the model. As mentioned above, Panjin ranked at an intermediate level.
It is necessary to acknowledge the limitations of this work. The model calculations have not been validated against measured hydrological or water quality monitoring data. Because this study focused on developing a model for calculating carbon, nitrogen, and phosphorus inputs and investigating their correlations and environmental consequences. Data-intensive validation was not conducted. This will be improved in future work.

3.2. Components and Environmental Impacts of Net Anthropogenic Pollutant Inputs

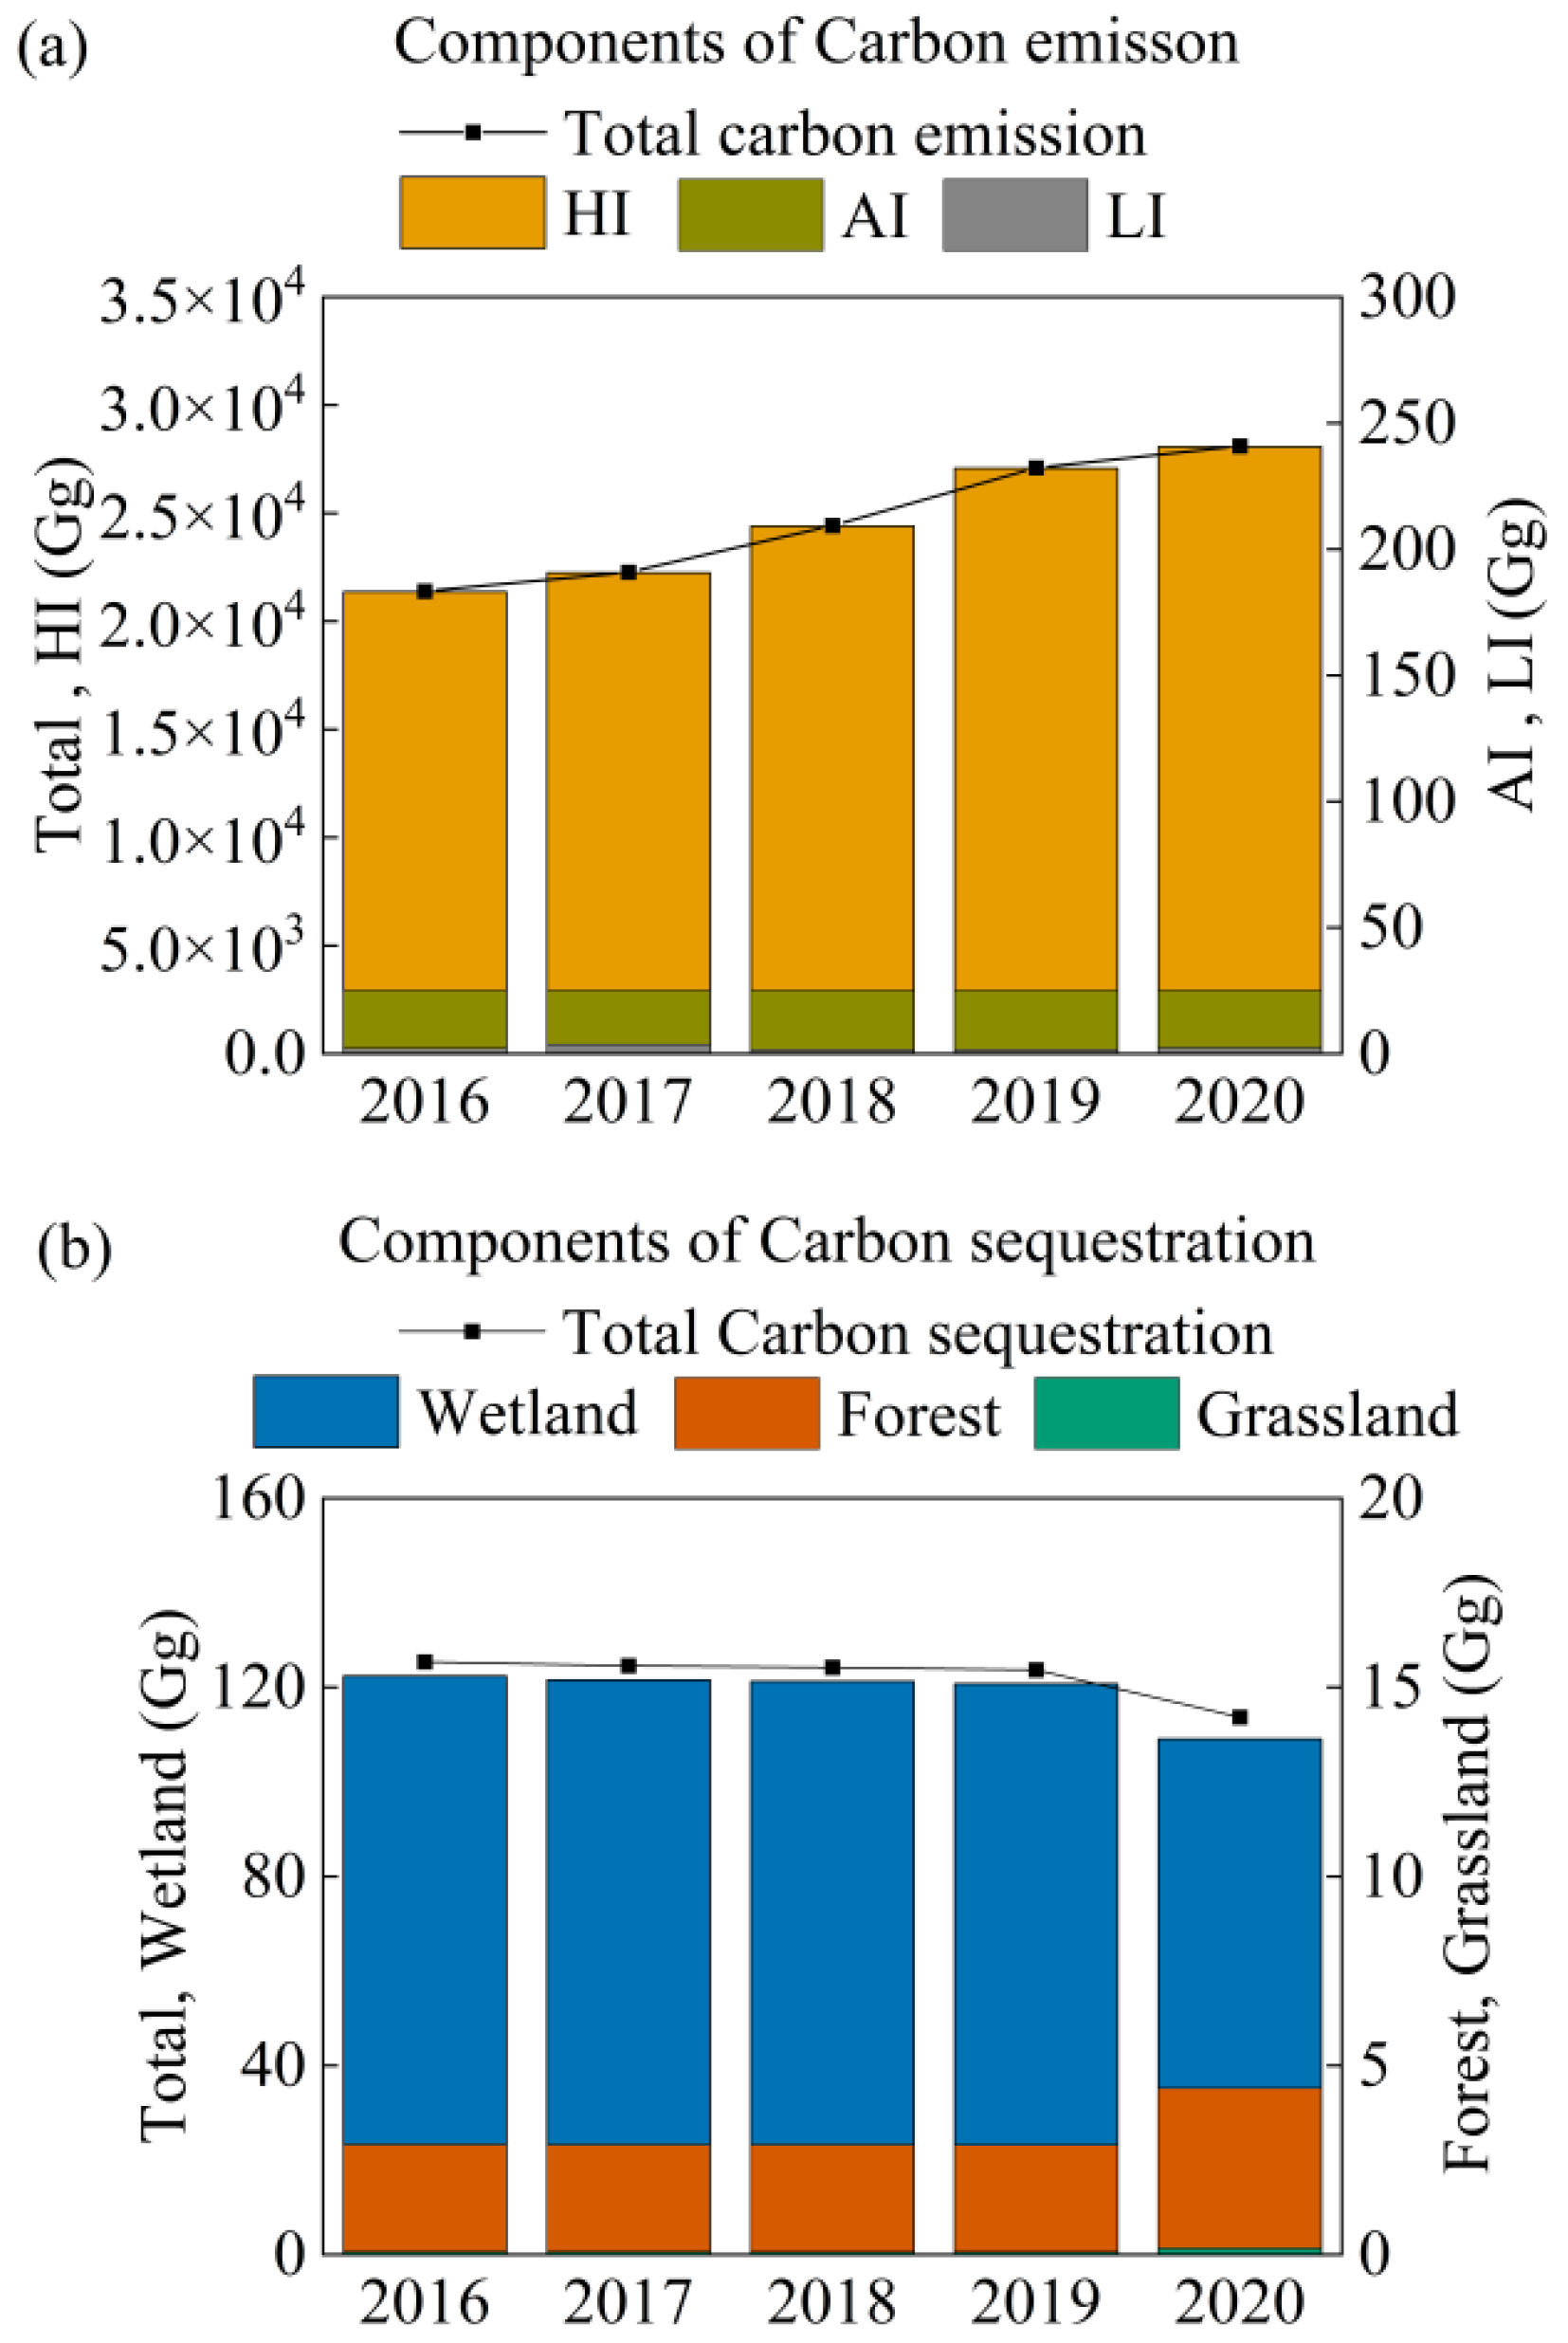
Human activities related to energy consumption, agriculture, and livestock were the sources of carbon emissions (Figure 3a). During the period from 2016 to 2020, fossil fuel burning was the dominant contributor, accounting for 99% of total carbon emissions. The trend in carbon emissions from energy consumption largely determined the changes in NAIC. The carbon emissions from agricultural and livestock fluctuated around 25 Gg and 2 Gg, respectively. In contrast, the natural environment, including forests, grasslands, and wetlands, reduced carbon emissions by 3.2 Gg, 0.09 Gg, and 119 Gg, respectively, with wetlands contributing the most to carbon sequestration (Figure 3b). From an annual variation perspective, carbon sequestration in forests and grasslands remained relatively stable. In 2020, however, it increased by 1.5 Gg and 0.09 Gg, respectively, compared to the previous year. In contrast, carbon sequestration in wetlands declined from 120.7 Gg in 2019 to 109.1 Gg in 2020. Despite wetlands covering over 25% of the region, extensive energy consumption continued to drive increases in carbon emissions.
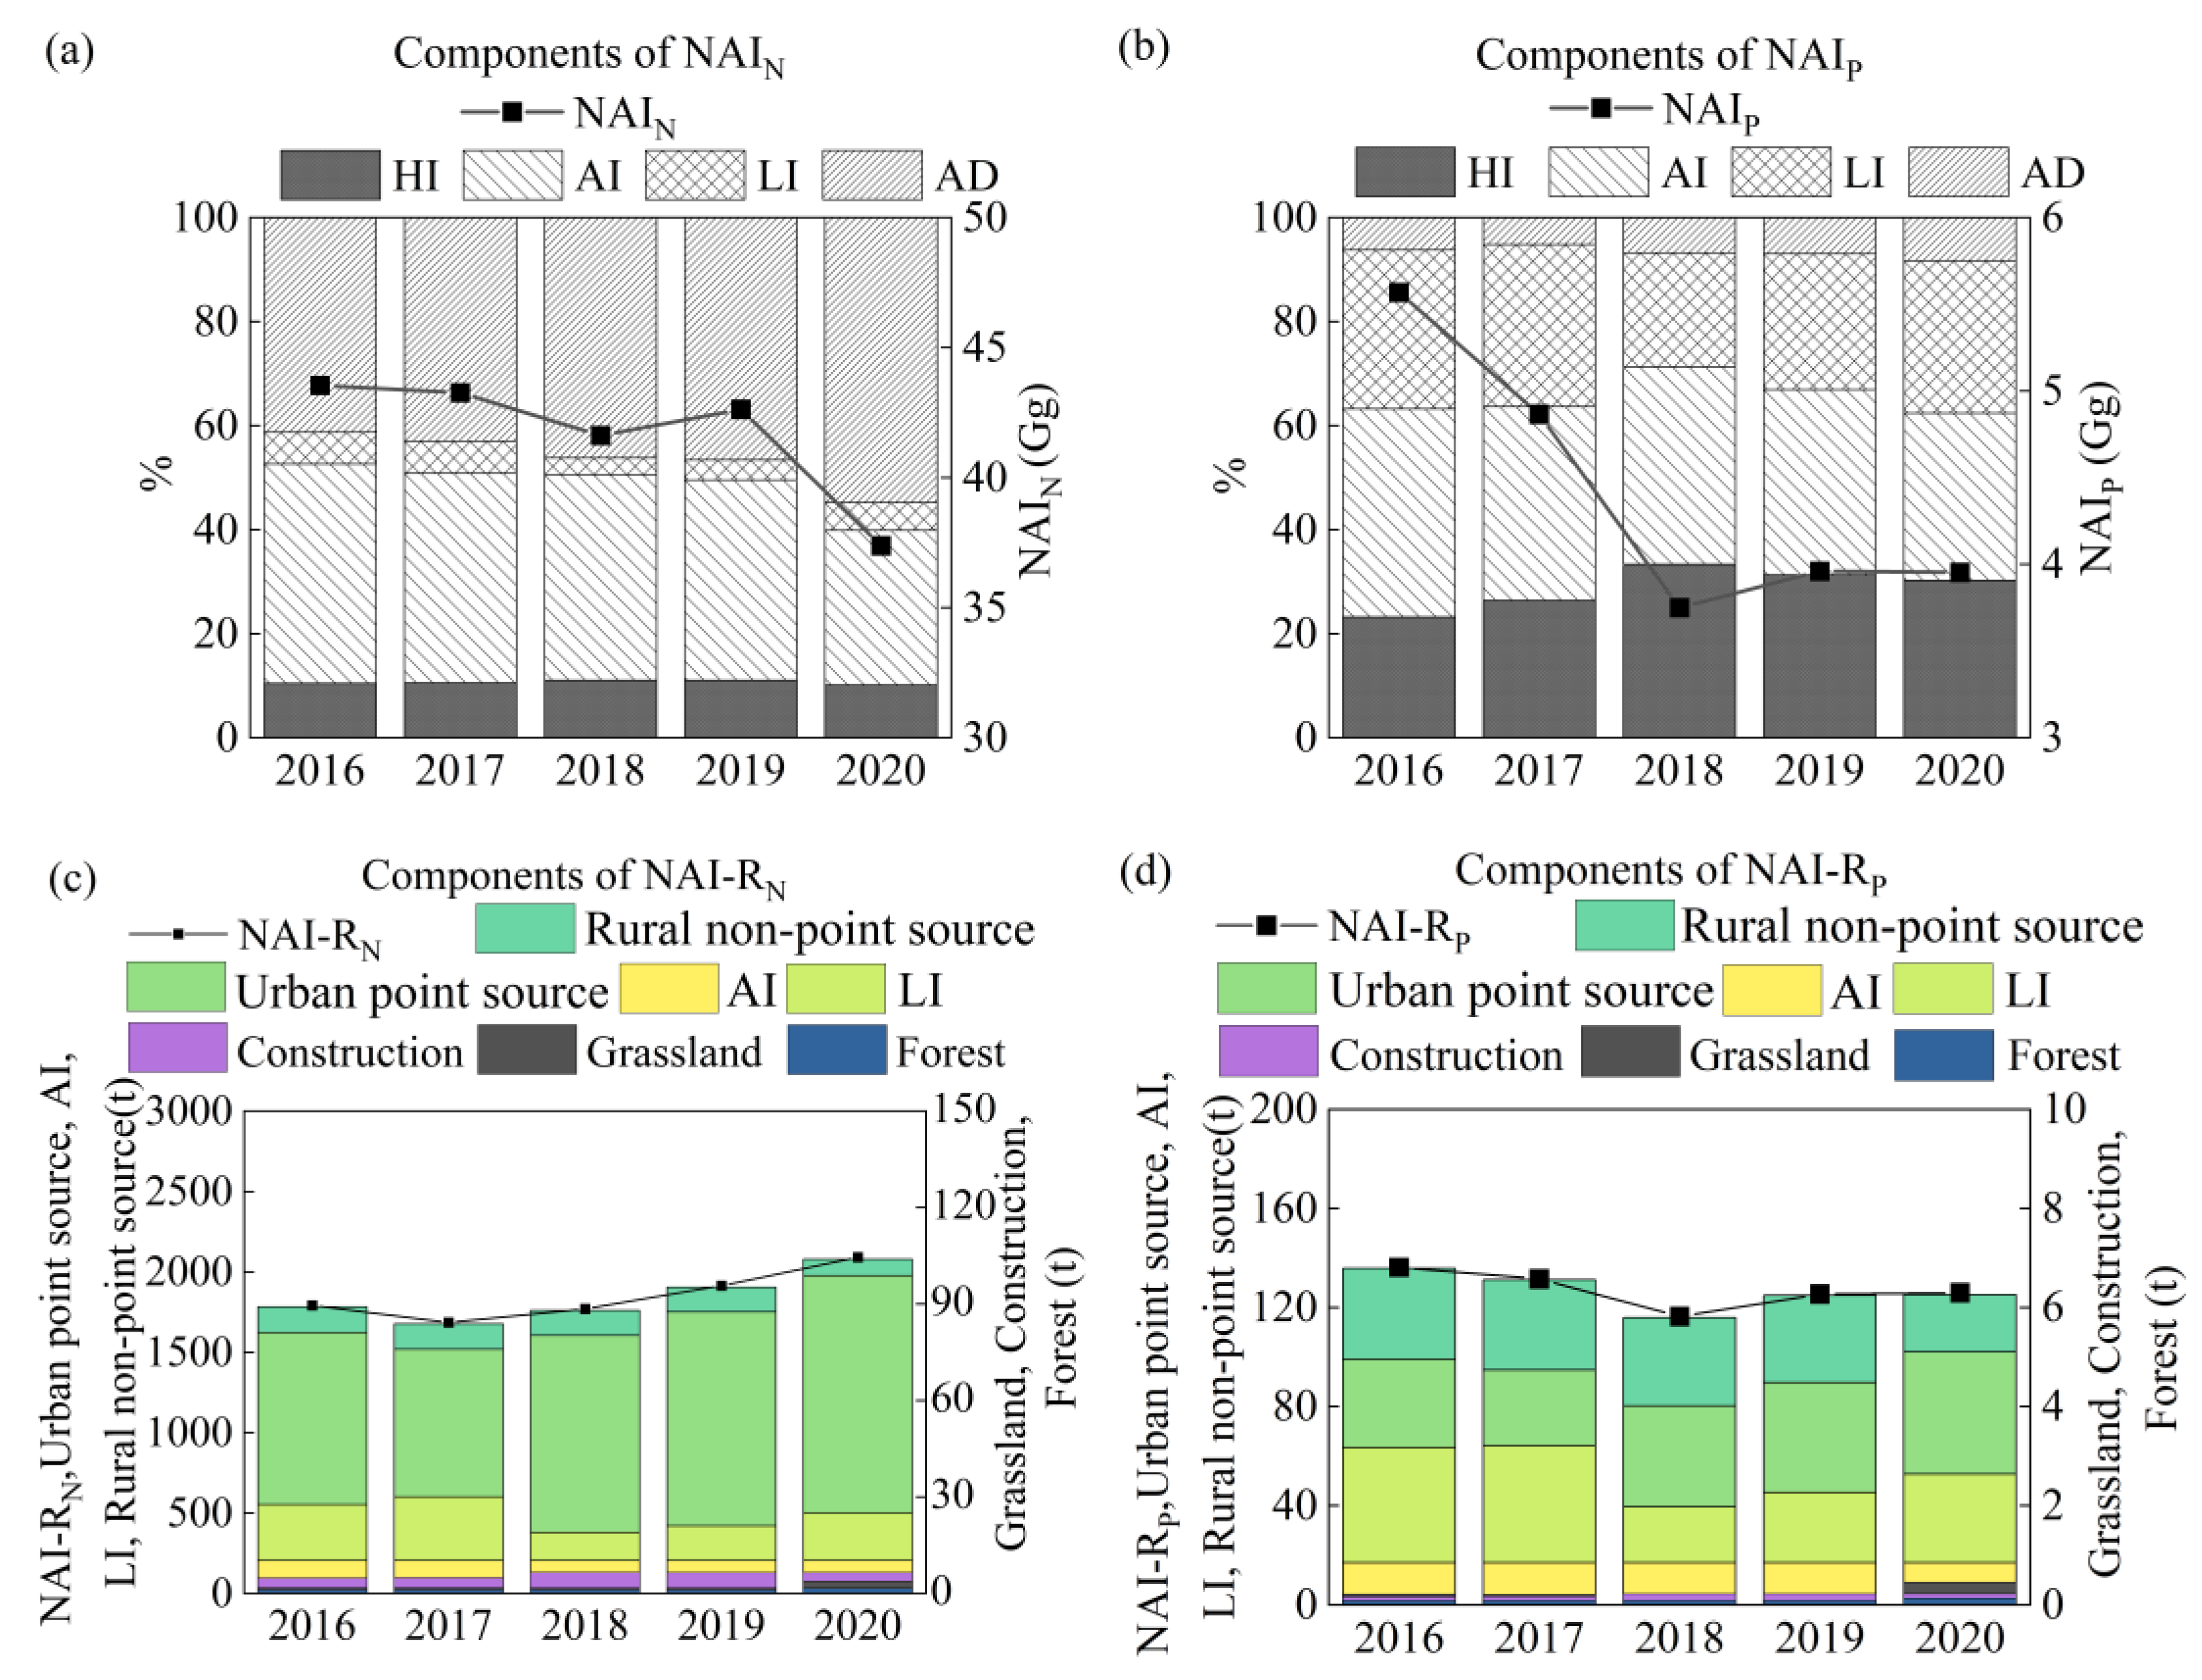
NAIN was composed of human consumption, agriculture, livestock, and atmospheric deposition, with mean values accounting for 10.7%, 38.0%, 4.9%, and 46.4% of the NAIN, respectively, during 2016–2020 (Figure 4a). Nitrogen inputs from atmospheric deposition fluctuated between 18 Gg and 20.5 Gg, mainly influenced by rainfall. In contrast, nitrogen contributions from human consumption, agriculture, and livestock exhibited declining trends over the five years, with reductions of 16.7%, 39.5%, and 25.0%, respectively. Consequently, the primary source of nitrogen inputs shifted from agricultural production in 2016 to atmospheric deposition by 2020.
Furthermore, net anthropogenic N inputs discharged into receiving water bodies (NAI-RN) were analyzed. On average, approximately 1.85 Gg of nitrogen per year was exported to water bodies, accounting for around 4.5% of the NAIN (Figure 4c). The interannual variation in nitrogen export exhibited fluctuations throughout the study period. Specifically, nitrogen discharges from urban point source pollution and livestock were the primary contributors to nitrogen influx into water bodies, accounting for 64.7% and 15.7%, respectively, over the past five years. This was followed by agricultural production and rural non-point source pollution, which contributed 11.1% and 8.0%, respectively. Non-point source discharges from construction land, forests, and grasslands together contributed approximately 0.5%. In terms of temporal variation, nitrogen discharges from construction land, forests, grasslands, and urban point source pollution exhibited increasing trends, with respective increases of 1.35, 1.51, 2.14, and 1.38 times. In contrast, nitrogen discharges from livestock and rural non-point source pollution showed decreasing trends, with reductions of 15% and 37%, respectively. Nitrogen discharges from agricultural production remained relatively stable. Urban point source pollution consistently remained the dominant source, contributing over 70% of NAI-RN by 2020.
The composition of NAIP was generally similar to that of NAIN. On average, phosphorus inputs from human consumption, agriculture, livestock, and atmospheric deposition contributed 28.9%, 36.6%, 27.8%, and 6.7% of NAIP, respectively (Figure 4b). During the period from 2016 to 2020, phosphorus inputs from human consumption, agriculture, and livestock decreased by 7.3%, 43%, and 32.1%, respectively. Phosphorus deposition exhibited fluctuations and contributed less overall compared to nitrogen. During the study period, approximately 0.13 Gg of phosphorus per year was discharged into water bodies, representing 2.9% of the NAIP. Although most phosphorus sources showed declining trends, the relative contributions of each source altered. The proportion of phosphorus from human consumption increased from 20% to 30%, while the share from agriculture and livestock declined by 7% and 10%, respectively.
Despite the reduction in NAIP, net anthropogenic nitrogen inputs discharged into receiving water bodies (NAI-RP) showed an overall decreasing trend (Figure 4d). Urban point sources and livestock were the primary contributors, accounting for 31.8% and 28% of NAI-RP, respectively. The following contributors were rural non-point sources and agricultural production, which accounted for 26.3% and 13.4%, respectively. Non-point source discharges from construction land, forests, and grasslands collectively contributed 0.5%. Regarding interannual variation from 2016 to 2020, phosphorus discharges from construction land, urban point sources, forests, and grasslands increased by 1.35, 1.38, 1.51, and 2.14 times, respectively. In contrast, discharges from livestock and rural nonpoint sources declined by 23% and 37%, respectively, while phosphorus discharges from agricultural production remained relatively stable. Livestock was initially the dominant source of NAI-RP, but its share declined from 34.1% to 28.4%. Conversely, the contribution from urban point sources rose from 26.2% to 39.1%, surpassing livestock to become the leading source of discharge. By 2020, phosphorus discharges from urban and rural human consumption represented 57% of NAI-RP. Overall, the consumption of carbon, nitrogen, and phosphorus driven by human activities has directly contributed to climate warming and intensified pollutant inputs into the environment.

4. Discussion

4.1. Associations of Net Anthropogenic C, N, and P Inputs

Human activities consume substantial energy resources to support socio-economic development, which in turn improves the quality of life and advances environmental protection initiatives. On the other hand, natural forests, grasslands, and wetlands provide essential carbon sequestration services but also contribute to the export of pollutants to water bodies under rainfall-driven conditions [37,46]. In addition, anthropogenic pressures have further altered these natural processes by converting forests, grasslands, and wetlands into construction land or agricultural areas, disrupting the functions of these ecosystems. Consequently, carbon, nitrogen, and phosphorus inputs under human influence are intrinsically interconnected and should be paid greater attention. For example, the analysis above indicated that NAIC in Panjin entered a phase of rapid growth after 2016, which was closely linked to the implementation of several large-scale oil projects in the city, including oil and gas drilling operations and the Huajin petrochemical project. Over the following five years, GDP increased by 29.1 billion yuan, while 661 km of drainage pipelines were added, and the use of nitrogen and phosphorus fertilizers decreased by 8070 t and 1096 t, respectively. Additionally, livestock farming gradually declined. These transformations collectively explain the reduction in NAIN and NAIP per unit GDP after 2016. The decline in nitrogen and phosphorus inputs concurrently demonstrates the effectiveness of optimized fertilizer management, industrial restructuring, and infrastructure upgrades such as wastewater treatment.
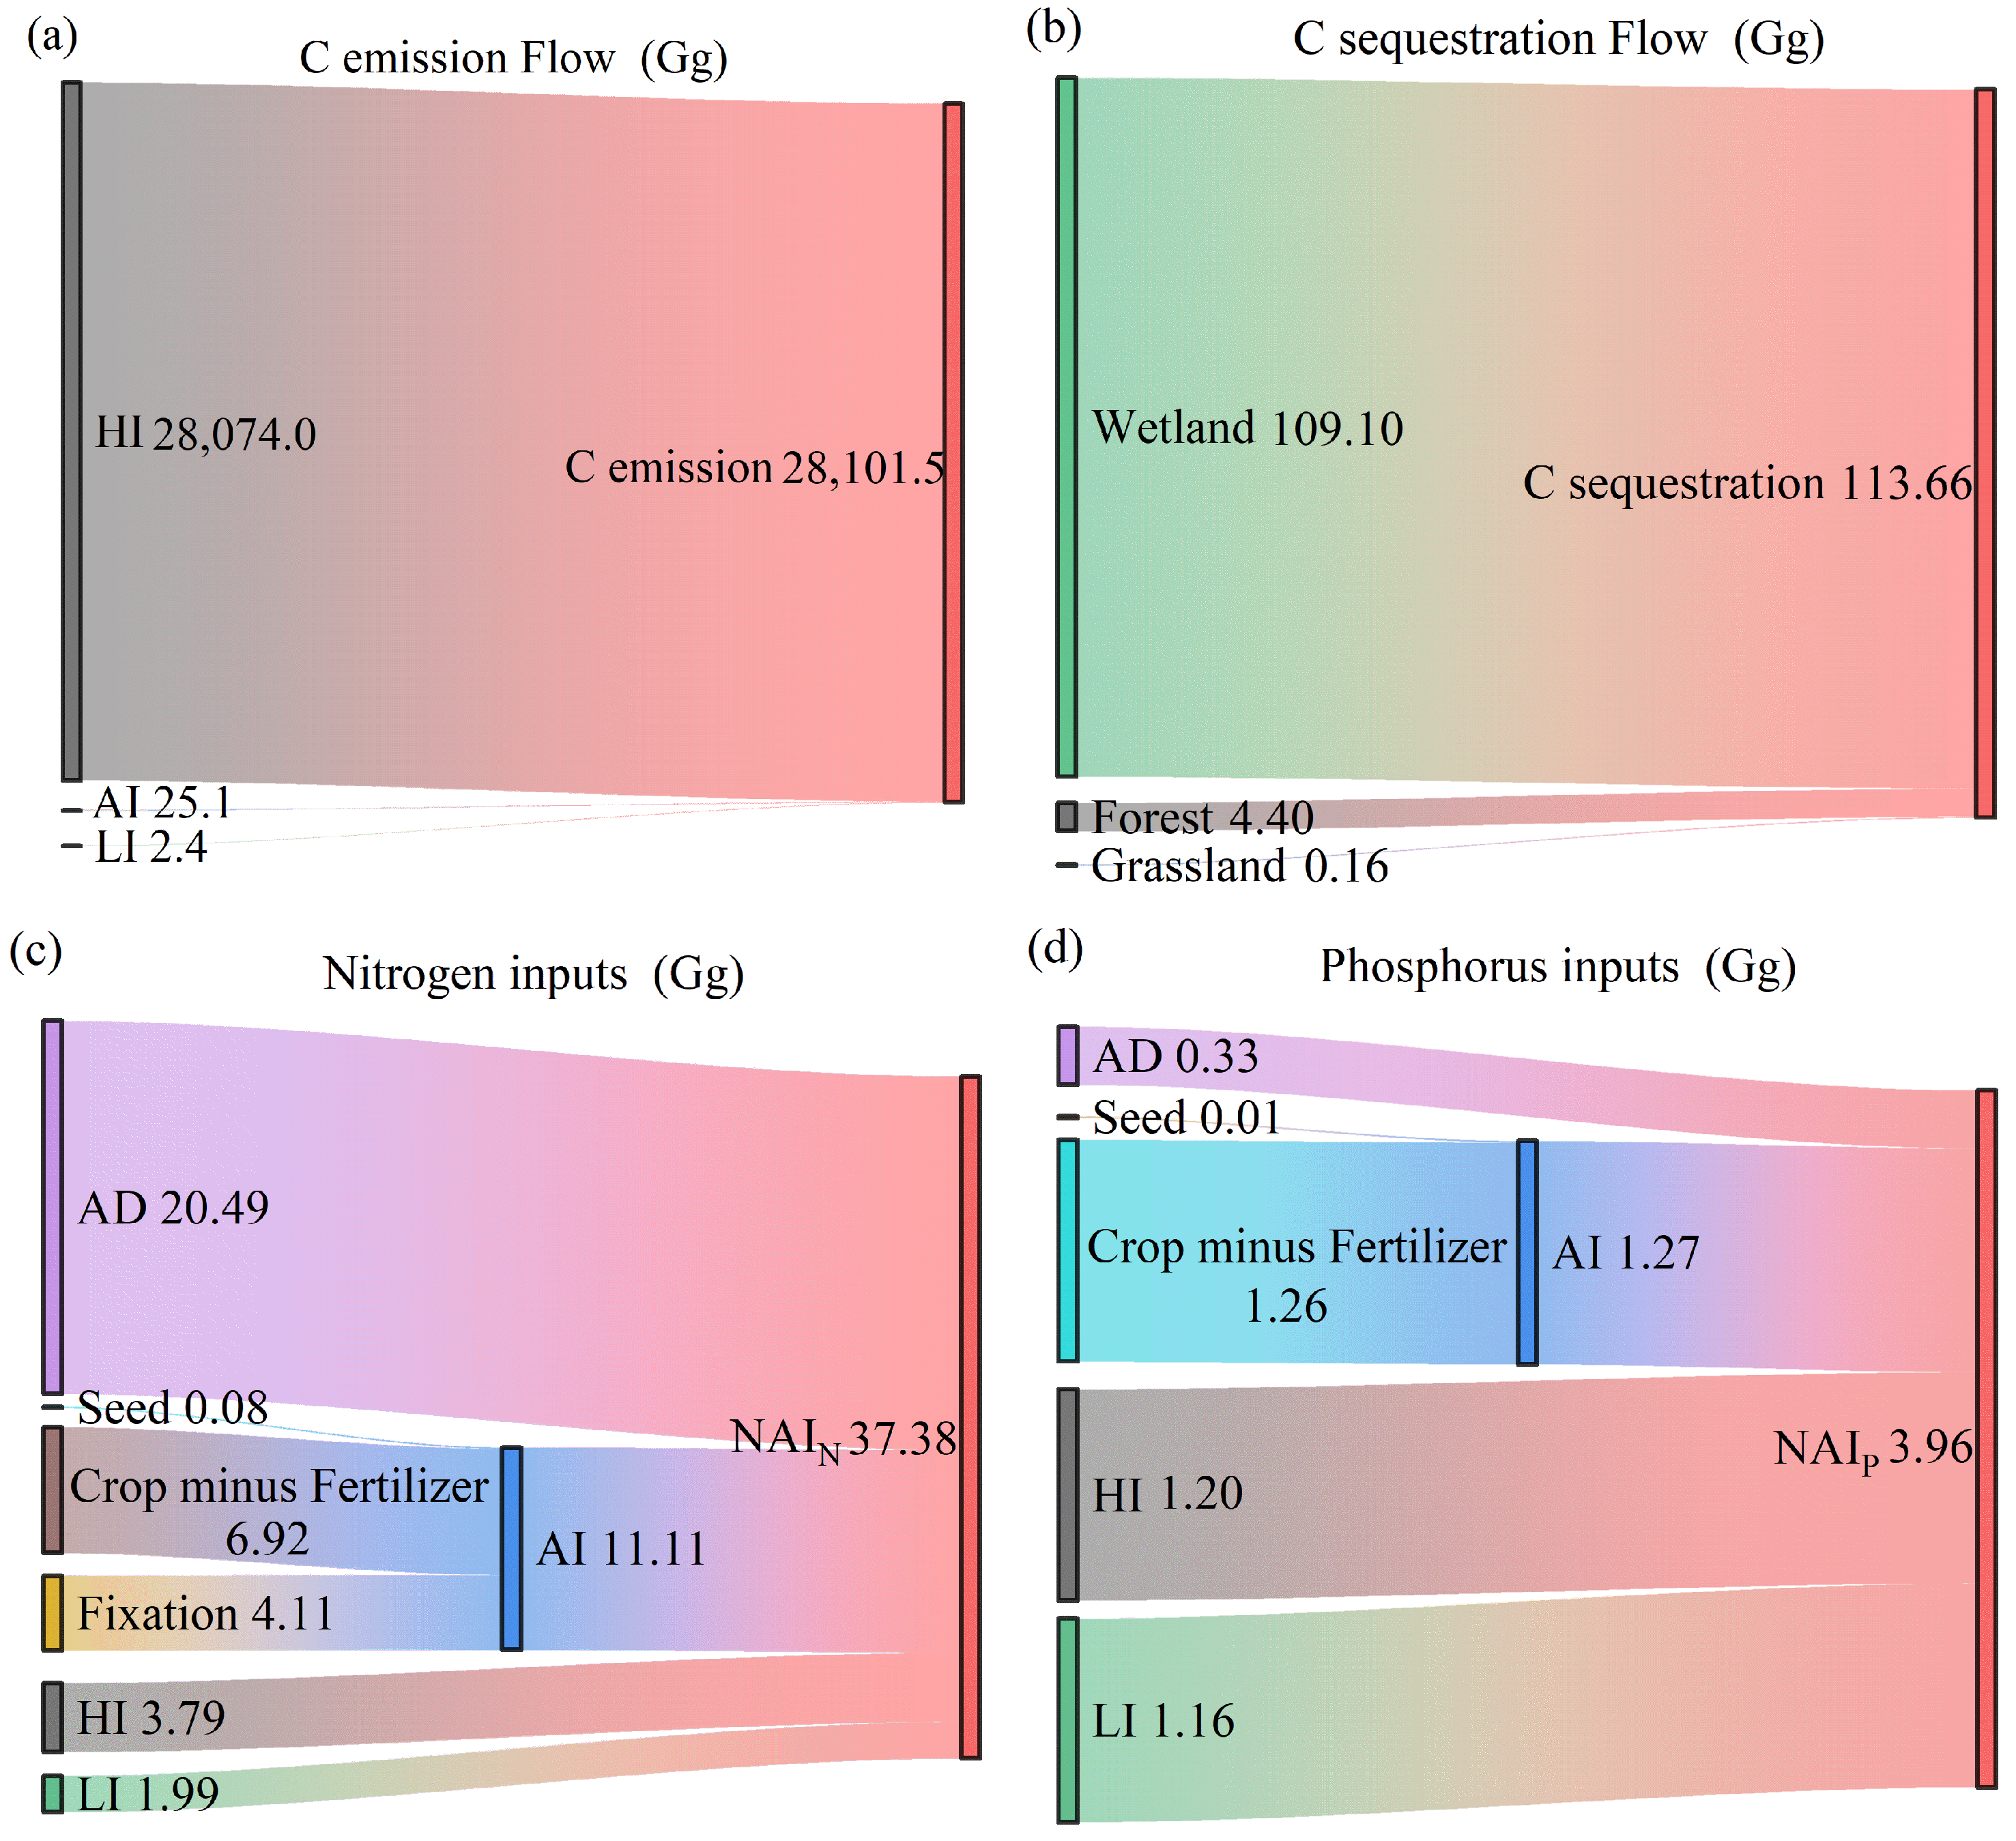
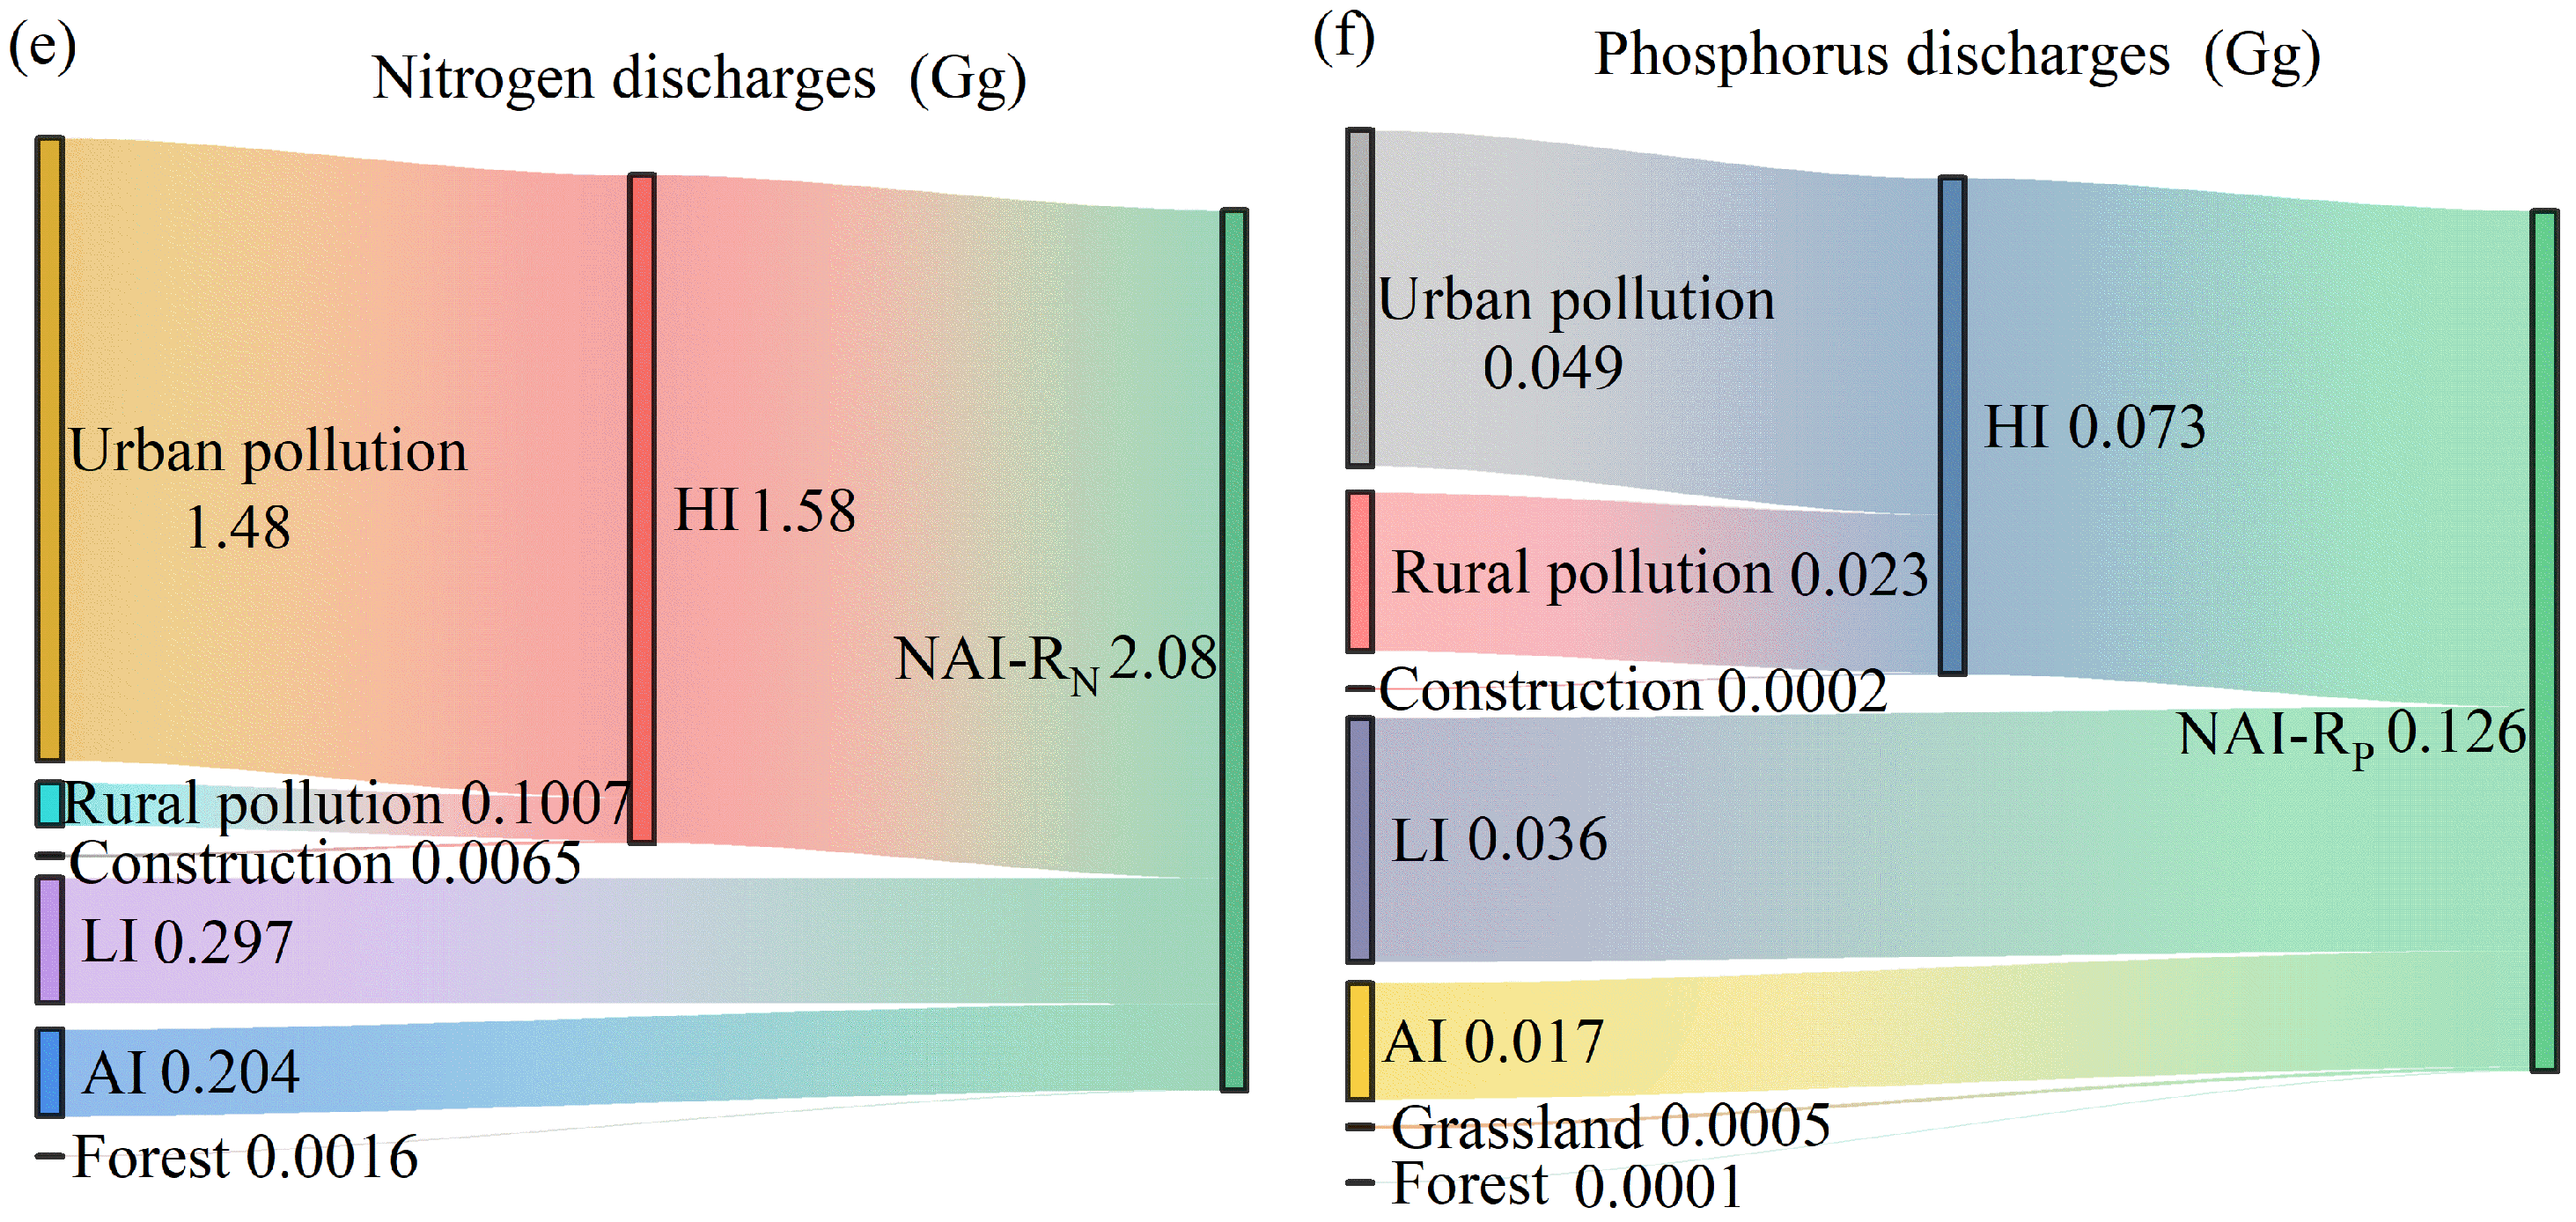
Next, this study focused on Panjin city in 2020 to illustrate the interactions between carbon, nitrogen, and phosphorus inputs influenced by human activities (Figure 5). Human consumption, agricultural production, and livestock farming, combined emitted 28.1 Tg of carbon (Figure 5a). During the same period, the city experienced steady economic growth, with a 2.27 billion yuan increase in GDP. Additionally, infrastructure development was enhanced, as evidenced by the installation of 13.42 km of new drainage pipelines and an upgraded wastewater treatment capacity of 1.284 × 10⁷ m3/day. Under these conditions, the sum of net N inputs from human consumption, agricultural production, and livestock were 16.9 Gg N and 3.6 Gg P, respectively (Figure 5c,d). The wastewater treatment system reduced pollutant inputs by 2.2 Gg N and 0.25 Gg P, respectively. Ultimately, 2.09 Gg N and 0.126 Gg P were discharged into water bodies (Figure 5e,f). In natural processes, forests, grasslands, and wetlands sequestered 114 Gg C, while releasing 5.4 t N and 0.6 t P (Figure 5b,e,f). Atmospheric deposition contributed an additional 20.5 Gg N and 0.33 Gg P. Net inputs from agricultural production were 25.1 Gg C, 11.1 Gg N, and 1.3 Gg P, with 204 t N and 17 t P subsequently released into water bodies, resulting in the production of 1770 Gg of food. Net inputs from livestock were 2.4 Gg C, 2.0 Gg N, and 1.2 Gg P, contributing 297 t N and 36 t P to water bodies and supporting the production of 2.5 million livestock. This analysis further confirmed that anthropogenic inputs of carbon, nitrogen, and phosphorus are interconnected, and that the associated processes generate both beneficial and adverse effects.
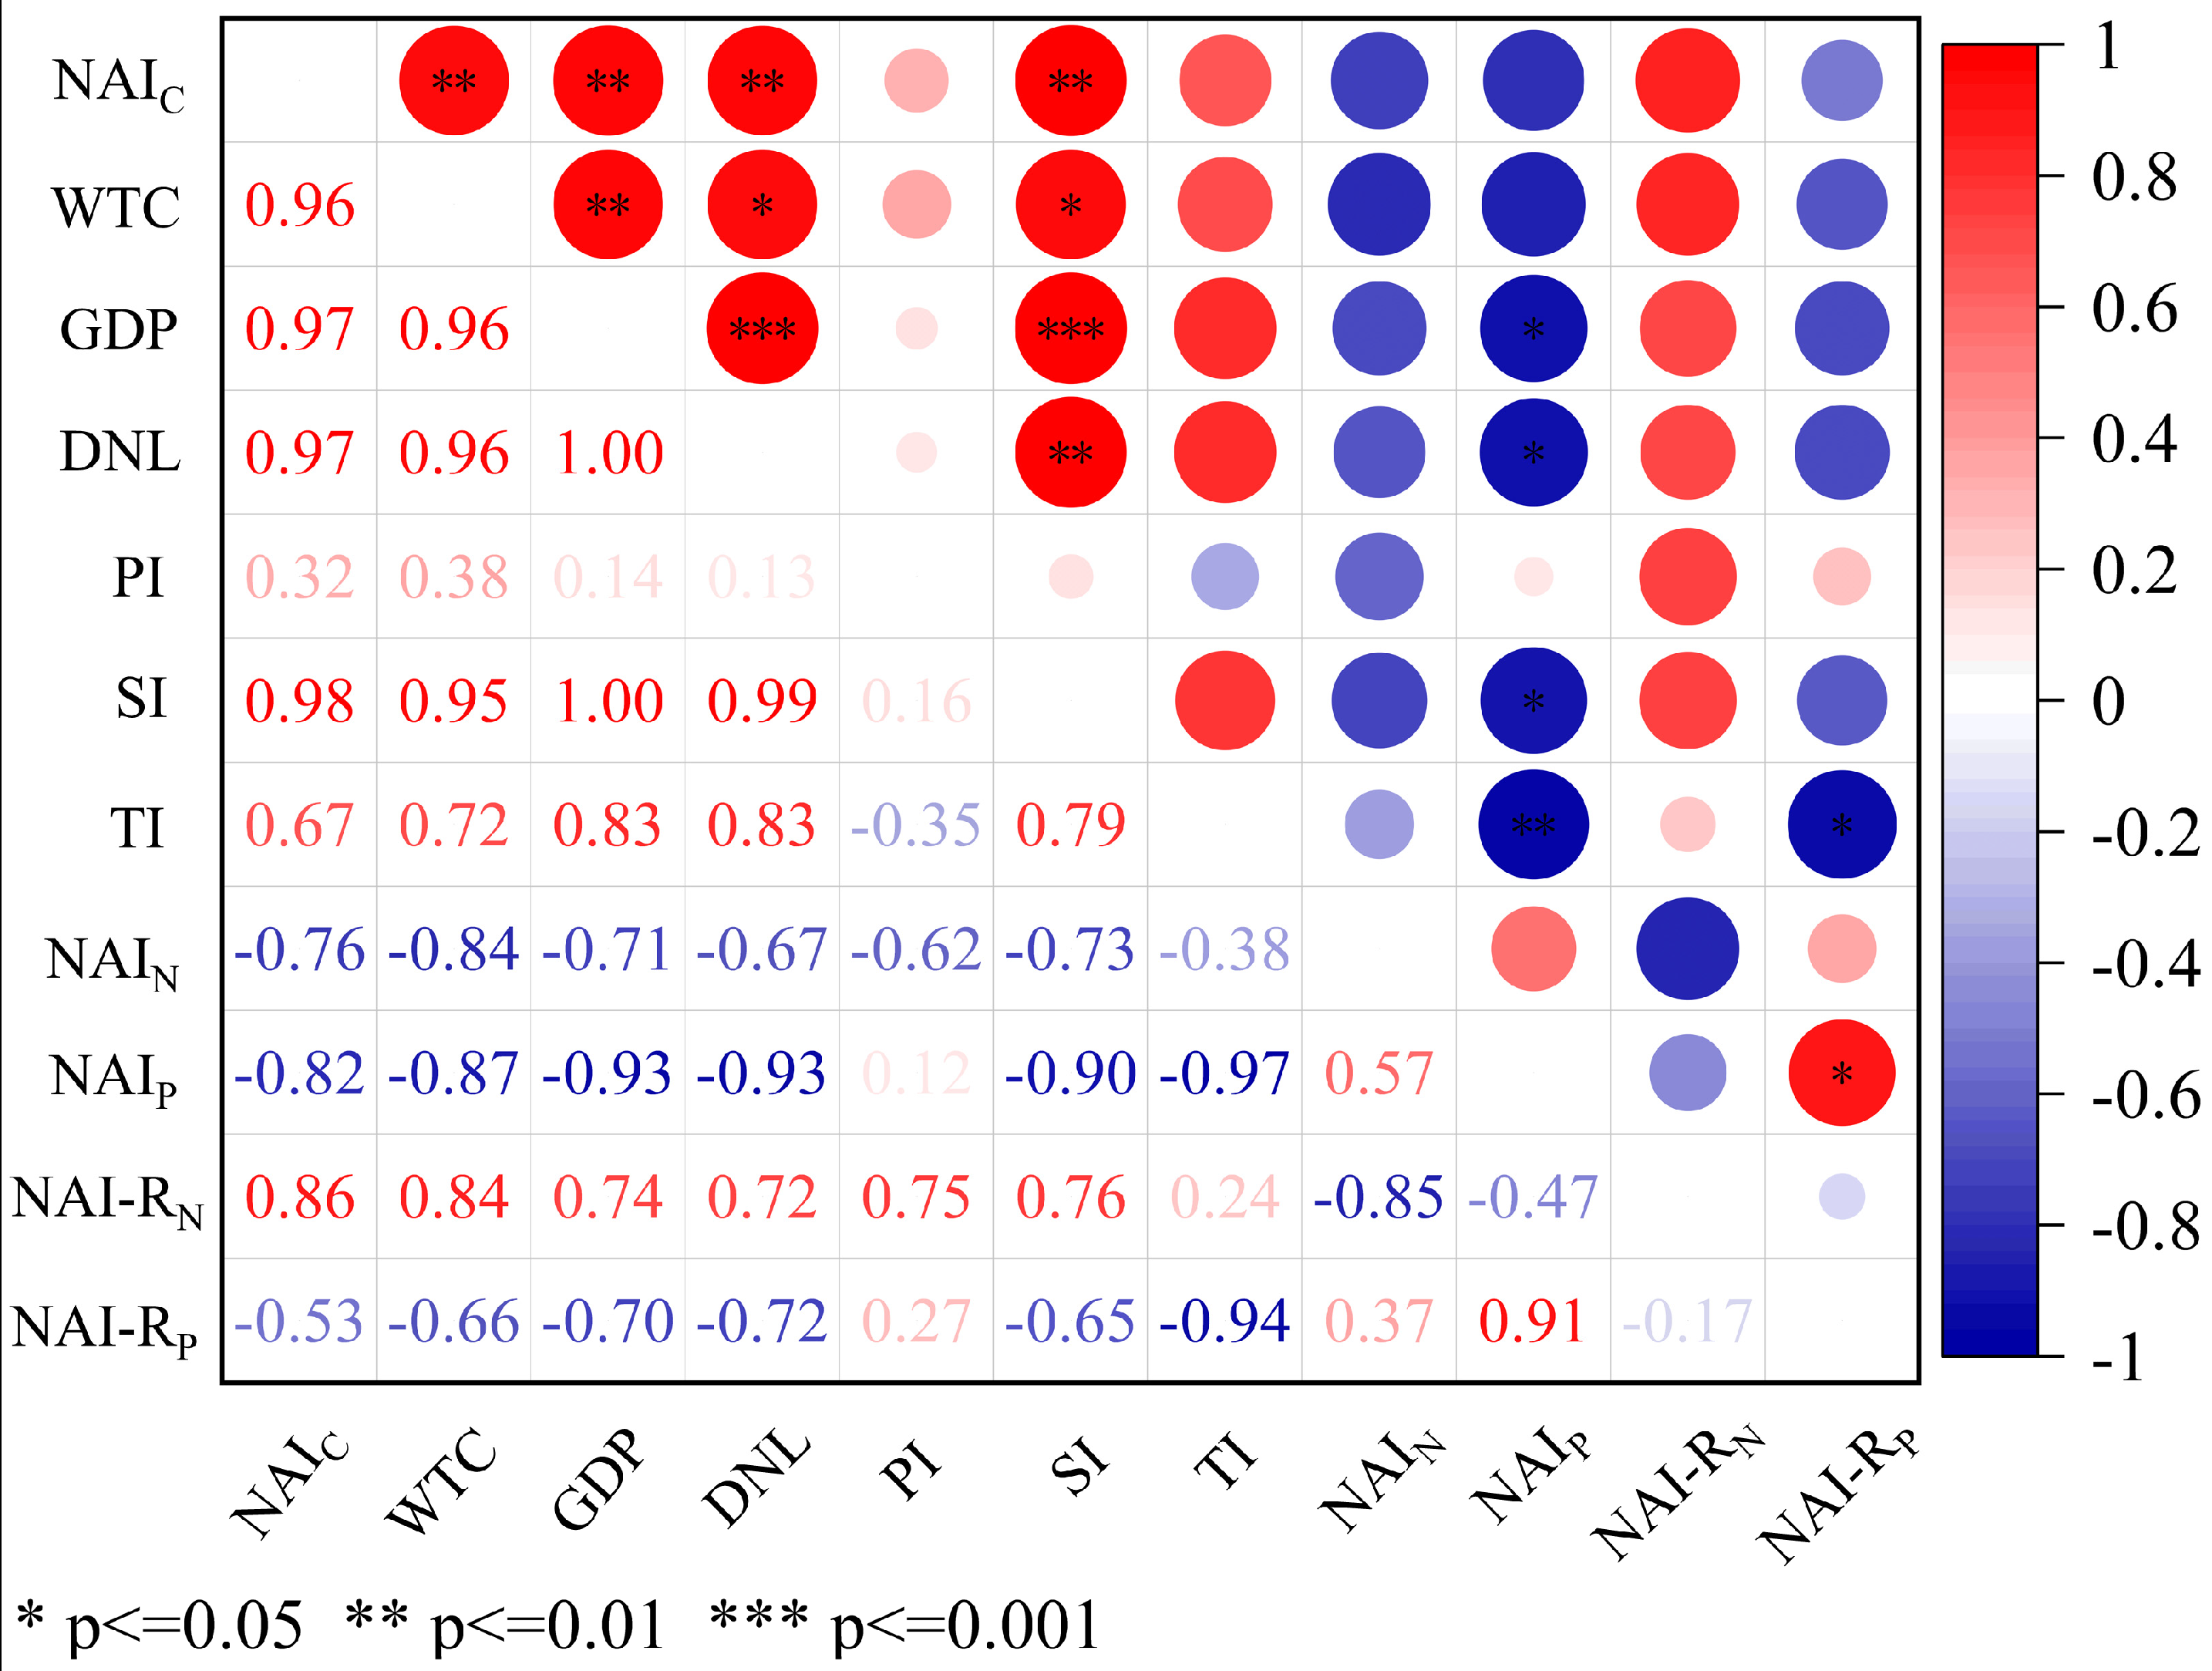
We propose that the increase in carbon emissions reflects both economic development and structural transformation. Correspondingly, economic growth has strengthened human capacity for environmental protection, contributing to a reduction in pollutant inputs. Correlation analysis (Figure 6) revealed that NAIC was positively associated with total GDP, wastewater treatment capacity (WTC), drainage network length (DNL), and the GDP of the secondary industry (SI), while negatively associated with NAIN and NAIP, supporting our hypothesis. To further explore the relationship between C, N, and P, this paper defined pollution intensity as the ratio of pollutant input or discharge to the corresponding C emissions. A lower pollution intensity indicates higher carbon use efficiency.
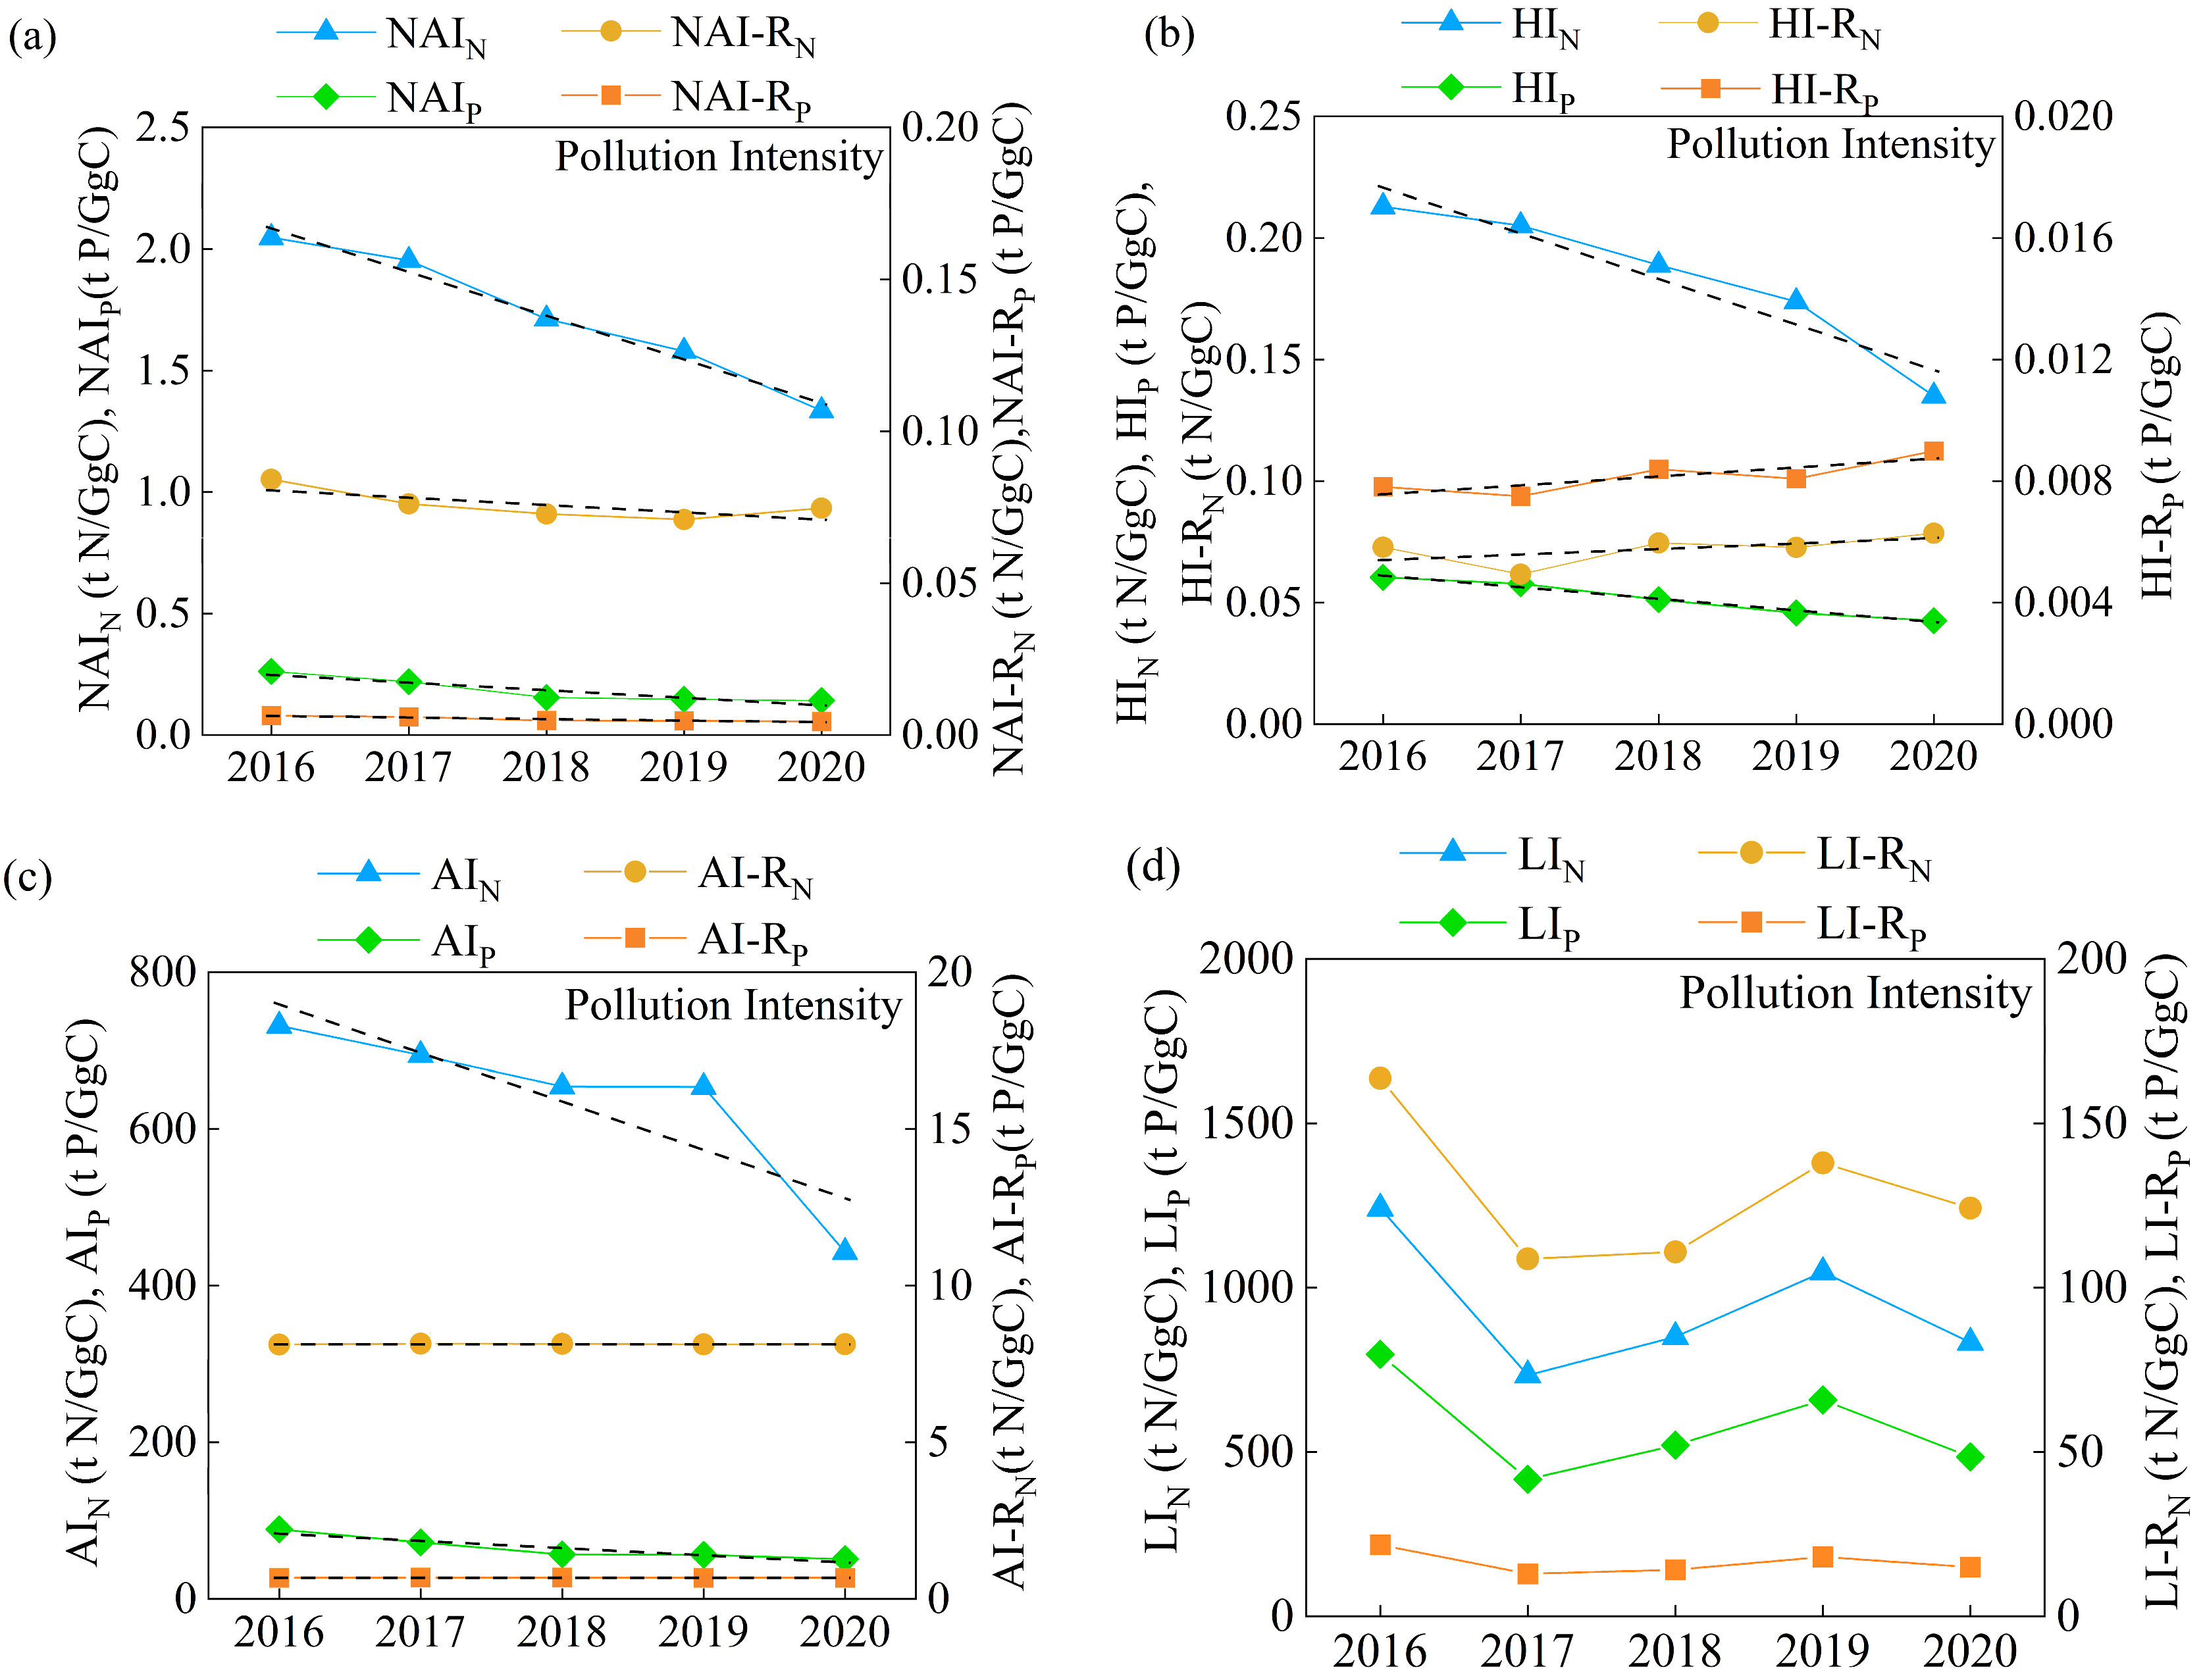
The net nitrogen and phosphorus input pollution intensities (NAIN and NAIP per NAIC) declined over the study period, suggesting improved carbon use efficiency (Figure 7a). Similarly, the total nitrogen and phosphorus discharges pollution intensities (NAI-RN and NAI-RP per NAIC) showed an overall decreasing trend. The human consumption pollution intensities (HIN and HIP per HIC) followed a downward trend, which may be attributed to a decreasing population and rising per capita energy consumption (Figure 7b). In contrast, the pollution removal intensities (nitrogen and phosphorus removed by the wastewater treatment system per HIC) increased, indicating that wastewater treatment capacity expanded alongside economic growth. Despite improvements in treatment capacity, the nitrogen and phosphorus discharge intensities from human wastewater (per HIC) exhibited a fluctuating trend, potentially driven by increased per capita water usage associated with higher economic levels. Over the past five years, per capita water consumption increased by 44 t, leading to a corresponding rise in wastewater discharge volumes from treatment plants. In addition, human wastewater discharge patterns have shifted from rural non-point source pollution to urban point source pollution.
The agricultural production input pollution intensities (AIN and AIP per AIC) exhibited a decreasing trend, attributed to improved fertilizer use efficiency (Figure 7c). The use of nitrogen and phosphorus fertilizers per rice input decreased by approximately 35%. Rice yield per Gg C emissions increased from 38 Gg to 42 Gg. On average, for every 1 Gg of C emitted from agricultural production, roughly 8 t of N and 0.68 t of P were discharged into receiving water bodies. The livestock input pollution intensities (LIN and LIP per LIC) fluctuated, primarily due to the livestock farming structure (Figure 7d). The changes in cattle farming lead to dynamic variations in greenhouse gas emissions. The nitrogen and phosphorus inputs from livestock, along with the nitrogen and phosphorus discharges relative to carbon emissions from livestock, were approximately 0.9 Gg N input per Gg C, 0.6 Gg P input per Gg C, 0.13 Gg N export per Gg C, and 0.017 Gg P export per Gg C, respectively. In natural processes, forests sequestered 1 Gg of C, resulting in the export of 3.5 t of N and 0.03 t of P into water bodies. Similarly, grasslands sequestered 1 Gg of C, resulting in the export of 23.5 t of N and 0.3 t of P into water bodies. Therefore, both human activities and natural processes have dual effects of pollution inputs and mitigation.

4.2. Comprehensive Assessment and Identification of Driving Forces

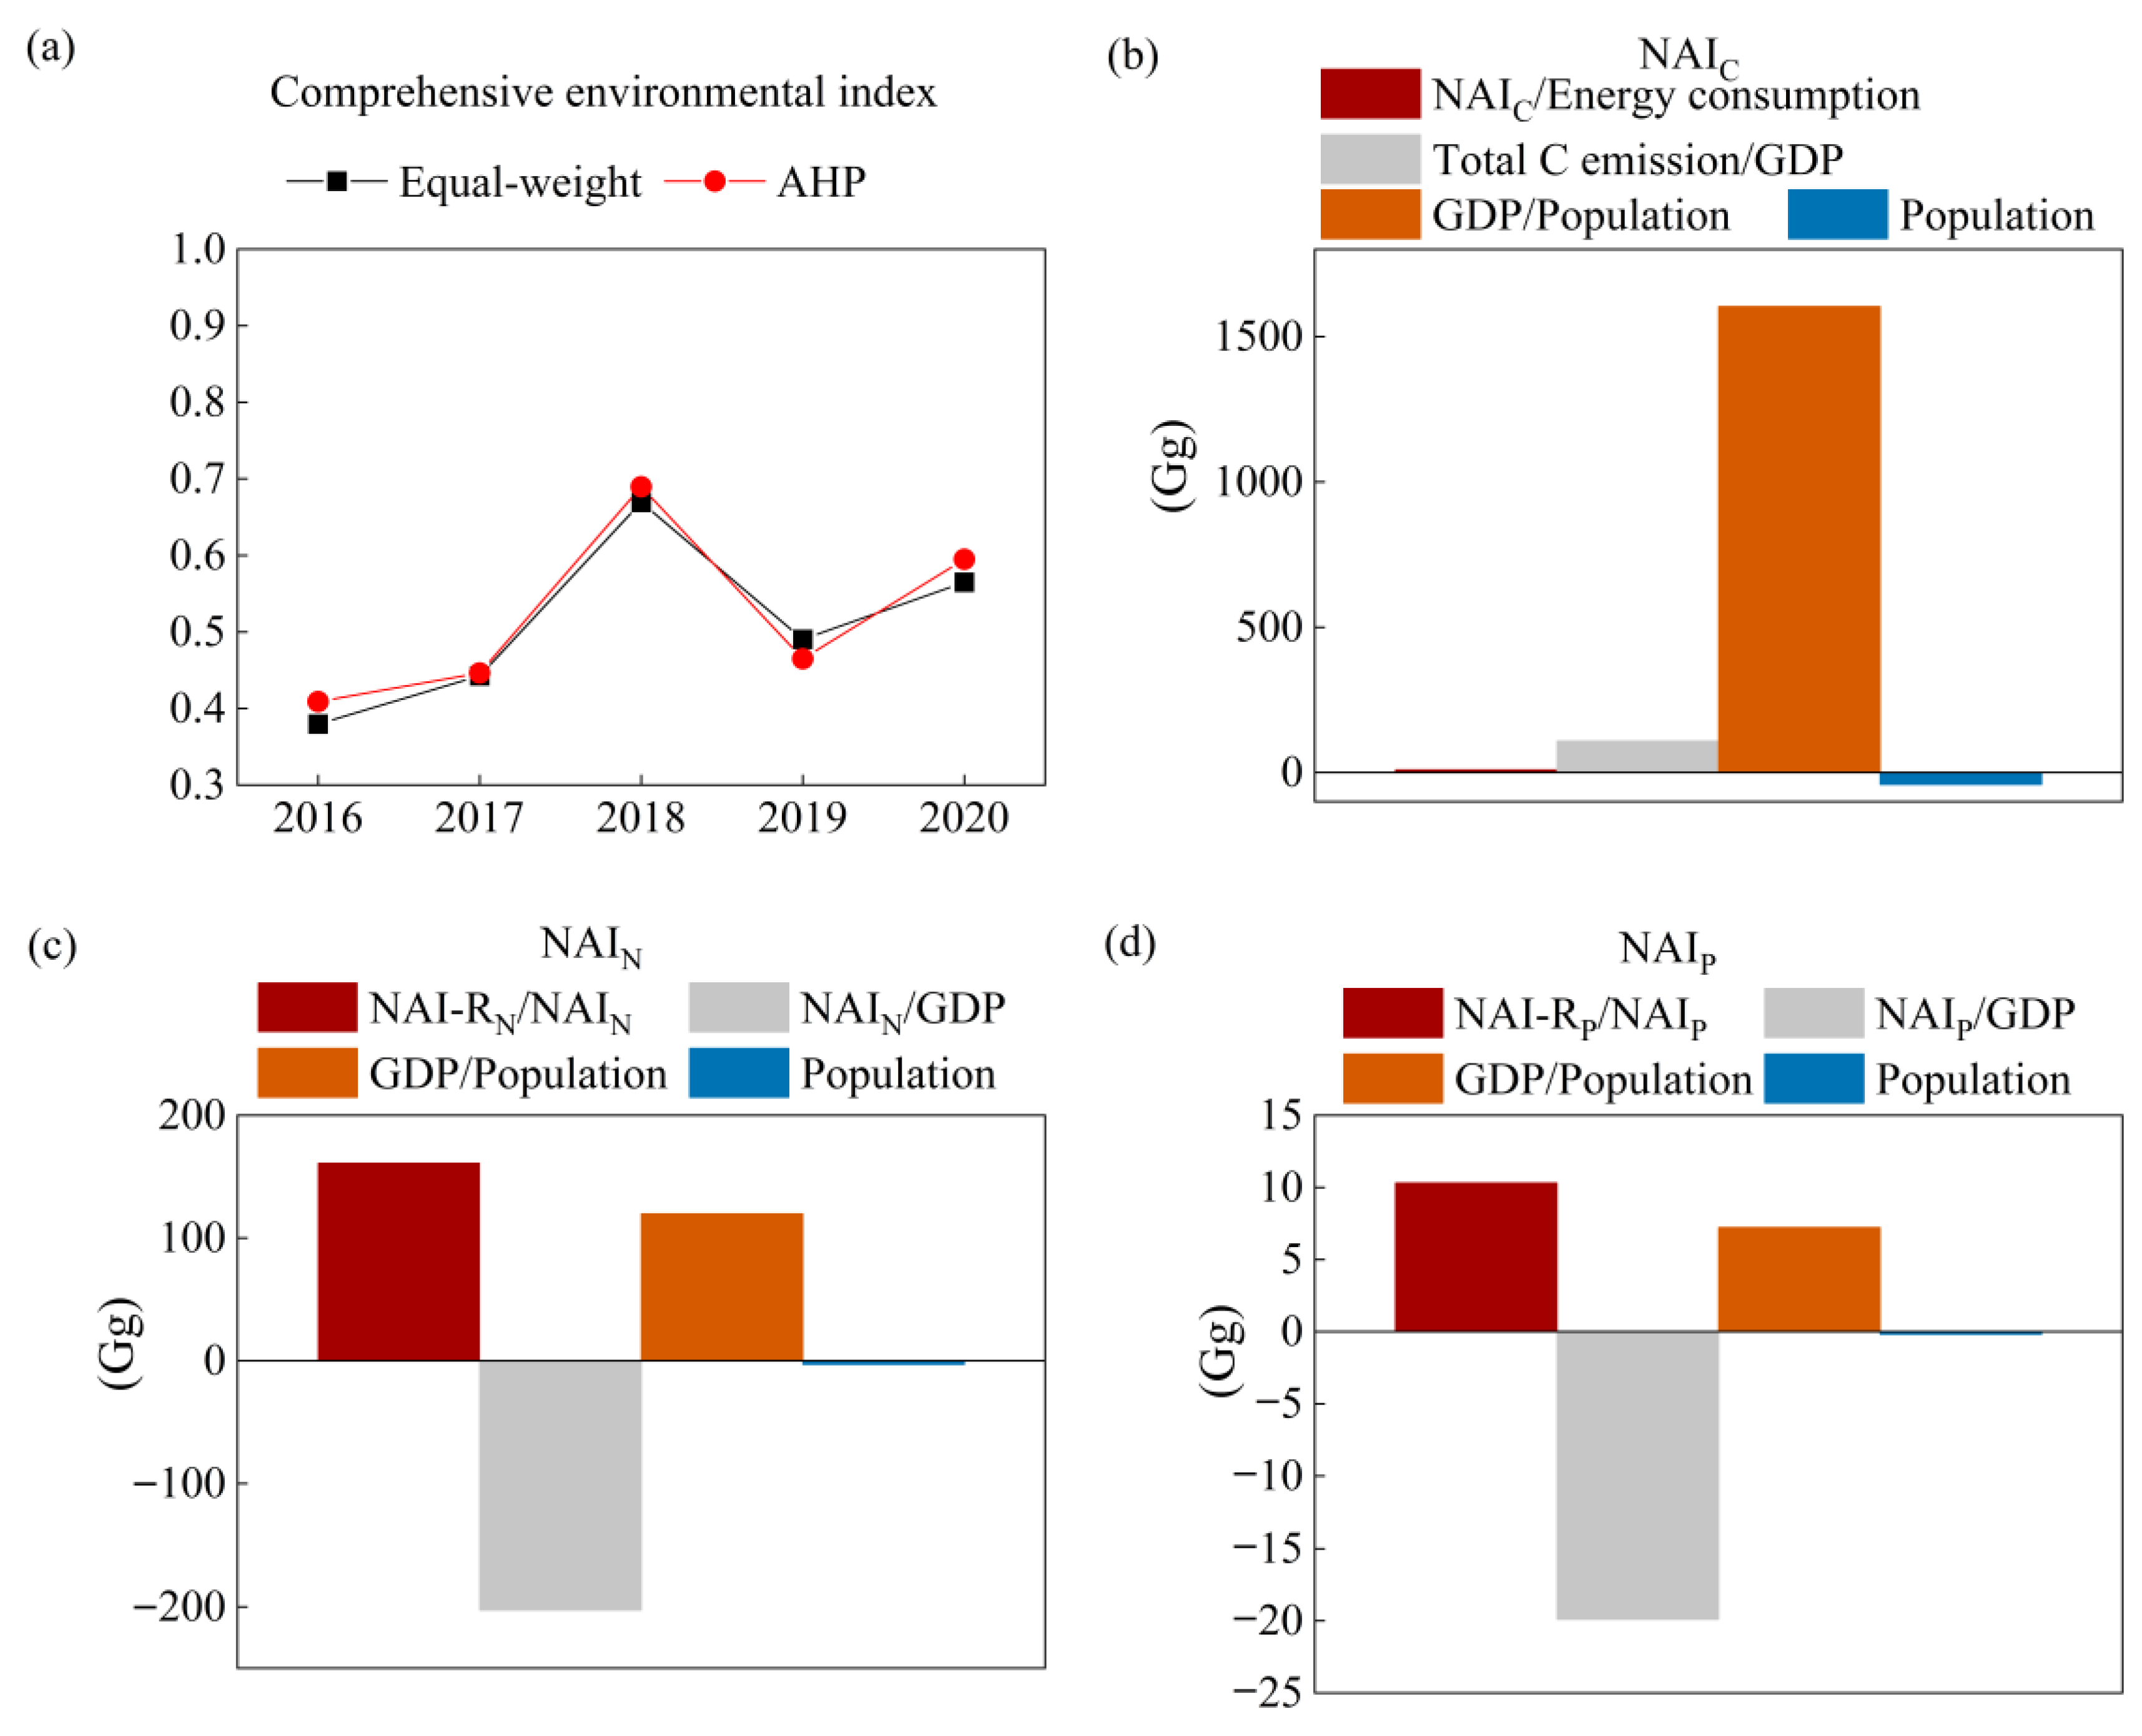
The variable fuzzy method was applied to assess the comprehensive environmental impact of anthropogenic carbon, nitrogen, and phosphorus inputs in Panjin city. Sixteen indicators were selected based on pollution sources and input characteristics. Specifically, carbon sequestration by forests, grasslands, and wetlands was defined as a positive factor, with the remaining thirteen indicators categorized as negative. The results indicated an improving trend in the comprehensive environmental index across various weighting scenarios (Figure 8a). The index peaked in 2018, primarily due to reductions in greenhouse gas emissions and pollution from livestock. However, the overall index remained relatively low, reflecting continued reliance on an energy consumption-driven model of economic growth.
Moreover, the LMDI method was employed to analyze the driving factors behind anthropogenic carbon, nitrogen, and phosphorus inputs (Figure 8b–d). Over the past five years, energy structure, energy efficiency, and economic scale factors contributed to the increase in NAIC, with economic scale alone accounting for 93% of the total growth. This finding further confirmed that economic development in Panjin city remained predominantly dependent on energy consumption. Regrettably, the carbon sequestration capacity of forests, grasslands, and wetlands was insufficient to offset greenhouse gas emissions from fossil fuel use, and the expansion of construction land led to the reduction in wetland areas. In response to this situation, Panjin City can mitigate carbon emission pressures from economic growth by promoting zero-carbon energy development, applying deep decarbonization technologies, and establishing a circular economy system. In addition, the economy in Panjin city was at a lower level compared to other regions in China, and the population decline resulting from out-migration also contributed to the decrease in NAIC. However, achieving sustainable development in the long term will still require structural transformation and technological upgrading.
Notably, the factors influencing the growth of NAI-RN and NAI-RP differed from those of NAIC, with pollution structure and economic scale serving as the primary drivers. The pollution intensity and population size factors contributed to the reduction in NAI-RN and NAI-RP, influenced by the industrial development of Panjin city. Despite a decrease in population, water usage increased by 1.4 times over the past five years. The statistical yearbook indicated that wastewater treatment capacity in Panjin city exceeded the volume of wastewater discharged, suggesting that increased water usage led to higher volumes of wastewater discharged from treatment plants. Previous analysis also noted that the proportion of nitrogen and phosphorus from urban wastewater discharges in total nitrogen and phosphorus discharges into receiving water bodies continued to increase. Correspondingly, driven by economic transformation, pollution discharges from agriculture and livestock gradually decreased.

4.3. Management Implications

Panjin city remained dependent on a development model driven by fossil fuel consumption, with the economic structure dominated by the secondary sector [57]. Although the wastewater treatment capacity exceeded discharge volumes, the excess capacity indicated that some human activities contributed to environmental protection. However, economic growth led to a consistent increase in water consumption, resulting in elevated pollutant discharges from urban wastewater. In addition, urban expansion decreased the extent of wetland areas in Panjin city, thereby diminishing the capacity for carbon sequestration. Considering the interrelated nature of anthropogenic carbon, nitrogen, and phosphorus inputs, we recommend implementing a comprehensive control strategy, which includes a novel management model, ecological restoration, promotion of clean energy, resource recycling, and pollution source reduction.
In terms of the management model, current practices often overlook the responsibility of the beneficiaries, placing greater emphasis on consumption during production processes. This arrangement is inequitable for Panjin city, a key energy production and food base. Over the past five years, Panjin produced 233.67 million t of crude oil, yet only 161.30 million t were consumed locally, with nearly 30% of the output supplied to other cities. Similarly, in food production, Panjin city used 2639 t of nitrogen fertilizer and 315 t of phosphorus fertilizer to produce 1.85 million tons of food, although only about 40% of the output was supplied locally. Therefore, we suggest that energy and food transactions be managed similarly to sewage treatment, with a tax imposed at the end-consumption stage. The revenue from this additional tax should be allocated to funding environmental technology upgrades and pollution reduction at the production stage.
Regarding ecological restoration, Panjin city has extensive forest, grassland, and wetland resources that contribute significantly to carbon sequestration and pollutant mitigation. However, the area of coastal wetlands declined by 75 km2 over the past five years, reducing resulting in a reduction of carbon sequestration capacity by 14 Gg and an additional discharge of 51 t of nitrogen into water bodies. This underscores the difficulty of balancing ecological conservation with economic development pressures. To address these challenges, targeted measures are recommended: establish a core protection zone for the Red Beach wetlands with peripheral ecological restoration and sustainable use demonstration zones to achieve ecological and economic synergies; promote ecological agriculture through soil-test-based fertilization and constructed ecological ditches to intercept agricultural runoff and reduce nitrogen and phosphorus inputs at the source; implement hydrological regulation measures including ecological sluice gates and tidal channel dredging to scientifically manage freshwater replenishment and salinity balance in the wetlands.
In the context of clean energy utilization, Panjin city, situated in a coastal region with abundant wind and tidal energy resources, should strategically develop offshore wind farms along the Liaodong Bay coast and deploy bidirectional-flow tidal power installations in tidal energy-rich zones to actively promote non-fossil energy technologies for carbon emission reduction [58]. Furthermore, the integration of energy storage systems is recommended to facilitate load balancing and optimize power supply during peak demand periods, thereby improving overall energy utilization efficiency.
In the area of resource recycling, we propose the development of novel technological systems for producing olefins, aromatics, and other high-value chemicals from petroleum, aiming to achieve low-carbon, clean, and efficient utilization [59]. In addition, the value-added reuse of solid wastes generated from fossil resource processing should be actively explored. It is important to note that significant carbon emissions are inevitably generated during wastewater treatment processes. Consequently, efforts should focus on the development of methane recovery technologies and the utilization of sludge resources to enable the synergistic management of both carbon and pollutant emissions.
Concerning pollution source reduction, promoting water-saving appliances, raising public awareness of water conservation, improving wastewater treatment systems, and facilitating the transition to low-energy-intensive industries will contribute to the synergistic reduction of carbon, nitrogen, and phosphorus inputs.

5. Conclusions

Climate change and environmental protection remain globally significant challenges, attracting sustained attention from both the scientific and policy communities. This study introduced a framework model for quantifying anthropogenic C, N, and P inputs, offering a novel perspective that emphasized the interrelated nature of these pollutants. Compared to conventional models, this framework can characterize the interlinked processes of C, N, and P across different pollution sources. Using Panjin City as a case study, the analysis assessed dynamic changes, interrelationships, driving forces, and comprehensive environmental indices associated with these elements. The findings provided integrated insights to support the coordinated management of C, N, and P inputs, contributing to more effective strategies for pollution control and environmental sustainability.
From 2016 to 2020, NAIC in Panjin city increased from 21 Tg to 28 Tg, primarily driven by energy consumption, while wetlands served as the main carbon sequestration component in the region. Over the same period, NAIN decreased from 43.5 Gg to 37.4 Gg, and NAIP declined from 5.6 Gg to 4.0 Gg, with agriculture identified as the dominant source. Approximately 4.5% of NAIN and 2.9% of NAIP were discharged into receiving water bodies, with pollution from human consumption gradually emerging as the primary contributor. Anthropogenic C, N, and P inputs exhibited intrinsic linkages, with human activities and natural processes generating both beneficial and adverse environmental effects. Increased carbon inputs facilitated economic growth and structural transformation, while economic development simultaneously enhanced the capacity for environmental protection, thereby mitigating pollutant discharges. Natural ecosystems such as forests and grasslands contributed to carbon sequestration but also served as sources of non-point pollution. Declines in the pollution intensities of NAIN and NAIP, as well as in NAI-RN and NAI-RP, further confirmed the dual role of carbon inputs in promoting both development and pollution control. The comprehensive environmental index in Panjin city showed a gradual improvement over time. Energy structure, energy efficiency, and economic scale factors were identified as major drivers for the increase in NAIC, with economic scale factors alone accounting for 93% of the total growth. Pollution structure and economic scale factors drove the growth of NAI-RN and NAI-RP. The following measures are recommended to achieve coordinated control of anthropogenic carbon, nitrogen, and phosphorus inputs: adopting novel management model, promoting ecological restoration and protection of the Red Beach wetland reserve, advancing clean energy utilization, and increasing investments in resource recycling and pollution source reduction.

Author Contributions

Writing—Original draft, Visualization, Methodology, Investigation, Data, Supervision, Conceptualization, T.W. (Tianxiang Wang); Visualization, Investigation, S.W.; Methodology, L.Y.; Methodology, Investigation, G.S.; Visualization, T.W. (Tianzi Wang); Visualization, R.M.; Supervision, Methodology, Z.Z. All authors have read and agreed to the published version of the manuscript.

Funding

This study was supported by National Natural Science Foundation of China (42277383), National Science and Technology Major Project for Comprehensive Environmental Management in Jing-Jin-Ji (2025ZD1206000) and Inner Mongolia Autonomous Region Science and Technology Program Project (2025YFHH0129). The views and ideas expressed herein are solely of the authors and do not represent the ideas of the funding agencies in any forms.

Data Availability Statement

The data supporting the findings of this study are available within the article and were also derived from the following sources: Liaoning Statistical Yearbook (https://tjj.ln.gov.cn/), Panjin Statistical Yearbook (https://www.panjin.gov.cn/), and the China Water Supply and Drainage Design Manual (ISBN 978-7-112-20074-0).

Conflicts of Interest

The authors declare that they have no known competing financial interests or personal relationships that could have appeared to influence the work reported in this paper.

References

  1. Kanter, D.R.; Brownlie, W.J. Joint nitrogen and phosphorus management for sustainable development and climate goals. Environ. Sci. Policy 2019, 92, 1–8. [Google Scholar] [CrossRef]
  2. Filonchyk, M.; Peterson, M.P.; Zhang, L.; Hurynovich, V.; He, Y. Greenhouse gases emissions and global climate change: Examining the influence of CO2, CH4, and N2O. Sci. Total Environ. 2024, 935, 173359. [Google Scholar] [CrossRef]
  3. Bertram, C.; Brutschin, E.; Drouet, L.; Luderer, G.; van Ruijven, B.; Reis, L.A.; Baptista, L.B.; de Boer, H.-S.; Cui, R.; Daioglou, V.; et al. Author Correction: Feasibility of peak temperature targets in light of institutional constraints. Nat. Clim. Change 2025, 15, 119. [Google Scholar] [CrossRef]
  4. Deng, C.; Zhang, Z.; Song, X.; Peng, D.; Zhao, C.; Chen, C.; Wu, Y.; Zhao, Z.; Shen, P.; Xie, M. Nitrogen-derived environmental behavior, economic performance, and regulation potential by human production and consumption in a mega river basin. J. Clean. Prod. 2024, 434, 140279. [Google Scholar] [CrossRef]
  5. Penuelas, J.; Sardans, J. Human-driven global nutrient imbalances increase risks to health. Eco-Environ. Health 2023, 2, 246–251. [Google Scholar] [CrossRef]
  6. Xu, J.; Guan, Y.; Oldfield, J.; Guan, D.; Shan, Y. China carbon emission accounts 2020–2021. Appl. Energy 2024, 360, 122837. [Google Scholar] [CrossRef]
  7. Tian, C.; Qi, L. Empirical decomposition and peaking path of carbon emissions in resource-based areas. J. Clean. Prod. 2023, 395, 136372. [Google Scholar] [CrossRef]
  8. Guo, B.; Xie, T.; Zhang, W.; Wu, H.; Zhang, D.; Zhu, X.; Ma, X.; Wu, M.; Luo, P. Rasterizing CO2 emissions and characterizing their trends via an enhanced population-light index at multiple scales in China during 2013–2019. Sci. Total Environ. 2023, 905, 167309. [Google Scholar] [CrossRef]
  9. Huang, Y.; Liang, H.; Wu, Z.; Xie, Z.; Liu, Z.; Zhu, J.; Zheng, B.; Wan, W. Comprehensive assessment of refined greenhouse gas emissions from China’s livestock sector. Sci. Total Environ. 2024, 946, 174301. [Google Scholar] [CrossRef]
  10. Aluko, O.O.; Liu, Z.; Sun, X. The interplay of carbon and nitrogen distribution: Prospects for improved crop yields. Mod. Agric. 2023, 1, 57–75. [Google Scholar] [CrossRef]
  11. Duan, Y.; Gao, Y.; Zhao, J.; Xue, Y.; Zhang, W.; Wu, W.; Jiang, H.; Cao, D. Agricultural Methane Emissions in China: Inventories, Driving Forces and Mitigation Strategies. Environ. Sci. Technol. 2023, 57, 13292–13303. [Google Scholar] [CrossRef] [PubMed]
  12. Hu, Y.; Zhao, T.; Guo, Y.; Wang, M.; Brachhold, K.; Chu, C.; Hanson, A.; Kumar, S.; Lin, R.; Long, W.; et al. 100 essential questions for the future of agriculture. Mod. Agric. 2023, 1, 4–12. [Google Scholar] [CrossRef]
  13. Yan, X.; Ying, Y.; Li, K.; Zhang, Q.; Wang, K. A review of mitigation technologies and management strategies for greenhouse gas and air pollutant emissions in livestock production. J. Environ. Manag. 2024, 352, 120028. [Google Scholar] [CrossRef] [PubMed]
  14. Zhang, S.; Ma, J.; Zhang, X.; Guo, C. Atmospheric remote sensing for anthropogenic methane emissions: Applications and research opportunities. Sci. Total Environ. 2023, 893, 164701. [Google Scholar] [CrossRef]
  15. Wang, Y.; Duan, X.; Li, P.; Wang, L. Spatiotemporal intensification of net anthropogenic nitrogen input driven by human activities in China from 1990 to 2020. Ecol. Indic. 2024, 160, 111841. [Google Scholar] [CrossRef]
  16. Ma, H.; Liu, X.; Lei, Q.; Luo, J.; Di, H.; Du, X.; Zhao, Y.; Zhang, X.; Liu, H. Spatio-Temporal Analysis of Net Anthropogenic Phosphorus Inputs (NAPIs) and Their Impacts in Ningxia Hui Autonomous Region Using Monte Carlo Simulations and Sensitivity Analysis. Water 2024, 16, 3160. [Google Scholar] [CrossRef]
  17. Zuo, D.; Bi, Y.; Song, Y.; Xu, Z.; Wang, G.; Ma, G.; Abbaspour, K.C.; Yang, H. The response of non-point source pollution to land use change and risk assessment based on model simulation and grey water footprint theory in an agricultural river basin of Yangtze River, China. Ecol. Indic. 2023, 154, 110581. [Google Scholar] [CrossRef]
  18. Qian, L.; Zhonghua, Y.; Wei, Y.; Minghui, Y.; Fengpeng, B.; Yao, Y.; Yufeng, R. Tracing the sources and transport of the total phosphorus in the upper Yangtze River. Ecol. Inform. 2023, 77, 102230. [Google Scholar] [CrossRef]
  19. Wang, T.; Sun, Y.; Wang, T.; Wang, Z.; Hu, S.; Gao, S. Dynamic spatiotemporal change of net anthropogenic phosphorus inputs and its response of water quality in the Liao river basin. Chemosphere 2023, 331, 138757. [Google Scholar] [CrossRef]
  20. Pei, W.; Yang, J.; Wang, L.; Maqsood, A.; Li, M. Rapid urbanization decelerates regional net anthropogenic phosphorus input: Evidence from the Chengdu-Chongqing urban agglomeration in China. J. Environ. Manag. 2025, 374, 124171. [Google Scholar] [CrossRef]
  21. Yang, J.; Li, M.; Liu, L.; Zhao, H.; Luo, W.; Guo, Y.; Ji, X.; Hu, W. Dynamic characteristics of net anthropogenic phosphorus input to the upper Yangtze River Basin from 1989 to 2019: Focus on the phosphate ore rich area in China. J. Environ. Manag. 2023, 347, 119140. [Google Scholar] [CrossRef]
  22. Liu, J.; Gu, W.; Liu, Y.; Li, W.; Shao, D. Influence of anthropogenic nitrogen inputs and legacy nitrogen change on riverine nitrogen export in areas with high agricultural activity. J. Environ. Manag. 2023, 338, 117833. [Google Scholar] [CrossRef]
  23. Zhang, X.; Qi, Y.; Li, H.; Wang, X.; Yin, Q. Assessing the response of non-point source nitrogen pollution to land use change based on SWAT model. Ecol. Indic. 2024, 158, 111391. [Google Scholar] [CrossRef]
  24. Deng, C.; Liu, L.; Peng, D.; Li, H.; Zhao, Z.; Lyu, C.; Zhang, Z. Net anthropogenic nitrogen and phosphorus inputs in the Yangtze River economic belt: Spatiotemporal dynamics, attribution analysis, and diversity management. J. Hydrol. 2021, 597, 126221. [Google Scholar] [CrossRef]
  25. Zhang, X.; Chen, P.; Dai, S.; Han, Y. Analysis of non-point source nitrogen pollution in watersheds based on SWAT model. Ecol. Indic. 2022, 138, 108881. [Google Scholar] [CrossRef]
  26. Kim, D.; Kaluskar, S.; Mugalingam, S.; Blukacz-Richards, A.; Long, T.; Morley, A.; Arhonditsis, G.B. A Bayesian approach for estimating phosphorus export and delivery rates with the SPAtially Referenced Regression On Watershed attributes (SPARROW) model. Ecol. Inform. 2017, 37, 77–91. [Google Scholar] [CrossRef]
  27. Jiang, W.; Zhang, Z.; Wen, J.; Yin, L.; Song, B. Spatio-temporal variation and influencing factors of industrial carbon emission effect in China based on water-land-energy-carbon nexus. Ecol. Indic. 2023, 152, 110307. [Google Scholar] [CrossRef]
  28. Ren, Y.; Zhang, F.; Zhao, C.; Cheng, Z. Attribution of climate change and human activities to vegetation NDVI in Jilin Province, China during 1998–2020. Ecol. Indic. 2023, 153, 110415. [Google Scholar] [CrossRef]
  29. GB 3838-2002; Environmental Quality Standards for Surface Water. Ministry of Ecology and Environment, People’s Republic of China: Beijing, China, 2002.
  30. Wang, T.; Wang, Z.; Wang, T.; Shumin, M.; Hu, S.; Gao, S.; Ye, L.; Runfa, C.; Arhonditsis, G. Evaluation of the role of urban domestic wastewater treatment systems for greenhouse gases emissions in China. Ecol. Inform. 2024, 81, 102571. [Google Scholar] [CrossRef]
  31. Huang, Y.; Matsumoto, K. Drivers of the change in carbon dioxide emissions under the progress of urbanization in 30 provinces in China: A decomposition analysis. J. Clean. Prod. 2021, 322, 129000. [Google Scholar] [CrossRef]
  32. Liu, K.; Xue, M.; Peng, M.; Wang, C. Impact of spatial structure of urban agglomeration on carbon emissions: An analysis of the Shandong Peninsula, China. Technol. Forecast. Soc. Change 2020, 161, 120313. [Google Scholar] [CrossRef]
  33. Zhang, X.; Yi, Y.; Yang, Z. Nitrogen and phosphorus retention budgets of a semiarid plain basin under different human activity intensity. Sci. Total Environ. 2020, 703, 134813. [Google Scholar] [CrossRef] [PubMed]
  34. Zhao, Z.; Zhang, L.; Deng, C. Changes in net anthropogenic nitrogen and phosphorus inputs in the Yangtze River Economic Belt, China (1999–2018). Ecol. Indic. 2022, 145, 109674. [Google Scholar] [CrossRef]
  35. Ma, X.; Li, Y.; Zhang, M.; Zheng, F.; Du, S. Assessment and analysis of non-point source nitrogen and phosphorus loads in the Three Gorges Reservoir Area of Hubei Province, China. Sci. Total Environ. 2011, 412–413, 154–161. [Google Scholar] [CrossRef] [PubMed]
  36. Zang, D.; Hu, Z.; Yang, Y.; He, S. Research on the Relationship between Agricultural Carbon Emission Intensity, Agricultural Economic Development and Agricultural Trade in China. Sustainability 2022, 14, 11694. [Google Scholar] [CrossRef]
  37. Zhang, B.; Cui, B.; Zhang, S.; Wu, Q.-Y.; Yao, L. Source apportionment of nitrogen and phosphorus from non-point source pollution in Nansi Lake Basin, China. Environ. Sci. Pollut. Res. 2018, 25, 19101–19113. [Google Scholar] [CrossRef]
  38. Wang, F.; Pei, X.; Zhou, L. Trend and inequality in livestock CO2 emission intensity: Evidence from 341 prefecture-level cities from 2006 to 2022 in China. Environ. Res. 2025, 284, 122209. [Google Scholar] [CrossRef]
  39. Zhou, L.; Zhang, J.; Zhang, X.; Zhang, J. A Leading Role of Water Resources and Animal Husbandry in Environmental Sustainability: A Case Study of China. Environ. Sci. Pollut. Res. 2023, 30, 72146–72159. [Google Scholar] [CrossRef]
  40. Rao, P.; Wang, S.; Wang, A.; Yang, D.; Tang, L. Spatiotemporal characteristics of nonpoint source nutrient loads and their impact on river water quality in Yancheng city, China, simulated by an improved export coefficient model coupled with grid-based runoff calculations. Ecol. Indic. 2022, 142, 109188. [Google Scholar] [CrossRef]
  41. Jia, W.; Qin, W.; Zhang, Q.; Wang, X.; Ma, Y.; Chen, Q. Evaluation of crop residues and manure production and their geographical distribution in China. J. Clean. Prod. 2018, 188, 954–965. [Google Scholar] [CrossRef]
  42. Zhang, C.; Li, H.; Wang, X.; Liu, P.; Liu, Q.; Zhan, S. Forest carbon storage in China from 2003 to 2021: Estimation based on the volume-derived carbon storage model with scale-compatible and tree species-merged. Forest. Ecol. Manag. 2025, 578, 122483. [Google Scholar] [CrossRef]
  43. Ma, S.; Xu, M. Assessing the Sustainability Impact of Land-Use Changes and Carbon Emission Intensity in the Loess Plateau. Sustainability 2024, 16, 8618. [Google Scholar] [CrossRef]
  44. Cheng, X.; Chen, L.; Sun, R.; Jing, Y. An improved export coefficient model to estimate non-point source phosphorus pollution risks under complex precipitation and terrain conditions. Environ. Sci. Pollut. Res. 2018, 25, 20946–20955. [Google Scholar] [CrossRef] [PubMed]
  45. Huishu, L.; Qiuliang, L.; Xinyu, Z.; Haw, Y.; Hongyuan, W.; Limei, Z.; Hongbin, L.; Jr-Chuan, H.; Tianzhi, R.; Jiaogen, Z.; et al. Effects of anthropogenic activities on long-term changes of nitrogen budget in a plain river network region: A case study in the Taihu Basin. Sci. Total Environ. 2018, 645, 1212–1220. [Google Scholar] [CrossRef] [PubMed]
  46. Li, B.; Fang, X.; Ye, Y.; Zhang, X. Carbon emissions induced by cropland expansion in Northeast China during the past 300 years. Sci. China Earth Sci. 2014, 57, 2259–2268. [Google Scholar] [CrossRef]
  47. Sun, Z.; Deng, M.; Li, D.; Sun, Y. Characteristics and driving factors of carbon emissions in China. J. Environ. Plan. Manag. 2024, 67, 967–992. [Google Scholar] [CrossRef]
  48. Guo, D.; Li, B.; Yu, W.; Han, J.-C.; Zhou, Y.; Ye, Z.; Wu, X.; Young, B.; Huang, Y. Revisiting China’s domestic greenhouse gas emission from wastewater treatment: A quantitative process life-cycle assessment. Sci. Total Environ. 2023, 876, 162597. [Google Scholar] [CrossRef]
  49. Li, B.; Boiarkina, I.; Young, B.; Yu, W. Substance flow analysis of phosphorus within New Zealand and comparison with other countries. Sci. Total Environ. 2015, 527–528, 483–492. [Google Scholar] [CrossRef]
  50. Shan, Y.; Guan, Y.; Hang, Y.; Zheng, H.; Li, Y.; Guan, D.; Li, J.; Zhou, Y.; Li, L.; Hubacek, K. City-level emission peak and drivers in China. Sci. Bull. 2022, 67, 1910–1920. [Google Scholar] [CrossRef]
  51. Han, Y.; Fan, Y.; Yang, P.; Wang, X.; Wang, Y.; Tian, J.; Xu, L.; Wang, C. Net anthropogenic nitrogen inputs (NANI) index application in Mainland China. Geoderma 2014, 213, 87–94. [Google Scholar] [CrossRef]
  52. Zhang, F.; Li, H.; Zhang, W.; Pang, J.; Li, Y. Spatial-Temporal Dynamics of Anthropogenic Nitrogen Inputs in the Rapid Developing Chaohu Lake Basin. Water 2023, 15, 414. [Google Scholar] [CrossRef]
  53. Pei, W.; Yan, T.; Lei, Q.; Zhang, T.; Fan, B.; Du, X.; Luo, J.; Lindsey, S.; Liu, H. Spatio-temporal variation of net anthropogenic nitrogen inputs (NANI) from 1991 to 2019 and its impacts analysis from parameters in Northwest China. J. Environ. Manag. 2022, 321, 115996. [Google Scholar] [CrossRef]
  54. Gao, W.; Howarth, R.W.; Swaney, D.P.; Hong, B.; Guo, H.C. Enhanced N input to Lake Dianchi Basin from 1980 to 2010: Drivers and consequences. Sci. Total Environ. 2015, 505, 376–384. [Google Scholar] [CrossRef] [PubMed]
  55. Han, Y.; Yu, X.; Wang, X.; Wang, Y.; Tian, J.; Xu, L.; Wang, C. Net anthropogenic phosphorus inputs (NAPI) index application in Mainland China. Chemosphere 2013, 90, 329–337. [Google Scholar] [CrossRef] [PubMed]
  56. Wang, Y.; Xie, X.; Liu, C.; Wang, Y.; Li, M. Variation of net anthropogenic phosphorus inputs (NAPI) and riverine phosphorus fluxes in seven major river basins in China. Sci. Total Environ. 2020, 742, 140514. [Google Scholar] [CrossRef] [PubMed]
  57. Wang, H.; Liu, G.; Shi, K. What Are the Driving Forces of Urban CO2 Emissions in China? A Refined Scale Analysis between National and Urban Agglomeration Levels. Int. J. Environ. Res. Public Health 2019, 16, 3692. [Google Scholar] [CrossRef]
  58. Zhang, Y.; Dong, X.; Wang, X.; Zhang, P.; Liu, M.; Zhang, Y.; Xiao, R. The Relationship between the Low-Carbon Industrial Model and Human Well-Being: A Case Study of the Electric Power Industry. Energies 2023, 16, 1357. [Google Scholar] [CrossRef]
  59. Vinayagam, V.; Sikarwar, D.; Das, S.; Pugazhendhi, A. Envisioning the innovative approaches to achieve circular economy in the water and wastewater sector. Environ. Res. 2024, 241, 117663. [Google Scholar] [CrossRef]
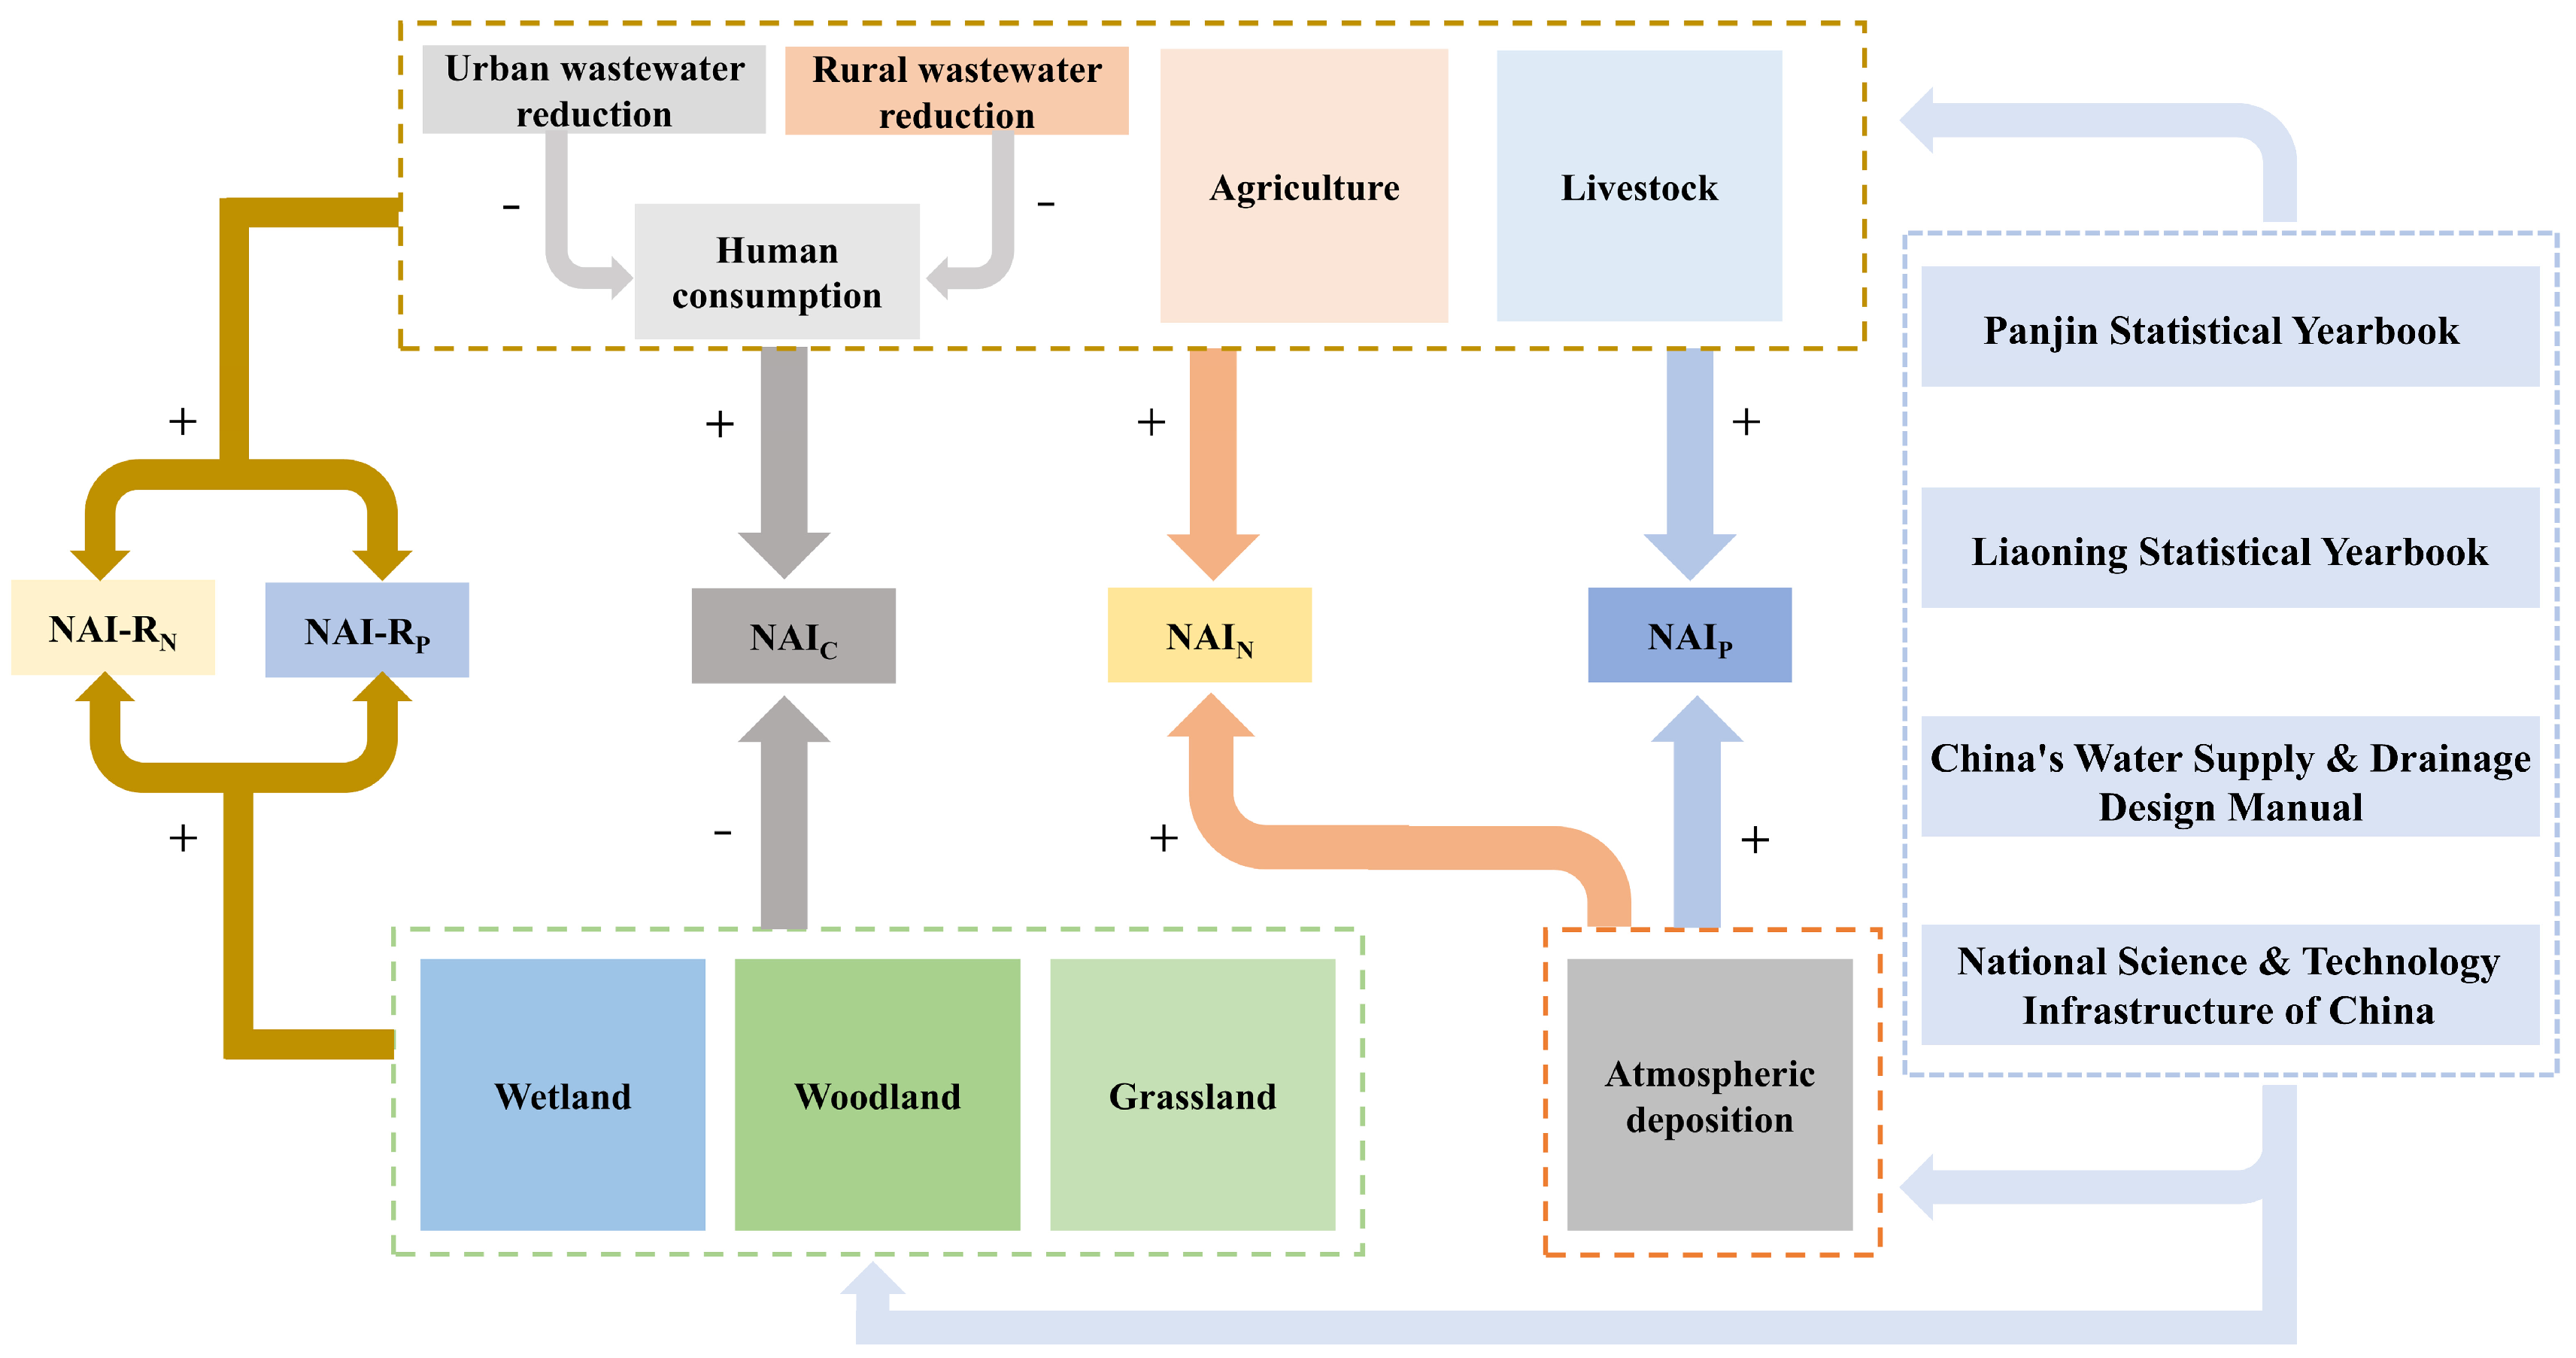
Figure 1. Framework model for evaluating net anthropogenic C, N, and P inputs and discharges.
Water 17 02962 g001
Figure 2. Dynamic changes in net anthropogenic C, N, and P inputs. (a) Total inputs; (b) NAIK per unit area; (c) NAIK per capita; (d) NAIK per unit GDP.
Water 17 02962 g002
Figure 3. Components of net anthropogenic C inputs. (a) Carbon emission; (b) Carbon sequestration.
Water 17 02962 g003
Figure 4. Components of net anthropogenic N, P inputs. (a) NAIN; (b) NAIP; (c) NAI-RN; (d) NAI-RP.
Water 17 02962 g004
Figure 5. Flows and corrections of net anthropogenic pollutant inputs and discharges. (a) C emission Flow; (b) C sequestration Flow; (c) Nitrogen inputs; (d) Phosphorus inputs; (e) Nitrogen discharges; (f) Phosphorus discharges.
Water 17 02962 g005aWater 17 02962 g005b
Figure 6. Correlation analysis (PI means primary industry, TI means tertiary industry).
Water 17 02962 g006
Figure 7. Pollution intensities of various sources. (a) NAIK and NAI-RL; (b) HIK and HI-RL; (c) AIK and AI-RL; (d) LIK and LI-RL.
Water 17 02962 g007
Figure 8. Results of the comprehensive assessment and the driving forces. (a) Comprehensive environmental index; (b) NAIC; (c) NAIN; (d) NAIP.
Water 17 02962 g008
Disclaimer/Publisher’s Note: The statements, opinions and data contained in all publications are solely those of the individual author(s) and contributor(s) and not of MDPI and/or the editor(s). MDPI and/or the editor(s) disclaim responsibility for any injury to people or property resulting from any ideas, methods, instructions or products referred to in the content.