Article

Investigating Seasonal Water Quality Dynamics in Humid, Subtropical Louisiana Facultative Waste Stabilization Ponds

1
School for Plant, Environment and Soil Science, Louisiana State University, Baton Rouge, LA 70803, USA
2
Department of Mechanical and Industrial Engineering, Louisiana State University, Baton Rouge, LA 70803, USA
3
Louisiana Sea Grant, Louisiana State University, Baton Rouge, LA 70803, USA
*
Author to whom correspondence should be addressed.
Water 2025, 17(20), 2936; https://doi.org/10.3390/w17202936 (registering DOI)
Submission received: 19 September 2025 / Revised: 8 October 2025 / Accepted: 10 October 2025 / Published: 11 October 2025
(This article belongs to the Section Wastewater Treatment and Reuse)

Abstract

Waste stabilization ponds (WSPs) in humid, subtropical climates rely on stable temperatures and mechanical aeration to promote microbial activity. These critical infrastructures can lack operational resources to ensure efficient treatment, which can impact downstream communities. This study aims to use remote water quality sensor data to establish trends in a yearly dataset and correlate various water quality parameters for simplistic identification of pond health. A facultative WSP was monitored in two stages: the primary settling over a period of 14 months to evaluate partially treated water, and the secondary treatment pond for a period of 11 months to monitor final stage water quality parameters. A statistical analysis was performed on the measured parameters (dissolved oxygen, temperature, conductivity, pH, turbidity, nitrate, and ammonium) to establish a comprehensive yearly, seasonal, and monthly dataset to show fluctuations in water parameter correlations. Standard relationships in dissolved oxygen, conductivity, pH, and temperature were traced during the seasonal fluctuations, which provided insight into nitrogen processing by microbial communities. During this study, the summer period showed the most variability, specifically a deviation in the dissolved oxygen and temperature relationship from a yearly moderate negative correlation (−0.593) to a moderate positive correlation (0.459), indicating a direct relationship. The secondary treatment pond data showed more nitrogen species correlation, which can indicate final cycling during seasonal transitions. Understanding pond dynamics can lead to impactful, proactive operational decisions to address pond imbalance or chemical dosing for final treatment. By establishing parameter correlations, facilities with WSPs can strategically integrate sensor networks for real-time pond health and treatment efficiency monitoring during seasonal fluctuations.

1. Introduction

Waste stabilization ponds (WSPs) are a critical infrastructure for communities to treat wastewater and protect downstream environmental ecosystems. These natural ponds offer an affordable and reliable means for wastewater treatment in communities that do not have the volume for a highly mechanical operation. In addition, the simplistic design, low capital cost, and minimal operational expenses make these ponds optimal for small communities and developing countries [1,2]. The United States Environmental Protection Agency (US EPA) estimates that ~72% of the wastewater treatment plants serve small communities, defined as populations less than 10,000 people, in the United States [3]. Compared to urban metropolitan areas, the availability of space allows wastewater treatment operations to be expanded to slow down the processes and use limited mechanical systems as the primary treatment. WSPs can be designed in single pond or multi-pond systems in parallel for low-volume community wastewater. The larger surface areas and minimal mechanical operations make ponds highly dynamic and subject to operational and environmental variables that can affect the treatment performance [4]. To mitigate the impact on the surrounding environmental systems, an understanding of seasonal water quality parameters can be tailored to WSPs to better prepare facility personnel for variations in processing.
Many economic studies have been performed to identify limitations in rural wastewater treatment systems, and it has been seen that construction design and operational resources drive facility cost [5,6]. There are a variety of treatment processes for WSPs, including anaerobic, maturation, and facultative ponds. Each pond type has different factors that contribute to the operational cost and processing of wastewater, while some facilities design multi-stage ponds encompassing all three types [7]. Additionally, tertiary treatment techniques, including constructed wetlands, algae filtration, and soil infiltration, can be added to the final processing stages of WSP to increase treatment capacity [8,9]. In standard WSP designs, facultative ponds precede an anaerobic, maturation, or tertiary treatment method to allow for settling and preliminary treatment using aeration and stratified layers. The stratification in these ponds creates a zone for aerobic and anaerobic nitrogen processing. This study focuses on a tandem facultative pond system to provide seasonal dynamics in the most common WSP type while investigating the water quality parameters at a single layer of stratification. These systems use mechanical aeration from small horsepower pumps, surface water–wind interaction, and sunlight to stimulate algal and microbial communities to process the organic matter in the water [10]. Using the elements of sunlight and wind to increase microbial activity and dissolved oxygen promotes natural processing across a long period of detention time. These ponds rely on layering to complete the processing of organic matter. The upper layer has elevated dissolved oxygen by mechanical aerators, atmospheric diffusion, and algae photosynthesis to oxidize organic matter by aerobic bacteria, while the lower layer uses anaerobic bacteria to further degrade settled organic matter [11]. Due to the variability of environmental inputs, many assessments have been conducted to optimize and monitor mechanical aeration to be more responsive to changing conditions [12,13]. Most studies of WSP focus on optimal arid climate conditions, while Louisiana provides impactful data to better understand the effect of subtropical (i.e., humid, rainy) climate on WSP water quality. Advancements in sensor technology provide opportunities to actively monitor parameters to make operational changes for cost savings and processing efficiency.
In areas of extreme weather fluctuation, the seasonal dynamics have a greater impact on WSPs. Arid climates are particularly ideal for treatment conditions due to the high temperature and consistent sunlight that increase oxidation of organic material [14,15]. In other areas, the influence of temperature can impact the stability of microbial communities and alter nutrient processing [16,17]. To better optimize pond health, the implementation of sensor technology can be used to mitigate challenges in fluctuating weather, including temperature and precipitation [18]. Sensor networks can be used to create models for correlations in water quality parameters to improve process efficiency [19]. Though resources are limited for small community facilities, the use of supervisory control and data acquisition (SCADA) is frequently used to track process effectiveness through the complex treatment processes in metropolitan systems [20,21]. These integrated system controls can be costly and difficult to operate with limited personnel. This makes the development of an affordable sensor network for rural facilities to access real-time data an impactful management tool to assess efficiency and nutrient processing at various stages of the designed ponds [22]. Since many WSPs are built in tandem systems, the integration of sensors at multiple stages provides data for spatial analysis during various stages of detention times. This can provide additional insight for water quality indexing [23], distribution of organic matter and nutrients, and potential release of greenhouse gases, which are associated with challenges of slow water movement in WSPs [24]. Facilities frequently face issues with odor, sludge buildup, and fluctuating nutrient values that lead to excessive operational and maintenance costs. For WSPs in small communities, utilizing easily analyzed standard water quality parameters (temperature, pH, conductivity, and dissolved oxygen) that provide immediate correlations to treatment optimization could provide a low-cost alternative to SCADA systems and provide a proactive response to fluctuating seasonal changes. This study investigates seasonal shifts in WSP treatment processing through water quality parameters to better understand trends in correlations, nutrient processing, and dissolved oxygen in a facultative pond setting.

2. Materials and Methods

2.1. Study Area

In South Louisiana, the areas between the two largest metropolitan cities, Baton Rouge, LA, and New Orleans, LA, are rapidly increasing due to expanding workforces. This exponential growth is impacting smaller communities with existing wastewater infrastructure. The study area for this investigation is the Gonzales, Louisiana wastewater treatment facility (30.203115 N, −90.925187 W). This community has seen a population increase over the last decade, with the 2024 census population reaching 13,837 residents. In preparation for community growth, the city of Gonzales expanded its WSP treatment processes to incorporate a second pond to maintain longer detention times for treatment and accommodate the increased residential sewage demands. The WSPs are permitted for 3.5 million gallons per day with a 30-day detention time across both ponds. Arid (hot and dry) climates are largely studied and seen as optimal for WSP processing. This region of the United States supports subtropical climates consisting of hot, humid summers averaging 32 °C–33 °C, and mild winters averaging 18 °C–19 °C. The temperate climate supports an optimal setting for WSP microbial processes [25]. Though spikes in seasonal temperature can impact the WSPs treatment efficiency, this site’s periodic rainfall and proximity to coastal Louisiana, where major tropical storms induce large rain events, presented an added environmental variable. High precipitation can increase water quality parameters like dissolved oxygen, which can influence nutrient and organic matter processing [26]. The city of Gonzales averages 55″ of rain per year, while the heaviest average rainfall is in June. During the study period of 28 March 2024 to 31 May 2025, there were two significant weather events, including Hurricane Francine, which made landfall in coastal Louisiana as a Category 2 hurricane on 11 September 2024, and a historic winter snowstorm impacting south Louisiana on 20 January 2025. These events had an impact on WSP operations, increasing rainfall (hurricane) and drastic decreasing water temperature (snow storm). The selected study dates aligned with internal seed grant funding and instrument acquisition. Overall, the increased complexity of subtropical climates adds a novelty to the data found during the study period.

2.2. Waste Stabilization Pond Description

This facility currently uses a common methodology for single-point water quality sampling to submit compliance requirements, manual operation of aeration systems, and potential optimization of treatment processes (i.e., chlorine contact chamber). The integration of water quality sensors at this site was an opportunity to promote technological advancements in water quality testing and correlate parameters that are regularly tested with single-point measurements. The dual facultative ponds are approximately three acres in size and at a depth of 3 m. The pond utilizes surface aerators to elevate dissolved oxygen and promote the breakdown of organic matter and nutrients through microbial activity. For the complete process, the pond has a 30-day detention time that treats the water in two stages. Figure 1 shows both ponds with an aeration profile.
The first stage of the process takes place in the primary settling pond. This pond is aerated by four 40-horsepower and six 25-horsepower surface aerators, which promote primary treatment and settling of solids. Facility personnel maintain eight active aerators per pond while oscillating two aerators off for operational maintenance and energy savings. From the raw effluent intake pipe to the outfall pipe leading to the next stage is a 15-day detention time, thus allowing a bottom anaerobic sludge layer to form. A Yellow Springs Instruments (YSI) EXO2 multiparameter sondes (S1) was strategically positioned near the outfall pipe to measure wastewater after approximately 15 days of treatment. The effluent is then pumped to the secondary treatment pond, which has four 15-horsepower and six 7.5-horsepower aerators for further processing. Continuing settling and processing of residual nutrients occurs at this stage for an additional 15 days before effluent is discharged through a gravity-fed basin for final processing and chlorine contact. At the gravity-fed station, the second YSI EXO2 Sonde (S2) was positioned to measure the final WSP water parameters. Near the S2 location, the facility has two 7.5-horsepower aerators in proximity to the S2 sampling location. The aerator immediately in front of the outfall basin (seen in Figure 1, right picture) is manually offline to promote settling of suspended material before discharge. The offline aerators reduce the amount of water mixing and dissolved oxygen at the S2 sensors, which leads to a stagnant, poorly oxygenated space that is not representative of the secondary treatment pond. The facility personnel can use this aerator if needed as a reactive adjustment in response to inefficient pond processing, but this is an irregular occurrence. Overall, the WSPs provided a two-stage pond system for water quality analysis, and strategic positions of the YSI EXO2 Sonde allow for comparison of selected parameters to indicate treatment efficiency.

2.3. Water Quality Sensor Data Collection

Water quality data were collected using YSI EXO2 Sonde with individual sensors to measure dissolved oxygen (DO) (mg/L), conductivity (μS/cm), temperature (°C), turbidity (FNU), pH, ammonium (mg/L), and nitrate (mg/L). Water quality variables are listed in Table 1 with assigned abbreviations and units, which will be used throughout this study.
At the beginning of the study, from 28 March 2024 to 30 April 2024, the sensors were programmed to collect water quality data every 15 min. Due to the data-intensive sampling schedule, the team adjusted the program to every 60 min for the duration of the study period. When the sensors used the primary 60 min program, the data was stored internally and retrieved during the bi-monthly maintenance inspections. To ensure consistent parameters, the sondes were suspended at a set depth of 0.91 m in both the settling and secondary treatment ponds. This depth was strategic due to the layering of the facultative WSP, which includes a natural aerobic zone at the surface, a mechanically aerobic zone in the middle of the water column, and the anaerobic bottom layer. This depth was selected for the study due to the homogeneously mixed layer, which feeds the aerators. Facility personnel indicated the aeration system draws water from 0.91 m to provide surface water aeration. This water cycling promotes mixing of the mechanically aerated layer. Due to the facilities’ set outflow structure, water remained at a constant depth, which allowed for data collection at the mechanically aerated aerobic zone for the duration of the project. The S1 and S2 placements also allowed for monitoring at two stages of the processes for both untreated and treated wastewater. The data collection, calibration, and maintenance of sensors followed YSI’s published protocols with documentation of all data during these procedures [27]. While in the ponds, the central wiper blade (Figure 2) was programmed to rotate and clean every 15 min to clean optical probes during the trial period. Bimonthly field checks were conducted to retrieve data, provide needed maintenance and calibrations, and ensure accurate data collection. Calibrations were performed using YSI-supplied standards at intervals indicated by YSI’s published protocols [27]. To facilitate calibration and data retrieval, the YSI KoR v1.4.1.10 software (YSI Incorporated, Yellow Springs, OH, USA) was used.

2.4. Statistical Analysis

The statistical analysis was conducted using JMP Statistical Discover Edition 18 v5.2.1 software (SAS Institute, Cary, NC, USA) [28]. To determine outliers and correlations in the dataset, a series of distribution and multivariate analysis techniques was performed. Outliers from the raw dataset were separated using distribution box-and-whisker analysis. The box plots were used to remove data outside the 95% confidence interval for each measured water quality parameter. For the nitrate species, the factory sensor has a standard range of 0–200 mg/L, while benchtop lab tests indicated a linear range of up to 1000 mg/L. Nitrate data above 200 mg/L were used as quantitative pattern recognition for trends in WSPs, but cannot be reported as qualitative concentration findings. Values above 1000 mg/L were outside the lab calibration range and removed from the dataset prior to the distribution analysis for outlier exclusion. For S1 datasets, concentrations above 1000 mg/L may be due to the high nutrient loads of untreated wastewater with fluctuations in water flow. For S2, high nitrate levels may be attributed to fouling from buildup in the stagnant basin outfall. In both cases, the saturation of gel caps can occur. In addition to this data being excluded from analysis, when high loads of nitrate were detected during bi-monthly inspections, the gel sensor caps were replaced and recalibrated to ensure the quality of data collected. The refined dataset was then analyzed by multivariate principal component analysis (PCA) to correlate parameters based on yearly, seasonal, and monthly trends for sensors in both settling and secondary treatment ponds. In the seasonal analysis, the months are separated as follows: March–May (Spring), June–August (Summer), September–November (Fall), and December–February (Winter). Many previous studies have used eigenvalues to show the significant influence of variables. For correlations in water quality, PCA is used as a preliminary indicator for trend identification and statistical significance by reducing the datasets into components for visualization and pattern recognition [29,30]. Additionally, the Correlation Matrix (CM) and Canonical Correlation Analysis (CCA) were used to designate clear statistical correlations at a selected confidence interval. For the CM, JMP analysis uses the Pearson correlation coefficient to measure the linear association for pairs of continuous parameters. The CM is a product of PCA loading and correlates individual variables after data has been standardized to reduce the influence of variables of different scales, while CCA plots are a separate multivariate analysis that clusters variables that share statistically similar data to an assigned confidence interval.

3. Results

3.1. Yearly Water Quality Parameters

This investigation took place from 28 March 2024 to 31 May 2025, during which water quality data were taken continuously across 60 min intervals at the S1 and S2 locations. To visualize the datasets, the water quality parameters were averaged across each month to consolidate and represent generalized monthly values. The values in Table 2 and Table 3 can be used to indicate shifts in trends and correlate with the monthly fluctuations, like seasonal temperature changes. This representative dataset was generated for the settling pond (S1) and secondary treatment location (S2) datasets. A total of 12,490 data points were collected across the entire study period for the S1 site, while the S2 datasets had a total of 9957. The reduction in sample size for the S2 location was due to sensor maintenance for the nitrogen species, which shortened the collection period to 28 March 2024 through 10 February 2025. To maintain multivariate model consistency, the data from 11 February 2025 to 31 May 2025 in the S2 dataset were eliminated from the analysis. From the initial datasets, it was seen that the months of July and August had the highest pond temperature, while January showed the lowest temperature, mostly associated with the 2025 Winter Storm. Generally fluctuating trends between other variables, including nitrogen species, DO, and conductivity, make statistical correlation imperative for a comprehensive understanding of parameter interactions. Other indicators from the visualized dataset including the S1 November 2024 NO3, S1 May 2025 NH4+, S2 October 2024 NO3, and S2 November 2024 NO3, were all outside of the instrument’s calibration range and thus were eliminated during the statistical analysis. The statistical analysis was performed on data that were within the 95% confidence interval for the distribution plots from the raw datasets. For the correlations, the results will be separated into the two pond stages for data clarity.

3.2. Settling Pond Statistical Analysis

3.2.1. Complete Study Period

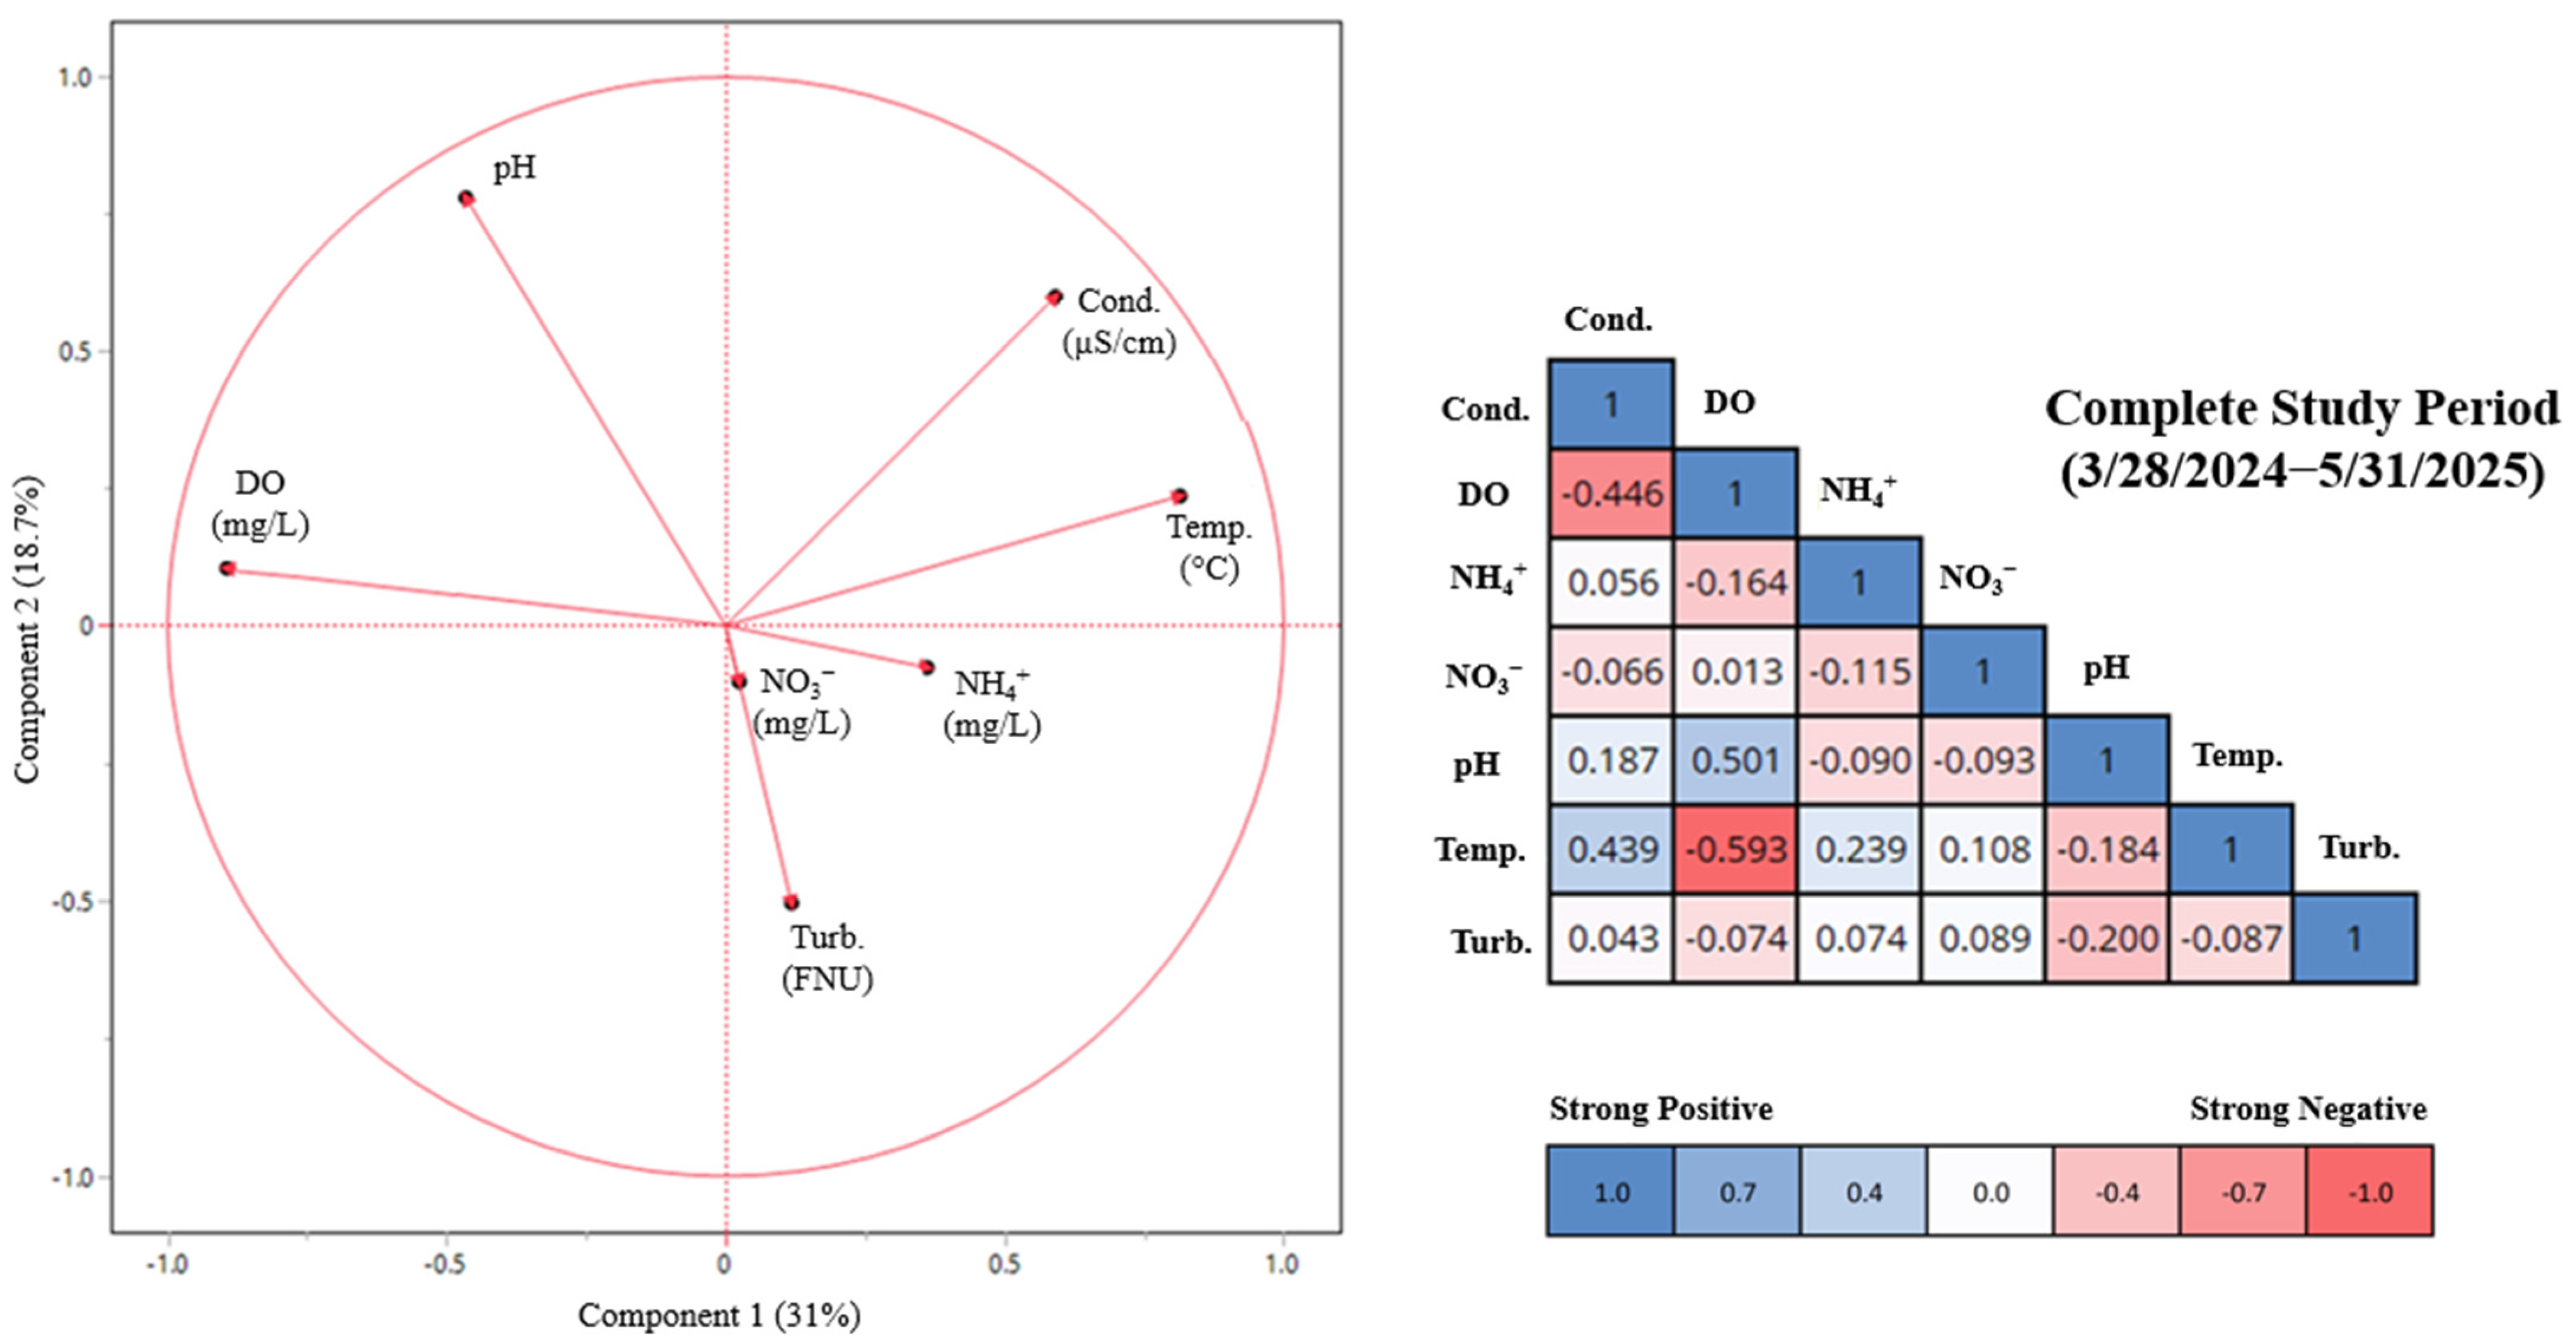
The corrected dataset for partially treated wastewater at the outfall of the primary settling pond was analyzed for variable correlation using multivariate statistical analysis. The complete study period is a representation of standard seasonal pond dynamics with the added dimension of Hurricane Francine and the 2025 Winter Storm. During the investigation, the facility met all standard wastewater permitting requirements, thus showing the WSP was effectively processing the sewage water. Figure 3 shows the PCA and CM plots for the full dataset, ranging from 28 March 2024 to 31 May 2025. The PCA plot indicates pH, conductivity, temperature, and DO all have high contributions to the statistical analysis. The CM was used to determine correlations of interest to proceed into the seasonal analysis. CM values greater than 0.40 and less than −0.40 were traced through the dataset to better understand water quality parameter relationships. For the purpose of discussion, CM values |r| = 0.400–0.699 are classified as moderate correlation, while |r| > 0.700 are strong correlations. There were 4 major relationships in the full dataset, including correlations between Cond./Temp. (0.439), DO/pH (0.501), Cond./DO (−0.446), and DO/Temp. (−0.593). These parameters are easily measured in situ and are typically associated with standard relationships in WSPs. All S1 values serve as indicators for relationships post-settled wastewater during the first 15 days of treatment.

3.2.2. Seasonal Intervals

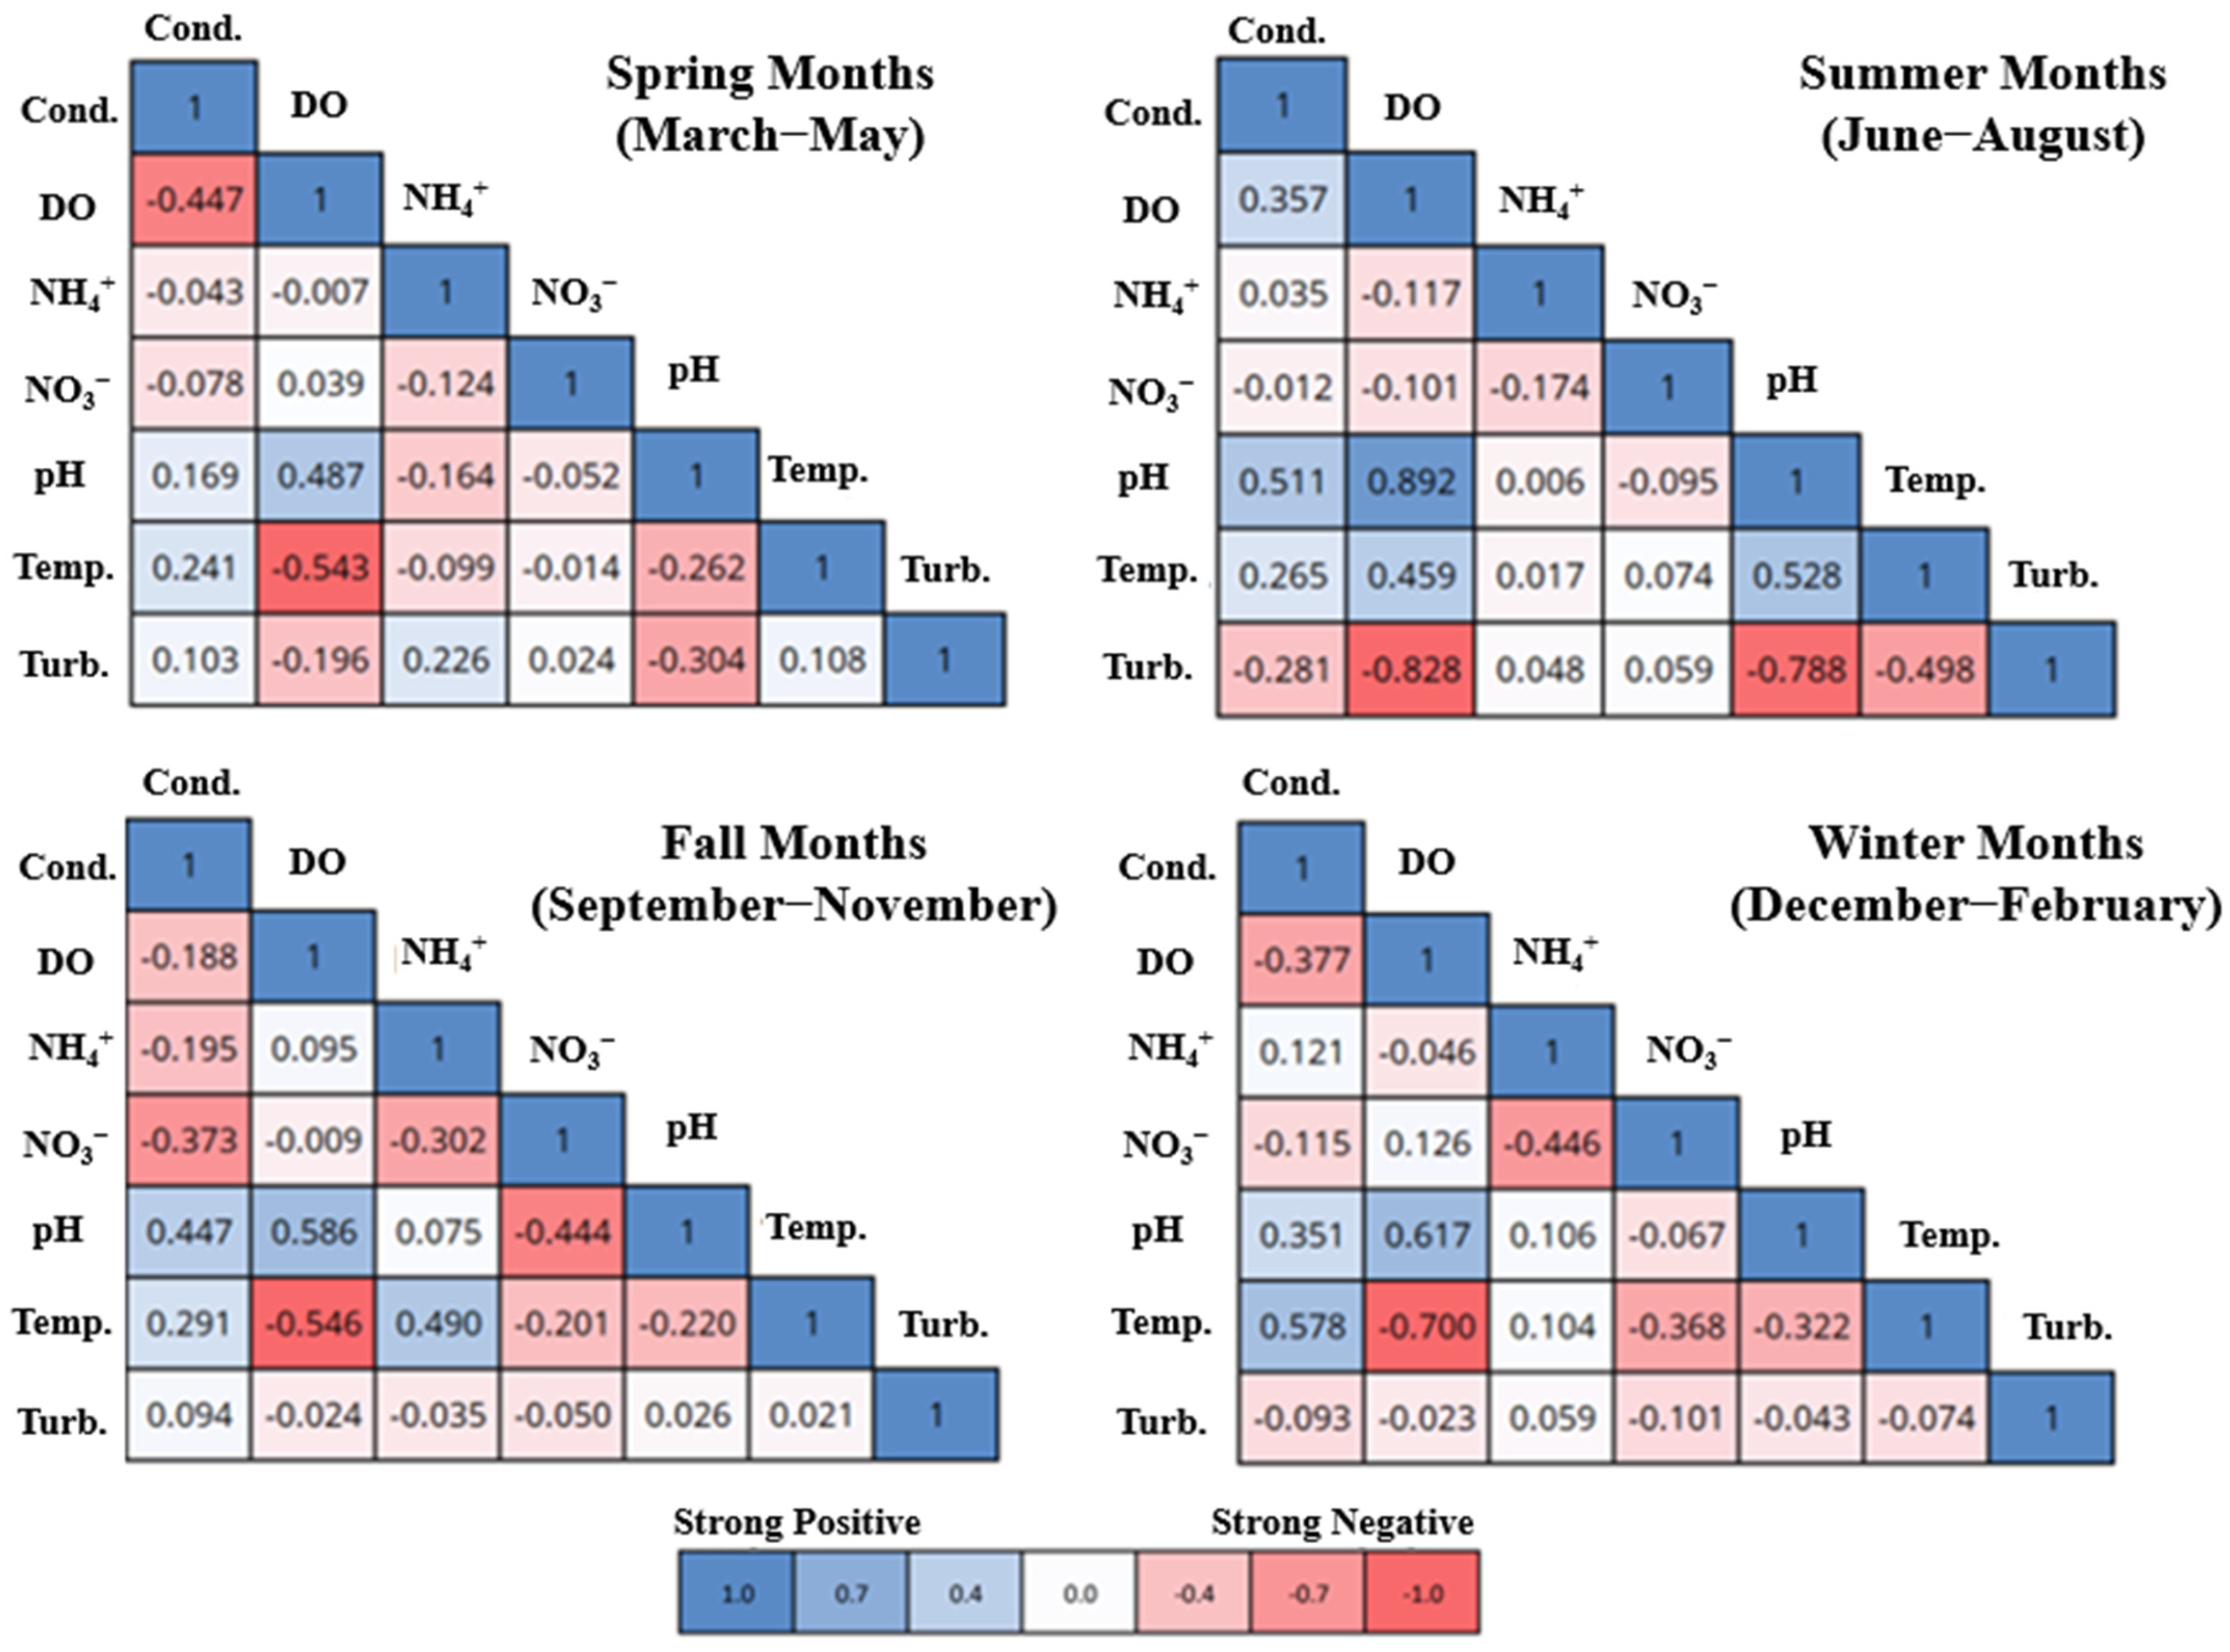
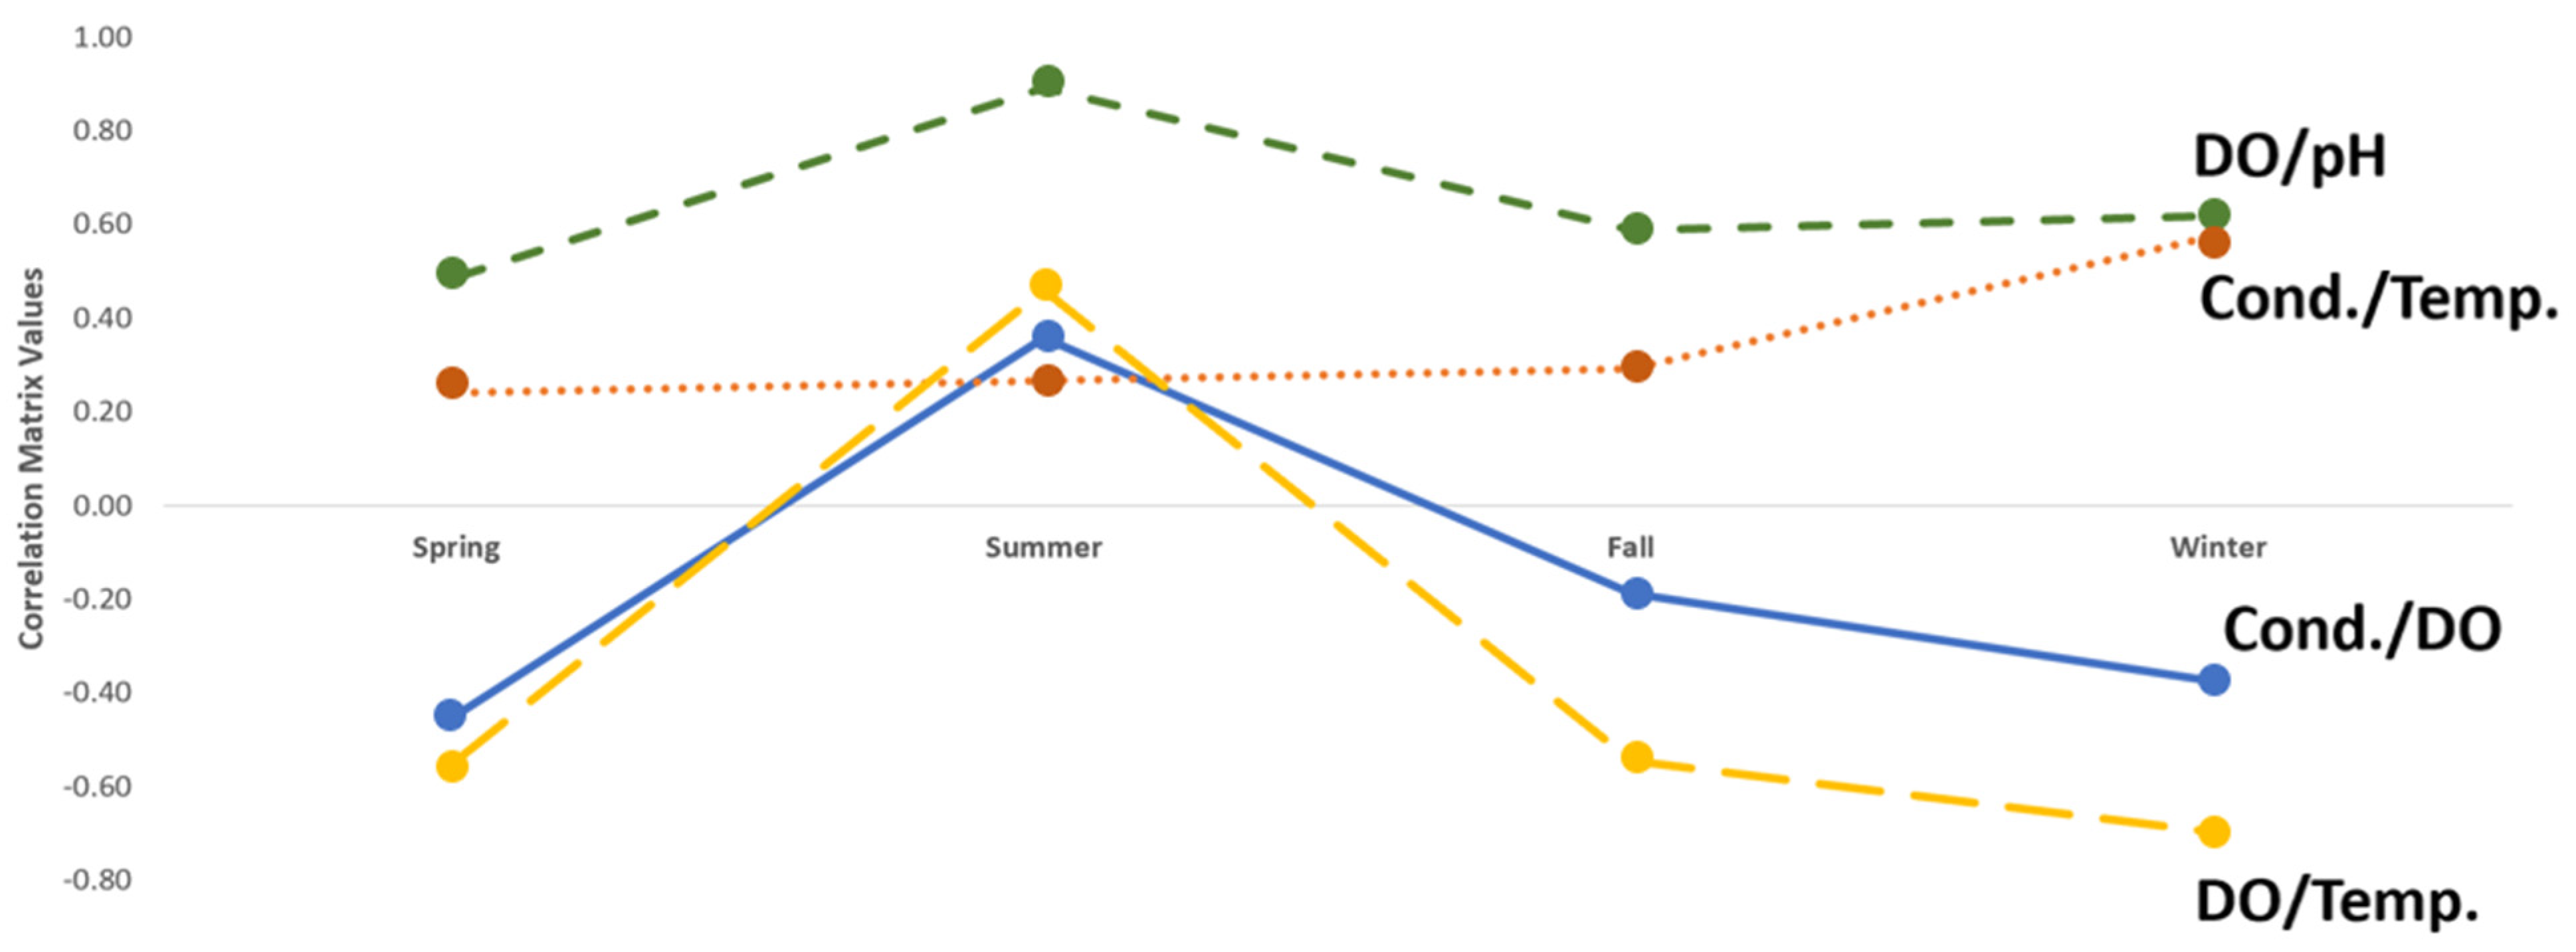
The four primary relationships observed in the complete study period were also examined by analyzing CM for each seasonal dynamic (Figure 4). Seasonal dynamics were assigned based on monthly intervals with spring representing March–May, summer June–August, fall September–November, and winter December–February. For CM interpretations, the closer the value is to 1 or −1, the stronger the relationship. For instance, the Cond./DO correlations range from −0.447(spring), 0.357 (summer), −0.188 (fall), and −0.377(winter). Similarly, the negative correlation of DO/Temp. also has a shift in the summer months. The CM from each season yields −0.543 (spring), 0.459 (summer), −0.546 (fall), and −0.700 (winter). Both positive correlations maintained positive values across the seasonal analysis, including: 0.241 (spring), 0.265 (summer), 0.291 (fall), and 0.578 (winter) for Cond./Temp. and 0.487 (spring), 0.892 (summer), 0.586 (fall), and 0.617 (winter) for the DO/pH correlations. Trends in these standard parameters will be further evaluated in the discussion.
There are additional strong correlations from the seasonal analysis that could indicate changes to pond health. The spring dataset was the only season that did not have relationships greater than 0.40 and less than −0.40 outside the standard correlations seen from the complete survey period. Summer showed strong negative trends in turbidity, including DO/Turb. (−0.828), pH/Turb. (−0.788), and moderate relationship in Temp./Turb. (−0498). There is also a moderate positive correlation in Cond./pH (0.511) and pH/Temp. (0.528). During the fall season, positive correlations in Cond./pH (0.447) and NH4+/Temp. (0.490), while there is a negative correlation NO3/pH (−0.444). The winter season has one additional negative correlated variable, NH4+/NO3 (−0.446).

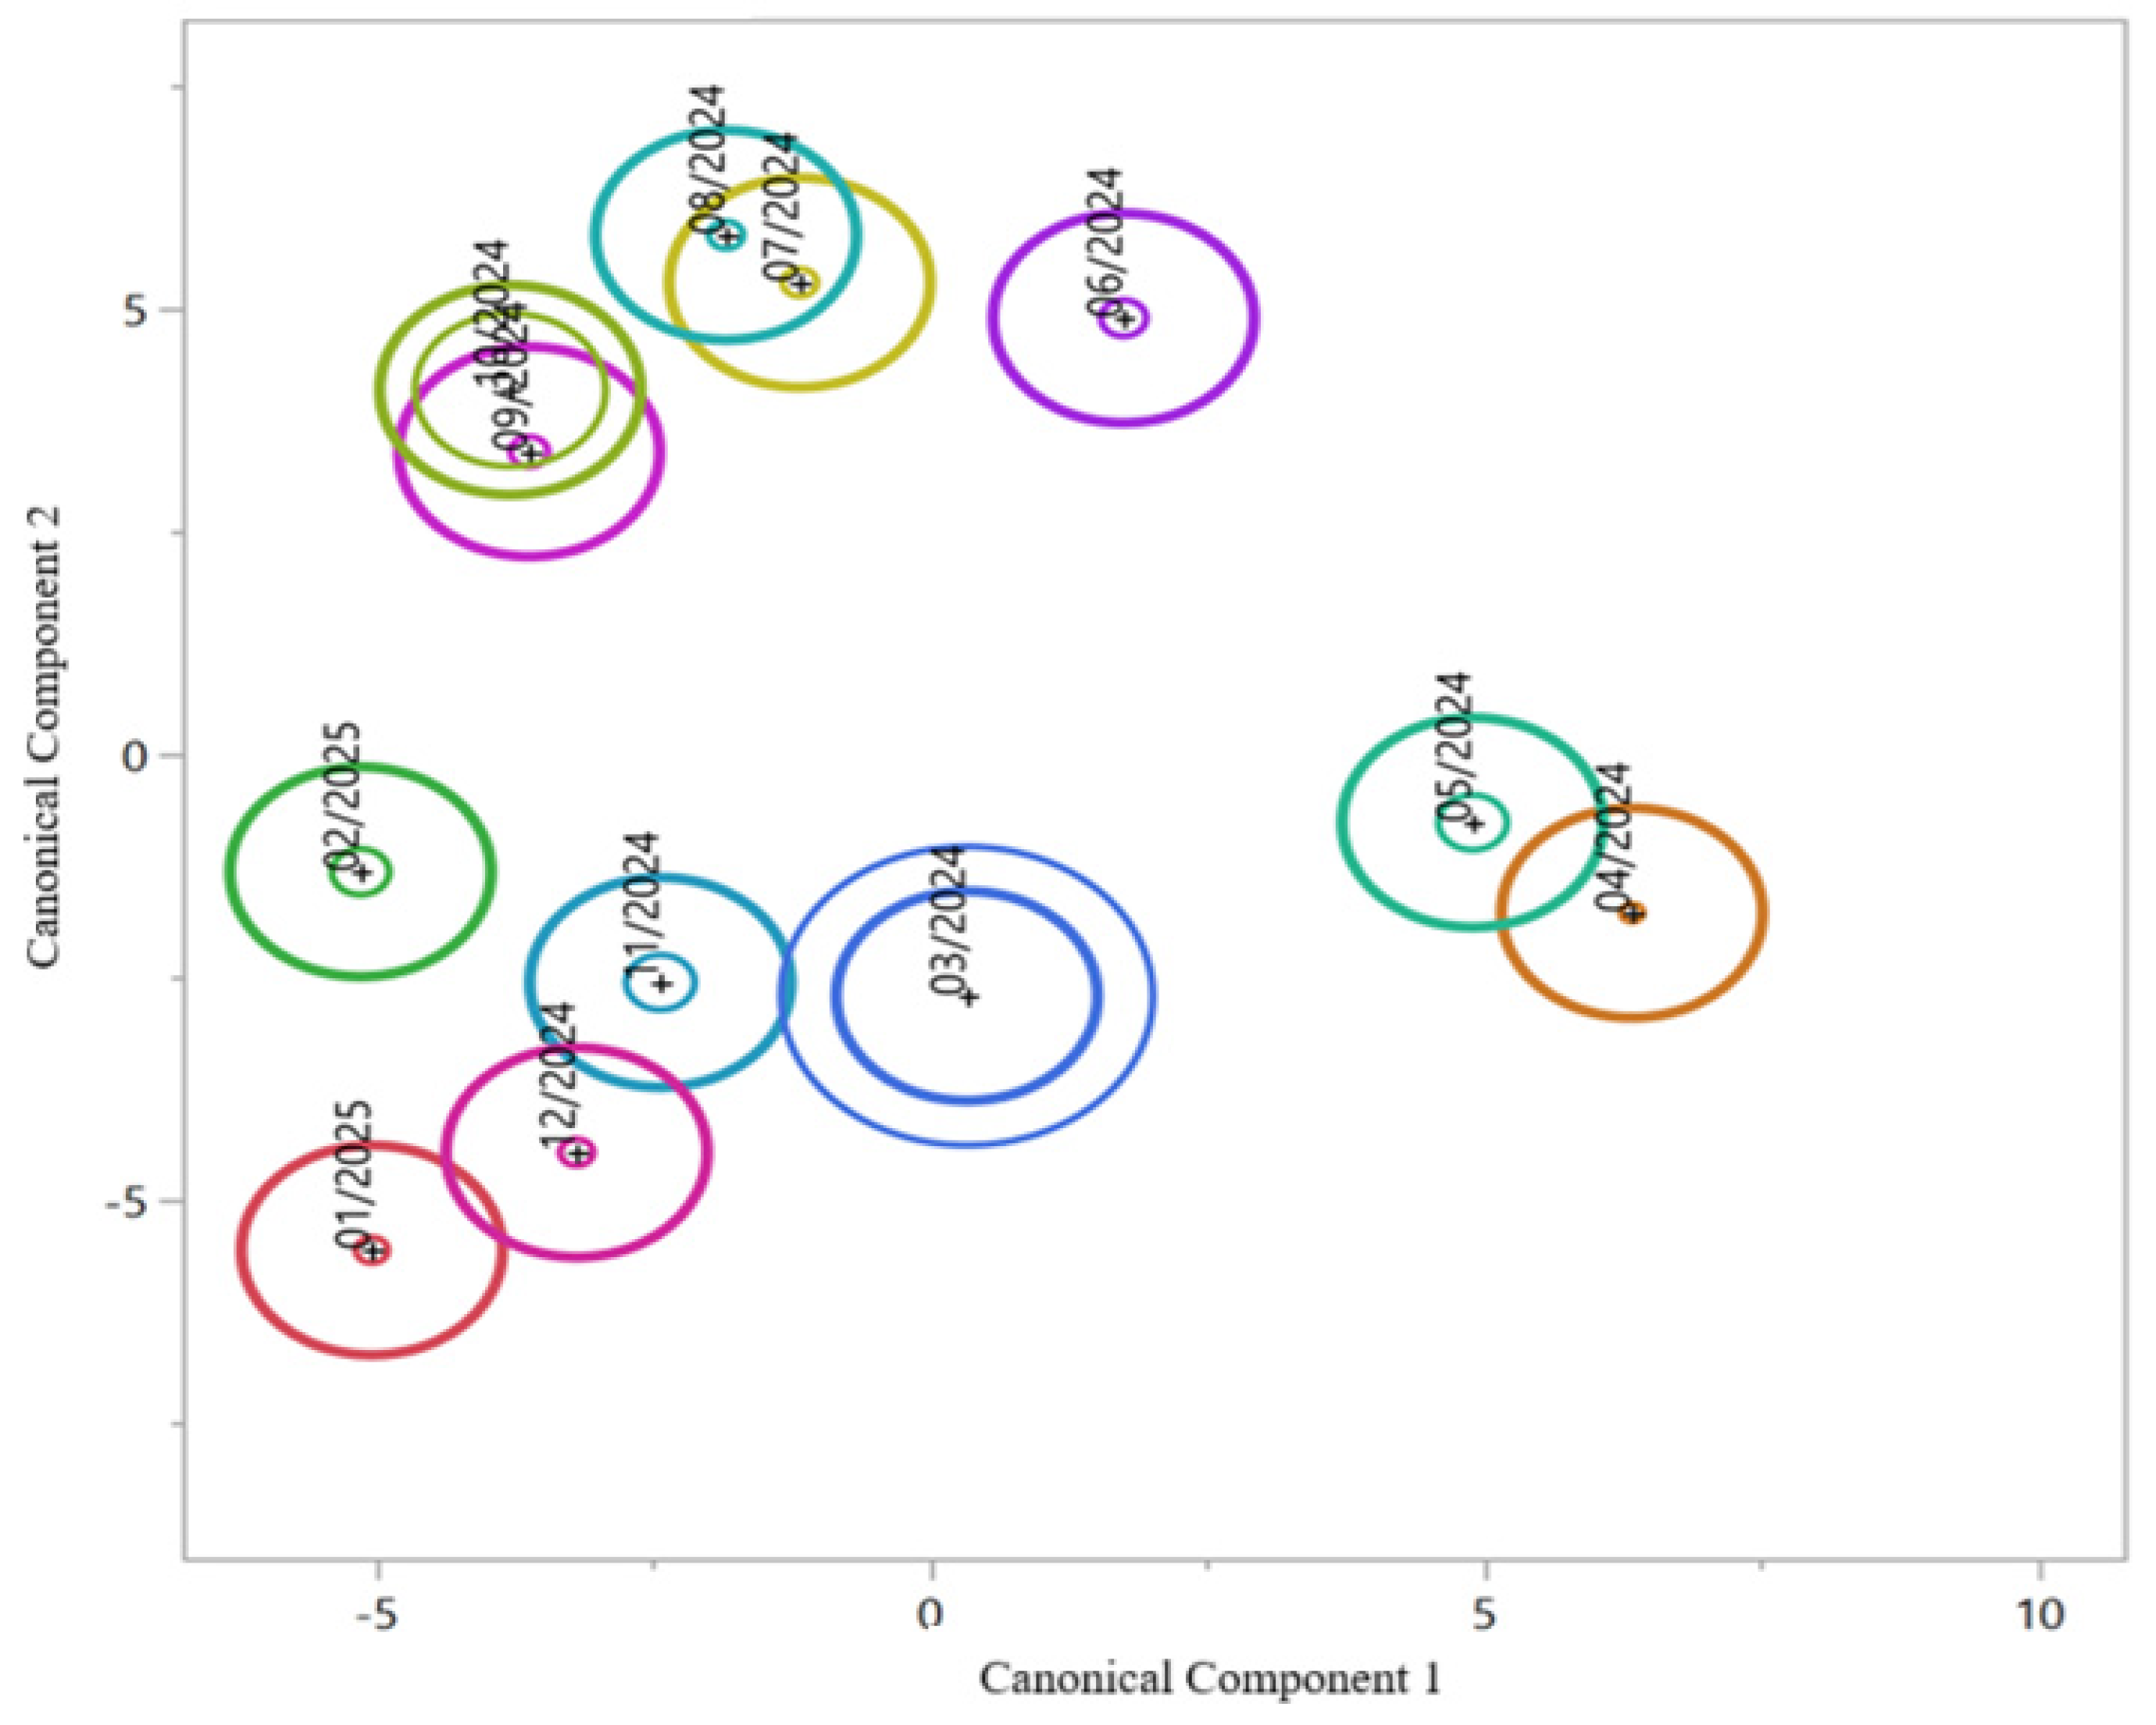
3.2.3. Monthly Canonical Correlation Analysis

Data resolution can continue with a monthly CCA cluster plot (Figure 5) that shows the separation of individual months that have changing parameters. The use of CCA allows data overlapping to show similarity at the mean confidence interval ellipse (95%) and connectivity of parameters, while indicating more granular changes in datasets. The 95% confidence interval ellipse is indicated by the overlapping of circles, which means the monthly data is statistically indistinguishable. For instance, Figure 5 shows each month identified by circles, while overlapping months are statistically similar to the others. The months October 2024, November 2024, March 2024, and April 2024 are all densely clustered with significant overlaps, which indicates the spring and fall data have similar characteristics, while August 2024 and September 2024 are isolated and may be indicative of a dynamic change in the warmer months. Most seasonal cycling, like in the case of February 2025, March 2025, April 2025, and May 2025, shows slight significance with minimal overlap. For this clustering, February 2025 and April 2025 share significance with March 2025, but not with each other, indicating a degree of separation due to seasonal fluctuations.

3.3. Secondary Treatment Statistical Analysis

3.3.1. Complete Study Period for S2

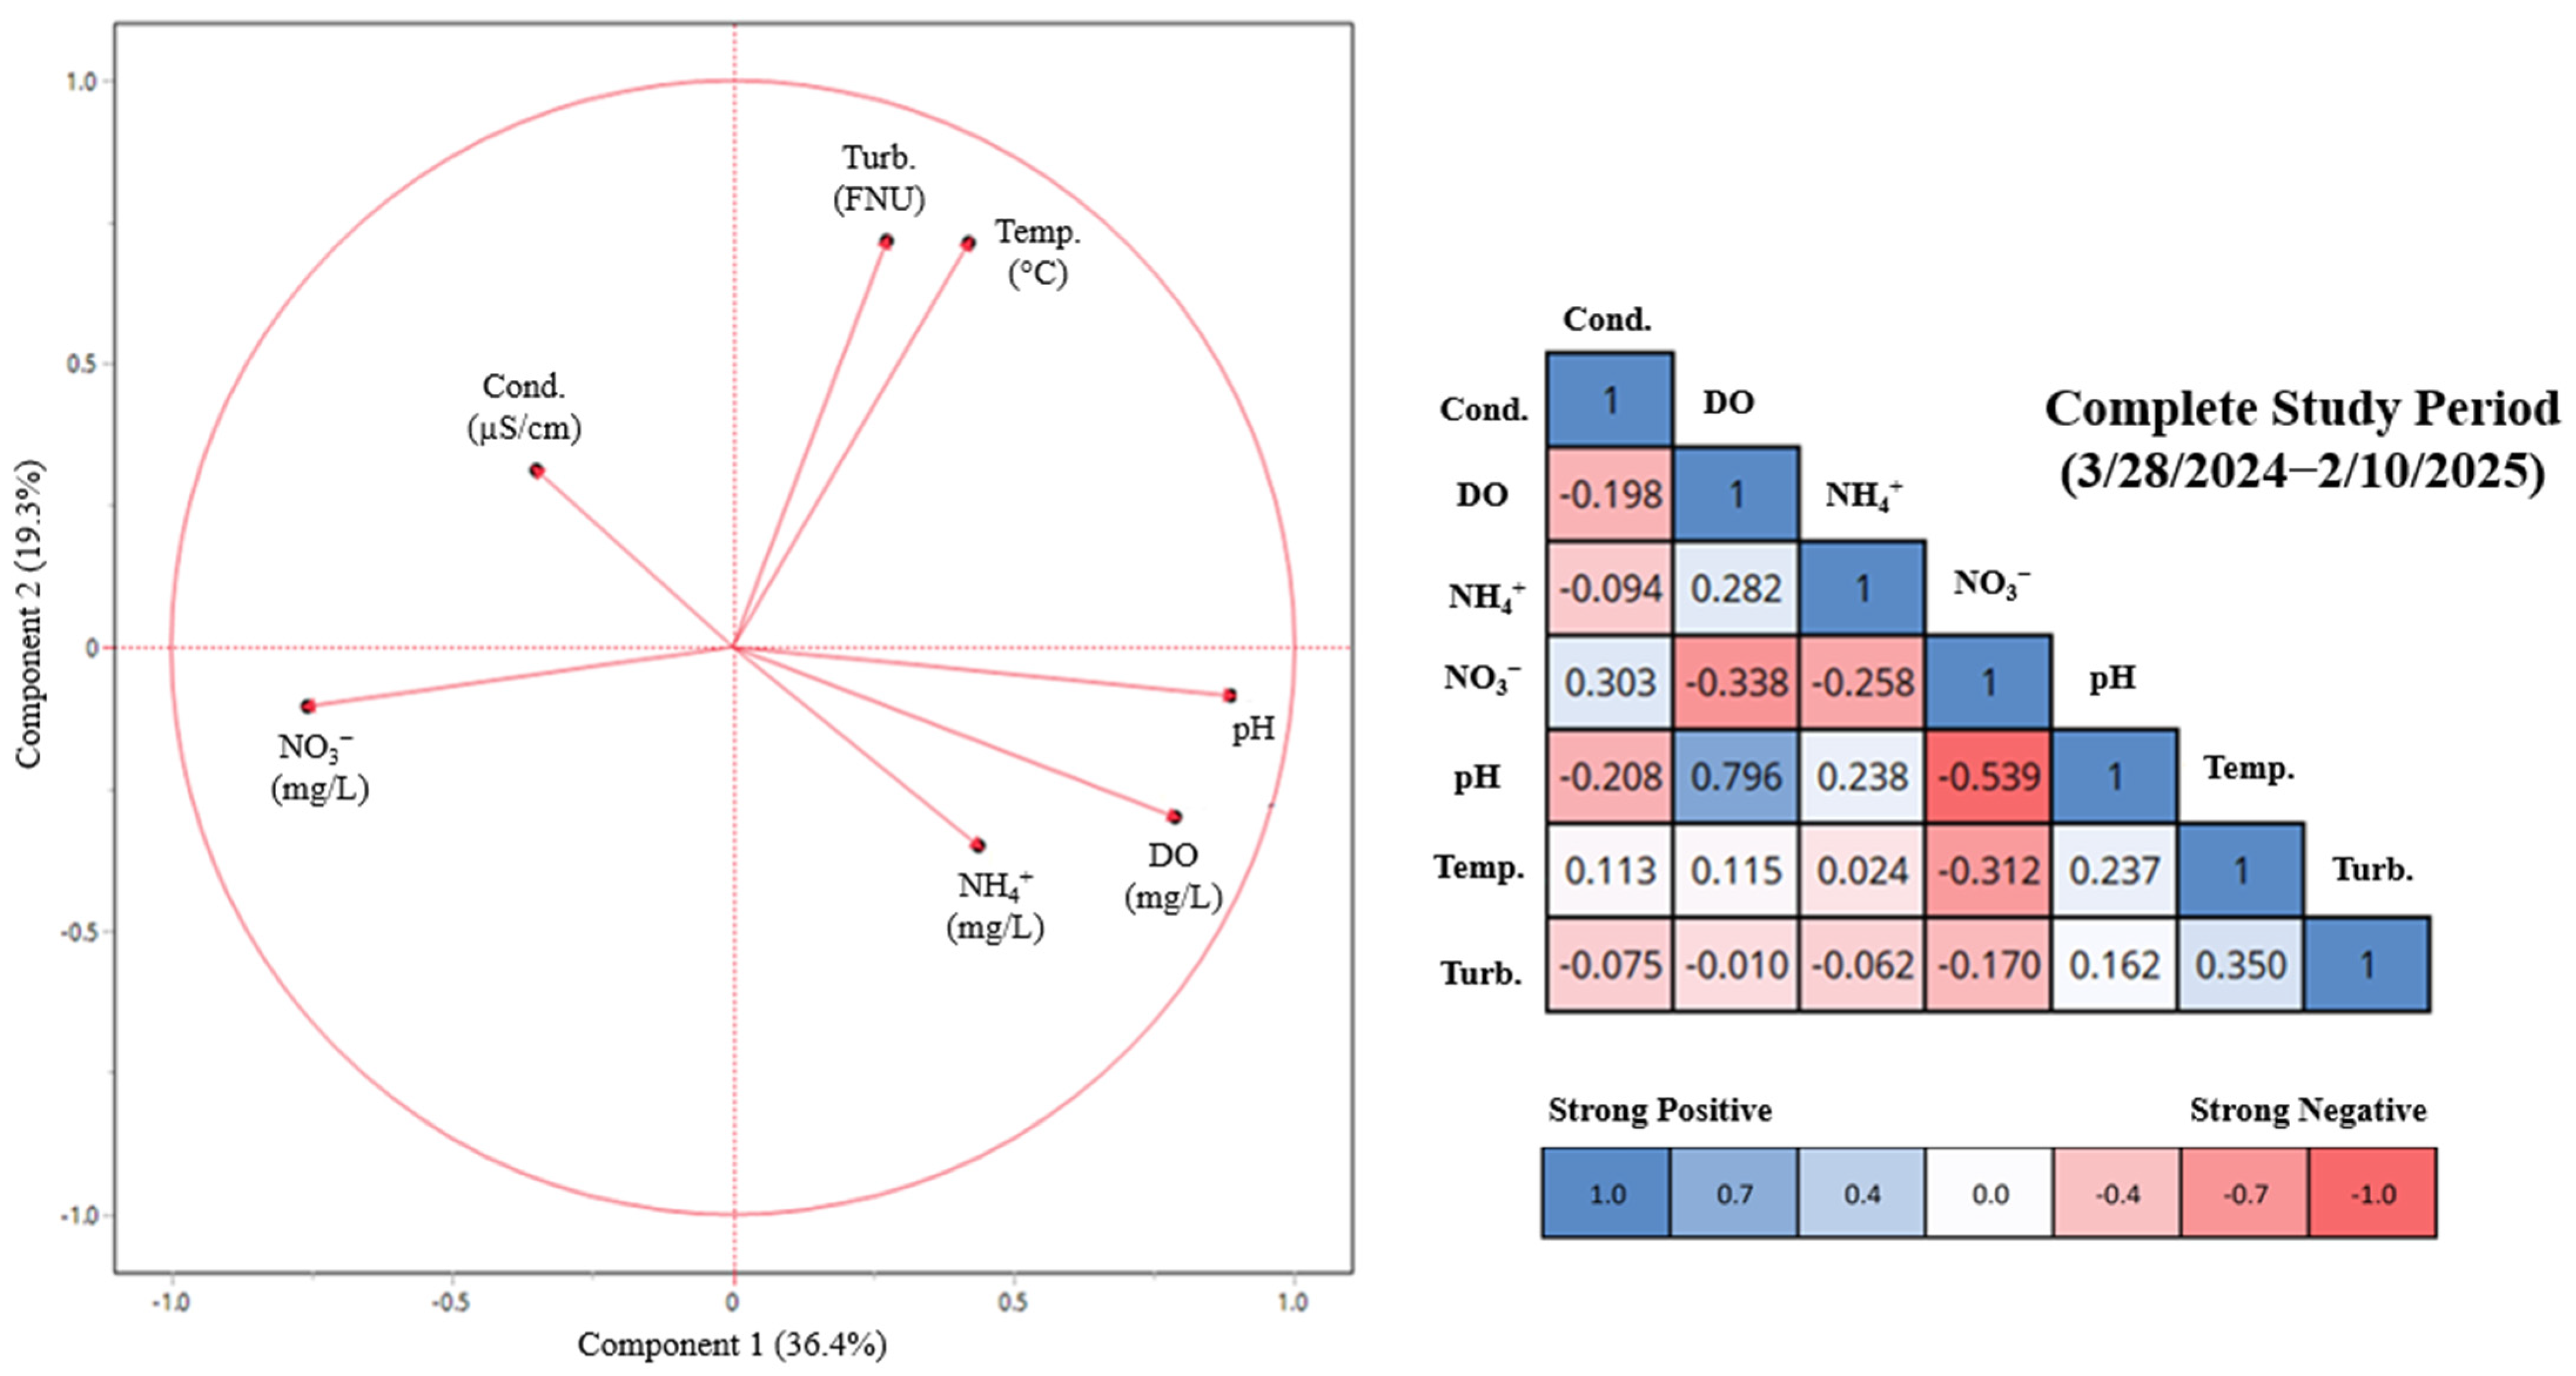
The secondary treatment pond S2 dataset served as an indicator for the full 30-day detention processes, prior to final treatment and chlorine dosing. The corrected data from 28 March 2024 to 10 February 2025 was analyzed using the same PCA, CM, and CCA multivariate analysis and yielded different correlated parameters to the partially treated S1 data. Figure 6 PCA Plot shows pH and DO with the highest contribution to the analysis, with the nitrogen species making greater contributions than in the S1 dataset. The thresholds of greater than 0.40 and less than −0.40 were used to determine the yearly relationship that would be traced during the seasonal surveys. Figure 6 shows two prominent relationships that were seen in the effluent, including a negative relationship of NO3/pH (−0.539) and a positive relationship between DO/pH (0.796).

3.3.2. Seasonal Intervals

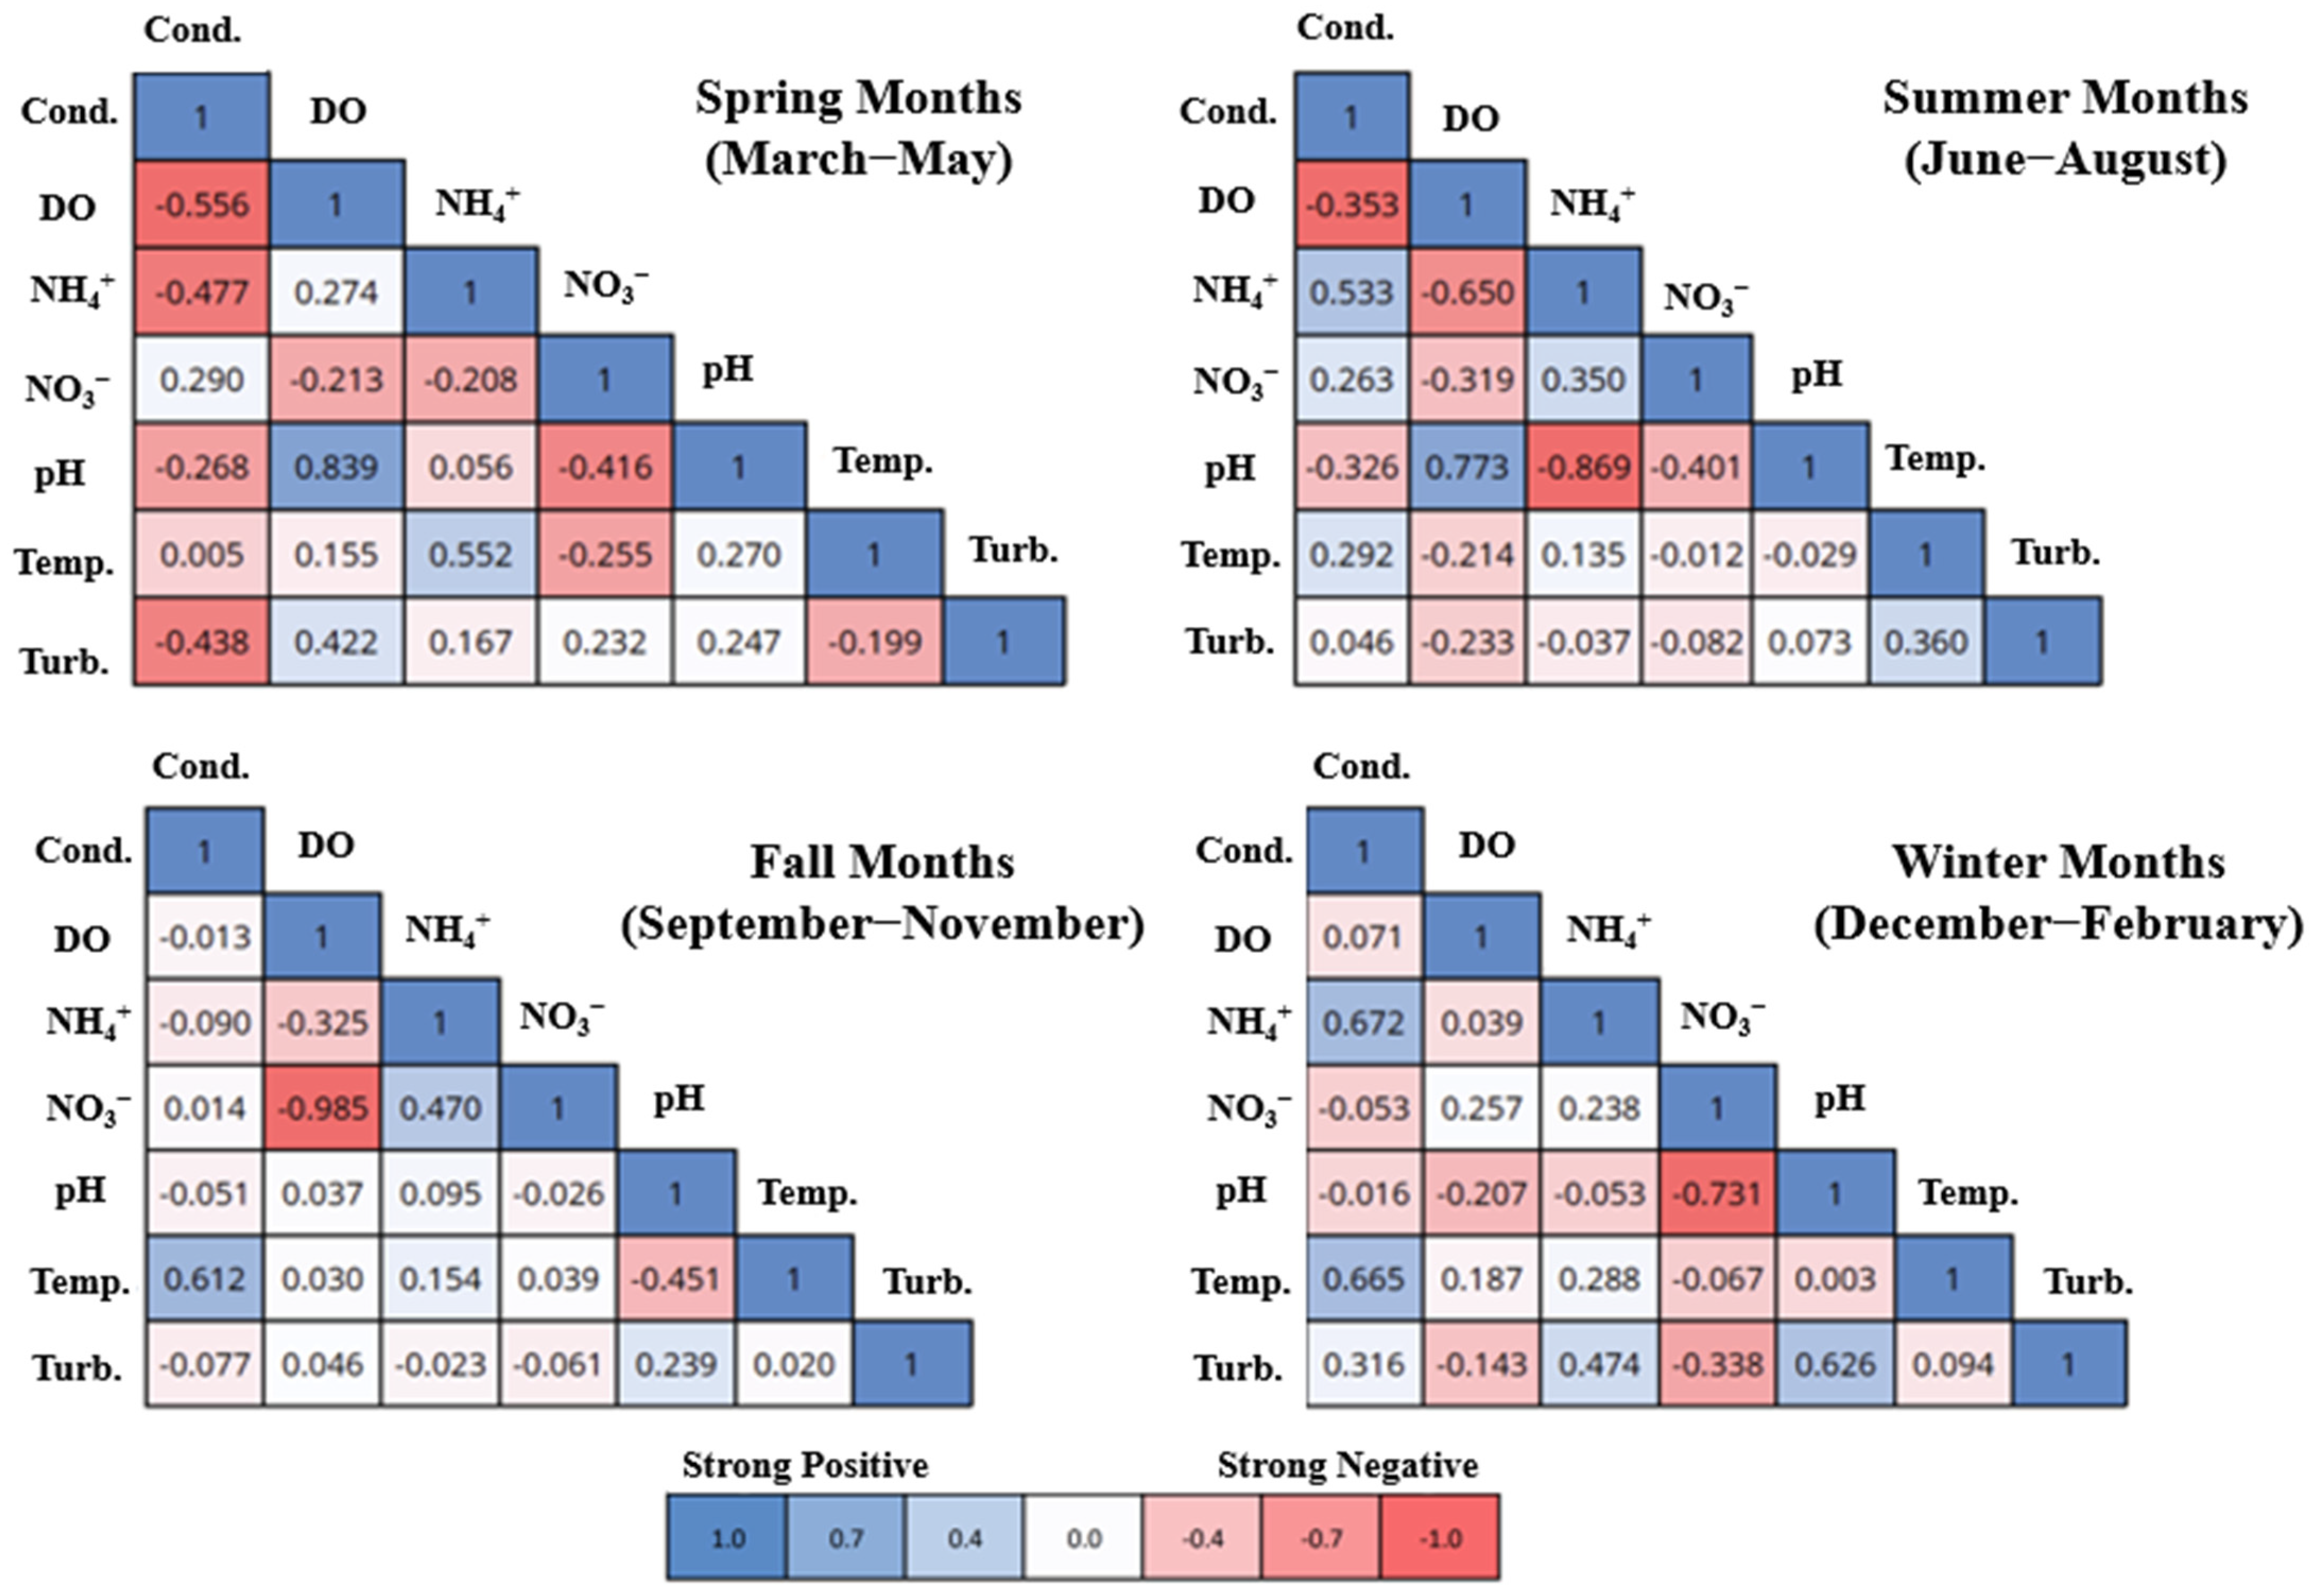
The two relationships prevalent in the yearly S2 data analysis were further investigated during each season. The positive DO/pH correlation has variability across the seasonal analysis, with 0.839 (spring), 0.773 (summer), 0.037 (fall), and −0.207 (winter). Since the DO/pH showed all positive correlations in the S1 seasonal analysis, the slight negative correlation in fall and winter could indicate a change in pond health. The negative NO3-/pH relation remains negative with −0.416 (spring), −0.401 (summer), −0.026 (fall), and −0.731 (winter). This provides more consistency for negative correlations, with slight variability in fall data. Figure 7 seasonal multivariate analysis produced more unique correlations during the three-month periods. The relationships that are not persistent in the yearly dataset could signify individual parameter responses to water quality changes or seasonal variation. The S2 location has very little fluctuation, which creates a stronger correlation when parameters fluctuate. For instance, spring has the highest DO in Table 3 for the S2 sensors. In response to this high DO event, in this case, the aerators closest to the outflow location were operational. There are two moderate correlations for DO in the spring dataset that are not present in the other seasons. For spring, there are negative correlations in Cond./DO (−0.556), Cond./NH4+ (−0.477), and Cond./Turb. (−0.438). Additionally, there are positive correlations in NH4+/Temp. (0.552) and DO/Turb. (0.422). The spring season has the most individual correlation of any month. Summer has a positive correlation between Cond./NH4+ (0.533) and negative correlations for DO/NH4+ (−0.650) and NH4+/pH (−0.869). In the fall season, there are positive correlations for Cond./Temp. (0.612) and NH4+/NO3 (0.470), while DO/NO3 (−0.985) and pH/Temp. (−0.451) have negative correlations. The winter has all positive correlations for the parameters Cond./NH4+ (0.672), Cond./Temp. (0.665), NH4+/Turb. (0.474) and pH/Turb. (0.626). The S2 dataset presents more correlations for the nitrogen species, which could be used as a predictive tool for treatment efficiency.

3.3.3. Monthly Canonical Correlation Analysis

The monthly CCA cluster plots (Figure 8) have intriguing trends that provide less significant clustering compared to the S1 data. The most intriguing cluster is June 2024, July 2024, August 2024, September 2024, and October 2024. Though not statistically aligned, these cluster points could indicate lag water parameters from Figure 5 CCA (May 2024, June 2024, July 2024, August 2024, and September 2024). This would seemingly validate the 15-day detention time across the water quality parameters and showcase the lag for water processing between the two-stage pond. In addition, the clusters could provide insight into the origin of water quality relationships. For example, the spring CM in Figure 7 shows moderate and strong correlations with conductivity and NH4+. In the CCA clusters, April 2024 and May 2025 are statistically similar, indicated by the overlapping circles; therefore, the changes in April/May could be the driving variable change to the correlations. This can also be seen in the fall correlation, where September 2024 and October 2024 are statistically similar, but November 2024 more closely correlates with December 2024. This can aid in narrowing the focus to the root of water quality changes in the WSP.

4. Discussion

4.1. Trends in Yearly WSP Dataset

The incorporation of remote water quality sensors into the facultative WSP can provide clear insight into yearly trends in both the primary settling and secondary treatment ponds. Early discussions with the facility personnel indicated an increase in chlorine usage in late spring and early fall. This was an accounted-for operational cost that is persistent in many WSPs due to temperature shift or ammonium concentrations [31]. Table 2 shows the variability in settling pond dynamics across the complete study period, and it can be seen that the largest difference in temperature is between April/May (3.4 °C) and September/October (3.5 °C). Additionally, in Table 3, secondary treatment, the same months have a higher temperature change of 4.2 °C and 4.0 °C, respectively. Steep temperature spikes in layered facultative WSPs are seen in the literature to cause decreased efficiency in microbial communities, thus inhibiting processing [32]. Microbial communities are more effective at a certain temperature threshold, so in the case of yearly temperature changes, populations can be seeded in ponds to maintain density and effective processes during extreme conditions. The temperature dynamic was also seen to impact the yearly correlations in the settling pond (Figure 3).
A positive correlation was seen in the settling pond between Cond./Temp. exhibiting standard water interactions of ion mobility and kinetic energy. Pond ion activity is due to the increased ability of ions to conduct current, which occurs as temperature increases. In contrast, the well-documented negative relationship of DO/Temp. is due to the solubility of oxygen in various water systems. Standard trends show that as temperature increases in WSPs, the total DO in the system is lowered, which can inhibit microbial activity [33]. In the annual settling pond correlations, there was an additional positive relationship between DO/pH. This can be linked to complex relationships in microbial activity or dissolved oxygen generation from pond aeration. The typical DO/pH dynamic is an inverse relationship, which leads to the increased requirement of DO [34]. An example of this dynamic is the algal photosynthesis process using dissolved oxygen to process carbon dioxide (CO2), which, in turn, increases the pH value by shifting the equilibrium from a carbonic acid to a carbonate system [35]. Since this trend remains consistent across all time intervals (with the exception of winter), this indicates that the continuous aeration in the WSP is the main contributor to this correlation. In this case, the continuous aeration increases dissolved oxygen concentrations and contributes to deassing or “stripping” of CO2 from wastewater which shifts the equilibrium to a carbonate system, increases the pH [23]. Another standard indicator that is observed for microbial breakdown in WSPs is the negative correlation of Cond./DO. The increased conductivity can indicate degradation of organic matter by microbes, which contributes to the production of nutritive salts, thus signifying a corresponding reduction in the DO from the activity [36]. These four parameters are easily measured with in situ testing by facilities and provide valuable insight as standard indicators for WSP processing.
The multivariate analysis of the secondary treatment pond (Figure 6) yielded fewer correlated parameters. For this stage of the pond treatment, DO/pH was the only standard correlation associated with consistent aeration in the WSP. The only other correlation was a negative relationship between NO3/pH. This could be indicative of residual nitrogen processing in the final stage of the processes. An identifiable difference between the S1 and S2 units is the duration of the treatment processing. The partially treated wastewater that is measured with the S1 sensors has a high concentration of DO (averaging 3.66 mg/L). In contrast, the S2 dataset is from stagnant wastewater behind the outfall basin, averaging 0.78 mg/L DO. The facility personnel identified that the 7.5-horsepower aerator in front of the outfall basin remains off to allow for settling before the final stage, unless needed due to maintenance of other aerators. The reduced oxygen introduction from the offline aerator and the lack of water movement behind the outfall basin account for the low DO, while the buildup from suspended nutrients from settling before discharge can contribute to increased nitrogen species.

4.2. Seasonal Water Quality Response in Settling Pond

The primary settling pond offers the most impactful treatment response in the WSP due to the fluctuating intake and partial treatment. Additionally, there is more aeration from larger horsepower blowers in this pond, generating high concentrations of DO for microbial use. In the spring season, the standard correlations are consistent with the annual CM plot. The only parameter with a slight change in correlation strength is Cond./Temp., which maintains a positive correlation in the spring but presents a weaker correlation. Alsualaili et al. 2021 [37] showed a strong influence of temperature and conductivity on discharge output, which indicates more focus should be placed on other correlations during the spring season, due to the decreased strength of this relationship. Springtime temperatures typically signify a change in microbial processes, but no changes in correlations or average values were noted during this time period. This could be in part due to the lag time in processes that would be detected by sensors later in the process.
The summer was the most dynamic season for settling pond parameters. Cond./Temp. remains the only constant value correlated value, while both traditional inverse relationships of DO/Temp. and Cond./DO present positive correlations. Though it is atypical to see a positive correlation in DO/Temp., there are certain situations that can lead to these results. For instance, this WSP continuously attempts to stimulate microbial activity with large horsepower aerations, and during the summer months, the city receives, on average, the highest rainfall. Rainfall can add additional dissolved oxygen to a system, thus increasing the overall saturation. It was also documented during the sampling period that two algae blooms were present in the corners of the WSP, where water circulation was limited. The presence of algae is rare in this pond setting, but Haung et al. 2021 [38] show that unusually high temperatures can lead to an algae bloom, and the proximity to the sensors may have contributed to higher saturation of DO. The cumulative sources of dissolved oxygen (algae, aeration, and rainfall) and the increased summer temperatures could contribute to the overall seasonal positive correlation in the DO/Temp., which could indicate operational change if detected early to ensure optimal treatment during the final 15 days of processing. Rainfall averages in Gonzales, Louisiana were recorded at 13.8″ from June to August 2024, which was an increase from 11.4″ in the same summer months in 2023. The facility personnel keep accurate logs of rainfall events to account for pond volume including high accumulation events like Hurricane Francine (Fall 2024) which added 4.0″ in less than 48 Hh span. This study presents evidence of low-cost sensors for parameters including DO and Temp. to be used to indicate imbalance. For this case, facility personnel could reduce aeration to avoid microbial stress from oversaturation during summer rainy seasons. The positive correlation in Cond./DO can be linked to increased need for DO from elevated nutrient loads. Table 2 indicates an elevation in NO3 from May to June, which remains slowly decreasing in July and August. The initial high load may suggest increased DO demand and degradation of organic matter by microbes, which corresponds to the increasing conductivity. This can also be seen with the highest correlation of DO/pH (0.828) which is linked to nitrification processes due to increased biological processing. The evidence of imbalance for the summer system is further evident in the moderate positive correlation of Cond./pH (0.511), the highest of any season. Though these parameters have a complex relationship, the increased conductivity in the summer from Table 2 could promote subtle changes in daily pH. Nair et al. 2022 [39] used conductivity and pH as indicators for phosphorus and chemical oxygen demand in municipal wastewater treatment, which indicates that nutrient imbalance could increase both parameters. In addition to the standard parameters, the strong negative correlations of Turb. to DO (−0.828), pH (−0.788), and Temp. (−0.497) show the increased abundance of organic material in the WSP, which has been linked to treatment efficiency issues [40].
The fall season provides more consistent trends with standard water parameters in WSPs. For instance, in Figure 9, DO/Temp. is shown to have a moderate inverse relationship as the cooling begins in September/October. Additionally, the decrease in weaker correlations of Cond./pH and DO/pH could indicate a reduction in nutrients in the fall system. This seasonal matrix was the first to have nitrogen species with moderate correlations. The positive correlations of pH/NO3 can be used as an indicator of biological processing at this stage in the process. These correlations remain low through the annual and seasonal trends, apart from fall, which shows a moderate negative correlation of −0.443. This, along with the increase in NO3 in Table 2 during the fall season, suggests higher loads for processing, though conditions between DO, temperature, and conductivity are more optimal at this time of year to treat the increased nutrient load. The positive correlation in NH4+/Temp. also could validate an abundance of NO3 in the system. This correlation should be presented as negative, but with a higher load of NO3, it would increase the nitrification and NH4+ present in the WSP. The fall trends suggest an increase in nutrient loads but a stabilization of processing to balance the treatment processes compared to summer.
Winter correlations can be more closely compared to the yearly correlation matrix with similar values for the Cond./Temp., DO/pH, and DO/Temp. relationships. The strong negative correlations in DO/Temp. could be due to the 2025 Winter Storms, which covered south Louisiana with 9” of snow, decreasing water temperatures to a sensor recorded 9.8 °C. This yielded the highest average monthly concentration of DO at 5.4 mg/L. The additional negative correlations between NH4+/NO3 indicate the nitrogen species dependence on microbial activity during cold weather. With the abundance of oxygen in the system, microbial performance decreases with cold temperatures, furthering the abundance of oxygen in the system, and causing an inverse correlation. In Table 2 averages, the NH4+ has an inverse correlation, which is supported by the relationship in the CM. These dynamics are also seen by Achag et al. [14], who reported an increase in water quality parameters in colder winter months for North African WSP.

4.3. Secondary Treatment Pond Nitrogen Correlations

For the secondary treatment pond, the S2 sensor location at the outflow basin provided data for the final stage pond treatment, before discharge gravity-fed to final processes and chlorine contact. In this part of the WSP, the 7.5-horsepower aerator in front of the outfall location is consistently turned off, which allows for settling before discharge. Additionally, the sensor was located on the back side of the concrete basin structure (Figure 1), where stagnant water and settled buildup were prominent. The S2 yearly CM showed two correlations that were traced throughout the processes. For the springtime, DO/pH showed strong positive correlations promoting healthy biological processing, with Table 3 depicting a rise in average concentrations of NO3 in the spring months. This is validated by the negative correlations of NO3/pH further promoting stable processing efficiency under these optimal temperatures, a concept presented in other wastewater treatment studies [41]. The negative correlation of Cond./NH4+ is a direct indicator of microbial processing and degradation of ions in the WSP process. Springtime nitrogen processing changes the dynamic of a standard positive relationship in Cond./NH4+, by the conversion of NH4+. The abnormally high NH4+ seen in the secondary pond during the spring months (Table 3) can contribute to the increased ion degradation and also explains the positive correlation of NH4+/Temp. as spring temperatures increase. These increased concentrations are typical in the event of winter accumulation from decrease processing and pond-turn over from increased temperature gradients. An additional factor is dilution from rainfall, which can cause water quality parameters to exhibit atypical correlation. During the survey period, the cumulative rainfall was 18.19″ compared to 10.36″ (2023) and 11.19″ (2025) in the same three-month span. This rainfall impacts the higher concentration of DO in Table 3 and corresponds to the negative relationship of Cond./DO. In comparison to dry arid climates, this study captures complex environmental variables of areas with subtropical climates, including rainfall that alters the standard water quality dynamics of WSP. The increased correlations of turbidity can also be explained by the input of rain that stimulates water mixing [33].
Summer dynamics in the settling pond are more consistent with yearly CM plots, with the positive correlation of DO/pH and negative correlations of NO3/pH suggesting standard biological processing of remaining nitrogen species. Table 3 confirms that lower concentrations of both NO3 and NH4+ are found in the secondary treatment pond. In addition, the Cond./NH4+ returns to positive correlation, which indicates a balance in the ammonia processing. Trach et al. 2022 [42] showed that conductivity above 500 mS/cm has a relatively stable balance of non-ionized ammonium. The negative correlation of NH4+/pH and DO/NH4+ validates the efficiency of summer processing in the outflow location, as the microbial activity is going through the nitrification processes, utilizing low levels of DO in the secondary treatment pond.
The shift in temperature during the fall season typically triggers instability in microbial communities within the WSP. Two standard correlations in WSP are the positive correlation of Cond./Temp. and the negative correlation pH/Temp., which fluctuate with decreasing water temperatures. The cooler water temperatures begin to slow microbial activity and reduce the conversion of nitrogen species [43]. Table 3 suggests a drastic increase in the concentration of nitrogen species, which is supported by the negative correlation between DO/NO3 and the positive correlation between NH4+/NO3. The negative correlation with DO can be indicative of either eutrophication or denitrification dominating processes. Due to the sensor placement, there was minimal DO registered, which initiates less microbial activity at this stage of the process. The secondary treatment pond has ten aerators to stimulate the processes before the final basin area. The positive correlation of NH4+/NO3 is validated by the external input of nitrogen species, which is seen in Table 3. This shifts the concentrations of nitrogen while microbial activity is slow due to cooler temperatures.
The winter season in the settling pond continues the trend in decreased temperatures, driving trends in processes. The positive correlation of Cond./Temp. indicates less processing, while the correlations of Cond./NH4+ (positive) and NO3/pH (negative) both validate standard processes for WSPs. The pH in the winter months is lower than the average throughout the year, which could point toward the positive correlation of NO3/pH being associated with increased NO3 concentration and decreased pH instead of signifying efficient processing. Overall, the S2 sensor placement yielded inconsistent DO data, which showed fewer correlations in the settling pond, with the exception of the rainfall in spring. Additionally, due to the settling and buildup around the gravity-fed outflow station, the turbidity has increased correlations, including winter NH4+/Turb. and pH/Turb. positive correlations. For more accurate outflow parameters, the sensor could be staged in the final stage between operational aerators to provide representative water quality for the entire system with continuous DO input.

4.4. Monthly Indicators for Improved Optimization

For the canonical plots, Figure 5 and Figure 8, the separation in monthly parameters provides more granular data for the seasonal trends. For the primary settling pond, the May 2024–September 2024 dates show data outside the yearly clusters. With the summer seasonal analysis producing atypical relationships, this could be a strategic focus area for the facility to begin optimization. The effects of summer-time dynamics are a well-studied area with research indicating shorter hydraulic retention times aiding processing [44]. Though WSPs have consistent detention times, other parameters like DO can be optimized by turning off aerators in response to rainfall events or using real-time sensors to change based on standard correlations with variables like conductivity, temperature, DO, and pH. Additionally, the incorporation of sensors to monitor the inflow of nitrogen species (ammonium and nitrate) could provide valuable data for optimizing parameters based on environmental conditions and mechanically elevate DO.
At the outflow basin, the monthly clusters show more independent data that would suggest pulses of water transition from primary settling to secondary treatment. For instance, the clustering in Figure 5 of May 2024–September 2024 could align with the group in June 2024–October 2024 in Figure 8, which would validate the approximately 15-day lag time for water variables being treated. This finding justifies the use of S1 data as a predictive tool for S2 outflow parameters and can allow facility personnel to be proactive if changes are observed in the standard water quality dynamics in the S1 data. This context suggests the secondary treatment pond is responsive to variation in parameters and can handle seasonal fluctuations, including drastic temperature spikes like the 2025 Winter Storm. Though the facility met all standard wastewater permitting requirements, this data can be used to explore correlations to promote more efficient treatment and resource optimization.

5. Conclusions

This study provides evidence of standard water quality correlations that are easily monitored to increase the treatment efficiency of WSPs. Most municipal facilities are focused on meeting the necessary requirements to prevent downstream impairments, and with the addition of simplistic monitoring, can obtain an effective means of proactively responding to seasonal variation in pond health. The findings illustrate that during the full-year dataset, the settling pond water quality correlates to standard parameters, including dissolved oxygen, pH, conductivity, and temperature, while secondary treatment is more closely correlated to pH, NO3, and event-based DO. Each seasonal statistical analysis provided context for fluctuations based on changing parameters that influence the conversion of nitrogen species. Summer provided the most dynamic variation in parameter correlations, which provides a target for operational changes to impact pond treatment. During this season, facility personnel can use positive correlations in DO/Temp. in the S1 location to drive operation changes to reduce mechanical aeration, thus mitigating system imbalance and optimizing resources (i.e., energy). The datasets were limited to a single layer of water quality parameters in the traditional facultative WPS. Though these ponds have three layers, this study focuses on the middle mechanically aerated zone at 0.91 m, which does not account for the impact of water quality parameters at the top layer aerobic interface or anaerobic bottom layer. Additionally, the S2 sensor location at the outfall basin was not representative of the secondary pond aeration due to the nearest aerator being off to allow for final settling. This could have impacted the DO measurements and increased nitrogen species and turbidity from buildup. Future studies can focus on vertical water quality profiles for standard parameters (dissolved oxygen, temperature, pH, and conductivity) to better understand the stratification of facultative ponds in response to seasonal change. Future studies will incorporate a water quality index (WQI) to determine the impact of water quality variables during the 15-day treatment between the S1 and D2 sensors. This index value will synthesize standard pond correlation and consolidate multiple parameters into a single pond health metric, allowing for a simplified tool for predictive operation changes. This data will also provide insight into the secondary treatment ponds’ ability to treat variable inflow from the settling pond and optimize dissolved oxygen saturation. This comprehensive dataset incorporates season shifts that correlate with standard parameters to process changes that allow for proactive response to the water quality issues that arise in detention-based WSP. Ultimately, correlating multiple parameters provides a more in-depth understanding of seasonal changes compared to single parameters and develops the framework for a proactive response for treatment after the S1 sampling point. By incorporating water quality sensor networks into rural WSPs, the correlations could provide insightful data and guidance for operational changes to save on annual facility maintenance and expenses.

Author Contributions

Conceptualization, M.M. and M.H.; methodology, M.M. and M.H.; formal analysis, M.M.; investigation, M.M. and M.H.; data curation, M.M., M.B. and M.H.; writing—original draft preparation, M.H.; writing—review and editing, M.B. and M.H.; visualization, M.H.; supervision M.H.; project administration, M.H.; funding acquisition, M.H. All authors have read and agreed to the published version of the manuscript.

Funding

This research was funded by the Louisiana State University Institute of Energy Innovation (IEI) Phase 1 Funding, grant number AWD005826.

Data Availability Statement

The data presented in this study are available on request from the corresponding author in respect of the team’s partnership with the municipal treatment facility.

Acknowledgments

The team would like to thank the Gonzales wastewater treatment facility personnel for their participation in the study, shared knowledge, and time spent with the team while on-site collecting data.

Conflicts of Interest

The authors declare no conflicts of interest.

References

  1. Butler, E.; Hung, Y.; Ahmad, S.; Yeh, R.; Liu, R.; Fu, Y. Oxidation Pond for municipal wastewater treatment. Appl. Water Sci. 2017, 7, 31–51. [Google Scholar] [CrossRef]
  2. Passos, R.; Ferreira, V.; von Sperling, M. A dynamic and unified model of hydrodynamics in waste stabilization ponds. Chem. Eng. Res. Des. 2019, 144, 434–443. [Google Scholar] [CrossRef]
  3. United States Environmental Protection Agency (US EPA). About Small Wastewater Systems. 2025. Available online: https://www.epa.gov/small-and-rural-wastewater-systems/about-small-wastewater-systems (accessed on 10 September 2025).
  4. Alves, M.; da Silva, F.; Araújo, A.; Pereira, E.L. First-order removal rates for organic matter in full-scale waste stabilization pond systems in Northeastern Brazil. Water Air Soil Pollut. 2020, 231, 528. [Google Scholar] [CrossRef]
  5. Moussavi, S.; Thompson, M.; Li, S.; Dvorak, B. Assessment of small mechanical wastewater treatment plants: Relative life cycle environmental impacts of construction and operations. J. Environ. Manag. 2021, 292, 112802. [Google Scholar] [CrossRef]
  6. Zhang, R.; Wang, Z.; Cai, Z.; Pousseau, D.; Hulle, S. Addressing the rural wastewater treatment dilemma: A techno-environmental-economic analysis. Chem. Eng. J. 2025, 504, 158905. [Google Scholar] [CrossRef]
  7. Mahapatra, S.; Samal, K.; Dash, R. Waste Stabilization Pond (WSP) for wastewater treatment: A review on factors, modelling and cost analysis. J. Environ. Manag. 2022, 308, 114668. [Google Scholar] [CrossRef]
  8. Omidina-Anarkoli, T.; Shayannejda, M. Improving the quality of stabilization pond effluents using hybrid constructed wetlands. Sci. Total Environ. 2021, 801, 149615. [Google Scholar] [CrossRef] [PubMed]
  9. Patyal, V.; Jaspal, D.; Tiwari, A.; Khare, K. Constructed Wetlands for removal of Phosphorus from Domestic Wastewater-A Patent Review. Sustain. Water Resour. Manag. 2020, 8, 1–16. [Google Scholar] [CrossRef]
  10. Kilian, S.; Paweska, K.; Bawiec, A. Evaluation of post-treatment after wastewater stabilization ponds at municipal wastewater treatment plant. Sci. Rep. 2024, 14, 22257. [Google Scholar] [CrossRef] [PubMed]
  11. Krimech, A.; Sbahi, S.; Ouzzani, N.; Oudra, B.; Cherifi, O.; Mandi, L. Evaluation of the efficiency of wastewater treatment and the diversity of phytoplankton in a large-scale waste stabilization pond in an arid climate. Ecol. Eng. 2025, 212, 107518. [Google Scholar] [CrossRef]
  12. Goodarzi, D.; Mohammadian, A.; Pearson, J.; Abolfathi, S. Numerical modelling of hydraulic efficiency and pollution transport in waste stabilization ponds. Ecol. Eng. 2022, 182, 106702. [Google Scholar] [CrossRef]
  13. Abdo, A.; El-Liethy, M.; Doma, H.; Taweel, G.; Ali, G. Chlorine as an integrated approach for environmental health and hygiene: A case study on evaluation of the performance of waste stabilization ponds located at 11 governorates in Egypt. Emerg. Contam. 2022, 8, 243–253. [Google Scholar] [CrossRef]
  14. Achag, B.; Mouhanni, H.; Bendou, A. Improving the performance of waste stabilization ponds in an arid climate. J. Water Clim. Change 2021, 12, 3634–3674. [Google Scholar] [CrossRef]
  15. Ghalhari, M.; Schonberger, H.; Lasaki, B.; Asghari, K.; Milan, E.; Rahimi, N.; Yousefi, S.; vakili, B.; Mahivi, A. Performance evaluation and siting index of the stabilization ponds based on environmental parameters: A case study in Iran. J. Environ. Health Sci. Eng. 2021, 19, 1681–1700. [Google Scholar] [CrossRef]
  16. Sinn, J.; Agrawal, S.; Orschler, L.; Lackner, S. Characterization and evaluation of waste stabilization pond systems in Namibia. H2 Open J. 2022, 5, 365–378. [Google Scholar] [CrossRef]
  17. Arslan, M.; Wilkinson, S.; Neaeth, M.; El-Din, M.; Kohkhar, Z.; Walker, C.; Lucke, T. Performance of constructed floating wetlands in a cold climate waste stabilization pond. Sci. Total Environ. 2023, 880, 163115. [Google Scholar] [CrossRef]
  18. Chen, P.; Zhao, W.; Chen, D.; Haung, Z.; Zhang, C.; Zheng, X. Research Progress on Integrated Treatment Technologies of Rural Domestic Sewage: A Review. Water 2022, 14, 243. [Google Scholar] [CrossRef]
  19. Rey, A.; Mulligan, R.; Silva, A.; Filion, Y.; Champagne, P.; Boegman, L. Three-Dimensional Hydrodynamic Behavior of an Operational Waste-Stabilization Pond. J. Environ. Eng. 2020, 147, 2. [Google Scholar] [CrossRef]
  20. Brad, S.; Murar, M.; Vlad, G.; Brad, E.; Popanton, M. Lifecycle Design of Disruptive SCADA Systems for Waste-Water Treatment Installations. Sustainability 2021, 13, 4950. [Google Scholar] [CrossRef]
  21. Dwarakanath, B.; Kalpana, D.; Ranjith, K.; Ahmed, M.; Ghulam, A.; Bheema, T. Smart IoT-based water treatment with a Supervisory Control and Data Acquisition (SCADA) system process. Water Reuse 2023, 13, 411–431. [Google Scholar] [CrossRef]
  22. Camargo, E.; Spanhol, F.; Slongo, J.; Silva, M.; Pazinato, J.; Lono, A.; Coutinho, F.; Pfrimer, F.; Lindino, C.; Oyamada, M.; et al. Low-Cost Water Quality Sensors for IoT: A Systematic Review. Sensors 2023, 23, 4424. [Google Scholar] [CrossRef]
  23. Ho, L.; Jerves-Cobo, R.; Morales, O.; Larriva, J.; Arevalo-Durazno, M.; Barthel, M.; Six, J.; Bode, S.; Boeckx, P.; Goethals, P. Spatial and temporal variations of greenhouse gas emissions from a waste stabilization pond: Effects of sludge distribution and accumulation. Water Res. 2021, 193, 116858. [Google Scholar] [CrossRef]
  24. Benkov, I.; Tsakovski, S.; Venelinov, T. Assessment of the Water Quality of WWTPs’ Effluents through the Use of Wastewater Quality Index. Appl. Sci. 2024, 14, 8467. [Google Scholar] [CrossRef]
  25. Meynet, P.; Joss, A.; Davenport, R.; Fenner, K. Impact of long-term temperature shifts on activated sludge microbiome dynamics and micropollutant removal. Water Res. 2024, 258, 121790. [Google Scholar] [CrossRef]
  26. Ho, L.; Pham, D.; Echelpoel, W.; Muchene, L.; Shkedy, Z.; Alvaradi, A.; Espinoza-Palacious, J.; Arevalo-Durazno, M.; Thas, O.; Goethals, P. A Closer Look on Spatiotemporal Variations of Dissolved Oxygen in Waste Stabilization Ponds Using Mixed Models. Water 2018, 10, 201. [Google Scholar] [CrossRef]
  27. Yellow Springs Incorporation (YSI) EXO University Practical Tips for Reliable Data EXO University–Calibration. Available online: https://www.ysi.com/exo-university/category/exo-sensor-calibration (accessed on 11 September 2025).
  28. JMP Statistical Discovery–Student Edition. Available online: https://www.jmp.com/en/academic/jmp-student-edition (accessed on 11 September 2025).
  29. Duan, R.; Gu, X.; Chang, L.; Cui, X.; Li, X.; You, X.; Zhang, Q. Spatiotemporal variations of nitrogen-nitrate in groundwater and health risk in the parts of Mu Us sandy land, NW China. J. Water Clim. Change 2025, 16, 322–343. [Google Scholar] [CrossRef]
  30. Roy, B.; Roy, H.; Tahman, K.; Mahmud, F.; Bhuiyan, M.; Hasan, M.; Bhuiyam, A.; Hasan, M.; Mahbub, M.; Jahedi, R.; et al. Principal component analysis incorporated water quality index modeling for Dhaka-based rivers. City Environ. Interact. 2024, 23, 100150. [Google Scholar] [CrossRef]
  31. Liu, L.; Hall, G.; Champagne, P. Disinfection processes and mechanisms in wastewater stabilization ponds: A review. Environ. Rev. 2018, 26, 417–429. [Google Scholar] [CrossRef]
  32. Shaheen, M.; Elmahdy, E.; Rizk, N.; Abdo, S.; Hussein, N.; Elshershby, A.; Shahein, Y.; Fawy, M.; El-Liethy, M.; Marouf, M.; et al. Evaluation of physical, chemical, and microbiological characteristics of waste stabilization ponds, Giza, Egypt. Environ. Sci. Eur. 2024, 36, 1–19. [Google Scholar] [CrossRef]
  33. Samal, K.; Samal, S.; Senapati, S.; Panda, A.; Reddy, N. A Review of the Impact of Climatic Factors on the Performance of Oxidation Pond (OP) and Its Linkage to the Circular Economy. Air Soil Water Res. 2025, 18, 11786221251336835. [Google Scholar] [CrossRef]
  34. Siddik, M. Application of machine learning approaches in predicting estuarine dissolved oxygen (DO) under a limited data environment. Water Qual. Res. J. 2022, 57, 140–151. [Google Scholar] [CrossRef]
  35. Santos, S.; van Haandel, A. Transformation of Waste Stabilization Ponds: Reengineering of an Obsolete Sewage Treatment System. Water 2021, 13, 1193. [Google Scholar] [CrossRef]
  36. Achag, b.; Mouhanni, H.; Bendou, A. Hydro-biological characterization and efficiency of natural waste stabilization ponds in a desert climate (city of Assa, Southern Morocco). Aqua Water Infrastruct. Ecosyst. Soc. 2021, 70, 361–374. [Google Scholar] [CrossRef]
  37. Alsulaiulu, A.; Rafaie, A. Artificial neural network modeling approach for the prediction of five-day biological oxygen demand and wastewater treatment plant performance. Water Supply 2021, 21, 1861–1877. [Google Scholar] [CrossRef]
  38. Haung, Y.; Ragush, C.; Johnston, L.; Hall, M.; Beiko, R.; Jamieson, R.; Hansen, L. Changes in Bacterial Communities During Treatment of Municipal Wastewater in Arctic Wastewater Stabilization Ponds. Front. Water 2021, 3, 710853. [Google Scholar] [CrossRef]
  39. Nair, A.; Hykkerud, A.; Ratnaweera, H. Estimating Phosphorus and COD Concentrations Using a Hybrid Soft Sensor: A Case Study in a Norwegian Municipal Wastewater Treatment Plant. Water 2022, 14, 332. [Google Scholar] [CrossRef]
  40. Assefa, E.; Jabasingh, A.; Mulugeta, E.; Dessalenge, M.; Teju, E. Impact of source water quality on total organic carbon and trihalomethane removal efficiency in a water treatment plant: A case study of Upper Awash, Ethiopia. J. Water Health 2024, 22, 337–349. [Google Scholar] [CrossRef] [PubMed]
  41. Park, J.; Craggs, R.; Tanner, C. Eco-friendly and low-cost Enhanced Pond and Wetland (EPW) system for the treatment of secondary wastewater effluent. Ecol. Eng. 2018, 120, 170–179. [Google Scholar] [CrossRef]
  42. Trach, Y.; Bujakowski, F.; Koda, E.; Mazur, L.; Nejbery, K.; Podlasek, A.; Vaverkova, M. Characterization of adsorbents from Ukrainian kaolinite clay for the sorption of nickel: Insight and practical application for water treatment in conditions of economic constraints. Desalination Water Treat. 2022, 278, 1–12. [Google Scholar] [CrossRef]
  43. Achag, B.; Mouhanni, H.; Bendou, A. Performance of municipal waste stabilization ponds in the Saharan desert (Morocco). J. Water Clim. Change 2023, 14, 1741–1761. [Google Scholar] [CrossRef]
  44. Sutherland, D.; Heubeck, S.; Park, J.; Turnball, M.; Craggs, R. Seasonal performance of a full-scale wastewater treatment enhanced pond system. Water Res. 2018, 136, 150–159. [Google Scholar] [CrossRef] [PubMed]
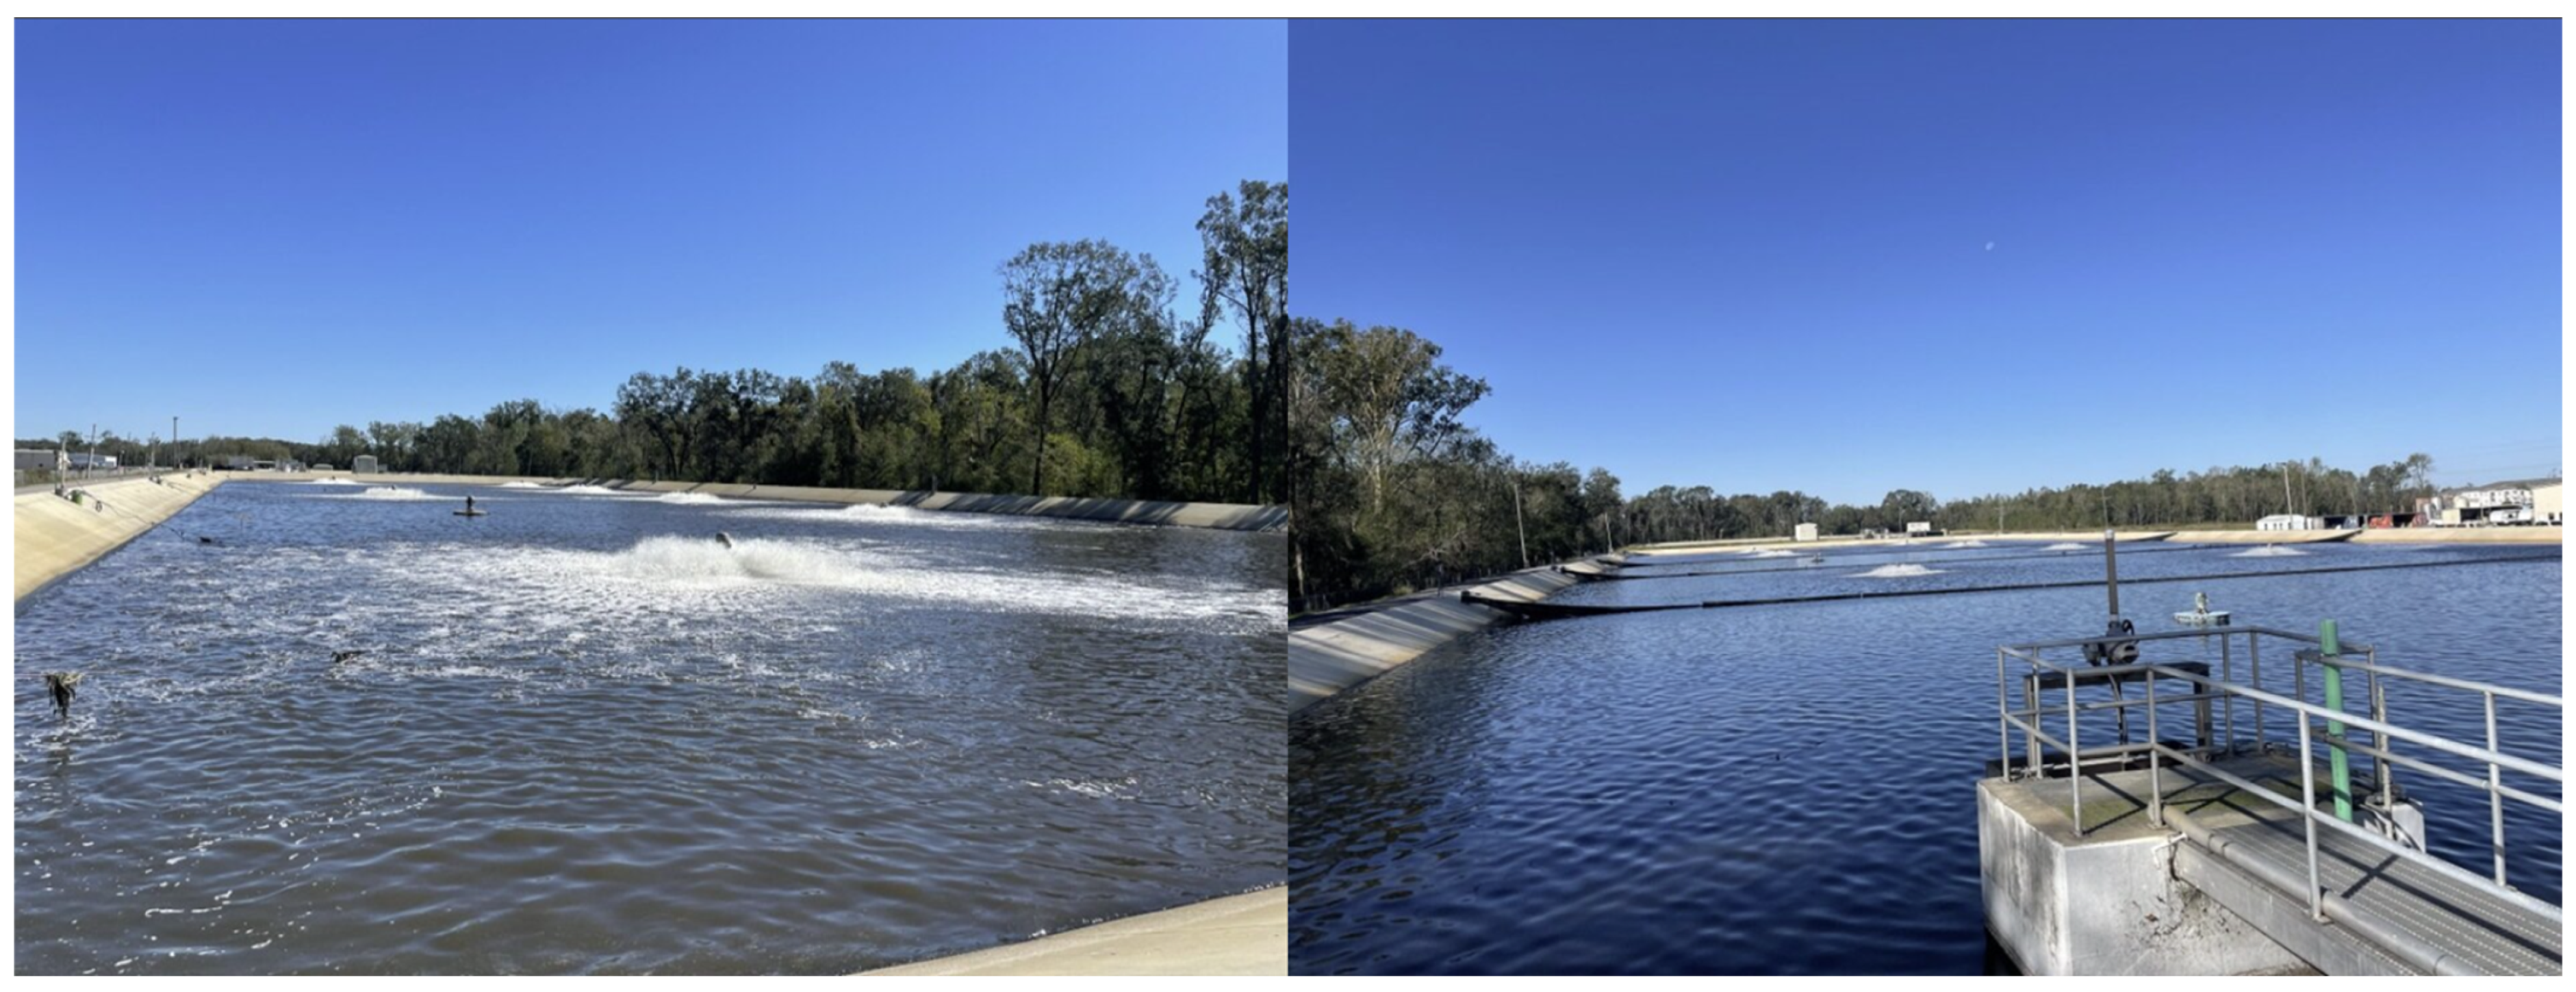
Figure 1. The primary settling pond (left) with the 25-horsepower aerator and the secondary treatment pond (right) with the gravity-fed outfall basin. The S1 sampling location is stationed to the sidewall of the pond near a 25-horsepower aerator, while the S2 sampling location is on the back right corner of the concrete basin in the green vertical pipe.
Water 17 02936 g001
Figure 2. Bimonthly maintenance check for the primary settling pond S1 to show fouling and central wiper blade cleaning efficiency.
Water 17 02936 g002
Figure 3. Principal component analysis and corresponding correlation matrix for the complete study period S1 dataset. CM values |r| = 0.400–0.699 are classified as moderate correlation, while |r| > 0.700 are strong correlations.
Water 17 02936 g003
Figure 4. Correlation matrix derived from PCA for spring, summer, fall, and winter seasonal dynamics for the S1 dataset. CM values |r| = 0.400–0.699 are classified as moderate correlation, while |r| > 0.700 are strong correlations.
Water 17 02936 g004
Figure 5. Canonical correlation analysis for S1 monthly datasets to show significant similarity at the mean confidence interval ellipse (95%). Each color circle represents a different month during the analysis period.
Water 17 02936 g005
Figure 6. Principal component analysis and corresponding correlation matrix for the complete study period S2 dataset. CM values |r| = 0.400–0.699 are classified as moderate correlation, while |r| > 0.700 are strong correlations.
Water 17 02936 g006
Figure 7. Correlation matrix derived from PCA for spring, summer, fall, and winter seasonal dynamics for the S2 dataset. CM values |r| = 0.400–0.699 are classified as moderate correlation, while |r| > 0.700 are strong correlations.
Water 17 02936 g007
Figure 8. Canonical correlation analysis for S2 monthly datasets to show significant similarity at the mean confidence interval ellipse (95%). Each color circle represents a different month during the analysis period.
Water 17 02936 g008
Figure 9. Dynamic change in standard correlation matrix variables during the summer months.
Water 17 02936 g009
Table 1. Water quality parameters, abbreviations, and units used during the study.
ParameterAbbreviateUnit
AmmoniumNH4+mg/L
Conductivity
Dissolved Oxygen
Nitrate
pH
Temperature
Turbidity
Cond.
DO
NO3
pH
Temp.
Turb.
µS/cm
mg/L
mg/L
-
°C
FNU
Table 2. Primary settling pond S1 sensor average water quality parameters.
Month-YearTotal Data PointsCond. µS/cmDO
mg/L
NH4+
mg/L
NO3
mg/L
pHTemp. °CTurb.
FNU
March-2024335 *602.54.948.1642.6 ¥7.819.737.5
April-20242779 *634.43.549.2208.7 ¥7.722.054.9
May-2024744615.22.950.5268.5 ¥7.625.4117.6
June-2024599647.53.438.9427.0 ¥7.627.775.8
July-2024744638.03.620.3396.8 ¥7.728.428.7
August-2024743654.43.0138.7303.8 ¥7.728.438.0
September-2024720623.63.0222.3380.6 ¥7.626.659.9
October-2024743645.83.221.2669.9 ¥7.723.161.1
November-2024719582.13.220.21744.2 7.622.769.1
December-2024744532.64.719.7265.1 ¥7.717.774.9
January-2025744489.75.415.0182.57.715.280.9
February-2025669569.04.669.546.77.717.990.0
March-2025743619.54.094.651.27.719.796.6
April-2025720698.23.095.091.77.622.9189.1
May-2025744686.52.51245.8 92.07.624.9138.1
*—Data acquisition interval was set for collection every 15 min prior to being set to 60 min for the remaining study period. ¥—The average was above factory standard range, but qualifiable from benchtop lab calibration. —The average of the dataset during this monthly period was outside of the calibration range, thus excluded from the analysis.
Table 3. Secondary treatment pond S2 sensor average water quality parameters.
Month-YearTotal Data PointsCond. µS/cmDO
mg/L
NH4+
mg/L
NO3
mg/L
pHTemp.
°C
Turb.
FNU
March-2024330 *605.90.951.97.27.219.915.2
April-20242778 *697.73.1116.4151.07.222.8110.5
May-2024744650.21.797.695.27.227.040.3
June-2024719628.02.92.436.07.429.7284.5
July-2024744669.20.112.046.16.930.0595.0
August-2024743703.00.112.6206.3 ¥6.930.4348.4
September-2024719848.50.039.4544.6 ¥6.727.246.5
October-2024747567.50.0117.32039.3 6.923.262.8
November-2024720596.80.06.72259.7 6.822.466.5
December-2024743686.60.09.3155.26.916.015.8
January-2025744649.70.010.3450.7 ¥6.713.313.9
February-2025226749.20.610.7625.5 ¥6.719.110.8
*—Data acquisition interval was set for collection every 15 min prior to being set to 60 min for the remaining study period. ¥—The average was above factory standard range, but qualifiable from benchtop lab calibration. —The average of the dataset during this monthly period was outside of the calibration range, thus excluded from the analysis.
Disclaimer/Publisher’s Note: The statements, opinions and data contained in all publications are solely those of the individual author(s) and contributor(s) and not of MDPI and/or the editor(s). MDPI and/or the editor(s) disclaim responsibility for any injury to people or property resulting from any ideas, methods, instructions or products referred to in the content.