Article

BIM Lightweight Technology in Water Conservancy Engineering Operation and Maintenance: Improvement of the QEM Algorithm and Construction of the Evaluation System

1
School of Civil Engineering, Architecture and Environment, Hubei University of Technology, Wuhan 430068, China
2
Department of Civil Engineering, Technology College, Hubei University of Technology Engineering, Wuhan 430068, China
3
Wuhan Municipal Engineering Design and Research Institute Co., Ltd., Wuhan 430023, China
4
Construction and Management Bureau of North Hubei Water Transfer Project, Wuhan 430061, China
*
Author to whom correspondence should be addressed.
Water 2025, 17(20), 2929; https://doi.org/10.3390/w17202929
Submission received: 7 September 2025 / Revised: 17 September 2025 / Accepted: 1 October 2025 / Published: 10 October 2025
(This article belongs to the Topic Hydraulic Engineering and Modelling)

Abstract

In recent years, with continuous technological advances, BIM technology has gradually expanded from the traditional construction industry into the field of hydraulic engineering. Since BIM models, which span the entire project lifecycle, contain substantial amounts of data and the operation and maintenance phase accounts for the majority of this lifecycle, higher computational demands are imposed. Consequently, the lightweighting of BIM models has become imperative. In this study, an improved Quadric Error Metric (QEM) algorithm was applied to simplify the geometric data of the constructed BIM model. The research investigates whether the lightweight model can reduce the computational requirements during its application in the operation and management of hydraulic engineering, thereby enhancing its general applicability. Furthermore, a fuzzy comprehensive evaluation model was established to assess the effectiveness of the lightweighting process. The experimental results indicate that the optimized model occupies significantly less memory space. Additionally, model loading time and rendering CPU usage were substantially improved. The lightweight effect was evaluated as excellent based on the fuzzy comprehensive evaluation.

1. Introduction

1.1. Research Background and Problem Statement

Water conservancy engineering holds significant and multifaceted importance in national development, impacting not only economic growth, social stability, and the daily lives of people but also extending to ecological environmental protection, national security, and cultural heritage. It serves as a critical pillar for economic development, social stability, ecological conservation, and cultural preservation. Furthermore, it satisfies the practical needs of the populace while laying a solid foundation for the country’s sustainable development. Amid the backdrop of global climate change and resource scarcity, the significance of water conservancy engineering has become increasingly evident. As early as 1997, the Flood Prevention Law emphasized the critical role of water conservancy engineering in flood control. In 2019, a series of water resource management reform measures were introduced in Innovative Practices in Water Resource Management in China, further highlighting the central position of water conservancy engineering in water resource allocation, scheduling, and conservation. Moreover, the 14th Five-Year Plan for Modern Service Industry Development identified water conservancy engineering as a key support for modern service industry development, underscoring its roles in agricultural modernization, ecological protection, and service industry growth. Additionally, policies encourage the integration of water conservancy engineering with digital and intelligent technologies to enhance water resource management and utilization efficiency.
The operation and maintenance (O&M) phase of water conservancy engineering accounts for the majority of its lifecycle, reportedly occupying 70% to 80% of the total duration [1]. Ensuring the stable and efficient operation of water conservancy engineering is thus paramount. In 2003, the Provisions on Safety Production Management of Water Conservancy Engineering Construction highlighted the importance of safety management through regular inspections and maintenance to identify and eliminate safety risks, ensuring the safe operation of engineering projects and effectively preventing accidents. By 2018, the Opinions on Strengthening Operation and Maintenance Management of Water Conservancy Engineering further emphasized the need to enhance routine maintenance and periodic repairs to ensure safe operation, explicitly stating that water conservancy engineering, as a critical component of national infrastructure, requires robust O&M management to safeguard its long-term benefits and safety. In 2021, the 14th Five-Year Plan for Water Conservancy Engineering Development reaffirmed that water conservancy engineering O&M management is a vital barrier for ensuring national water resource security and agricultural development, stressing the necessity of integrating it into the country’s overarching development planning.
While digital intelligent technologies are experiencing rapid development and application in the water conservancy industry, they are also confronted with a number of challenges. Water conservancy engineering is characterized by complex structures, involvement of multiple disciplines, numerous types of scenario objects, and intricate spatial relationships. Digital models of water conservancy engineering typically exhibit multiple types, high precision, and large data volumes, with the application of digital twin technology further increasing the size and complexity of BIM models generated by modeling software [2]. Throughout the lifecycle of water conservancy engineering, the O&M phase not only spans the longest duration but also accounts for 82.5% of total costs, generating vast amounts of operational data. Moreover, the requirement for real-time data updates during practical application renders operational speed a critical factor [3]. Therefore, lightweight processing of BIM models not only significantly enhances operational efficiency but also effectively reduces maintenance costs.

1.2. Literature Review

1.2.1. Application and Research of BIM

Building Information Modeling (BIM) represents an innovative concept and technology within the construction industry. Its foundational ideas can be traced back to the 1970s, initially proposed by Chuck Eastman, a professor at Georgia Institute of Technology in the United States. According to the definition provided by the American National BIM Standard, BIM is described as “a digital representation of the physical and functional characteristics of a facility”. As a digital carrier for engineering projects, BIM not only incorporates geometric information, attribute data, and feature details but also exhibits notable capabilities such as three-dimensional visualization, information integration, lifecycle management, simulation and analysis, and multi-disciplinary collaboration. BIM, as a powerful digital technology, integrates information across the entire project lifecycle, spanning design, construction, and operations, and supports multi-disciplinary collaboration and optimized management, facilitating information sharing across all phases. Due to its visualization, coordination, and optimization capabilities, BIM has been widely adopted in the architectural domain [4]. With advancements in technology, BIM has gradually transcended the boundaries of the traditional construction industry, extending into the field of water conservancy engineering and emerging as a key driver for the digital transformation of the water conservancy sector.

1.2.2. Application and Research of BIM in Hydrological Engineering Operations Management

Research into BIM technology in the domain of operation and maintenance (O&M) can be traced back to 2005, during which initial studies primarily focused on exploring the potential application value of BIM technology in facility operations. As technology advanced, the period around 2010 marked the beginning of a rapid development phase, as governments in countries such as the United States and the United Kingdom started mandating the use of BIM technology in public projects. It was during this time that M. Yalcinkaya [5] systematically summarized the methodologies and development trends in BIM research, while L. V. Berlop [6] conducted in-depth investigations into data-sharing mechanisms and server creation within BIM technology. These efforts laid the theoretical groundwork for extending BIM applications from the design and construction phases to the O&M phase. By this point, BIM technology had begun to demonstrate significant potential in the field of O&M management, particularly in its application to water conservancy engineering, thereby attracting widespread academic attention. Notably, it was not until 2017, with the publication of China’s first BIM group standard for the water conservancy sector, that the application and research of BIM technology in water conservancy engineering O&M entered a more mature phase. During this stage, scholars achieved notable advancements in both technological application and theoretical innovation. For instance, Zhao Nan [7] developed an integrated system management platform that enabled efficient lifecycle management of water conservancy projects. Similarly, Fu Xiyi [8] utilized artificial intelligence, the Internet of Things, and bigdata analytics to develop a smart water affairs AIOT digital platform, Chen Xuetting [9] developed a 3D visualization operation and maintenance management platform based on BIM, providing technical support for intelligent operation and maintenance, Su Qiang [10] implemented a management platform for total model assembly, collision checking, and optimization design functions based on BIM+GIS collaborative design, Liu Haiyue [11] achieved knowledge-driven intelligent operation and maintenance by constructing a hierarchical pump station group operation and maintenance knowledge graph. These research outcomes not only provided a robust theoretical foundation for water conservancy engineering O&M but also offered reliable technical support for practical applications.

1.2.3. Research on BIM Model Lightweight Processing

In recent years, driven by the rapid advancement of emerging technologies such as digital twins, the Internet of Things (IoT), big data, Geographic Information Systems (GIS), Virtual Reality (VR), and Augmented Reality (AR), the lightweight processing of BIM models has emerged as a critical research topic to achieve the efficient integration and application of BIM technology with these cutting-edge technologies. Domestic and international scholars have conducted in-depth research on BIM model lightweight processing, yielding significant outcomes. For instance, Zhao Fei [12] conducted lightweight BIM model research in the domain of ancient architecture, focusing on WebGL technology, and proposed a lightweight solution based on JSON format. Similarly, Du Zheng [13] explored BIM lightweight applications in the water conservancy engineering field, utilizing IFC standards and WebGL technology, and not only developed an extension method for IFC standards but also achieved IFC file parsing and lightweight processing through the XBIM toolset. Wang Di [14], on the other hand, dedicated efforts to BIM lightweight research in the field of rail transit, proposing a geometric data lightweight method based on the Delaunay triangulation algorithm. The aforementioned studies have provided multiple effective solutions for addressing BIM model lightweight issues, significantly improving operational efficiency in practical applications. However, the focus of these studies has primarily been on Web-based rendering optimization and lightweight file format conversion, while in-depth algorithmic research on triangular mesh simplification has received comparatively less attention. As research continues to advance and applications become more widespread, there is a pressing need to explore more innovative methods and technical pathways for BIM model lightweighting.

1.2.4. Research on the Establishment of an Evaluation System

In China, research on the construction of evaluation systems has made significant progress across multiple disciplines. For instance, in the field of medicine, Wei Anhua et al. [15] conducted a clinical comprehensive evaluation study on the use of specific plasminogen activators for thrombolytic therapy in acute myocardial infarction. In economics, Zhao Junfeng et al. [16] explored the generation logic, theoretical connotations, and evaluation system of new productive forces. Within the electric power industry, Liu Jiajun et al. [17] proposed a comprehensive evaluation method for quickly determining short-circuit current limiting switch locations based on cloud model-based dynamic adjustment of topology constraints. In logistics, Yu Jie et al. [18] developed a quality evaluation system for practical teaching in higher vocational college logistics management programs, grounded in the CIPP evaluation model. Despite these advancements, the current evaluation systems for BIM model lightweight processing still face numerous challenges in terms of scientific validity, technical feasibility, industry standardization, and practical applicability. Addressing these issues requires collaborative efforts across theoretical research, technology development, industry regulation, and practical application to ensure that lightweight technologies better meet the needs of BIM projects.
Based on an analysis of the literature regarding the application of BIM technology in the operation and maintenance of hydraulic engineering, several research gaps have been identified: (1) For established BIM-based operation and maintenance platforms, lightweight technologies are required to address issues such as large model data volume so as to ensure operational efficiency. (2) The majority of current research on BIM model lightweighting focuses primarily on Web-based rendering optimization and lightweight file format conversion, with relatively limited investigation into in-depth lightweight algorithms for triangular mesh models. (3) There is a lack of systematic evaluation frameworks for assessing the effectiveness of already implemented lightweight techniques.
To address this, the present study employs the following methods: First, BIM models are created using Revit (2024) software, and the default exported RVT files are converted to obj format. Subsequently, an improved Quality Evaluation Metric (QEM) algorithm is applied to perform mesh lightweight processing on the models, achieving lightweight through triangular mesh optimization. Second, for assessing the lightweight effects, this paper establishes a comprehensive evaluation system comprising four dimensions: model quality evaluation, user experience evaluation, computer performance metrics, and long-term optimization and stability. This framework provides a comprehensive assessment standard for lightweight technologies. Finally, to scientifically and intuitively evaluate the lightweight processing effects, this study employs both the Analytic Hierarchy Process (AHP) and fuzzy comprehensive evaluation models to construct a complete evaluation system, ensuring the objectivity and reliability of the evaluation results.
By accomplishing the aforementioned research objectives, the findings of this study have made advancements, respectively, in terms of methodological innovation and practical application. On one hand, an improved algorithmic approach has been proposed for the lightweight processing of BIM models within the domain of BIM model lightweighting, providing a novel technical perspective for such lightweight processing tasks. On the other hand, a scientific evaluation framework has been developed to achieve optimized outcomes of model lightweight processing. This has not only facilitated the practical application of BIM technology in the field of hydraulic engineering operation and maintenance management but also further validated the effectiveness of the research methods and technical routes adopted in this study, thereby fully demonstrating the innovation and application value of the research.

1.3. Research Methods

The technical roadmap of this study is illustrated in Figure 1. The paper is structured into three main sections: problem identification, analysis, and resolution. Firstly, the topic concerning the application of lightweight BIM models in the operation and maintenance management of hydraulic engineering was introduced based on a review of the research background and relevant literature. Subsequently, an improved Quadric Edge Simplification (QEM) algorithm was employed to simplify the BIM model, and a comparative analysis of data before and after the simplification process was conducted. Finally, an evaluation system was established using the Analytic Hierarchy Process-Fuzzy Comprehensive Evaluation (AHP-FCE) model to assess the effectiveness of the lightweighting process.

2. The Application of BIM Technology in Operations and Maintenance (O&M)

2.1. The Advantages of BIM Technology in Operations and Maintenance (O&M)

With the deep application of BIM technology in the water conservancy engineering industry, conducting research on water conservancy engineering operation and maintenance (O&M) holds significant practical importance. Traditional O&M methods exhibit notable limitations: data recording relies heavily on manual operations, data storage utilizes spreadsheet formats, and there is a lack of unified O&M information management standards and comprehensive O&M management platforms. These inefficiencies result in low efficiency in the acquisition, integration, processing, and sharing of O&M information [19,20]. Compared to the design, construction, and demolition phases, the O&M phase often requires continuous management for decades. Consequently, the application of BIM technology during the O&M phase can yield more significant benefits [21]. The advantages of BIM-based operational management are primarily evident in two key aspects [22]:
(1)
Information Integration and Sharing
By integrating project information, structural models, and component parameters from various stages—such as planning, design, construction, and O&M—into a unified BIM database, comprehensive data support can be provided for traditional O&M systems. This integration enables the sharing of resources and coordination of workflows, effectively improving management efficiency and addressing the issue of isolated information systems.
(2)
Visualized Management
When equipment requires maintenance, repair personnel can quickly locate the spatial position of the equipment and simultaneously access relevant maintenance information. Unlike traditional methods that rely on paper-based blueprints to determine the location of electrical systems and metal structures, BIM 3D models can precisely identify the specific locations of mechanical equipment and metal components within buildings, thereby significantly enhancing the efficiency of equipment management. Furthermore, by leveraging the information integration capabilities of BIM technology, diverse O&M-related information can be unified within the BIM model. This facilitates rapid information retrieval and statistical analysis while enabling intuitive representation and visualization of project facilities’ status, spatial distribution, emergency management, and concealed engineering information [23].

2.2. Large AI Models for Predicting the Running Status of Water Conservancy Equipment

In the operational and maintenance (O&M) phase of water conservancy projects, a vast amount of real-time information related to equipment operating status is generated. This real-time information can be efficiently transmitted through Building Information Modeling (BIM) technology and input into large AI models, thereby achieving precise predictions of the operating status of water conservancy equipment. The core objective of predicting the operating status of water conservancy equipment lies in conducting an in-depth analysis of the equipment’s future operational conditions. Currently, the prediction of water conservancy equipment operating status primarily employs time series analysis and other statistical methods, as well as machine learning algorithms such as Convolutional Neural Networks (CNNs). However, these methods exhibit limitations in integrating results from the identification of multiple types of events, making it challenging to comprehensively characterize the global operational status of the equipment. Furthermore, in predicting future trends and describing dynamic changes, certain inadequacies remain. In light of these limitations, it is possible to fully leverage the unique advantages of AI technology in addressing highly non-linear and interdependent problems by constructing time series prediction models or association prediction models [24]. This approach enables accurate predictions of the operating status of water conservancy equipment. Such advancements not only provide new technical pathways for achieving intelligent and efficient O&M management of water conservancy projects but also open up innovative research directions for the intelligent O&M and fault prediction of equipment.

2.3. Challenges of BIM Technology in Addressing Lightweight Issues Within Operations and Maintenance Management

Water conservancy projects are characterized by large-scale system engineering, with their BIM models exhibiting high complexity and level of detail. Compared to the design and construction phases, the operations and maintenance (O&M) phase requires not only the processing of real-time operational data but also the recording and analysis of vast amounts of operational information. For instance, Revit model files often reach sizes of 20 GB or even larger, as they store the comprehensive data necessary throughout the entire lifecycle of water conservancy projects. This imposes extremely high demands on system memory.
Currently, the application of BIM technology in the domain of water conservancy project O&M management has seen significant progress, as it is undergoing a rapid transformation from a purely digitized phase to one that is increasingly intelligent and smart. In this process, BIM technology is no longer limited to the simple visualization of 3D models; instead, it is achieving deep integration with cutting-edge technologies such as GIS (Geographic Information Systems), VR (Virtual Reality), and AI (Artificial Intelligence). This multi-technology fusion model not only significantly enhances the efficiency of O&M management but also provides more comprehensive technical support for the holistic management of water conservancy projects throughout their entire lifecycle.
To achieve real-time, dynamic, and visualized management across all scenarios, elements, and processes [25], it is imperative to ensure not only the stable and efficient operation of water conservancy equipment during the O&M phase but also the real-time updates of data. However, constrained by the practical limitations of end-user device performance, such a system must be based on a concise and efficient digital platform.
Based on the aforementioned demands and challenges, the lightweight processing of BIM models has become an indispensable approach in current O&M management practices. This method helps minimize system runtime loads while maintaining model accuracy, thereby ensuring smooth operation and rapid response in practical applications.

3. Lightweight Analysis

The lightweighting of BIM models is not merely a process of compressing the model but rather a comprehensive data traffic optimization and management strategy that spans the entire lifecycle from design to operations. This approach employs multi-dimensional technical strategies to perform an in-depth optimization of the original BIM model. By doing so, it retains the essential information while significantly reducing the file size and improving runtime efficiency. Specifically, while ensuring the integrity of the model and the accuracy of the data, redundant information is streamlined, and the data structure is optimized. This results in a substantial improvement in data processing speed and system response efficiency, which holds great significance for the efficient operations and maintenance management of large-scale water conservancy projects.

3.1. Lightweight Fineness Level Classification

L1: Suitable for large-scale basin planning and macroscopic analysis, primarily used to display the overall layout of water conservancy projects, including basic information such as topography and terrain.
L2: Applicable to hydrological analysis in key areas, such as important river segments, lakes, and flood detention zones. It is utilized for fine-grained management tasks, including flood control scheduling and water resource allocation.
L3: Employed for the detailed management of water conservancy projects, focusing on critical hydraulic structures such as hinge projects and major hydraulic facilities. This level addresses operational management, maintenance, and repair requirements, as well as detailed identification needs for construction, installation, and procurement. The model is partitioned into zones, sections, and layers to meet specific design requirements.
L4: Focuses on critical equipment within water conservancy projects, such as hydraulic turbines and gates, to support detailed management, fault diagnosis, and operational optimization of facilities and infrastructure [26].

3.2. Lightweight Process

3.2.1. The Introduction of Traditional QEM Algorithm

Edge Collapse Algorithm [27] is a widely used technique for simplifying three-dimensional models (Mesh Simplification). Its primary purpose is to reduce the number of polygons in a 3D model while preserving the model’s geometric features and visual effects as much as possible. This algorithm is extensively applied in the fields of computer graphics, game development, virtual reality, and Building Information Modeling (BIM), particularly in scenarios where model performance needs to be optimized or data volume reduced.
Quadric Error Metrics represent a method introduced by Garland and Heckbert [28] in 1997. Their approach employs quadric error as a cost metric for edge collapse algorithms, characterized by its fast computation speed and high simplification quality. Specifically, when selecting an appropriate edge for iterative collapse, the method defines a variable Δ to represent the cost associated with edge collapse. This is detailed as follows: For each vertex v in the mesh, a 4 × 4 symmetric error matrix Q is predefined. The error associated with a vertex V = V x V y V z 1 T is expressed in quadratic form as Δ V = V T Q V . For a collapsing edge ( V 1 , V 2 ) , the resulting vertex V b a r is associated with an error matrix Q b a r = Q 1 + Q 2 . Two strategies are proposed for determining the position of V b a r :
1.
A simpler strategy involves selecting the position of V b a r from ( V 1 , V 2 ) or ( V 1 + V 2 ) / 2 that minimizes the collapse cost Δ ( V b a r )
2.
A more advanced strategy involves numerically solving for the position of V b a r that minimizes Δ ( V b a r ) . Since Δ is expressed in quadratic form, its minimum is found by setting the first derivative to zero, which reduces to solving as follows:
q 11 q 12 q 13 q 14 q 21 q 22 q 23 q 24 q 13 q 23 q 33 q 34 0 0 0 1 v = 0 0 0 1
where Q i j represents the corresponding elements of the matrix Q b a r . If the coefficient matrix is invertible, the position of the new vertex V b a r can be determined by solving the aforementioned equation. If the coefficient matrix is non-invertible, the new vertex V b a r is obtained using the first, simpler strategy.
The remaining issue pertains to the computation of the initial error matrix Q for each vertex. In the original mesh model, each vertex can be considered as the intersection of the planes containing adjacent triangles. Specifically, the vertex position is defined as the intersection point of these planes, and the error associated with the vertex is defined as the sum of the squared distances from the vertex to these planes:
Δ V = Δ V x V y V z 1 T = p planes v P T V 2 = p planes v V T P P T V = p planes v V T P P T V = V T p planes v K p V
where P = a b c d T presents the coefficients of the plane equation a x + b y + c z + d = 0 (with the constraint a 2 + b 2 + c 2 = 1 ), and K p denotes the quadratic fundamental error matrix. The construction of K p is defined as follows:
K p = P P T = a 2 a b a c a d a b b 2 b c b d a c b c c 2 c d a d b d c d d 2
Consequently, the initial error for vertex V in the original mesh is zero, i.e., Δ ( V ) = 0 . After an edge collapse, the error for the new vertex V b a r is computed as Δ ( V b a r ) = V b a r T Q b a r V b a r . The algorithm proceeds by iteratively collapsing the edge that results in the smallest error for the new vertex V b a r , continuing this process until the desired simplification level is achieved.

3.2.2. Improvement on the Quadratic Error Metric (QEM) Algorithm

Regarding the traditional QEM algorithm, the basic algorithm neglects certain critical constraints during the initial stages of its simplification process. To address this limitation, this study proposes incorporating boundary curve constraints and modifications due to normal vector offsets into the algorithmic framework to provide a more comprehensive representation of the influencing factors present in real-world scenarios.
(1)
Boundary curve constraints
When the set of triangles associated with an edge contains no more than one triangle, that edge is determined to be a boundary edge. In such cases, a maximum value is assigned to it in the error metric. Specifically, since the vertices of the boundary may belong to multiple edge sets, these edges could potentially alter the boundary morphology when undergoing contraction. Therefore, in the error metric, maximum values are also assigned to these edges to ensure the accuracy of boundary identification.
(2)
Taking into account the modifications resulting from normal vector offsets
During the contraction process of an edge, the optimally obtained vertex will form a new triangle together with the surrounding vertices. Through comparison with the original planar triangulation, if a flipping phenomenon occurs, the contraction operation on this edge should be terminated, and a maximum value should be assigned to it in the error metric calculation. This approach ensures the stability of the geometric structure while avoiding potential issues arising from the flipping phenomenon.
Assume a triangle with vertices A , B and C . The lengths of edges A B and A C are computed:
A B = B p o s A P O S
A C = C p o s A p o s
The plane normal vector is obtained by computing the cross product of vectors A B and A C .
N = A B A C
The cross product is computed according to the following formula:
N = N x N y N z = A B y A C z A B z A C y A B x A C x A B x A C z A B x A C y A B y A C x
Through the aforementioned procedure, the normal vectors N 1 and N 2 , corresponding to the original and new triangles, respectively, are computed. To eliminate the influence of magnitude, both N 1 and N 2 are normalized, thereby preserving only their directional information. Subsequently, a weighted average of all the face normal vectors in the triangular patch is performed, allowing the derivation of the vertex normal vector. The computation process is mathematically formalized as follows:
N v i = j = 1 m N ¯ i S i j = 1 m N ¯ i S i
N i = N | N |
In this formulation, m denotes the number of triangles associated with vertex V i , and S i represents the area of the triangle. The magnitude of the vector, denoted as | N | , is computed according to the following formula:
| N | = N x 2 + N y 2 + N z 2
The angle θ between the two planes can be computed using the dot product of their normal vectors, as shown in the following formula:
θ = arccos θ ( N 1 · N 2 | N 1 | | N 2 | )
Based on this method, it is possible to predict whether contraction of certain edges will result in a flipping phenomenon. Specifically, if the maximum displacement of the vertex normal, denoted as N max , is less than 1 and the edge is unconstrained, the optimal point error metric for the edge is calculated. Otherwise, to ensure the stability of the algorithm, the error metric for the edge is set to its maximum value.
The code was developed using PyCharm 2024, with numpy employed as the primary computational library and the piny function imported from scipy.linalg. Representative code segments are presented in Figure 2.

4. Instance Analysis

4.1. Lightweight Processing

Hydraulic engineering involves complex three-dimensional geometric models, among which pumps serve as critical equipment. They play an essential role in various fields such as water resource management, flood control and discharge, and water supply systems, making them indispensable in modern hydraulic engineering. Given their practical significance and application value, the pump was selected as the research object in this study. Its three-dimensional model was constructed using Autodesk Revit. To achieve model lightweighting, the default RVT format exported by Revit was converted to the OBJ format, and the lightweighted mesh model was thoroughly examined and analyzed. During the format conversion process, to accommodate application scenarios with different levels of detail requirements, three grades of OBJ export options were provided, corresponding to L4–L3, L2, and L1 detail levels, respectively.
The experimental environment utilized in this study consisted of an Intel Core i5-14600KF processor (Intel Corporation, Santa Clara, CA, USA) and an NVIDIA RTX 4070 Super graphics card (NVIDIA Corporation, Santa Clara, CA, USA). The development activities were carried out in PyCharm, while model lightweighting and visualization were performed using Autodesk 3ds Max (v2022). In consideration of the level of detail required for operational management applications, the OBJ format model classified as “Fine” was selected for lightweighting research, targeting the L4–L3 grade specifications. This selection was made to align with the performance needs of practical operational scenarios.

4.2. Analysis and Evaluation of Lightweight Processing Results

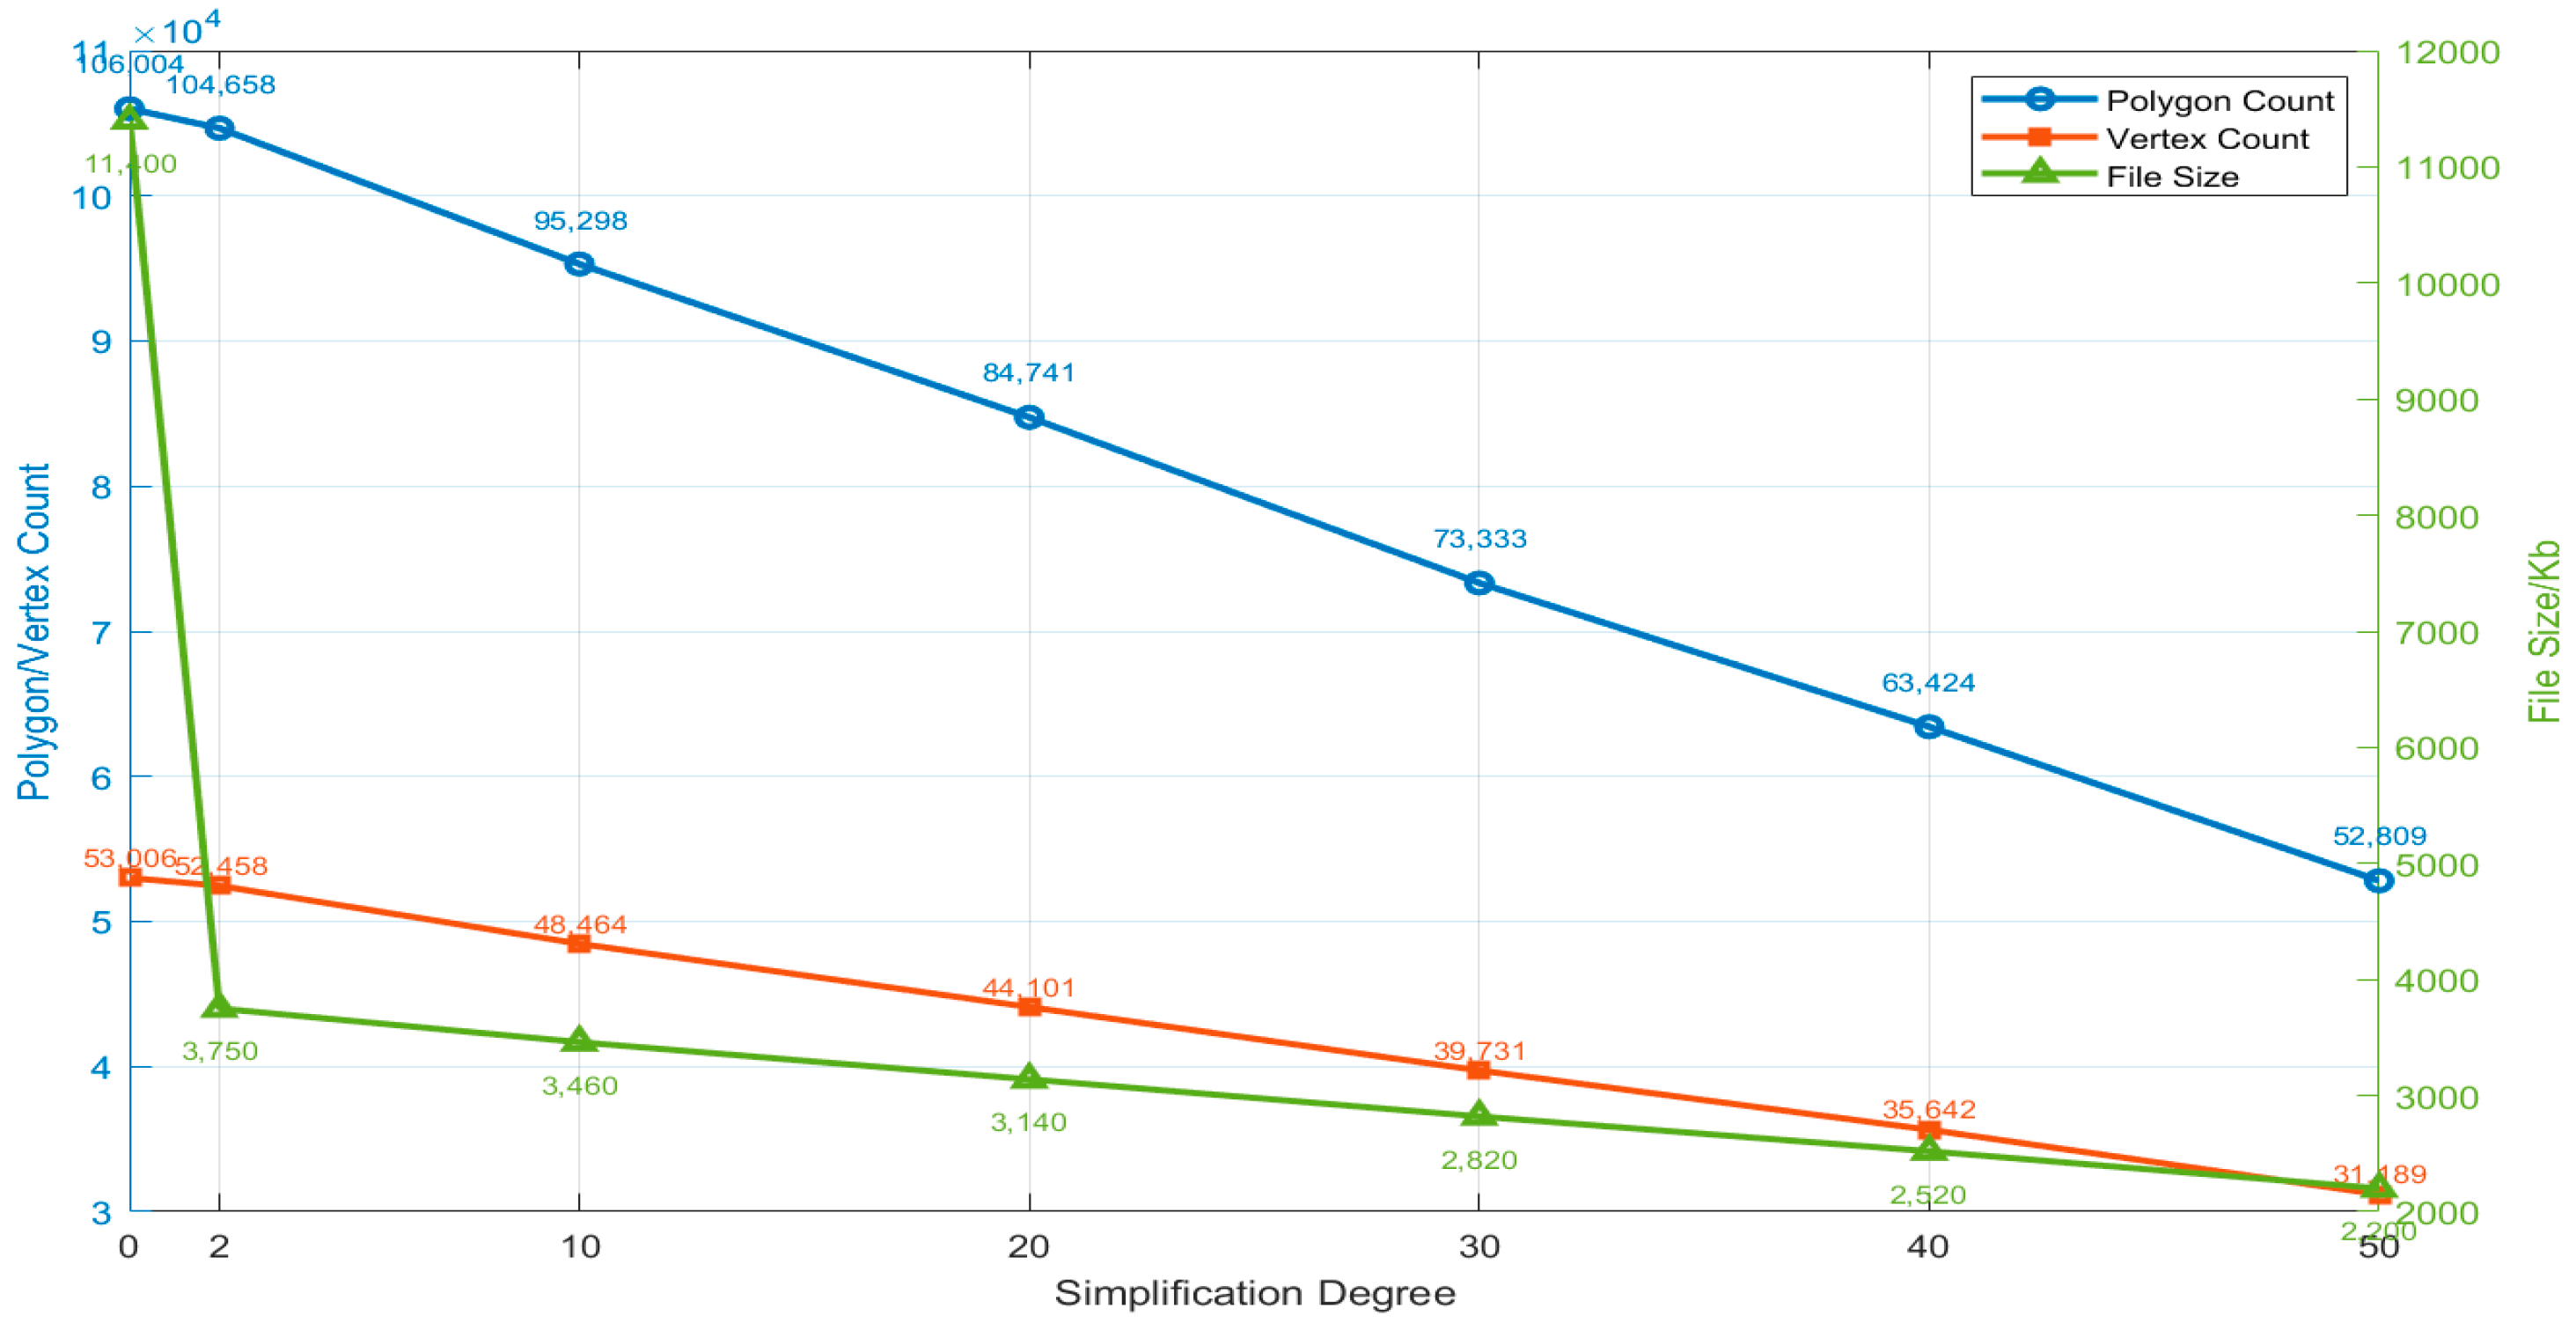
The initial parameters of the water pump three-dimensional model selected in this study, prior to lightweight processing, are as follows: the number of triangular meshes, N mesh is 106,004; the number of vertices, N vert is 53,006; and the model file occupies 11.4 MB of memory space. To systematically evaluate the effects of model simplification, the method of controlling variables was adopted, with the simplification rate serving as the independent variable. Specifically, the changes in key indicators such as the number of faces, vertex count, memory usage, and loading time under different levels of simplification were comprehensively examined.
(1)
Analysis of Simplification Degree on Face Count, Vertex Count, and File Size
As illustrated in Figure 3, the number of faces, vertices, and file size all exhibit a significant positive linear correlation with the model simplification rate. The reduction in memory usage, however, demonstrates a change pattern that is initially substantial and subsequently moderate as the simplification rate increases. This occurs because, during the initial stages of simplification (e.g., at a 2% simplification rate), the triangular mesh data undergoes significant lightweight processing. As the simplification degree progresses further, the proportion of triangular mesh data within the model file gradually decreases, leading to less pronounced reductions in memory usage. Additionally, this study reveals that the visual quality of the model degrades progressively with increasing simplification rates. When the simplification rate reaches 50%,issues such as triangle face connectivity disorders and model shape distortion emerge due to the inherent characteristics of the model’s geometry and the intrinsic limitations of the QEM algorithm, including error accumulation effects and loss of detail. These phenomena will serve as key focus areas for optimization in subsequent research.
(2)
Analysis of Simplification Degree on Model Loading Time
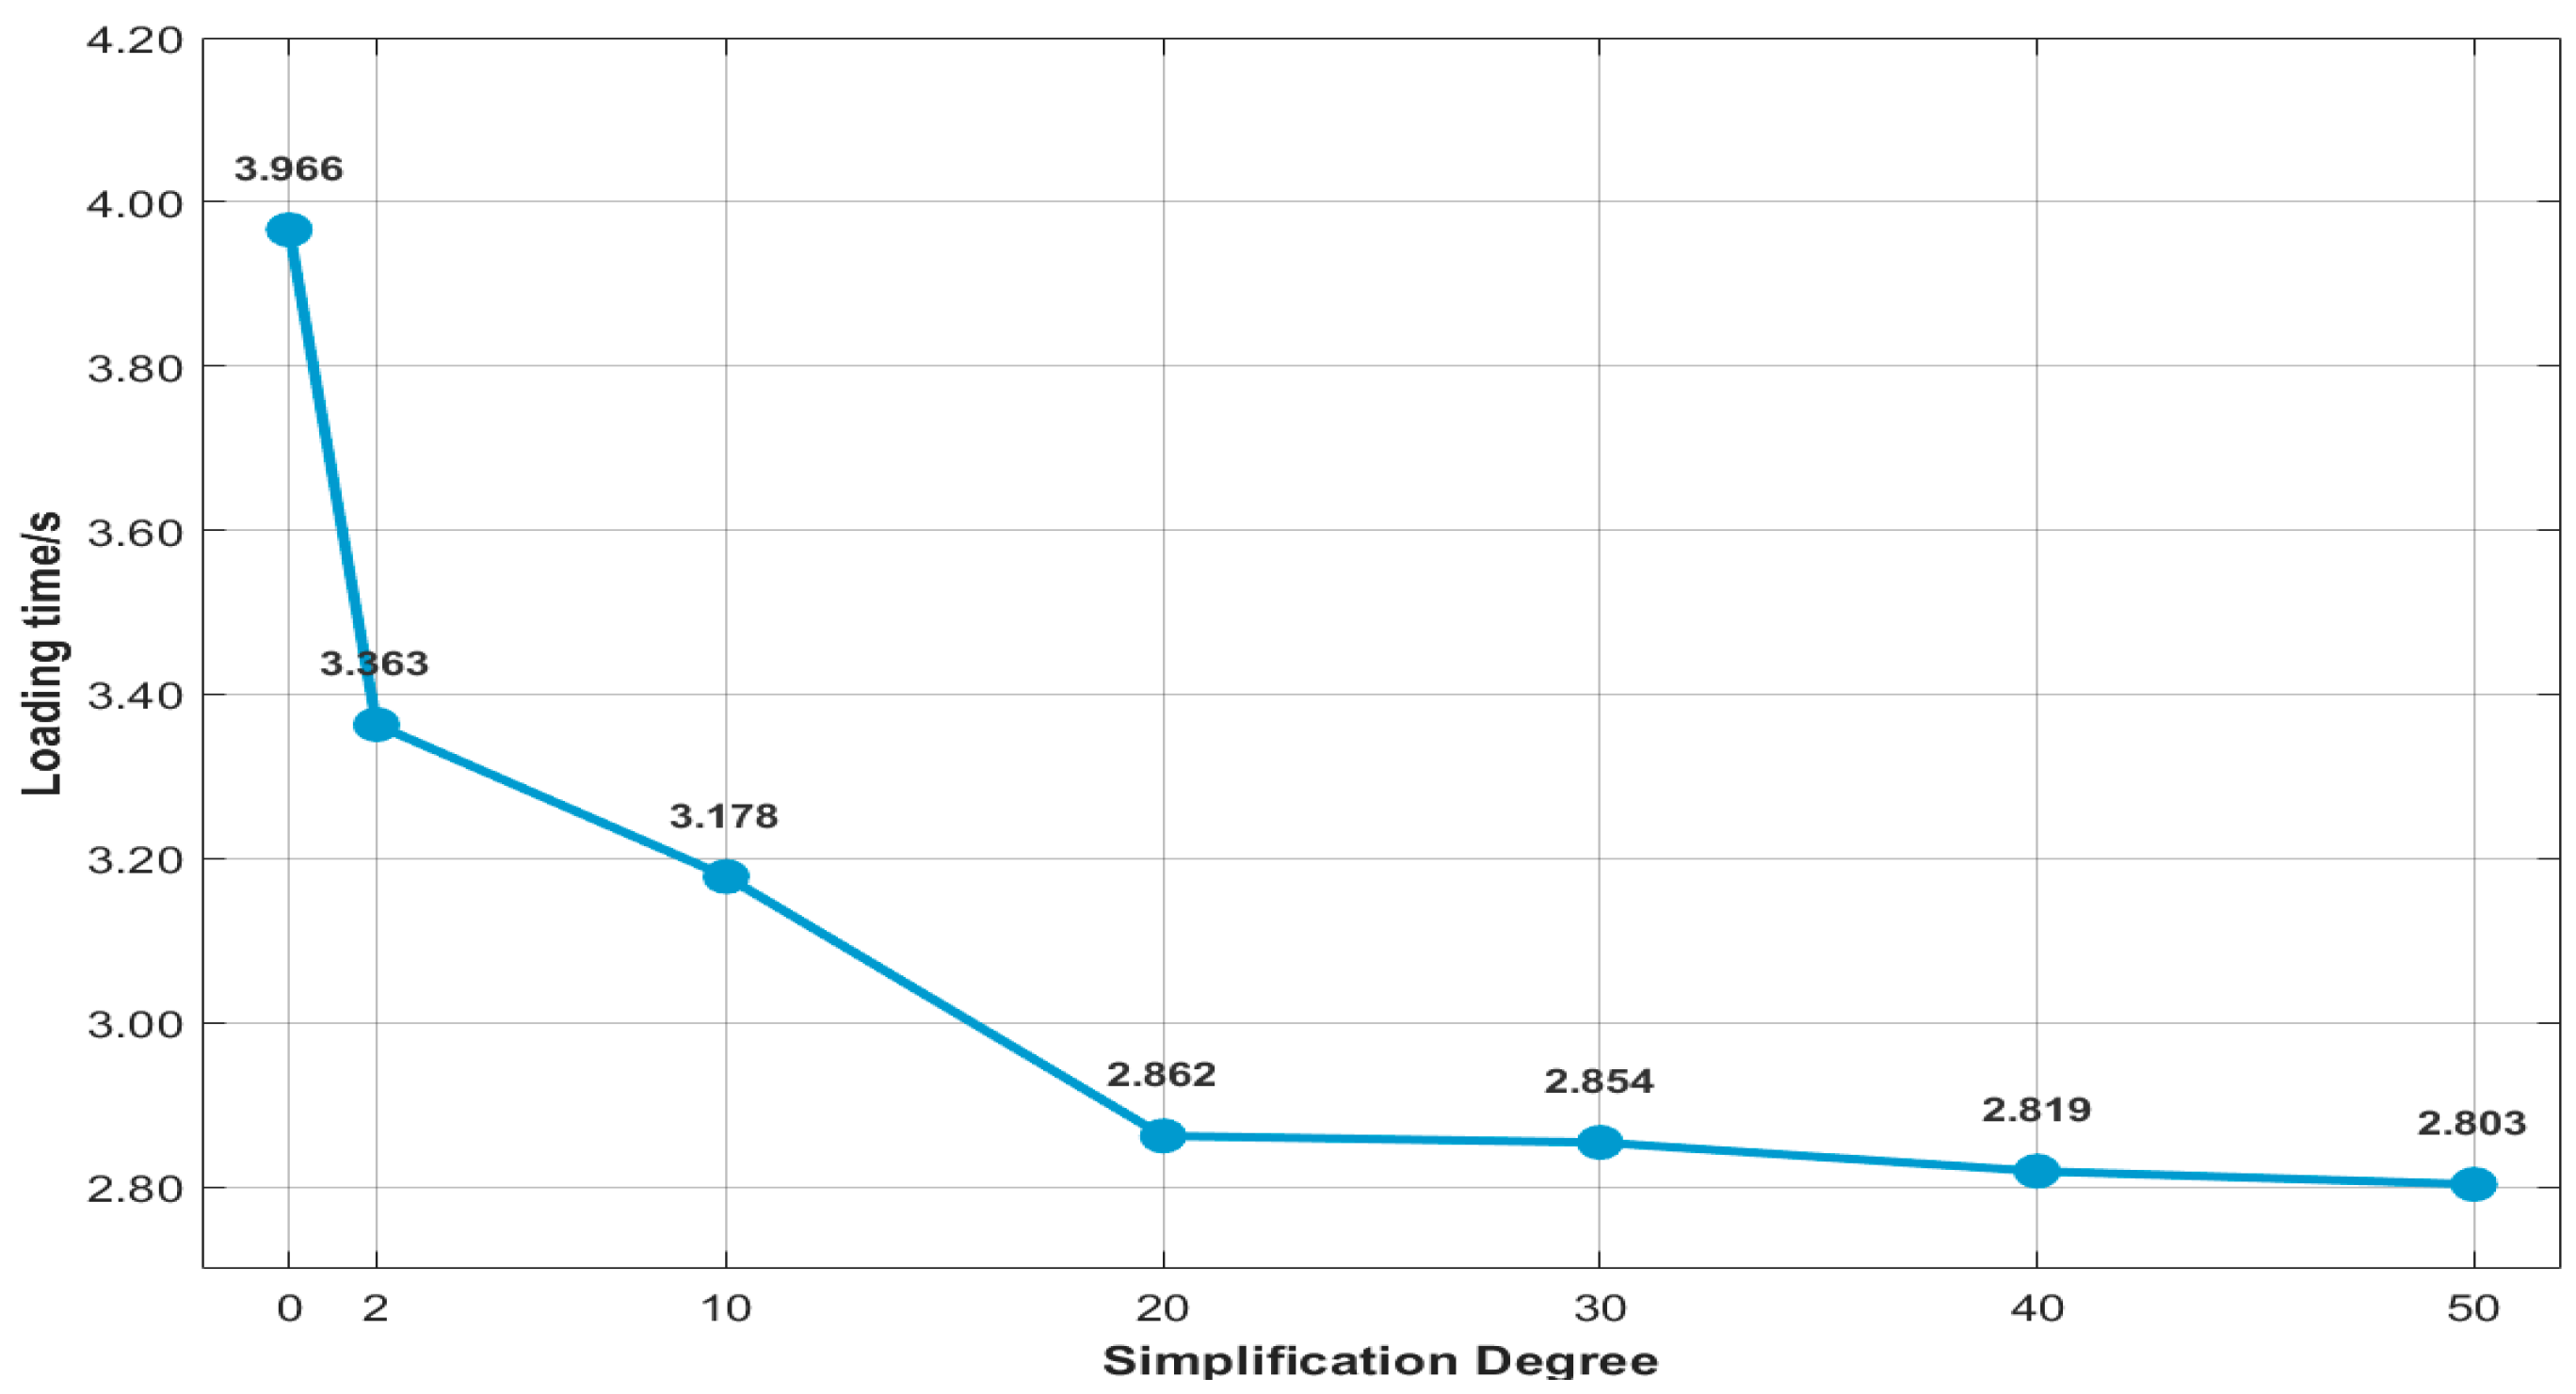
An empirical analysis of lightweight model loading times was conducted using Max-script code within a 3ds Max software environment. To ensure the validity and comparability of the experimental data, a rigorous controlled variable method was employed. Under identical hardware conditions (including CPU, storage devices, and operating system), models with varying levels of simplification were subjected to repeated loading and unloading tests over a continuous period of one week. The average loading time was then determined and used as the basis for the results. As shown in Figure 4, the experimental findings indicate a strong positive correlation between the increase in simplification degree and the reduction in model loading time. Specifically, as the level of simplification is enhanced, the time required to load the model file is significantly diminished. This relationship underscores the efficiency gains associated with model simplification in terms of loading performance. Notably, the controlled experimental conditions and repeated testing ensure the reliability and robustness of the observed results. Additionally, the progressive reduction in loading time as simplification increases highlights the practical benefits of lightweight processing for applications requiring fast model rendering and interaction. However, it is also observed that while higher simplification rates yield faster loading times, they may compromise model fidelity, as previously discussed. This trade-off between performance and visual quality remains a critical consideration in the optimization of lightweight models.
(3)
Analysis of the Effect of Simplification Level on CPU Usage
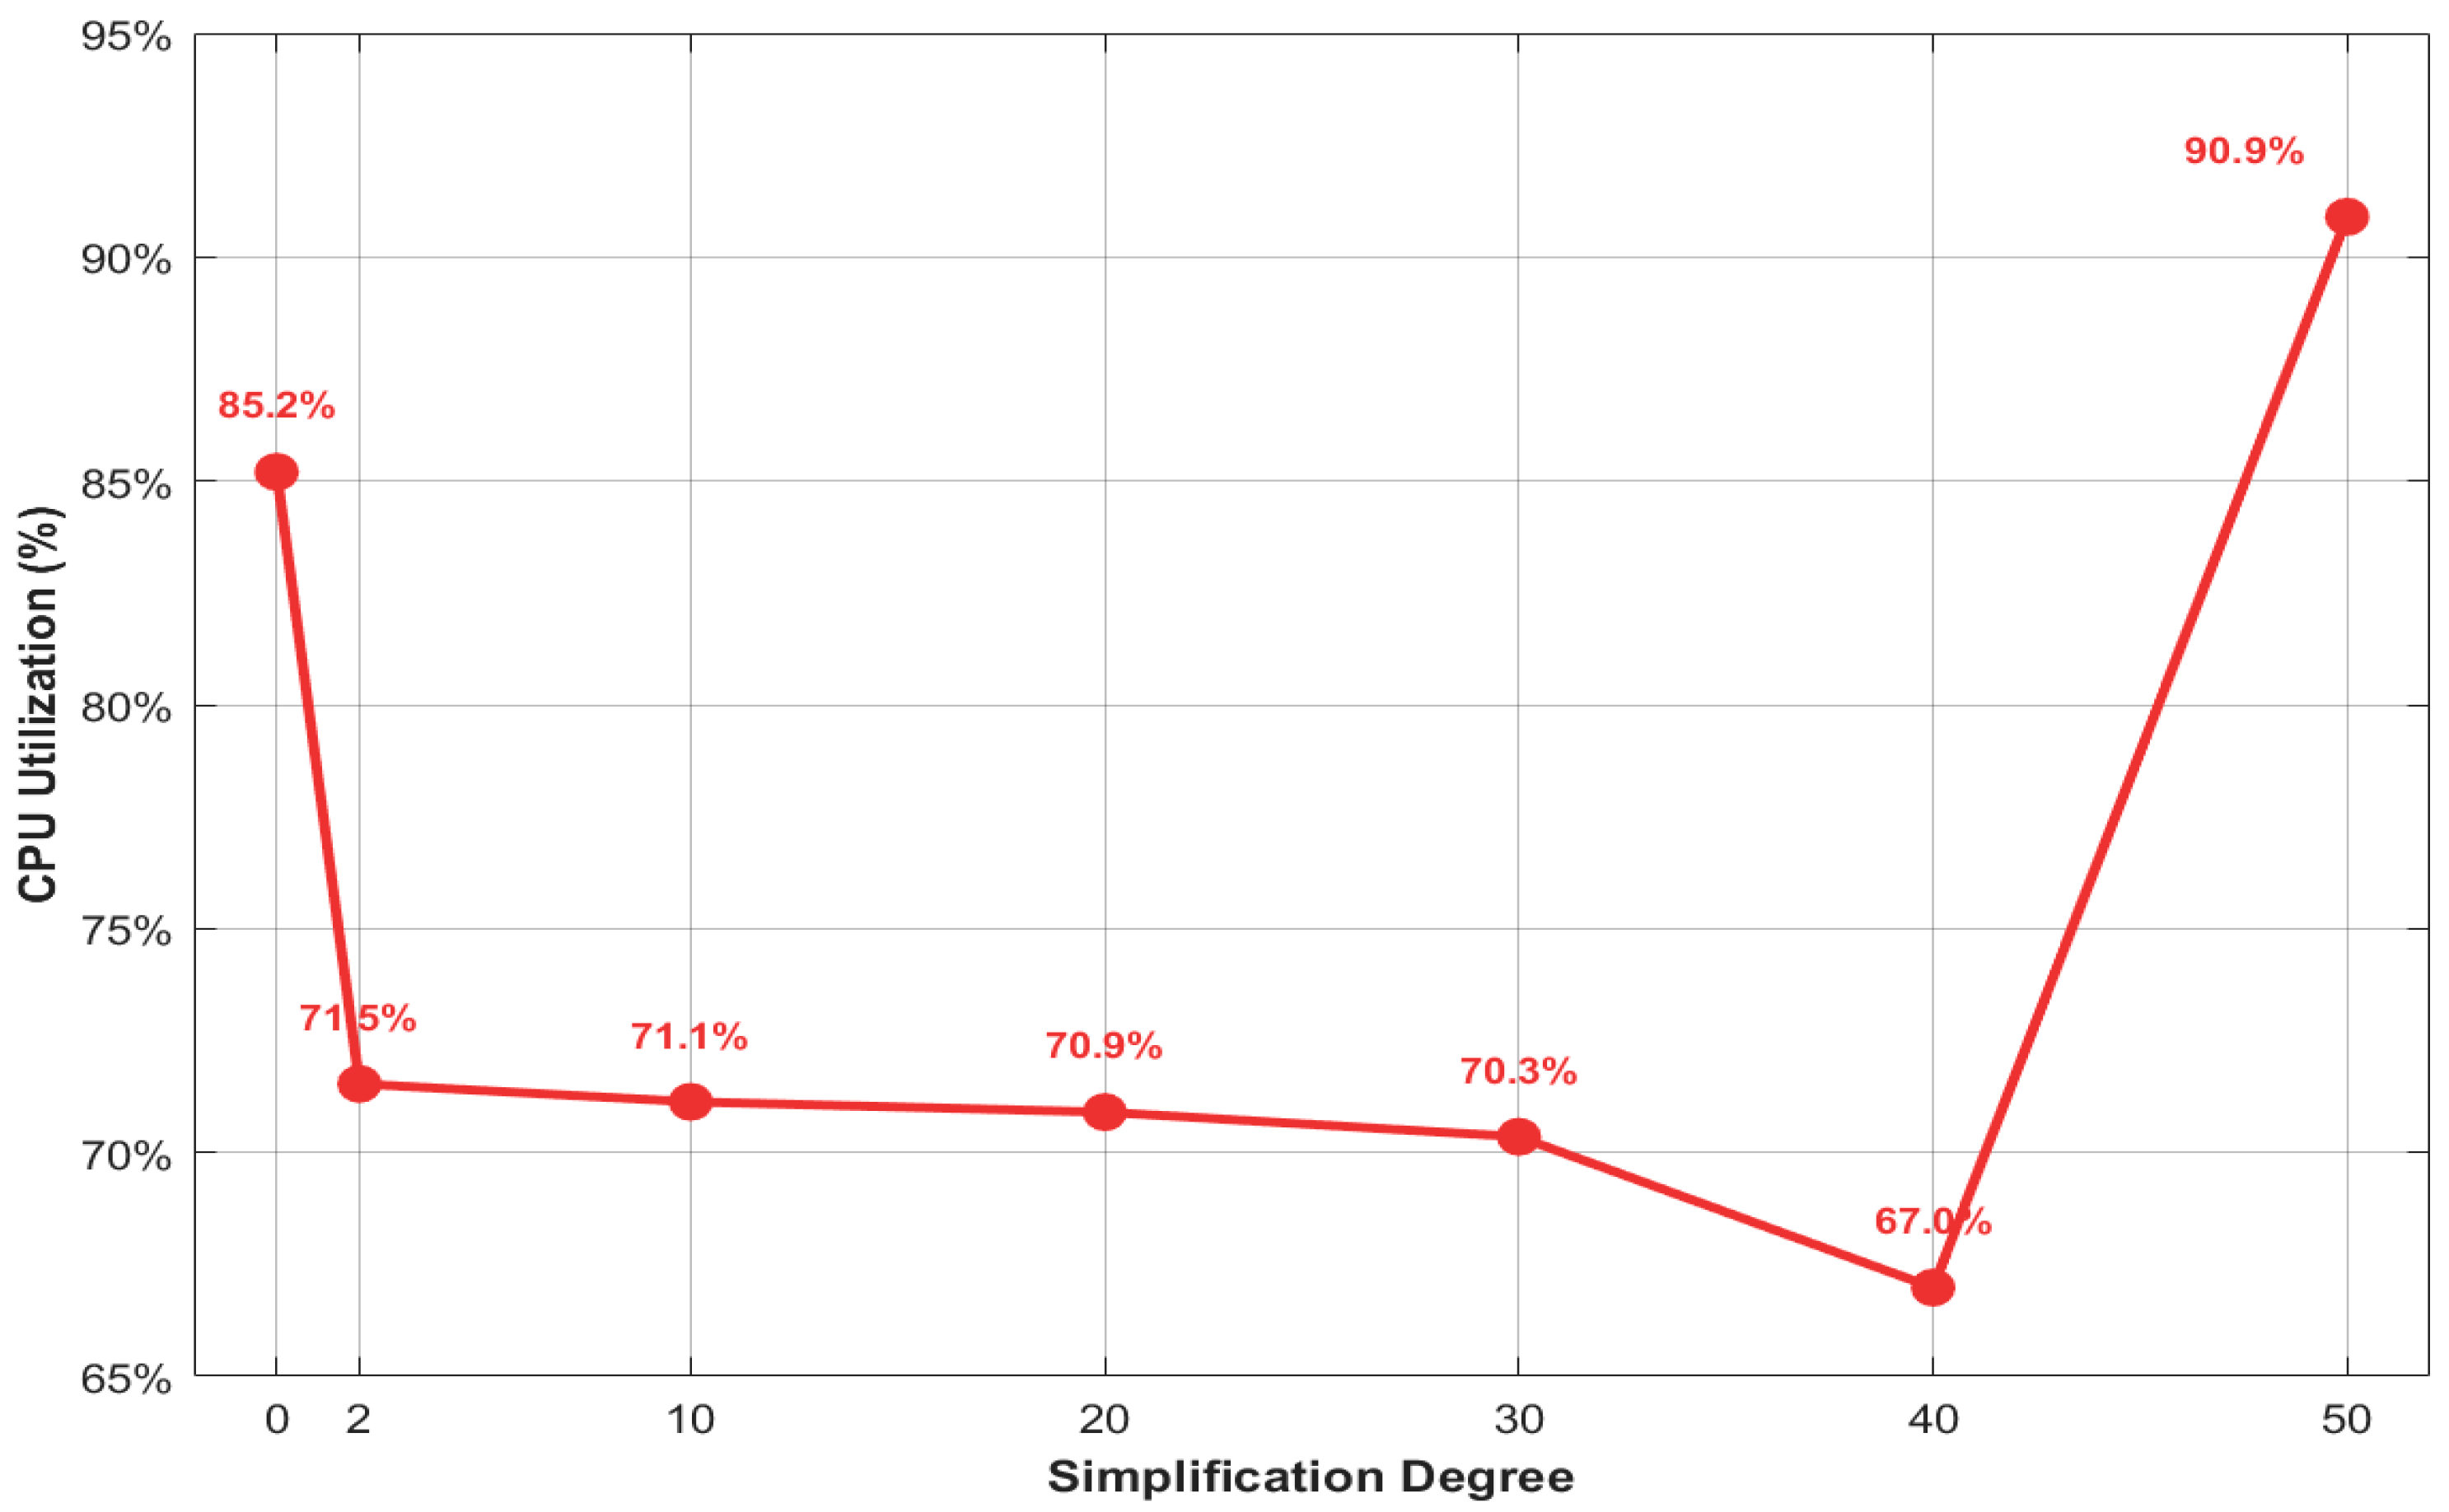
Empirical analysis of CPU occupancy during rendering operations (Figure 5) revealed an overall decreasing trend as simplification ratios increased. However, a significant rebound in CPU utilization was observed at 50% simplification. This phenomenon is attributable to computational characteristics of rendering engines: when pronounced geometric distortion occurs, increased computational complexity arises from irregular structures requiring intensive processing for ray tracing and texture mapping algorithms.
(4)
Universality Analysis of Model Lightweighting Methodology
This study not only conducted systematic experiments on a water pump model but also selected three representative groups of models with varying levels of detail (including water dam and intake sluice gate models, among other hydraulic facilities) for equivalent comparative experiments. The experimental results demonstrate that lightweighting processing consistently achieved approximately 70% storage optimization while maintaining both geometric precision and visual quality, regardless of whether the models were individual or part of a diverse set. Furthermore, the lightweighted models met practical application requirements across key metrics such as shape recognizability and detail retention. These findings indicate that the model lightweighting methodology employed in this study exhibits strong universality and practical value, providing a reliable foundation for its broader application and dissemination.
In comparison with existing studies, it was demonstrated that the newly proposed improved method achieved a 75% reduction in memory usage at simplification levels of 30% to 20%, which is comparable to the 68% reduction reported by Sun Shaonan et al. [29], and significantly outperforms the 6% improvement attained by Guo Siyi et al. [4]. However, at a 10% simplification level, a 70% optimization was achieved with the present method, markedly superior to the 44% reported by Sun Shaonan et al. [29]. In terms of loading time optimization, the proposed method was also found to outperform those previously mentioned under equivalent simplification conditions.

5. Evaluation System Construction

5.1. Lightweighting Effect Evaluation

A systematic evaluation framework was designed to ensure that the outcomes of BIM model lightweighting processing meet practical application requirements. This framework comprehensively assesses lightweighting effectiveness through four critical dimensions: model quality assessment, user experience evaluation, computational performance metrics, and long-term optimization and stability. As demonstrated in Table 1, this multidimensional methodology enables thorough reflection of lightweighting effects, providing a scientific basis for subsequent refinement.
A four-dimensional evaluation framework encompassing model quality assessment, user experience evaluation, computational metrics analysis, and long-term optimization stability was developed to comprehensively assess lightweighting effectiveness. Model quality assessment focuses on geometric accuracy and visual fidelity, while user experience evaluation employs subjective perception metrics for visual performance. Computational metrics analysis quantifies objective parameters including storage footprint, CPU utilization during rendering, and model loading duration.
Comparative analysis of visual outputs against precision requirements for hydraulic engineering O&M models (L3–L4) demonstrated adequate visual performance and shape discernibility at this simplification level. Furthermore, cross-referencing model quality and computational metrics (Figure 3, Figure 4 and Figure 5) indicated significant improvements in storage footprint, loading time, and CPU utilization. These optimization metrics exhibited progressive enhancement with increasing simplification ratios. Consequently, models processed through the enhanced QEM algorithm satisfy operational requirements at this simplification threshold, establishing a robust foundation for subsequent applications.

5.2. Evaluation System Establishment

A systematic evaluation framework for lightweighted models was established to ensure processed models achieve expected outcomes and satisfy acceptance criteria. This framework enables comprehensive assessment of lightweighting effectiveness through multidimensional quantitative analysis, providing an empirical foundation for practical implementations.

5.2.1. Establishment of the Evaluation System

(1)
Definition of Evaluation Objectives
Establishing precise evaluation objectives is essential in model lightweighting research. The primary aim of this investigation is to systematically assess the enhanced Quadric Error Metric (QEM) algorithm, with particular emphasis on quantifying lightweighting effectiveness. This assessment framework ensures optimized outcomes conform to predefined requirements while generating empirical support for subsequent refinements.
(2)
Determination of Evaluation Metrics
A comprehensive metric system spanning four critical dimensions was constructed to evaluate model lightweighting performance (Table 1). These dimensions include: (1) model quality assessment; (2) user experience evaluation; (3) computational performance analysis; (4) long-term optimization stability. Model quality and user experience metrics constitute the principal components, directly reflecting practical lightweighting efficacy.
(3)
Weight Assignment via Analytic Hierarchy Process (AHP)
Weight coefficients for evaluation metrics were determined using the Analytic Hierarchy Process. Hierarchical structures were established wherein pairwise comparison matrices quantitatively derive relative importance weights. This method demonstrates significant scientific rigor in resolving multi-criteria decision-making problems. For instance, within model quality assessment, hierarchical decomposition of storage footprint, polygon count, loading time, and geometric accuracy metrics—coupled with expert judgment and experimental data—enabled systematic weight allocation.
(4)
Implementation of Fuzzy Comprehensive Evaluation Model
Accounting for subjective judgment complexity and nonlinear inter-metric relationships, a fuzzy comprehensive evaluation model was implemented. This approach employs fuzzy mathematics to process qualitative indicators, synthesizing fuzzy relation matrices with weight vectors to yield discrete rating outcomes. The model effectively integrates subjective and objective factors, facilitates stratified analysis of results, and demonstrates robust adaptability to complex evaluation scenarios.

5.2.2. Instance Analysis

Model quality assessment was investigated as the primary focus, with its effectiveness evaluated through the established framework. Systematic examination of core metrics within this domain was conducted to validate the framework’s scientific rigor and practical applicability, while establishing theoretical and empirical foundations for optimizing model lightweighting outcomes.
Determining Indicator Weights
  • Analysis of Model Quality Determinants
Critical factors influencing model quality were systematically analyzed, categorized, and synthesized, resulting in the identification of five primary determinants: storage footprint, polygon count, loading time, geometric accuracy, and aperture integrity. Quantifiable metrics were established for each factor, forming a comprehensive and scientifically grounded evaluation framework.
2.
Hierarchical Indicator System Construction
A hierarchically structured indicator system was developed with the goal level targeting efficient BIM model lightweighting. The criterion level encompasses five dimensions: storage footprint, polygon count, loading time, geometric accuracy, and aperture integrity. Each dimension incorporates specific quantifiable metrics, enabling systematic assessment of lightweighting effectiveness while providing scientifically validated optimization guidance.
3.
Weight Calculation Methodology
Judgment matrices were constructed based on the indicator hierarchy (Table 2):
Q 11 : Loading Time;
Q 12 : Aperture Integrity;
Q 13 : Geometric Accuracy;
Q 14 : Storage Space;
Q 15 : Polygon Count.
Table 2. Judgment Matrix.
X Q 11 Q 12 Q 13 Q 14 Q 15
Q 11 14121/3
Q 12 1/411/31/51/6
Q 13 13131/2
Q 14 1/251/311/4
Q 15 36241
Sum5.75194.6610.52.25
The judgment matrix was subjected to normalization, and the resulting normalized judgment matrix is presented in Table 3 for further analysis and reference:
To ensure that the determination of weights is rational and reliable, it is essential to conduct a consistency test on the judgment matrix within the analytic hierarchy process framework. This involves computing the consistency ratio (CR). If CR < 0.1, the weight determination is considered reasonable.
For the judgment matrix under analysis, the maximum eigenvalue ( λ max ) was calculated as the sum of the products of the matrix elements and the corresponding weights, resulting in λ max = 5.255. The consistency index (CI) was then determined using the formula:
C I = λ max n n - 1 = 0.06375
where n represents the order of the matrix. The random inconsistency index (RI) for a matrix of this size is 1.12. Subsequently, the consistency ratio was computed as:
C R = C I R I = 0.06375 1.12 = 0.0569
Since C R < 0.1 , the consistency test was satisfied, confirming the rationality of the weight determination process. The resulting weight values are presented in Table 4.
Constructing the Evaluation Model
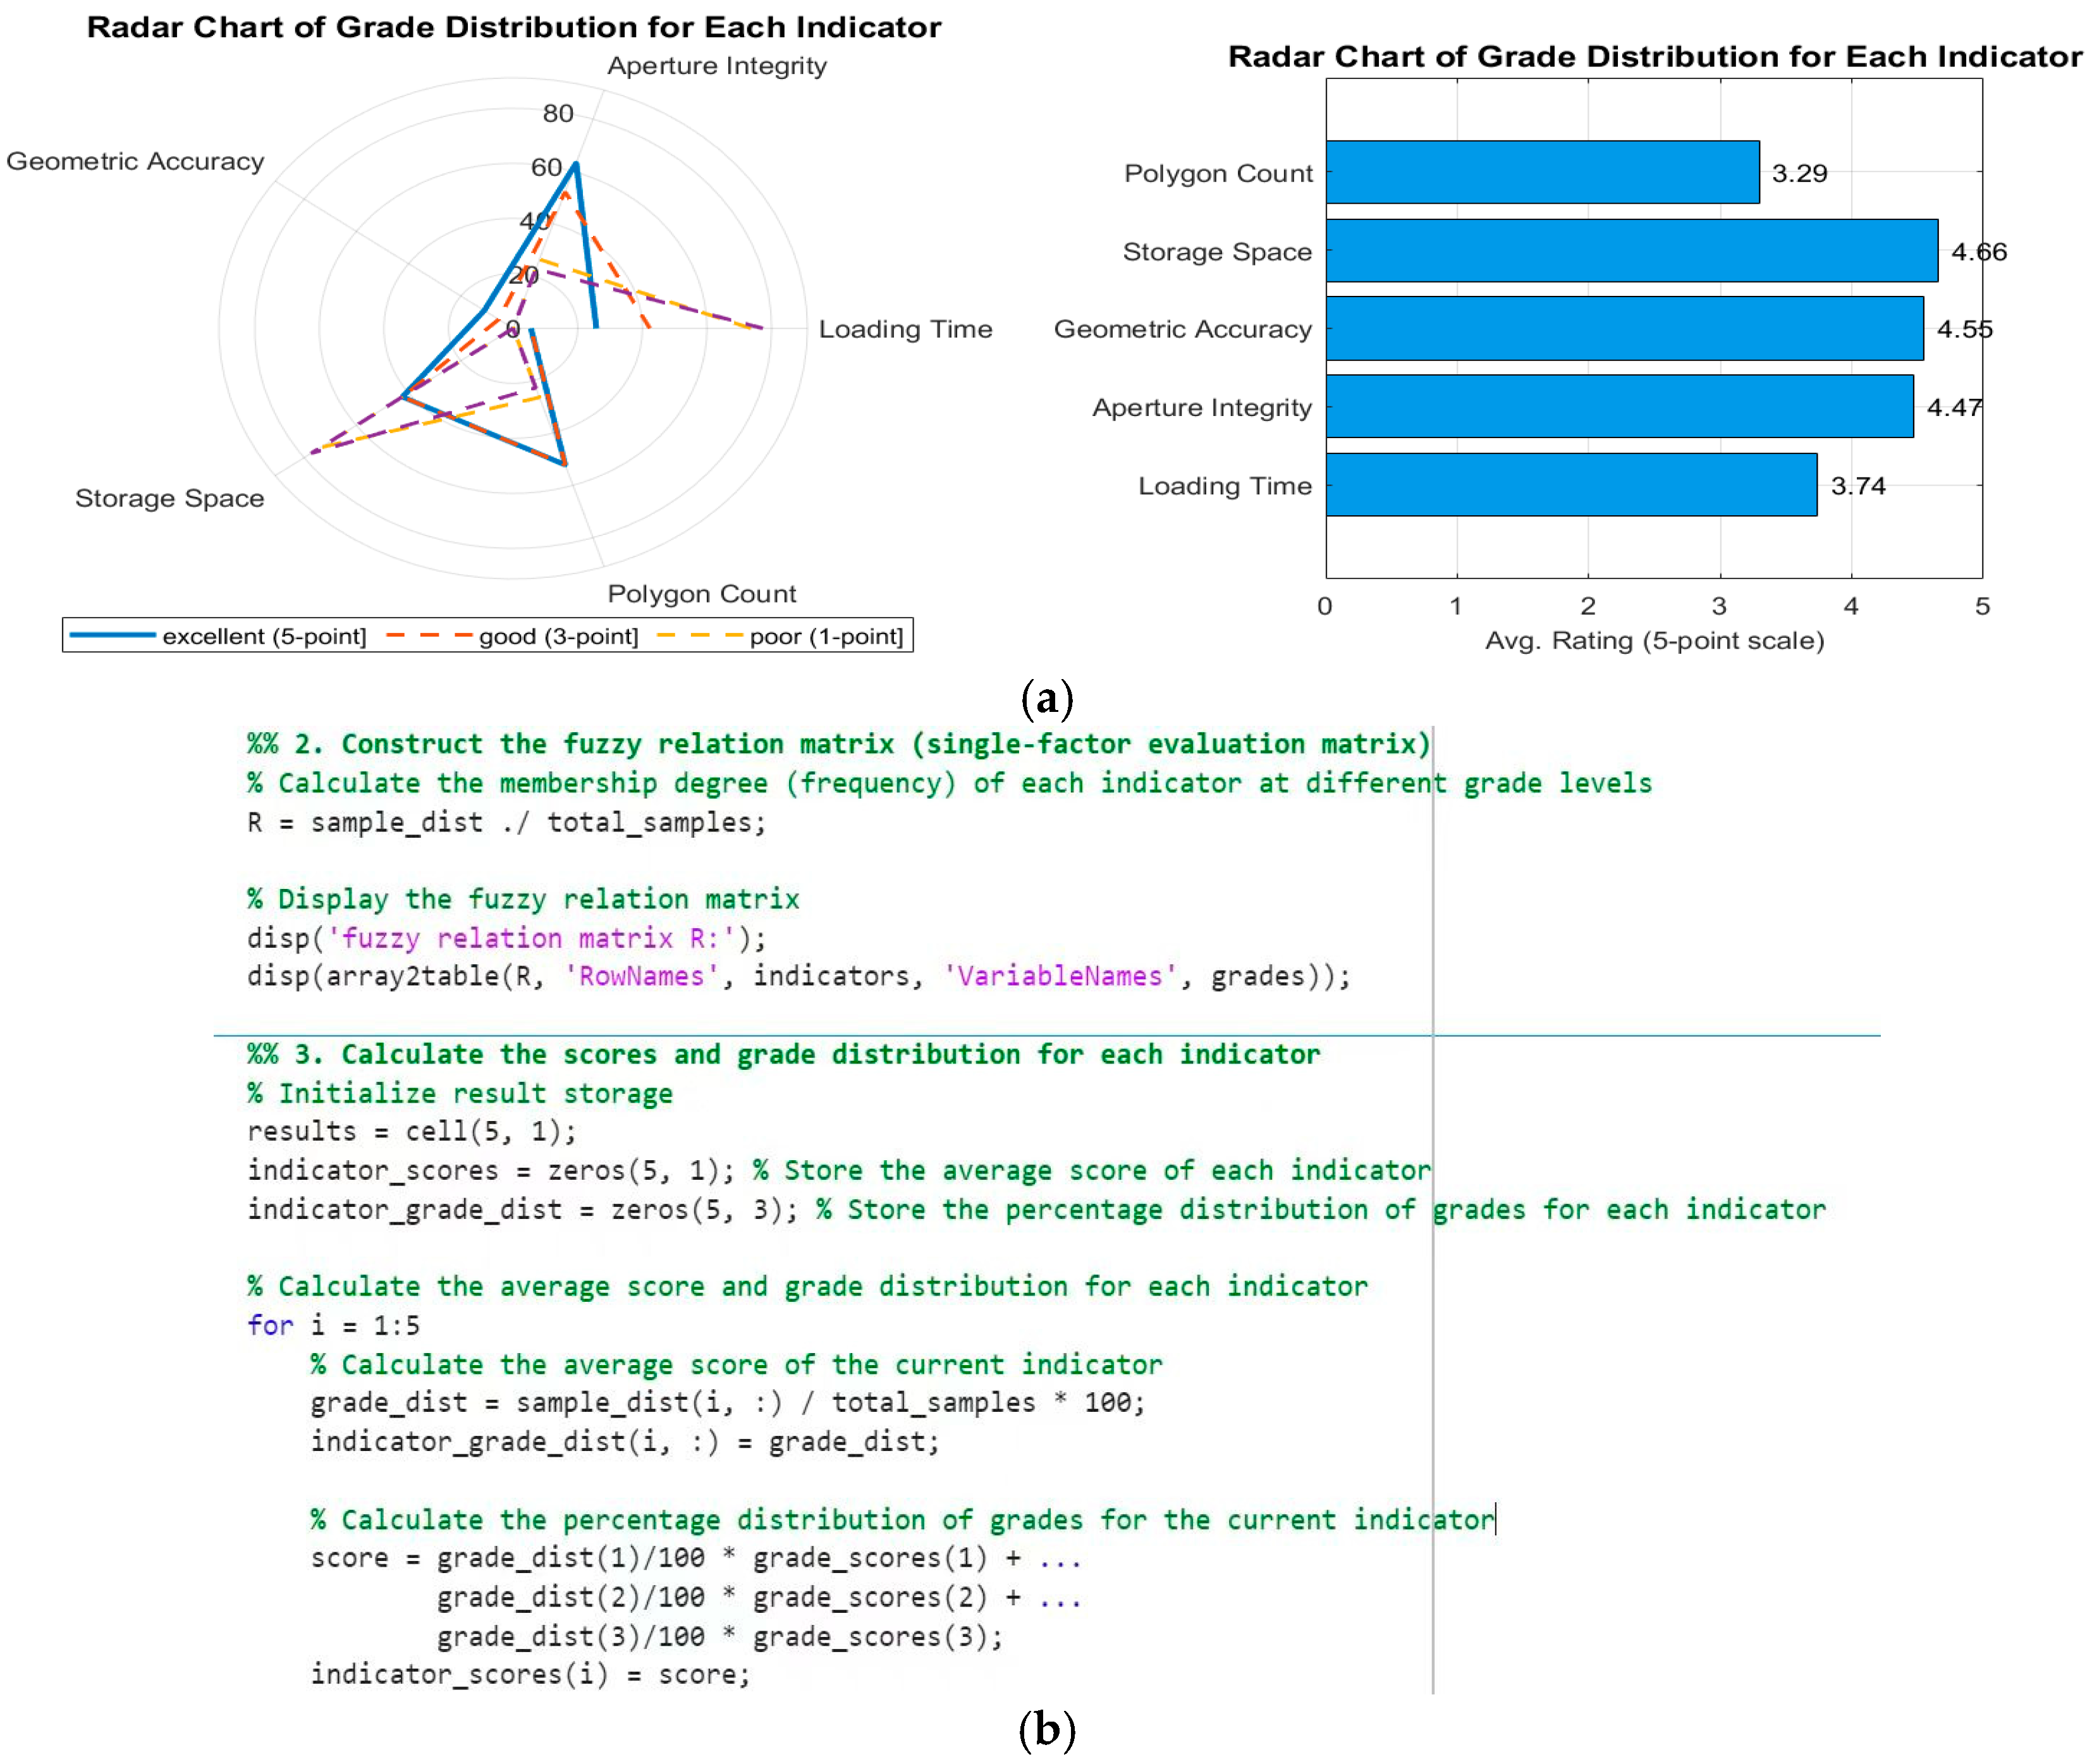
The model was established using MATLAB v2024 software, with specialized definitions incorporated for fuzzy geometry. In terms of evaluation grade determination, the grades were categorized into three levels: “excellent,” “good,” and “poor,” assigned scores of 5, 3, and 1, respectively. To facilitate quantifiable evaluation, the scoring system was defined as follows: scores within the range of [3.5, 5] were classified as “excellent,” scores within [2.5, 3.5] as “good,” and scores within [1, 2.5] as “poor.” The fuzzy comprehensive evaluation process primarily encompasses the following steps: first, a fuzzy relation matrix was constructed based on the specific performance of the evaluation object across various indicators; second, the scores for each indicator were calculated from the evaluation matrix, and the grade distribution was statistically analyzed; finally, the fuzzy comprehensive evaluation algorithm was applied to integrate the results across all indicators, and the evaluation outcomes were visualized. A portion of the visualization results and implementation code are presented below (Figure 6a,b). Additionally, a flowchart illustrating the construction process of the evaluation model is provided in Figure 7: To ensure the reliability and representativeness of the sample data in the fuzzy relation matrix, this study employed a questionnaire survey method for data collection. A total of 163 valid questionnaires were collected.

5.2.3. Results and Model Innovation Analysis

Model Features and Innovations
  • Weight Normalization:
The sum of the weights is automatically normalized to 1, ensuring the accuracy of the fuzzy comprehensive evaluation.
2.
Multidimensional Visualization Analysis:
Comprehensive Evaluation Pie Chart: Clearly displays the overall evaluation results.
Score–Weight Relation Graph: Simultaneously presents both score and weight information.
Stacked Bar Chart: Provides an intuitive representation of the grade distribution of each indicator.
3.
Interactive Design:
The data are displayed directly on the charts, with different color codes used to distinguish various grades. The results are automatically saved as MAT files for convenient retrieval.
Runtime Results Analysis
Based on the aforementioned operational results, the membership degree distribution for the fuzzy comprehensive evaluation was calculated as follows: the membership degree values for the “excellent,” “good,” and “poor” evaluation grades were 0.49, 0.44, and 0.057, respectively, with the highest membership degree corresponding to the “excellent” grade. Specifically, the improved QEM (Quality Evaluation Model) algorithm achieved an evaluation score of 3.87 in the BIM model lightweight processing, and this score fell within the predefined interval of [3.5, 5]. Therefore, the comprehensive evaluation results indicated that the improved QEM algorithm demonstrated exceptional performance in model quality assessment, with an effectiveness grade of “excellent.” Additionally, compared to the original method, the improved algorithm significantly reduced the model volume while maintaining model accuracy, thereby validating the effectiveness and feasibility of the proposed method and providing important references for future research.
When applying the improved QEM algorithm for model lightweight processing, the algorithm exhibited excellent performance in memory space and geometric precision. It was capable of maintaining existing optimization strategies while establishing monitoring mechanisms to prevent performance regression. Regarding loading time optimization, future research could adopt progressive loading techniques, combining the QEM algorithm with LOD technology to achieve resource loading.

6. Conclusions and Future Work

6.1. Conclusions

This study focuses on lightweight processing methods of BIM models in the domain of water conservancy engineering operation and maintenance. An improved QEM algorithm is applied to optimize geometric models, with a water pump used as a case study for in-depth analysis. The MATLAB platform was utilized to construct an AHP-fuzzy comprehensive evaluation model for systematic assessment of the lightweight effects. The key findings of the research are as follows:
(1)
Methodologically, an improved Quadric Error Metric (QEM) algorithm was proposed in this study, and a comprehensive evaluation framework was established, together providing new tools and a theoretical foundation for BIM model lightweighting. Furthermore, the introduced evaluation framework addresses a significant gap in the field—namely, the lack of systematic methods for assessing the effectiveness of existing lightweighting techniques—thus laying a groundwork for future research.
(2)
In practical terms, the findings of this study can be directly applied to the operation and maintenance management of hydraulic engineering. They offer a solution to enhance the operational efficiency of existing BIM platforms by mitigating issues related to large model data volume through lightweight processing. Experimental results demonstrate that the processed BIM models significantly improve operational responsiveness in large-scale and complex scenarios, optimize user interaction experience, and further promote the broader application of BIM technology in engineering management; The established evaluation framework is capable of effectively assessing the effectiveness of the lightweighting process and providing relevant recommendations.
(3)
While the Quadric Error Metric (QEM) algorithm can reduce memory usage, shorten model loading time, and improve rendering efficiency, its primary operation involves the reduction in triangular faces. Consequently, its effectiveness in enhancing loading speed and rendering performance remains limited. Therefore, integrating QEM with other algorithms—such as Level of Detail (LOD)—presents a viable strategy to overcome these limitations.

6.2. Future Work

Due to limitations in the research cycle and personal resources, this study primarily focused on the initial exploration of QEM algorithm improvement, and there are certain limitations in both the depth and breadth of the research. To further refine the research framework and enhance the application value of the research outcomes, subsequent studies will engage in in-depth investigations from the following three perspectives:
(1)
Algorithm Refinement and Optimization: Future research will focus on exploring strategies to integrate the improved QEM algorithm with Level of Detail (LOD) technology. This approach not only can effectively avoid potential distortion issues during the model lightweight processing but also optimize resource loading strategies, thereby further reducing model loading time and improving overall operational efficiency.
(2)
Performance Metric Maintenance and Optimization: For the performance metrics where the current algorithm excels, further optimizations of existing strategies will be pursued. Additionally, a comprehensive monitoring mechanism will be established to identify and prevent performance regression phenomena in a timely manner, ensuring the stability and reliability of the algorithm during long-term applications.
(3)
Technology Application Expansion: BIM model lightweight processing allows for the establishment of a more concise and efficient working platform during water conservancy engineering operation and maintenance, thereby enhancing work efficiency. The application value of BIM model lightweight technology is not only evident in the field of water conservancy engineering operation and maintenance but also extends to multiple scenarios such as Web, VR, and AR. Specifically, lightweight models ensure smooth model loading and rendering on WebGL-based digital twin platforms; facilitate the construction of dynamic interactive web presentations in React frameworks; and significantly improve application runtime efficiency and user immersive interaction experience on mobile VR/AR devices. These advantages underscore the vast application potential of BIM lightweight technology in the fields of engineering management, digital twins, and virtual reality. Based on the current research outcomes, subsequent studies will actively explore the application potential of the improved QEM algorithm in WebGL engines, React frameworks, and mobile VR/AR scenarios. This will further validate the algorithm’s applicability and superiority in various application contexts. Such efforts will provide critical technical support for the deeper integration of BIM technology into emerging fields such as digital twins and virtual reality.
Through in-depth exploration of the aforementioned research directions, the technical capabilities of the QEM algorithm will be systematically enhanced, providing stronger technical assurances for the widespread application of BIM technology in water conservancy engineering and related domains.

Author Contributions

Conceptualization, Z.Z. and Z.T.; methodology, Z.Z.; software, Z.T.; vali-dation, Z.Z., Z.T., and L.H.; formal analysis, Z.T.; investigation, Z.T.; resources, Z.Z.; data curation, Z.T.; writing—original draft preparation, Z.T.; writing—review and editing, Z.Z., Z.T., and L.H.; visualization, J.D.; supervision, L.H. and J.D.; project administration, L.H. and J.D.; funding acquisition, Z.Z. All authors have read and agreed to the published version of the manuscript.

Funding

The project presented in this article is supported by the Hubei Provincial Department of Housing and Urban–Rural Development Science and Technology Plan Project “Research on Cost Control of Foundation Pit Support Engineering Based on BIM Technology” (2020171185-25) and Hubei Provincial Department of Education 2025 Emerging Engineering Education Program “Construction and Practice of Engineering Management Course Cluster for Smart Construction” (Project No.: 2024-143).

Data Availability Statement

The data presented in this study are available on request from the corresponding author. The data are not publicly available due to privacy concerns.

Conflicts of Interest

Author Lihong He was employed by the company Wuhan Municipal Engineering Design and Research Institute Co., Ltd. The remaining authors declare that the research was conducted in the absence of any commercial or financial relationships that could be construed as a potential conflict of interest.

References

  1. Chu, P.; Zhao, E.; Madiniyetti, J. Research on Whole Life Cycle Management of Water Conservancy and Hydropower Engineering Based on BIM. Water Resour. Hydropower Eng. 2018, 36, 133–136. [Google Scholar] [CrossRef]
  2. Jiang, P.; Wu, J.; Liu, H.; Liu, Z.; Zhang, S. Research on Lightweight Technology of Digital Twin Water Conservancy Engineering Based on BIM. People’s Yellow River 2024, 46, 133–137+144. [Google Scholar] [CrossRef]
  3. Guo, S.; Chen, Y. A Lightweight Method for Information Models in the Building Operation and Maintenance Stage. J. Graph. 2018, 39, 123–128. [Google Scholar] [CrossRef]
  4. Bao, S.; Bu, H.; Lou, X.; Fang, X. Status and Outlook of BIM-based Operation and Maintenance. Constr. Technol. 2024, 53, 28–35+50. [Google Scholar]
  5. Yalcinkaya, M.; Singh, V. Patterns and trends in Building Information Modeling (BIM) research: A Latent Semantic Analysis. Autom. Constr. 2015, 59, 68–80. [Google Scholar] [CrossRef]
  6. Vberlo, L.; Krijnen, T. Using the BIM Collaboration Format in a Server Based Workflow. Procedia Environ. Sci. 2014, 22, 325–332. [Google Scholar] [CrossRef]
  7. Zhao, N.; Li, W.; Chen, Y. Research on Whole Life Cycle Management of Water Conservancy Engineering Based on BIM Technology. Sichuan Water Resour. 2022, 43, 116–121. [Google Scholar]
  8. Fu, X.; Tian, L.; Zhang, Q.; Chang, H.; Li, S.; Wu, W. Application of Digital Twin Technology in Operation and Maintenance Management of Water Conservancy Engineering. Water Hydropower News 2024, 45, 104–107. [Google Scholar] [CrossRef]
  9. Chen, X.; Wang, Z.; Kou, B.; Yu, Q. Three-Dimensional Visualization Operation and Maintenance Management Platform for Building Models Based on BIM. Green Constr. Intell. Build. 2023, 4, 33–36+40. [Google Scholar]
  10. Su, Q. Development and Application of a BIM+GIS Collaborative Management Platform for Water Conservancy Engineering. Yellow River 2024, 46, 133–136+148. [Google Scholar] [CrossRef]
  11. Liu, H.; Zhong, Q.; Xie, J.; Zhang, G.; Fu, C. Research and Application of an Intelligent Operation and Maintenance Management Platform for Pumping Stations Based on Knowledge-Driven Methods. Water Hydropower Technol. 2025, 56, 484–490. [Google Scholar] [CrossRef]
  12. Zhao, F. Research and Implementation of Lightweight Ancient Building BIM Models Based on WebGL; Xi’an University of Architecture and Technology: Xi’an, China, 2018. [Google Scholar]
  13. Du, Z.; Wang, H.; Tan, Z.; Huang, H. Research on Lightweight Application of Water Conservancy Engineering BIM Based on IFC and WebGL. Rural Water Conserv. Hydropower 2020, 11, 199–203. [Google Scholar]
  14. Wang, D.; Wang, S.; Zeng, W. Lightweight Application of BIM in Rail Transit Based on WebGL. Railw. Comput. Appl. 2021, 30, 30–34. [Google Scholar] [CrossRef]
  15. Wei, A.; Ding, Z.; Wang, L.; Zeng, L.; Yan, L. Clinical Comprehensive Evaluation of Specific Plasminogen Activator for Thrombolysis in Acute Myocardial Infarction. Guide to Pharmacology. 2025, pp. 1–13. Available online: http://kns.cnki.net/kcms/detail/42.1293.R.20250613.1115.028.html (accessed on 16 June 2025).
  16. Zhao, J.; Yuan, P.; Yan, J. Research on the Generation Logic, Theoretical Connotation, and Evaluation System of Emerging Productive Forces. Xinjiang Financ. Econ. 2025, 3, 5–15. [Google Scholar] [CrossRef]
  17. Liu, J.; Wang, Z.; Sun, J.; Lin, H.; Li, C. Comprehensive Evaluation Method for Cloud Model-Based Dynamic Adjustment of Topological Restriction Short-Circuit Current Fast Switching Device Placement. Trans. China Electrotech. Soc. 2025, 1–16. [Google Scholar] [CrossRef]
  18. Gu, Y. Construction of Practice Teaching Quality Evaluation System for Logistics Management Majors in Higher Vocational Colleges Based on the CIPP Evaluation Model. Logist. Technol. 2025, 48, 170–172+184. [Google Scholar] [CrossRef]
  19. Xu, N.; Gong, Y. Research on the Framework System of BIM-Based Building Operation and Maintenance Management–Taking the Xuzhou Civil Service Center Project as an Example. Constr. Econ. 2018, 39, 45–48. [Google Scholar] [CrossRef]
  20. Lou, X.; Zhang, J. Thinking on the Path of Campus Digital Intelligent Operation and Maintenance Management Based on BIM. Informatiz. China Constr. 2022, 17, 58–59. [Google Scholar]
  21. Kensek, K. BIM guidelines inform facilities management data bases: A case study over time. Buildings 2015, 5, 899–916. [Google Scholar] [CrossRef]
  22. Wang, Z. The Application of BIM Technology in Building Operation and Maintenance. Constr. Econ. 2013, 9, 94–97. [Google Scholar] [CrossRef]
  23. Chen, G.; Zhang, H.; Lü, B.; Sun, S. Research on the Application of BIM Technology in the Operation Phase of Projects. J. Zhongzhou Univ. 2016, 33, 120–124. [Google Scholar] [CrossRef]
  24. Chen, X.; Fu, W.; Liu, C.; Liu, Z.; Li, P.; Hu, Z.; Hu, D. Exploring the Application of Large Artificial Intelligence Models in Power Equipment Maintenance Scenarios. Chin. Eng. Sci. 2025, 27, 180–192. [Google Scholar]
  25. Yang, J.; Chen, Y.; Wang, T.; Zhou, Y.; Xia, J. The Application of BIM Technology in Operation and Maintenance Management of Water Conservancy Engineering. Water Hydropower Technol. 2020, 51, 185–190. [Google Scholar] [CrossRef]
  26. GB/T 51301-2018; Technical Standard for Building Information Model Delivery. China Standards Press: Beijing, China, 2018.
  27. Li, X.; Li, G.; Zhang, X.; Li, H. Edge collapse simplification base on subdivision. J. Comput. Aided Des. Comput. Graph. 2002, 14, 8–13. [Google Scholar]
  28. Garland, M.; Heckbert, P.S. Surface simplification using quadric error metrics. In SIGGRAPH Proceedings; ACM Press: New York, NY, USA, 1997; pp. 209–216. [Google Scholar] [CrossRef]
  29. Sun, S.; Dong, G.; Jiao, H.; Li, B. Research on Lightweighting of Digital Twin Virtual Entities in Hydraulic Engineering. China Rural. Water Hydropower 2025, 1, 168–174. [Google Scholar]
Figure 1. Technology Roadmap.
Water 17 02929 g001
Figure 2. (a,b) Partial Algorithm Improvement Scheme.
Water 17 02929 g002
Figure 3. Simplification Level Change Chart.
Water 17 02929 g003
Figure 4. Variation of Loading Time with Simplification Level.
Water 17 02929 g004
Figure 5. CPU Utilization vs. Simplification Ratio Plot.
Water 17 02929 g005
Figure 6. (a) Visualization Results Display; (b) implementation code Display.
Water 17 02929 g006
Figure 7. Evaluation Model Flowchart.
Water 17 02929 g007
Table 1. Evaluation Criteria for Lightweighting Effectiveness.
Evaluation of Model LightweightingAssessment MetricsSpecifications
Model Quality ( Q 1 )Loading Time ( Q 11 )Time required for complete model initialization
Aperture Integrity ( Q 12 )Preservation of void structures without collapse or fusion
Geometric Accuracy ( Q 13 )Magnitude of deviation in dimensional parameters
Storage Space ( Q 14 )File size of the processed model
Polygon Count ( Q 15 )File size of the processed model Number of triangular meshes in the model geometry
User Experience ( Q 2 )Visual Satisfaction ( Q 21 )Perceived quality assessed through user rating scales
Shape Discernibility ( Q 22 )Recognizability of critical structural components
Texture Quality ( Q 23 )Preservation of color and texture resolution
Interaction Responsiveness ( Q 24 )System latency during view manipulation operations
Computational Performance ( Q 3 )Frame Rate ( Q 31 )Rendering frames per second (FPS) during navigation
Cross-platform Compatibility ( Q 32 )Operational stability across diverse hardware/software environments
Resource Utilization ( Q 34 )CPU/GPU occupancy rates and memory consumption during runtime
Long-term Viability ( Q 4 )Operational Stability ( Q 41 )Reliability under extended usage scenarios
Maintenance Scalability ( Q 42 )Resource requirements for future updates and optimizations
Table 3. Normalization of Judgment Matrix.
X Q 11 Q 12 Q 13 Q 14 Q 15 ω A ω
Q 11 0.170.210.2150.190.1470.18640.987
Q 12 0.040.050.0710.0190.0740.05080.262
Q 13 0.170.1570.2150.280.2220.20881.1316
Q 14 0.0870.260.0710.0950.1110.12480.646
Q 15 0.5210.320.430.3810.4440.41922.2
Table 4. Weighting Factor.
ω ( Q 11 ) ω ( Q 12 ) ω ( Q 13 ) ω ( Q 14 ) ω ( Q 15 )
0.18640.05080.20880.12480.4192
Disclaimer/Publisher’s Note: The statements, opinions and data contained in all publications are solely those of the individual author(s) and contributor(s) and not of MDPI and/or the editor(s). MDPI and/or the editor(s) disclaim responsibility for any injury to people or property resulting from any ideas, methods, instructions or products referred to in the content.