Article

Data–Physics-Driven Multi-Point Hybrid Deformation Monitoring Model Based on Bayesian Optimization Algorithm–Light Gradient-Boosting Machine

1
School of Civil and Environmental Engineering, Nanchang Institute of Science and Technology, Nanchang 330108, China
2
School of Infrastructure Engineering, Nanchang University, Nanchang 330031, China
3
Key Laboratory of Poyang Lake Environment and Resource Utilization, Nanchang 330031, China
*
Author to whom correspondence should be addressed.
Water 2025, 17(20), 2926; https://doi.org/10.3390/w17202926
Submission received: 12 September 2025 / Revised: 28 September 2025 / Accepted: 5 October 2025 / Published: 10 October 2025

Abstract

Single-point deformation monitoring models fail to reflect the structural integrity of the concrete gravity dams, and traditional regression methods also have shortcomings in capturing complex nonlinear relationships among variables. To solve these problems, this paper develops a data–physics-driven multi-point hybrid deformation monitoring model based on Bayesian Optimization Algorithm–Light Gradient-Boosting Machine (BOA-LightGBM). Building upon conventional single-point models, spatial coordinates are incorporated as explanatory variables to derive a multi-point deformation monitoring model that accounts for spatial correlations. Subsequently, the finite element method (FEM) is employed to simulate the hydrostatic component at each monitoring point under actual reservoir water levels. Finally, a hybrid model is constructed by integrating the derived mathematical expression, simulated hydrostatic components, and the BOA-LightGBM algorithm. A case study demonstrates that the proposed model effectively incorporates spatial deformation characteristics within dam sections and achieves satisfactory fitting and prediction accuracy compared to traditional single-point monitoring models. With further refinement and extension, the proposed modeling theory and methodology presented in this study can also provide valuable references for safety monitoring of other hydrostatic structures.

1. Introduction

Dam is an important infrastructure to solve the uneven distribution of water resources in time and space, prevent floods and droughts, and promote clean energy production. It has played an important role in ensuring national water, ecology, food, energy and public security, promoting economic growth. However, what cannot be ignored is that as the service life of dams increases, problems such as aging of the dam construction materials and deterioration of structural characteristics keep emerging, seriously threatened the service life of the project [1,2,3]. To prevent engineering failures that could result in significant loss of life and property, ensuring the long-term safe operation and sustainable benefits of dams has become a critical engineering issue in dam safety management [4]. Deformation reflects the structural response of the dam-foundation system under the dual evolution of material properties and external environmental loads. Therefore, deformation is an important monitoring parameter that can effectively and intuitively represent changes in the comprehensive service state of concrete dams. Therefore, based on the massive monitoring data acquired from various sensors embedded within the dam-foundation system and external observation methods, constructing a reasonable deformation monitoring and prediction model is widely recognized as an effective scientific approach for analyzing and diagnosing dam health both domestically and internationally. It is also a frontier scientific issue in this field. This approach has significant scientific and practical value for understanding environmental load influence mechanisms and identifying structural hazards [5,6].
Reasonable deformation monitoring models play a crucial role in the timely diagnosis of dam service behavior and offer a theoretical foundation for safety evaluations and management decisions. Various sensing technologies have been employed in dam deformation monitoring, ranging from conventional approaches such as plumb line measurements to more advanced techniques such as GNSS, InSAR, and fiber optic sensors [7,8,9], and the abundant and reliable monitoring data thereby obtained provide a solid foundation for subsequent construction of deformation monitoring models. Based on the acknowledgement of primary influencing factors and load mechanisms of dam deformation, most existing deformation monitoring models for concrete gravity dams decompose the deformation into hydraulic, thermal, and time-effect components, and share similar compositions of explanatory factors. However, depending on the extent to which finite element technology is incorporated in the modeling process, deformation monitoring models can be broadly categorized into three types [3]: statistical models, hybrid models, and deterministic models. Among these, statistical models fit all components using mathematical methods. These models are valued for their simple formulation and high computational efficiency. However, since they rely solely on the statistical characteristics of monitoring data to establish mapping relationships between explanatory and response variables, their connection to the actual structural behavior of the dam system is limited. Deterministic models use the finite element method to accurately simulate deformation components induced by hydraulic and thermal variations, which are then combined with a time-effect component calculated using either statistical methods or numerical simulation techniques. This approach effectively explains structural behavior based on physical mechanisms. Nevertheless, deterministic models face challenges such as high modeling complexity and low computational efficiency, which restrict their practical application. To overcome these limitations, hybrid deformation models that integrate monitoring statistics with numerical simulation have gained broader adoption. These models simulate the hydrostatic component using numerical techniques while employing statistical components to represent other influencing factors, thus combining the advantages of both statistical and deterministic models to enable efficient and comprehensive diagnosis of dam deformation behavior. Researchers worldwide have conducted various studies in this area. Gu et al. [10] proposed a hybrid spatio-temporal distribution modeling approach for arch dam deformation by integrating finite element simulations with spatial deformation monitoring data. Utilizing the elastic finite element (FE) method, Yang et al. [11] simulated the coupled effects on the deformation behavior of large concrete dams during operation and further developed the hybrid model. Wei et al. [6], based on the shuffled frog leaping algorithm and chaos theory, constructed an improved hybrid forecasting model that accounts for chaotic residual errors. Nevertheless, these models generally rely on deformation measurements from a single monitoring point, which limits their ability to fully capture the spatial deformation field of dams influenced by internal and external environmental loads such as reservoir water pressure, temperature, seepage, and autogenous volume changes [12]. The insufficient consideration of spatial correlations reduces prediction reliability and may cause inconsistencies in early warning applications in practical engineering. To address this issue, some researchers have incorporated deformation sequences from neighboring monitoring points as explanatory variables. For example, Wang et al. [13] developed a combined monitoring model composed of two sub-models, one driven by environmental factors and the other by deformation data from nearby points. However, such approaches depend heavily on well-designed monitoring layouts and the availability of complete datasets.
Furthermore, due to the complex interdependencies among monitoring points in the spatial deformation field of dams and the introduction of numerous explanatory variables, traditional linear regression methods are unsuitable for constructing multi-point hybrid deformation monitoring models. To develop higher-quality multi-point prediction models, some researchers have introduced machine learning algorithms into the modeling process and achieved encouraging results [14,15,16]. Kao et al. [17] utilized artificial neural networks (ANNs) to establish a deformation prediction model for arch dams, evaluating the advantages and applicability of various neural network architectures. Furthermore, the authors developed a PSO-SVM hybrid model for multi-point deformation monitoring of a concrete arch dam and verified its predictive capability through a case study [18]. To overcome limitations such as weak generalizability and low robustness, Wang et al. [19] proposed a combined dam deformation prediction framework based on multi-factor fusion and Stacking ensemble learning. Despite their potential, machine learning-based approaches also face several challenges. For example, ANNs are prone to local optima and require long training times when applied to large datasets, while the regression accuracy of SVM is highly sensitive to parameter selection [20,21]. LightGBM, a gradient-boosting decision tree-based algorithm, demonstrates higher computational efficiency and prediction accuracy compared with traditional shallow learning methods such as ANNs and SVMs. Although LightGBM has been widely adopted in fields such as financial risk assessment [22,23] and recommendation systems [24], its application in dam safety monitoring is still relatively limited.
To improve the reliability of multi-point deformation prediction and to better capture the overall deformation behavior of concrete gravity dams, this study proposes a data–physics-driven hybrid monitoring model. In this framework, the spatial coordinates of each monitoring point are incorporated into the explanatory variables, and a mathematical formulation of the hybrid model is derived to reflect the structural integrity of the dam while providing a comprehensive representation of spatial deformation patterns. The hydrostatic component time series is first obtained through finite element analysis, after which the BOA-LightGBM algorithm is applied to explore the complex nonlinear mapping between explanatory variables and deformation. In this way, a data–physics-driven multi-point hybrid monitoring model for concrete gravity dams is established. The effectiveness of the proposed approach is demonstrated through a case study on a roller-compacted concrete dam, and its reliability, accuracy, and efficiency in deformation prediction are systematically assessed.
The basic theory of multi-point deformation monitoring for concrete gravity dam is presented in Section 2. The basic principles and spatial correlation of concrete dam deformation are reviewed in Section 2.1, while the mathematical expression of the multi-point hybrid model is provided in Section 2.2. The constitution of multi-point hybrid model based on BOA-LightGBM is briefly introduced in Section 3. Section 4 presents the application of the proposed data–physics-driven multi-point hybrid deformation monitoring model and analyzes the calculation results. The conclusions are summarized in Section 5.

2. Basic Theory of Multi-Point Deformation Monitoring for Concrete Gravity Dam

2.1. Basic Principles and Spatial Correlation of Concrete Dam Deformation

Deformation represents an intuitive response of the dam–foundation system to environmental loads. From the perspective of physical causation, the deformation at any point of a concrete gravity dam can be decomposed into three components [6,15], as shown in the following equation. When analyzing deformation behavior with the hydrostatic–season–time (HST) model, its mathematical representation can be formulated as:
δ = δ H + δ T + δ θ = a 0 + i = 1 3 a i H i H 0 i + b 1 sin 2 π t 365 sin 2 π t 0 365 + b 2 sin 4 π t 365 sin 4 π t 0 365 + b 3 cos 2 π t 365 cos 2 π t 0 365 + b 4 cos 4 π t 365 cos 4 π t 0 365 + c 1 θ θ 0 + c 2 ln θ ln θ 0
where δ H , δ T and δ θ are the hydrostatic, temperature and aging component, respectively; a 0 is a constant; a i , b i , c i are statistical coefficients; t is the number of cumulative days from the t -th monitoring day to the first monitoring day, while t 0 is the cumulative number of days from the initial day; H , H 0 are the upstream water depths of the t -th monitoring day and the initial day, respectively; θ = t / 100 ,   θ 0 = t 0 / 100 .
The deformation mechanism of the concrete gravity dams under internal and external factors, as described by this model, is illustrated in Figure 1. Based on structural mechanics principles, the hydrostatic component is represented by a cubic polynomial function of the upstream water level. During the operational period, the temperature field of the dam concrete remains in a stable or quasi-stable state. Although the simplified representation of the temperature component using multi-period harmonic wave functions overlooks details caused by short-term temperature fluctuations, it can still align well with the overall trend of temperature changes. Both the hydrostatic and thermal components represent reversible deformations driven by dynamic changes in environmental loads on the dam system. In contrast, the time-effect component has more complex causes, typically reflecting irreversible deformations resulting from factors such as aging of construction materials and structural deterioration. It is commonly characterized using a combination of a linear function and a logarithmic function.
Based on the deformation mechanism and component analysis of concrete dams, it is evident that factors such as variations in upstream and downstream water levels, temperature changes, concrete shrinkage and creep, and material aging exert loads that influence the deformation behavior of the entire dam or large sections of the structure. Although deformation responses may vary in certain regions due to differences in constraints, material properties, and applied loads, even monitoring points located far apart exhibit similar or identical deformation trends. This consistency reflects the structural continuity and mechanical integration of the dam. Such behavior exemplifies the spatial correlation inherent in the deformation of a concrete dam as an integrated structure, a characteristic particularly prominent during the elastic deformation phase. In previous studies, this spatial correlation has often been quantitatively assessed using statistical measures such as correlation coefficients, variograms, or spatial autocorrelation indices (e.g., Moran’s I) [25,26].

2.2. Hybrid Model for Deformation Monitoring of Multiple Measurement Points

Influence of environmental loads on dam is global in nature, whereas single-point models are limited to reflecting changes at individual monitoring points and cannot capture the complex interactions among multiple points. Therefore, building upon the single-point monitoring model, this study introduces spatial coordinates into the set of explanatory variables for deformation. By incorporating the spatial distribution of deformation measurements, a multi-point deformation monitoring model is constructed to better represent the overall safety behavior of the dam. After including spatial coordinates as explanatory variables, the deformation monitoring model is as follows:
δ x , y , z = f H , T , θ , x , y , z = f H δ H , f x , y , z + f T δ T , f x , y , z + f θ δ θ , f x , y , z
where δ x , y , z is the deformation at any location within the dam; H , T , θ are the hydrostatic, temperature and aging factor, respectively; x , y , z is the three-dimensional space coordinate; f H δ H , f x , y , z , f T δ T , f x , y , z and f θ δ θ , f x , y , z respectively represent the hydrostatic, temperature and aging components fields; f x , y , z is a continuous function of position, which can be expanded by multivariate power series and expressed as:
f ( x , y , z )   = l = 0 3 m = 0 3 n = 0 3 a l m n x l y m z n = l , m , n = 0 3 a l m n x l y m z n
where a l m n is the statistical coefficient.
By integrating the three component expressions of the single-point HST deformation monitoring model with Equation (3) and omitting higher-order terms, the hydrostatic, thermal, and time-effect components of the multi-point monitoring model for concrete gravity dams are derived, as shown in Equations (4)–(6), respectively:
f H δ H , f x , y , z = k = 0 3 l , m , n = 0 3 A k l m n H i k H 0 k x l y m z n
f T δ T , f x , y , z = j , k = 1 2 l , m , n = 0 3 B j k l m n sin 2 π j t 365 sin 2 π j t 0 365 cos 2 π k t 365 cos 2 π k t 0 365 x l y m z n
f θ δ θ , f x , y , z = j , k = 0 1 l , m , n = 0 3 C j k l m n θ j θ 0 ln θ k ln θ 0 x l y m z n
Substituting Formulas (4)–(6) into Formula (2), and multiplying the hydrostatic component obtained from the finite element calculation by the adjustment factor, the mathematical expression of hybrid multi-point deformation monitoring model for concrete gravity dams is derived as follows:
δ ( x , y , z ) = K k = 0 3 l , m , n = 0 3 A k l m n H i k H 0 k x l y m z n   + j , k = 1 2 l , m , n = 0 3 B j k l m n sin 2 π j t 365 sin 2 π j t 0 365 cos 2 π k t 365 cos 2 π k t 0 365 x l y m z n   + j , k = 0 1 l , m , n = 0 3 C j k l m n θ j θ 0 ln θ k ln θ 0 x l y m z n
where A k l m n , B j k l m n and C j k l m n are fitting coefficients; K is the adjustment coefficient for the hydrostatic component, introduced to correct errors resulting from imperfect selection of material parameters or boundary conditions during the finite element simulation; the remaining symbols are the same with those defined in Equation (1).

3. Construction of Multi-Point Hybrid Deformation Monitoring Model Based on BOA-LightGBM

Due to the application of spatial coordinate functions and their interactions with other independent variables, the number of explanatory variables in the multi-point hybrid deformation monitoring model increases significantly. In this case, using traditional linear regression to fit the mapping relationship between the independent variables and deformation effects is prone to issues such as multicollinearity among predictors and an ill-conditioned coefficient matrix [27,28]. To address these challenges, this study leverages the strong nonlinear pattern recognition capability of LightGBM and the parameter optimization ability of BOA to construct a hybrid multi-point deformation monitoring model for concrete gravity dams.

3.1. Multi-Point Deformation Prediction of Gravity Dams Based on LightGBM

LightGBM is a gradient-boosting learning framework based on decision tree algorithm, which has been widely utilized in a variety of data mining tasks [29,30]. Compared with traditional gradient-boosting decision tree (GBDT), LightGBM effectively solves the problems of complex computation and high memory consumption in large-scale data training of GBDT. The main solutions include applying histogram-based algorithms to find the best segmentation points, gradient-based one-side sampling to narrow the search range, mutually exclusive feature bundling to reduce redundant calculations, and a leaf growth strategy with depth constraints [31,32] as presented in Figure 2.
For a given multi-point deformation dataset X = x i , y i i = 1 n (where n is the dataset length, x i is a multi-point deformation environment quantity, and y i represents multi-point deformation effect quantities), the object of LightGBM is to find an approximation f ^ x of the function f * x so that the expected value of the loss function L y , f x is minimized as follows:
f ^ = arg min f E y , x L y , f x
The LightGBM algorithm combines the prediction results from T decision trees to approximate the final output, which can be expressed as follows:
f T X = t = 1 T f t X
where f t ( X ) is the t-th decision tree, T is the total number of decision trees.
The decision tree can be expressed as w q x , where J is the number of leaves, q 1 , 2 , , J are the decision rules of the tree, and w is the vector of sample weights for leaf nodes. LightGBM algorithm will gradually optimize the model in addition form, in step t, the objective function of the model is expressed as:
Γ t = i = 1 n L y i , F t 1 x i + f t x i
During training process, traditional decision tree growth strategies adopt a level-wise approach, as illustrated in Figure 3a. This strategy splits all leaf nodes at each hierarchy regardless of their information gain, resulting in substantial computational resource consumption and poor training efficiency. In contrast, as depicted in Figure 3b, LightGBM utilizes a depth-constrained leaf-wise growth strategy, which merely splits the leaf node with the highest information gain at each iteration. This approach minimizes unnecessary splitting operations while maintaining model performance. Furthermore, LightGBM incorporates a maximum depth constraint for decision trees, effectively mitigating overfitting risks [33].

3.2. The Construction of a Multi-Point Hybrid Deformation Monitoring Model Based on Bayesian-Optimized LightGBM

Considering that the LightGBM model requires determining the optimal hyperparameter set during the process of supervised learning [34], this paper adopts the BOA to optimize the hyperparameters of the LightGBM. By constructing probabilistic proxy model and designing acquisition function, the BOA can efficiently utilize historical information and quickly find the global optimal solution. Compared with other hyperparameter optimization methods, the BOA is more efficient [35]. As shown in Equation (11), its theoretical basis is the Bayesian theorem. This algorithm achieves efficient search for the optimal hyperparameters of the LightGBM model by continuously evaluating the objective function and updating the probability proxy model.
p f D 1 : t = p D 1 : t f p f p D 1 : t
where f is the abbreviation of the objective function f θ ; D 1 : t = θ 1 , Y 1 , θ 2 , Y 2 , , θ t , Y t is the observed set, θ t is the hyperparameter combination, Y t is the observed value of the loss function; p D 1 : t f is the likelihood function of Y ; p f is the prior probability distribution of function f , that is, an assumption on the state of the loss function; p D 1 : t is the marginal likelihood distribution of f ; p f D 1 : t is the posterior probability distribution of function f , which represents the confidence of the unknown loss function after modification of the prior through the observed data set.
On the basis of mathematical expression of multi-point deformation monitoring hybrid model shown in Equation (7), this paper employs the Bayesian-optimized LightGBM algorithm to approximate the nonlinear functional relationship between the deformation explanatory variables and the multi-point deformation of the dam. A data–physics-driven multi-point hybrid deformation monitoring model is thus established. The construction process of this model is illustrated in Figure 4 and can be summarized as follows.
  • A multi-point deformation monitoring dataset was constructed by combining the measured water levels, time, and spatial coordinates according to Equation (7). The hydrostatic components at each monitoring point under the actual water pressure load were calculated using the FEM, and the results were fitted with the polynomial expression of the hydrostatic component field given in Equation (7). The fitted hydrostatic components, together with the temperature and time-effect-related factors, were subsequently normalized to serve as the input features (independent variables) of the LightGBM model, while the measured multi-point deformation sequences were taken as the target variable (dependent variable).
  • To optimize the model, the initial parameters of the Bayesian Optimization Algorithm (BOA) and the search ranges for the LightGBM hyperparameters were defined. An initial LightGBM model was trained under the starting hyperparameter set, and its prediction accuracy was used as the objective function. The BOA then iteratively evaluated the objective function, updated the search positions using Gaussian Process and the acquisition function, and trained new LightGBM models with the proposed hyperparameter sets. This process continued until the maximum number of BOA iterations was reached.
  • Finally, the BOA optimization process was terminated, and the best-found LightGBM hyperparameters were obtained. Using these optimal parameters, the final data–physics-driven hybrid multi-point deformation monitoring model for the concrete dam was constructed. The construction process of this model is illustrated in Figure 4.

4. Case Study

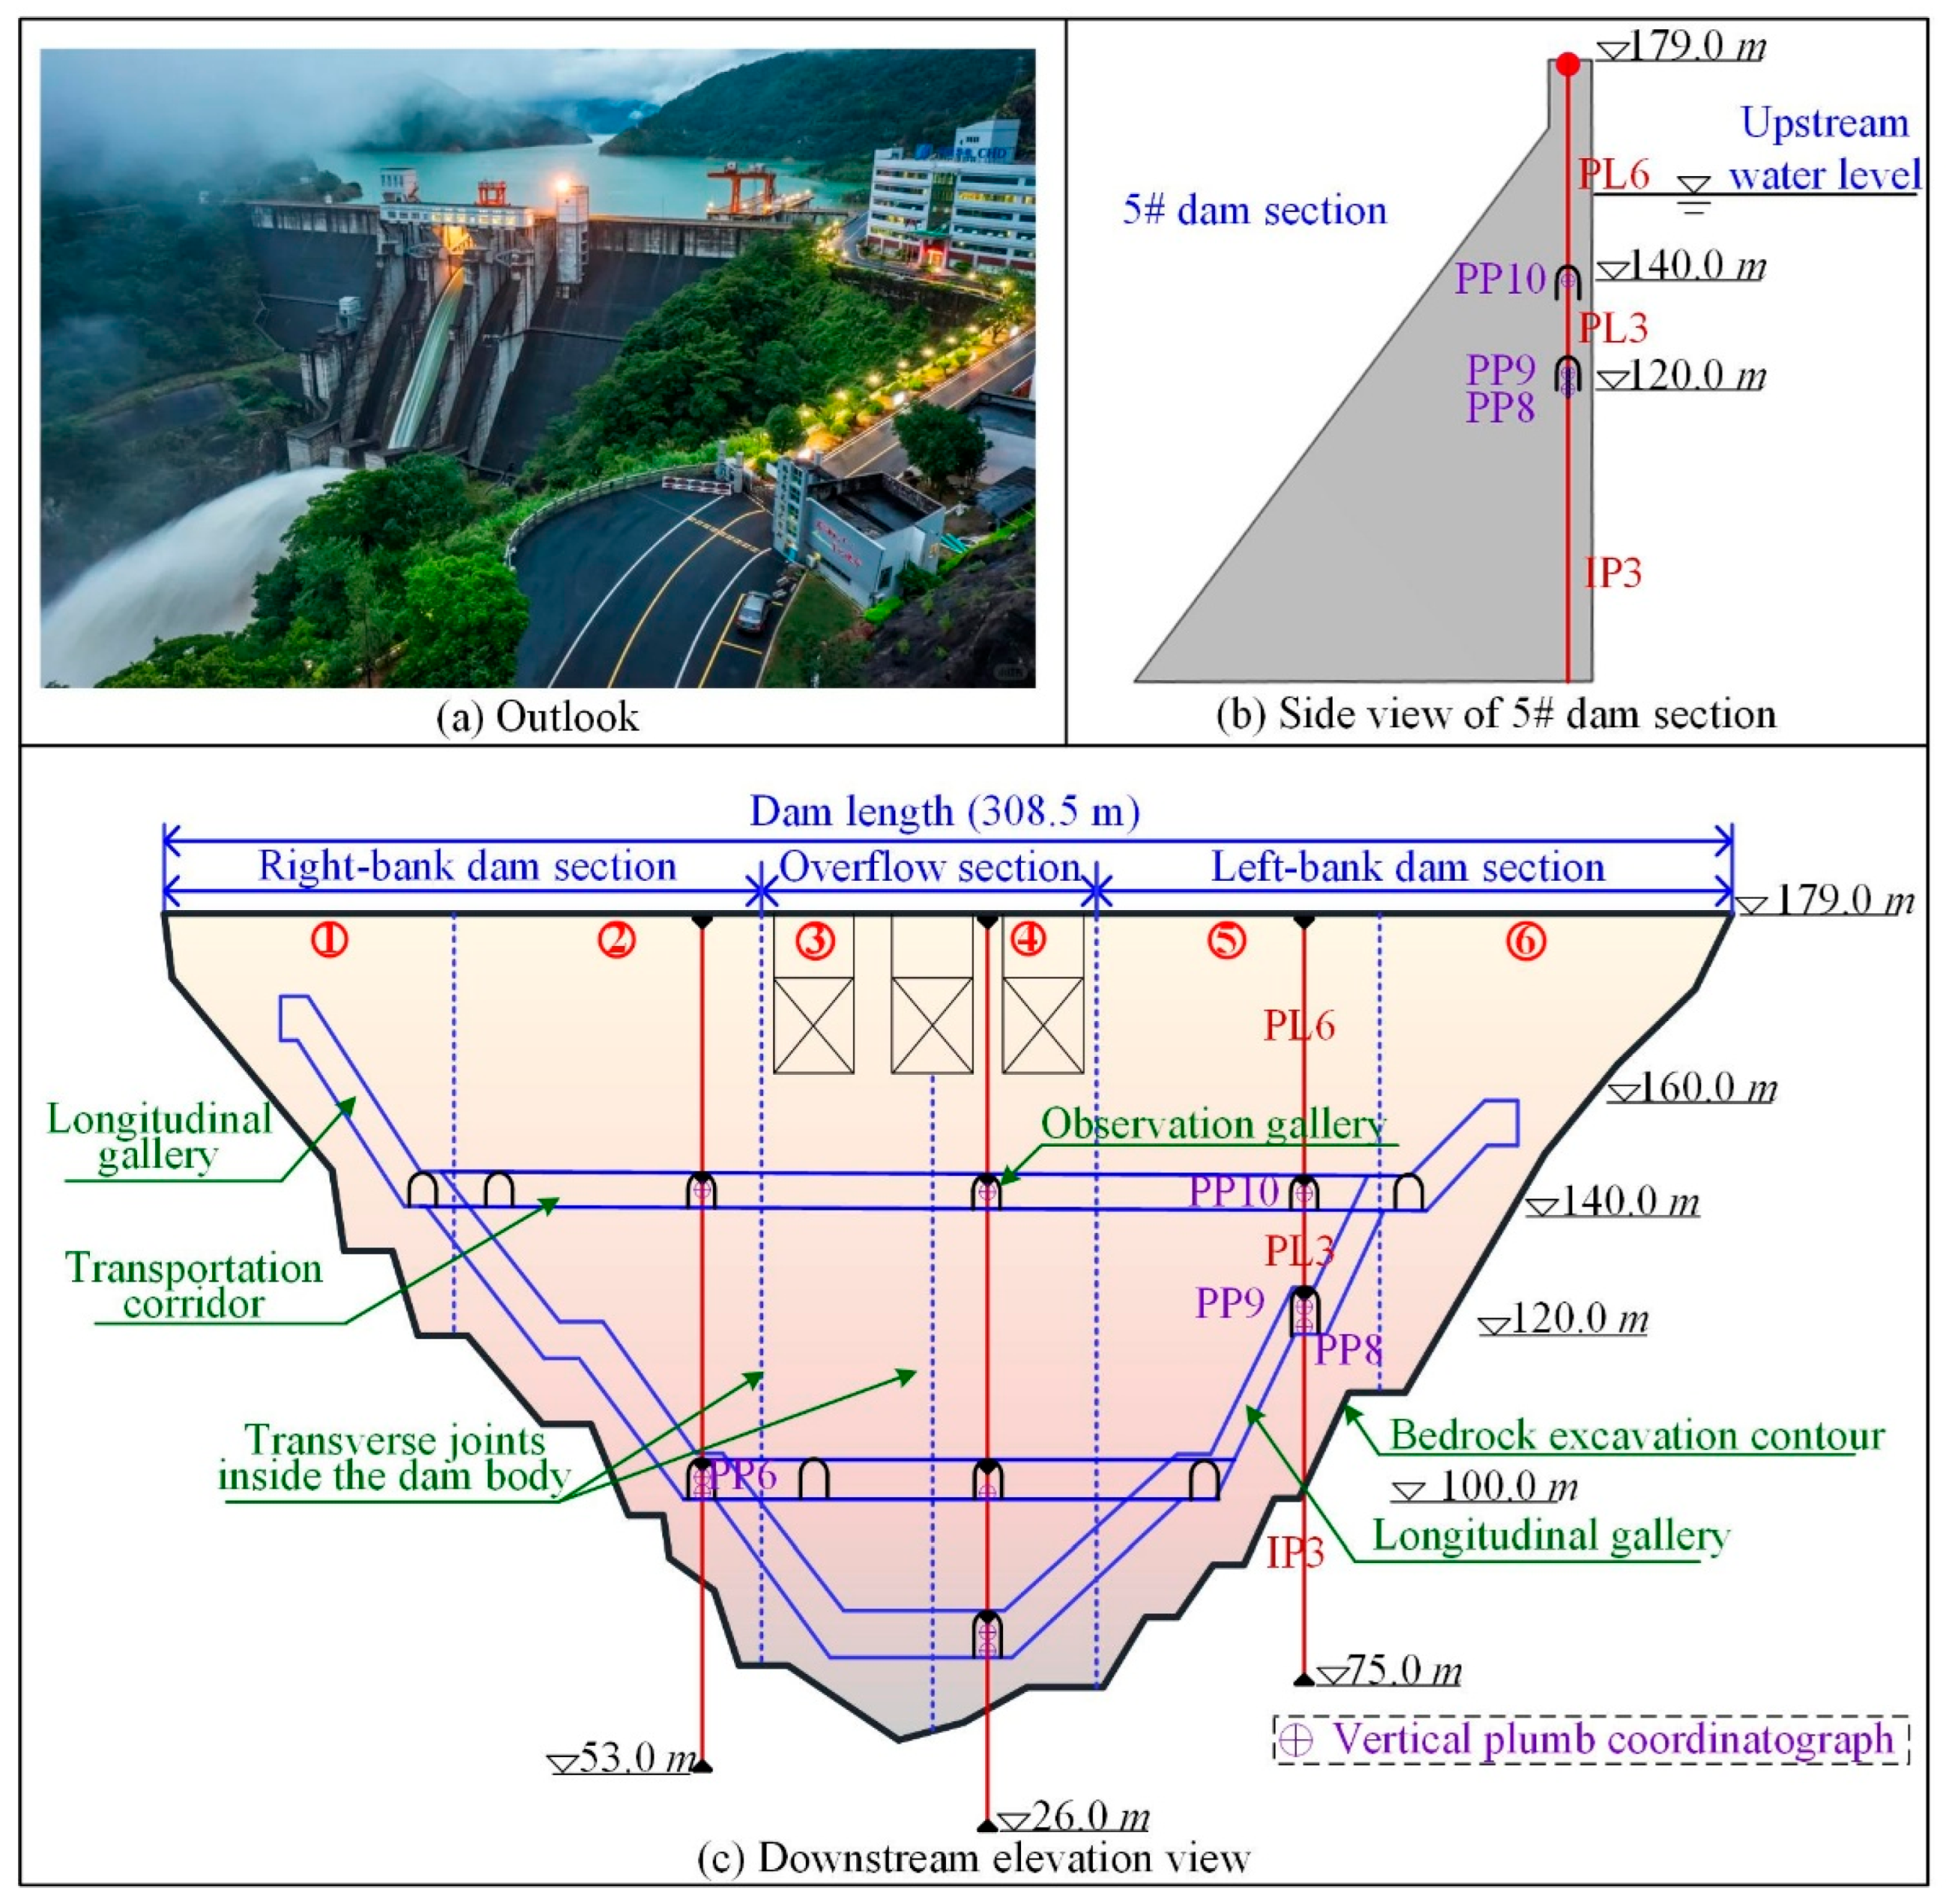
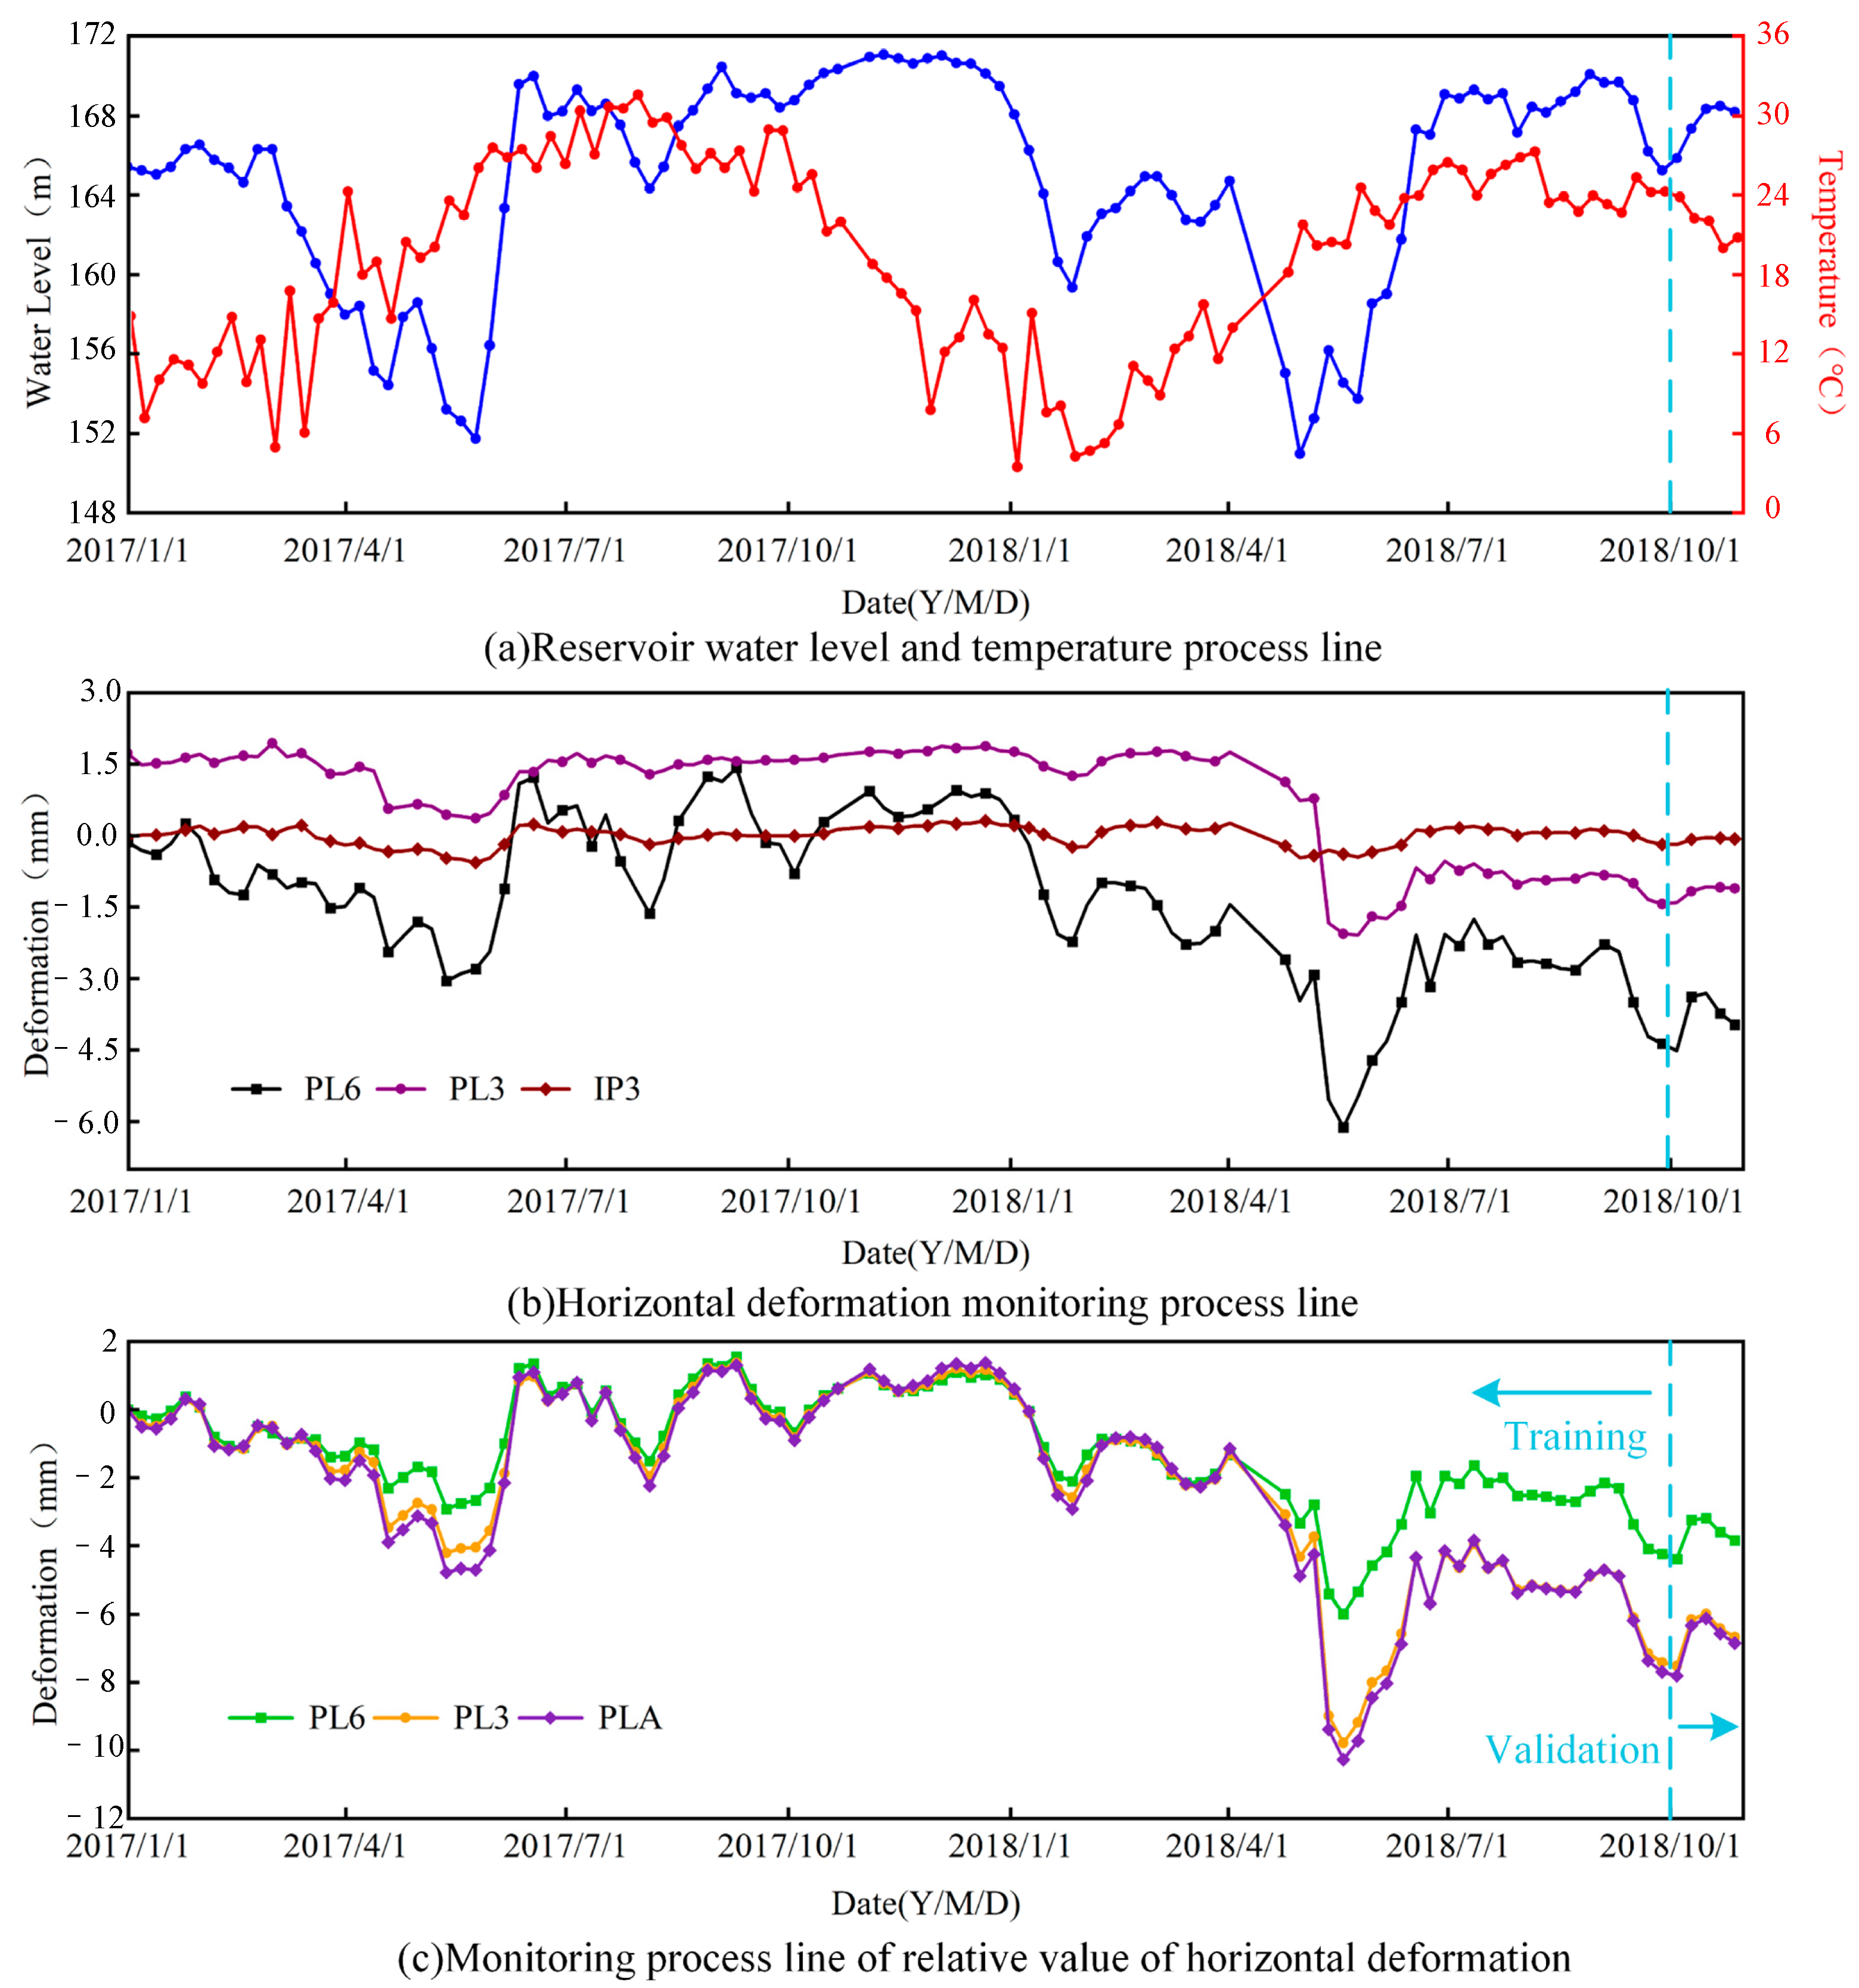
The concrete gravity dam has a total length of 308.5 m with a crest elevation of 179.0 m. Its normal pool level and check flood level are 173.0 m and 177.8 m, respectively. As shown in Figure 5, a comprehensive automated safety monitoring system has been implemented to observe the structural performance of the dam. In this study, the right-bank water-retaining monolith (Block 5) is selected as the case for constructing the proposed data–physics-driven multi-point hybrid deformation monitoring model. Within this block, three monitoring points are installed, including two plumb lines (PL6 and PL3) and one inverted plumb line (IP3). The absolute deformation of the dam crest relative to the foundation (PAL) is determined by summing the deformation records from these three points. For model development, horizontal deformation monitoring data from 1 January 2017 to 30 September 2018, are used for training, while data collected from 1 October to 31 October 2018, are employed to evaluate predictive performance.
Figure 6 exhibits the time series of the measured deformation at each monitoring point along with environmental factors. Among them, Figure 6a shows the reservoir water level and air temperature variation during the modeling period, while Figure 6b presents the measured horizontal displacements from the forward and inverted pendulums in Block No. 5 of the concrete gravity dam without relative processing. Figure 6 shows the relative values of the measured deformations at IP3, PL3 and PL6 with respect to the start date of the modeling sequence. According to Figure 6a, the air temperature exhibits periodic variation during this period, therefore, it is suitable to approximate it with a combination of harmonic functions. By comparing the water level curve in Figure 6 with the deformation curves of each monitoring point, a positive correlation between the two can be observed. This characteristic is particularly evident at points PL6, PL3, and PLA. In Figure 6 and subsequent modeling processes, the deformation of the dam in downstream direction is defined as positive.

4.1. Numerical Simulation Model of Concrete Gravity Dam

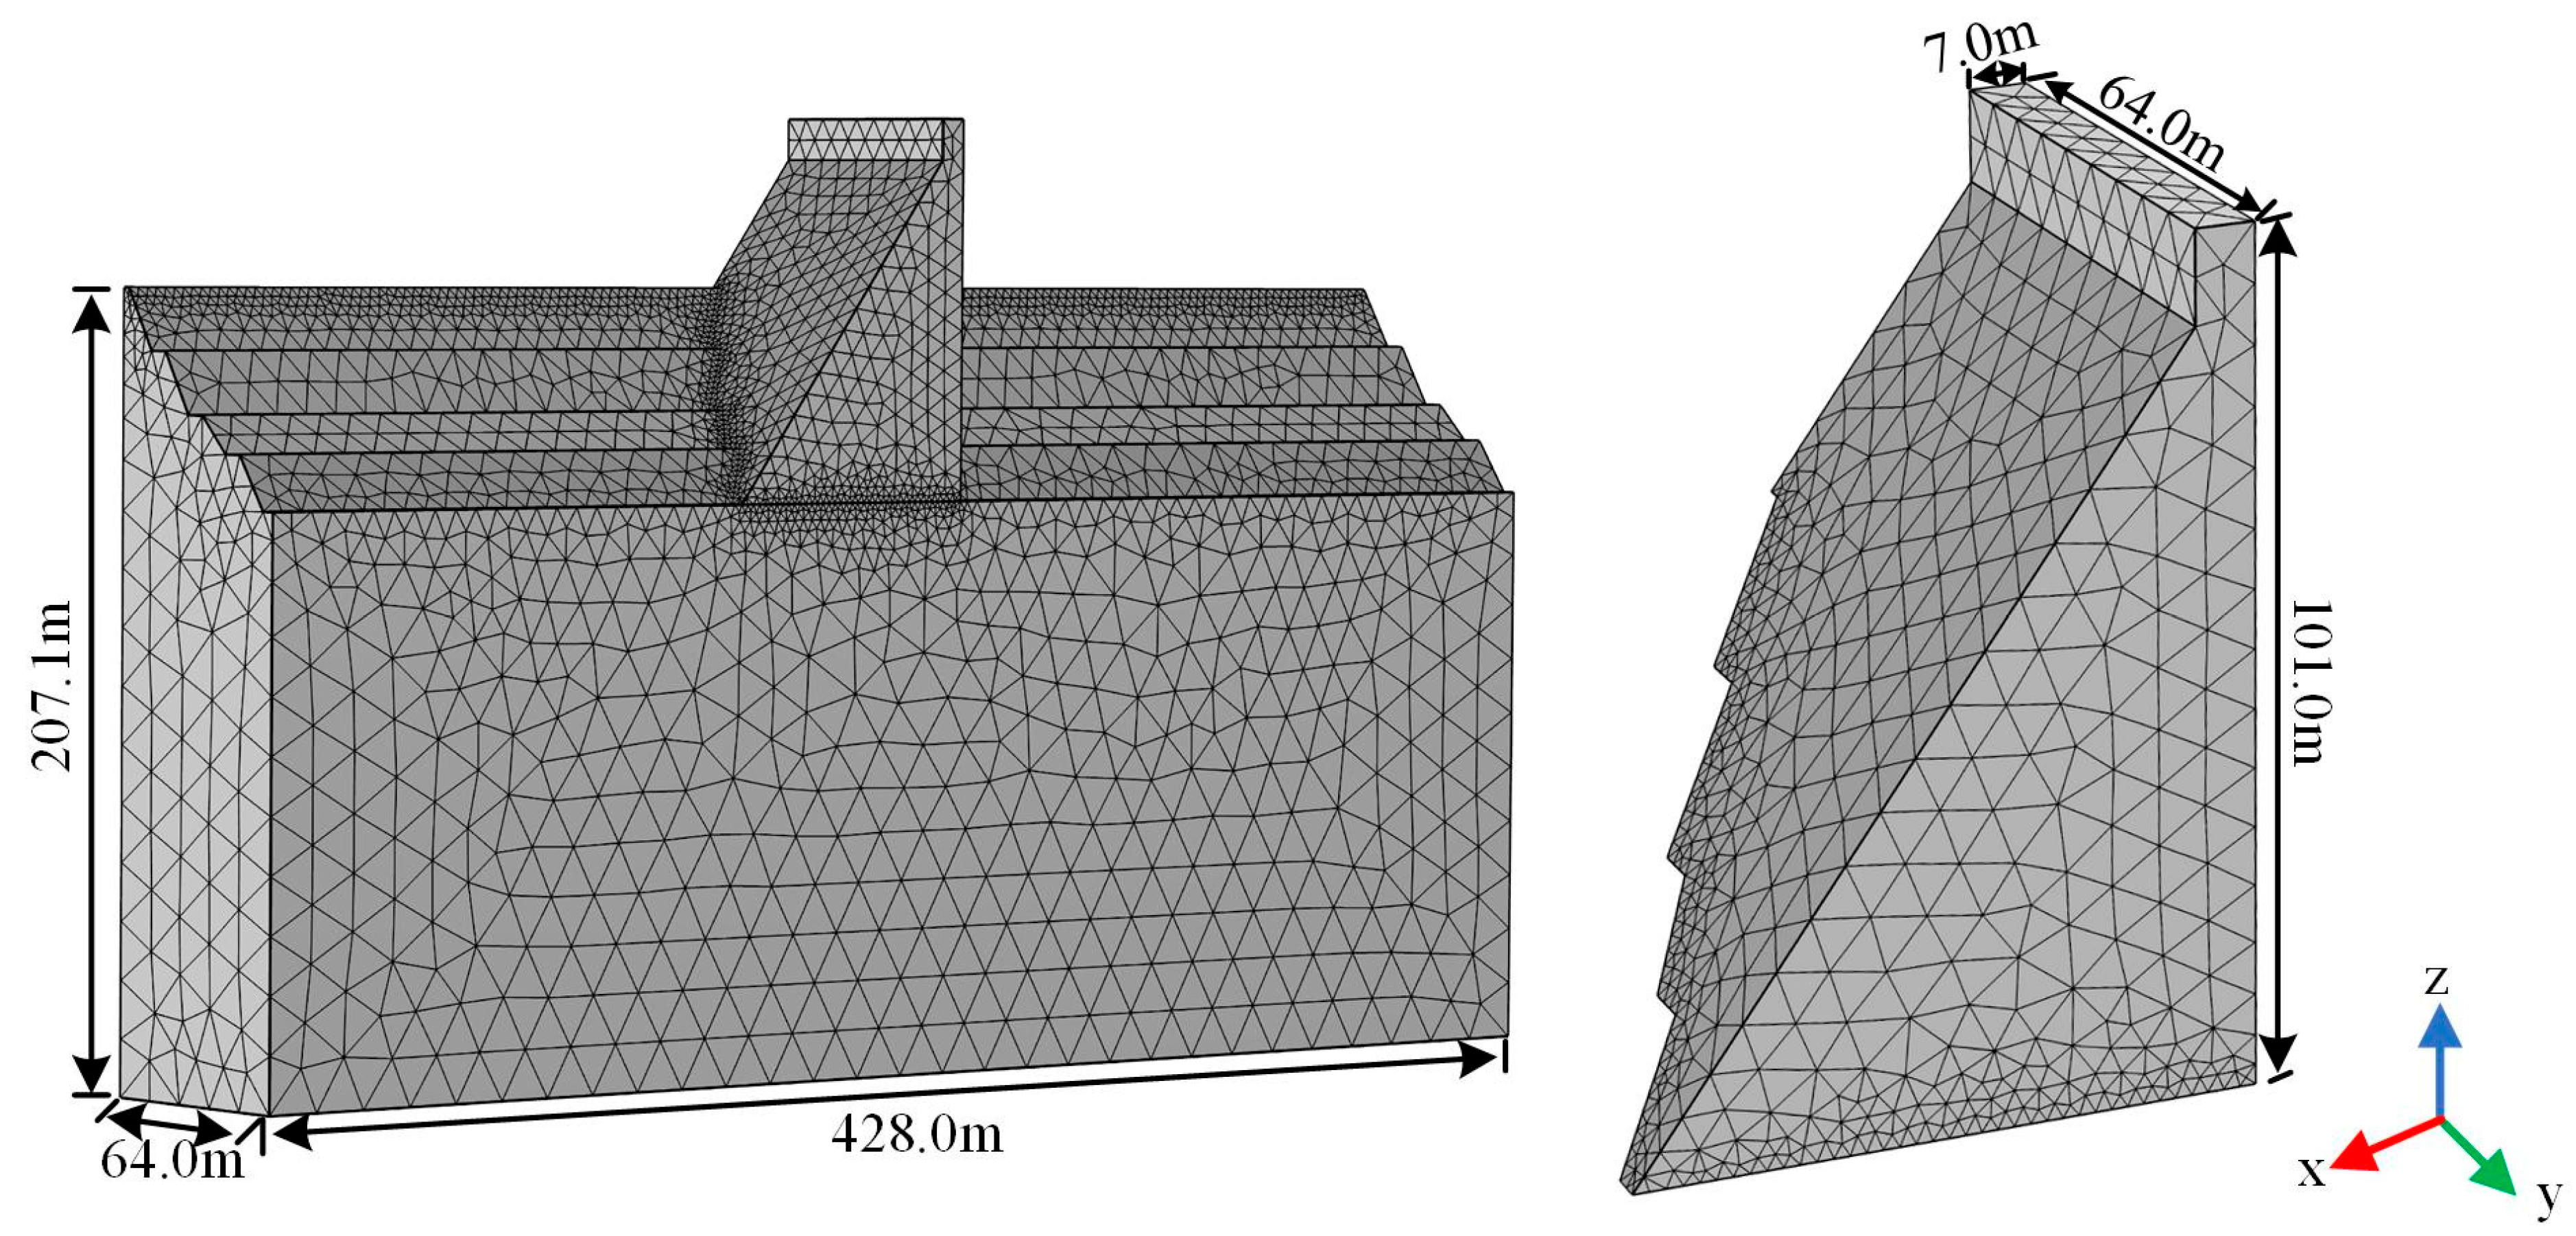
Based on the actual conditions of the concrete gravity dam, this study developed a finite element model of Block No. 5 using the COMSOL 6.2 multiphysics numerical simulation software. The modeling domain extends 2 times the dam height upstream, and 1.5 times the dam height both downstream and downward from the base. Specifically, the model extends 202.00 m ahead of the upstream toe, 151.50 m behind the downstream toe and 151.50 m below the base. The finite element model contains a total of 55,821 isoparametric elements, including 44,719 foundation elements and 11,102 dam body elements. The model comprises 11,570 nodes in total, with 9697 located in the foundation and 2663 in the dam body. The overall mesh of the dam and the structure is shown in Figure 7.
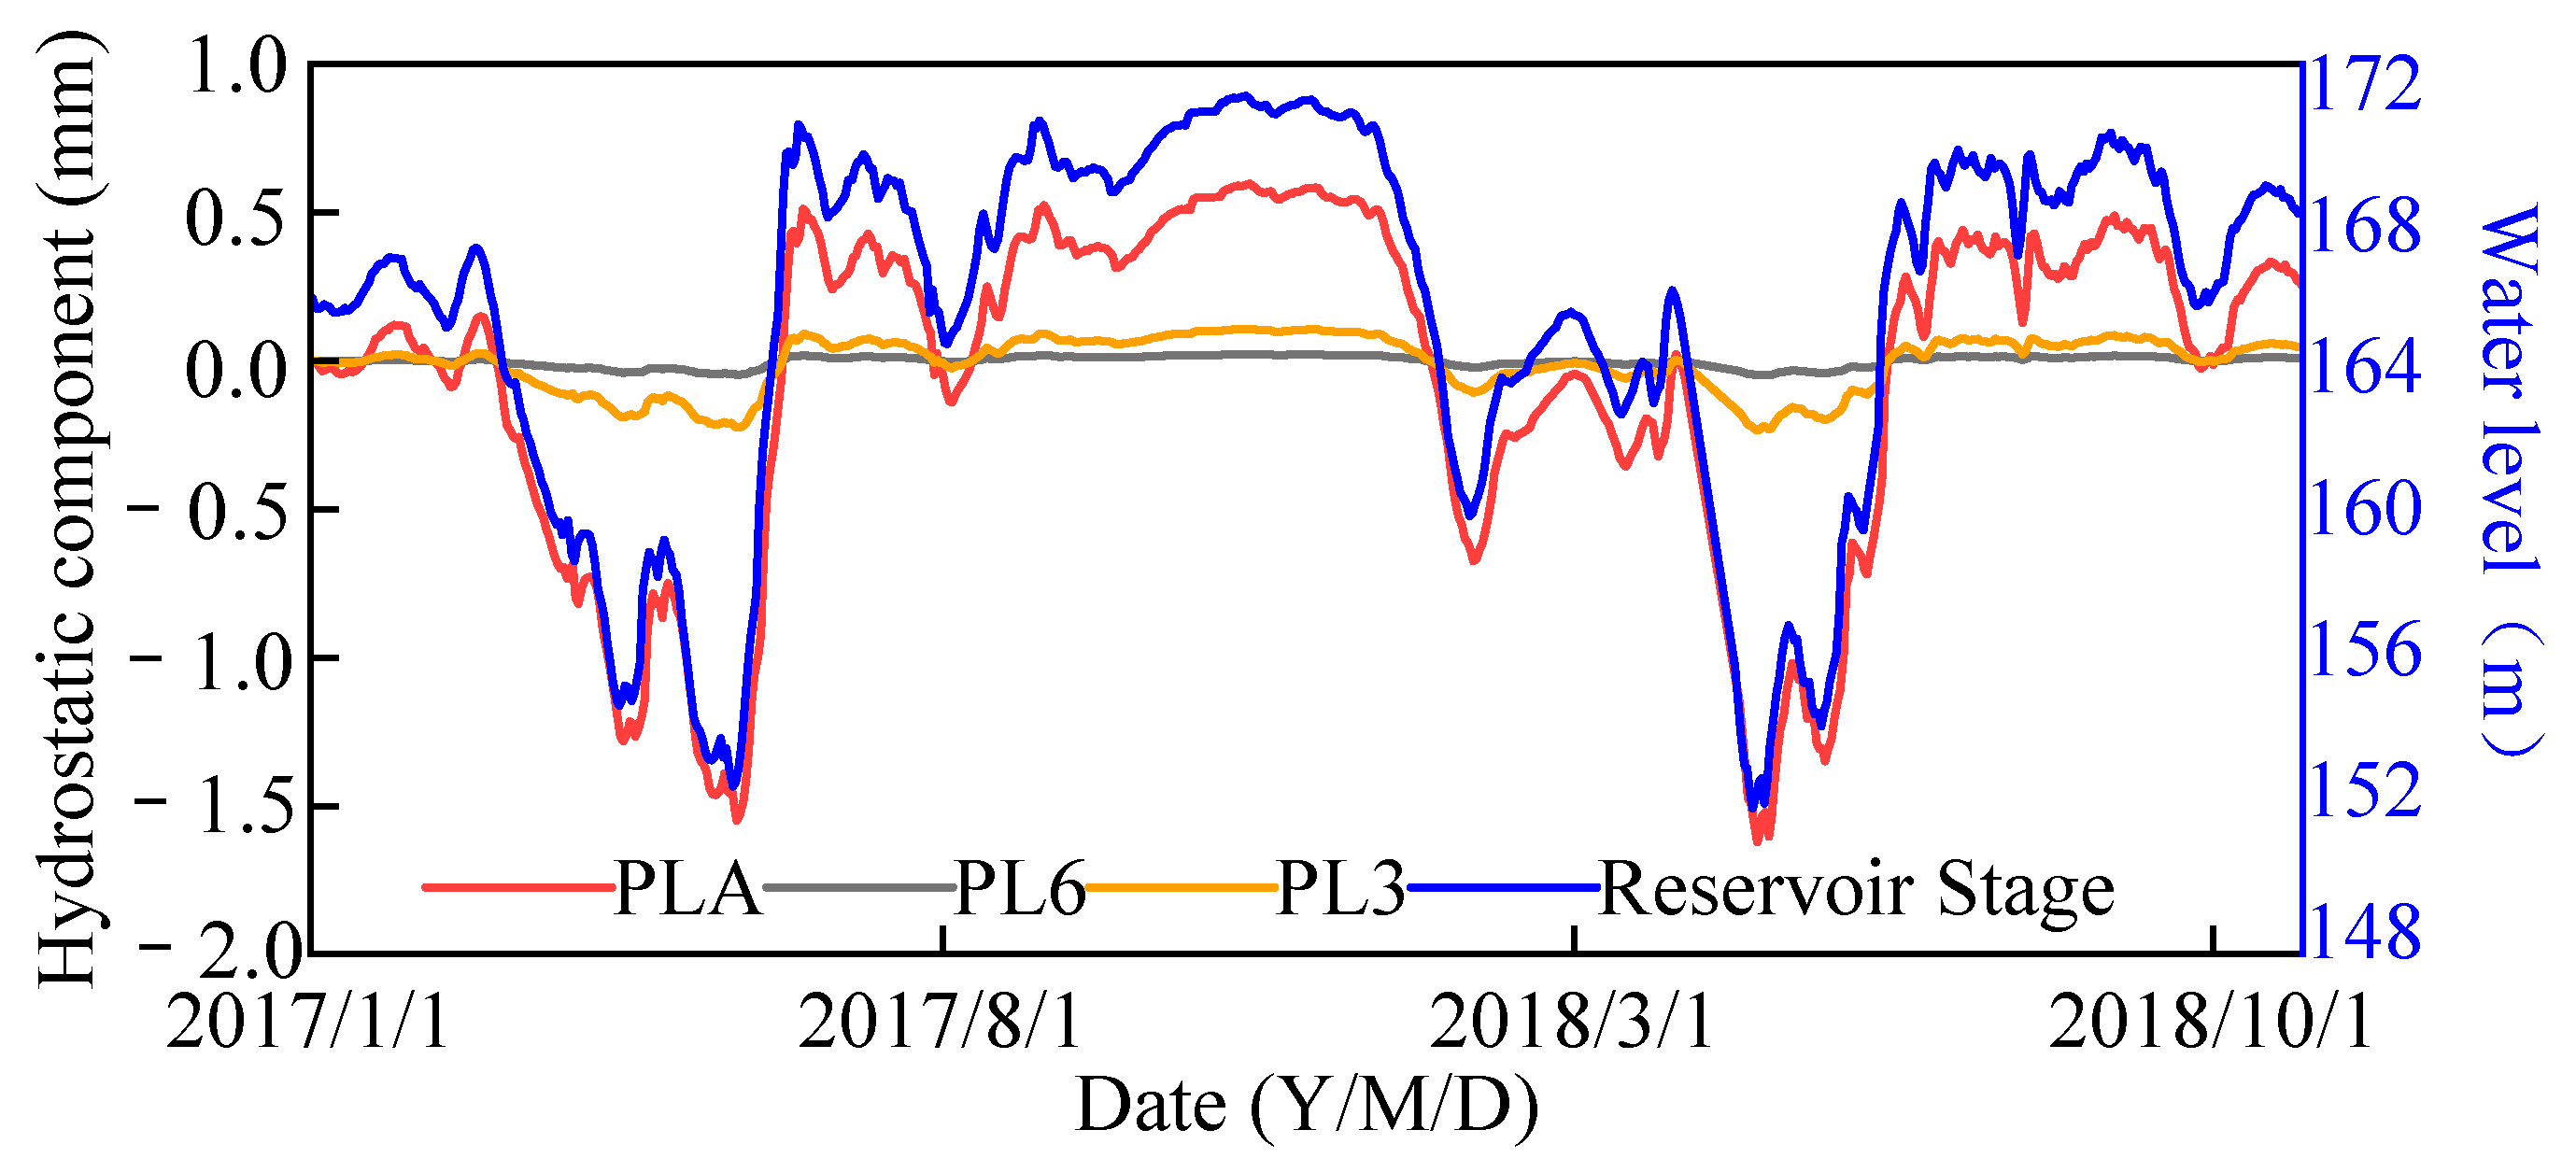
When establishing a hybrid multi-point deformation monitoring model for the concrete dam, the hydrostatic component under measured water pressure loads must be calculated using the FEM. For this purpose, this study defines the seepage, stress, and displacement boundary conditions for the 3D finite element model of Block No. 5. The seepage boundaries are set as follows: constant-head boundaries are applied to the regions below the upstream and downstream water levels; a mixed boundary condition accounting for potential seepage face is applied to the downstream surface of the dam; and all other boundaries are treated as impermeable. For stress boundaries, the model incorporates the downward load due to the self-weight of the gravity dam and the uniformly distributed load from the reservoir water acting on the dam foundation. In terms of displacement constraints, the bottom boundary is fully fixed, while the left/right banks and upstream/downstream boundaries are assigned roller supports. According to the design document of the dam block, the elastic moduli of the dam body and foundation are set to 24.85 GPa and 11.97 GPa, respectively [36]. Furthermore, as shown in Figure 8, a triaxial stress–strain pre-loading step is applied prior to the hydrostatic component calculation to bring the dam into a steady state. The purpose of this step is to bring the finite element model to a state of geostatic stress equilibrium before calculating the deformation field induced by hydraulic loading. This approach better reflects the actual physical process and reduces the risk of non-convergence. Specifically, the stress and deformation of the dam-foundation system under its self-weight, without hydraulic loading, are first calculated. These results are then incorporated as the initial stress and deformation state in subsequent computational steps. The hydrostatic components at each monitoring point in the dam block, computed using the FEM, are presented in Figure 9.
As shown in Figure 9, the hydrostatic components at each monitoring point increase with rising water levels. Although the absolute value of the hydrostatic component at point PL3 is relatively small, its variation trend still exhibits a clear positive correlation with the water level. This phenomenon indicates that the simulated hydrostatic components are consistent with the variation pattern of the reservoir water level, which aligns with the general principles of structural mechanics. The finite element calculation results are fitted using the polynomial expression of the hydrostatic component in the multi-point hybrid model, as shown in Equation (12). The resulting expression is as follows:
d H = 5.20635 + 5.85 × 10 9 H 3 z 1.84 × 10 8 H 2 z 2 + 1.01 × 10 7 H z 3
where z is the height of points.

4.2. Construction of the Data–Physics-Driven Multi-Point Hybrid Deformation Monitoring Model Based on BOA-LightGBM

After preparing the set of explanatory variables according to Equation (7), the multi-point hybrid model is constructed using the proposed BOA-LightGBM method to predict the spatial deformation field of the concrete dam. In this study, the LightGBM algorithm involves five hyperparameters. When utilizing the Bayesian optimization algorithm to find the best set of these hyperparameters, the maximum number of iterations for the BOA is set to 50. The selected parameter search ranges and the optimized hyperparameter combination are presented in Table 1. This study employe the LightGBM library in the Python 3.12.2 environment to train and validate the proposed model. To mitigate the risk of overfitting, a five-fold cross-validation via the sklearn library was employed during the training process, coupled with the application of the early stopping method, in addition to the use of BOA for the hyperparameter tuning mentioned above.
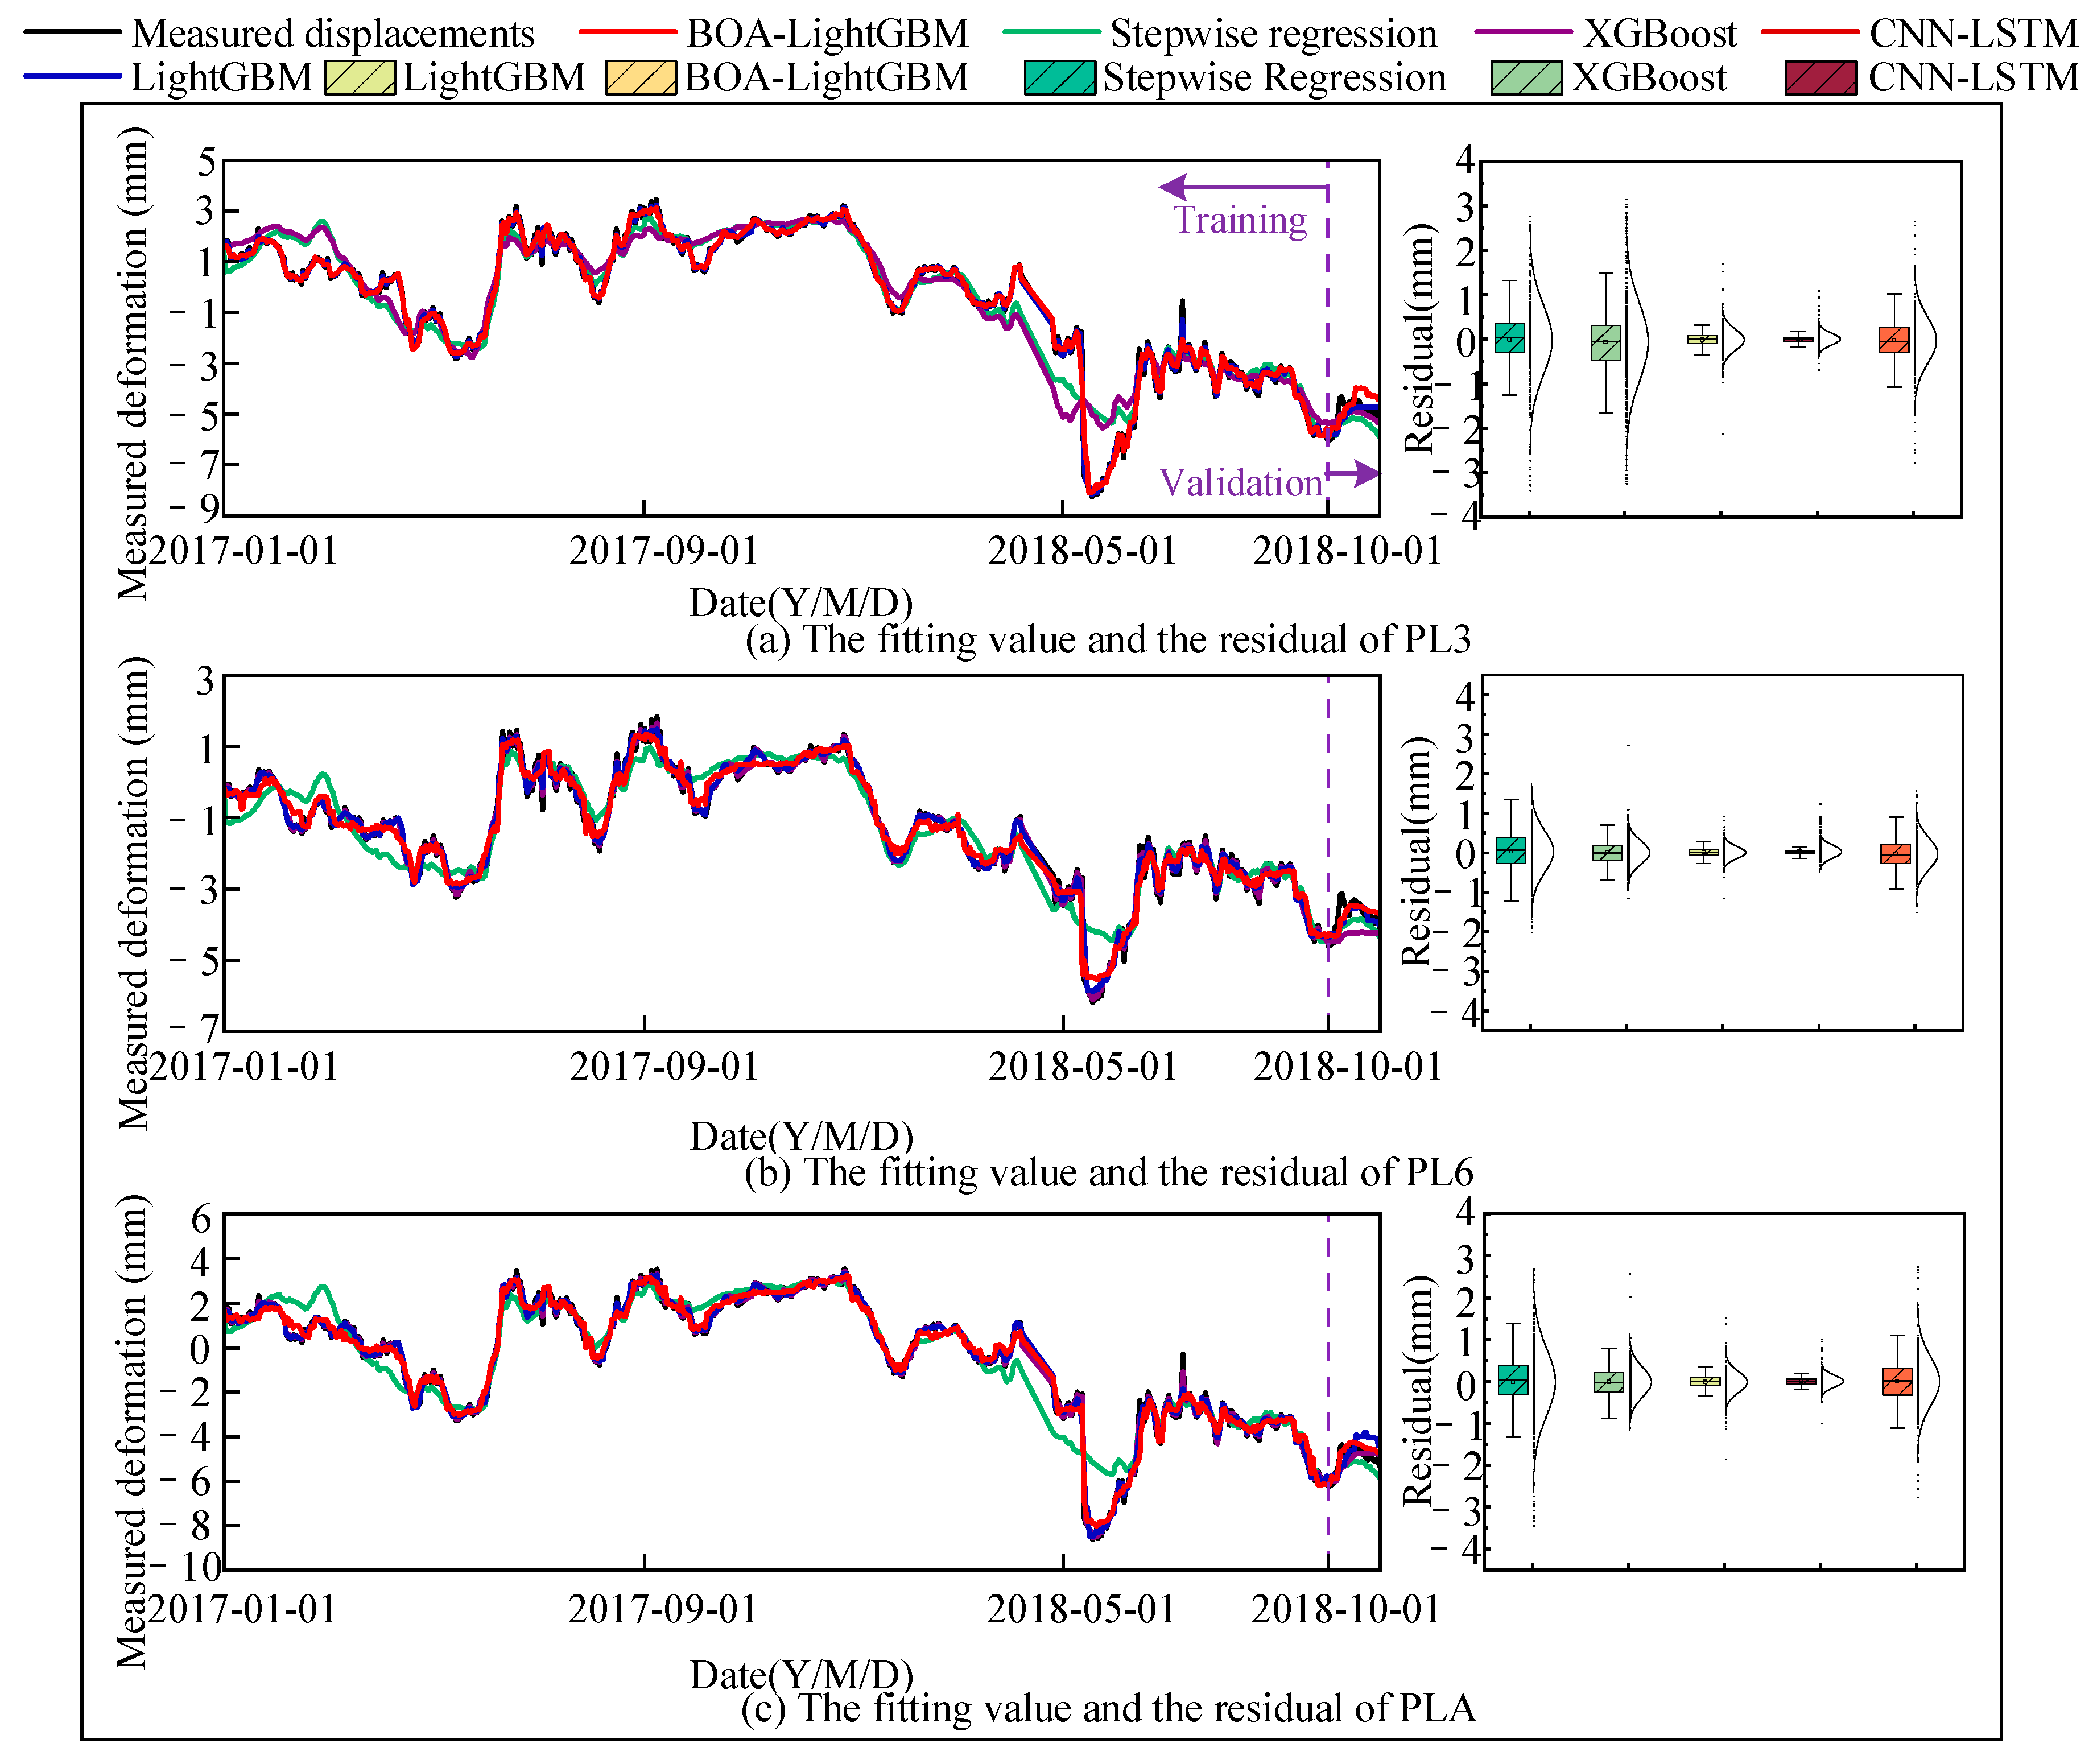
To validate the effectiveness of the proposed BOA-LightGBM method in constructing the hybrid multi-point deformation monitoring model for the concrete gravity dam, this study also developed and compared four alternative models for the same dam section: a standard LightGBM model, an XGBoost model, a CNN-LSTM model, and a stepwise regression model. The fitting performance and residual distributions of the five deformation prediction models are illustrated in Figure 10. To quantitatively assess the accuracy of these models, the following evaluation metrics were computed for the fitting results at each monitoring point: coefficient of determination (R2), mean absolute error (MAE), mean square error (MSE), and mean absolute percentage error (MAPE). The corresponding values of these metrics are summarized in Table 2.
In Figure 10, it can be found that the predicted deformation values from the five models at each monitoring point are all close to the measured values and exhibit generally consistent variation trends, indicating that the proposed model can reasonably reflect the overall deformation behavior of the dam. Among them, the values fitted by the BOA-LightGBM model show the best agreement with the actual measurements, with a concentrated residual distribution and a small mean residual error. In contrast, the stepwise regression model yields the largest fitting deviations, while the performances of the LightGBM, XGBoost, and CNN-LSTM models lie between these two extremes. Furthermore, the statistical metrics presented in Table 2 support this conclusion. The BOA-LightGBM model achieves a coefficient of determination (R2) closer to 1, while its MAE, MSE, and MAPE values are all lower than those of the other models.
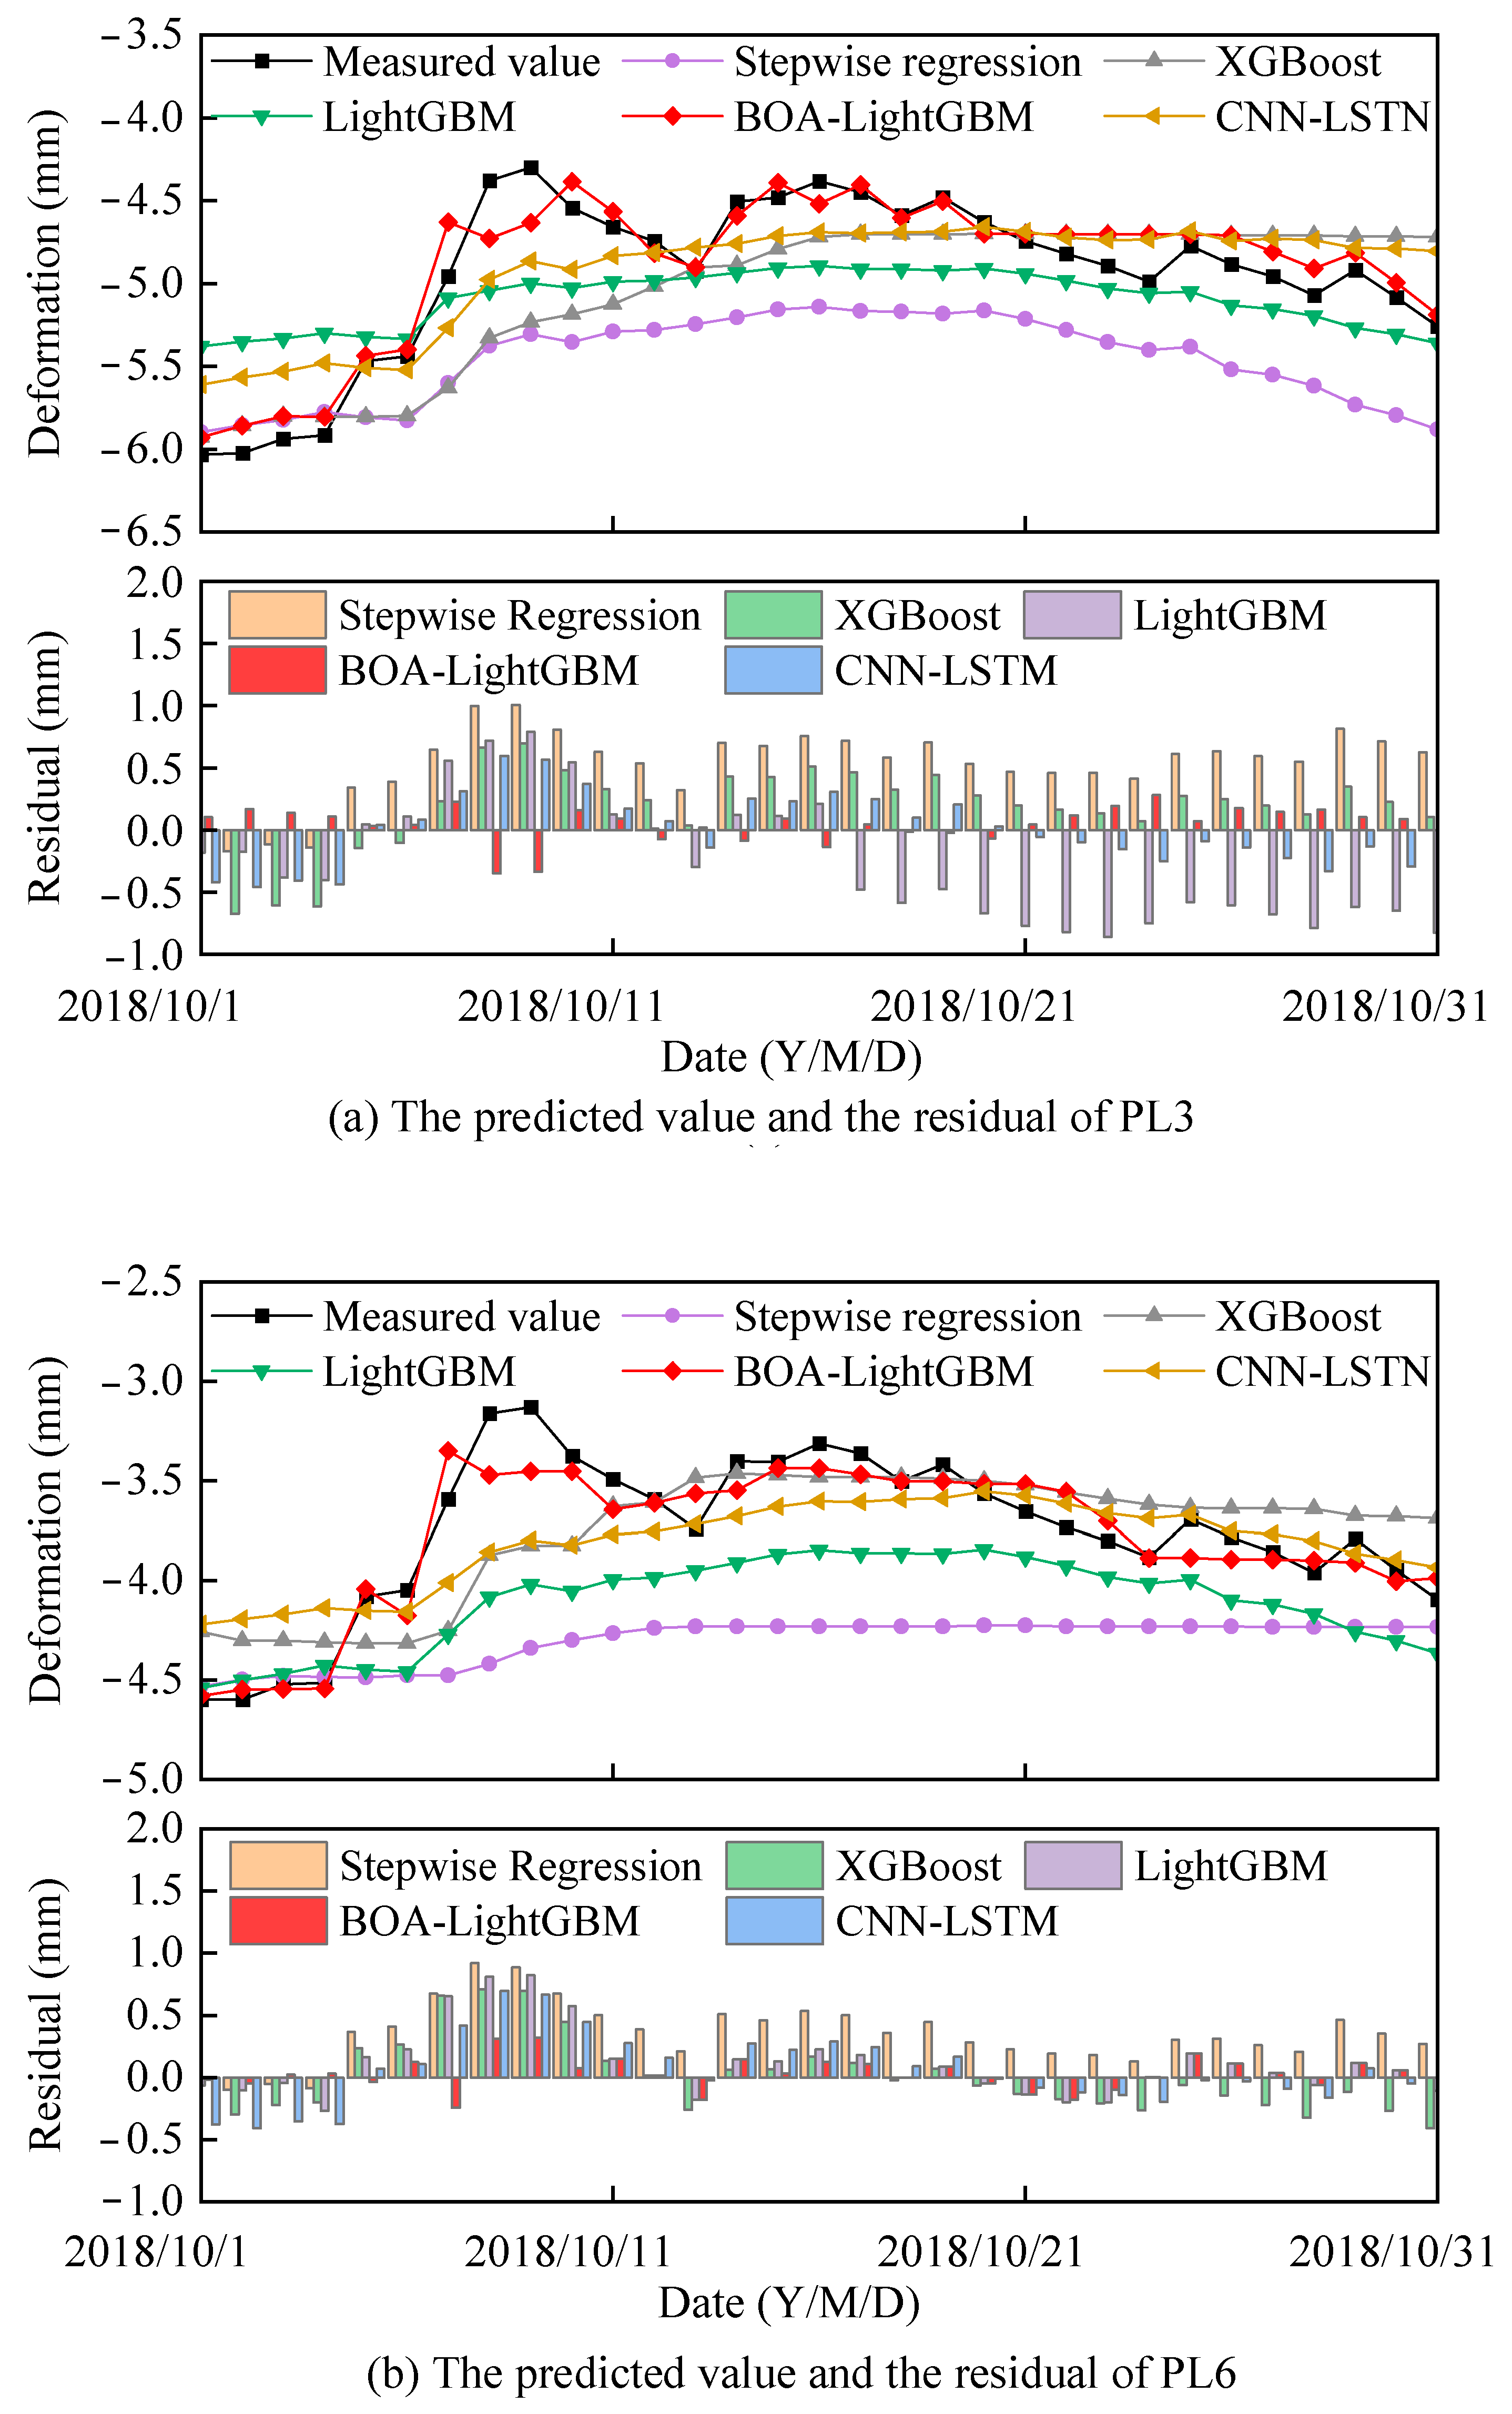
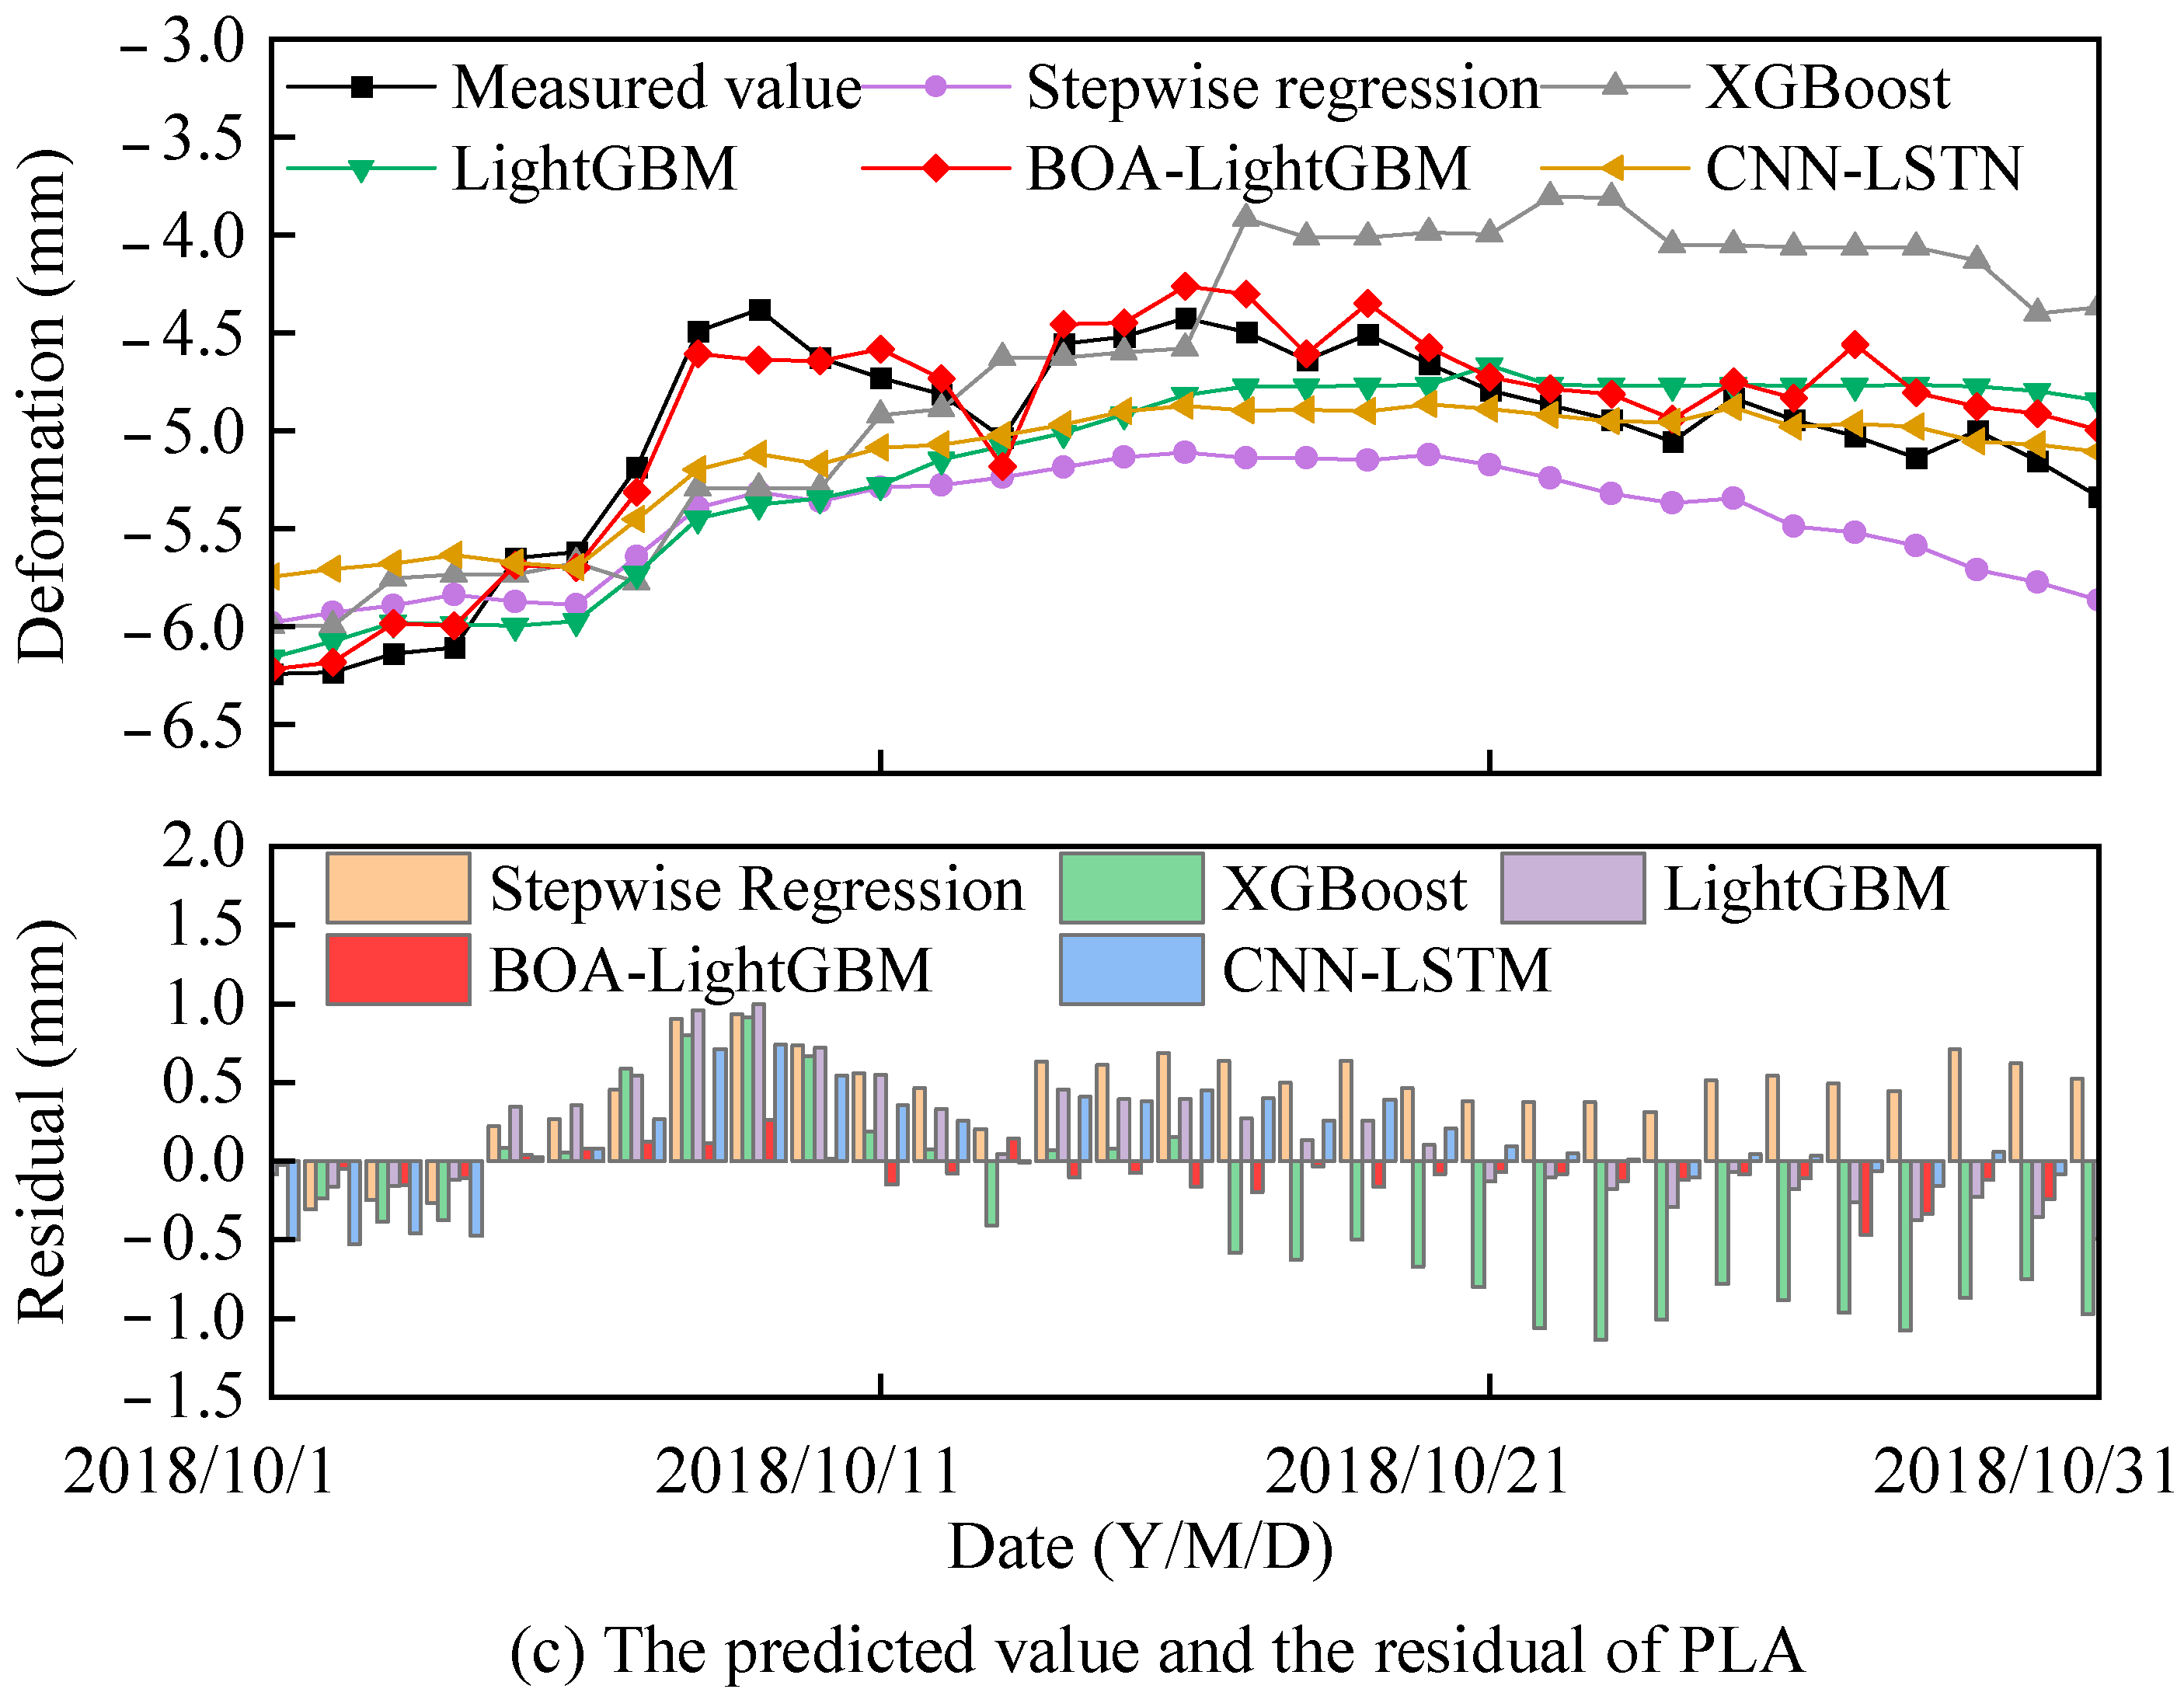
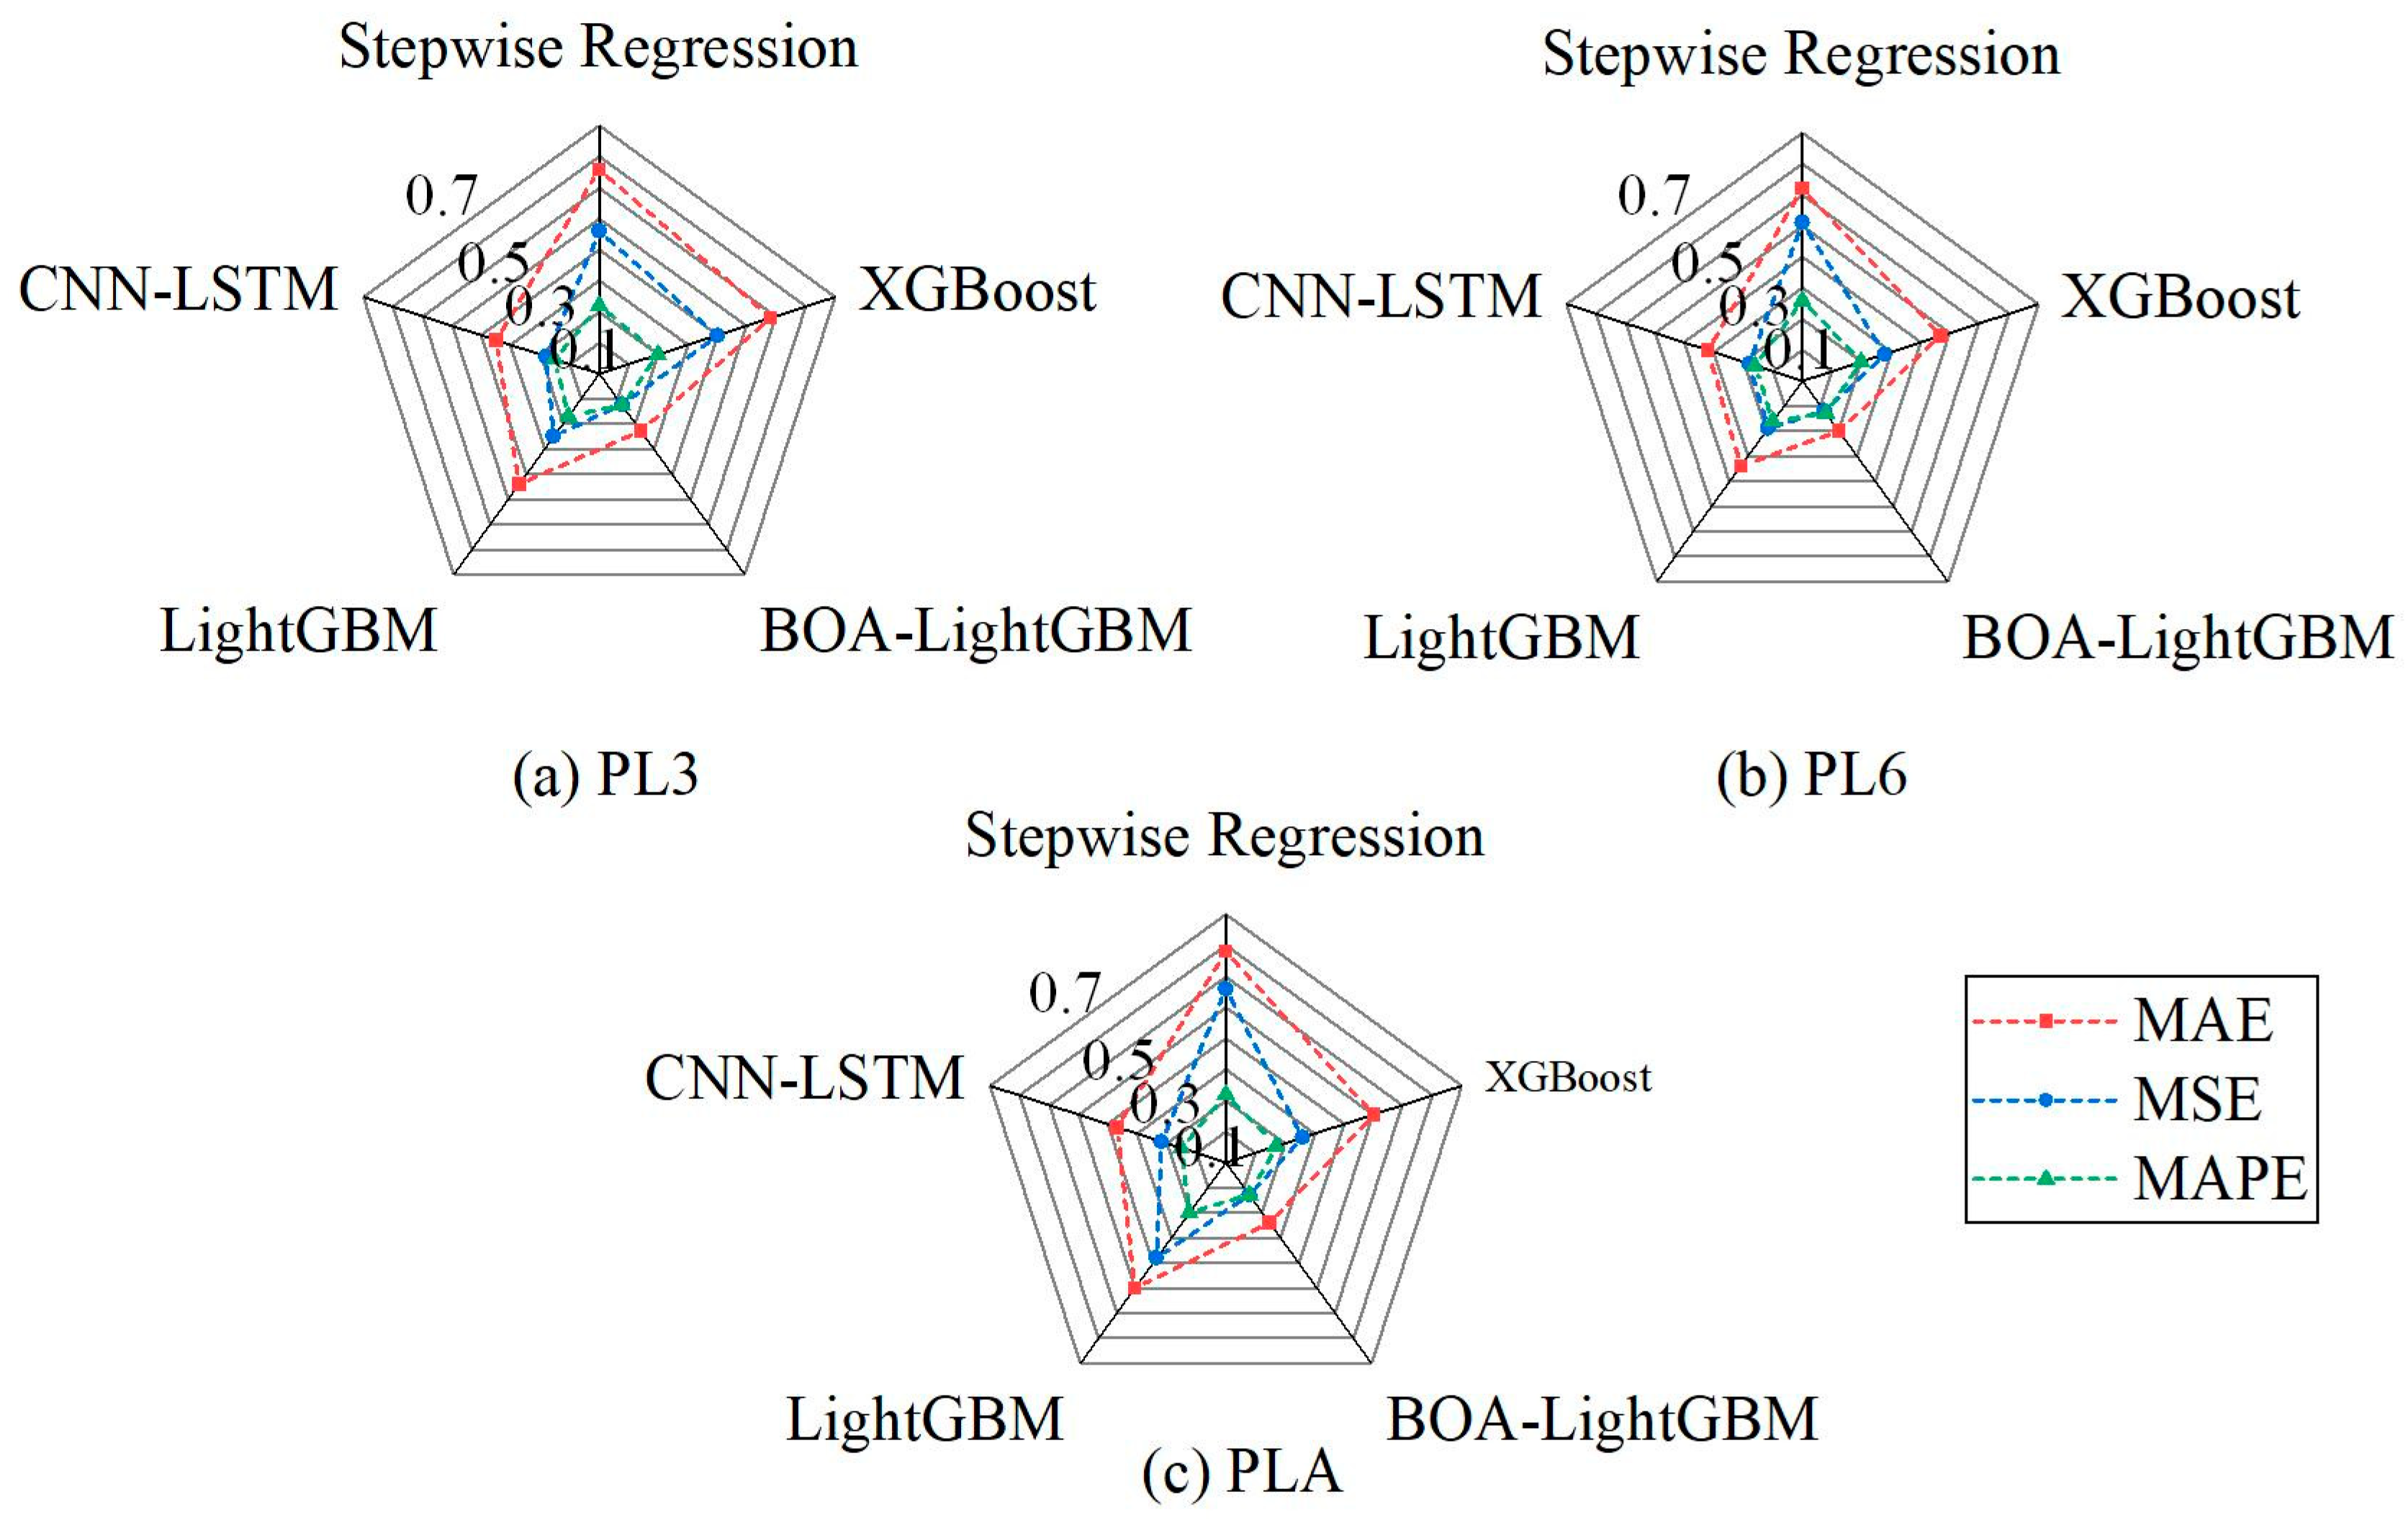
The prediction results of the five hybrid multi-point deformation monitoring models are shown in Figure 11, which displays the predicted horizontal deformation of the dam during the last month of the dataset. The statistical metrics of each model on the prediction set are plotted in Figure 12. In Figure 11 and Figure 12, the proposed BOA-LightGBM model performs best on the prediction set, with the smallest prediction errors, enabling more accurate forecasting and analysis of the dam’s future service behavior. Although XGBoost, LightGBM, and CNN-LSTM do not perform as well as BOA-LightGBM, they still outperform the traditional stepwise regression model. Furthermore, a comparison between the statistical metrics in Table 2 and Figure 12 indicates that the constructed models exhibit similar performance on both the training and prediction sets, with no signs of overfitting or underfitting.
A comprehensive comparison of the performance of each model demonstrates that the BOA-LightGBM model can more effectively and simultaneously predict multi-point deformations of concrete dams, making it suitable for modeling and analyzing the spatial deformation field of dam structures. This conclusion not only verifies the effectiveness of the BOA-LightGBM model in capturing the complex nonlinear relationships between dam deformation and influencing factors, but also further validates the rationality of the proposed data–physics-driven multi-point hybrid deformation monitoring model for concrete gravity dams in representing the overall structural behavior of the dam.

5. Conclusions

To solve the issues of multicollinearity and ill-conditioned matrix issues present in single monitoring models, this study integrates a multi-point hybrid deformation monitoring model with the BOA-LightGBM algorithm, establishing a data–physics-driven hybrid deformation monitoring model for multi-point prediction in concrete gravity dams. Through the analysis of engineering cases, the following conclusions have been substantiated:
(1)
The proposed hybrid multi-point deformation monitoring model incorporates spatial coordinates and FEM-assisted components, effectively capturing spatial correlations of dam deformation. Combined with BOA-LightGBM, it achieves accurate representation of nonlinear relationships, significantly enhancing fitting and prediction performance.
(2)
Compared with four conventional models, the proposed approach demonstrates superior adaptability without overfitting or underfitting. It improves fitting accuracy by up to 43% and prediction accuracy by 27%, outperforming stepwise regression, LightGBM, XGBoost, and CNN-LSTM models.
(3)
The multi-point deformation predictions align well with prototype monitoring data from the concrete dam, significantly enhancing the reliability of simultaneous deformation predictions at multiple points and providing a scientific basis for evaluating the structural performance of the dam. With appropriate improvements and extensions, the modeling theory and methodology proposed in this study can also serve as a valuable reference for safety monitoring of other hydrostatic structures.

Author Contributions

Conceptualization, Y.H.; methodology, L.S.; software, L.S. and Y.H.; validation, Y.H.; formal analysis, Y.H.; investigation, Y.H.; resources, Y.H.; data curation, L.S. and Y.H.; writing—original draft preparation, L.S. and Y.H.; writing—review and editing, L.S. and Y.H.; supervision, Y.H.; project administration, Y.H.; funding acquisition, Y.H. All authors have read and agreed to the published version of the manuscript.

Funding

This study was supported by the National Natural Science Foundation of China (No. 52469022), the Jiangxi Provincial Natural Science Foundation (No. 20242BAB20239), and the Science and Technology Projects of the Jiangxi Provincial Department of Water Resources, China (Nos. 202425YBKT24, 202425YBKT27, 202527ZDKT25).

Data Availability Statement

Dataset available on request from the authors.

Conflicts of Interest

The authors declare no conflicts of interest.

References

  1. Gu, C.S.; Li, Y.; Song, J.X. Study on safety monitoring model for deformation of RCCD. Chin. J. Comput. Mech. 2010, 27, 286–290. [Google Scholar]
  2. Yu, S.Y.; Sun, Z.H.; Yu, J.; Yang, J.; Zhu, C.H. An improved meshless method for modeling the mesoscale cracking processes of concrete containing random aggregates and initial defects. Constr. Build. Mater. 2023, 363, 129770. [Google Scholar] [CrossRef]
  3. Wu, Z.R. Deterministic model and hybrid model for safety monitoring of concrete dams. J. Hydrostatic Eng. 1989, 05, 64–70. [Google Scholar]
  4. Wang, S.; Gu, C.; Liu, Y.; Wu, B.B. Displacement observation data-based structural health monitoring of concrete dams: A state-of-art review. Structures 2024, 68, 107072. [Google Scholar] [CrossRef]
  5. Ren, D.J.; Gao, M.J.; Li, G.G. Application of mixing model in deformation analysis of dam. Water Conserv. Sci. Technol. Econ. 2008, 1, 29–30. [Google Scholar]
  6. Wei, B.W.; Yuan, D.Y.; Xu, Z.K.; Li, L.H. Modified hybrid forecast model considering chaotic residual errors for dam deformation. Struct. Control Health Monit. 2018, 25, e2188. [Google Scholar] [CrossRef]
  7. Zhang, S.; Yang, Y.T.; Yang, Y. GNSS signal extraction using CEEMDAN-WPD for deformation monitoring of ropeway pillars. Remote Sens. 2025, 17, 224. [Google Scholar] [CrossRef]
  8. Xu, L.Y.; Shi, S.M.; Bao, Y. Corrosion monitoring and assessment of steel under impact loads using discrete and distributed fiber optic sensors. Opt. Laser Technol. 2024, 174, 110553. [Google Scholar] [CrossRef]
  9. Li, Y.X.; Yang, K.M.; Ding, X.M. Research on time series InSAR monitoring method for multiple types of surface deformation in mining area. Nat. Hazards 2022, 114, 2479–2508. [Google Scholar] [CrossRef]
  10. Gu, C.S.; Fu, X.; Shao, C.F.; Shi, Z.W.; Su, H.Z. Application of spatiotemporal hybrid model of deformation in safety monitoring of high arch dams: A case study. Int. J. Environ. Res. Public Health 2020, 17, 319. [Google Scholar] [CrossRef]
  11. Yang, G.; Gu, H.; Chen, X.; Zhao, K.; Qiao, D.; Chen, X. Hybrid hydrostatic-seasonal-time model for predicting the deformation behaviour of high concrete dams during the operational period. Struct. Control. Health Monit. 2021, 28, e2685. [Google Scholar] [CrossRef]
  12. Feng, Y.Q.; Chen, W.Y.; Tao, C.C.; Wang, F. Application of ridge regression model to dam safety monitoring based on genetic algorithm. Water Resour. Power 2010, 28, 51–52. [Google Scholar]
  13. Wang, S.; Xu, Y.; Gu, C.; Xia, Q.; Hu, K. Two spatial association-considered mathematical models for diagnosing the long-term balanced relationship and short-term fluctuation of the deformation behaviour of high concrete arch dams. Struct. Health Monit.-Int. J. 2020, 19, 1421–1439. [Google Scholar] [CrossRef]
  14. Yang, H.; Yue, J.P.; Xing, Y.; Zhou, Q.K. Research on dam deformation prediction based on deep fully connected neural network. J. Geod. Geodyn. 2021, 41, 162–166. [Google Scholar]
  15. Wei, B.W.; Yuan, D.Y.; Xie, B.; Chen, L.J. Chicken swarm optimization algorithm used optimization of relevance vector machine model for concrete dam deformation prediction. Water Resour. Hydropower Eng. 2020, 51, 98–105. [Google Scholar]
  16. Zhang, Y.; Zhong, W.; Li, Y.; Wen, L. A deep learning prediction model of DenseNet-LSTM for concrete gravity dam deformation based on feature selection. Eng. Struct. 2023, 295, 116827. [Google Scholar] [CrossRef]
  17. Kao, C.Y.; Loh, C.H. Monitoring of long-term static deformation data of Fei-Tsui arch dam using artificial neural network-based approaches. Struct. Control. Health Monit. 2013, 20, 282–303. [Google Scholar] [CrossRef]
  18. Wei, B.W.; Liu, B.; Xu, F.G.; Li, H.K.; Mao, Y. Multi-point hybrid model based on PSO-SVM for concrete arch dam deformation monitoring. Geomat. Inf. Sci. Wuhan Univ. 2023, 48, 396–407. [Google Scholar]
  19. Wang, R.J.; Bao, T.F.; Li, Y.T.; Song, B.G.; Xiang, Z.Y. Combined prediction model of dam deformation based on multi-factor fusion and stacking ensemble learning. J. Hydrostatic Eng. 2023, 54, 497–506. [Google Scholar]
  20. Huang, L.; Chen, J.; Tan, X. BP-ANN based bond strength prediction for FRP reinforced concrete at high temperature. Eng. Struct. 2022, 257, 114026. [Google Scholar] [CrossRef]
  21. Zhang, J.; Xie, J.; Zhang, T.; Lu, B.; Zheng, D.; Zhou, H. A prediction method for oblique load stability of multi-cell tubes based on SVM. Eng. Struct. 2023, 283, 115885. [Google Scholar] [CrossRef]
  22. Wu, Z.M.; Hu, X.C. Algorithm optimization of credit risk control model based on Lightgbm. Comput. Appl. Softw. 2022, 39, 342–349. [Google Scholar]
  23. Zhao, B.; Li, B.; Zhang, J.; Cao, W.; Gao, Y. DCLGM: Fusion recommendation model based on LightGBM and deep learning. Neural Process. Lett. 2024, 56, 17. [Google Scholar] [CrossRef]
  24. Wu, Z.R. Safety Monitoring Theory and Its Application of Hydrostatic Structures; Higher Education: Beijing, China, 2003. (In Chinese) [Google Scholar]
  25. Li, S.P.; Zhang, B.; Liu, Z.Q. A new prediction model of dam deformation and successful application. Buildings 2025, 15, 818. [Google Scholar] [CrossRef]
  26. Cao, W.H.; Wen, Z.P.; Su, H.Z. Spatiotemporal clustering analysis and zonal prediction model for deformation behavior of super-high arch dams. Expert Syst. Appl. 2023, 216, 119464. [Google Scholar] [CrossRef]
  27. Shi, Y.Q.; Cheng, L.; Xu, W.; He, J.P. Multiple observation points fusion diagnosis model of dam deformation based on multrscale theory and wavelet entropy. Water Resour. Power 2013, 31, 95–98. [Google Scholar]
  28. Yao, K.; Wen, Z.; Yang, L.; Chen, J.; Hou, H.; Su, H. A multipoint prediction model for nonlinear displacement of concrete dam. Comput.-Aided Civ. Infrastruct. Eng. 2022, 37, 1932–1952. [Google Scholar] [CrossRef]
  29. Ke, G.; Meng, Q.; Finley, T.; Wang, T.; Chen, W.; Ma, W.; Ye, Q.; Liu, T.Y. Lightgbm: A highly efficient gradient boosting decision tree. In Proceedings of the 31st International Conference on Neural Information Processing Systems, Long Beach, CA, USA, 4–9 December 2017; pp. 3149–3157. [Google Scholar]
  30. Xie, Y. Prediction of Medical Service Waiting-Time Based on Ensemble Learning Algorithm. Master’s Thesis, Ningbo University, Ningbo, China, 2022. [Google Scholar]
  31. Tang, M.; Zhao, Q.; Ding, S.X.; Wu, H.; Li, L.; Long, W.; Huang, B. An improved LightGBM algorithm for online fault detection of wind turbine gearboxes. Energies 2020, 13, 807. [Google Scholar] [CrossRef]
  32. Gao, Z.X.; Bao, T.F.; Li, Y.T.; Wang, Y.B. Dam deformation prediction model based on bayesian optimization and LightGBM. J. Chang. River Sci. Res. Inst. 2021, 38, 46–50. [Google Scholar]
  33. Tang, M.; Meng, C.; Wu, H.; Zhu, H.; Yi, J.; Tang, J.; Wang, Y. Fault detection for wind turbine blade bolts based on GSG combined with CS-LightGBM. Sensors 2022, 22, 6763. [Google Scholar] [CrossRef]
  34. Liang, J.; Bu, Y.; Tan, K.; Pan, J.; Yi, Z.; Kong, X.; Fan, Z. Estimation of stellar atmospheric parameters with light gradient boosting machine algorithm and principal component analysis. Astron. J. 2022, 163, 153. [Google Scholar] [CrossRef]
  35. Cui, J.X.; Yang, B. Survey on Bayesian optimization methodology and applications. J. Softw. 2018, 29, 3068–3090. [Google Scholar]
  36. Wei, B.W.; Wan, X.; Xu, F.G.; Guo, Y.J. Fast inversion method of composite elastic modulus concrete gravity dam based on SBFEM and PSO-LSSVM. J. Basic Sci. Eng. 2023, 31, 894–905. [Google Scholar]
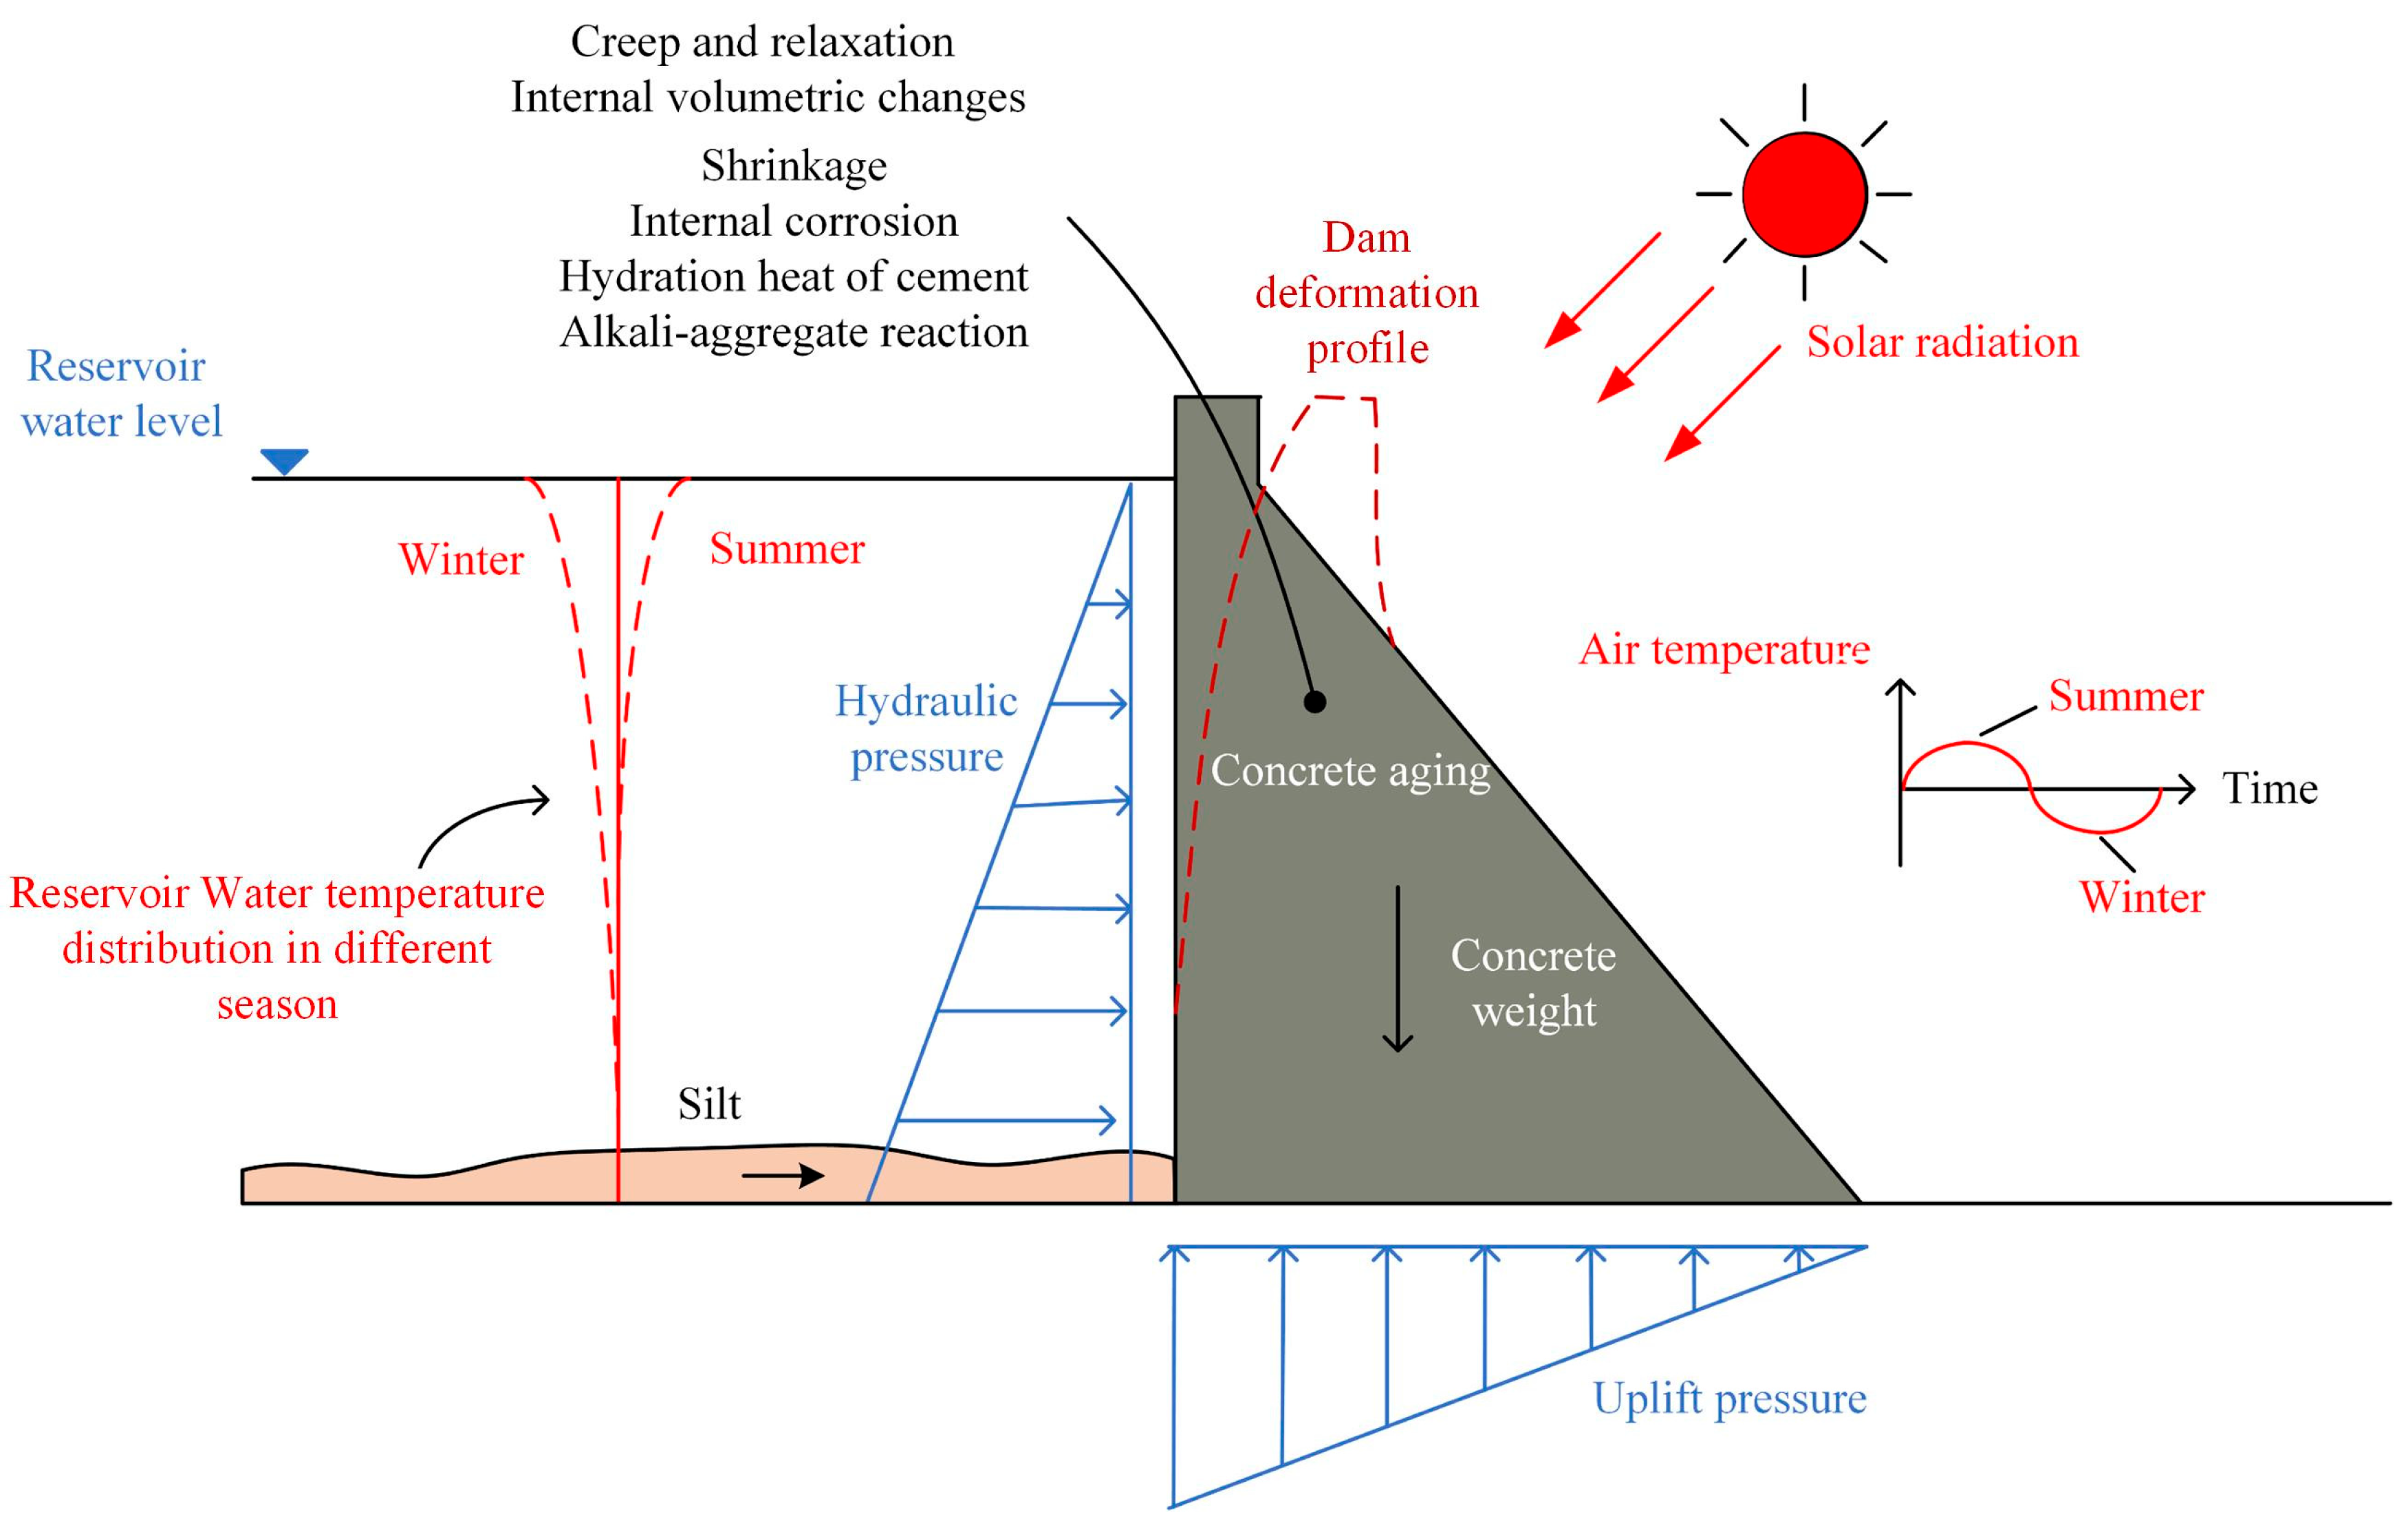
Figure 1. Deformation mechanism diagram of concrete gravity dam.
Water 17 02926 g001
Figure 2. The histogram algorithm.
Water 17 02926 g002
Figure 3. Schematic representation of the leaf growth strategy.
Water 17 02926 g003
Figure 4. The realization process of constructing the data–physics-driven multi-point hybrid deformation monitoring model for concrete gravity dams.
Water 17 02926 g004
Figure 5. Layout of vertical lines.
Water 17 02926 g005
Figure 6. Time series of horizontal deformations and the environmental factors.
Water 17 02926 g006
Figure 7. Finite element model of 5# dam section.
Water 17 02926 g007
Figure 8. Stress strains are pre-applied to achieve in situ stress balance.
Water 17 02926 g008
Figure 9. Hydrostatic components calculated by FEM.
Water 17 02926 g009
Figure 10. The fitting performance and the residual distribution.
Water 17 02926 g010
Figure 11. Radial deformation prediction process line.
Water 17 02926 g011aWater 17 02926 g011b
Figure 12. Radar plot of statistical metrics for deformation prediction.
Water 17 02926 g012
Table 1. Determination of LightGBM hyperparameters.
HyperparametersRangeOptimized Value
Max_depth(4, 40)33
Num_leaves(5, 130)103
Min_data_in_leaf(5, 30)20
Feature_fraction(0.7, 1.0)0.72
Bagging_fraction(0.7, 1.0)0.72
Table 2. Statistical index of each model in the fitting set.
Statistical IndexPL3PL6PLA
Stepwise regressionMAE/mm0.530.410.55
MSE/mm0.640.290.67
MAPE0.940.780.75
R20.910.890.91
XGBoostMAE/mm0.230.220.27
MSE/mm0.270.090.13
MAPE0.410.400.31
R20.930.970.93
LightGBMMAE/mm0.120.100.13
MSE/mm0.040.020.04
MAPE0.200.150.13
R20.950.980.95
BOA-LightGBMMAE/mm0.070.060.07
MSE/mm0.010.010.01
MAPE0.110.090.08
R20.990.990.99
CNN-LSTMMAE/mm0.400.320.39
MSE/mm0.340.190.35
MAPE0.580.460.41
R20.950.930.95
Disclaimer/Publisher’s Note: The statements, opinions and data contained in all publications are solely those of the individual author(s) and contributor(s) and not of MDPI and/or the editor(s). MDPI and/or the editor(s) disclaim responsibility for any injury to people or property resulting from any ideas, methods, instructions or products referred to in the content.