Abstract
Groundwater chemical composition often exhibits complex characteristics under the combined influence of anthropogenic activities and natural geological conditions. Accurately distinguishing between human-derived and naturally occurring constituents is crucial for formulating effective pollution control strategies and ensuring sustainable groundwater resource management. However, conventional hydrogeochemical analytical methods often face challenges in quantitatively differentiating these overlapping influences. In this study, 66 groundwater samples were collected from the midstream section of the Dawen River Basin, an area subject to significant anthropogenic pressure. An integrated approach combining hydrogeochemical analysis, Self-Organizing Map (SOM) clustering, and Positive Matrix Factorization (PMF) receptor modeling was employed to identify sources of chemical constituents and quantify the proportional contributions of various factors. The results indicate that: (1) The predominant groundwater types in the study area were Cl·SO4·Ca. (2) SOM clustering classified the groundwater samples into five distinct groups, each reflecting a dominant influence: (i) natural geological processes—samples distributed within the central geological mining area; (ii) agricultural activities—samples located in intensively cultivated zones along both banks of the Dawen River; (iii) hydrogeochemical evolution—samples concentrated in areas with impermeable surfaces on the eastern and western sides of the study region; (iv) mining operations—samples predominantly found in industrial zones at the periphery; (v) domestic wastewater discharge—samples scattered relatively uniformly throughout the area. (3) PMF results demonstrated that natural geological conditions constituted the largest contribution (29.0%), followed by agricultural activities (26.8%), consistent with the region’s extensive farming practices. Additional contributions arose from water–rock interactions (23.9%), mining operations (13.6%), and domestic wastewater (6.7%). This study establishes a methodological framework for quantitatively assessing natural and anthropogenic impacts on groundwater quality, thereby providing a scientific basis for the development of protection measures and sustainable management strategies for regional groundwater resources.
1. Introduction
Groundwater is an irreplaceable component of the global hydrological cycle [1] and is vital for agricultural irrigation [2], industrial production [3], and domestic water supply. Its quality significantly affects human health [4] and is closely linked to food security [5], drinking water availability, socioeconomic stability, and ecosystem sustainability [6]. The chemical composition of groundwater systems stems primarily from water–rock interactions and anthropogenic activities [7]. Intensive human interventions, rapid urbanization, large-scale land use changes, and aquifer overexploitation have significantly modified original hydrogeological environments [8], resulting in increasingly complex geochemical signatures characterized by altered ion exchange processes, enhanced solute transport, and shifted redox conditions [9]. Identifying the distinct impacts on groundwater chemistry is essential for elucidating pollution mechanisms, predicting evolutionary trends, and implementing targeted control measures—all critical for ensuring water security, ecosystem protection, and sustainable development. However, conventional hydrogeochemical methods often face challenges in quantitatively distinguishing natural geogenic processes from anthropogenic influences [10]. These limitations stem from their reliance on static geochemical indicators, which frequently fail to capture dynamic interactions among aquifer properties, flow regimes, and land use changes [11]. Modern analytical frameworks should therefore integrate multi-proxy datasets—including isotopic tracers, machine learning algorithms, and reactive transport modeling—to decipher the complex natural-anthropogenic feedback mechanisms governing groundwater quality evolution [12].
Recent advances in computational technology and mathematical theory have facilitated the broader application of quantitative methods in water environment management [13]. Commonly used receptor models for source apportionment include Chemical Mass Balance (CMB), Principal Component Analysis (PCA), Absolute Principal Component Score-Multiple Linear Regression (APCS-MLR), Bayesian Isotope Mixing Models (MixSIAR), Backpropagation Neural Networks (BPNN), and Genetic Algorithms (GA). Among these, Bayesian isotope mixing models, artificial neural networks, and multivariate statistical methods are increasingly being applied to groundwater source identification. While MixSIAR models effectively quantify pollution source contributions and incorporate parameter uncertainty, their use in complex hydrogeological settings remains limited due to reliance on equilibrium assumptions [14]. Neural network approaches such as BPNN can capture nonlinear hydrochemical relationships but require extensive labeled datasets, are prone to overfitting under data-scarce conditions, and often suffer from computational inefficiency. PCA reduces data dimensionality [15] but used alone lacks the capacity for quantitative source apportionment [16]. Self-Organizing Map (SOM) and Positive Matrix Factorization (PMF) represent advanced data mining tools with wide applications in environmental science [17]. SOM enables visualization of high-dimensional data through unsupervised learning, while PMF decomposes mixed contributions without requiring pre-defined source profiles [18]. Although well-established in atmospheric and soil research, their utilization in groundwater studies remains relatively limited. Integrating machine learning with conventional hydrogeochemical approaches shows significant potential for developing more robust frameworks for source identification [19].
The midstream region of the Dawen River in Shandong Province represents a typical area with intensive agricultural and industrial activities, where groundwater quality is influenced by multiple natural and anthropogenic factors. These include long-term application of chemical fertilizers and pesticides, industrial effluent discharge, domestic wastewater infiltration, as well as natural processes such as local geological conditions and hydrogeochemical evolution [20]. The combined effects of these geogenic and anthropogenic inputs have led to progressively increasing concentrations of groundwater constituents, frequently resulting in non-compliance with water quality standards and posing significant risks to regional water resource security. This study aims to enhance the understanding of groundwater chemical characteristics and pollution sources through an integrated methodology that combines hydrochemical analysis, unsupervised machine learning, and PMF receptor modeling. The specific objectives include: (1) Characterize regional water chemistry and classify water types; (2) Identify sources of various components; (3) Quantify contributions from different sources—with the ultimate goal of supporting groundwater protection and promoting sustainable regional development.
2. Materials and Methods
2.1. Research Area Overview
The mid-stream basin of the Dawen River is situated in southern Shandong Province, downstream of the Yellow River [21], within the hilly terrain of the Yimeng Mountain area (Figure 1). The region experiences a warm temperate semi-humid monsoon climate, with mean annual temperatures ranging from 12 °C to 14 °C. Precipitation is highly seasonal, with approximately 80% of the annual average rainfall (673.0 mm) occurring between June and September, and higher accumulations observed in the upstream mountainous regions compared to the downstream plains. Geomorphologically, the basin is characterized by gently undulating topography and a well-developed river network, set within a geologically complex structural zone. Dominated by the Luzhong Uplift tectonic framework, the area includes secondary structural features such as the Feicheng Depression and Dongping Uplift, collectively forming a distinct basin-range system [22]. Land use is predominantly comprising suburban and rural residential areas interspersed with concentrated agricultural zones, contributing to significant groundwater contamination risks and presenting considerable challenges for water resource management [23].
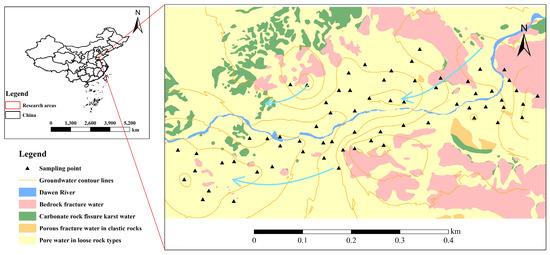
Figure 1.
Hydrological and geological overview of the study area and sampling point distribution map.
The study area is situated within a hydrogeological zone characterized by medium-low mountainous and hilly terrain underlain by carbonate rocks [24,25]. Based on predominant runoff pathways and tectonic attributes, the region is classified as part of the Juntun Fault-block Karst Water Unit, which belongs to the Feicheng–Yiyuan Monoclinal Fault Depression Hydrogeological Subzone. According to groundwater occurrence conditions, hydrophysical properties, and hydraulic characteristics, the aquifer system is categorized into four distinct types (Table 1):

Table 1.
Division and distribution of aquifer rock groups in the study area.
Fine sand, medium-coarse sand, and sandy gravel lithologies occur in ribbon-like distributions along the Dawen River and its tributary valleys, forming unconsolidated rock pore-water aquifers.
In the Dawenkou Basin and piedmont zones, lithologies including shale, sandstone, conglomerate, and limestone are exposed, with clastic rock pore-fissure water occurring sporadically within these formations.
Along the northern margins of fault-block uplifts and basin edges, monoclinal structures dominated by thick-bedded graywacke and pelitic graywacke host carbonate rock fissure-karst water.
Within basin margins and peripheral mountainous bedrock areas, lithologies such as amphibolite, granite, and gabbro contain concentrated bedrock fissure water.
This geological framework provides the hydrogeological basis for subsequent analysis of groundwater quality evolution and source apportionment in the region.
Groundwater recharge in the study area occurs mainly through infiltration of atmospheric precipitation and lateral inflow from bedrock mountainous areas, supplemented by river water infiltration and irrigation return flow. Under natural conditions, the direction of groundwater runoff generally corresponds to that of surface water, converging from the basin margins toward the intramontane basin, with eventual discharge into the main channel of the Dawen River. Upon reaching discharge zones, groundwater flow may be impeded by geological barriers such as aquitards or tectonic structures, resulting in natural discharge through spring systems or direct exfiltration into surface water bodies.
2.2. Data Sources and Processing
A total of 66 shallow groundwater wells, serving primarily agricultural irrigation and domestic supply, were systematically sampled throughout the mid-stream region of the Dawen River basin. The sampling point layout was designed with full consideration of the study area’s topography, hydrographic network distribution, groundwater flow direction, and geological structural characteristics. Sampling points are uniformly distributed and cover the entire study area.
Sample collection and pretreatment followed standard protocols to maintain integrity and minimize contamination. Strict quality control measures were implemented throughout the analytical process to ensure data reliability. This systematic approach provides a robust foundation for subsequent hydrochemical interpretation and source apportionment.
2.3. Methods
This study employs an integrated methodology combining conventional hydrochemical analysis with unsupervised machine learning to delineate the sources of groundwater chemical constituents in the study area. Groundwater chemical characteristics were characterized using Piper diagrams, Gibbs diagrams, and ion end-member diagrams to identify dominant hydrochemical facies and examine the controlling factors of key ions. Sample clustering was conducted using a Self-Organizing Map (SOM) neural network to qualitatively classify groundwater groups and identify potential pollutant sources. Subsequently, the Positive Matrix Factorization (PMF) model was applied to quantitatively assess characteristic groundwater pollutants, identify contributing source types, and resolve the apportionment of pollution sources across the sampled groundwater systems.
2.3.1. Traditional Water Chemistry Methods
Initially, statistical analysis was performed on the concentrations of major ions (Ca2+, Mg2+, Na+, K+, Sr, Ba, F−, Cl−, SO42−, HCO3−, NO2−, NO3−), as well as total hardness (TH), total dissolved solids (TDS), chemical oxygen demand (CODMn), and pH. Based on statistical characteristics—such as minimum and maximum values, coefficient of variation, and other descriptors—a preliminary assessment of groundwater chemical properties was conducted to determine the hydrochemical type prevailing in the study area.
2.3.2. Analysis and Classification of Groundwater Chemical Composition
Analysis of groundwater chemical composition and source apportionment facilitates the evaluation of water quality status, identification of chemical species and their concentrations, and assessment of potential contamination impacts. This approach enables quantitative examination of major ion concentrations to elucidate the chemical characteristics, sources, and evolutionary processes of groundwater. In this study, Origin 2025b was utilized to generate correlation heatmaps, Piper diagrams, Gibbs diagrams, and ion end-member diagrams for the analysis of major ions in groundwater.
2.3.3. Unsupervised Machine Learning
The Self-Organizing Map (SOM) is an unsupervised neural network model introduced by Finnish scholar Teuvo Kohonen in 1982. It operates by mapping high-dimensional input data onto a low-dimensional topological structure, facilitating both clustering and visualization. The core principle of SOM is that similar input patterns activate adjacent neurons in the output space, thereby preserving the topological relationships within the original data.
The standard SOM architecture consists of two layers: the input layer and the competitive layer. The input layer contains N neural nodes, while the competitive layer is typically organized as a one-dimensional linear array or a two-dimensional grid comprising M processing units. Each node in the input layer is fully connected to all neurons in the competitive layer.
SOM clustering is effective in revealing intrinsic structures and classification features within groundwater hydrochemical datasets, thereby supporting subsequent pollution source analysis. However, the method does not autonomously determine the optimal number of clusters, necessitating complementary techniques such as K-means clustering. In this study, the combined use of K-means clustering and the Davies–Bouldin Index (DBI) was employed to identify the optimal cluster number. K-means partitions samples into subsets based on similarity, minimizing intra-cluster variance while maximizing inter-cluster separation. The DBI, introduced by Davies and Bouldin in 1979, serves as an internal validation metric that evaluates clustering quality by measuring within-cluster similarity and between-cluster distances. A lower DBI indicates better clustering performance.
In this study, groundwater hydrochemical data were processed using the SOM neural network model implemented in MATLAB 2023b. After unsupervised training, samples were automatically categorized into distinct groups. Parameters such as grid size and topological configuration were systematically adjusted to optimize clustering performance, leading to the identification of the most representative clustering solution.
2.3.4. Positive Matrix Factorization (PMF) Source Analysis
Positive Matrix Factorization (PMF) is a multivariate source apportionment receptor model developed by Paatero and Tapper in 1994. Based on chemical composition data from environmental receptor samples, this model does not rely on the chemical composition profiles of pollution sources. It employs iterative operations using the least squares method to solve for chemical mass balances between component concentrations and pollution sources. Its mathematical principle is:
Here, X denotes the sample concentration matrix, G represents the factor contribution matrix, F signifies the factor concentration matrix, E indicates the residual matrix, n denotes the number of samples, m represents the number of chemical components, and p denotes the number of factors.
The PMF model employs constrained and iterative calculations based on weighted least squares, continuously decomposing matrix X to obtain the optimal matrices G and F.
PMF also requires uncertainty calculations. For indicators where the monitored concentration (C) is below or above the Method Detection Limit (MDL), the following formula is applied:
Among these, EF stands for Error Fraction, which is typically determined empirically and generally ranges between 0.05 and 0.2.
This study employed the PMF 5.0 software provided by the Environmental Protection Agency (EPA). By integrating existing water chemistry analyses and SOM clustering results, groundwater chemistry data were input into the PMF model for source apportionment. This approach assessed the validity of the SOM clustering outcomes and calculated the contribution of identified factors to the groundwater chemical composition within the study area.
3. Results
3.1. Statistical Characteristics of Groundwater Chemical Types and Content
As indicated in Table 2, pH values in the groundwater range from 7.40 to 8.48, reflecting a weakly alkaline environment across the study area. The coefficient of variation (CV) for pH is 0.03, indicating minimal spatial variability and relatively stable conditions. Among the hydrochemical parameters, potassium (K+) and chloride (Cl−) exhibit high variability (CV > 1), while the remaining ions demonstrate moderate variation (0.1 ≤ CV ≤ 1). Total dissolved solids (TDS) concentrations vary from 397.15 to 1925.98 mg/L, classifying the groundwater as fresh to slightly brackish, with a standard deviation of 477.52 mg/L. This wide range suggests the influence of complex hydrogeochemical processes and multiple contamination sources.
Table 2.
Statistical Analysis of Hydrochemical Characteristics of Groundwater in the Study Area.
According to China’s groundwater quality standards [26], exceedances of specified indicator thresholds render groundwater unsuitable as a drinking water source. Reference limits are provided in Table 2, with samples surpassing these values considered non-compliant. Evaluation based on these standards revealed elevated concentrations of nitrate (NO3−), total hardness (TH), TDS, sulfate (SO42−), and chloride (Cl−), with exceedance rates of 86.36%, 80.30%, 46.97%, 28.79%, and 24.24%, respectively. The mean TH value of 663.00 mg/L exceeds the Class III threshold (450 mg/L), indicating substantial dissolution of calcium and magnesium ions likely derived from water–rock interactions within aquifer minerals.
In accordance with China’s Sanitary Standard for Drinking Water [27], the maximum permissible limit for nitrate (as N) is 10 mg/L, equivalent to 44.27 mg/L for NO3−. Groundwater exceeding this value is considered contaminated and unsuitable for drinking. Since most sampling locations exceeded this threshold, the groundwater in the study area was classified as severely contaminated by nitrate. Isolated non-compliances were also observed for sodium (Na+), fluoride (F−), and permanganate index (CODMn), while other parameters remained within permissible limits.
3.2. Analysis of Groundwater Chemical Composition Sources
3.2.1. Groundwater Chemical Types
The Piper three-line diagram is a chart tool used for analyzing and classifying the chemical composition of groundwater [28]. It consists of an equilateral parallelogram and two equilateral triangles, and is mainly used to display the composition of major cations and anions in groundwater. This diagram (as shown in Figure 2) is used to characterize the chemical properties of groundwater in the study area and to identify the types of groundwater in the study area.
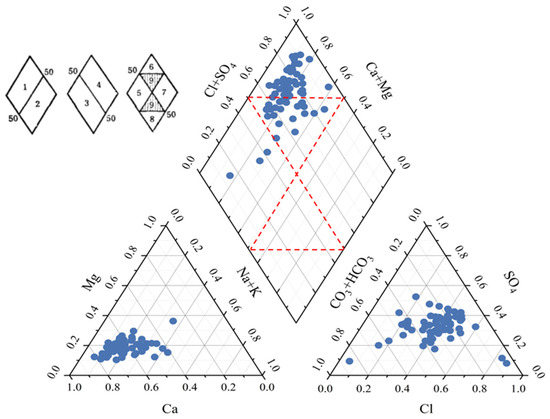
Figure 2.
Piper Trilinear Diagram of Groundwater in the Study Area.
Hydrochemical analysis of groundwater samples revealed distinct spatial and compositional patterns. Most sampling points were predominantly located in Zone 1 (Figure 2), indicating higher concentrations of alkaline earth metals (Ca2+, Mg2+) relative to alkali metals (Na+, K+). Further analysis showed a concentrated distribution within Zones 6 and 9, indicating that non-carbonate hardness exceeded 50%. Cationic composition exhibited relatively low variability, with Ca2+ and Mg2+ as the dominant ions, although several isolated samples were Na+-dominant [29]. In contrast, anionic composition showed greater variability, primarily influenced by SO42− and Cl−.
The Shukarev classification system, widely employed in hydrogeochemical studies [30], categorizes groundwater into 49 types based on major ion concentrations and mineralization levels. This method combines dominant cations and anions whose concentrations exceed 25 milliequivalents per liter to define distinct hydrochemical facies. According to this classification, groundwater in the study area was predominantly of the Cl·SO4–Ca type, reflecting the combined effects of natural geochemical processes and anthropogenic influences.
3.2.2. Equilibrium of Ions and Molecules
In hydrochemical studies, Gibbs diagrams are employed to illustrate equilibrium relationships among ions and molecules in aqueous systems. These diagrams feature dashed lines that represent contours of equal distribution coefficients (Kd) across different species. As a widely adopted tool in hydrogeochemical analysis, Gibbs diagrams facilitate the visualization of chemical equilibrium in groundwater samples and assist in identifying the composition and principal sources of major ions. The spatial distribution of sample points within the diagram allows for preliminary inference of dominant processes influencing groundwater hydrochemistry.
The sources of groundwater ions were interpreted using Gibbs diagrams (Figure 3). The left panel shows that most groundwater samples cluster within the upper-left quadrant, suggesting that cationic origins are primarily governed by water–rock interactions [31]. The right panel, in contrast, displays a distribution of samples across the upper-central region, indicating that anion sources are influenced by both water–rock interactions and evaporation–crystallization processes. Several outlier samples exhibit marked deviation from the main cluster, likely resulting from the cumulative effects of multiple environmental factors. These patterns underscore distinct controlling mechanisms for cation versus anion enrichment, with water–rock interactions representing the dominant process. This prevalence is consistent with the regional temperate continental sub-humid monsoon climate and Cenozoic fault-depression geological setting, where rocks are subjected to intensive chemical and physical weathering due to hydrological, atmospheric, and biological activities—thereby amplifying the extent and impact of water–rock interactions.
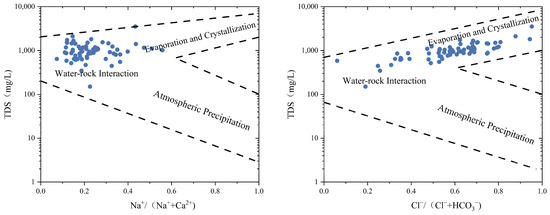
Figure 3.
Gibbs Diagram of Groundwater in the Study Area.
3.2.3. Ion Ratio Analysis
In hydrogeochemical studies, ionic ratios are widely used to trace the origins and evolutionary pathways of groundwater, as water from different sources or formed under varying conditions often exhibits distinct ratio characteristics. These ratios thus serve as effective indicators for identifying groundwater genesis.
Ionic end-member diagrams (Figure 4) were applied to evaluate the influence of rock weathering on groundwater hydrochemical composition [32]. Most samples clustered near the silicate rock end-member, indicating that silicate weathering is the dominant process controlling hydrochemistry in the study area. The left panel shows a subset of samples trending toward the carbonate end-member, reflecting notable contributions from carbonate dissolution to cationic composition [31]. In the right panel, several samples plot near the evaporite end-member, suggesting that evaporite dissolution partially regulates anion sources. The scattered distribution also implies notable anthropogenic influence, highlighting differing formation mechanisms between cations and anions. These results confirm the predominance of silicate weathering, with secondary contributions from carbonate and evaporite dissolution, while human activities further modulate anion dynamics in this geologically complex Cenozoic basin.
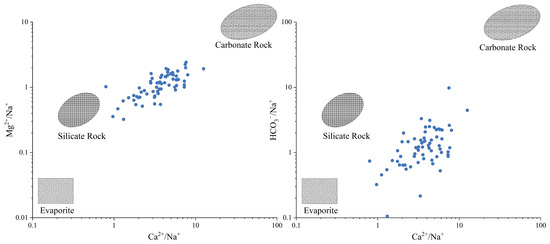
Figure 4.
Ionic End-member Diagram of Groundwater in the Study Area.
End-member ion ratios [32] were analyzed to quantify rock-water interaction intensity and identify dominant mineral sources in groundwater systems (Figure 5).
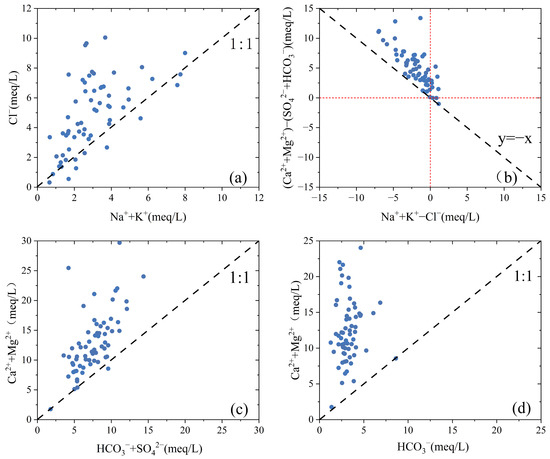
Figure 5.
Bivariate Ionic Ratio Diagram of Groundwater in the Study Area. (a) source of sodium chloride; (b) cation exchange adsorption; (c,d) source of calcium and magnesium.
Figure 5a reveals that most samples cluster near or above the 1:1 Cl−/(Na+ + K+) equivalence line, with elevated Cl− and depleted (Na+ + K+) concentrations. This pattern indicates silicate dissolution as the primary control on Na+ and K+ sources, consistent with prior end-member diagram interpretations. Deviations from the 1:1 line in certain samples may reflect evaporation-concentration processes in runoff-discharge zones and/or agricultural impacts. Additional Cl− sources, including anthropogenic inputs, cannot be excluded. Figure 5b evaluates cation exchange dynamics. Samples predominantly occupy the second quadrant and cluster near the y = −x line, indicating reverse cation exchange as the dominant process. This proximity to the theoretical exchange line confirms significant ion substitution between groundwater and aquifer matrices. Figure 5c examines Ca2+/Mg2+ ratios to differentiate mineral sources. Most samples plot above the 1:1 equivalence line, with marked Ca2+ + Mg2+ excess, signifying carbonate and sulfate mineral dissolution as the principal sources of divalent cations. However, deviations below the line in minor samples suggest supplementary contributions from silicate weathering. Figure 5d further corroborates carbonate dominance, as Ca2+ + Mg2+ concentrations exceed HCO3− levels across most samples. The dispersed distribution implies secondary controls, likely including cation exchange and anthropogenic modifications, on groundwater geochemistry.
3.2.4. SOM Clustering Results
Self-Organizing Map (SOM) clustering, an unsupervised neural network algorithm, projects multivariate data into a two-dimensional topological space while preserving inherent structure. In this study, SOM was applied to analyze 12 hydrochemical parameters measured across 66 groundwater sampling sites within the study area, with the aim of identifying spatial hydrochemical patterns and supporting qualitative interpretation of groundwater composition. The initial dataset was standardized using MATLAB. Given the sample size (N = 66), the theoretical number of neurons was determined as M = 5√N ≈ 40.62. Based on SOM optimization criteria, which aim to align grid dimensions with the theoretical neuron count while minimizing quantization and topological errors, a rectangular 7 × 6 grid (42 neurons) was selected to achieve an optimal balance between model accuracy and computational efficiency. The resulting feature maps of the 12 hydrochemical parameters after SOM training are shown in Figure 6.
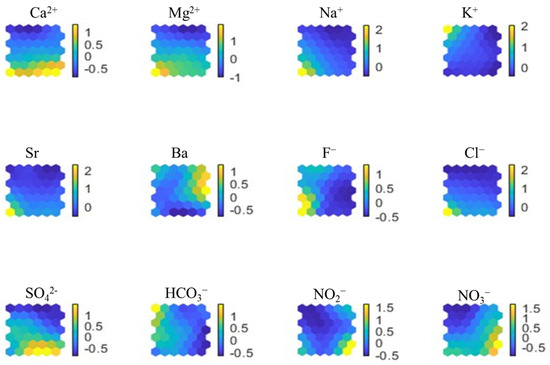
Figure 6.
SOM Feature Map of 12 Hydrochemical Parameters in Groundwater of the Study Area.
Subsequently, K-means clustering was applied to partition the neuron map into 2 to 6 clusters. The Davies–Bouldin Index (DBI) was used to evaluate clustering performance, with lower values indicating better separation. The DBI values for each partition were as follows: 1.1622 (2 clusters), 1.0825 (3 clusters), 0.9554 (4 clusters), 0.8080 (5 clusters), and 0.8875 (6 clusters). The minimum DBI value (0.8080) corresponded to the 5-cluster partition, which was therefore selected as the optimal configuration. This outcome provided a basis for determining the number of factors in the subsequent Positive Matrix Factorization (PMF) source apportionment model [33]. The relationship between sampling sites and the SOM-derived clusters under the 5-group configuration is illustrated in Figure 7, where distinct colors represent different clusters within the topological mesh: blue (Cluster 1), red (Cluster 2), green (Cluster 3), black (Cluster 4), and yellow (Cluster 5).
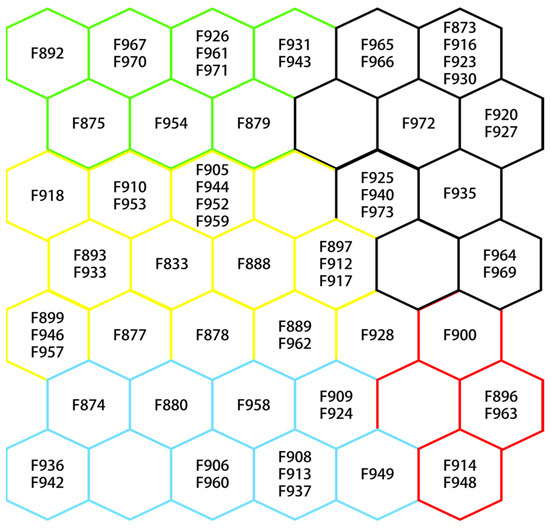
Figure 7.
Five Neuron Clusters Identified via SOM Clustering.
3.2.5. PMF Source Analysis
To quantitatively apportion the sources of groundwater chemical components in the midstream section of the Dawen River, this study employed the U.S. EPA PMF 5.0 receptor model. Building upon prior hydrochemical analyses and SOM clustering results, 13 hydrochemical parameters from 66 sampling sites were incorporated into the PMF model for quantitative source apportionment. Given inherent uncertainties in groundwater sampling, the error fraction (EF) was set to 0.2, and the method detection limit (MDL) was defined as one-third of the minimum measured value for each parameter. Signal-to-noise ratios (S/N) were categorized as follows: 0–0.5 (“bad”), 0.5–1 (“weak”), and >1 (“strong”). All parameters exhibited S/N ratios greater than 1 and were thus classified as “strong”, except TDS, which was assigned a “weak” classification.
Model simulations were conducted with factor numbers (p) set to 3, 4, and 5, each executed over 50 iterations. Parameters demonstrating poor model fit were adjusted: Sr was reclassified as “weak” due to high standardized residuals, while K+ and NO2− were designated as “bad” owing to unsatisfactory correlation between observed and predicted values. The model with p = 5 exhibited the best performance. Subsequent displacement error (DISP) estimation yielded error code 0 and a maximum Q reduction of 0.039 (<0.1), indicating statistically negligible uncertainty and confirming the robustness of the error analysis. This optimal five-factor solution formed the basis for subsequent source apportionment. Under the five-factor PMF configuration, a contribution rate distribution of factors across various hydrochemical indicators was obtained (Figure 8). Each factor is represented by a distinct color, with longer bars indicating a greater contribution of that factor to the corresponding indicator.
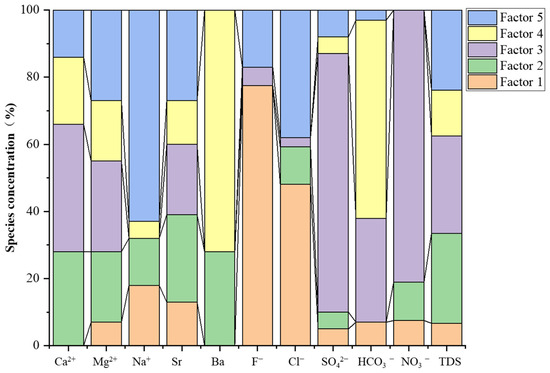
Figure 8.
Contribution Patterns of PMF-Derived Source Factors in Groundwater of the Study Area.
4. Discussion
4.1. Preliminary Analysis of Ion Sources
The preceding chapter presented preliminary statistics on ion sources within the study area, with results showing overall consistency. Statistical analysis indicates that groundwater composition in the study area originates from complex and diverse sources, while the severe exceedance of NO3− levels reflects significant influence from agricultural activities on groundwater sources. Piper’s three-line diagram identifies Ca2+ as the predominant cations, with Cl− and SO42− being the primary anion. Gibbs diagrams indicate that ion origins in the study area are predominantly controlled by water-rock interactions, while anion origins are additionally influenced by evaporation and crystallization processes. Ion ratio analysis indicates mineral weathering products constitute the primary component of the study area’s hydrochemical composition. Reverse cation exchange processes are present in the water bodies. Na+ primarily originates from silicate dissolution, while Ca2+ and Mg2+ mainly stem from carbonate rock weathering. Cl− may also derive from other natural sources or human activities. Further analysis is required to determine the sources of other ions.
4.2. Analysis of SOM Clustering Results
Based on Figure 7, we established a correspondence between sampling point numbers and cluster categories. By projecting the coordinates of each sampling point category onto the study area, the spatial response of each cluster category within the study area can be observed. The specific distribution is shown in Figure 9.
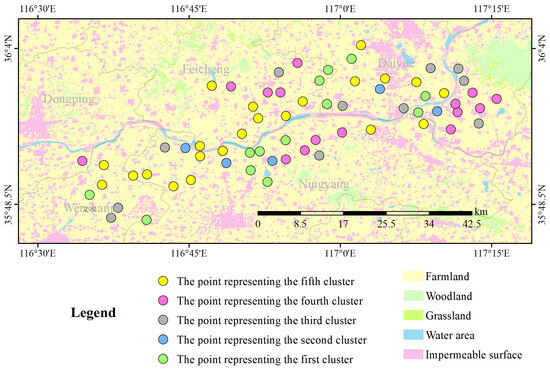
Figure 9.
Spatial Distribution Map of SOM-Clustered Sampling Points and Land Use Types in the Study Area.
The first cluster, encompassing Ca2+, Mg2+, Na+, Sr, F−, Cl− and SO42−, demonstrated a spatial pattern with high-response zones in the lower-left and central-lower regions of the map. This distribution highlights the dominance of major ions, indicative of natural geological processes. Clustered sampling points, marked as green dots in Figure 9, were primarily distributed around Gancheng and Mazhuang towns—areas characterized by abundant natural resources. The spatial association suggests these indicators represent natural sources influenced by primary geological conditions, with additional impacts from anthropogenic activities.
The second cluster, comprising NO2− and NO3−, exhibited a spatial pattern characterized by high response areas in the lower-right quadrant. These indicators demonstrated extensive influence in the characteristic map (Figure 6), aligning with the observed dense farmland distribution in the study area. Clustered sampling points, marked as blue dots in Figure 9, displayed a relatively dispersed distribution with proximity to large-scale agricultural zones. This spatial association underscores the pervasive impact of agricultural sources represented by these indicators across the region.
The third cluster, composed of K+ and HCO3−, exhibited a spatial pattern with high-response zones in the upper-left quadrant (Figure 9). These indicators effectively trace the extent of carbonate rock weathering, confirming widespread dissolution processes in the study area [34]. Clustered sampling points, marked as grey dots, were predominantly located in zones with concentrated impervious surfaces, suggesting natural source impacts from water-rock interactions.
The fourth cluster, containing only Ba, showed high-response zones in the upper-right quadrant (Figure 9). Elevated Ba concentrations likely stem from barite mining activities in the Dawen River basin. Sampling points, denoted as pink dots, clustered near industrial/mining zones, indicating anthropogenic influences from mining operations.
The fifth cluster, encompassing all 12 studied indicators, exhibited a relatively uniform response across the study area with extensive spatial influence. Sampling points, marked as yellow dots in Figure 9, were concentrated along high-population-density zones. Given the observed correlation with dense urban settlements, these indicators collectively suggest anthropogenic impacts from domestic activities, positioning this cluster as a proxy for human-induced domestic sources.
In summary, the SOM clustering results divided the 12 water chemistry indicators into five categories: Ca2+, Mg2+, Na+, Sr, F−, Cl− and SO42− are natural sources affected by the original geological conditions; NO2− and NO3− are agricultural sources; K+ and HCO3− are natural sources affected by water-rock interactions; Ba is an industrial and mining source; and domestic sources have a widespread impact.
4.3. Factors in the PMF Model
Factor 1 in the PMF analysis explained 6.7% of the total variance, with F− exhibiting the highest contribution (Figure 10). Groundwater F− primarily originated from natural weathering dissolution of fluoride-bearing minerals. Meanwhile, anthropogenic nitrification processes released Ca2+, which could form insoluble or sparingly soluble solid phases through interaction with F−, leading to decreased F− concentrations in areas influenced by human activities. This suggests that anthropogenic activities may mitigate F− contamination to a certain extent, corresponding to Cluster 5 in the SOM analysis.
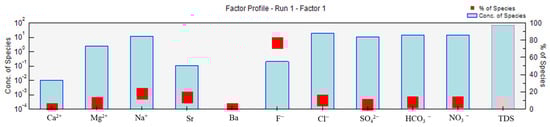
Figure 10.
Source Contribution Apportionment of PMF-Derived Factor 1 in Groundwater of the Study Area.
Factor 2 accounted for 26.8% of the total variance, with NO3− demonstrating the highest contribution rate followed by Ba (Figure 11). This factor exhibited significant influence on the total variability within the study area, likely attributable to the prevalence of agricultural activities and extensive cropland distribution. Based on these characteristics, Factor 2 was interpreted as representing agricultural sources derived from anthropogenic farming practices, corresponding to Cluster 2 in the self-organizing map (SOM) analysis.
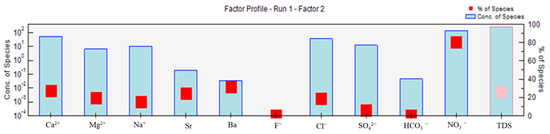
Figure 11.
Source Contribution Apportionment of PMF-Derived Factor 2 in Groundwater of the Study Area.
Factor 3 explained 29.0% of the total variance, with SO42− showing the highest contribution rate, followed by Ca2+, Mg2+, Sr, and HCO3− (Figure 12). These parameters are primarily linked to geological processes, indicating that Factor 3 represents natural sources influenced by primary geological conditions. Consequently, this factor was categorized as a geogenic natural source, corresponding to Cluster 1 in the self-organizing map (SOM) analysis.
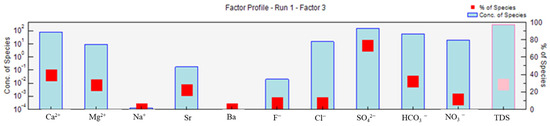
Figure 12.
Source Contribution Apportionment of PMF-Derived Factor 3 in Groundwater of the Study Area.
Factor 4 accounted for 13.6% of the total variance, with Ba demonstrating the highest contribution rate, followed by HCO3− (Figure 13). Mining activities associated with barite (barium sulfate) deposits may contribute to the mobilization of barium and related elements. Based on these characteristics, Factor 4 was thus identified as an industrial/mining source linked to mineral extraction activities, corresponding to Cluster 4 in the self-organizing map (SOM) analysis.
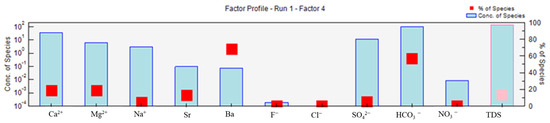
Figure 13.
Source Contribution Apportionment of PMF-Derived Factor 4 in Groundwater of the Study Area.
Factor 5 explained 23.9% of the total variance, with Na+ and Cl− demonstrating the highest contribution rates (Figure 14). These ions primarily originate from the dissolution of salt rocks and minerals in sedimentary formations, while reverse cation exchange processes in the study area further contribute to Na+ mobilization. Based on these observations, Factor 5 was attributed to salt rock dissolution influenced by hydrogeochemical evolution processes, corresponding to Cluster 3 in the self-organizing map (SOM) analysis.
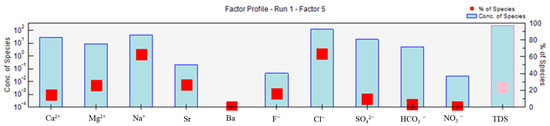
Figure 14.
Source Contribution Apportionment of PMF-Derived Factor 5 in Groundwater of the Study Area.
5. Conclusions
This study employs hydrochemical and multivariate statistical methods to analyze the sources of major ions in groundwater within the midstream region of the Dawen River basin. Integrating topographic, hydrogeological, and land use characteristics of the study area, qualitative and quantitative pollution source apportionment was conducted using hydrochemical techniques, unsupervised machine learning, and Positive Matrix Factorization (PMF). The main conclusions are as follows:
Preliminary assessment of hydrochemical characteristics and pollution sources was carried out using statistical analysis, Piper and Gibbs diagrams, ion ratios, and other hydrochemical methods. Results indicate that groundwater in the study area derives from complex and diverse sources. The groundwater system is predominantly of the Cl·SO4–Ca type, weakly alkaline (pH 7.2–8.5), and ranges from fresh to slightly brackish. Several parameters exceeded standard limits, particularly total hardness (TH), nitrate (NO3−), and total dissolved solids (TDS). Hydrochemical composition is primarily governed by hydrogeochemical processes, with silicate weathering being the dominant natural process. Analysis of ion ratios further indicates that anthropogenic pollution sources include industrial wastewater, domestic sewage, and agricultural nonpoint sources.
Using MATLAB, SOM combined with K-means clustering was applied to classify pollution sources and examine their spatial distribution. Groundwater samples were categorized into five clusters, each associated with dominant influencing factors: (i) natural geological processes—samples located in the central geological mining area; (ii) agricultural activities—samples distributed in intensively cultivated zones along both banks of the Dawen River; (iii) hydrogeochemical evolution—samples concentrated in impermeable strata on the eastern and western margins; (iv) mining operations—samples situated in peripheral industrial zones; (v) domestic wastewater—samples scattered uniformly throughout the region.
Source apportionment using EPA PMF 5.0 yielded the total contribution rates of various indicators and identified characteristic species for each factor. Based on the five-cluster SOM classification, a five-factor PMF model was applied, yielding the following results: Factor 1 (6.7% of total variance) was dominated by F−, corresponding to domestic wastewater (SOM Cluster 5); Factor 2 (26.8%) was primarily influenced by NO3−, indicating agricultural sources (SOM Cluster 2); Factor 3 (29.0%) was driven mainly by SO42−, reflecting natural geological sources (SOM Cluster 1); Factor 4 (13.6%) was characterized by Ba, associated with industrial activities (SOM Cluster 4); Factor 5 (23.9%) was dominated by Na+ and Cl−, indicative of salt rock dissolution under hydrogeochemical evolution (SOM Cluster 3).
This study establishes a diagnostic model for groundwater pollution that accounts for the synergistic effects of geological background and human activities, offering a scientific basis for water quality protection in similar regions. A primary limitation is that the findings are based on a single sampling campaign and do not capture potential seasonal variations in groundwater chemistry. Furthermore, the precision of source apportionment is constrained by the spatial distribution of sampling points, which may introduce uncertainties. Future studies should implement long-term monitoring to better elucidate temporal dynamics and improve spatial resolution.
Author Contributions
Conceptualization, X.W. (Xinqi Wang) and Z.S.; Methodology, X.W. (Xinqi Wang), Z.Z. and Z.S.; software, X.W. (Xinqi Wang), Z.Z. and H.A.; validation, X.W. (Xinqi Wang), L.H. and X.W. (Xinfeng Wang); Data curation, X.W. (Xinqi Wang), Z.Z., L.H., M.L. and Z.W.; Writing—origin draft preparation, X.W. (Xinqi Wang) and Z.S.; Writing-review and editing, X.W. (Xinqi Wang), Z.Z., L.H., H.A., X.W. (Xinfeng Wang) and Z.S.; Projection administration, X.W. (Xinfeng Wang) and Z.S.; Funding acquisition, X.W. (Xinfeng Wang). All authors have read and agreed to the published version of the manuscript.
Funding
This research was funded by The Geological Survey Project of the China Geological Survey (Grant) No. DD20230505; Ministry of Natural Resources Provincial Cooperation Project (No. 2024ZRBSHZ028).
Data Availability Statement
The original contributions presented in this study are included in the article. Further inquiries can be directed to the corresponding authors.
Conflicts of Interest
The authors declare no conflict of interest.
Abbreviations
The following abbreviations are used in this manuscript:
| SOM | Self-Organizing Map |
| PMF | Positive Matrix Factorization |
| EF | Error Fraction |
| DBI | Davies-Bouldin Index |
References
- Foroushani, T.S.; Balali, H.; Movahedi, R.; Kurban, A.; Varnik, R.; Stamenkovska, I.J.; Azadi, H. Importance of good groundwater governance in economic development: The case of western Iran. Groundw. Sustain. Dev. 2023, 21, 100892. [Google Scholar] [CrossRef]
- Li, D.; Tian, P.; Luo, Y.; Dong, B.; Cui, Y.; Khan, S. Importance of stopping groundwater irrigation for balancing agriculture and wetland ecosystem. Ecol. Indic. 2021, 127, 107747. [Google Scholar] [CrossRef]
- Zhao, Y.; Lin, L.; Hong, M. Nitrobenzene contamination of groundwater in a petrochemical industry site. Front. Environ. Sci. Eng. 2019, 13, 29. [Google Scholar] [CrossRef]
- Lee, D.; Murphy, H.M. Private Wells and Rural Health: Groundwater Contaminants of Emerging Concern. Curr. Environ. Health Rep. 2020, 7, 129–139. [Google Scholar] [CrossRef] [PubMed]
- Wang, L.; Liu, X.L.; Liu, X.J.; Bao, X.Y.; Zhang, X.C.; Yin, B.Z.; Wang, W.T.; Wang, Y.D.; Zhen, W.C. Effects of spring limited irrigation on grain yield and root characteristics of winter wheat in groundwater-overexploitation areas in the North China Plain. Agric. Water Manag. 2024, 294, 108729. [Google Scholar] [CrossRef]
- Meinzen-Dick, R.; Bruns, B. Crafting Combinations to Govern Groundwater: Knowledge, Motivation, and Agency. Int. J. Commons 2024, 18, 585–600. [Google Scholar] [CrossRef]
- Abanyie, S.K.; Apea, O.B.; Abagale, S.A.; Amuah, E.E.Y.; Sunkari, E.D. Sources and factors influencing groundwater quality and associated health implications: A review. Emerg. Contam. 2023, 9, 100207. [Google Scholar] [CrossRef]
- Zhao, Y.; Zhang, M.L.; Liu, Z.Q.; Ma, J.B.; Yang, F.; Guo, H.M.; Fu, Q. How Human Activities Affect Groundwater Storage. Res. Sci. Partn. J. 2024, 7, 0369. [Google Scholar] [CrossRef]
- Kastali, F.; Meddi, M.; Boufekane, A.; Longobardi, A. Integrated modeling of surface water and groundwater interactions in the Eastern Mitidja Plain, North Algeria: Investigating the impact of human activities and climate change. J. Water Clim. Change 2024, 15, 5570–5586. [Google Scholar] [CrossRef]
- Arsenault, R.; Martel, J.L.; Brunet, F.; Brissette, F.; Mai, J.L.E. Continuous streamflow prediction in ungauged basins: Long short-term memory neural networks clearly outperform traditional hydrological models. Hydrol. Earth Syst. Sc. 2023, 27, 139–157. [Google Scholar] [CrossRef]
- Liu, C.; Jia, X.; Shao, M. Application and Prospect of Geophysical Methods in Study of Soil Hydrological Processes. Soils 2022, 54, 24–31. [Google Scholar]
- Hussein, E.E.; Derdour, A.; Zerouali, B.; Almaliki, A.; Wong, Y.J.; los Santos, M.B.D.; Ngoc, P.M.; Hashim, M.A.; Elbeltagi, A. Groundwater Quality Assessment and Irrigation Water Quality Index Prediction Using Machine Learning Algorithms. Water 2024, 16, 264. [Google Scholar] [CrossRef]
- Boo, K.B.W.; El-Shafie, A.; Othman, F.; Khan, M.M.H.; Birima, A.H.; Ahmed, A.N. Groundwater level forecasting with machine learning models: A review. Water Res. 2024, 252, 121249. [Google Scholar] [CrossRef] [PubMed]
- He, S.; Li, P.; Su, F.; Wang, D.; Ren, X. Identification and apportionment of shallow groundwater nitrate pollution in Weining Plain, northwest China, using hydrochemical indices, nitrate stable isotopes, and the new Bayesian stable isotope mixing model (MixSIAR). Environ. Pollut. 2022, 298, 118852. [Google Scholar] [CrossRef] [PubMed]
- Yan, B.; Sun, J.; Chen, J.; Sun, F.; Li, X.; Fu, Q. Suitability Zoning for Groundwater Source Heat Pump Based on Adaptive BPNN-GIS Method. Geoscience 2023, 37, 963–971. [Google Scholar]
- Krishan, G.; Bhagwat, A.; Sejwal, P.; Yadav, B.K.; Kansal, M.L.; Bradley, A.; Singh, S.; Kumar, M.; Sharma, L.M.; Muste, M. Assessment of groundwater salinity using principal component analysis (PCA): A case study from Mewat (Nuh), Haryana, India. Environ. Monit. Assess. 2023, 195, 37. [Google Scholar] [CrossRef] [PubMed]
- Bhuiyan, M.A.H.; Karmaker, S.C.; Bodrud-Doza, M.; Rakib, M.A.; Saha, B.B. Enrichment, sources and ecological risk mapping of heavy metals in agricultural soils of dhaka district employing SOM, PMF and GIS methods. Chemosphere 2021, 263, 128339. [Google Scholar] [CrossRef]
- Jiang, W.; Meng, L.; Liu, F.; Sheng, Y.; Chen, S.; Yang, J.; Mao, H.; Zhang, J.; Zhang, Z.; Ning, H. Distribution, source investigation, and risk assessment of topsoil heavy metals in areas with intensive anthropogenic activities using the positive matrix factorization (PMF) model coupled with self-organizing map (SOM). Environ. Geochem. Health 2023, 45, 6353–6370. [Google Scholar] [CrossRef]
- Lv, X.; Li, C.; Wang, H.; Yang, S.; Wang, S.; Yang, C.; Teng, F.; Zhao, J.; Xu, X.; Zhang, H.; et al. Source apportionment and risk quantification of soil heavy metals using SOM-PMF model: Implications for ecological and human health management. Environ. Monit. Assess. 2025, 197, 868. [Google Scholar] [CrossRef]
- Kang, X.Q.; Niu, Y.; Yu, H.; Gou, P.; Hou, Q.Y.; Lu, X.F.; Wu, Y.L. Effect of rainfall-runoff process on sources and transformations of nitrate using a combined approach of dual isotopes, hydrochemical and Bayesian model in the Dagang River basin. Sci. Total Environ. 2022, 837, 155674. [Google Scholar] [CrossRef]
- Li, Y.; Zhao, L.; Zhang, Z.; Li, J.X.; Hou, L.; Liu, J.Q.; Wang, Y.B. Research on the Hydrological Variation Law of the Dawen River, a Tributary of the Lower Yellow River. Agronomy 2022, 12, 1719. [Google Scholar] [CrossRef]
- Ding, M.; Zhao, W.; Xu, X.; Tang, J.; Fan, T.; Zhang, L.; Zhang, Z.; Peng, S.; Xu, L. Characteristics of Organochlorine Pollution in the Topsoil of the Dawen River Watershed and Potential Risk Assessment in China. Appl. Ecol. Environ. Res. 2020, 18, 159–172. [Google Scholar] [CrossRef]
- Zhao, Q.; Gao, Q.; Zou, C.H.; Yao, T.; Li, X.M. Impact of Changes in Land Use and Climate on the Runoff Based on Swat Model in Dawen River Basin, China. Appl. Ecol. Environ. Res. 2019, 17, 2849–2863. [Google Scholar] [CrossRef]
- Wei, S.M.; Zhang, Y.X.; Cai, Z.Z.; Bi, D.W.; Wei, H.H.; Zheng, X.F.; Man, X.B. Evaluation of groundwater quality and health risk assessment in Dawen River Basin, North China. Environ. Res. 2025, 264, 120292. [Google Scholar] [CrossRef] [PubMed]
- Liu, Z.; Wang, X.; Wan, X.; Jia, S.; Mao, B. Evolution origin analysis and health risk assessment of groundwater environment in a typical mining area: Insights from water-rock interaction and anthropogenic activities. Environ. Res. 2024, 252, 118792. [Google Scholar] [CrossRef] [PubMed]
- GB/T 14848-2017; Standard for Groundwater Quality. Standardization Administration of China (SAC/TC 93): Beijing, China, 2017.
- GB 5749-2022; Standards for Drinking Water Quality. National Health Commission of the People’s Republic of China: Beijing, China, 2022.
- Razack, M.; Dazy, J. Hydrochemical Characterization of Groundwater Mixing in Sedimentary and Metamorphic Reservoirs with Combined Use of Piper Principle and Factor-Analysis. J. Hydrol. 1990, 114, 371–393. [Google Scholar] [CrossRef]
- Hoaghia, M.A.; Roman, C.; Tanaselia, C.; Ristoiu, D. Groundwater chemistry rendering using Durov, Piper and ion balanced diagrams. Case study: The northern part of Sibiu county (vol 8, pg 93, 2013). Studia Univ. Babes-Bolyai Chem. 2016, 61, 319. [Google Scholar]
- Wu, J. Classification of Groundwater by Chemical Composition and Systematic Organization of Water Analysis Data. Hydrogeol. Eng. Geol. 1958, 31–35. Available online: https://xueshu.baidu.com/ndscholar/browse/detail?paperid=b466e33fcaaa3ff5e822002abfcb2f43&site=… (accessed on 7 October 2025).
- Marandi, A.; Shand, P. Groundwater chemistry and the Gibbs Diagram. Appl. Geochem. 2018, 97, 209–212. [Google Scholar] [CrossRef]
- Mondal, N.C.; Singh, V.P.; Singh, V.S.; Saxena, V.K. Determining the interaction between groundwater and saline water through groundwater major ions chemistry. J. Hydrol. 2010, 388, 100–111. [Google Scholar] [CrossRef]
- Zhang, Z.; Yi, L.X.; Liu, C.Y.; Li, S.C.; Liu, N.; Ren, L. Source apportionment of groundwater contamination and spatial variability in the Bohai Sea region (China). Mar. Pollut. Bull. 2025, 220, 118392. [Google Scholar] [CrossRef]
- Cao, Z.Z.; Zhang, S.Y.; Du, F.; Ma, D.; Li, Z.H.; Huang, C.H.; Wang, W.Q. Water Inrush Mechanism and Variable Mass Seepage of Karst Collapse Columns Based on a Nonlinear Coupling Mechanical Model. Mine Water Environ. 2025, 44, 259–274. [Google Scholar] [CrossRef]
Disclaimer/Publisher’s Note: The statements, opinions and data contained in all publications are solely those of the individual author(s) and contributor(s) and not of MDPI and/or the editor(s). MDPI and/or the editor(s) disclaim responsibility for any injury to people or property resulting from any ideas, methods, instructions or products referred to in the content. |
© 2025 by the authors. Licensee MDPI, Basel, Switzerland. This article is an open access article distributed under the terms and conditions of the Creative Commons Attribution (CC BY) license (https://creativecommons.org/licenses/by/4.0/).