Article

Research on the Impact of Landscape Pattern in Haikou City on Urban Water Body Quality

1
College of Geography and Environmental Science, Hainan Normal University, Haikou 571158, China
2
Key Laboratory of Tropical Island Land Surface Processes and Environmental Changes of Hainan Province, Haikou 571158, China
3
China Resources Satellite Application Center, Beijing 100094, China
4
Southern Ocean Science and Engineering Laboratory of Guangdong Province, Zhuhai 519080, China
*
Author to whom correspondence should be addressed.
Water 2025, 17(20), 2922; https://doi.org/10.3390/w17202922
Submission received: 16 August 2025 / Revised: 18 September 2025 / Accepted: 20 September 2025 / Published: 10 October 2025
(This article belongs to the Section Urban Water Management)

Abstract

In the rapid development process of cities, as important ecological corridors and landscape carriers, the water quality conditions of urban water bodies are not only related to the health of the ecological environment, but also closely linked to the quality of life of residents. The landscape pattern, as an important component of the urban ecosystem, has a potential impact on water quality. As a tropical coastal city, the unique water network pattern of Haikou City is facing the dual challenges of landscape fragmentation and water quality pollution in its rapid urban expansion. In order to study the impact of the landscape pattern of Haikou City on urban water bodies, this study takes the urban water bodies of Haikou City as the research object. By comprehensively applying landscape ecology methods and water quality monitoring techniques, and using landscape pattern indices (such as the number of patches, fragmentation degree, spread degree, etc.) and on-site investigation of water quality parameter data (such as chemical oxygen demand (COD), total nitrogen (TN), total phosphorus (TP), etc.), and by using correlation analysis and redundancy analysis, we explore the mechanism by which landscape patterns affect water quality. The results show that: (1) There are significant differences in water quality among water bodies. The concentrations of COD and TN in Hongcheng Lake are relatively high. The average values reached 86.603 mg/L and 13.368 mg/L, respectively, mainly affected by the high-intensity construction land around. Jinniu Lake has a high degree of landscape fragmentation and relatively high concentrations of NH3-N and TP. The average values are 2.086 mg/L and 0.154 mg/L, respectively. The Meishe River has a strong water purification capacity due to its good vegetation coverage. (2) The influence of landscape pattern on water quality has a scale effect. Hongcheng Lake, Jinniu Lake, and Meishe River all have the best interpretation rate of water quality in the 2000 m buffer zone landscape pattern. (3) The expansion of construction land has significantly exacerbated water pollution, while natural vegetation landscapes with high connectivity and low fragmentation can effectively improve water quality. The research reveals the correlation between urban landscape planning and water quality protection. It is suggested that by enhancing ecological connectivity, controlling non-point source pollution, and implementing differentiated seasonal management, the self-purification capacity of water bodies can be improved, providing a scientific basis for ecological restoration and sustainable development in Haikou City.

1. Introduction

Water resources represent a fundamental and indispensable asset, playing a crucial role in the survival and development of human societies, as well as in the sustainable development of regions [1] They form the basis for sustaining life, promoting economic growth, and preserving ecological balance. As a vital component of urban ecosystems, urban water bodies not only perform ecological functions—such as climate regulation, aesthetic enhancement, and biodiversity conservation—but are also closely linked to the well-being and quality of life of urban residents. However, with the rapid pace of economic development and urbanization, water pollution has become increasingly severe [2]. Urban water bodies are now facing escalating levels of pollution and a significant decline in ecological functions. The term landscape pattern refers to the types, quantities, spatial distribution, and arrangement of landscape elements. As an integral part of watershed ecosystems, landscape patterns directly or indirectly influence river water quality by affecting material cycling and energy flows [3]. Analyzing the correlations between water quality and landscape patterns has become a key research focus in environmental science and landscape ecology. Such analyses aim to elucidate the complex relationships among human activities, natural landscape features, and the quality of aquatic environments.
In recent years, numerous scholars have investigated the relationship between landscape patterns and water quality across various temporal and spatial scales. The temporal scale effect refers to the significant differences in the intensity and nature of the influence that landscape composition and configuration exert on water quality over different temporal scales—such as seasonal, annual, and event-based (e.g., rainfall) periods [4,5,[6]. For example, Zhang Jing analyzed tributary water samples from the Three Gorges Reservoir area and found that the impact of land use types on water quality was slightly more pronounced during the dry season than in the wet season [7]. Similarly, Lei Chaogui, in a study of the Stör River Basin in Germany, concluded that water quality variations were better explained during the summer months than in winter [8]. Wu Jianhong, investigating seasonal fluctuations in landscape indices in the Hengxi River Basin, observed that landscape configuration exhibited the highest sensitivity to seasonal changes. Furthermore, he reported that the explanatory power of landscape metrics for water quality was greater in the wet season than in the dry season [9]. Existing studies also demonstrate that the relationship between landscape patterns and water quality varies across spatial scales. For instance, Han Haojie [10], examining riparian buffer zones of different widths in the Qinhuai River Basin, found that a 1000 m buffer zone best explained water quality variations during the dry season, whereas a 200 m buffer zone was more explanatory during the wet season. Xu Qiyu [11] studied the impact of landscape structure on river water quality in the Yuanjiang River Basin and reported that the strongest influence occurred within the 300 m buffer zone. Similarly, Huang Wenqin [12], using Poyang Lake as a case study, concluded that the highest correlation between landscape patterns and water quality was observed within a 1000 m buffer zone.
Despite extensive research, the relationship between landscape patterns and water quality across different spatiotemporal scales remains inconclusive. Therefore, it is essential to further investigate how watershed landscape patterns influence water quality across varying spatial and temporal dimensions. To enhance our understanding of the underlying mechanisms driving these interactions, future research should examine the landscape–water quality relationship across a wider range of geographic regions and scales. Such efforts are crucial for developing more comprehensive and generalizable insights into the complex dynamics between landscape configuration and aquatic environmental quality.
Research on the regulatory mechanism of landscape structure on water quality has already been conducted by some scholars. Sahar Heidari Masteali [13] used Pearson and Spearman correlation coefficients to test the potential relationship between forest patch connectivity and water quality indicators, and found that the improvement in water quality is related to the increase in forest connectivity. Wang Yan [14] took Dianchi Lake in Kunming, Yunnan (a tectonic lake) and Fushun West Lake in Zigong, Sichuan (a man-made lake) as the research objects, and used correlation analysis and redundancy analysis (RDA) to quantitatively compare the differences in the responses of water quality in the two types of lakes to landscape characteristics. The conclusion was that patch density is the most critical indicator affecting the water quality of the Dianchi Lake and Fushun West Lake basins. Li Biao [15] took the typical subtropical hilly area in the upper reaches of the Ganjiang River as the research object, and used redundancy analysis and multiple linear regression models to analyze the influence of landscape characteristics in the basin and buffer zone on river water quality. The conclusion was that in the buffer zone, grassland has the greatest impact on winter water quality (72.8%), and at the catchment scale, the aggregation index (AI) of grassland has the greatest contribution to the change in winter water quality (31.6%). Xu Yaotao [16] analyzed the water quality monitoring data of the Wuding River Basin using machine learning and positive matrix factorization techniques, and concluded that in the dry season, the composition and configuration of the landscape have the greatest impact on water quality parameters, while in the rainy season, connectivity and landscape configuration are more crucial for water quality parameters, and connectivity also makes a significant contribution to the comprehensive water quality index, accounting for 33.46% and 36.22% in the dry and rainy seasons, respectively.
Haikou City encompasses a total wetland area of 29,100 hectares, with a wetland coverage rate of 12.7% and a conservation rate of 55.53%. As one of the world’s first designated International Wetland Cities [17], Haikou plays a critical role as an ecological barrier in China and is endowed with abundant urban water resources. Among these, Hongcheng Lake, Jinniu Lake, and the Meishe River—representative urban water bodies in Hainan Province—exhibit distinct characteristics in both landscape patterns and water quality conditions. Investigating the relationship between landscape patterns and water quality in these areas is therefore of great significance for the ecological restoration and sustainable management of urban aquatic environments. This study focuses on the Hongcheng Lake, Jinniu Lake, and Meishe River in Haikou City. By combining landscape ecology methods with water quality monitoring techniques, it aims to explore the multi-scale correlations of “landscape composition—landscape pattern index—water quality parameters”, to clarify the “pollution—purification” effects of different landscape types on water quality parameters, and to identify the key landscape composition factors that affect the water quality of urban water bodies in Haikou City. It also verifies the correlation strength of landscape pattern indices and water quality parameters at buffer zone scales of 500 m, 1000 m, and 2000 m, to determine the optimal analysis scale for the landscape–water quality relationship. It analyzes the water quality differentiation patterns and seasonal change mechanisms caused by landscape pattern differences in Red City Lake, Jinniu Lake, and Meishe River, and clarifies the specific landscape–water quality responses of different functional areas of water bodies in tropical coastal cities. Ultimately, it provides a scientific basis for precise water body ecological restoration and landscape planning in Haikou City.

2. Materials and Methods

2.1. Study Area Overview

This study focuses on Haikou City, Hainan Province, using three representative urban water bodies—Hongcheng Lake, Jinniu Lake, and the Meishe River—as study sites to investigate the mechanisms by which landscape patterns influence water quality. Hongcheng Lake (Figure 1a), located in the central area of Qiongshan District, is one of the largest urban lakes in Hainan Province. It serves as a key flood regulation and water storage reservoir within the Meishe River Basin and functions as an ecological core within the urban landscape. The lake covers a water surface area of approximately 38 hectares and has a total storage capacity of 1.5 million cubic meters. It plays multiple roles, including flood control and drainage, ecological conservation, and landscape-based recreation. As a flagship project within Haikou’s “Sponge City” initiative, Hongcheng Lake underwent a comprehensive ecological restoration. These efforts led to an improvement in water quality from Class V to Class IV, based on the Chinese surface water quality standard (GB 3838–2002) [18]. Key restoration measures included the installation of ecological floating islands, sediment dredging, the construction of a water circulation system, and the establishment of artificial wetlands for water purification. These interventions have achieved notable outcomes: approximately 5 hectares of mangrove wetlands were reconstructed along the shoreline, biodiversity has been significantly enhanced, and the lake’s capacity to mitigate urban waterlogging has been markedly improved. The areas surrounding the lake are primarily composed of residential and commercial zones. However, with ongoing urbanization, ecological pressure and environmental resistance have intensified [19], exposing the water body to increasing pollution stress.
Jinniu Lake in Haikou (Figure 1b) is located southeast of Jinniuling Park. It receives inflow from the upstream Binlian Ditch, flows through Xibeng Pool, and discharges into the downstream Longkun Ditch. As a critical component of the Longkun Ditch flood control system, Jinniu Lake represents an important urban landscape water body in central Haikou. The lake has a total storage capacity of approximately 1.03 million cubic meters and a surface area of about 6.3 hectares, with an elongated and irregular shape. Its primary functions include groundwater resource protection and flood discharge. The lake’s water quality is generally maintained at a clear and stable level, largely due to regular tidal water replenishment and the operation of an ecological purification system. This system not only improves the water quality of Jinniu Lake itself but also contributes to the enhancement of downstream water quality. Constructed wetlands within the lake play a significant role in purifying wastewater while simultaneously improving the residential environment of surrounding areas. As one of the urban “sponge” infrastructure elements, Jinniu Lake integrates stormwater regulation and storage with ecological and landscape functions [20]. However, in recent years, ongoing urban development and intensified anthropogenic activities have imposed increasing pollution pressures on the lake, threatening its ecological integrity and water quality.
The Meishe River in Haikou (Figure 1c) is a major river that traverses the city’s main urban area, exhibiting an arc-shaped flow path. It originates in the Yangshan area in the south and flows northward through the Longhua, Qiongshan, and Meilan districts before ultimately discharging into the Nandu River. The river spans a total length of approximately 23.8 km and drains a watershed area of about 52.3 square kilometers. Following comprehensive ecological restoration, the Meishe River has been transformed into an urban ecological corridor. Within the river channel, various ecological landscapes—such as terraced wetlands and vegetated buffer strips—have been established, and extensive riparian green spaces have been developed along both banks. As a result, the river’s water quality has been maintained at a relatively high level. Measures including sewage interception and ecological water replenishment have significantly enhanced its self-purification capacity. Today, the Meishe River fulfills multiple functions, including flood control and drainage, ecological conservation, and urban recreation, and serves as a model of Sponge City development in Haikou [21].

2.2. Data Sources and Processing

2.2.1. Remote Sensing Data and Processing

The remote sensing data used in this study were obtained from the GF-2 satellite imagery provided by the China Resources Satellite Data and Application Center (CRESDA) on 14 January 2023. As a key component of China’s High-Resolution Earth Observation System, GF-2 is equipped with spectral bands and spatial resolution suitable for high-precision mapping and multispectral analysis. To improve classification accuracy, panchromatic and multispectral images were fused using a pan-sharpening technique, resulting in multispectral imagery with a spatial resolution of 2 m. This high-resolution dataset was employed for the extraction of land use/land cover (LULC) types. In conjunction with field surveys, supervised classification was conducted using the Maximum Likelihood Classification (MLC) algorithm within the ArcMap 10.8 software environment. LULC types in the study area were classified based on the national standard Current Land Use Classification (GB/T 21010–2017) [22], and categorized into six primary classes: Built-up Land, Forest Land, Grassland, Cropland, Water Bodies, and Unused Land.

2.2.2. Water Quality Data Collection and Measurement

Sampling points were established based on the spatial distribution characteristics of the selected urban water bodies. Adhering to the principle of spatial uniformity, monitoring locations were arranged at approximately equidistant intervals along each water body. Ultimately, 16 water quality monitoring points were set in Hongcheng Lake (Figure 1a; A1–A16), 9 points in Jinniu Lake (Figure 1b; B1–B9), and 5 points in the Meishe River (Figure 1c; C1–C5). Water quality monitoring was conducted on a quarterly basis. Sampling commenced in July 2024 and continued through October 2024, January 2025, and April 2025, thus covering four consecutive quarters. At each sampling site, a 500 mL water sample was collected at a depth of approximately 0.5 m below the water surface. All samples were transported to the laboratory on the same day for further analysis to minimize potential degradation or contamination. The measured water quality parameters included Chemical Oxygen Demand (COD), Total Nitrogen (TN), Total Phosphorus (TP), Ammonia Nitrogen (NH3-N), Turbidity, and Suspended Solids (SS) (see Table 1). All analytical procedures were conducted in accordance with national standard methods to ensure the reliability and accuracy of the data.
The data were first standardized using the Z-Score method (Equation (1)) to facilitate the examination of water quality differences between water bodies and seasonal variations, ensuring unbiased participation in multivariate analysis.
Z = x μ σ
where x is the original data value, μ is the mean of the original data, and σ is the standard deviation of the original data.

2.3. Significance Testing of Differences

To analyze differences in water quality parameters among the various water bodies, the data were first subjected to the Kolmogorov–Smirnov normality test. Parameters with a p-value > 0.05 were considered to conform to a normal distribution, whereas those with a p-value ≤ 0.05 were deemed non-normally distributed. For parameters conforming to normality, homogeneity of variance was assessed. If the assumption of homogeneity was violated (heteroscedasticity), pairwise comparisons were conducted using the Games–Howell post hoc test. For parameters not conforming to normality, non-parametric tests were applied. The Kruskal–Wallis H test was initially used to evaluate overall differences, with p-values ≤ 0.05 indicating statistically significant differences and p-values > 0.05 indicating no significant difference. When the Kruskal–Wallis test revealed significant differences (p ≤ 0.05), subsequent pairwise comparisons were performed using the Mann–Whitney U test. The Bonferroni correction was applied to adjust for multiple comparisons, where adjusted p-values ≤ 0.05 denoted statistically significant pairwise differences, and adjusted p-values > 0.05 indicated no significant difference. Seasonal variations in water quality parameters were illustrated using multiple line graphs. Furthermore, Principal Component Analysis (PCA) was employed to identify the key pollution indicators within the studied water bodies [23].

2.4. Multi-Scale Landscape Pattern Index Calculation

Land use/land cover (LULC) types constitute the fundamental material basis for analyzing landscape patterns. The diversity of LULC directly affects landscape heterogeneity, and the interplay between these factors—shaped by ecological processes and anthropogenic activities—collectively governs the structure and function of regional ecosystems [24]. Landscape pattern indices provide quantitative metrics describing the spatial distribution characteristics of landscapes, encompassing aspects such as patch number, shape complexity, area proportion, and spatial connectivity [25]. Following the extraction and classification of LULC types, circular buffer zones with radii of 500 m, 1000 m, and 2000 m were established around each water quality sampling point. Within these buffers, landscape pattern indices were calculated for each study area. This multi-scale buffer approach was employed to explore landscape characteristics at varying spatial extents surrounding the three urban water bodies.
Extraction and analysis of land use/land cover (LULC) data were conducted within buffer zones of varying spatial scales. Using the “Extract by Mask” tool in ArcMap 10.8, LULC raster data corresponding to each buffer zone were obtained. These datasets were subsequently imported into Fragstats 4.2 software to calculate landscape pattern indices. Based on their ecological significance in characterizing landscape fragmentation, aggregation, isolation, connectivity, and diversity, eleven landscape-level metrics were selected for analysis (Table 2). These landscape-level metrics represent the overall structural attributes resulting from the spatial arrangement and composition of different patch types [26]. The selected landscape pattern indices include: Number of Patches (NP), Patch Density (PD), Largest Patch Index (LPI), Landscape Shape Index (LSI), Contagion Index (CONTAG), Interspersion and Juxtaposition Index (IJI), Patch Cohesion Index (COHESION), Landscape Division Index (DIVISION), Shannon’s Diversity Index (SHDI), Shannon’s Evenness Index (SHEI), and Aggregation Index (AI).

2.5. Correlation Analysis

Correlation analysis between landscape structure and water quality parameters was conducted using SPSS 27 software. To mitigate potential multicollinearity and ensure the stability of the results, Pearson correlation analysis was first performed to identify and remove highly correlated landscape pattern indices.
Spearman’s rank correlation, a non-parametric statistical method (Equation (2)), was subsequently applied to assess the strength and direction of associations between variables [27]. Specifically, Spearman’s rank correlation was used to evaluate the relationships between land use types, landscape pattern indices at different buffer scales, and water quality parameters.
ρ = 1 6 d i 2 n ( n 2 1 )
where di is the difference between the ranks of corresponding values for the two variables, and n is the sample size.
Redundancy Analysis (RDA) is a constrained ordination technique that integrates multiple linear regression with principal component analysis to explore the relationships between explanatory and response variables [28]. In this study, RDA was employed to investigate the driving effects of landscape pattern indices on water quality parameters and to identify key landscape factors along with the direction and strength of their influence. In the RDA ordination biplot, the angle between vectors represents the correlation between variables: an acute angle indicates a positive correlation, whereas an obtuse angle denotes a negative correlation. The length of each vector corresponds to the strength of the relationship, with longer arrows indicating stronger correlations.

3. Results

3.1. Analysis of Water Quality Parameter Characteristics

3.1.1. Differences in Water Quality Parameters Among Urban Water Bodies

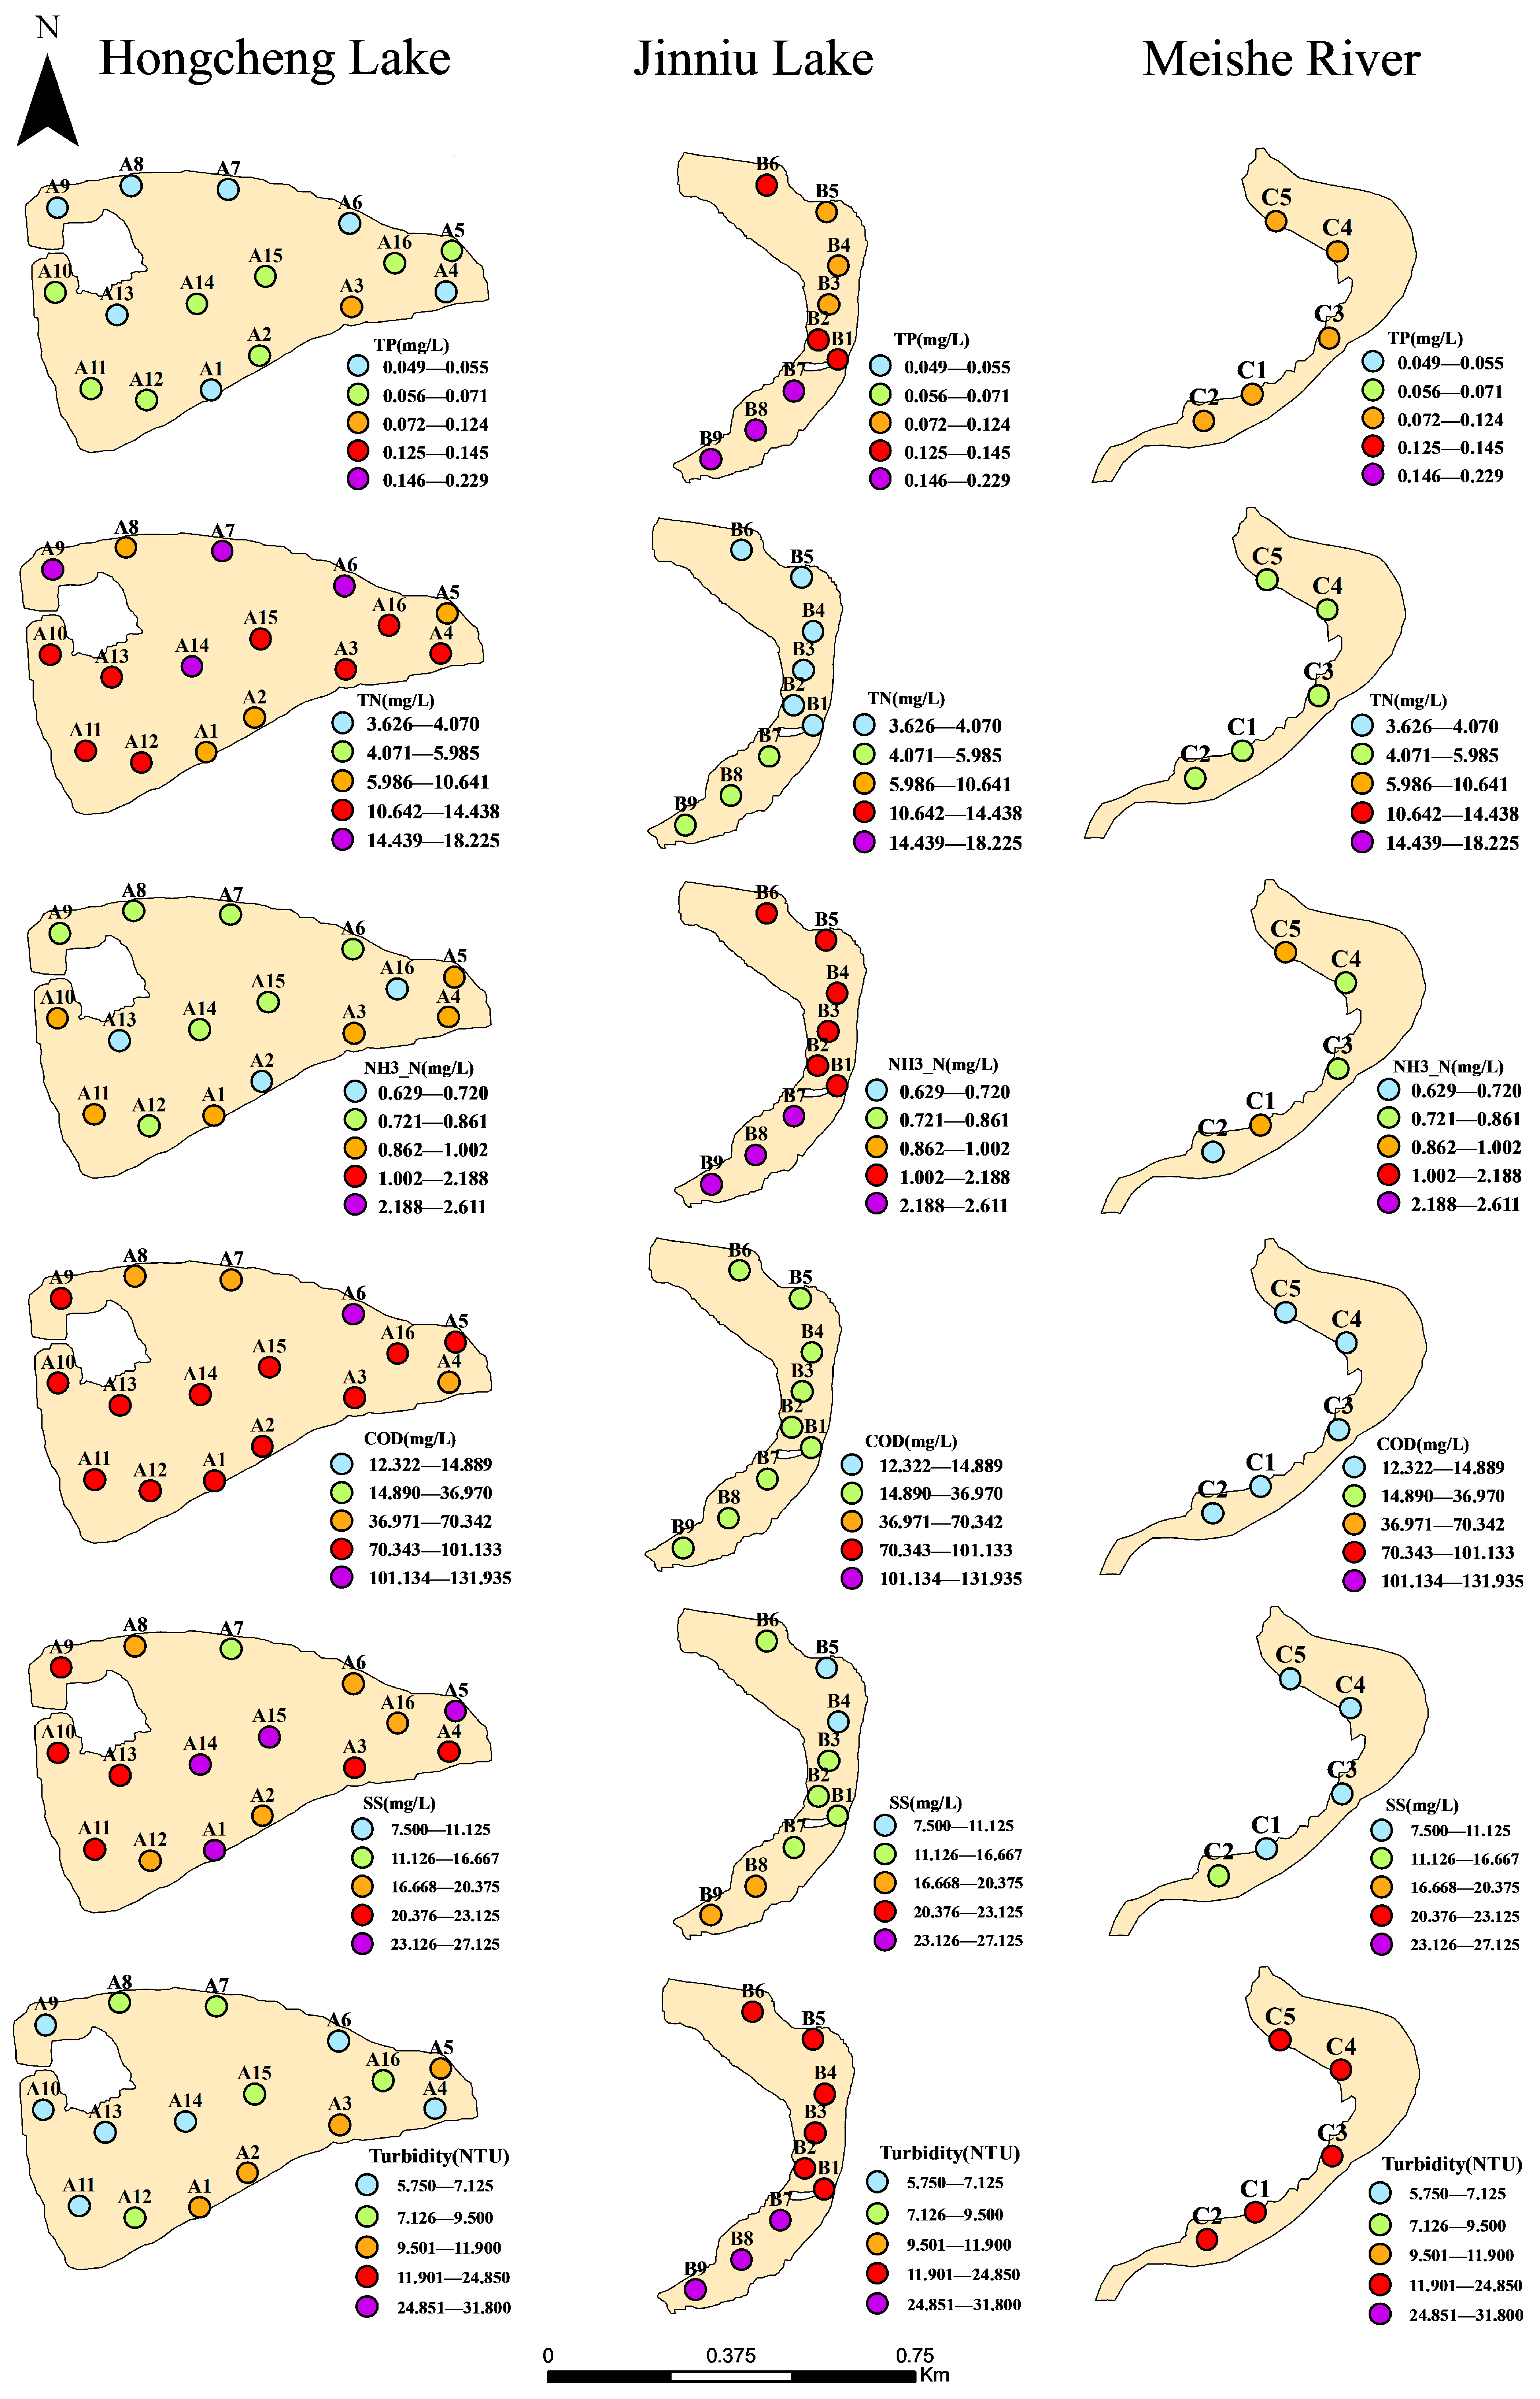
Significant differences in overall water quality parameters were observed among the three water bodies (Table 3 and Table 4). Normality tests indicated that Suspended Solids (SS) conformed to a normal distribution, allowing the application of parametric tests. Results revealed statistically significant differences in SS between Hongcheng Lake and Jinniu Lake, as well as between Hongcheng Lake and the Meishe River, while no significant difference was detected between Jinniu Lake and the Meishe River. In contrast, Total Phosphorus (TP), Total Nitrogen (TN), Ammonia Nitrogen (NH3-N), Chemical Oxygen Demand (COD), and Turbidity did not meet normality assumptions; hence, non-parametric tests were employed. The analysis showed no significant difference in TP between Jinniu Lake and the Meishe River, no significant differences in TN and NH3-N between Hongcheng Lake and the Meishe River, no significant difference in COD between Hongcheng Lake and Jinniu Lake, and no significant difference in Turbidity between Jinniu Lake and the Meishe River. All other pairwise comparisons for these parameters among the water bodies exhibited statistically significant differences. To visually represent these variations, the six water quality parameters were classified into five levels each using the Jenks Natural Breaks classification method implemented in ArcMap 10.8 software (Figure 2).

3.1.2. Seasonal Variation Characteristics of Urban Water Bodies

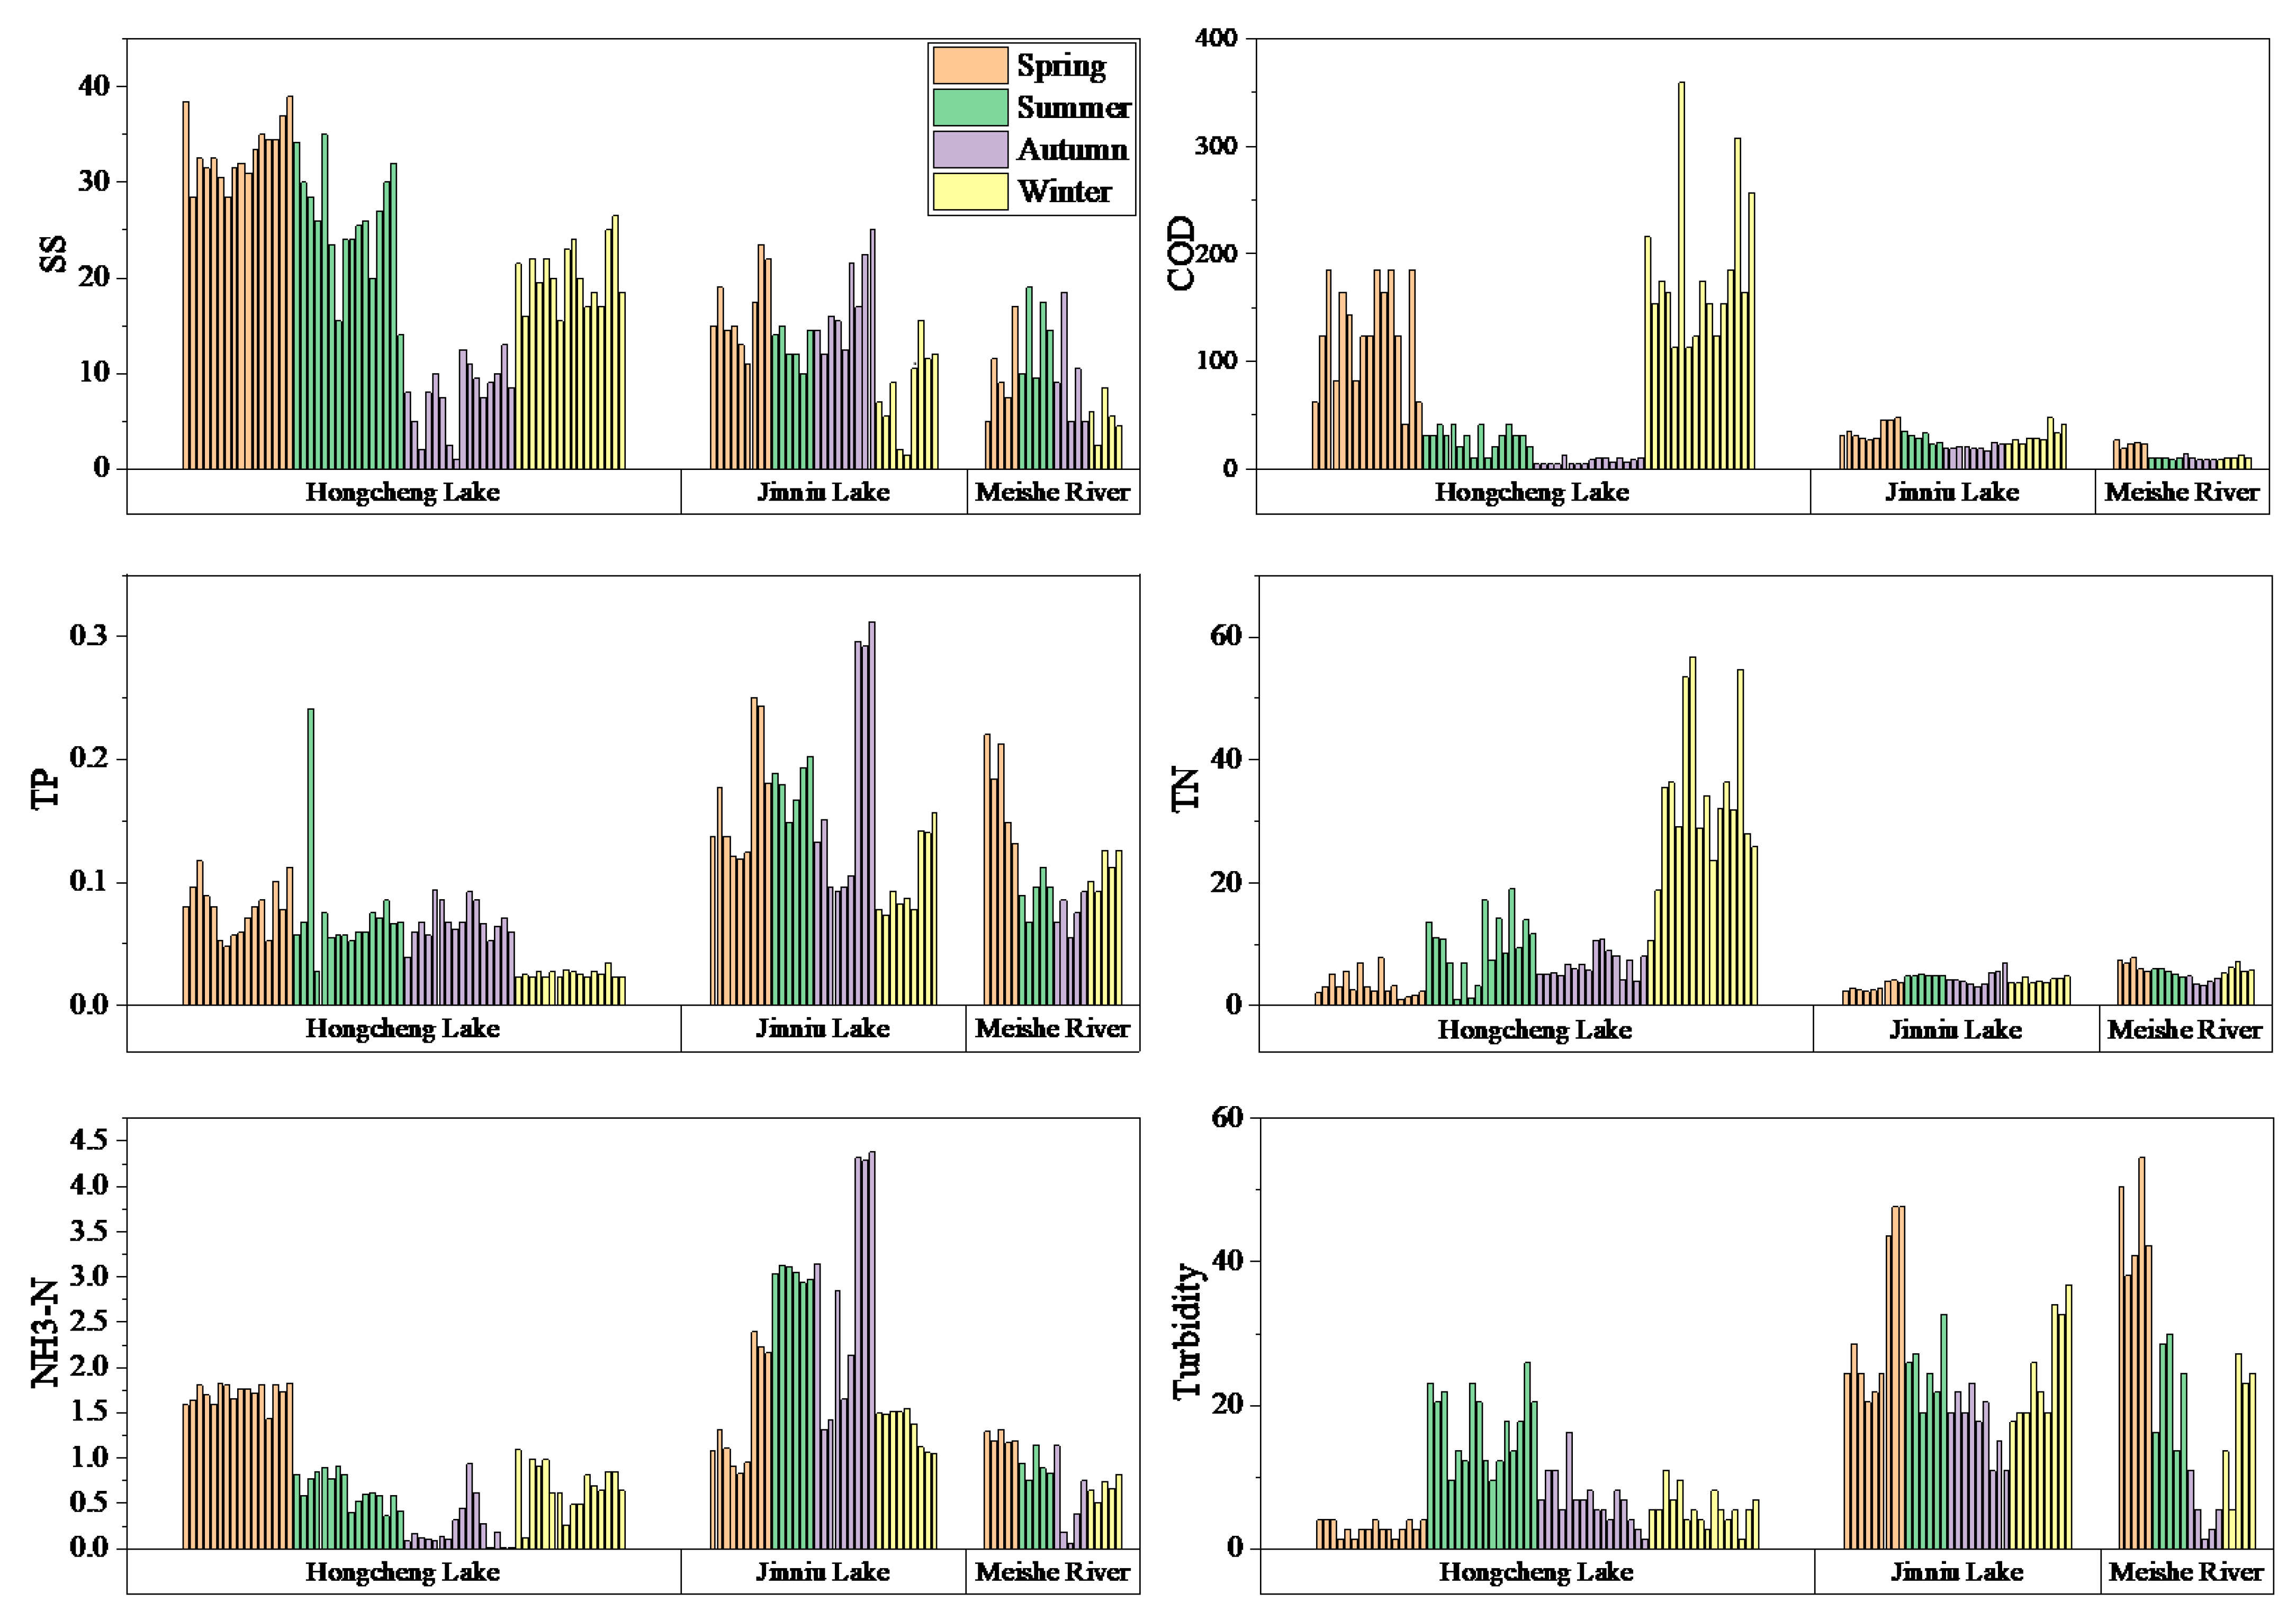
Seasonal variations in water quality parameters for each water body are illustrated in Figure 3. Hongcheng Lake exhibited significant seasonal fluctuations in Chemical Oxygen Demand (COD), with concentrations notably higher in spring and winter compared to summer and autumn. In contrast, COD seasonal variability was relatively minor in both Jinniu Lake and the Meishe River. Jinniu Lake showed marked seasonal changes in Ammonia Nitrogen (NH3-N), with elevated concentrations during summer and autumn relative to spring and winter. Conversely, Hongcheng Lake and the Meishe River displayed comparatively minor seasonal variation in NH3-N, characterized by an initial decrease followed by an increase, with the lowest mean concentrations occurring in autumn. Regarding phosphorus and nitrogen dynamics, both Jinniu Lake and the Meishe River exhibited considerable seasonal variation in Total Phosphorus (TP), while their seasonal fluctuations in Total Nitrogen (TN) were relatively limited. In contrast, Hongcheng Lake demonstrated minimal seasonal variation in TP but significant seasonal differences in TN. All three water bodies experienced pronounced seasonal variability in Suspended Solids (SS) and Turbidity.

3.1.3. Major Pollution Parameters in Water Bodies

The Kaiser-Meyer–Olkin (KMO) measure values for all three water bodies exceeded 0.5, and Bartlett’s test of sphericity produced p-values below 0.05, confirming the appropriateness of the data for Principal Component Analysis (PCA). The PCA results, summarized in Table 5, indicate that: Hongcheng Lake: water quality is predominantly influenced by Ammonia Nitrogen (NH3-N) and Suspended Solids (SS), which together account for 37.81% of the total variance. Jinniu Lake: total Phosphorus (TP), Ammonia Nitrogen (NH3-N), and Total Nitrogen (TN) exert significant impacts on water quality, collectively explaining 45.82% of the variance. Meishe River: water quality is influenced by a composite set of parameters including Turbidity, Total Phosphorus (TP), Chemical Oxygen Demand (COD), Ammonia Nitrogen (NH3-N), and Total Nitrogen (TN), with a combined variance contribution rate of 66.20%.

3.2. Analysis of Landscape Pattern Characteristics Around Urban Water Bodies

3.2.1. Landscape Characteristics Around Urban Water Bodies

The composition of land use/land cover (LULC) types within varying spatial scales (buffer zones) surrounding the monitoring points of Hongcheng Lake, Jinniu Lake, and the Meishe River showed notable differences (Figure 4). Hongcheng Lake: Within the 500 m buffer zone, Built-up Land and Water Bodies were the dominant LULC types. Except for sampling points A7 and A8, Built-up Land coverage exceeded 40% across all points and surpassed 50% at most locations. Water Bodies accounted for roughly 30% at all points except A4 and A5. As the buffer radius expanded, Built-up Land became increasingly dominant, rising above 60% within the 1000 m buffer and exceeding 70% within the 2000 m buffer. In contrast, Water Bodies coverage sharply declined to about 10% in the 1000 m buffer and further dropped to nearly 5% in the 2000 m buffer. Cropland coverage increased with buffer scale and remained relatively stable, while Grassland and Forest Land gradually decreased, showing slight variations among sampling points. Unused Land coverage exhibited minimal change. Jinniu Lake: At the 500 m scale, Built-up Land, Forest Land, and Water Bodies constituted the primary LULC types. Built-up Land coverage was approximately 50% at all points and increased with buffer expansion. Meanwhile, Forest Land and Water Bodies proportions decreased as the buffer scale enlarged. Grassland and Unused Land showed minor fluctuations, and Cropland coverage was minimal, approximately 1%. Meishe River: Within the 500 m buffer, Grassland, Built-up Land, and Water Bodies were predominant. Notably, sampling points C1 and C2 had significantly higher proportions of Unused Land and lower percentages of Water Bodies compared to points C3, C4, and C5. With increasing buffer radius, Built-up Land coverage increased, while Grassland coverage decreased but remained one of the major land types. Water Bodies coverage steadily declined, Cropland expanded, and Forest Land and Unused Land maintained relatively stable proportions.

3.2.2. Landscape Pattern Indices Around Urban Water Bodies

Figure 5 illustrates the landscape pattern indices of the urban water bodies across multiple spatial scales. For all three water bodies, the Number of Patches (NP), Patch Density (PD), Largest Patch Index (LPI), Landscape Shape Index (LSI), and Patch Cohesion Index (COHESION) values increased as the buffer radius expanded. This trend indicates that with larger buffer zones, landscape fragmentation intensified, dominant patches became more prominent, patch edges grew more complex, and patch connectivity improved. Notably, COHESION values consistently exceeded 90%, reflecting strong patch connectivity within each study area. In contrast, the Landscape Division Index (DIVISION), Shannon’s Diversity Index (SHDI), Shannon’s Evenness Index (SHEI), and Aggregation Index (AI) decreased with increasing buffer size. This suggests that larger buffer zones corresponded with more continuous and homogeneous landscapes, reduced landscape diversity, dominance by fewer patch types, and a decline in overall aggregation. However, AI values remained above 90%, indicating a sustained high level of patch aggregation. The Contagion Index (CONTAG) rose with buffer expansion for Hongcheng Lake and Jinniu Lake, with median values exceeding 60% within the 1000 m and 2000 m buffers, signaling a high degree of dominance and spread of particular patch types. Conversely, the Meishe River’s mean CONTAG initially decreased and then increased, fluctuating between 50% and 60%. This pattern reflects a gradient in its landscape structure: from localized aggregation at smaller scales, to mixed patterns at intermediate scales, and re-aggregation at larger scales. Regarding the Interspersion and Juxtaposition Index (IJI), Hongcheng Lake exhibited a decrease with buffer expansion, ranging from 55% to 62%, indicating a reduction in adjacency diversity and a trend toward spatial homogenization of patch types. Conversely, IJI values for Jinniu Lake and the Meishe River increased with buffer size, reflecting enhanced adjacency diversity and more uniform spatial mixing of patches at larger scales. Jinniu Lake’s IJI ranged between 50% and 60%, representing moderate adjacency diversity, whereas the Meishe River’s IJI exceeded 60%, indicative of a highly interdigitated and spatially intermixed patch distribution.

3.3. Correlation Analysis of Landscape Characteristics and Water Quality Parameters

3.3.1. Correlation Analysis of Landscape Composition and Water Quality Parameters

Spearman’s rank correlation analysis between landscape composition and water quality parameters for the urban water bodies was conducted using SPSS 27, with the results summarized in Table 6, Table 7 and Table 8.
Hongcheng Lake: Built-up Land exhibited consistent positive correlations with Total Phosphorus (TP), Ammonia Nitrogen (NH3-N), Chemical Oxygen Demand (COD), Suspended Solids (SS), and Turbidity across all buffer scales. Forest Land, in contrast, showed overall negative correlations with TP, NH3-N, SS, and Turbidity. Grassland was negatively correlated with NH3-N and SS, but positively correlated with Total Nitrogen (TN) and COD. Cropland was positively associated with TN, and displayed a significant negative correlation with Turbidity within the 500 m buffer. Water Bodies were generally negatively correlated with TN, TP, NH3-N, and COD, but positively correlated with SS and Turbidity. Unused Land demonstrated a positive correlation with TN and a negative correlation with TP.
Jinniu Lake: Built-up Land showed predominantly significant negative correlations with water quality parameters in the 500 m and 2000 m buffers, but significant positive correlations within the 1000 m buffer. The 500 m buffer zone of Jinniu Lake is characterized by the lake surrounded by park green spaces, and it has a negative correlation with water quality. The 1000 m buffer zone is a key area where the natural landscape of Jinniu Lake transitions to the urban built-up area, and the landscape fragmentation degree significantly increases. It has a positive correlation with water quality. The 2000 m buffer zone covers the entire catchment area of Jinniu Lake and forms a relatively high-connectivity landscape network with large areas of forest land (accounting for 30%) and grassland (accounting for 15%). It has a negative correlation with water quality. Forest Land exhibited significant positive correlations with water quality parameters in the 500 m buffer, transitioning to significant negative correlations in the 1000 m buffer. Cropland showed significant positive correlations with certain water quality parameters in the 2000 m buffer. Water Bodies consistently demonstrated significant negative correlations with water quality parameters across all buffer zones. Unused Land was negatively correlated with water quality indicators within the 500 m buffer.
Meishe River: Built-up Land generally exhibited positive correlations with TP, NH3-N, COD, and Turbidity. Forest Land showed negative correlations with NH3-N, COD, SS, and Turbidity, but positive correlations with TN and TP. Grassland was negatively correlated with COD, NH3-N, SS, and Turbidity. Cropland was positively associated with TN and SS. Unused Land showed negative correlations with TP, NH3-N, COD, and Turbidity, while exhibiting positive correlations with TN and SS.

3.3.2. Correlation Analysis of Landscape Pattern Indices and Water Quality Parameters

To mitigate the effects of multicollinearity on correlation analysis, Pearson correlation analysis was initially conducted (Table 9, Table 10 and Table 11) to identify and eliminate highly autocorrelated landscape pattern indices. This step preceded the application of Spearman’s rank correlation analysis between landscape pattern indices and water quality parameters. For Hongcheng Lake, six landscape pattern indices were retained: Number of Patches (NP), Largest Patch Index (LPI), Landscape Shape Index (LSI), Interspersion and Juxtaposition Index (IJI), Landscape Division Index (DIVISION), and Shannon’s Diversity Index (SHDI). For Jinniu Lake, seven indices were preserved: NP, LPI, LSI, IJI, DIVISION, SHDI, and Aggregation Index (AI). For Meishe River, six indices were retained: NP, LPI, LSI, IJI, SHDI, and AI. Considering the smaller sample size for the Meishe River, three landscape pattern indices and three water quality parameters were subsequently selected for Redundancy Analysis (RDA), based on their relevance to the characteristics of the urban environment.
The results of the Spearman’s rank correlation analysis between landscape pattern indices and water quality parameters for the urban water bodies are summarized in Table 12, Table 13 and Table 14. Hongcheng Lake: No statistically significant correlations were observed between the landscape pattern indices and water quality parameters across any buffer scale, indicating a weak or non-systematic relationship in this water body. Jinniu Lake: Within the 500- m buffer, most landscape pattern indices exhibited statistically significant correlations with water quality parameters, except for the Interspersion and Juxtaposition Index (IJI) and Shannon’s Diversity Index (SHDI), which showed no significant associations. Within the 1000 m buffer, the Number of Patches (NP), Largest Patch Index (LPI), Landscape Shape Index (LSI), and IJI were positively correlated with various water quality parameters, whereas DIVISION, SHDI, and Aggregation Index (AI) showed negative correlations. Within the 2000 m buffer, all landscape pattern indices displayed statistically significant correlations with water quality parameters. Among these, only AI and LPI were negatively correlated, while the remaining indices demonstrated significant positive correlations. Meishe River: Within the 500 m buffer, NP exhibited a significant negative correlation with Total Phosphorus (TP), LPI showed a significant negative correlation with Total Nitrogen (TN), and LSI, IJI, and AI were significantly negatively correlated with Turbidity. Within the 2000 m buffer, NP continued to show a significant negative correlation with TP, suggesting a consistent spatial relationship at both scales.

3.3.3. Redundancy Analysis of Water Quality Parameters and Landscape Characteristics

The Redundancy Analysis (RDA) results are summarized in Table 15 and reveal notable spatial-scale effects across the three urban water bodies.
Across all three water bodies, the 2000 m buffer consistently exhibited the highest cumulative explained variance. This indicates that landscape patterns within the 2000 m buffer exert the greatest explanatory power on water quality parameters. Therefore, the 2000 m buffer zone is identified as the optimal spatial extent for assessing the influence of landscape structure on water quality in Hongcheng Lake, Jinniu Lake, and the Meishe River.
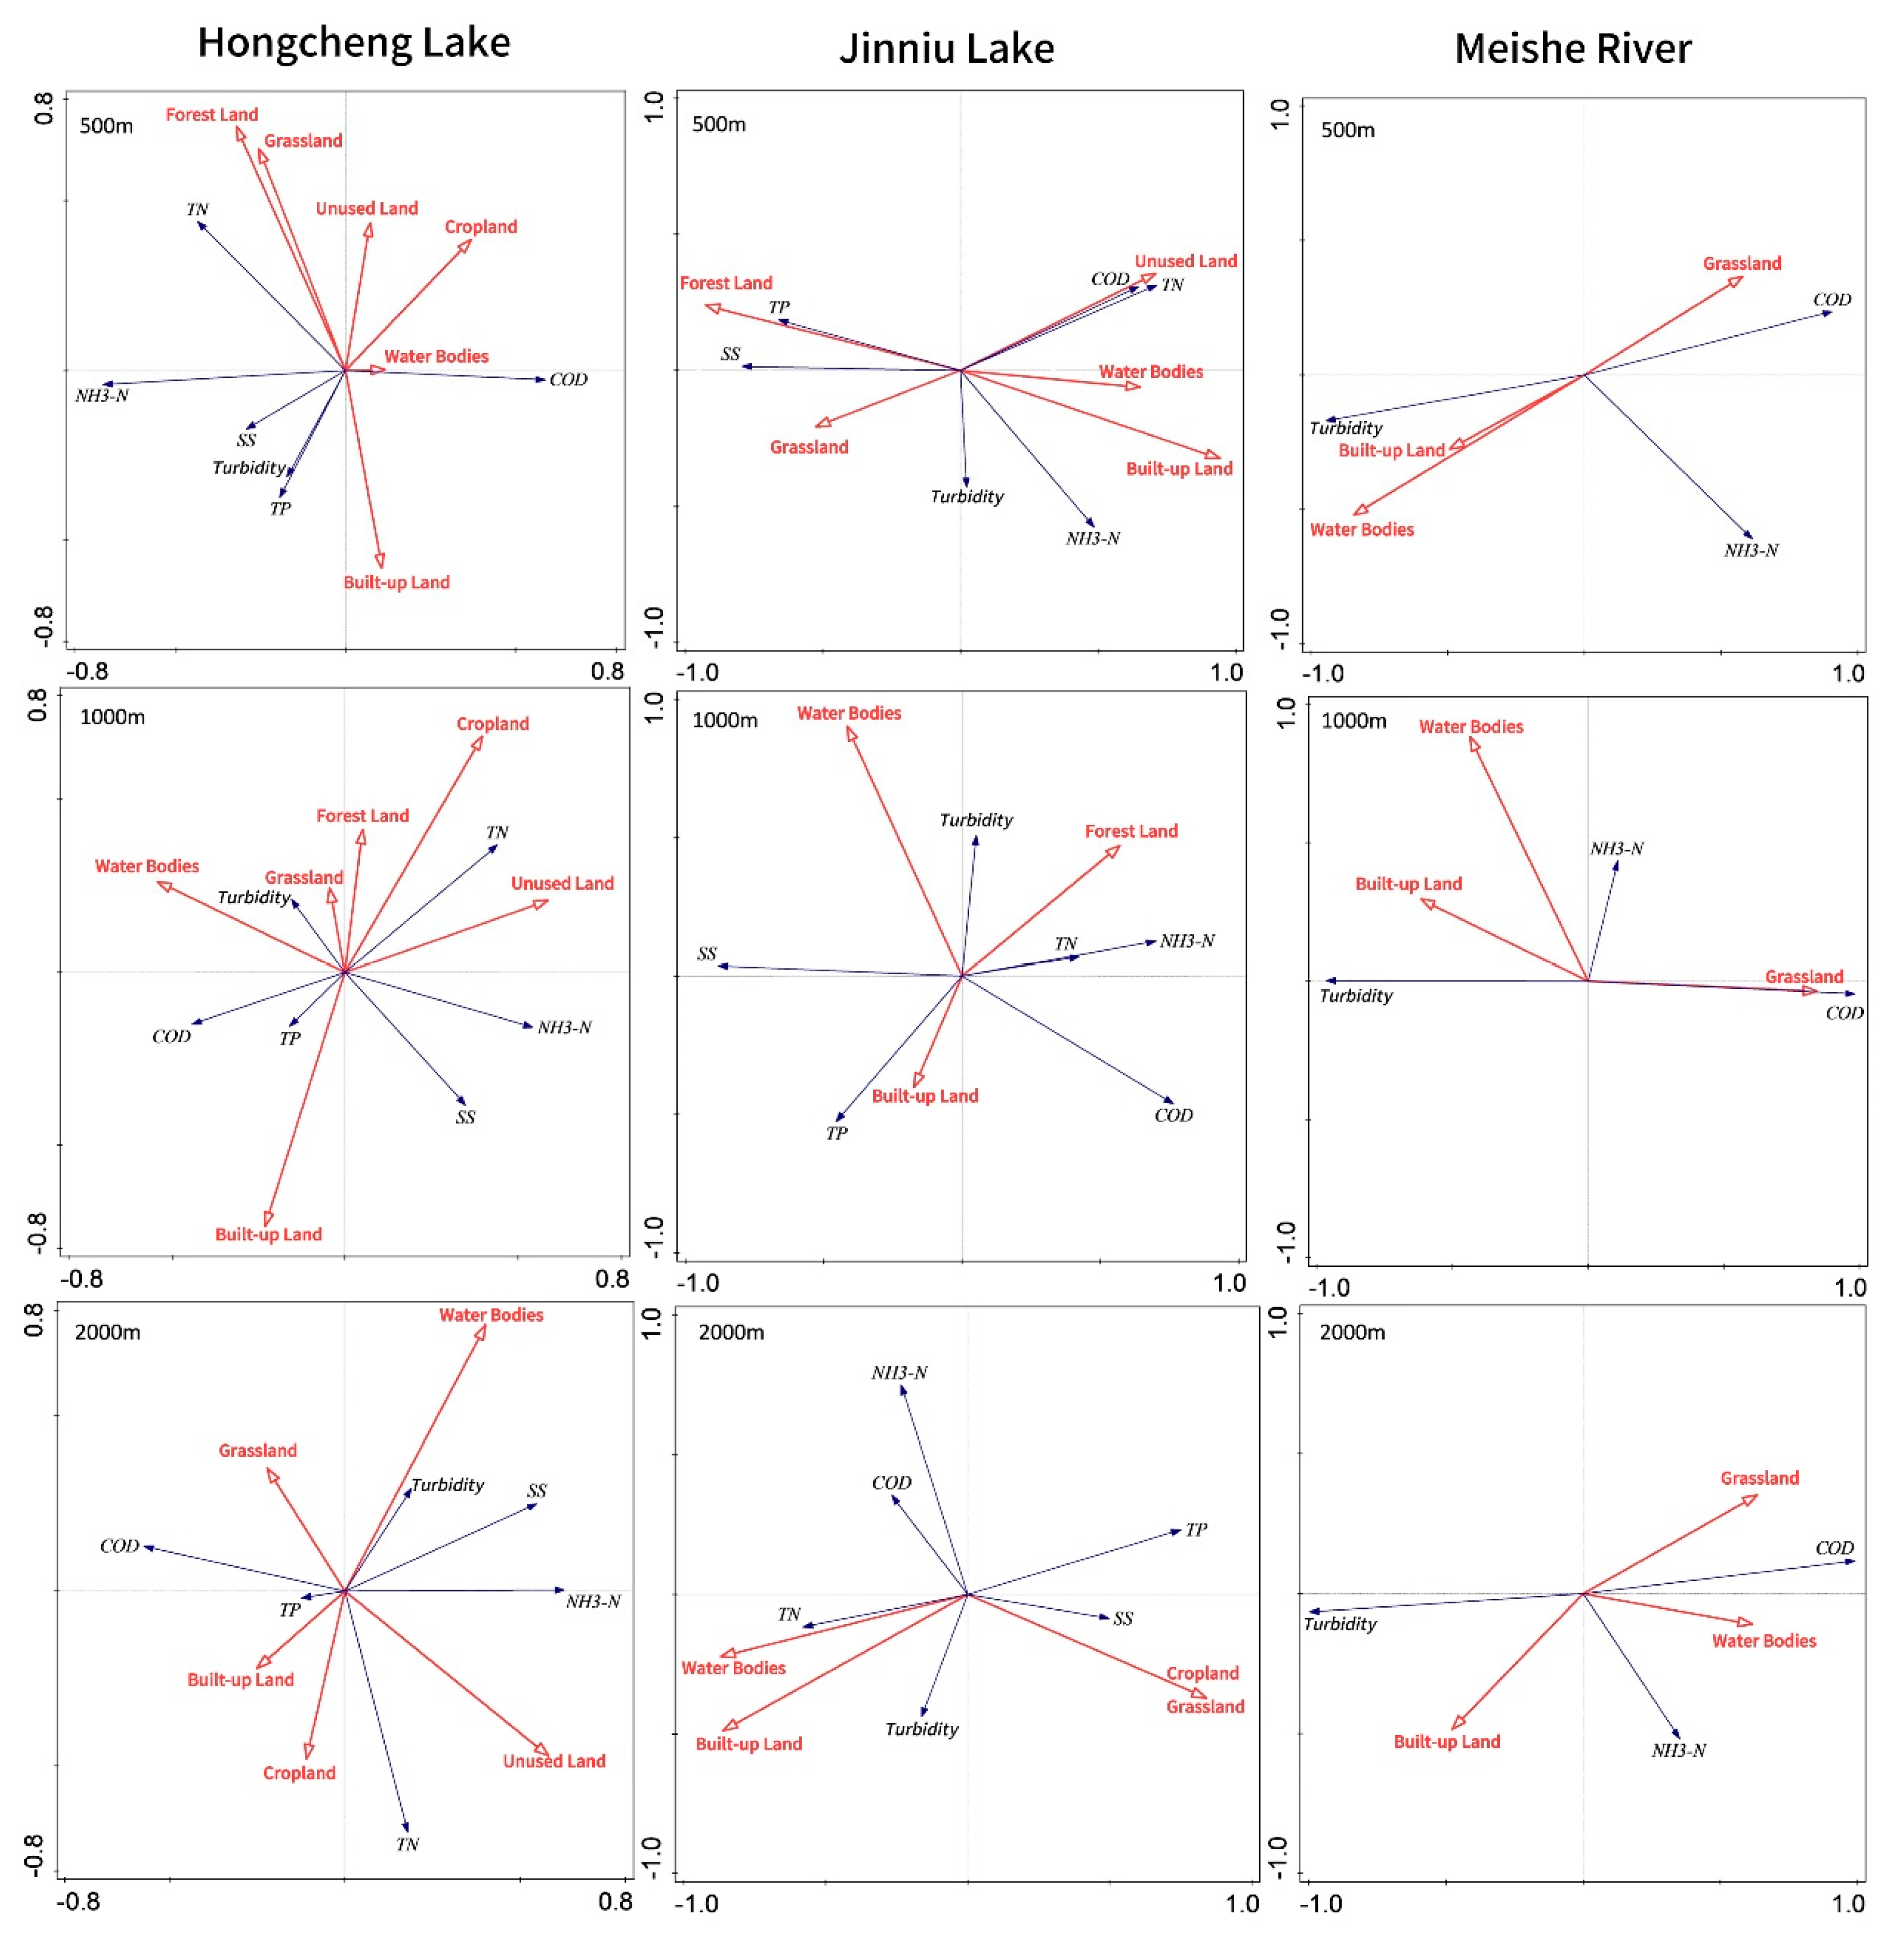
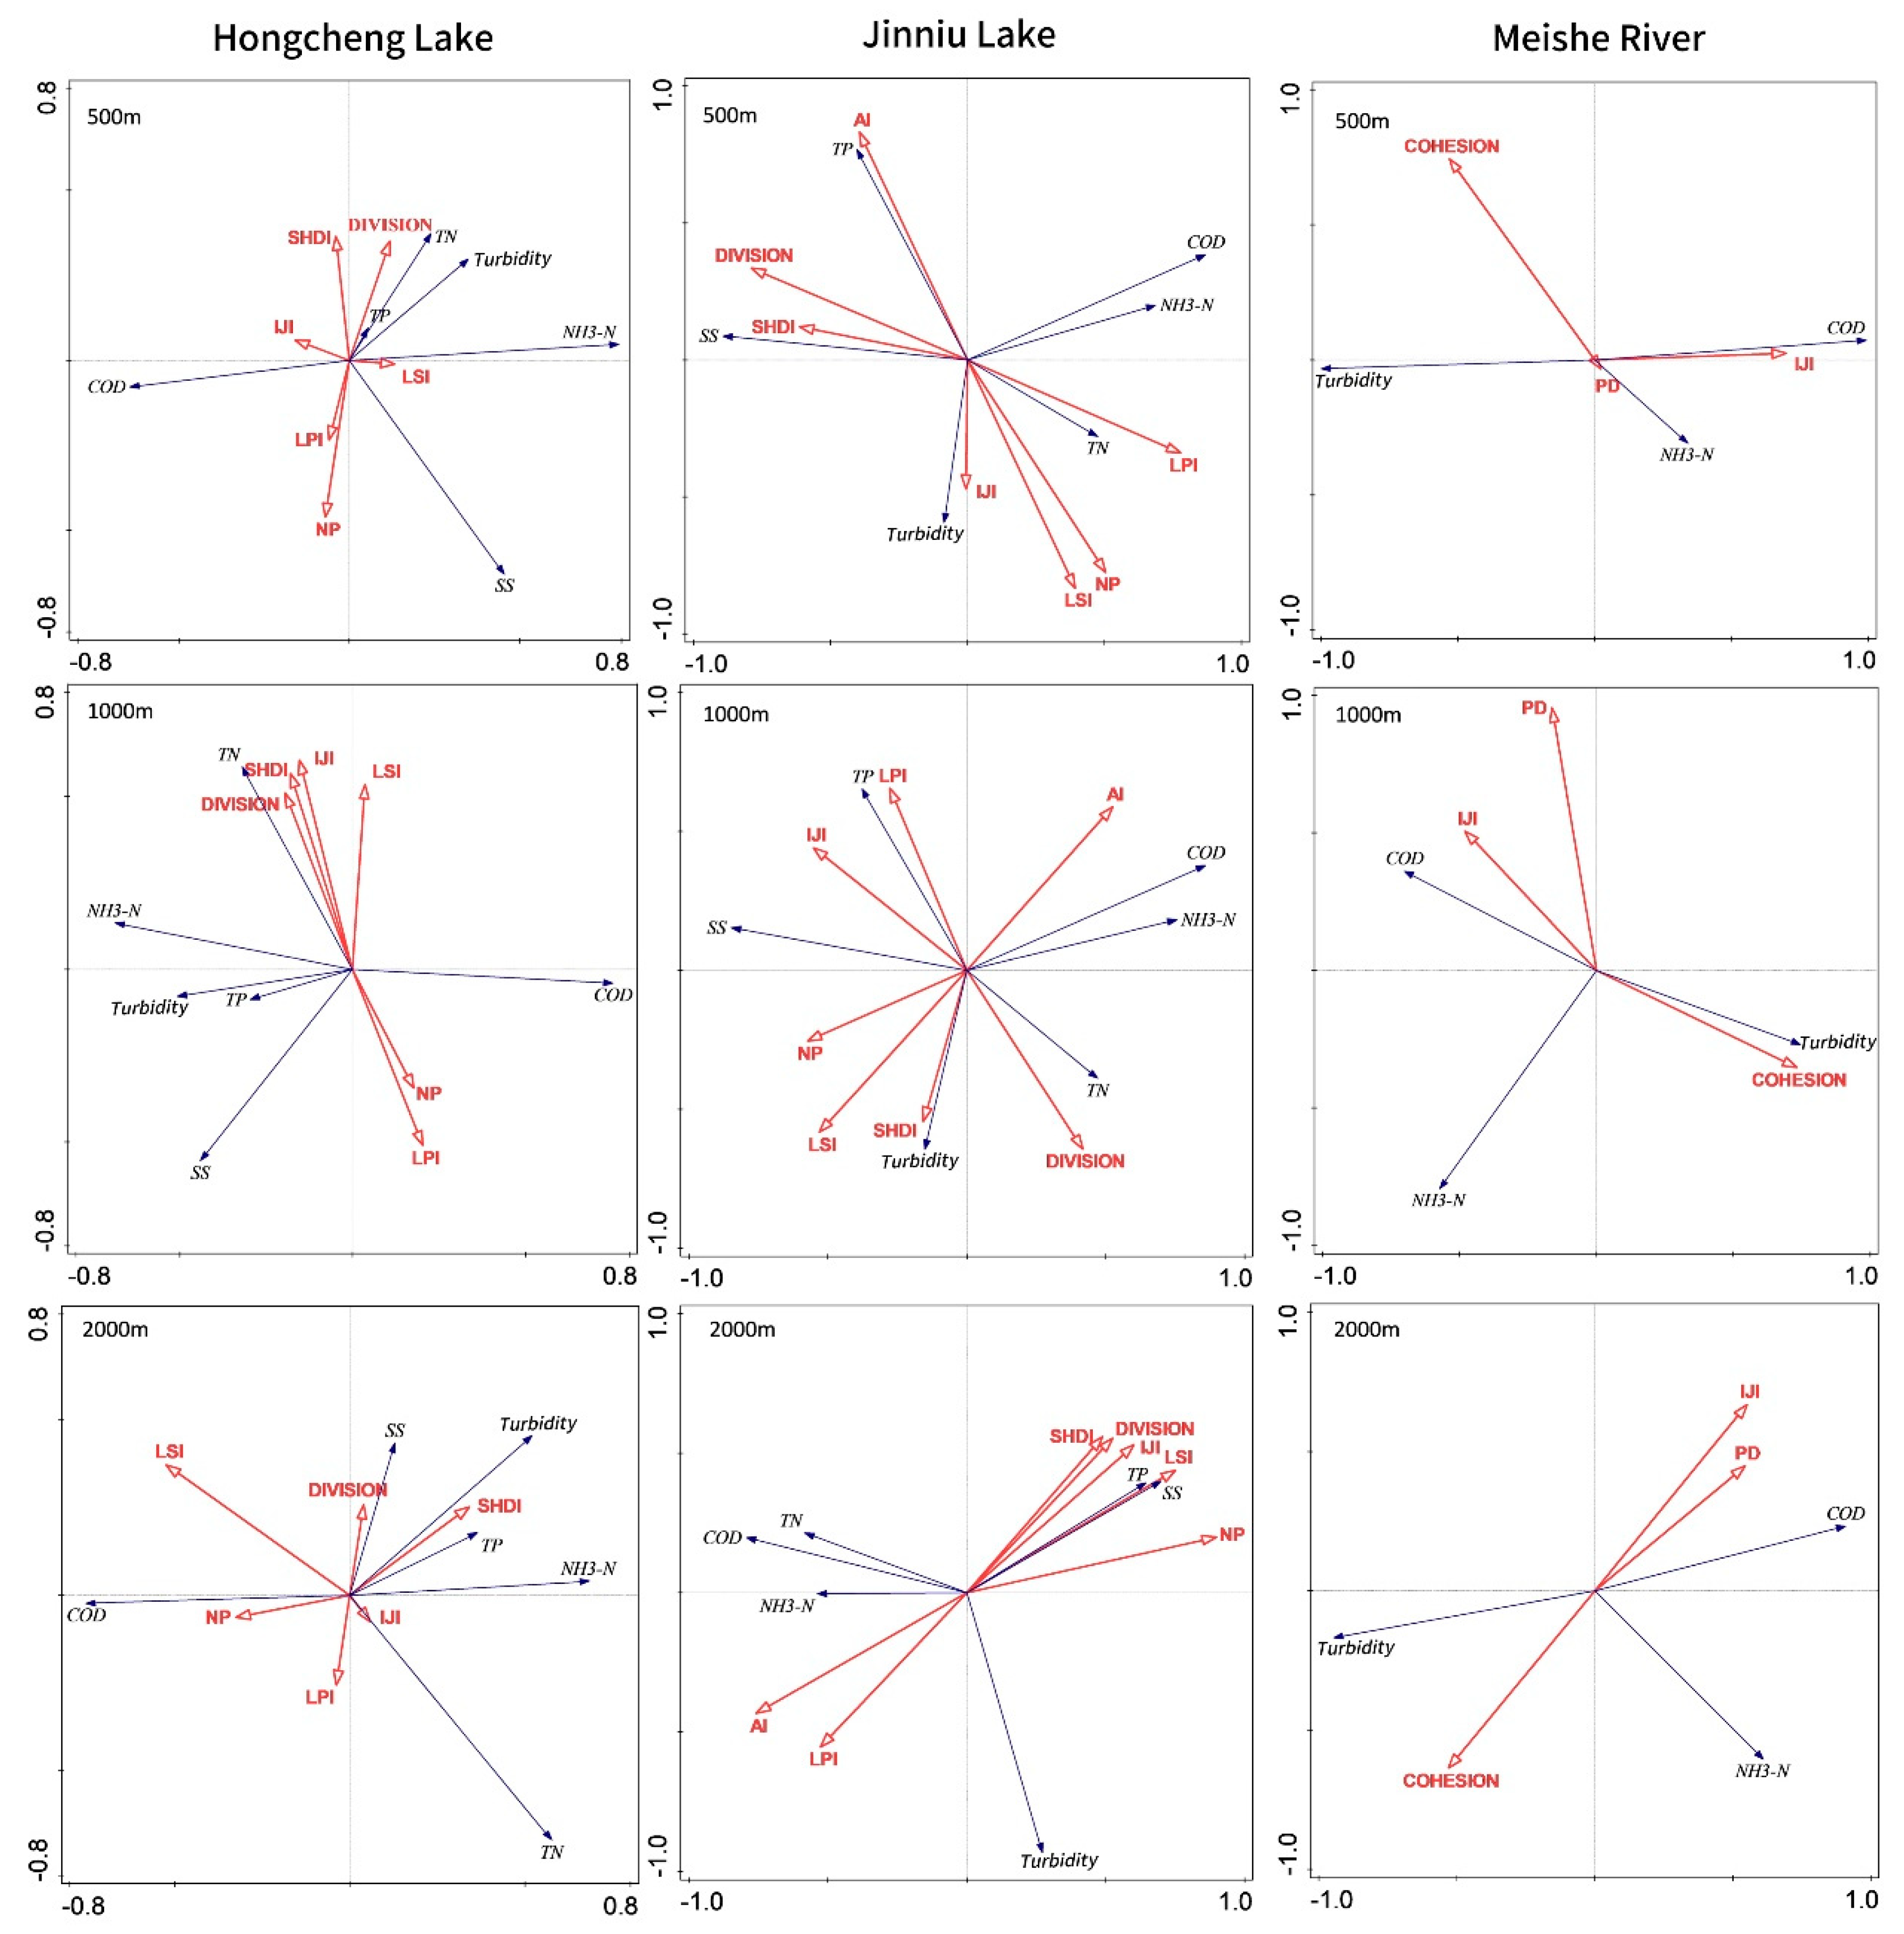
The RDA ordination biplots (Figure 6 and Figure 7) illustrate the relationships between landscape composition, landscape pattern indices, and water quality parameters for Hongcheng Lake, Jinniu Lake, and Meishe River across different buffer scales.
Hongcheng Lake—500 m buffer: Total Nitrogen (TN) exhibited positive correlations with Forest Land, Grassland, and Unused Land, but was negatively associated with Built-up Land and Water Bodies. Total Phosphorus (TP), Suspended Solids (SS), and Turbidity were positively correlated with Built-up Land, while showing negative correlations with Forest Land, Grassland, and Unused Land. From the perspective of landscape pattern indices, TN, TP, and Turbidity were positively associated with Landscape Shape Index (LSI), Landscape Division Index (DIVISION), and Shannon’s Diversity Index (SHDI), indicating a relationship with more fragmented and diverse landscapes. Chemical Oxygen Demand (COD) demonstrated positive correlations with Interspersion and Juxtaposition Index (IJI), Largest Patch Index (LPI), and Number of Patches (NP), suggesting that spatial patch complexity contributes to variations in organic pollution.
Hongcheng Lake—1000 m buffer: TN showed positive correlations with Cropland and Unused Land, while COD was positively correlated with Built-up Land. Ammonia Nitrogen (NH3-N) exhibited negative correlations with Forest Land, Grassland, and Water Bodies. In terms of landscape indices, TN was positively associated with LSI, IJI, SHDI, and DIVISION, reflecting increasing spatial heterogeneity. In contrast, both NH3-N and TN were negatively correlated with LPI and NP, implying that larger and more contiguous patches may help suppress nitrogen concentrations. COD showed positive correlations with NP and LPI, again linking more extensive or numerous patches to organic load.
Hongcheng Lake—2000 m buffer: TP, TN, and COD were positively associated with Built-up Land and Cropland, highlighting the influence of anthropogenic land uses on nutrient and organic pollution. NH3-N was negatively correlated with Grassland, suggesting the potential purifying role of vegetative cover. SS and Turbidity showed strong positive correlations with Water Bodies, reflecting hydrological and sediment transport dynamics. Among the landscape indices, TP, SS, NH3-N, and Turbidity were positively correlated with DIVISION and SHDI, indicating greater patch fragmentation and landscape diversity may exacerbate certain water quality issues. Conversely, TN was positively correlated with LPI and IJI, while COD showed negative correlations with DIVISION and SHDI.
These findings suggest that intensified human disturbance—represented by increases in Built-up Land, Cropland, and fragmented landscape configurations—is closely linked to the degradation of water quality. In contrast, enhanced ecological integrity, such as the presence of natural land cover types and more cohesive landscape patterns, appears conducive to water quality improvement.
Jinniu Lake—500 m buffer: Total Nitrogen (TN), Chemical Oxygen Demand (COD), and Ammonia Nitrogen (NH3-N) exhibited positive correlations with Built-up Land and Water Bodies, while showing negative correlations with Forest Land and Grassland. Suspended Solids (SS) and Total Phosphorus (TP) were negatively correlated with Water Bodies, suggesting a potential dilution or buffering effect of aquatic surfaces on particulate and nutrient loading. From a landscape pattern perspective, TP and SS showed positive correlations with Landscape Division Index (DIVISION), Aggregation Index (AI), and Shannon’s Diversity Index (SHDI), implying that increased fragmentation and landscape heterogeneity may exacerbate sediment and phosphorus pollution. Conversely, TN, COD, and NH3-N were positively correlated with the Largest Patch Index (LPI), but negatively correlated with DIVISION and SHDI, indicating that large dominant patches may intensify certain types of water pollution under high urban pressure.
Jinniu Lake—1000 m buffer: TP and SS were positively associated with Built-up Land and negatively associated with Forest Land, further emphasizing the detrimental role of urbanization and the mitigating influence of natural vegetation. In contrast, TN and NH3-N showed positive correlations with Forest Land, suggesting a complex interplay between nutrient cycling and vegetative cover. COD and NH3-N were positively correlated with AI, indicating that more aggregated land-use types may be linked with higher organic and ammonia loads. TP displayed negative correlations with Landscape Shape Index (LSI), SHDI, and DIVISION, while SS was negatively correlated with AI and DIVISION, suggesting that increased landscape continuity and simplicity may help suppress particulate and nutrient levels.
Jinniu Lake—2000 m buffer: At this broader spatial scale, TN and Turbidity showed positive correlations with Built-up Land, indicating increased anthropogenic pressure on water quality. TP and SS were positively correlated with Cropland and Grassland, suggesting diffuse non-point source pollution associated with vegetated or semi-agricultural areas. Multiple water quality parameters—TN, COD, NH3-N, and Turbidity—exhibited strong positive correlations with AI and LPI, reflecting the role of large, aggregated land patches in pollutant accumulation or transport. In contrast, TP and SS were positively associated with SHDI, DIVISION, Interspersion and Juxtaposition Index (IJI), LSI, and Number of Patches (NP), but negatively correlated with AI and LPI. These patterns indicate that greater landscape fragmentation and heterogeneity are linked to poorer water quality, while landscapes characterized by better connectivity and spatial extensibility tend to support improved water quality conditions.
Overall, the findings underscore that increased landscape fragmentation—driven by urban expansion or disjointed land cover arrangements—can significantly deteriorate water quality. In contrast, landscapes with strong connectivity, cohesive structure, and larger aggregated patches are more favorable for maintaining or enhancing water quality integrity.
Meishe River—500 m buffer: Turbidity was positively correlated with Built-up Land and Water Bodies, but negatively associated with Grassland, suggesting that urban surfaces and open water may contribute to sediment resuspension or runoff, while vegetated areas potentially mitigate turbidity. In contrast, Ammonia Nitrogen (NH3-N) and Chemical Oxygen Demand (COD) exhibited negative correlations with Built-up Land and Water Bodies, implying that these parameters may be more sensitive to specific point or diffuse pollution sources rather than urban land cover at smaller spatial scales. Landscape pattern indices further elucidated these relationships: NH3-N and COD showed positive correlations with Patch Density (PD) and the Interspersion and Juxtaposition Index (IJI), but negative correlations with the Patch Cohesion Index (COHESION). Conversely, Turbidity showed negative correlations with PD and IJI, yet a positive correlation with COHESION. This suggests that while dispersed and heterogeneous patch arrangements may reduce certain organic and nutrient pollutants, they may be less effective in controlling turbidity, which benefits from more continuous and cohesive land configurations.
Meishe River—1000 m buffer: At the 1000 m scale, Turbidity and NH3-N were positively associated with Built-up Land and negatively correlated with Grassland, reinforcing the role of urbanization in driving pollutant loads and highlighting the protective function of vegetative cover. COD, however, displayed a contrasting trend—showing negative correlations with Built-up Land and Water Bodies, but positive associations with IJI and PD, and a negative correlation with COHESION. In contrast, NH3-N and Turbidity were negatively correlated with IJI and PD, while Turbidity again showed a positive correlation with COHESION. These patterns suggest that COD may be influenced by landscape fragmentation and patch juxtaposition, while Turbidity and NH3-N respond more favorably to landscape connectivity and cohesion.
Meishe River—2000 m buffer: At the broadest spatial scale, Turbidity and NH3-N continued to show positive correlations with Built-up Land, indicating persistent anthropogenic pressure. COD, however, exhibited positive correlations with Grassland and Water Bodies and a negative correlation with Built-up Land, indicating a possible shift in pollution sources or landscape buffering effects at this scale. COD remained positively associated with IJI and PD and negatively correlated with COHESION. Conversely, Turbidity maintained negative correlations with IJI and PD but was positively correlated with COHESION.
Taken together, these results demonstrate a consistent pattern: landscape cohesion—characterized by large, continuous ecological patches—is associated with improved water quality, particularly in terms of reduced turbidity and nutrient loads. Meanwhile, increased landscape fragmentation, reflected by higher patch density and spatial heterogeneity, may exacerbate organic pollution and disrupt ecological filtering functions, especially in urbanized river corridors.

4. Discussion

The distinct characteristics of urban water bodies are shaped by a complex interplay of natural conditions, anthropogenic activities, and urban planning and management practices [29]. This study revealed differences in water quality parameters among the three urban water bodies, reflecting their varied ecological settings and degrees of human influence. Hongcheng Lake exhibited elevated levels of Chemical Oxygen Demand (COD) and Total Nitrogen (TN) compared to Jinniu Lake and the Meishe River. After conducting on-site research, it was found that the area around Hongcheng Lake is bustling with commercial activities and has a high volume of pedestrian traffic. There are many commercial sightseeing boats powered by fuel. In contrast, the Meishe River demonstrated the lowest concentrations of COD and Suspended Solids (SS), highlighting the effective nutrient and sediment retention capabilities of its riparian wetland vegetation, which enhances nitrogen and phosphorus absorption and purification processes. Jinniu Lake, on the other hand, exhibited higher concentrations of Ammonia Nitrogen (NH3-N) and Total Phosphorus (TP) than the other two sites. Turbidity levels in the Meishe River during the spring were higher than in Jinniu and Hongcheng Lakes. The seasonal variations of water quality parameters reflect the combined effects of the natural hydrological cycle, the dynamics of the ecosystem, and human activities [30], and further demonstrate the dynamic influence of the landscape pattern. For example, the higher COD levels observed in Hongcheng Lake during spring and winter, relative to summer and autumn, may result from reduced hydrodynamic flow during the dry season, facilitating pollutant accumulation. Conversely, elevated NH3-N levels in Jinniu Lake during summer and autumn are likely influenced by increased agricultural runoff and intensified surface runoff caused by seasonal rainfall. These findings emphasize the dynamic nature of water quality responses to both landscape structure and seasonal variability. Recognizing such temporal and spatial disparities is vital for informing targeted and adaptive water quality management strategies, tailored to the specific ecological context and disturbance regimes of each urban water body.
A high proportion of Built-up Land surrounding Hongcheng Lake and Jinniu Lake, which further increased with the expansion of buffer zones, was positively correlated with elevated concentrations of pollutants such as Chemical Oxygen Demand (COD) and Suspended Solids (SS). This conclusion is consistent with the findings of HY Pak’s study on the Johor River Basin in Malaysia, which indicated that residential and urban land use are important predictors of nutrients and organic matter (chemical oxygen demand) [31]. This trend underscores the critical role of urban expansion in exacerbating aquatic pollution, as the proliferation of impervious surfaces and anthropogenic disturbances intensifies non-point source runoff and pollutant discharge into adjacent water bodies [32]. These findings are consistent with prior research by Waqas Ahmad [33] and Cheng Chunyan [34], who similarly identified urbanization and land-use intensification as primary drivers of deteriorating water quality in urban aquatic systems. In contrast, the Meishe River, characterized by a higher proportion of grassland and natural vegetation, exhibited comparatively better water quality. This highlights the crucial ecological function of vegetative cover in filtering, intercepting, and degrading pollutants before they enter aquatic environments. Such results align with the conclusions of Hu Yanxin [35], Wang Pengcheng [36], and Wang Rongjia [37], who demonstrated the effectiveness of vegetated landscapes in enhancing water purification and buffering the impacts of urban runoff. Moreover, this study revealed scale-dependent effects of landscape patterns on water quality outcomes [38]. Despite spatial variation among the three water bodies, all showed higher cumulative explanatory power of landscape metrics on water quality within the 2000 m buffer zone. It emphasizes the necessity of selecting an optimal spatial scale for landscape–water quality analysis based on the unique environmental and developmental characteristics of each region [39].
This study, by examining the relationships between landscape patterns and water quality parameters in Hongcheng Lake, Jinniu Lake, and the Meishe River in Haikou, highlights that maintaining landscape connectivity and limiting high-intensity land development can play a critical role in improving water quality and mitigating pollutant discharge. These findings are consistent with the conclusions of Nafi’ Shehab Z. [40], who emphasized the ecological benefits of integrated land use and landscape cohesion. Natural landscapes with high connectivity can extend the surface runoff path through “structural continuity”, slow down the flow rate, and enhance the infiltration capacity. This way, they can reduce the amount of pollutants entering the water body at the source and construct continuous channels for material migration and degradation. Through processes such as vegetation absorption and microbial decomposition, the concentrations of nutrients (TN, TP) and organic pollutants (COD) in the water body can be lowered. Among the three water bodies, Jinniu Lake exhibited the highest concentrations of Total Phosphorus (TP) and Ammonia Nitrogen (NH3-N), a consequence of its central urban location, high anthropogenic activity, and significant landscape fragmentation. These factors contribute to increased pollutant inputs and reduced ecological resilience. In contrast, the Meishe River demonstrated strong water purification capacity, supported by greater landscape connectivity and dense vegetation coverage, which enhance the interception, absorption, and degradation of pollutants before they enter the aquatic system. Despite having a larger surface area, Hongcheng Lake suffered from greater landscape fragmentation and localized anthropogenic pressures, resulting in an increase in the level of Chemical Oxygen Demand (COD) and Total Nitrogen (TN) compared to the other two water bodies. This pattern indicates that the lake’s self-purification capacity is highly vulnerable to peripheral land-use disturbances. Despite the large water body area, the increase in landscape fragmentation and isolation has led to a decline in self-purification capacity. This indicates that landscape fragmentation weakens the integrity of the ecosystem, thereby reducing the self-purification capacity of water bodies. This conclusion is consistent with the study of the Portuguese urban catchment area—the Eufa River Basin by Pinheiro C A F. Among the indicators analyzed by him, the Shannon diversity index, landscape isolation degree, percentage of urban areas, and the percentage of agricultural edges shared with artificial areas are the land use characteristics that best represent the degradation of water resources [27]. Urban planning should prioritize the preservation and restoration of natural vegetation [41], while simultaneously enhancing landscape connectivity and minimizing landscape fragmentation. These goals can be effectively pursued through the establishment of ecological corridors and green belts, which facilitate the integration of urban water bodies with adjacent terrestrial ecosystems and improve ecological resilience. To account for seasonal hydrological fluctuations, it is crucial to implement seasonally adaptive water quality monitoring and management strategies [42]. In particular, optimizing the purification functions of forest and grassland areas requires increasing vegetative cover within urban green spaces. This not only promotes pollutant interception and assimilation but also enhances ecosystem stability and provisioning of ecological services [43]. In urban zones characterized by high concentrations of built-up land, targeted management measures are essential to mitigate negative environmental impacts. These should include: strengthening stormwater management systems; implementing effective non-point source pollution control measures; preventing further environmental degradation around water bodies; and reducing pollutant discharges through sustainable land-use practices and infrastructure design. Set an upper limit threshold for the proportion of construction land, implement ecological compensation linked to development and restoration, carry out ecological transformation of urban “corner areas”, establish a fragmented restoration subsidy mechanism, and build a multi-scale monitoring network.

5. Conclusions

This study integrated landscape ecology approaches and water quality monitoring techniques by employing landscape pattern indices and field-measured water quality parameters to explore the mechanisms through which landscape patterns influence water quality in urban water bodies. The principal findings are as follows:
(1) Significant spatial differences in water quality exist among the urban water bodies of Haikou City. The concentrations of COD and TN in Hongcheng Lake are relatively high, while the concentrations of NH3-N and TP in Jinniu Lake are relatively high. There are seasonal differences among different water bodies. There is no significant difference in total phosphorus between Jinniu Lake and Meishe River, no significant difference in total nitrogen and ammonia nitrogen between Hongcheng Lake and Meishe River, no significant difference in chemical oxygen demand between Hongcheng Lake and Meishe River, and no significant difference in turbidity between Jinniu Lake and Meishe River. However, there are significant differences in all other parameters.
(2) Built-up land was identified as the primary contributor to aquatic pollution, especially in Hongcheng Lake and Jinniu Lake. In contrast, areas dominated by natural vegetation—such as forest land and grassland—were associated with improved water quality, highlighting the ecological benefits of vegetative land cover. The 2000 m buffer zone exhibited the strongest relationship between landscape pattern indices and water quality parameters for all three water bodies (Hongcheng Lake, Jinniu Lake, and the Meishe River). This suggests that the influence of landscape structure on water quality is scale-dependent, with the 2000 m buffer being the optimal spatial scale for assessing landscape–water quality interactions in this context.
(3) Landscape configuration plays a crucial role in shaping urban water quality. High landscape connectivity and abundant vegetation cover were found to enhance the water bodies’ self-purification capacity. Conversely, increased landscape fragmentation and a high proportion of built-up land corresponded to deteriorating water quality. These results underscore the importance of maintaining ecosystem integrity and controlling urban expansion in proximity to aquatic ecosystems. The Red City Lake should give priority to controlling the expansion of commercial land use. For Jinniu Lake, the focus should be on reducing scattered construction land. Through ecological corridors, connect Jinniu Ridge Park with the lake green space. For Meishe River, strictly protect the existing riverbank green areas to achieve the coordinated advancement of landscape pattern optimization and water quality protection.

Author Contributions

Writing—original draft preparation, Y.Z.; project administration, Y.D.; investigation, Y.H.; data curation, S.H. and J.P. All authors have read and agreed to the published version of the manuscript.

Funding

This work was supported by National Key R & D Program of China (2023YFF1304600). This work was supported by Hainan Provincial Natural Science Foundation of China (grant number: 724MS059).

Data Availability Statement

The data in this article were sourced from the China Satellite Application Center for Resources. The website address is https://zywx.dljczb.com accessed on 14 January 2023.

Conflicts of Interest

The authors declare that they have no known competing financial interests or personal relationships that could have appeared to influence the work reported in this paper.

References

  1. Makanda, K.; Nzama, S.; Kanyerere, T. Assessing the role of water resources protection practice for sustainable water resources management: A review. Water 2022, 14, 3153. [Google Scholar] [CrossRef]
  2. Fan, Y.; Fang, C. Insight into China’s water pollution and sustainable water utilization from an integrated view. Appl. Geogr. 2024, 165, 103224. [Google Scholar] [CrossRef]
  3. Aalipour, M.; Antczak, E.; Dostál, T.; Jabbarian Amiri, B. Influences of landscape configuration on river water quality. Forests 2022, 13, 222. [Google Scholar] [CrossRef]
  4. Shi, J.H.; Jin, R.; Zhu, W.H.; Tian, L.; Lv, X. Effects of multi-scale landscape pattern changes on seasonal water quality: A case study of the Tumen River Basin in China. Environ. Sci. Pollut. Res. 2022, 29, 76847–76863. [Google Scholar] [CrossRef]
  5. Stets, E.G.; Sprague, L.A.; Oelsner, G.P.; Johnson, H.M.; Murphy, J.C.; Ryberg, K.; Riskin, M.L. Landscape drivers of dynamic change in water quality of US rivers. Environ. Sci. Technol. 2020, 54, 4336–4343. [Google Scholar] [CrossRef]
  6. Nobre, R.L.G.; Caliman, A.; Cabral, C.R.; de Carvalho Araújo, F.; Guerin, J.; Dantas, F.D.C.C.; Carneiro, L.S. Precipitation, landscape properties and land use interactively affect water quality of tropical freshwaters. Sci. Total Environ. 2020, 716, 137044. [Google Scholar] [CrossRef]
  7. Zhang, J.; Li, S.; Dong, R.; Jiang, C.; Ni, M. Influences of land use metrics at multi-spatial scales on seasonal water quality: A case study of river systems in the Three Gorges Reservoir Area, China. J. Clean. Prod. 2019, 206, 76–85. [Google Scholar] [CrossRef]
  8. Lei, C.; Wagner, P.D.; Fohrer, N. Effects of land cover, topography, and soil on stream water quality at multiple spatial and seasonal scales in a German lowland catchment. Ecol. Indic. 2021, 120, 106940. [Google Scholar] [CrossRef]
  9. Wu, J.; Lu, J. Spatial scale effects of landscape metrics on stream water quality and their seasonal changes. Water Res. 2021, 191, 116811. [Google Scholar] [CrossRef]
  10. Han, H.; Yan, X.; Xie, H.; Qiu, J.; Li, X.; Zhao, D.; Xia, Y. Incorporating a new landscape intensity indicator into landscape metrics to better understand controls of water quality and optimal width of riparian buffer zone. J. Hydrol. 2023, 625, 130088. [Google Scholar] [CrossRef]
  11. Xu, Q.; Wang, P.; Shu, W.; Ding, M.; Zhang, H. Influence of landscape structures on river water quality at multiple spatial scales: A case study of the Yuan river watershed, China. Ecol. Indic. 2021, 121, 107226. [Google Scholar] [CrossRef]
  12. Huang, W.; Mao, J.; Zhu, D.; Lin, C. Impacts of land use and land cover on water quality at multiple buffer-zone scales in a Lakeside City. Water 2019, 12, 47. [Google Scholar] [CrossRef]
  13. Masteali, S.H.; Bayat, M.; Ghorbanpour, M. Effects of forest structure from graph theory connectivity indicators on river water quality in the Caspian Sea Basin. Sci. Rep. 2025, 15, 7344. [Google Scholar] [CrossRef] [PubMed]
  14. Wang, Y.; Liu, R.; Liu, J.; Zhang, J. Differences in Multi-temporal and Spatial Scale Responses of Water Quality to Landscape Features in Tectonic and River-forming Lake Watersheds in Southwest China. Huan Jing Ke Xue 2025, 46, 4227–4240. [Google Scholar]
  15. Li, B.; Huang, X.; Zhong, Q.; Wu, X. Response of river water quality to landscape features in a subtropical hilly region. Sci. Rep. 2025, 15, 13528. [Google Scholar] [CrossRef]
  16. Xu, Y.; Li, P.; Ma, F.; Liu, X.; Zhang, N.; Pan, J.; Meng, Y. Watershed landscape characteristics and connectivity drive river water quality under seasonal dynamics. J. Clean. Prod. 2024, 473, 143533. [Google Scholar] [CrossRef]
  17. Zhang, L. Office of Local Chronicles and Annals of Haikou City Haikou Yearbook (2023); Nanhai Publishing Company: Haikou, China, 2023. [Google Scholar]
  18. GB 3838-2002; Environmental Quality Standards for Surface Water. China Environmental Science Press: Beijing, China, 2002.
  19. Chen, C.; Shi, L.; Lu, Y.; Yang, S.; Liu, S. The optimization of urban ecological network planning based on the minimum cumulative resistance model and granularity reverse method: A case study of Haikou, China. IEEE Access 2020, 8, 43592–43605. [Google Scholar] [CrossRef]
  20. Zhao, B.; Tan, X.; Luo, L.; Deng, M.; Yang, X. Identifying the Production–Living–Ecological Functional Structure of Haikou City by Integrating Empirical Knowledge with Multi-Source Data. ISPRS Int. J. Geo-Inf. 2023, 12, 276. [Google Scholar] [CrossRef]
  21. Wen, S.; Yu, C.; Lin, F.; Diao, X. Comparative assessment of microplastics in surface water and sediments of Meishe River, Haikou, China. Sustainability 2022, 14, 13099. [Google Scholar] [CrossRef]
  22. In GB/T 21010-2017; Classification of Land Use Status. China Standard Press: Beijing, China, 2017.
  23. Tripathi, M.; Singal, S.K. Use of principal component analysis for parameter selection for development of a novel water quality index: A case study of river Ganga India. Ecol. Indic. 2019, 96, 430–436. [Google Scholar] [CrossRef]
  24. Dadashpoor, H.; Azizi, P.; Moghadasi, M. Land use change, urbanization, and change in landscape pattern in a metropolitan area. Sci. Total Environ. 2019, 655, 707–719. [Google Scholar] [CrossRef]
  25. Li, J.; Zhou, K.; Xie, B.; Xiao, J. Impact of landscape pattern change on water-related ecosystem services: Comprehensive analysis based on heterogeneity perspective. Ecol. Indic. 2021, 133, 108372. [Google Scholar] [CrossRef]
  26. Metzger, J.P.; Villarreal-Rosas, J.; Suárez-Castro, A.F.; López-Cubillos, S.; González-Chaves, A.; Runting, R.K.; Hohlenwerger, C.; Rhodes, J.R. Considering landscape-level processes in ecosystem service assessments. Sci. Total Environ. 2021, 796, 149028. [Google Scholar] [CrossRef]
  27. Fernandes, A.C.P.; de Oliveira Martins, L.M.; Pacheco, F.A.L.; Fernandes, L.F.S. The consequences for stream water quality of long-term changes in landscape patterns: Implications for land use management and policies. Land Use Policy 2021, 109, 105679. [Google Scholar] [CrossRef]
  28. Xu, M.; Xu, G.; Li, Z.; Dang, Y.; Li, Q.; Min, Z.; Zhang, Y. Effects of comprehensive landscape patterns on water quality and identification of key metrics thresholds causing its abrupt changes. Environ. Pollut. 2023, 333, 122097. [Google Scholar] [CrossRef] [PubMed]
  29. Akhtar, N.; Syakir Ishak, M.I.; Bhawani, S.A.; Umar, K. Various natural and anthropogenic factors responsible for water quality degradation: A review. Water 2021, 13, 2660. [Google Scholar] [CrossRef]
  30. Shi, J. Identifying the influence of natural and human factors on seasonal water quality in China: Current situation of China’s water environment and policy impact. Environ. Sci. Pollut. Res. 2023, 30, 104852–104869. [Google Scholar] [CrossRef] [PubMed]
  31. Pak, H.Y.; Chuah, C.J.; Yong, E.L.; Snyder, S.A. Effects of land use configuration, seasonality and point source on water quality in a tropical watershed: A case study of the Johor River Basin. Sci. Total Environ. 2021, 780, 146661. [Google Scholar] [CrossRef]
  32. Chen, S.S.; Kimirei, I.A.; Yu, C.; Shen, Q.; Gao, Q. Assessment of urban river water pollution with urbanization in East Africa. Environ. Sci. Pollut. Res. 2022, 29, 40812–40825. [Google Scholar] [CrossRef]
  33. Ahmad, W.; Iqbal, J.; Nasir, M.J.; Ahmad, B.; Khan, M.T.; Khan, S.N.; Adnan, S. Impact of land use/land cover changes on water quality and human health in district Peshawar Pakistan. Sci. Rep. 2021, 11, 16526. [Google Scholar] [CrossRef]
  34. Cheng, C.; Zhang, F.; Shi, J.; Kung, H.T. What is the relationship between land use and surface water quality? A review and prospects from remote sensing perspective. Environ. Sci. Pollut. Res. 2022, 29, 56887–56907. [Google Scholar] [CrossRef] [PubMed]
  35. Hu, Y.; Gao, L.; Ma, C.; Wang, H.; Zhou, C. The comprehensive reduction capacity of five riparian vegetation buffer strips for primary pollutants in surface runoff. Appl. Sci. 2023, 13, 3898. [Google Scholar] [CrossRef]
  36. Wang, P.; Ding, J.; He, Y.; Wang, D.; Cao, C.; Huang, M. Ecological revetments for enhanced interception of nonpoint source pollutants: A review. Environ. Rev. 2020, 28, 262–268. [Google Scholar] [CrossRef]
  37. Wang, R.; Liu, L.; Tao, Z.; Wan, B.; Wang, Y.; Tang, X.; Li, X. Effect of urbanization and urban forests on water quality improvement in the Yangtze River Delta: A case study in Hangzhou, China. J. Environ. Manag. 2024, 351, 119980. [Google Scholar] [CrossRef]
  38. Xu, S.; Li, S.L.; Zhong, J.; Li, C. Spatial scale effects of the variable relationships between landscape pattern and water quality: Example from an agricultural karst river basin, Southwestern China. Agric. Ecosyst. Environ. 2020, 300, 106999. [Google Scholar] [CrossRef]
  39. Zhao, Y.; Liang, R.; Ding, A.; Lan, W. The differences in the influence of landscape characteristics at different spatial scales on the water quality of Nanliu River. Acta Ecol. Sin. 2023, 43, 4954–4964. [Google Scholar]
  40. Nafi’Shehab, Z.; Jamil, N.R.; Aris, A.Z.; Shafie, N.S. Spatial variation impact of landscape patterns and land use on water quality across an urbanized watershed in Bentong, Malaysia. Ecol. Indic. 2021, 122, 107254. [Google Scholar] [CrossRef]
  41. Ferrini, F.; Fini, A.; Mori, J.; Gori, A. Role of vegetation as a mitigating factor in the urban context. Sustainability 2020, 12, 4247. [Google Scholar] [CrossRef]
  42. Gu, Y.; Zhang, P.; Qin, F.; Cai, Y.; Li, C.; Wang, X. Enhancing river water quality in different seasons through management of landscape patterns at various spatial scales. J. Environ. Manag. 2025, 373, 123653. [Google Scholar] [CrossRef] [PubMed]
  43. Piaggio, M.; Siikamäki, J. The value of forest water purification ecosystem services in Costa Rica. Sci. Total Environ. 2021, 789, 147952. [Google Scholar] [CrossRef] [PubMed]
Figure 1. The distribution of land use types and water quality sample points around urban water bodies: (a) Hongcheng Lake, (b) Jinniu Lake, (c) Meishe River.
Water 17 02922 g001
Figure 2. Differences in water quality parameters among urban water bodies.
Water 17 02922 g002
Figure 3. Seasonal differences in water quality parameters among different water bodies.
Water 17 02922 g003
Figure 4. Bar charts of percentage accumulation of land use types at different spatial scales: (a) Hongcheng Lake, (b) Jinniu Lake, (c) Meishe River.
Water 17 02922 g004aWater 17 02922 g004b
Figure 5. Exponential box plots of landscape patterns at different spatial scales: (a) Hongcheng Lake, (b) Jinniu Lake, (c) Meishe River.
Water 17 02922 g005aWater 17 02922 g005b
Figure 6. The proportion of urban water body landscape composition area and the redundant analysis ranking of water quality parameters at different spatial scales.
Water 17 02922 g006
Figure 7. The ranking of the index of urban water body landscape pattern and the redundant analysis of water quality parameters at different spatial scales.
Water 17 02922 g007
Table 1. Descriptive statistics of water quality parameters of urban water bodies.
WaveParametersMinimum ValueMaximum ValueAverage ValueStandard Deviation
Hongcheng LakeTP0.0230.2410.0610.034
TN1.03056.76013.36813.754
NH3-N0.0041.8320.8230.589
COD4.107359.40086.60383.863
SS13921.82310.178
Turbidity1.325.98.1306.368
Jinniu LakeTP0.0730.3120.1540.066
TN2.3437.0304.0911.029
NH3-N0.8284.3802.0861.056
COD16.43047.24028.7518.669
SS1.52513.9095.509
Turbidity10.947.724.7919.085
Meishe RiverTP0.0550.2200.1150.046
TN3.3337.8185.5771.216
NH3-N0.0581.3130.8300.357
COD8.21526.713.2466.123
SS2.5199.7755.072
Turbidity1.354.522.93016.129
Table 2. Landscape pattern indices and their descriptions.
Landscape IndexFormulaDescription
NP NP = N The number of patches in a landscape reflects the spatial pattern of the landscape.
PD PD = NP A The number of patches per unit area reflects the degree of fragmentation of the landscape.
LPI LPI = a m a x A × 100 Determines the type of dominant patches in the landscape to reflect the direction and magnitude of human activity interference.
LSI LSI = 0.25 k = 1 m g i k j A Reflects the complexity and dynamic changes of the landscape pattern.
CONTAG CONTAG = [ 1 + i = 1 m k = 1 m [ ( P i ) ( g i k k = 1 m g i k ) ] [ I n ( P i ) ( g i k k = 1 m g i k ) ] 2 I n m ] × 100 The degree of agglomeration or extension trend of different patch types in the landscape.
IJI IJI = i = 1 m k = i + 1 m [ g i k G I n ( g i k G ) ] I n ( 0.5 m ( m 1 ) ) × 100 Reflects the overall distribution and juxtaposition among various plaque types.
COHESION COHESION = [ 1 j = 1 m p i j j = 1 m p i j a i j ] [ 1 1 A ] 1 × 100 Reflects the physical connectivity and the state of aggregation and dispersion of the landscape.
DIVISION DIVISION = 1 i = 1 n ( a i A ) 2 Measures the degree of fragmentation or fragmentation of the patch types in the landscape.
SHDI SHDI = i = 1 m ( P i I n P i ) Reflects the heterogeneity of the landscape.
SHEI SHEI = i = 1 m ( P i × I n P i ) I n m Infers the health status and stability of the landscape.
AI AI = [ g i i m a x g i i ] × 100 Examines the connectivity among landscape type patches.
N: Total number of plaques; A: total area of plaques; m: the total number of patch types in the landscape; n: number of plaques; Pi: the proportion of the area of type i to the total landscape area; gik: the boundary length adjacent to type i and type k; G: the total length of the boundaries of all patches in the landscape; ai: the area of the i-th patch; P: the perimeter of the plaque; aij: the area of the JTH patch in the i-class landscape type; amax: the area of the largest patch in a landscape or a certain type of patch; pij: the perimeter of the JTH patch in the i-type landscape; gii: the number of similar adjacent patches of the corresponding landscape type.
Table 3. Test for differences in water quality parameters among different water bodies.
ParametersComparable GroupMean DifferenceStandard ErrorpSignificance
SSHongcheng Lake—Jinniu Lake7.911.59<0.01Significant
Hongcheng Lake—Meishe River12.051.70<0.01Significant
Jinniu Lake—Meishe River4.131.490.084Not significant
Table 4. Test for differences in water quality parameters among different water bodies (continued).
ParametersComparable GroupMann–Whitney UOriginal pCorrected pSignificance
TPHongcheng Lake—Jinniu Lake112<0.01<0.03Significant
Hongcheng Lake—Meishe River159.5<0.01<0.03Significant
Jinniu Lake—Meishe River205.50.0220.066Not significant
TNHongcheng Lake—Jinniu Lake508.5<0.01<0.03Significant
Hongcheng Lake—Meishe River4480.0440.132Not significant
Jinniu Lake—Meishe River119.5<0.01<0.03Significant
NH3-NHongcheng Lake—Jinniu Lake301<0.01<0.03Significant
Hongcheng Lake—Meishe River569.50.4591.377Not significant
Jinniu Lake—Meishe River60.5<0.01<0.03Significant
CODHongcheng Lake—Jinniu Lake7660.0270.081Not significant
Hongcheng Lake—Meishe River307.5<0.01<0.03Significant
Jinniu Lake—Meishe River47.5<0.01<0.03Significant
TurbidityHongcheng Lake—Jinniu Lake133<0.01<0.03Significant
Hongcheng Lake—Meishe River271.5<0.01<0.03Significant
Jinniu Lake—Meishe River297.50.551.65Not significant
Table 5. Principal component analysis of different water bodies.
WavePrincipal
Component
High Load Parameters
(Load Values)
Variance
Contribution Rate
Accumulating
Contribution Rate
Hongcheng LakePC1NH3-N (0.955), SS (0.874)37.81037.810
PC2TN (0.833), COD (0.762)33.69871.508
Jinniu LakePC1TP (0.916), NH3-N (0.894), TN (0.807)45.81645.816
PC2Turbidity (0.947), COD (0.939)34.39680.212
Meishe RiverPC1Turbidity (0.939), TP (0.902), COD (0.893), NH3-N (0.876), TN (0.839)66.19666.196
PC2SS (0.986)17.78483.979
Table 6. Spearman rank correlation analysis of the landscape composition and water quality parameters of Hongcheng Lake.
Landscape CompositionBuffer AreaWater Quality Parameters (mg/L)
TNTPNH3-NCODSSTurbidity
Built-up Land500 m−0.2320.3610.4340.0000.069−0.036
1000 m−0.2540.2830.3720.0030.2140.123
2000 m0.261−0.174−00170.2260.0170.017
Forest Land500 m0.347−0.237−0.2660.054−0.055−0.077
1000 m0.282−0.016−0.1570.2190.079−0.126
2000 m0.461−0.1770.000−0.136−0.109−0.381
Grassland500 m0.320−0.239−0.3850.021−0.131−0.052
1000 m0.2090.103−0.0770.1250.0430.042
2000 m−0.2320.192−0.0410.178−0.0690.151
Cropland500 m0.019−0.0500.0630.0000.075−0.528 *
1000 m0.288−0.410−0.155−0.177−0.2110.000
2000 m0.2460.123−0.2050.000−0.123−0.164
Water Bodies500 m−0.116−0.158−0.370−0.0100.0810.333
1000 m0.0280.280−0.1960.3080.0560.421
2000 m−0.420−0.3650.252−0.1960.3650.253
Unused Land500 m0.123−0.0620.1230.0410.226−0.370
1000 m0.302−0.271−0.028−0.245−0.016−0.375
2000 m0.125−0.3920.000−0.407−0.251−0.126
* Significant at the 0.05 level (2-tailed).
Table 7. Spearman rank correlation analysis of the landscape composition and water quality parameters of Jinniu Lake.
Landscape CompositionBuffer AreaWater Quality Parameters (mg/L)
TNTPNH3-NCODSSTurbidity
Built-up Land500 m−0.895 **−0.828 **−0.678 *−0.736 *−0.966 **−0.878 **
1000 m0.4250.4160.6500.5810.3220.467
2000 m−0.693 *−0.779*−0.866 **−0.693 *−0.609−0.611
Forest Land500 m0.900 **0.817 **0.683 *0.750 *0.971 **0.874 **
1000 m−0.752 *−0.780 *−0.835 **−0.752 *−0.719 *−0.712 *
2000 m
Grassland500 m0.3950.4400.6510.5320.5250.680 *
1000 m
2000 m0.725 *0.5180.5180.6210.728 *0.731 *
Cropland500 m
1000 m
2000 m0.725 *0.5180.5180.6210.728 *0.731 *
Water Bodies500 m−0.596−0.749 *−0.724 *−0.638−0.564−0.721 *
1000 m−0.137−0.274−0.137−0.4110.1380.069
2000 m−0.693 *−0.866 **−0.693 *−0.693 *−0.565−0.655
Unused Land500 m−0.274−0.548−0.456−0.183−0.550−0.552
1000 m------
2000 m------
* Significant at the 0.05 level (2-tailed). ** Significant at the 0.01 level (2-tailed).
Table 8. Spearman rank correlation analysis of the landscape composition and water quality parameters of Meishe River.
Landscape CompositionBuffer AreaWater Quality Parameters (mg/L)
TNTPNH3-NCODSSTurbidity
Built-up Land500 m−0.800−0.600−0.300−0.3590.6670.200
1000 m−0.5000.1000.3000.205−0.0510.700
2000 m−0.5000.1000.3000.205−0.0510.700
Forest Land500 m0.7910.7910.2640.406−0.7300.053
1000 m0.8660.2890.000−0.148−0.296−0.289
2000 m0.5800.158−0.580−0.4600.135−0.158
Grassland500 m0.6000.2000.1000.205−0.359−0.600
1000 m0.564−0.154−0.205−0.2890.053−0.667
2000 m0.5640.051−0.1030.000−0.158−0.667
Cropland500 m−0.205−0.821−0.154−0.3420.500−0.821
1000 m0.5800.158−0.580−0.4600.135−0.158
2000 m0.000−0.707−0.707−0.7250.725−0.707
Water Bodies500 m0.1000.7000.1000.205−0.3590.900 *
1000 m−0.354−0.3540.354−0.1810.1810.354
2000 m
Unused Land500 m−0.154−0.667−0.205−0.1320.368−0.975 **
1000 m0.5640.051−0.1030.000−0.158−0.667
2000 m0.289−0.2890.0000.0000.000−0.866
* Significant at the 0.05 level (2-tailed). ** Significant at the 0.01 level (2-tailed).
Table 9. Pearson correlation analysis of landscape pattern indices of Hongcheng Lake.
NPPDLPILSICONTAGIJICOHESIONDIVISIONSHDISHEIAI
NP1
PD0.7441
LPI0.3980.8591
LSI−0.094−0.339−0.5761
CONTAG0.4620.7900.900−0.8301
IJI−0.352−0.708−0.8620.773−0.9421
COHESION0.5420.8790.935−0.5630.879−0.7721
DIVISION−0.493−0.875−0.9710.693−0.9670.897−0.9571
SHDI−0.478−0.833−0.9310.781−0.9960.938−0.9030.9831
SHEI−0.478−0.833−0.9310.781−0.9960.938−0.9030.98311
AI0.1840.3130.507−0.9820.801−0.7430.534−0.649−0.743−0.7431
Table 10. Pearson correlation analysis of landscape pattern indices in Jinniu Lake.
NPPDLPILSICONTAGIJICOHESIONDIVISIONSHDISHEIAI
NP1
PD0.3181
LPI−0.7200.3121
LSI0.6320.911−0.0591
CONTAG−0.2800.4300.6530.0901
IJI0.738−0.138−0.8820.152−0.3641
COHESION−0.8370.0000.894−0.2930.288−0.9491
DIVISION0.679−0.317−0.9850.061−0.7440.857−0.8451
SHDI0.104−0.721−0.625−0.424−0.9340.336−0.2230.6961
SHEI0.106−0.720−0.626−0.423−0.9350.338−0.2250.69711
AI−0.311−0.983−0.253−0.926−0.3180.1220.0170.2460.6360.6351
Table 11. Pearson correlation analysis of the landscape pattern indices of Meishe River.
NPPDLPILSICONTAGIJICOHESIONDIVISIONSHDISHEIAI
NP1
PD0.8931
LPI0.2070.6031
LSI0.308−0.145−0.8591
CONTAG−0.1900.2690.892−0.9861
IJI0.8190.558−0.1560.601−0.5531
COHESION−0.0070.3790.944−0.8940.890−0.3531
DIVISION−0.085−0.506−0.9920.918−0.9410.275−0.9571
SHDI0.124−0.334−0.9110.973−0.9970.504−0.8890.9521
SHEI0.124−0.334−0.9110.973−0.9970.504−0.8890.95211
AI−0.447−0.0090.778−0.9870.952−0.6980.858−0.852−0.929−0.9291
Table 12. Correlation between the landscape pattern indices of Hongcheng Lake and the Spearman rank of water quality parameters.
Buffer AreaLandscape Pattern IndexWater Quality Parameters (mg/L)
TNTPNH3-NCODSSTurbidity
500 mNP−0.2590.3180.447−0.0380.114−0.065
LPI−0.2240.3780.3850.0180.018−0.012
LSI0.026−0.1770.006−0.182−0.041−0.401
IJI0.262−0.105−0.4030.2120.147−0.192
DIVISION0.250−0.331−0.4210.015−0.044−0.027
SHDI0.315−0.219−0.3850.100−0.149−0.118
1000 nNP−0.0880.0470.0030.1680.237−0.088
LPI−0.1820.3360.3180.1350.1400.088
LSI0.353−0.392−0.3560.000−0.204−0.298
IJI0.256−0.337−0.212−0.150−0.217−0.186
DIVISION0.182−0.336−0.318−0.135−0.140−0.088
SHDI0.294−0.280−0.321−0.026−0.108−0.218
2000 mNP−0.0760.0310.0260.1940.221−0.298
LPI−0.076−0.077−0.2090.1260.0650.204
LSI0.3120.1000.276−0.0470.236−0.038
IJI−0.453−0.352−0.288−0.1380.035−0.109
DIVISION−0.0530.0770.209−0.126−0.065−0.204
SHDI−0.312−0.0340.406−0.412−0.052−0.295
Table 13. Correlation between the landscape pattern indices of Jinniu Lake and the Spearman rank of water quality parameters.
Buffer AreaLandscape Pattern IndexWater Quality Parameters (mg/L)
TNTPNH3-NCODSSTurbidity
500 mNP−0.833 **−0.867 **−0.800 **−0.850 **−0.736 *−0.714 *
LPI−0.867 **−0.783 *−0.700 *−0.700 *−0.996 **−0.874 **
LSI−0.667 *−0.800 **−0.733 *−0.683 *−0.536−0.529
IJI−0.217−0.417−0.467−0.433−0.059−0.210
DIVISION0.850 **0.800 **0.733 *0.717 *0.979 *0.849 **
SHDI0.4170.4830.1670.2000.5100.345
AI0.667 *0.800 **0.733 *0.683 *0.5360.529
1000 mNP0.2850.2760.3680.2260.5420.565
LPI0.683 *0.5330.783 *0.817 **0.5440.546
LSI0.0170.0000.050−0.0170.3260.378
IJI0.733 *0.833 **0.5330.5500.6440.714 *
DIVISION−0.833 **−0.633−0.700 *−0.750 *−0.628−0.521
SHDI−0.367−0.283−0.517−0.533−0.226−0.370
AI−0.0170.000−0.0500.017−0.326−0.378
2000 mNP0.783 *0.800 **0.5330.5330.887 **0.840 **
LPI−0.850 **−0.783 *−0.750 *−0.817 **−0.678 *−0.664
LSI0.800 **0.933 **0.867 **0.750 *0.803 **0.773 *
IJI0.867 **0.767 *0.767 *0.850 **0.695 *0.664
DIVISION0.850 **0.783 *0.750 *0.817 **0.678 *0.664
SHDI0.867 **0.767 *0.767 *0.850 **0.695 *0.664
AI−0.800 **−0.933 **−0.867 **−0.750 *−0.803 **−0.773 *
* Significant at the 0.05 level (2-tailed). ** Significant at the 0.01 level (2-tailed).
Table 14. Correlation between the landscape pattern indices of Meishe River and the Spearman rank of water quality parameters.
Buffer AreaLandscape Pattern IndexWater Quality Parameters (mg/L)
TNTPNH3-NCODSSTurbidity
500 mNP−0.700−0.900 *−0.200−0.4100.718−0.300
LPI−1.000 **−0.600−0.3000.0510.564−0.200
LSI−0.100−0.700−0.100−0.2050.359−0.900 *
IJI−0.100−0.700−0.100−0.2050.359−0.900 *
SHDI0.154−0.154−0.2050.1580.000−0.872
AI0.1000.7000.1000.205−0.3590.900 *
1000 mNP0.300−0.100−0.800−0.5640.410−0.300
LPI−0.5000.1000.3000.205−0.0510.700
LSI0.500−0.100−0.300−0.2050.051−0.700
IJI0.500−0.100−0.300−0.2050.051−0.700
SHDI0.500−0.100−0.300−0.2050.051−0.700
AI−0.5000.1000.3000.205−0.0510.700
2000 mNP−0.300−0.900 *−0.200−0.4620.616−0.700
LPI−0.5000.1000.3000.205−0.0510.700
LSI0.500−0.100−0.300−0.2050.051−0.700
IJI0.500−0.100−0.300−0.2050.051−0.700
SHDI0.500−0.100−0.300−0.2050.051−0.700
AI−0.5000.1000.3000.205−0.0510.700
* Significant at the 0.05 level (2-tailed). ** Significant at the 0.01 level (2-tailed).
Table 15. Total interpretation rate of the sorting axes for redundant analysis of urban water bodies.
Urban Water BodiesBuffer AreaParametersAxis 1Axis 2Total Interpretation Rate
Hongcheng Lake500 mEigenvalue0.240.1144.1%
Cumulative percentage of correlation %54.3678.64
1000 mEigenvalue0.280.1148.6%
Cumulative percentage of correlation %57.7181.16
2000 mEigenvalue0.300.1556.2%
Cumulative percentage of correlation %53.0880.35
Jinniu Lake500 mEigenvalue0.400.2076.7%
Cumulative percentage of correlation %52.6579.12
1000 mEigenvalue0.400.2075.6%
Cumulative percentage of correlation %53.3079.63
2000 mEigenvalue0.370.2181.0%
Cumulative percentage of correlation %46.1372.32
Meishe River500 mEigenvalue0.700.0373.4%
Cumulative percentage of correlation %95.41100
1000 mEigenvalue0.460.2873.7%
Cumulative percentage of correlation %62.29100
2000 mEigenvalue0.700.1584.9%
Cumulative percentage of correlation %82.36100
Disclaimer/Publisher’s Note: The statements, opinions and data contained in all publications are solely those of the individual author(s) and contributor(s) and not of MDPI and/or the editor(s). MDPI and/or the editor(s) disclaim responsibility for any injury to people or property resulting from any ideas, methods, instructions or products referred to in the content.