Article

Evaluating Agro-Based Waste Materials for Cyanotoxin Sorption for Future Incorporation in Nature-Based Solution Units (NBSUs)

by
Guna Bavithra
1,*,
Joana Azevedo
1,
Alexandre Campos
1,
C. Marisa R. Almeida
1,2 and
Pedro N. Carvalho
3,4,*
1
CIIMAR—Centro Interdisciplinar de Investigação Marinha e Ambiental, University of Porto, Terminal de Cruzeiros do Porto de Leixões, Avenida General Norton de Matos, S/N, 4450-208 Matosinhos, Portugal
2
Department of Chemistry and Biochemistry, FCUP—Faculty of Sciences, University of Porto, Rua do Campo Alegre 790, 4150-171 Porto, Portugal
3
Department of Environmental Science, Aarhus University, Frederiksborgvej 399, 4000 Roskilde, Denmark
4
WATEC, Centre for Water Technology, Aarhus University, Ny Munkegade 120, 8000 Aarhus C, Denmark
*
Authors to whom correspondence should be addressed.
Water 2025, 17(2), 285; https://doi.org/10.3390/w17020285
Submission received: 6 December 2024 / Revised: 14 January 2025 / Accepted: 17 January 2025 / Published: 20 January 2025
(This article belongs to the Section Wastewater Treatment and Reuse)

Abstract

:
Toxic cyanobacterial blooms are a growing environmental problem, persisting in freshwater bodies globally, and potentially hazardous to populations that rely on surface freshwater supplies. Nature-based solution units (NBSUs) are effective and sustainable approaches for water treatment, with sorption being an important process. The purpose of this study was to evaluate unmodified agro-based waste materials (rice husks, olive pulp pomace pellets (OP), cork granules) and the benchmark NBSU substrates (biochar, light expanded clay aggregate (LECA), and sand) for their microcystin-LR (MC-LR) and cylindrospermopsin (CYN) sorption potential. The kinetics and sorption mechanism of the two best sorbent materials were studied for future incorporation into NBSUs. Pre-screening of the sorbents showed highest sorption with biochar (>86% MC-LR and >98% CYN) and LECA (78% MC-LR and 80% CYN) and lower sorption with rice husk (<10%), cork (<10%), and sand (<26%). Leaching from OP made them unsuitable for further use. The sorption of both the cyanotoxins onto biochar was rapid (8 h), whereas onto LECA it was steadier (requiring 48 h for equilibrium). The pseudo-second-order kinetic model fit the sorption of both cyanotoxins onto biochar and LECA (R2: 0.94–0.99), suggesting that the sorption rate is limited by chemisorption. The sorption of MC-LR and CYN to biochar and LECA fit the Freundlich and D–R models better, suggesting multilayer sorption, high heterogeneity, and porosity in the sorbents (which was also confirmed by SEM/EDS). The sorption capacity was observed to be higher for biochar (Kf: MC-LR = 0.05, CYN = 0.16) than LECA (Kf: MC-LR = 0.02, CYN = 0.01).

1. Introduction

Cyanobacterial blooms are widely spread and are a global concern. The rising frequency of harmful cyanobacterial blooms (HCBs) and cyanotoxins in freshwater systems is an overlooked issue. With urban expansions and increased anthropogenic activities, nutrient inlet and greenhouse gas emissions have been favouring this phenomenon. Cyanotoxins are secondary metabolites produced by certain cyanobacterial species [1]. They can be released into the water directly, or through cell lysis. Cyanotoxins persist in freshwater bodies and are stable for lengthy periods of time, even through extreme conditions. This is frequently a threat to human and animal health by direct or indirect exposure [2]. Humans can be exposed directly through drinking water or indirectly through ingestion of contaminated food items. The exposure to cyanotoxins through food is primarily through aquatic animals, livestock, and agricultural crop consumption [3]. Among cyanotoxins, microcystins (MCs) and cylindrospermopsin (CYN) have been identified as the ones of major concern due to the invasive nature of their producers, widespread distribution, and high toxicity. More than 250 variants of MCs have been identified so far, with MC-LR being the model for MC investigations due to its prevalence and toxicity [4]. Previously thought to proliferate only in more tropical regions of the world, CYN-producing strains are now being detected in more temperate climates [5], indicating that these toxin-producing cyanobacteria are highly adaptable, which has significant implications for water authorities worldwide.
Treatment technologies are required for the effective removal of dissolved cyanotoxins from water bodies. When advanced solutions are not accessible in remote or rural areas, cost-effective decentralized approaches for the removal of cyanotoxins for remote areas are needed. Among such water treatment options, nature-based solution units (NBSUs) or eco-technologies are of increasing interest. NBSUs are a type of nature-based solution that focus on the implementation of it at a local level. NBSUs are designed to be locally adapted, resource-efficient, and incorporating more and more diversified environmental and natural characteristics into the landscape [6]. They are designed to effectively and adaptively handle social, economic, and environmental concerns, while offering human well-being, ecosystem services, resilience, and biodiversity advantages [6]. Treatment wetlands (TWs), biofilters, vegetated swales, and raingardens are all examples of NBSUs used for water treatment [7], removing different types of pollutants [8]. A limiting factor of the said NBSUs is the requirement for space for effective treatment; sometimes a vast area of land being needed, which limits their wide-spread application, especially in urban areas. However, that is normally not an issue in rural areas. One way to enhance the performance of NBSUs towards specific pollutant removal is to incorporate sorbent materials to enhance their effectiveness. Nowadays, low-cost sorbents are gaining popularity, namely, new materials, such as carbons from waste or waste by-products from agricultural, household, and industrial sectors [9]. Incorporating sorbents into NBSUs should be considered for enhanced performance, as well as circularity of resources.
To date, many conventional sorbents such as activated carbons (ACs), zeolites, and clays have been studied for the sorption of cyanotoxins [10,11,12]. Their sorption capacity depends on their physico-chemical properties. ACs generally have high sorption capacity of multiple cyanotoxins [10], but it includes major drawbacks such as complex and expensive production and difficulty in regeneration and disposal. On the other hand, biochar (considered a precursor of ACs) is obtained simply by biomass pyrolysis and does not undergo any physical or chemical modification [13], making it potentially more cost-effective. Biochar has been a promising sorbent of pollutants such as metals, microplastics, and nutrients [14,15]. Although limited, they have also been investigated for the sorption of cyanotoxins, namely, MC-LR [16,17,18,19,20,21]. Based on previous studies, biochar generated from various waste biomasses can be used as a prospective sorbent of MC-LR. Wei and Lu [16] investigated the sorption of MC-LR by biochars derived from rice straw obtained at different pyrolysis temperatures. Their study showed that sorption capacity increased with higher pyrolysis temperature of the rice straw. Another study conducted by Song et al. [18] compared biochars derived from Kentucky bluegrass (Poa pratensis L.), microalgae (Spirulina sp.), grape pomace, and coffee residues, where the maximum MC-LR sorption capacity was observed in biochar derived from Kentucky bluegrass. Li et al. [21] reported that biochar derived from wood chips could also effectively adsorb MC-LR. Among these studies, the sorption capacities ranged from 0.14 to 42.4 mg/g MC-LR; the highest sorption capacity being in giant reed biochar pyrolyzed at 600 °C [19], and the lowest by giant reed biochar pyrolyzed at 300 °C [19]. Biochar generated from woody residues has also been proven to have great potential for the sorption of MC-LR [21], as well as to remove organic micropollutants from real wastewaters [22]. However, there have been no studies so far on the sorption of CYN by biochar.
With natural clays and sediments, the sorption depends not only on sediment/clay physico-chemical properties, but also on contact period, organic matter content, and the toxin structure [11,12,23]. One study by Wu et al. [12] showed a direct correlation between organic matter and MC sorption, with higher organic matter content resulting in higher MC sorption due to the interaction between MCs and adsorbed organic matter. Clays can also be chemically modified to enhance their sorption capacity. A study comparing the sorption of MC-LR by natural and chemically modified clay (smectite) showed that the modified clay had better sorption efficiency with different MC-LR concentrations [11].
Light expanded clay aggregate (LECA), sand, and biochar have already been widely incorporated in NBSUs [24,25,26], especially TWs. However, the sorption of MC-LR and CYN by LECA and sand has not been studied. Although natural sandy sediments from water bodies have been tested for cyanotoxin sorption [23], and sand from ripened sand filter systems have been tested for CYN sorption [27], the sorption capacity of pure filter sand with no organic matter has not been studied.
Other chemically modified sorbents that have been studied for the sorption of cyanotoxins include graphene, iron, and silica-based sorbents [28,29,30,31]. Most of these chemically modified sorbents are easily regenerable with no loss of their sorption capacity. However, modified sorbents are more expensive to synthesize, and most research has been restricted to lab scale [32]. Moreover, extensive chemical modification required for these sorbents can lead to increased environmental impact due to the use of chemicals and potential waste generation. Additionally, there is a growing focus on sustainable methods for the disposal of used sorbents, ensuring that they do not harm the environment further.
Another option for sorbents is agro-based materials. Palagama et al. [33] tested raw and treated rice husks for the sorption of MCs, and concluded that acid and heat treatment of rice husks improved the sorption of MCs. More than 50% overall removal of MCs could be obtained from raw rice husks, but sorption of CYN was not tested. To the best of our knowledge, agro-based waste materials without any chemical modifications, such as dried olive pulp pomace (OP) pellets and cork granules, have not been tested for the sorption of cyanotoxins. So, more research on new sorbents for toxins removal is needed, extending also the research on different toxins, other than MC.
Hence, the objectives of this study were to test agro-based waste materials (rice husks, OP pellets, cork granules) and the benchmark NBSU substrates (biochar, LECA, and sand) for (a) their MC-LR and CYN sorption potential, and (b) the kinetics and sorption mechanism of the two best sorbent materials aiming for their future incorporation into NBSUs.

2. Materials and Methods

2.1. Preparation of Sorbent Materials

Rice husk (from Oryza sativa) was obtained from Valente Marques S.A. (Oliveira de Azeméis, Portugal), an agricultural firm that processes rice and other grains. Biochar was obtained from the company Swiss Biochar, Belmont-sur-Lausanne, Switzerland. The biochar was generated by slow pyrolysis (620 °C) of residues from wood chip production. More details on its characteristics can be found in Prodana, M. et al. [34]. Cork was obtained from a cork processing company in Portugal (name not disclosed as requested by the company). Dried olive pomace pellets were obtained from the Union of Agricultural Cooperatives of the South (UCASUL), Alentejo, Portugal. LECA (SIRO HYDROTON) and sand (AXTON SILICE) were obtained from Leroy Merlin retailer in Matosinhos, Portugal.
All of the sorbent materials underwent pre-treatment to ensure similar particle size for further testing. The materials, initially supplied in different particle size ranges, were first sieved using a Retsch vibratory sieve shaker (AS 200) at 1.50 amplitude mm/g for 10 min. Sorbent materials at the size range 2–4 mm were collected for further use. In the case of LECA, the material was first broken down with the help of a mortar and pestle to get smaller bits comparable to the other sorbents, and then sieved. All materials of particle size 2–4 mm were then rinsed with deionized water, left to air-dry in the dark, and then stored in glass bottles for use in sorption experiments. In this work, all sorbent materials were used directly without chemical or thermal processing to make the method simple, eco-friendly, and cost-efficient.

2.2. Cyanotoxin Preparation

The cyanobacterial strains Microcystis aeruginosa (LEGE 91094) and Chrysosporum ovalisporum (LEGE X-001) were used for the production of MC-LR and CYN, respectively. They were obtained from the Blue Biotechnology and Ecotoxicology Culture Collection (LEGE-CC) at CIIMAR, Matosinhos, Portugal (http://lege.ciimar.up.pt/; accessed on 2 February 2022), and grown to the exponential phase in Z8 medium [35,36].
After the culture was grown to the exponential phase, the biomass was harvested. M. aeruginosa cells were harvested by centrifugation (20 min, 4 °C, 4495× g), frozen at −20 °C for three days, and then lyophilized. C. ovalisporum cells were gathered by filtration with an 11 µm Kunstoff-Analysensieb filtration unit (LINKER Industrie-Technik, Vogtsburg, Germany), frozen at −20 °C for three days, and then lyophilized. The lyophilized biomass was stored at room temperature in a dark dry space. MC-LR was extracted from M. aeruginosa and CYN was extracted from C. ovalisporum biomass following a modified version of the method described by Welker et al. [37] and Ramanan et al. [38], respectively. Initially, 10 mg of the lyophilized biomass was taken in 5 mL deionized water and homogenized by sonicating it in a water bath at room temperature for 5 min, three times. It was then left in the fridge at 4 °C for 2 h and subsequently sonicated again in a water bath at room temperature for 5 min, three times. Afterwards, the homogenized biomass solution was centrifuged at 3000 rpm for 5 min, and the supernatant was vacuum-filtered through a microfiber filter paper of 0.22 µm and 47 mm diameter. Then, the supernatant was analyzed (see Section 2.4) and the MC-LR and CYN concentration in the respective biomass was determined.
To perform the different sorption experiments, proportional amounts of cyanobacteria biomass were routinely extracted in 1 L deionized water following the same protocol. Each batch was sub-sampled for determination of cyanotoxins concentration, and the remaining solution was stored at −20 °C until further use in sorption studies.

2.3. Sorption Studies

2.3.1. Screening of MC-LR and CYN Sorption by Selected Sorbents

The screening of MC-LR and CYN sorption by rice husk, OP, cork, biochar, LECA, and sand was done at room temperature, with an average of 22.4 °C during the day and 17.5 °C at night, by putting the selected sorbents in contact with cyanotoxin-contaminated water. Sorbent amounts were pre-determined by filling 100 mL beakers with the materials till the 20 mL mark and weighing them. The volume of cyanotoxin contaminated water used for exposure was 30 mL. This was done to simulate the substrate to water ratio of 2:3 (v:v) in TW mesocosms previously used by Bavithra et al. [39]. The average weights of the materials in g were as follows: 2.5, 2.5, 8.5, 3.5, 12.5, and 35 for rice husk, cork, LECA, biochar, OP, and sand, respectively. Inert gravel stones were placed on top of the sorbents to prevent them from floating above the water level and to ensure equal exposure to the cyanotoxins. Cyanotoxin-contaminated water was prepared by adding previously prepared cyanotoxin extract (as described in Section 2.2) to deionized water. The concentration of the cyanotoxins was selected based on the relevant environmental concentration (100 µg/L) that is within the most likely concentration range observed in dissolved form in surface waters [40]. For each material, triplicates were prepared. The beakers were covered with parafilm to prevent loss of water. However, the weight of the beakers was also checked before and after the contact periods to calculate the loss of water through evaporation. From the loss of weight of the beakers before and after the contact periods, it was concluded that there was negligible loss of water due to evaporation during the tests (below 0.04% after 24 h, below 1.3% after 48 h). Therefore, volume loss was not considered for calculating removal percentages. The beakers were shaken on an automatic shaker (J.P. Selecta Unitronic series, Barcelona, Spain) at 80 rpm, for 24 h and 48 h.
The preliminary sorption studies were carried out in two sets, according to the capacity of the automatic shaker. In the first set, the materials tested were rice husk, cork, and LECA. In the second set, the materials tested were biochar, OP, and sand. Two controls were also prepared: one control with just the cyanotoxin-contaminated deionized water, and another control with cyanotoxin-contaminated deionized water with the gravel stones (CGs).
After the contact period, the samples and controls were immediately taken off the shaker and the solutions were vacuum-filtered with a microfiber filter paper of 0.22 µm and 47 mm diameter. From that, 5 mL was stored at −20 °C until cyanotoxin analysis. Controls showed negligible loss of cyanotoxins, indicating that cyanotoxins were not retained in the filter or degraded during the contact period.

2.3.2. Sorption Kinetics

Following the screening of the sorbent materials, the two materials with the highest sorption capacity were studied for their sorption kinetics, determining also the equilibrium time for the sorption of MC-LR and CYN. The experimental setup was the same as the screening test (Section 2.3.1). The contact periods were 1, 2, 4, 8, 16, 24, and 48 h.

2.3.3. Sorption Isotherm Studies

Sorption isotherms were also determined for the two materials with the highest sorption capacity, using a similar experimental setup and testing 3 different cyanotoxin concentrations (0.1, 1, and 10 mg/L) of MC-LR and CYN at the equilibrium period of 24 h (as determined in kinetic studies). These three orders of concentrations were selected keeping in mind the environmental relevance, as well as practicality of the study (maximum produced by the cyanobacterial strains and extractable from the biomass). Moreover, due to the inherent variability of cyanotoxin in biomass, achieving accurate initial cyanotoxin concentrations were not possible. For that reason, the sorbent weights were lowered to achieve saturation capacities at equilibrium (qe) of varying magnitudes. For this, sorbent weights of the two sorbents were lowered to 0.2, 0.5, and 1 g, and studied with an initial cyanotoxin concentration of 1 mg/L. Then, the data were treated for fitting different isotherm models using the equations given in Table 1.
Table 1 gives information on the equations used to treat the data. Equations (1) and (2) were used to calculate the percentage sorption and sorption capacity (q) of the sorbents. Here, C0 and Ce are the starting and equilibrium cyanotoxin concentrations (mg/L), respectively, and V denotes the volume (L) and m denotes the weight of the sorbents (g). Equations (3) and (4) describe the pseudo-first-order and pseudo-second-order kinetic models, respectively, which were used to assess the sorption kinetics more comprehensively. Here, (qt), the sorption capacity of the cyanotoxins onto each sorbent at time t (h) was calculated using Equation (2), where Ct, the concentration at each sampling time, is substituted for Ce. The parameters K1 (hour−1) and K2 (g mg−1 h−1) are the rate constants associated with the pseudo-first-order and pseudo-second-order kinetic reactions, respectively.
The Langmuir (5), Freundlich (6), Dubinin–Radushkevich (D–R) (7), and Temkin (8) models were also used. The Langmuir constant is denoted by b. By plotting Ce vs. Ce/qe, the qmax and b can be determined from the slope and intercept. The Freundlich constant, denoted by Kf, indicates sorption capacity, n indicates sorption intensity, and 1/n denotes the heterogeneity factor [16]. Plotting lnqe vs. lnCe in Equation (6) revealed the values of Kf and n. KDR (kJ/mol) is the D–R constant linked to sorption free energy (ɛ is the Polanyi potential), and Qmax (mg/g) is the sorption capacity in relation to the micropore volume [45,46]. The values of KDR and Qmax were found by plotting lnqe vs. ε2 using Equation (4). BT (J/mol) and AT (L/mg) are Temkin isotherm constants, where BT is a Temkin constant linked to heat of sorption, analogous to the sorption intensity, while AT is the equilibrium binding constant, analogous to the sorption capacity. Equation (9) can be used to compute the Polanyi potential, where R is the universal gas constant (8.313 J mol−1 K−1) and T is temperature (K). The values of AT and BT were obtained by plotting qe against lnCe using Equation (6).
Although non-linear isotherm model parameter values fit the experimental data better, are more representative, and dependable, the linearized least-square technique is generally favoured because of its simplicity and ease of use [47]. As a result, linearized models were used in the current investigation. Computation and data fitting were done on Microsoft Excel (2019).

2.4. Cyanotoxin Analysis

Cyanotoxins in all solutions were determined by liquid chromatography with tandem mass spectrometry (LC-MS/MS). For that, 5 mL of the solutions stored at −20 °C was thawed and subsequently homogenized by shaking. Then, 1 mL was filtered by Pall ACRODISC (New York, USA) 13 mm PTFE filters with 0.2 μm, and transferred into 2 mL HPLC vials for LC-MS/MS analysis. These filters were previously tested internally in our lab for cyanotoxin retention, with full recovery (work not published). This was applied to all solutions except those obtained from the sorption tests with OP, as it showed strong matrix interference in direct LC-MS/MS analysis.
Solid phase extraction (SPE) was carried out to eliminate the matrix from OP samples. For MC-LR, a modified protocol adapted from Lawton et al. [48] and Ramanan et al. [38] was used; for CYN, the protocol was carried out as described in Guzmán-Guillén R et al. [49]. Recovery tests were made with samples doped with a known amount of MC-LR toxin to evaluate SPE recoveries, which were 84 ± 3%. However, CYN could not be recovered with this method due to a persisting strong matrix interference with the LC-MS/MS even after the SPE, preventing quantification of CYN in solutions obtained from the sorption tests with OP.
The LC-MS/MS analytical method follows indications from Pekar et al. [50] and Zervou et al. [51], with some modifications. The instrument used to quantify MC-LR and CYN was a Waters Alliance e2695 LC system, coupled with a triple quadrupole MS (Micromass® Quattro micro TM API) with electrospray (ESI) interface. The program used for data acquisition and processing was Mass Lynx version 4.1.
Separation was achieved on C18 Hypersil Gold column (100 × 4.6 mm I.D., 5 μm, Thermo Scientific, Waltham, MA, USA) kept at 30 °C, with a flow rate of 0.35 mL/min and injected volume of 10 μL. A gradient elution was used with mobile phase A, methanol, and B ultrapure water both acidified with 0.1% formic acid (2% A and 98% B for 3 min, 40% A and 60% B at 4 min for 1 min, increasing to 60% A at 7 min for 2 min, increasing to 80% A for 2 min, and returning to initial conditions at 20 min and equilibrating for 5 min).
The MS was operated in positive mode with multiple reaction monitoring (MRM). The capillary voltage was maintained at 3.5 kV; cone at 30 V; extractor at 3 V; and Lens at 0.2 V. The source temperature was held at 120 °C and desolvation at 350 °C and 500 L/h. Nitrogen was used as a sheath and auxiliary gas and Argon as a collision gas at a pressure of 0.5 bar. MRM conditions were optimized with standard solutions injected in positive polarity mode, in full scan (30–1500 m/z), and later in MRM mode. Transitions, cone, and collision energy voltages for each cyanotoxin are present in Table S1. The cyanotoxin standard solution and sample solutions were injected in duplicate in the LC-MS/MS equipment, and at each set of 10 samples, a blank and two standard mix solutions of different cyanotoxin concentrations were introduced for QA/QC. Quantification was performed by external calibration curve. All of the standard cyanotoxin solutions of MC-LR and CYN were injected in the LC-MS/MS individually, with a concentration range from 1 µg/L to 1000 µg/L. The limits of detection were 28.7 µg/L and 12.5 for MC-LR and CYN, respectively, and the limits of quantification were 86.9 µg/L and 37.8 µg/L for MC-LR and CYN, respectively. The MC-LR (CRM-00-MC-LR, Lot 19-001, 96% purity) and CYN (CRM-03-CYN, Lot 16-001, 99% purity) standard solutions were supplied by Cifga (Lugo, Spain).

2.5. Characterization of Sorbent Materials

The sorbent materials were characterized for comparing the surface areas and the element compositions among the sorbent materials; specifically, to understand their morphologies, degrees of porosity, and composition variances. This was done using Scanning Electron Microscopy/Energy Dispersive Spectroscopy (SEM/EDS). Since the goals were to observe degrees of porosity and composition variance among the different materials, and not the pore size itself, a 100× magnification was used for all of the sorbent materials, as it gave an apt field of view to observe this. Care was taken during sampling to provide a more representative sample of each sorbent, in order to obtain conclusions on the materials’ surface characteristics. For each sorbent, each visually different surface was analyzed by EDS (Supplementary Materials Section S1, Figures S5–S10), where each of the surfaces were labelled as different zones of the material (Z1, Z2, Z3…). Moreover, EDS data were also seen in conjunction with the backscattered electron diffraction mode of SEM.
The SEM/EDS analysis was performed using a high-resolution (Schottky) Environmental Scanning Electron Microscope with X-Ray Microanalysis and Electron Backscattered Diffraction analysis: FEI Quanta 400 FEG ESEM/EDAX Genesis X4M. For sand, samples were characterized using low-vacuum mode because it is a bad conductor. The scanning electron mode was used to give information on the topography of the materials. The backscattered electron mode was used to give information on the distribution of elements on the surface of the materials (brighter areas denoting higher atomic number elements and darker areas denoting lower atomic number elements), and the X-ray detector was used to give information on the elemental composition. All SEM/EDS analyses were performed at Centro de Materiais da Universidade do Porto (CEMUP).

2.6. Data Treatment

Statistical analyses were performed in Sigmaplot v.14, Systat Software Inc. (San Jose, CA, USA), and Microsoft Excel (2019). Statistical differences between the two controls (C and CG) were initially tested by performing a two-way ANOVA followed by a Tukey test. The significance levels of all the tests were p < 0.05. No significant difference was found between the two controls for any of the experiments, therefore, CG was considered as the control for the subsequent analyses. For the pre-screening of the sorbents, one-way ANOVA was performed to test sorption differences between the sorbents at contact periods 24 h and 48 h. For statistical purposes, when values were <LOD, it was considered as half of the LOD. All graphs and regression statistical analysis for the kinetic studies were done in Microsoft Excel (2019).

3. Results

3.1. Pre-Screening of Sorbents

Biochar and LECA showed highest sorption potential of both MC-LR (100 µg/L) and CYN (300 µg/L) (Figure 1). Highest MC-LR sorption rates were >86% by biochar, with MC-LR levels <LOD; and an average 62% and 78% by LECA at 24 h and 48 h, respectively (Figure 1a). The highest CYN sorption rates were >98% by biochar, with CYN levels <LOD; and an average 68% and 80% by LECA at 24 h and 48 h, respectively (Figure 1b). Controls showed no sorption of both compounds, and for simplification, this is not included in Figure 1. Tables including data and statistics are provided in the Supplementary Materials (Tables S2 and S3).
One-way ANOVA analysis for these pre-screening results showed significant difference between the control and the sorbents at 24 h and 48 h for both MC-LR and CYN (p < 0.05). The Tukey post hoc tests revealed that for MC-LR sorption there was no significant difference between the control and rice husk and cork at 24 and 48 h. However, at 48 h, OP showed significant difference from the control (p < 0.05). For CYN sorption, there was no significant difference from the control and sand at 24 and 48 h. Rice husk had a low MC-LR sorption rate of 3% at 24 h and no sorption at 48 h, as well as low CYN sorption rates of 10% and 9% at 24 h and 48 h, respectively. Cork also had low MC-LR sorption rates of 5% and 0.6% at 24 h and 48 h, respectively, and low CYN sorption rates of 6% and 10% at 24 h and 48 h, respectively. OP gave problems with the LC-MS/MS analysis due to matrix effects, even after a tentative clean-up step with SPE. Although there was MC-LR sorption of 1% and 20% at 24 h and 48 h, respectively, by OP, this material seems not feasible to be incorporated into NBSUs due to the leaching observed. Filter sand had an average 26% MC-LR sorption at 24 and 48 h, and negligible CYN sorption of 3% and 4% at 24 h and 48 h, respectively. All in all, biochar and LECA were further studied for kinetics and different sorption isotherm models due to their high sorption capacity.

3.2. Kinetic Studies

Figure 2 shows the sorption of the cyanotoxins MC-LR and CYN by biochar and LECA at different contact periods up to 48 h. Results show that the sorption of MC-LR and CYN by biochar is rapid, occurring within the first 8 h and reaching equilibrium thereafter. By 8 h, biochar reached an average sorption of 80% for MC-LR and 90% for CYN. There was no significant increase in the sorption rates from 8 h to 48 h with biochar. The slight reduction in sorption observed in MC-LR by biochar was not assumed to be of any significance, owing to the sensitivity limitations that come with detecting low concentrations of microcystins in water samples. However, there was a significant increase in the sorption rates from 8 h to 48 h with LECA. Sorption by LECA increased more steadily before reaching equilibrium at 48 h. Biochar sorbed less MC-LR (80%) than CYN (95%) from 16 h. LECA equally sorbed MC-LR (83%) and CYN (80%).
The pseudo-first-order and pseudo-second-order sorption kinetics (Equations (8) and (9), Table 1) resulted in the parameter fitting summarized in Table 2, while graphics are shown in Figure 3 and Figure 4. It can be deduced that the pseudo-second-order kinetic model fits the data better than the pseudo-first order kinetics model, giving R2 between 0.94 and 0.99.

3.3. Sorption Isotherms

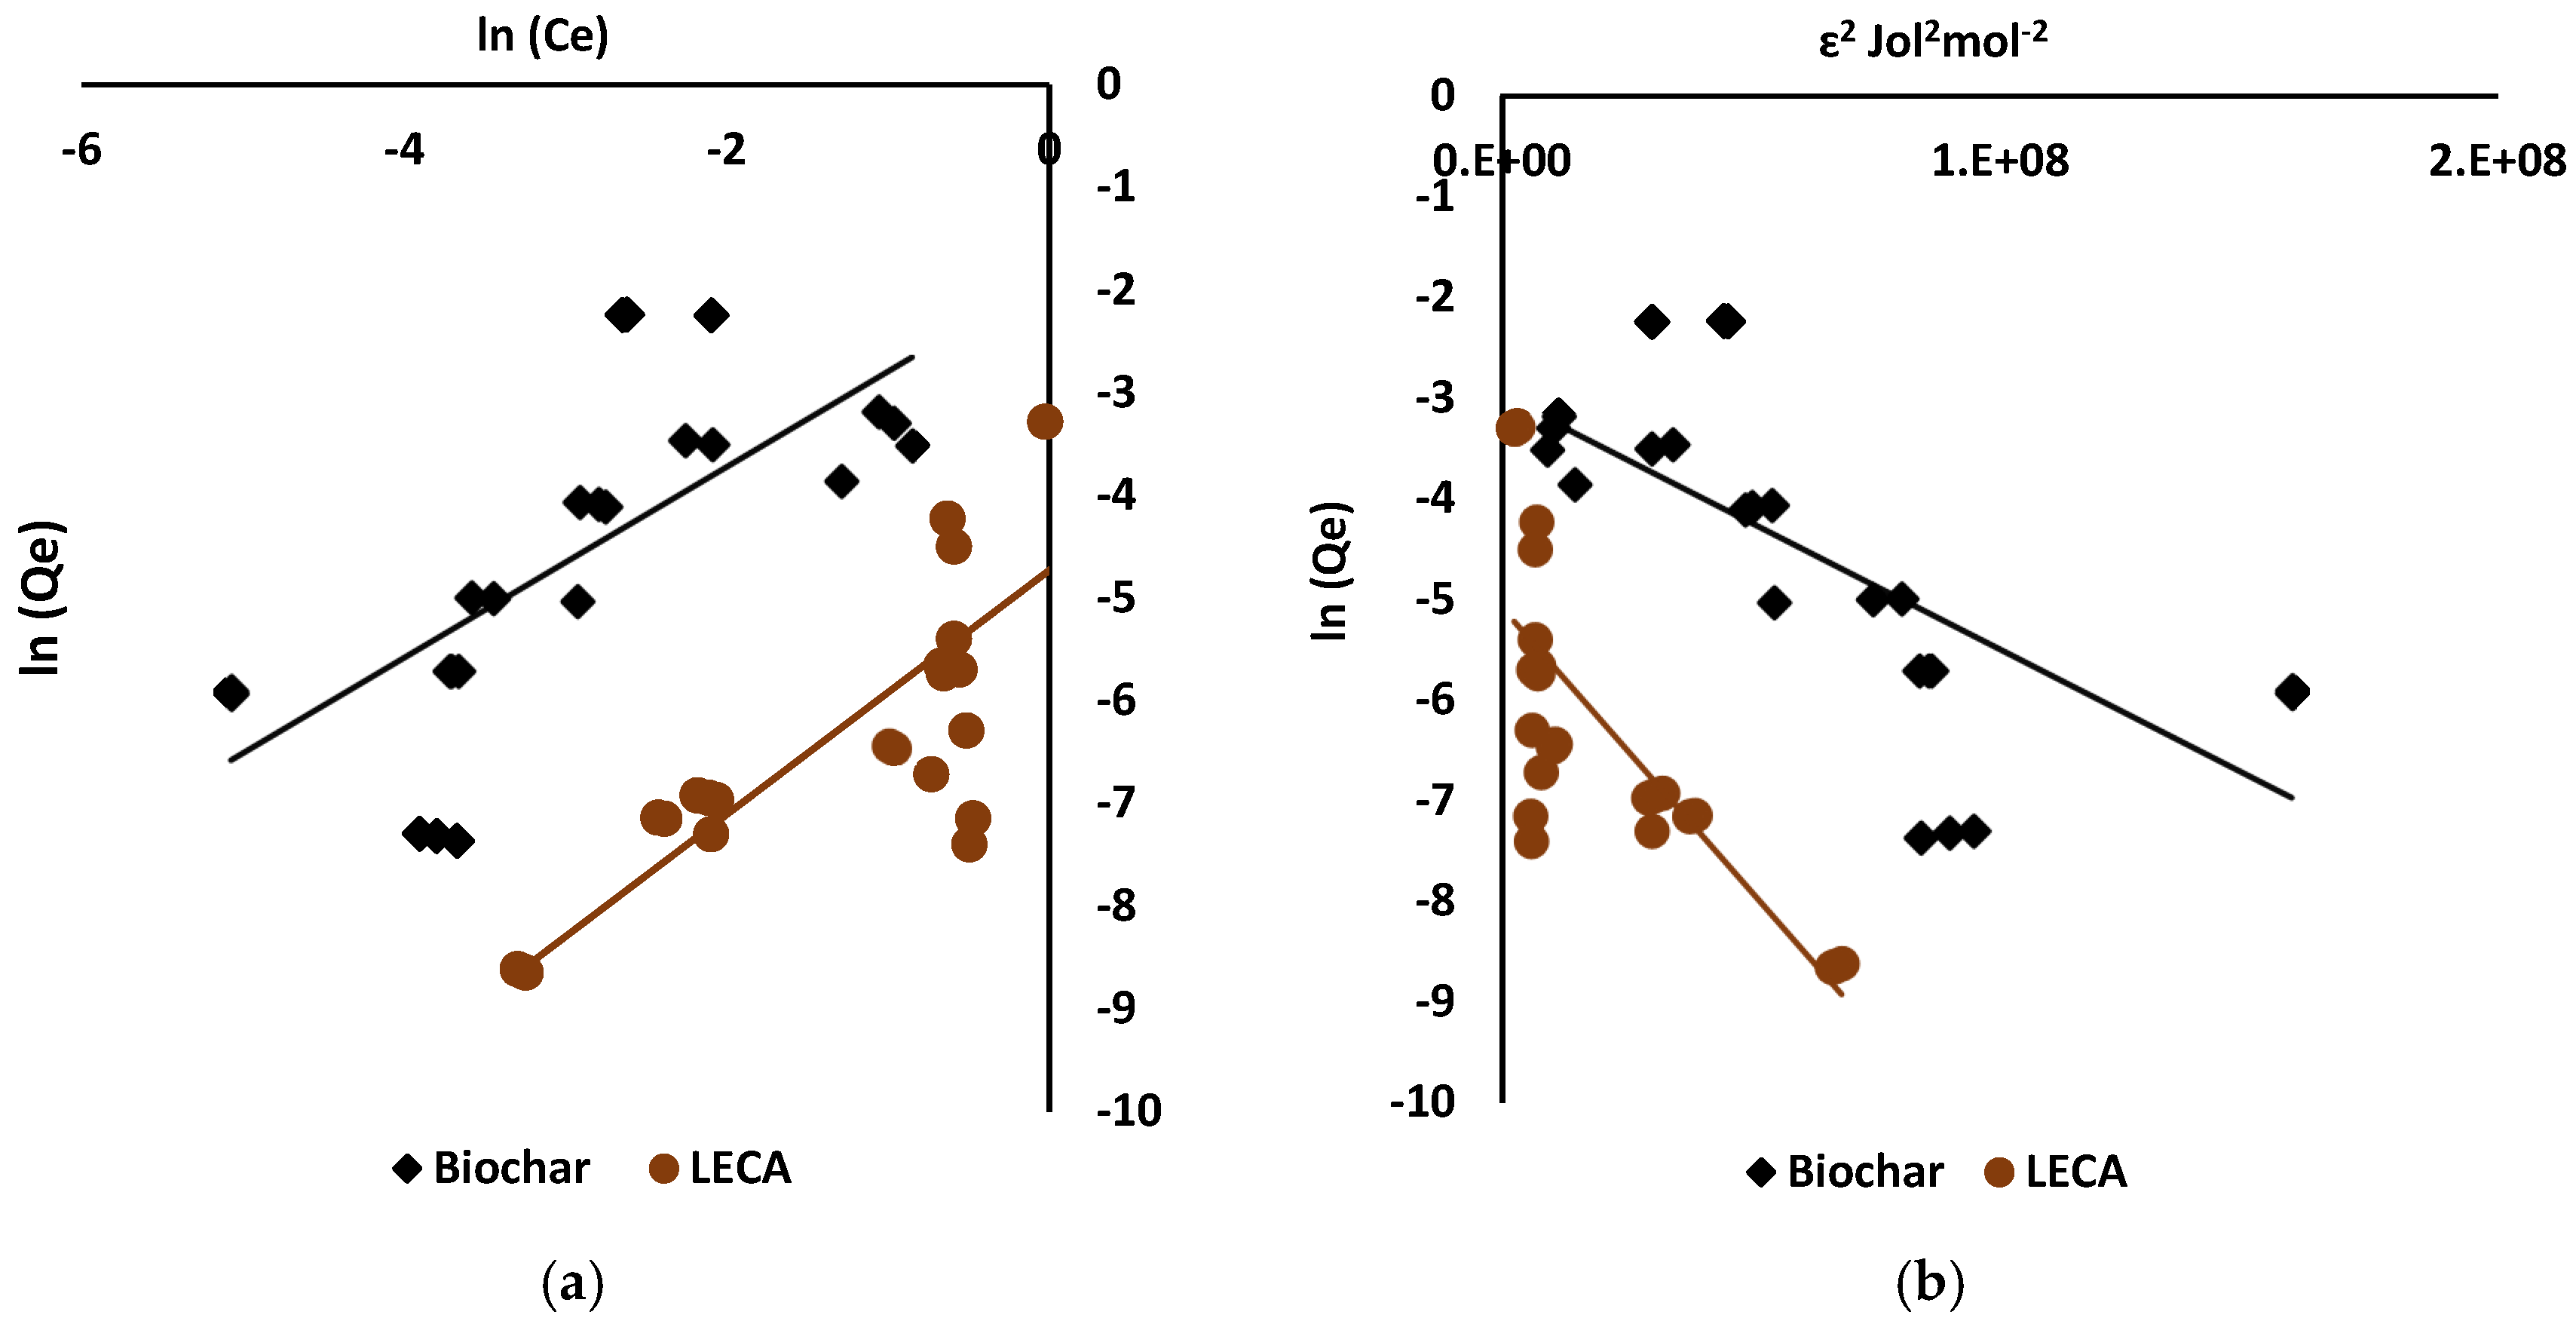
Four sorption models (Langmuir, Freundlich, D–R, and Temkin) were applied to the experimental data to understand the favourability of MC-LR and CYN sorption onto biochar and LECA, and potential processes involved. Detailed modelling results of sorbents biochar and LECA are given in Table 3. The sorption isotherm plots that had the best fit for the sorption of MC-LR by biochar and LECA, Freundlich and Dubinin–Radushkevich (D–R), are shown in Figure 3, and of CYN by biochar and LECA, are shown in Figure 4. The isotherm plots that did not fit the data well are in the Supplementary Materials (Figures S3 and S4). The sorption capacities, Kf, were estimated to be 0.05 and 0.16 L/g for MC-LR and CYN for biochar, respectively, and 0.02 and 0.01 L/g for MC-LR and CYN for LECA, respectively. The Qmax values were estimated to be 0.09 and 0.05 mg/g for MC-LR and CYN for biochar, respectively, and 0.05 and 0.01 mg/g for MC-LR and CYN for LECA, respectively.

3.4. SEM/EDS of Sorbents

SEM/EDS results showed that all of the sorbent materials had their own characteristic surface morphology and elemental composition (Supplementary Materials Section S1). Some materials had uniform morphologies and distribution of elemental compositions throughout their surface (cork), whereas others had irregular morphologies (OP, rice husk), and others had high morphological and elemental composition variance even within their own surface (sand, biochar, LECA). The different surfaces of each sorbent material are marked as Z (1, 2, 3…) on the SEM images. This section focuses on the SEM/EDS results of biochar and LECA. The SEM/EDS results of rice husk, cork, OP, sand, and the EDS results of biochar and LECA can be found in the Supplementary Materials (Supplementary Section S1).

3.4.1. Biochar

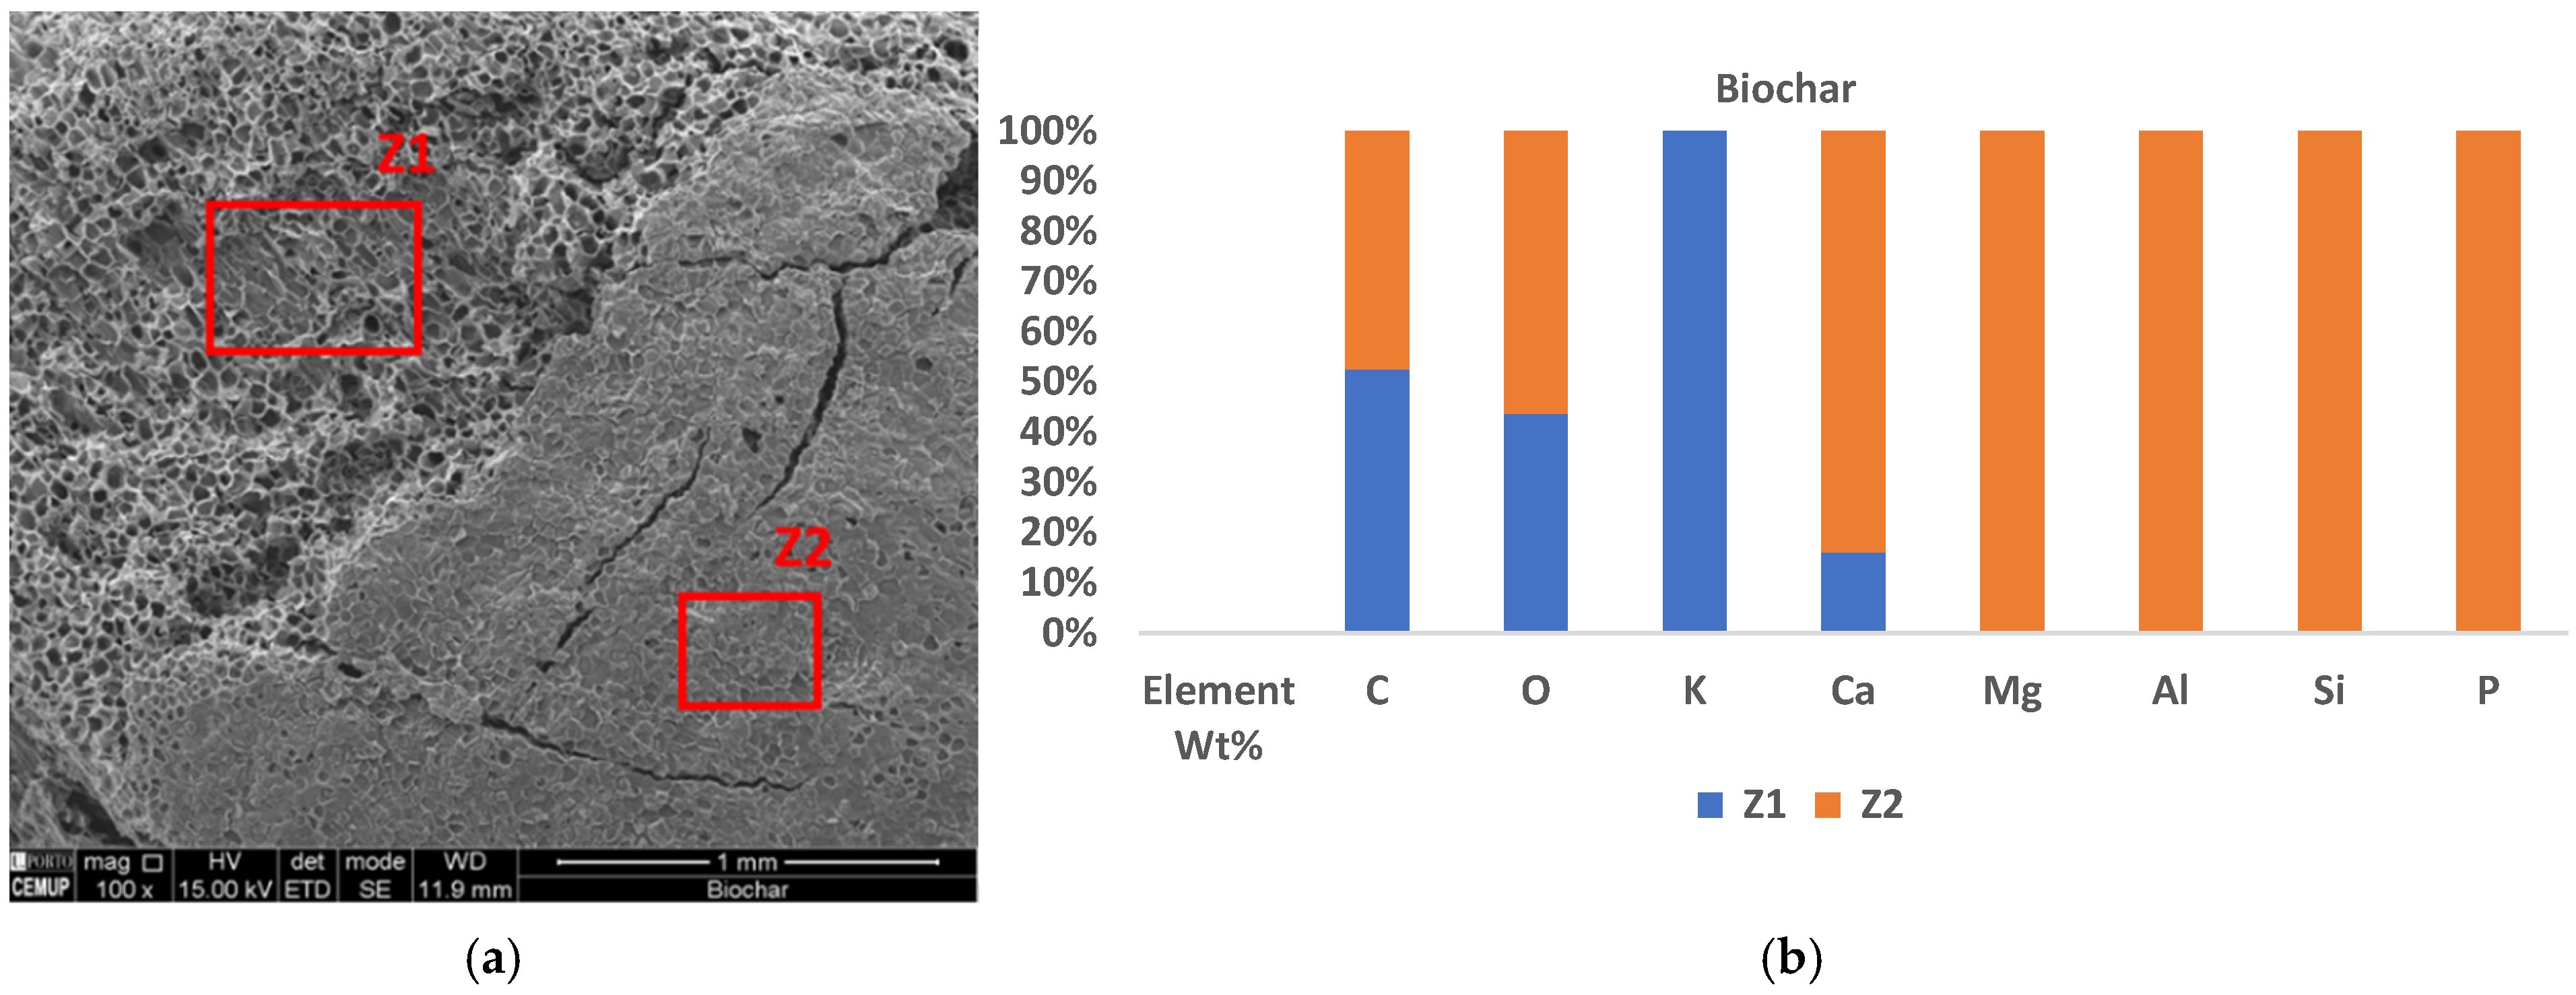
Two perspectives of the biochar could be observed in the SEM image (Figure 5a). The horizontal part of the biochar represented the smooth part of the wood, or the surface (Z2), and the vertical part represented the longitudinal part of the wood that has channels (Z1). The latter part had more pores than the former. Differences in the element composition can be observed in both parts as well (Figure 5b and Figure S10a,b).

3.4.2. LECA

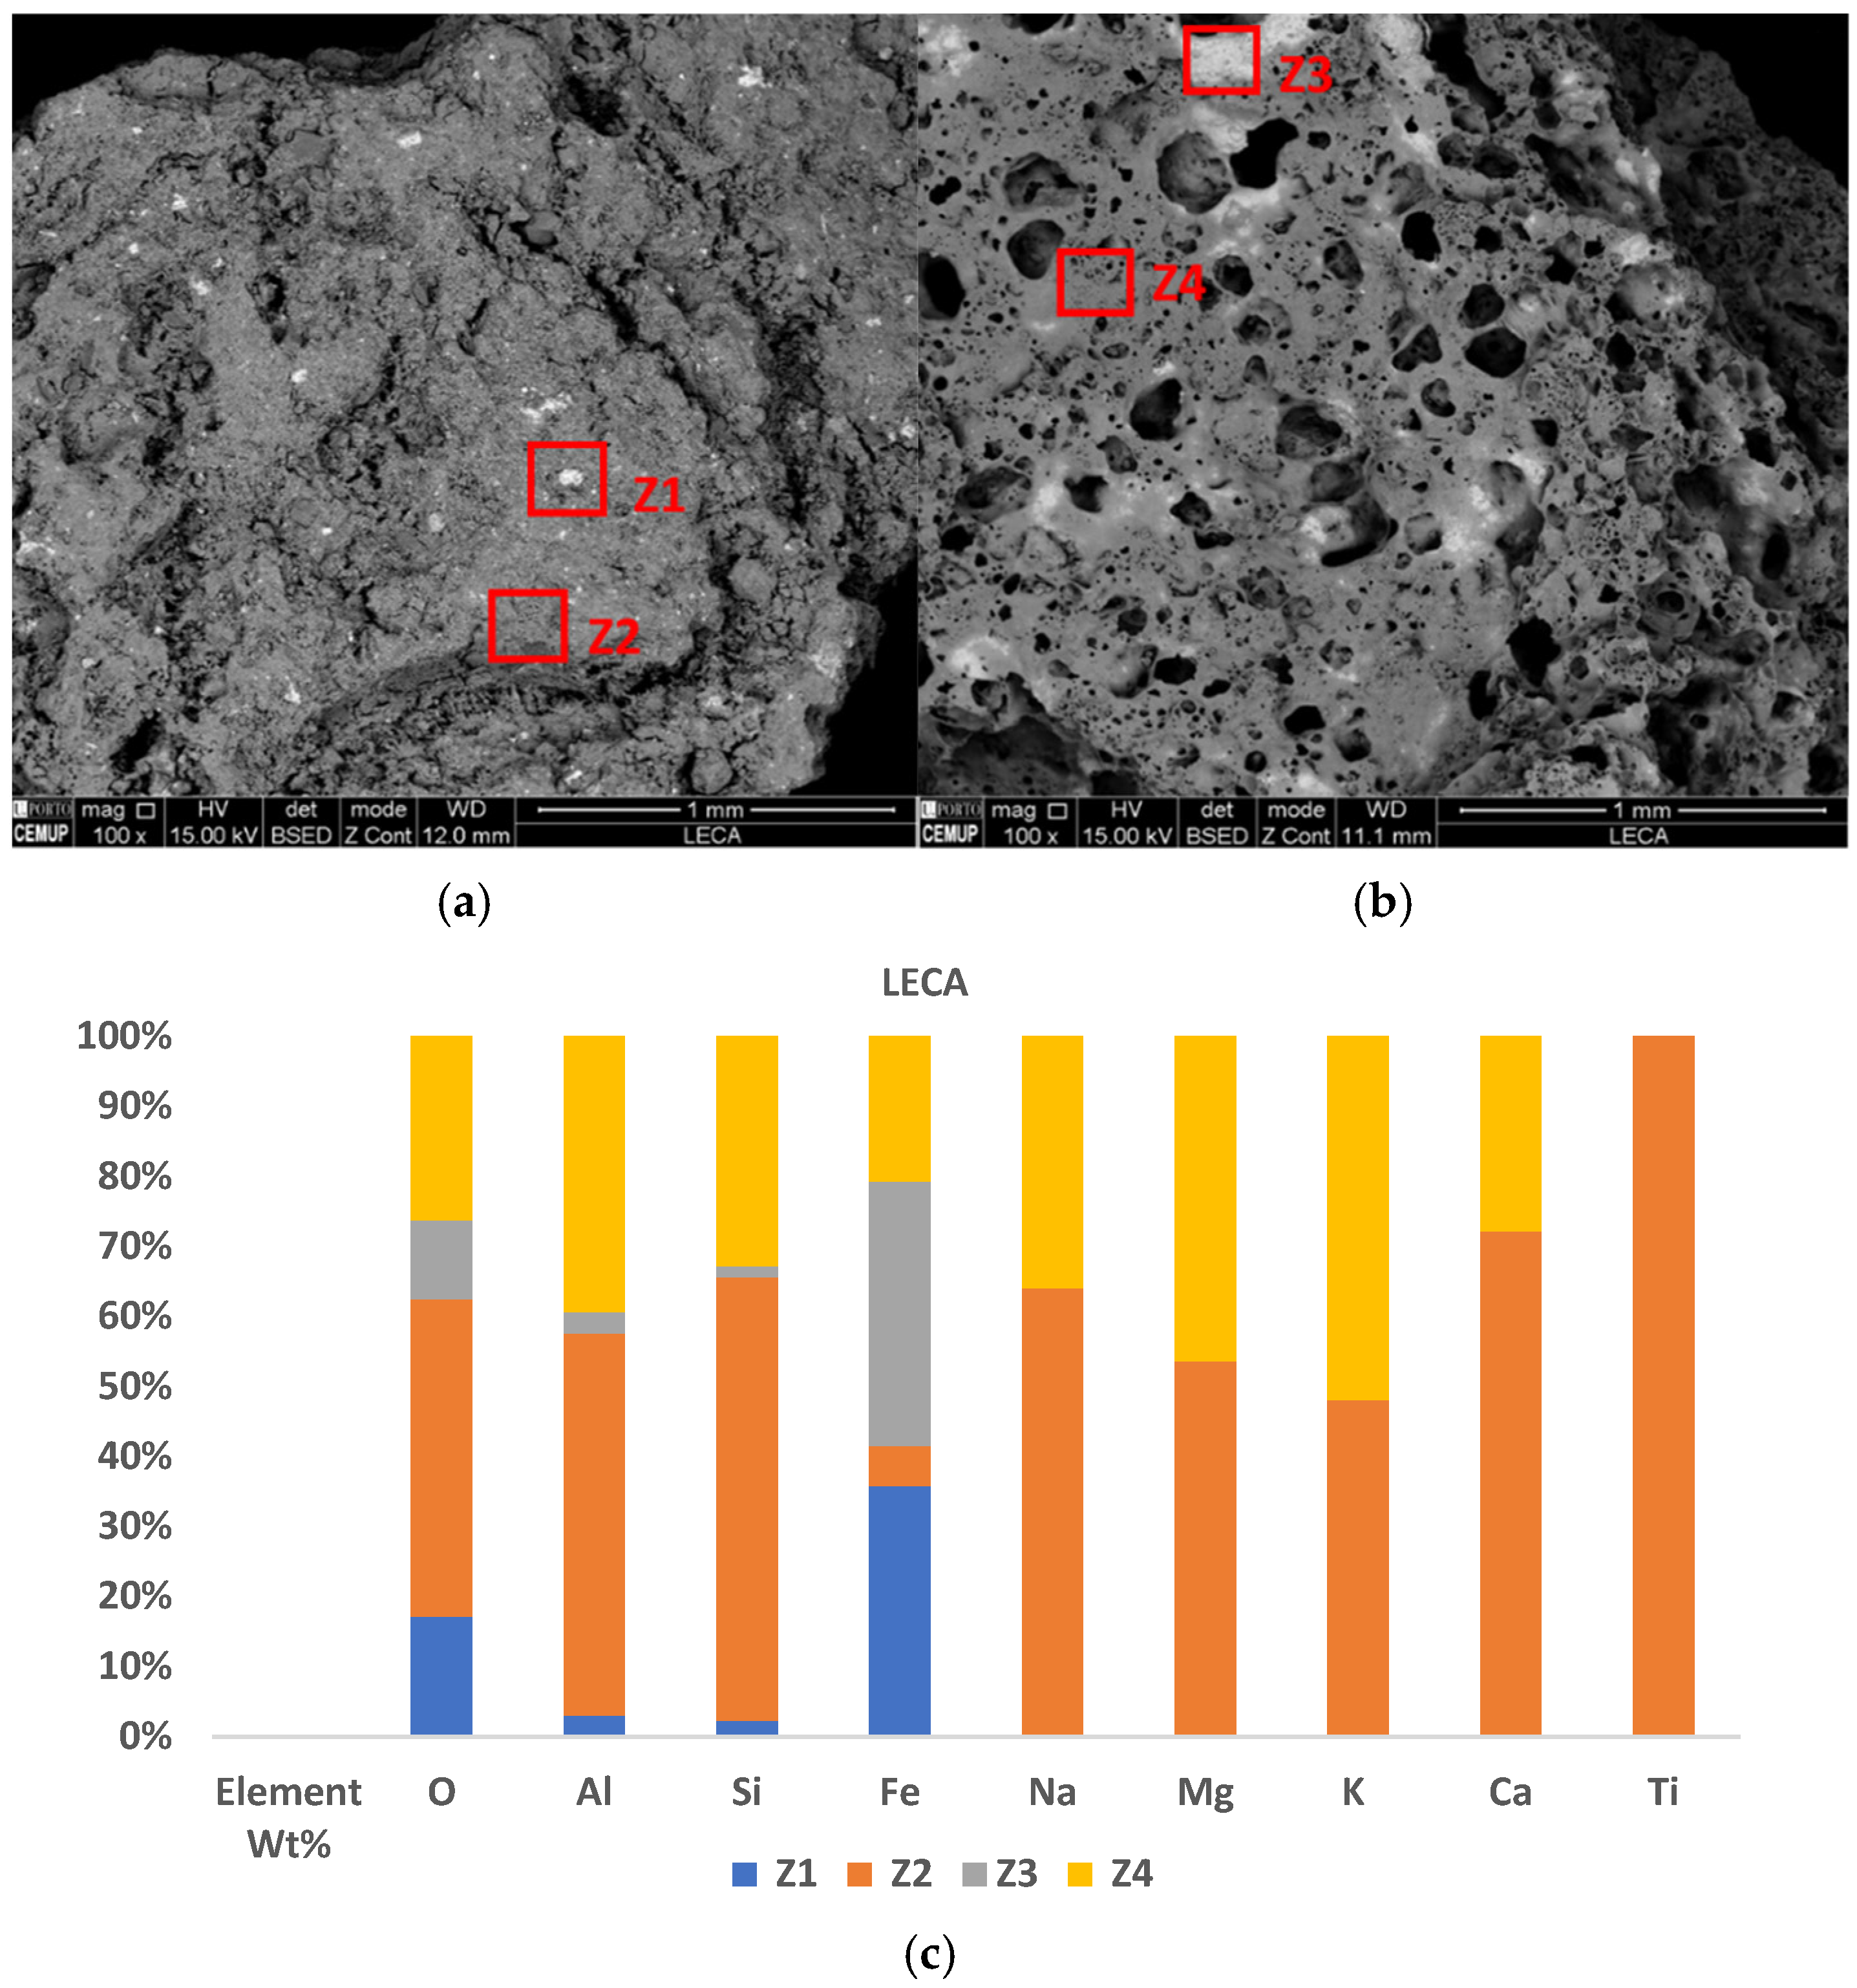
Since LECA was broken down, there were differences in surface morphologies and element composition in the outer (brown) (Figure 6a) and inner (grey) (Figure 6b) parts. The difference in element composition on the outer and inner surfaces can be seen in the backscattered electron diffraction mode SEM images (Figure 6a,b), the stacked column graph (Figure 6b), and the EDS graphs (Figure S9a–d). The brighter spots on the SEM image (Z1 and Z3) denote the concentration of elements of higher atomic number, and the darker spots on the SEM image denote the concentration of elements of lower atomic number, in the respective areas.

4. Discussion

4.1. Pre-Screening of Sorbents

The pre-screening reports the sorption potential of cyanotoxins in agro-based waste materials that can be incorporated as substrates materials in NBSUs (Figure 1). To the best of our knowledge, this is the first report on the sorption capacity of MC-LR and CYN by cork granules and OP, as well as to benchmark them against NBSU common substrates such as LECA and sand. In the case of OP, CYN sorption could not be reported because the matrix (which had other compounds leached by OP) did not allow for CYN detection by the analytical equipment used. Even after a tentative clean-up step by SPE before injecting the sample in the chromatographic equipment, the matrix effect was too intense to allow CYN determination. As so, it was not possible to optimize a methodology for CYN after contact with OP. Nevertheless, considering the leaching behavior of OP, this material does not seem feasible to be incorporated in NBSUs and was discarded. In certain cases, like rice husk and cork, the removal percentages dropped between 24 h and 48 h, probably due to desorption (which still needs confirmation).
In contrast to the study by Palagama et al. [33], which had >50% sorption of MC-LR, the present study had lower sorption of MC-LR by rice husk (4%). However, Palagama et al. [33] also showed a significant improvement in MC-LR sorption in treated rice husks over raw rice husks. The MC concentrations and sorbent amounts used also varied highly between the studies. CYN sorption by rice husks was presently studied for the first time, showing limited sorption capacity (below 10%).
In general, sorption of MC-LR is governed by mesopore filling, hydrogen bonding, π–π interactions, hydrophobic interactions (induced by carbon materials), electrostatic attraction, and dispersive interactions [31]. According to the literature, due to the molecular size of MC-LR (ranging from 1.3 to 2.94 nm in diameter), mesoporous sorbents (diameter between 2 and 50 nm) have been verified to preferentially adsorb MC-LR, rather than micro- or macropores [52]. In this study, materials such as rice husk, OP, and sand lacked porosity (Figures S5a, S7a and S8a), cork was macroporous (Figure S6a), and biochar and LECA had an uneven distribution of smooth areas, macropores, and mesopores (Figure 5a and Figure 6a). Regarding CYN sorption, it is considered to be weaker in comparison to other cyanotoxins due to its high water-solubility and zwitterionic properties. CYN sorption is primarily driven by interactions with organic carbon. Moreover, for CYN, the literature indicates that carbon-based materials with a greater volume of mesopores is better suited for sorption of the molecule [53]. Thus, the reason why agro-waste materials such as rice husk, OP, and cork did not show significant sorption potential could be because they were not activated by chemical/thermal modification; this significantly improves sorption capacity by increasing surface area (porosity), accessible active sites, removal of pre-adsorbed substances (thermal activation), and activation for better selectivity [54]. However, doing so would increase the costs and complexity of production, hence decreasing the interest in potentially incorporating them in NBSUs. While there have been several studies on the sorption of cyanotoxins by chemically modified sorbents [10], they are less attractive for application in pilot or full-scale NBSUs due to their high manufacturing costs and energy consumption. Therefore, agro-waste materials could potentially be interesting for direct usage in NBSUs if there would be potential without activation, but that was not the case in the present study for the selected materials.
On the other hand, biochar and LECA showed good sorption of MC-LR and CYN. Biochar derived from various waste biomasses, including rice husk [55] and wood residues [21], have seen sorption of MCs and, in some cases, nodularin [55]. The sorption of CYN has not been studied in biochar and is reported here for the first time. As for LECA, the MC-LR and CYN sorption was reported for the first time in the present study. Sand showed low sorption of MC-LR (26%) and CYN (1%) in the present study, which was comparable to previous MC-LR and CYN sorption studies with sand. Kumar et al. [56] showed that sand used as filter media could only remove <20% MC-LR during the sorption phase. In a study with natural sandy sediments [23], there was little to no sorption of CYN. Another study that evaluated sand from a ripened slow sand filter [27] showed that sorption by sand was not part of the removal process.
Due to their good sorption capacity, biochar and LECA were further studied. While their sorptive properties might change when being incorporated into mesocosm- or full-scale NBSUs, it is highly relevant to characterize their sorption potential and understand the kinetics and mechanisms of the sorption of cyanotoxins.

4.2. Kinetics

The kinetics studies were done to assess the effects of contact time and sorption rates of MC-LR and CYN. Biochar showed quicker sorption of both MC-LR and CYN than LECA. Data fitted the pseudo-second-order kinetic model better than the pseudo-first-order kinetic model, as revealed by the higher regression constant (R2) (Table 2). This is in accordance with the sorption kinetics of previous works of MC-LR sorption by biochar [16,17,33]. The pseudo-second-order model views chemisorption as the process’s rate-limiting mechanism, whereas the pseudo-first-order model considers that physisorption controls the rate at which particles adhere to the sorbent [41]. The calculated qe of the pseudo-second-order kinetic model was also closer to the experimental qe (Table 2). From this, it is apparent that the sorption rate of both cyanotoxins onto biochar and LECA was limited by chemisorption. In some studies [17,18], MC-LR sorption onto biochar fitted well with the Elovich kinetic model, which is also a model that describes activated chemisorption processes and is valid for heterogenous surfaces [57]. The k2 values also indicate that biochar has faster sorption kinetics of MC-LR and CYN than LECA. The calculated qe values according to the pseudo-second-order kinetic model also showed that CYN sorption capacity at equilibrium was higher in biochar than MC-LR, and similar for MC-LR and CYN in the case of LECA.
It should be noted that the present study only focuses on the sorption kinetics of cyanotoxins onto biochar and LECA. In an environmental setting, where pollutants are present as complex mixtures, there could be competition for sorption sites from other contaminants which could influence the sorption kinetics of cyanotoxins by these materials [23,58,59]. Moreover, when incorporated in an NBSU, components of the system other than the substrate could also influence the sorption kinetics. This includes vegetation, oxygen transfer, pollutant loading, flow direction, area, temperature, etc. [60,61,62]. Despite this point of argument, the information on cyanotoxin sorption kinetics and rate coefficients of biochar and LECA is valuable for the design configurations of NBSUs for water treatment, including just sorption. This includes determining factors such as the hydraulic retention time.

4.3. Sorption Isotherms

From the R2 values in Table 3, the experimental data for MC-LR and CYN sorption by biochar and LECA fit the Freundlich and D–R isotherm models better than the Langmuir or Temkin models. This is explained by the heterogenous surfaces of biochar and LECA, which results in variable bond energies on the surface. The fundamental assumption of the Langmuir model implies that sorption follows a monolayer pattern and that there are a limited number of binding sites on the sorbent surface, hence, the solid surface eventually approaches saturation. The Langmuir model also implies that the sorbate molecules adsorbed on the surface do not interact laterally [43,44], and it does not take into consideration surface roughness or multilayer sorption. To overcome these constraints, models such as the Freundlich, D–R, and Temkin were applied. The Temkin isotherm model assumes that as the sorbent surface is covered, the sorption heat drops linearly. Sorption heat is the amount of heat released when one unit of sorbate gets sorbed on the sorbent surface. It also assumes that the sorption is characterized by a uniform distribution of binding energies, up to a maximum binding energy. Although the Temkin isotherm model is used to describe multilayer sorption and is commonly used for the sorption of water contaminants, its dimensional inconsistency, approximate nature, poor fitting capacity, and widespread misquotation are known major drawbacks when using it [63].
The Freundlich isotherm is commonly used to model sorption processes in environmental applications, as it describes sorption onto heterogeneous surfaces with a non-uniform distribution of sorption sites [64]. It is the first known model that describes non-ideal and reversible sorption that is not limited to the formation of monolayers. According to the Freundlich isotherm, the amount sorbed is the total sorption on all sites (each with its own bond energy), with the stronger binding sites occupied first, until sorption energy is exponentially diminished at completion of the sorption process [64]. It also describes a physical type of sorption in which sorption occurs in several layers with weak links (multilayer). Presently, the Freundlich isotherm model represented the experimental data quite well, as evidenced by R2 values equal to or greater than 0.7 in all cases except for CYN sorption by biochar, as seen in Table 3. This is similar to previous studies of MC-LR sorption onto biochar where they were also well described with the Freundlich model [16,17,18,19,20]. The value of n indicates the magnitude of the sorption and the sorbent site energy distribution. From Table 3, it can be seen that for biochar, the n values were 1.08 (MC-LR) and 1.07 (CYN), while for LECA, the n values were 0.79 (MC-LR) and 0.84 (CYN), reflecting that the sorption intensity was higher in biochar. The 1/n values also indicated that biochar has a slightly lower surface heterogeneity than LECA (in broken form), which is consistent with the SEM/EDS data (Section 3.4). The sorption capacity constant Kf was observed to be higher for biochar (MC-LR = 0.05, CYN = 0.16) than LECA (MC-LR = 0.02, CYN = 0.01), which is consistent with the screening and kinetics data. Compared to the Kf values for MC-LR sorption by biochar in previous works, the Kf value in this study is lower. However, not all studies had the similar isotherm model fits. Even among previous studies, the MC-LR sorption capacities and mechanisms differed with different feedstock and pyrolysis temperatures of the biochar. The biochars from these previous studies were generated from rice straw (Kf = 0.69–2.45) [16], iron-activated biochar generated from Bermuda grass (Kf = 12.33) [17], Kentucky bluegrass (Kf = 230.9) [18], pine sawdust (Kf = 1.52–4.53), maize straw (Kf = 1.47–5.69), and chicken manure (Kf = 2.57–6.35) [20]. In one study with biochar generated from giant reeds, the Kf values (0.086) [21] were similar to this study.
The D–R model, like the Freundlich model, describes heterogeneous surfaces and can be useful at especially high-to-intermediate sorbate concentrations. Although the D–R isotherm model is used to differentiate between physical and chemical sorption of metal ions [45], it was considered for this study because it explains the sorption process on a porous sorbent or a heterogeneous-surfaced sorbent, and reflects the sorption free energy. It assumes that the sorption process is based on the filling of micropores. The D–R isotherm model fit the experimental data fairly well (R2 ≥ 0.6), except for CYN with biochar. KDR is a constant linked to the free energy of sorption per unit of cyanotoxin when the ions migrate from infinity to the sorbent’s surface [47]. Values of KDR < 1 on average suggest that the sorbent’s surface has micropores. As seen in Table 3, KDR values are less than unity, which suggests that the micropores on the sorbent surfaces are high. This is in conformity with another work where MC-LR sorption by biochar fit the D–R model [17]. The Qmax values observed are theoretical saturation capacities at equilibrium in relation to the micropore volume of the sorbents [47].
It is important to note that the isotherm models have different underlying assumptions that govern them and, therefore, discrepancies between the isotherm constants and maximum sorption capacities (qmax for Langmuir, Kf for Freundlich, Qmax for D–R, AT for Temkin). Furthermore, the heterogeneity of both biochar and LECA, the impracticality of attaining precise initial cyanotoxin concentrations, as well as the lack of complete temperature control contributed to the low R2 values obtained in the current work. Moreover, there were practical constraints in terms of achieving higher cyanotoxin concentrations than 10 mg/L for the sorption studies, due to the amount of biomass available for this study. This prevented us from determining the maximal sorption capacities from the experimental data to determine the saturating concentration for the materials.
Having said the above, the heterogeneity of biochar and LECA is what makes them favourable sorbent materials that can be incorporated in NBSUs. The multilayer sorption is a characteristic that would be beneficial with the frequent variability in the nutrients as well as cyanotoxin concentrations due to the on/off cycles of eutrophication and toxic algal blooms in surface waters. Moreover, NBSUs also have other components contributing to the degradation or removal of cyanotoxins. Some examples of the other component mechanisms are microbial degradation, phytodegradation, phytoextraction, filtration, and sedimentation [61]. The sorption capacity, as well as the loose availability for biotic degradation, are ideal characteristics that biochar and LECA present in NBSUs.

4.4. Influence of Surface Element Composition and Morphology of Sorbents on Sorption Potential

From the SEM/EDS data, it can be observed that all of the sorbent materials had their own characteristic surface morphology and elemental compositions. Characterization of the surface morphology was important because it plays an important role in impacting sorption characteristics, especially the surface roughness, texture, and porosity [65]. Moreover, taking into consideration that most of the sorbent materials were raw and untreated, and therefore complex on their own, it was important to study their surface morphologies and compositional variances. The heterogenous surface morphology of biochar and LECA (Figure 5 and Figure 6) confirms that the Freundlich and D–R isotherm models represented the experimental data well. Moreover, porosity was observed in both biochar and LECA, which is characteristic of the D–R model. Despite not having done any chemical modifications to the sorbents, the surface element composition was characterized to check the uniformity or distribution of elements on their surfaces. High variability in surface element composition, even within a sorbent, further indicated its heterogeneity. It also presented the differences in surface element composition between the sorbent materials. However, the surface elemental compositions between the materials were too different to make any correlations with sorption capacity.
Although the effect of pH on sorption of the cyanotoxins was not within the scope of this study, the pH of the sorbate (cyanotoxin solutions) was maintained at pH 7. At pH 7, MC-LR has a net negative charge and CYN is zwitterionic. While negatively charged MC-LR is more available to positively charged surfaces such as those of clays with positively charged elements, CYN is a more stable cyanotoxin at pH 7. This results in more MC-LR adsorption onto Ca-saturated clays than, for instance, Na-saturated clays [66]. From the surface elemental composition of biochar and LECA, it can be seen that there is a higher presence of positively charged elements (Figure 5 and Figure 6).
However, whether the surface element composition would have an influence on the sorption is not within the scope of this study. Most studies using agro-waste biomasses as sorbents chemically modify them to improve their sorption capacities [33,43]. However, doing so would go against the objective of this study, which is to help sustainably manage agro-waste, be locally adapted, and resource efficient, thereby bringing more natural features into water treatment technologies. Therefore, in this study, there were no chemical modifications done on the materials in order to keep the NBSUs a clean technology.

5. Conclusions

This study explores the valorization of agro-waste materials as cyanotoxin sorbents in NBSUs, also testing other sorbents commonly used in NBSUs, like LECA. It also brings mechanistic insights on the sorptive properties of these materials for removing cyanotoxins from water. The most widely studied cyanotoxin for sorption is microcystin. Even with widely studied sorbents like biochar, sorption of cylindrospermopsin has not been studied [10]. LECA has not previously been separately studied for its sorptive properties of cyanotoxins. Therefore, this work fills the gaps in knowledge regarding research on new sorbents for cyanotoxin removal, also extending the research on different toxins other than MC. From the pre-screening, the highest sorption was seen in biochar (MC-LR > 86%, CYN > 99%,) and LECA (MC-LR = 78%, CYN = 80%). The sorption of both the cyanotoxins onto biochar was rapid (8 h), whereas onto LECA it was steadier (requiring 48 h for equilibrium). The pseudo-second-order kinetic model fit the sorption of both cyanotoxins onto biochar and LECA, suggesting that the sorption rate is limited by chemisorption. Freundlich and D–R models fit the suggested multilayer sorption, high heterogeneity, and porosity in the sorbents (which was also confirmed by SEM/EDS). These characteristics would make them ideal to be incorporated as sorbents in NBSUs, keeping the pollutants available for complete degradation by other biotic components of the systems. The cost-effectiveness of biochar and LECA would depend very much on how the materials are applied in practice and the technology it is implemented in, whether completely or partially being replaced as the media in NBSUs, or used separately as an extra column providing post-treatment purely focused on sorption. Such assessment goes beyond the scope of this work, which was a first exploratory step for the potential of the different materials. Therefore, at the moment, it is difficult to make economic evaluations. The applicability of these materials in NBSUs should be further considered for mesocosm- and pilot-scale systems. Especially, the sorption potential, the life-span, and durability of these materials in NBSUs deserves to be further studied.

Supplementary Materials

The following supporting information can be downloaded at: https://www.mdpi.com/article/10.3390/w17020285/s1, Table S1. Molecules addressed in the LC-MS/MS method and their MS operating parameters; Table S2. Average cyanotoxins removal in pre-screening of sorbents; Table S3. Statistical details of pre-screening of sorbents; Figure S1. Pseudo-first-order sorption kinetic models for (a) MC-LR and (b) CYN onto sorbents biochar and LECA; Figure S2. Pseudo-second-order sorption kinetic models for (a) MC-LR and (b) CYN onto sorbents biochar and LECA; Figure S3. Sorption isotherm plots of MC-LR onto biochar and LECA: (a) Langmuir and (b) Temkin; Figure S4. Sorption isotherm plots of CYN onto biochar and LECA: (a) Langmuir and (b) Temkin; Figure S5. SEM images and EDS graphs of RH; Figure S6. SEM images and EDS graphs of cork; Figure S7. SEM images and EDS graphs of OP; Figure S8. SEM images and EDS graphs of sand; Figure S9. EDS graphs of LECA; Figure S10. EDS graphs of biochar.

Author Contributions

Conceptualization, G.B., A.C., C.M.R.A. and P.N.C.; methodology, G.B., A.C., C.M.R.A. and P.N.C.; validation, G.B., A.C., C.M.R.A. and P.N.C.; formal analysis, G.B., J.A. and P.N.C.; investigation, G.B.; resources, A.C., C.M.R.A. and P.N.C.; data curation, G.B.; writing—original draft preparation, G.B.; writing—review and editing, A.C., C.M.R.A. and P.N.C.; visualization, G.B.; supervision, A.C., C.M.R.A. and P.N.C.; funding acquisition, A.C. All authors have read and agreed to the published version of the manuscript.

Funding

This research was funded by a fellowship from “La Caixa” Foundation (ID 100010434; fellowship code LCF/BQ/DI21/11860058) to Guna Bavithra. This work was also supported by the CIIMAR Strategic Funding UIDB/04423/2020 and UIDP/04423/2020 funded through FCT and European Regional Development Fund (ERDF), from the European Union’s Horizon 2020 research and innovation programme under the Marie Sklodowska-Curie grant agreement No. 823860, TOXICROP, an EU research project (MSCA-RISE nr. 823860). Alexandre Campos’s work contract was funded by FCT (CEECIND/03767/2018).

Data Availability Statement

Data will be made available on request.

Conflicts of Interest

The authors declare no conflicts of interest.

References

  1. Haque, F.; Banayan, S.; Yee, J.; Chiang, Y.W. Extraction and applications of cyanotoxins and other cyanobacterial secondary metabolites. Chemosphere 2017, 183, 164–175. [Google Scholar] [CrossRef]
  2. Mowe, M.A.; Mitrovic, S.M.; Lim, R.P.; Furey, A.; Yeo, D.C. Tropical cyanobacterial blooms: A review of prevalence, problem taxa, toxins and influencing environmental factors. J. Limnol. 2015, 74, 205–224. [Google Scholar] [CrossRef]
  3. Abdallah, M.F.; Van Hassel, W.H.R.; Andjelkovic, M.; Wilmotte, A.; Rajkovic, A. Cyanotoxins and Food Contamination in Developing Countries: Review of Their Types, Toxicity, Analysis, Occurrence and Mitigation Strategies. Toxins 2021, 13, 786. [Google Scholar] [CrossRef]
  4. Cyanobacterial Toxins: Microcystins. Background Document for Development of WHO Guidelines for Drinking-Water Quality and Guidelines for Safe Recreational Water Environments; WHO/HEP/ECH/WSH/2020.6; World Health Organization: Geneva, The Netherland, 2020.
  5. Brient, L.; Lengronne, M.; Bormans, M.; Fastner, J. First occurrence of cylindrospermopsin in freshwater in France. Environ. Toxicol. 2009, 24, 415–420. [Google Scholar] [CrossRef] [PubMed]
  6. Dunlop, T.; Khojasteh, D.; Cohen-Shacham, E.; Glamore, W.; Haghani, M.; Bosch, M.v.D.; Rizzi, D.; Greve, P.; Felder, S. The evolution and future of research on Nature-based Solutions to address societal challenges. Commun. Earth Environ. 2024, 5, 132. [Google Scholar] [CrossRef]
  7. Nature-Based Solutions for Wastewater Treatment; IWA Publishing: London, UK, 2021. [CrossRef]
  8. Wang, J.; Long, Y.; Yu, G.; Wang, G.; Zhou, Z.; Li, P.; Zhang, Y.; Yang, K.; Wang, S. A Review on Microorganisms in Constructed Wetlands for Typical Pollutant Removal: Species, Function, and Diversity. Front. Microbiol. 2022, 13, 845725. [Google Scholar] [CrossRef]
  9. De Gisi, S.; Lofrano, G.; Grassi, M.; Notarnicola, M. Characteristics and adsorption capacities of low-cost sorbents for wastewater treatment: A review. Sustain. Mater. Technol. 2016, 9, 10–40. [Google Scholar] [CrossRef]
  10. Abbas, T.; Kajjumba, G.W.; Ejjada, M.; Masrura, S.U.; Marti, E.J.; Khan, E.; Jones-Lepp, T.L. Recent advancements in the removal of cyanotoxins from water using conventional and modified adsorbents—A contemporary review. Water 2020, 12, 2756. [Google Scholar] [CrossRef]
  11. Couto, R.S.P.; Guarino, A.; Branco, W.S.; Palermo, C.W.C.; Azero, E.F.A. Application of Clay Minerals and Polymeric Resins to Remove Dissolved Microcystin-LR from Water. Int. J. Environ. Res. 2013, 7, 435–442. [Google Scholar]
  12. Wu, X.; Xiao, B.; Li, R.; Wang, C.; Huang, J.; Wang, Z. Mechanisms and Factors Affecting Sorption of Microcystins onto Natural Sediments. Environ. Sci. Technol. 2011, 45, 2641–2647. [Google Scholar] [CrossRef]
  13. Gęca, M.; Wiśniewska, M.; Nowicki, P. Biochars and activated carbons as adsorbents of inorganic and organic compounds from multicomponent systems—A review. Adv. Colloid Interface Sci. 2022, 305, 102687. [Google Scholar] [CrossRef] [PubMed]
  14. Jagadeesh, N.; Sundaram, B. Adsorption of Pollutants from Wastewater by Biochar: A Review. J. Hazard. Mater. Adv. 2023, 9, 100226. [Google Scholar] [CrossRef]
  15. Yaashikaa, P.; Kumar, P.S.; Varjani, S.; Saravanan, A. A critical review on the biochar production techniques, characterization, stability and applications for circular bioeconomy. Biotechnol. Rep. 2020, 28, e00570. [Google Scholar] [CrossRef]
  16. Wei, L.; Lu, J. Adsorption of microcystin-LR by rice straw biochars with different pyrolysis temperatures. Environ. Technol. Innov. 2021, 23, 101609. (In English) [Google Scholar] [CrossRef]
  17. Zeng, S.; Kan, E. Adsorption and regeneration on iron-activated biochar for removal of microcystin-LR. Chemosphere 2021, 273, 129649. (In English) [Google Scholar] [CrossRef]
  18. Song, H.J.; Gurav, R.; Bhatia, S.K.; Bin Lee, E.; Kim, H.J.; Yang, Y.-H.; Kan, E.; Lee, S.H.; Choi, Y.-K. Treatment of microcystin-LR cyanotoxin contaminated water using Kentucky bluegrass-derived biochar. J. Water Process. Eng. 2021, 41, 102054. (In English) [Google Scholar] [CrossRef]
  19. Liu, G.; Zheng, H.; Zhai, X.; Wang, Z. Characteristics and mechanisms of microcystin-LR adsorption by giant reed-derived biochars: Role of minerals, pores, and functional groups. J. Clean. Prod. 2018, 176, 463–473. [Google Scholar] [CrossRef]
  20. Li, J.; Cao, L.; Yuan, Y.; Wang, R.; Wen, Y.; Man, J. Comparative study for microcystin-LR sorption onto biochars produced from various plant- and animal-wastes at different pyrolysis temperatures: Influencing mechanisms of biochar properties. Bioresour. Technol. 2018, 247, 794–803. [Google Scholar] [CrossRef] [PubMed]
  21. Li, L.; Qiu, Y.; Huang, J.; Li, F.; Sheng, G.D. Mechanisms and Factors Influencing Adsorption of Microcystin-LR on Biochars. Water Air Soil Pollut. 2014, 225, 2220. [Google Scholar] [CrossRef]
  22. Hagemann, N.; Schmidt, H.-P.; Kägi, R.; Böhler, M.; Sigmund, G.; Maccagnan, A.; McArdell, C.S.; Bucheli, T.D. Wood-based activated biochar to eliminate organic micropollutants from biologically treated wastewater. Sci. Total Environ. 2020, 730, 138417. [Google Scholar] [CrossRef] [PubMed]
  23. Klitzke, S.; Beusch, C.; Fastner, J. Sorption of the cyanobacterial toxins cylindrospermopsin and anatoxin-a to sediments. Water Res. 2011, 45, 1338–1346. [Google Scholar] [CrossRef] [PubMed]
  24. Kataki, S.; Chatterjee, S.; Vairale, M.G.; Dwivedi, S.K.; Gupta, D.K. Constructed wetland, an eco-technology for wastewater treatment: A review on types of wastewater treated and components of the technology (macrophyte, biolfilm and substrate). J. Environ. Manag. 2021, 283, 111986. [Google Scholar] [CrossRef] [PubMed]
  25. Mlih, R.; Bydalek, F.; Klumpp, E.; Yaghi, N.; Bol, R.; Wenk, J. Light-expanded clay aggregate (LECA) as a substrate in constructed wetlands—A review. Ecol. Eng. 2020, 148, 105783. [Google Scholar] [CrossRef]
  26. Deng, S.; Chen, J.; Chang, J. Application of biochar as an innovative substrate in constructed wetlands/biofilters for wastewater treatment: Performance and ecological benefits. J. Clean. Prod. 2021, 293, 126156. [Google Scholar] [CrossRef]
  27. Valencia-Cárdenas, D.; Tavares, T.S.; Silveira, R.; Brandão, C.C.S.; Soares, R.M.; Ginoris, Y.P. Evaluation of the Removal and Effects of Cylindrospermopsin on Ripened Slow Sand Filters. Toxins 2023, 15, 543. [Google Scholar] [CrossRef]
  28. Pavagadhi, S.; Tang, A.L.L.; Sathishkumar, M.; Loh, K.P.; Balasubramanian, R. Removal of microcystin-LR and microcystin-RR by graphene oxide: Adsorption and kinetic experiments. Water Res. 2013, 47, 4621–4629. [Google Scholar] [CrossRef] [PubMed]
  29. Gao, Y.Q.; Gao, N.Y.; Deng, Y.; Gu, J.S.; Shen, Y.C.; Wang, S.X. Adsorption of Microcystin-LR from Water with Iron Oxide Nanoparticles. Water Environ. Res. 2012, 84, 562–568. [Google Scholar] [CrossRef] [PubMed]
  30. Lee, J.; Walker, H.W. Adsorption of microcystin-Lr onto iron oxide nanoparticles. Colloids Surf. A Physicochem. Eng. Asp. 2011, 373, 94–100. [Google Scholar] [CrossRef]
  31. Park, J.-A.; Kang, J.-K.; Jung, S.-M.; Choi, J.-W.; Lee, S.-H.; Yargeau, V.; Kim, S.-B. Investigating Microcystin-LR adsorption mechanisms on mesoporous carbon, mesoporous silica, and their amino-functionalized form: Surface chemistry, pore structures, and molecular characteristics. Chemosphere 2020, 247, 125811. [Google Scholar] [CrossRef]
  32. Smith, S.C.; Rodrigues, D.F. Carbon-based nanomaterials for removal of chemical and biological contaminants from water: A review of mechanisms and applications. Carbon 2015, 91, 122–143. [Google Scholar] [CrossRef]
  33. Palagama, D.S.W.; Devasurendra, A.M.; Baliu-Rodriguez, D.; Kirchhoff, J.R.; Isailovic, D. Treated rice husk as a recyclable sorbent for the removal of microcystins from water. Sci. Total Environ. 2019, 666, 1292–1300. [Google Scholar] [CrossRef] [PubMed]
  34. Prodana, M.; Bastos, A.C.; Amaro, A.; Cardoso, D.; Morgado, R.; Machado, A.L.; Verheijen, F.; Keizer, J.; Loureiro, S. Biomonitoring tools for biochar and biochar-compost amended soil under viticulture: Looking at exposure and effects. Appl. Soil Ecol. 2019, 137, 120–128. [Google Scholar] [CrossRef]
  35. Ramos, V.; Morais, J.; Castelo-Branco, R.; Pinheiro, Â.; Martins, J.; Regueiras, A.; Pereira, A.L.; Lopes, V.R.; Frazão, B.; Gomes, D.; et al. Cyanobacterial diversity held in microbial biological resource centers as a biotechnological asset: The case study of the newly established LEGE culture collection. J. Appl. Phycol. 2018, 30, 1437–1451. [Google Scholar] [CrossRef] [PubMed]
  36. Kotai, J. Instructions for Preparation of Modified Nutrient Solution Z8 for Algae; Norwegian Institute for Water Research: Oslo, Norway, 1972; Volume 11, p. 5. [Google Scholar]
  37. Welker, M.; Fastner, J.; Erhard, M.; von Döhren, H. Applications of MALDI-TOF MS analysis in cyanotoxin research. Environ. Toxicol. 2002, 17, 367–374. [Google Scholar] [CrossRef]
  38. Ramanan, S.; Tang, J.; Velayudhan, A. Isolation and preparative purification of microcystin variants. J. Chromatogr. A 2000, 883, 103–112. [Google Scholar] [CrossRef] [PubMed]
  39. Bavithra, G.; Azevedo, J.; Oliveira, F.; Morais, J.; Pinto, E.; Ferreira, I.M.; Vasconcelos, V.; Campos, A.; Almeida, C.M.R. Assessment of Constructed Wetlands’ Potential for the Removal of Cyanobacteria and Microcystins (MC-LR). Water 2019, 12, 10. [Google Scholar] [CrossRef]
  40. Machado, J.; Campos, A.; Vasconcelos, V.; Freitas, M. Effects of microcystin-LR and cylindrospermopsin on plant-soil systems: A review of their relevance for agricultural plant quality and public health. Environ. Res. 2017, 153, 191–204. [Google Scholar] [CrossRef]
  41. Yang, Q.; Zhao, H.; Peng, Q.; Chen, G.; Liu, J.; Cao, X.; Xiong, S.; Li, G.; Liu, Q. Elimination of Pharmaceutical Compounds from Aqueous Solution through Novel Functionalized Pitch-Based Porous Adsorbents: Kinetic, Isotherm, Thermodynamic Studies and Mechanism Analysis. Molecules 2024, 29, 463. [Google Scholar] [CrossRef]
  42. Rwiza, M.J.; Oh, S.-Y.; Kim, K.-W.; Kim, S.D. Comparative sorption isotherms and removal studies for Pb(II) by physical and thermochemical modification of low-cost agro-wastes from Tanzania. Chemosphere 2018, 195, 135–145. [Google Scholar] [CrossRef] [PubMed]
  43. Gupta, V.K.; Mittal, A.; Jain, R.; Mathur, M.; Sikarwar, S. Adsorption of Safranin-T from wastewater using waste materials— activated carbon and activated rice husks. J. Colloid Interface Sci. 2006, 303, 80–86. [Google Scholar] [CrossRef]
  44. Langmuir, I. The adsorption of gases on plane surfaces of glass, mica and platinum. J. Am. Chem. Soc. 1918, 40, 1361–1403. [Google Scholar] [CrossRef]
  45. Ayawei, N.; Ebelegi, A.N.; Wankasi, D. Modelling and Interpretation of Adsorption Isotherms. J. Chem. 2017, 2017, 3039817. [Google Scholar] [CrossRef]
  46. Sheha, R.; El-Shazly, E. Kinetics and equilibrium modeling of Se(IV) removal from aqueous solutions using metal oxides. Chem. Eng. J. 2010, 160, 63–71. [Google Scholar] [CrossRef]
  47. Foo, K.; Hameed, B. Insights into the modeling of adsorption isotherm systems. Chem. Eng. J. 2010, 156, 2–10. [Google Scholar] [CrossRef]
  48. Lawton, L.A.; Edwards, C.; Codd, A. Extraction and high-performance liquid chromatographic method for the determination of micro-cystins in raw and treated waters. Analyst 1994, 119, 1525–1530. [Google Scholar] [CrossRef]
  49. Guzmán-Guillén, R.; Prieto, A.I.; González, A.G.; Soria-Díaz, M.E.; Cameán, A.M. Cylindrospermopsin determination in water by LC-MS/MS: Optimization and validation of the method and application to real samples. Environ. Toxicol. Chem. 2012, 31, 2233–2238. [Google Scholar] [CrossRef] [PubMed]
  50. Pekar, H.; Westerberg, E.; Bruno, O.; Lääne, A.; Persson, K.M.; Sundström, L.F.; Thim, A.M. Fast, rugged and sensitive ultra high-pressure liquid chromatography tandem mass spectrometry method for analysis of cyanotoxins in raw water and drinking water—First findings of anatoxins, cylindrospermopsins and microcystin variants in Swedish source waters and infiltration ponds. J. Chromatogr. A 2016, 1429, 265–276. [Google Scholar] [PubMed]
  51. Zervou, S.-K.; Christophoridis, C.; Kaloudis, T.; Triantis, T.M.; Hiskia, A. New SPE-LC-MS/MS method for simultaneous determination of multi-class cyanobacterial and algal toxins. J. Hazard. Mater. 2017, 323, 56–66. [Google Scholar] [CrossRef] [PubMed]
  52. El Bouaidi, W.; Enaime, G.; Loudiki, M.; Yaacoubi, A.; Douma, M.; Ounas, A.; Lübken, M. Adsorbents Used for Microcystin Removal from Water Sources: Current Knowledge and Future Prospects. Processes 2022, 10, 1235. [Google Scholar] [CrossRef]
  53. Antonieti, C.C.; Ginoris, Y.P. Removal of Cylindrospermopsin by Adsorption on Granular Activated Carbon, Selection of Carbons and Estimated Fixed-Bed Breakthrough. Water 2022, 14, 1630. [Google Scholar] [CrossRef]
  54. Xie, R.; Jin, Y.; Chen, Y.; Jiang, W. The importance of surface functional groups in the adsorption of copper onto walnut shell derived activated carbon. Water Sci. Technol. 2017, 76, 3022–3034. [Google Scholar] [CrossRef] [PubMed]
  55. Thenuwara, S.I.; Kiridena, H.S.; Kirchhoff, J.R.; Isailović, D. Evaluation of the mechanisms of adsorption of microcystins and nodularin-R onto rice husk-based biochar. Environ. Adv. 2022, 9, 100314. [Google Scholar] [CrossRef]
  56. Kumar, P.; Pérez, J.A.E.; Cledon, M.; Brar, S.K.; Duy, S.V.; Sauvé, S.; Knystautas, É. Removal of microcystin-LR and other water pollutants using sand coated with bio-optimized carbon submicron particles: Graphene oxide and reduced graphene oxide. Chem. Eng. J. 2020, 397, 125398. [Google Scholar] [CrossRef]
  57. Al-Harby, N.F.; Albahly, E.F.; Mohamed, N.A. Kinetics, Isotherm and Thermodynamic Studies for Efficient Adsorption of Congo Red Dye from Aqueous Solution onto Novel Cyanoguanidine-Modified Chitosan Adsorbent. Polymers 2021, 13, 4446. [Google Scholar] [CrossRef]
  58. Esfandiar, N.; Suri, R.; McKenzie, E.R. Competitive sorption of Cd, Cr, Cu, Ni, Pb and Zn from stormwater runoff by five low-cost sorbents; Effects of co-contaminants, humic acid, salinity and pH. J. Hazard. Mater. 2022, 423, 126938. [Google Scholar] [CrossRef] [PubMed]
  59. Campinas, M.; Viegas, R.M.; Rosa, M.J. Modelling and understanding the competitive adsorption of microcystins and tannic acid. Water Res. 2013, 47, 5690–5699. [Google Scholar] [CrossRef] [PubMed]
  60. Orta-Ortiz, M.S.; Geneletti, D. What variables matter when designing nature-based solutions for stormwater management? A review of impacts on ecosystem services. Environ. Impact Assess. Rev. 2022, 95, 106802. [Google Scholar] [CrossRef]
  61. Varma, M.; Gupta, A.K.; Ghosal, P.S.; Majumder, A. A review on performance of constructed wetlands in tropical and cold climate: Insights of mechanism, role of influencing factors, and system modification in low temperature. Sci. Total Environ. 2021, 755, 142540. [Google Scholar] [CrossRef]
  62. Frazer-Williams, R.A. A Review of the Influence of Design Parameters on the Performance of Constructed Wetlands. J. Chem. Eng. 1970, 25, 29–42. [Google Scholar] [CrossRef]
  63. Chu, K.H. Revisiting the Temkin Isotherm: Dimensional Inconsistency and Approximate Forms. Ind. Eng. Chem. Res. 2021, 60, 13140–13147. [Google Scholar] [CrossRef]
  64. Vigdorowitsch, M.; Pchelintsev, A.; Tsygankova, L.; Tanygina, E. Freundlich Isotherm: An Adsorption Model Complete Framework. Appl. Sci. 2021, 11, 8078. [Google Scholar] [CrossRef]
  65. Wang, F.; Wu, P.; Shu, L.; Guo, Q.; Huang, D.; Liu, H. Isotherm, kinetics, and adsorption mechanism studies of diethylenetriaminepentaacetic acid—Modified banana/pomegranate peels as efficient adsorbents for removing Cd(II) and Ni(II) from aqueous solution. Environ. Sci. Pollut. Res. 2022, 29, 3051–3061. [Google Scholar] [CrossRef] [PubMed]
  66. Liu, Y.-L.; Walker, H.W.; Lenhart, J.J. Adsorption of microcystin-LR onto kaolinite, illite and montmorillonite. Chemosphere 2019, 220, 696–705. [Google Scholar] [CrossRef] [PubMed]
Figure 1. (a) MC-LR sorption rates by different sorbents at 24 h and 48 h during the pre-screening (mean and standard deviation, n = 3), (b) CYN sorption rates by different sorbents at 24 h and 48 h during the pre-screening (OP*—matrix not suitable for CYN detection).
Water 17 00285 g001
Figure 2. Sorption kinetics of MC-LR (a) and CYN (b) on biochar and LECA (mean and standard deviation, n = 3).
Water 17 00285 g002
Figure 3. Sorption isotherm plots of MC-LR onto LECA and biochar: (a) Freundlich and (b) D–R.
Water 17 00285 g003
Figure 4. Sorption isotherm plots of CYN onto LECA and biochar: (a) Freundlich and (b) D–R.
Water 17 00285 g004
Figure 5. (a) SEM image of biochar and (b) elemental composition of Z1 and Z2 of biochar.
Water 17 00285 g005
Figure 6. (a) SEM images of outer part of LECA, (b) SEM image of inner part of LECA, and (c) elemental composition of Z1, Z2, Z3, and Z4 of LECA.
Water 17 00285 g006
Table 1. Equations used to analyze the experimental data [41,42,43,44] (N/A stands for not applicable).
EquationIsotherm ModelNon-Linearized FormLinearized Form
(1)N/AN/A %   S o r p t i o n = C 0 C e C 0 × 100
(2)N/AN/Aqe = (C0Ce) V/m
(3)N/AN/Aln (qeqt) = ln qeK1t
(4)N/AN/At/qt = t/qe + 1/qe2K2
(5)Langmuir q e = q m a x b c e 1 + b c e c e q e = 1 q m a x b + c e q m a x
(6)Freundlich q e = K f C e 1 / n ln q e = ln K f + 1 n ln C e
(7)D–R q e = Q m a x K D R ε 2 log = ln Q m a x K D R ε 2
(8)Temkin q e = R T B T ln A T C e q e = B T ln A T + B T ln C e
(9)N/A ε = R T ln 1 + 1 C e N/A
Table 2. Kinetic parameters of MC-LR and CYN onto biochar and LECA.
Sorbent Pseudo-First-Order Kinetic ModelPseudo-Second-Order Kinetic Model
qe (mg/g)qe (cal) (mg/g)k1 (h−1)R2qe (cal) (mg/g)k2 (g mg−1 h−1)R2
BiocharMC-LR0.00070.00010.00100.330.000667360.99
CYN0.00340.00070.00180.950.00354970.99
LECAMC-LR0.00040.00040.00130.950.00052100.98
CYN0.00120.00120.00220.920.00121340.94
Table 3. Isotherm modelling results for MC-LR and CYN sorption by biochar and LECA.
Isotherm ModelSorbentCyanotoxinR2qmax (mg/g)bRL
LangmuirBiocharMC-LR0.060.1640.2760.162
CYN2 × 10−40.8020.1410.359
LECAMC-LR0.090.0240.1930.238
CYN1 × 10−50.4690.0090.897
R2Kf (L/g)n1/n
FreundlichBiocharMC-LR0.830.0501.0560.95
CYN0.530.1551.0760.93
LECAMC-LR0.770.0170.7931.26
CYN0.670.0090.8401.19
R2Qmax (mg/g)KDR
Dubinin–Radushkevich (D–R)BiocharMC-LR0.870.0925 × 10−8
CYN0.510.0513 × 10−8
LECAMC-LR0.620.0457 × 10−8
CYN0.580.0066 × 10−8
R2AT (L/g)BT
TemkinBiocharMC-LR0.01116.54.758
CYN0.23129.64.865
LECAMC-LR0.01298.95.700
CYN0.349.8972.292
Disclaimer/Publisher’s Note: The statements, opinions and data contained in all publications are solely those of the individual author(s) and contributor(s) and not of MDPI and/or the editor(s). MDPI and/or the editor(s) disclaim responsibility for any injury to people or property resulting from any ideas, methods, instructions or products referred to in the content.