Article

Integrating Field Data and Modeling for Sustainable Wastewater Irrigation Management: Case Studies from Jordan and Palestine

The Mediterranean Agronomic Institute of Bari (CIHEAM Bari), Via Ceglie 9, 70010 Valenzano, Italy
*
Author to whom correspondence should be addressed.
Water 2025, 17(2), 228; https://doi.org/10.3390/w17020228
Submission received: 26 November 2024 / Revised: 5 January 2025 / Accepted: 7 January 2025 / Published: 16 January 2025
(This article belongs to the Special Issue Water Quality, Wastewater Treatment and Water Recycling)

Abstract

:
Water shortages, overexploitation, and sectoral conflicts have prompted the use of treated wastewater (TWW) in agriculture. While TWW provides essential nutrients, improper management can harm the soil and crops. To address this, case studies from Jordan and Palestine—where alfalfa and citrus crops are exclusively irrigated with TWW—were conducted to identify suitable irrigation schedules and assess adverse impacts on crops and soils. The Safe Irrigation Management (SIM) model was used to simulate irrigation in 2021, considering TWW quality, quantity, and initial soil conditions. Two scenarios were examined: FARMOD, based on farmers’ planning, and ON-DEMAND, suggested by SIM. The results showed significant differences in irrigation frequencies and volumes between the two scenarios. The ON-DEMAND scenario demonstrated improved nitrogen and phosphorus uptake, lower soil electrical conductivity (ECe 1.5 dS·m−1), and reduced Escherichia coli (E. coli) levels (4 log10 CFU·g−1). A hypothetical scenario assuming initial soil conditions prior to TWW use yielded even lower ECe (0.8 dS·m−1) and E. coli (3.3 log10 CFU·g−1). Sensitivity analysis identified ECe and nitrogen as crucial water quality indicators requiring continuous monitoring. Integrating field data and modeling practices is vital to maintaining soil quality, supporting long-term TWW reuse especially where it is a widely adopted irrigation solution.

1. Introduction

Over 40% of the global population faces water scarcity, with 700 million lacking access to clean drinking water. Water scarcity in agriculture is projected to impact over 80% of the world’s arable land by 2050, threatening the livelihoods of approximately 10 billion people [1,2]. This issue involves the overexploitation of freshwater resources, exacerbating unsustainable water use. Additionally, half of human-generated wastewater is untreated, polluting rivers and oceans, leading to severe environmental and health issues. This crisis contributes to desertification, migration, hunger, diseases, and conflicts [3]. Water reuse strategies, including treated wastewater (TWW), are crucial for replenishing agricultural water supplies and ensuring high-quality water [4]. This approach aligns with Sustainable Development Goal (SDG) 6.3, which aims to increase recycling and the safe reuse of wastewater, recover nutrients and organic matter, reduce water pollution, and enhance resource use efficiency.
The Middle East and North Africa (MENA) region faces significant challenges due to its scarce freshwater resources. Jordan and Palestine, sharing close geographic proximity and deep cultural connections, also struggle with severe water scarcity. Sustainable irrigation management with TWW can effectively address water shortages and enhance agricultural resilience, providing scalable solutions for similar challenges across the region. Jordan, the second-most-water-scarce country globally and one of the most arid in the Middle East [5], utilizes approximately 85% of its TWW for productive purposes, mainly in agriculture [6]. For instance, 45 Mm3·yr−1 of TWW is used in restricted irrigation to produce fodder crops and fruit trees, though these projects often face low cost recovery and questionable long-term financial sustainability [7]. Similarly, Palestine experiences severe water scarcity, with TWW representing a significant potential source for agriculture. The West Bank could produce over 50,000 m3·d−1 of TWW, sufficient to irrigate over 2000 hectares (20 km2), but currently, TWW reuse is limited to around 300 hectares [8]. The reuse of TWW in agriculture offers significant environmental and economic benefits, such as conserving freshwater resources and providing a steady supply of nutrients like nitrogen and phosphorus, reducing the need for synthetic fertilizers [9]. However, TWW reuse carries risks related to the potential accumulation of heavy metals, salts, and emerging contaminants, which can degrade soil health and enter the food chain [10]. Pathogens in TWW pose another significant health risk for farmworkers and consumers if proper disinfection protocols are not followed [11]. Advanced treatment processes, such as membrane filtration and UV disinfection, are recommended to meet stringent water quality standards [12]. Thus, while TWW reuse presents a sustainable solution for agricultural irrigation, a balanced approach that addresses its potential environmental and health impacts is crucial.
Inappropriate irrigation management tailored to TWW can lead to imbalances in water quality and quantity. TWW, being a double source of water and nutrients, may have a detrimental effect on the soil’s physical and chemical qualities, resulting in soil salinization, reduced production, and reduced root uptake. Additionally, the presence of hazardous metals and pathogens may pose environmental risks to the agroecosystem [8,13].
Salinity impacts nutrient absorption (e.g., nitrate, phosphorus) by roots and affects soil infiltration and aeration. Soil pH, influenced by structure, irrigation, and depth, alters nutrient availability and organic matter mineralization. Organic matter content and soil aggregates influence water retention, infiltration, drainage, and soil fertility. TWW fertilization boosts soil microbial activity and organic matter (OM) mineralization, increasing potassium (K) levels with surface drip systems [14].
Strategic irrigation, such as frequent watering and pre-planting irrigation, reduces the salinity risk and water stress. These methods can be adapted for TWW irrigation. Modeling TWW consumption is recommended but still depends on traditional irrigation plans designed for conventional water and is often based on the sole estimation of the evapotranspiration demand. However, misleading threshold values from conventional irrigation can lead to inadequate TWW practices [15].
Overall, traditional irrigation plans can be based on the soil water depletion ratio, where irrigation is scheduled when the soil water deficit in the effective root zone exceeds a certain threshold of total available water (TAW) [16]. However, this approach does not consider water quality, which is closely linked to water quantity estimation. Therefore, it is essential to use models that support the implementation of schedules incorporating water quality parameters to better balance water demand and supply, enhance plant growth, control water fluxes, and manage salt transport in the vadose zone and beyond the root zone.
Models that predict the effects of TWW irrigation management on soil are crucial, but they must be combined with field data to validate irrigation practices. For instance, some models estimate crop yield response to irrigation water by treating soil as a reservoir, where once fully saturated, the saturated hydraulic conductivity is reached, triggering the drainage process [17]. These models allow for the inclusion of TWW quality parameters. To propose effective TWW irrigation management, it is essential to consider critical parameters such as the quality of the applied TWW, soil water, salinity levels, and the presence of pathogens. These factors help to preserve soil physical characteristics, reduce soil salination, and maintain good yield production [18].
Combining field data with modeling enhances decision-making by introducing and testing alternative scenarios for proper TWW irrigation scheduling [16]. Modeling tools aid in selecting optimal irrigation strategies for TWW reuse, understanding complex reactions beforehand, and adjusting farm management practices to minimize negative effects. Scenarios focused on reducing salt accumulation in the root zone and reducing the leaching of rapidly leachable nutrients or pollutants are particularly effective.
This study aims to develop irrigation plans for TWW reuse in two case studies from Jordan and Palestine that have been proactive in transferring irrigation management responsibilities to water users’ associations [19]. It focuses on optimizing nutrient uptake while minimizing long-term adverse impacts on crops and soils. Specifically, the research seeks to: (i) harmonize field-collected data and calibrate the Safe Irrigation Management (SIM) model in Beit-Dajan (Palestine) and Al Ramtha (Jordan) for alfalfa, a perennial crop, and citrus, a permanent crop, respectively; (ii) simulate multiple irrigation strategies and scenarios with TWW using the SIM model, accounting for water quantity and quality inputs; and (iii) identify the best/no harm irrigation management practices tailored to TWW. Based on these objectives, two scenarios were identified to run the SIM model: (1) FARMOD, which refers to model calibration based on farmer planning, and (2) ON DEMAND, which refers to the irrigation schedule suggested by SIM. A sensitivity analysis was also performed to assess the most sensitive parameters, requiring monitoring for long-term reuse. Additionally, a hypothetical scenario (HYP) was set up to evaluate whether the outputs generated by the SIM model using current inputs still reflect proper TWW irrigation management. This scenario assumes optimal water and soil conditions for crop growth under good TWW irrigation quality, aiming to predict better TWW management in the Jordan and Palestine contexts. Jordan and Palestine have been proactive in transferring irrigation management responsibilities to water users’ associations.

2. Materials and Methods

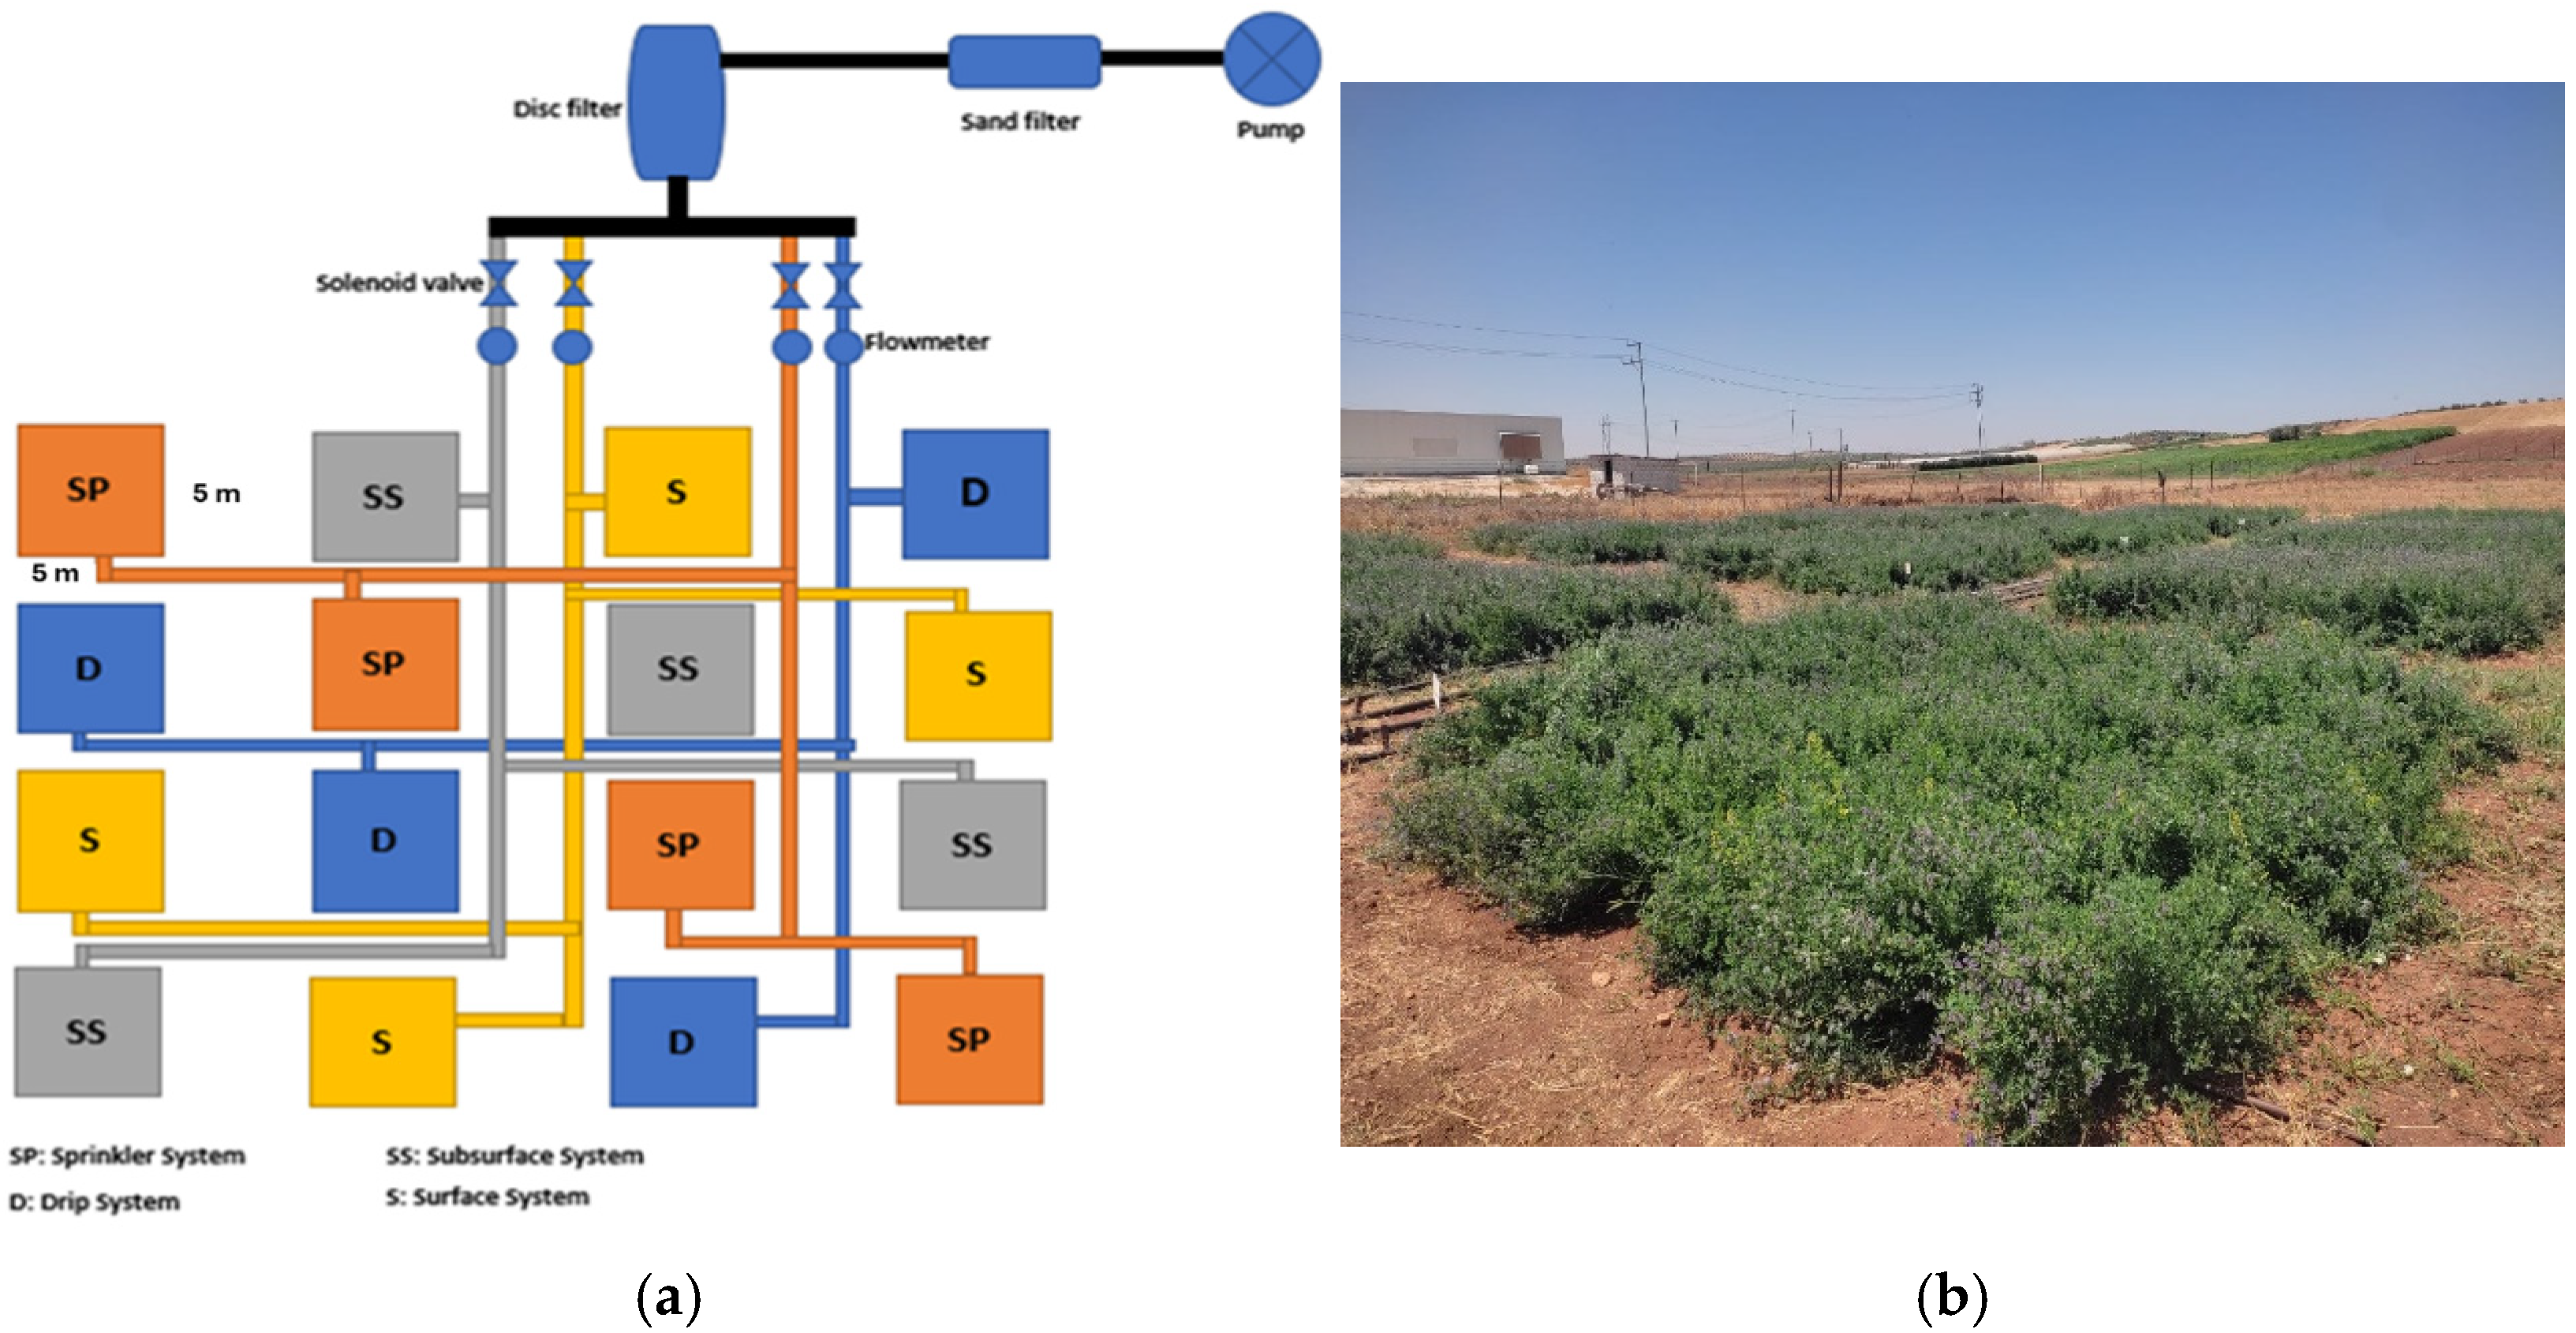
2.1. Study Area 1: Alfalfa in Jordan

The experiment was conducted from December 2020 to October 2021 at the National Agricultural Research Center (NARC)’s Al Ramtha Experimental Station for TWW Studies in Jordan, which receives an average annual rainfall of approximately 275 mm. Four alternative irrigation techniques were tested: sprinkler, surface drip, subsurface drip, and surface irrigation. The plots were completely randomized, with irrigation systems assigned to 5 × 5 m randomized experimental plots with 3 m spacing between the plots, for a total of 16 plots (Figure 1). Alfalfa seeds (Medicago sativa L.) were sown in April 2021 at a rate of 70 kg/ha, and harvested four times during the experiment on 18 May, 6 June, 28 June, and 3 August 2021.
Domestically, TWW effluent from the Al Ramtha Secondary Wastewater Treatment Plant (RWTP) was used for irrigation. The RWTP is connected to the experimental site via a main HDPE irrigation line, with water filtered through sand and disc filters before use. Four pop-up sprinklers with discharge rates of 0.1 m3·h−1 were installed, one at each corner of the plots. The subsurface drip irrigation system had dripper lines placed 25 cm deep, with 50 cm between adjacent lines and drippers spaced 30 cm apart. Non-leakage pressure-compensated drippers with discharge rates of 2 L·h−1 were used. The surface drip irrigation system was similar, except the dripper lines were positioned on the soil surface.
Irrigation events for each technique were scheduled to occur whenever the available soil water dropped to 30% or below. TWW irrigation was applied using the Penman–Monteith equation, with an anticipated annual irrigation volume of 680 mm. This volume was enhanced by 60%, 70%, 85%, and 90% for surface, sprinkler, drip, and subsurface irrigation systems, respectively, to account for system efficiency. Overall, a yearly irrigation volume of 1044 mm was provided, with sprinkler irrigation delivering 969.7 mm, drip irrigation 798.6 mm, and subsurface irrigation 754.1 mm. Each system was connected by a separate pipe directly from the treatment station.
The soil was classified as clay, with an average clay content of more than 50%, low salinity (1.0 dS·m−1), and a slightly alkaline pH of 8.4. The soil potassium content exceeded 700 mg·L−1. Phosphorus and nitrogen levels were 20 mg·L−1 and 0.09%, respectively, according to NARC results [20]. Nitrogen values ranged between 0.05% and 0.15%, while phosphorus was in the medium range (20–25 mg·L−1) [20]. The organic matter content was 1.25%.

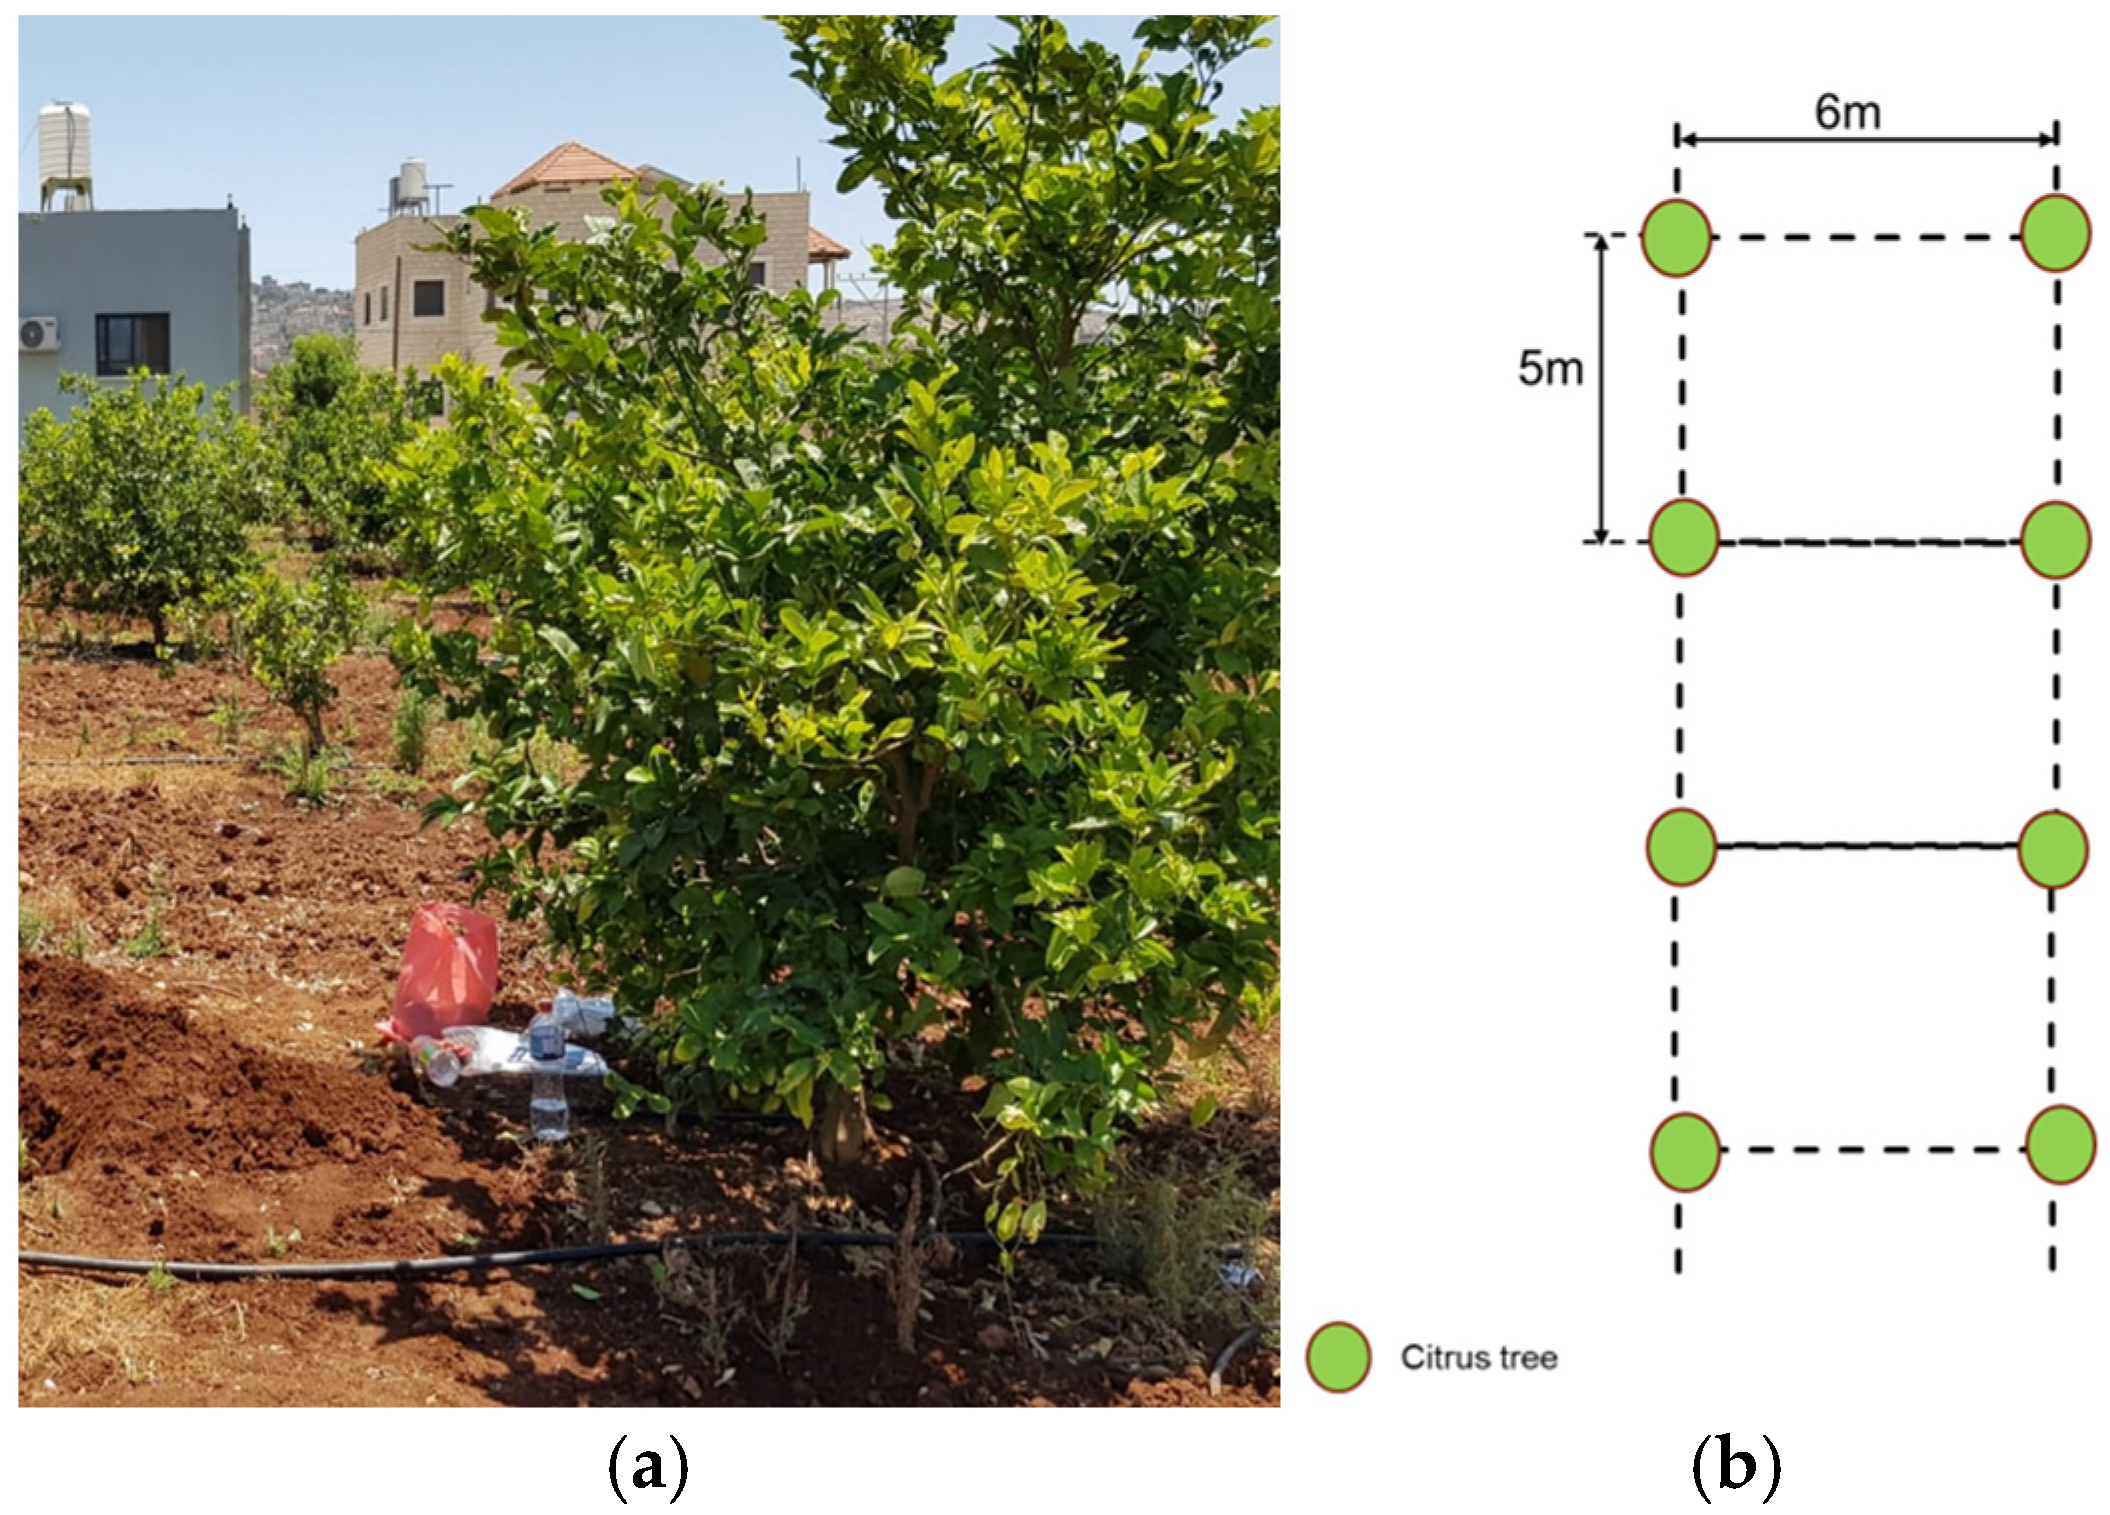
2.2. Study Area 2: Citrus Palestine

Beit Dajan is situated 10.74 km east of the Nablus, receiving an average annual rainfall of 343.3 mm. The experimental field, measuring 0.35 ha, is planted with 6 year old citrus trees, and irrigated using a drip irrigation system with tertiary TWW (Figure 2). The soil in Beit Dajan is classified as Terra Rossa (Xerochrepts, Rhodoxeralfs), according to USDA classification, characterized by a reddish-brown color and a fine clay loam texture with 35% clay, 36.5% silt, and 28.5% sand. The soil solution’s electrical conductivity (ECe) is 0.9 dS·m−1, with phosphorus at 12.3 ppm, and total nitrogen at 0.45%. TWW irrigation is scheduled at 750 mm/year. The citrus orchards are drip-irrigated with one drip line per tree row, emitters spaced 0.25 m apart, and a discharge of 2 L.h−1, with irrigation occurring every 3 days. The input data pertains to the citrus experiment carried out during the 2020–2021 season. TWW irrigation volumes for citrus crop supplied daily by the farmers (including frequency, interval, amount of TWW), were measured throughout the irrigation season. Four measurement campaigns were conducted to assess the effects of TWW irrigation on the soil and citrus. Soil samples were collected on 7 and 28 June, 18 July, and 28 August 2021, to determine volumetric water content, soil solution electrical conductivity, and nitrate and ammonium concentrations. Chemical analyses were performed on soil samples collected from below the tree and between two trees at the beginning of the irrigation season. Additionally, three effluent samples per month were collected from the Beit Dajan treatment plant outlet from 1 March to 30 August 2021. Physical and chemical analyses of the effluent were performed according to the standard methods of water and wastewater analysis [21]. The average chemical parameters from the three collected samples (1 March–August 2021) were as follows: NH4+ was 32 mg·L−1; NO3 was 0.768 mg·L−1; PO43− was 22.9 mg·L−1; and K was 270 mg·L−1. The average water electrical conductivity, ECw, was equal to 1.9 dS·m−1.

2.3. SIM Model Setup

The SIM model was used to retrieve TWW irrigation practices scheduled by the farmers and identify the optimal scenario to minimize soil salinity and yield reduction. This one-dimensional, daily water and salt balance model simulates soil water and salt behavior under specific crop, soil, and irrigation management conditions, considering water quality, quantity, and climatic conditions. The SIM model is a tool designed to forecast these processes and identify crucial elements related to the soil and TWW quality.
It is used to extrapolate the outcomes of various irrigation and fertigation management schemes, enabling the examination of alternative management strategy scenarios in terms of their effects on yield, soil qualities, and potential environmental problems. The SIM model considers water and soil quality factors, bacterial migration, and infection risk using a one-dimensional daily water and nutrient balance model and the single crop coefficient method (single Kc). It has four compartments dealing with crop water demand and irrigation scheduling, salinity management, bacterial movement and risk assessment, and nutrient management [22].
Two scenarios are accounted for: (1) FARMOD refers to the model results calibrated based on field variables measured at the end of the crop season, such as N and P uptake and yield. The simulation was able to replicate soil and crop responses during the irrigation season (15 November 2020 to 15 November 2021); (2) ON-DEMAND refers to the irrigation scheduling suggested by the model based on two assumptions of ECe not exceeding 2.5 dS·m−1 and improved yield production compared to the farmer’s practice.
For alfalfa, the two scenarios were reproduced using the SIM model to replicate soil and nutrient behavior under farmer irrigation management (FARMOD) and model scheduling (ON-DEMAND). Similarly, for citrus, the effects of TWW were compared under both farmer (FARMOD) and model (ON-DEMAND) scheduling in two case studies.

2.4. Sensitivity Analysis of Two FARMOD and ON-DEMAND Scenarios

Sensitivity analysis (SA) measures how uncertainties in input variables affect output variables, enhancing model prediction. This study uses SA to assess the robustness, or “sensitivity” of the findings to changes in parameters, identifying levels beyond which results change dramatically. SA prioritizes knowledge improvement by minimizing assessment parameter uncertainties, allowing for phenomenon-related judgments [23]. Sensitivity studies identify which input parameters most impact model outcomes, enabling the elimination of irrelevant factors and guiding future research to minimize parameter uncertainties and improve model accuracy [24].
Based on SIM model scenarios, SA was utilized to design optimal TWW irrigation management methods. SA findings also indicated the main characteristics affecting soil quality when using TWW irrigation. The variance-based global sensitivity analysis technique ‘Sobol’ was applied. This approach assesses the relative effect of a parameter and its interaction with other variables on model output variance using variance decomposition.
The first-order sensitivity index (FSI) and total sensitivity index (TSI) are calculated using this approach. The FSI represents each parameter’s sensitivity to the model output, whereas the TSI is the sum of a parameter’s FSI plus the sensitivity of the parameter’s interaction with other factors impacting the model output. If no parameters interact, the total of all parameters’ FSIs equals 1. The FSI and TSI parameters range from 0 to 1 [25].
The Sobol method was applied to the model outputs to identify the most sensitive elements requiring monitoring.
The FSI was calculated as follows [25]:
F S I   =   V i V
where Vi is the model output variance in response to variation of the input variable and V is the total variance of the model output.
The TSI was calculated as follows [25]:
T S I   =   j V i j + j < m V i j m + V i , j , k V
where j and m are the jth and the mth model input variable, Vi is the model output variance in response to the interaction between the input variables i and j, and V is the total variance of the model output.
After performing the sensitivity analysis and observing that ECe and nitrogen are the most sensitive parameters, the SIM model was rerun to generate results specifically for ECe and nitrogen. This was conducted under a hypothetical scenario (HYP) which refers to the optimal water and soil inputs.

2.5. Hypothetical Scenario for Alfalfa and Citrus

Monitoring the long-term effects of TWW is crucial not only for the quality of the water supplied but also for the quality of the soil, which plays an essential role in maintaining sustainable reuse and agriculture.
Previous simulations (FARMOD, ON-DEMAND) were set up using soil and water quality parameters derived from the TWW irrigation management practices. These practices were carried out over a long period without any prior assessment of the initial soil condition before reuse. Consequently, the FARMOD and ON-DEMAND simulations were based on soil and water quality parameters that were lower than the standards. Since the accuracy of the model depends on the quality of the input data, the likelihood of a better scenario can be tested.
A hypothetical scenario was created using improved water and soil quality parameters, assuming optimal initial soil quality (good tilth). This aspect is relevant because water quality can be controlled and improved by modernizing the treatment plants and conducting weekly water sample analyses. However, the main challenge remains the soil quality, where TWW dynamics are more complex under continuous irrigation, as water and nutrients are supplied simultaneously with each irrigation event.
To account for accurate soil quality data, well-managed case studies from the literature were considered, involving the same soil types and similar TWW quality parameters. Accordingly, two scenarios were performed: (1) Vertisol and TWW secondary treatment as input parameters for Alfalfa; and (2) Terra Rossa and TWW tertiary treatment for Citrus.

3. Results and Discussion

3.1. Case Study 1: Alfalfa in Jordan

3.1.1. Yield and Nutrient Efficiency for Alfalfa

The SIM model simulated water inflows and outflows based on a bucket model concept. The comparison between the FARMOD and the ON-DEMAND scenario showed comparable results in terms of yield and nutrient efficiency, as presented in (Table 1). N and P uptake observations were calculated as the product of yield and the percentage of leaf N and P measured, respectively. FARMER (observations only) and FARMOD produced very similar results, indicating that the SIM model provided an accurate simulation and served as a calibration test. Once the model was calibrated, the input soil and water quality variables were fixed, like the scenario used. Proper irrigation scheduling within the model requires setting the ECe value to 2.5 dS·m−1 to achieve optimal FARMER yield conditions. However, in the ON-DEMAND scenario, even with a similar farmer yield, it was evident that applying an appropriate irrigation schedule improved root N and P uptake. This strongly influenced qualitative and quantitative crop parameters, leading to yield improvement. For instance, the yield obtained under the drip FARMER scenario was 14,200 kg/ha compared to 16,410 kg/ha in the ON-DEMAND scenario.

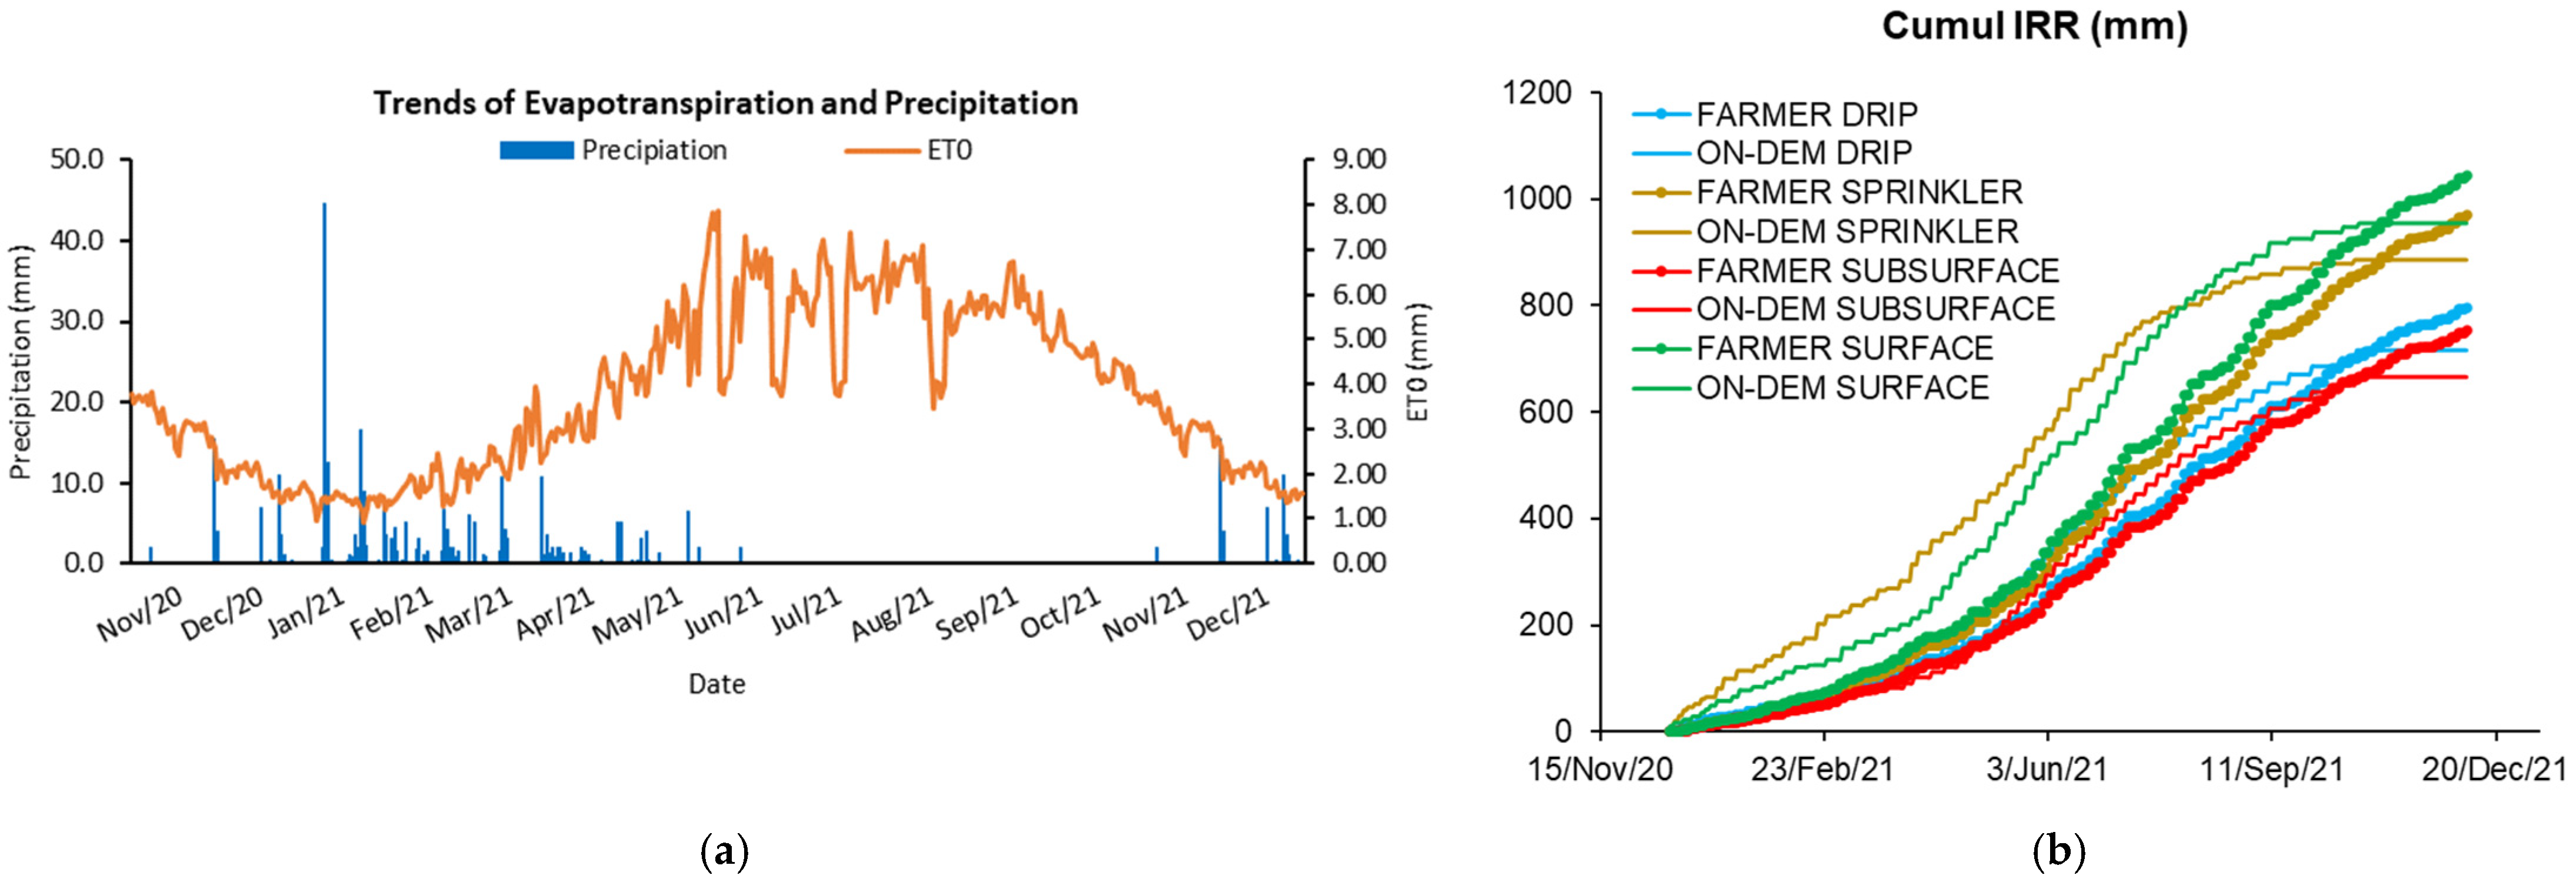
3.1.2. Irrigation Management for Alfalfa

The curve of rainfall and evapotranspiration shows that at the beginning of the season, rainfall is high while evapotranspiration is low. During the peak period, evapotranspiration reaches its highest point where rainfall is at its minimum. Throughout the alfalfa growing season, the trend of evapotranspiration decreases due to the four-cutting effect (Figure 3a).
The model output, in terms of cumulative irrigation demand for almost all growing seasons, was analyzed. The curve of the FARMOD scenario is higher than the ON-DEMAND trend across the four irrigation systems (Figure 3b). For example, the farmer applied 800 mm with the drip system compared to 715 mm with the ON-DEMAND scenario that suggests a better irrigation distribution, leading to water savings. In addition, the farmer’s irrigation behavior shows an increasing trend at the end of the season, justified by the fact that farmers irrigate twice per week. Conversely, the ON-DEMAND curve tends to stabilize at the end of the season, indicating low to zero irrigation events due to the simulation length set up. This stabilization occurs because of low crop evapotranspiration and rainfall events during the last two months (Figure 3b).
Regarding irrigation scheduling, the adopted FARMOD strategy for the ongoing proposed strategies for TWW reuse continues to rely on the traditional modeling of irrigation plans intended for conventional water sources. In this case study, TWW irrigation volumes are mainly based on the demand for evapotranspiration, meaning that the water delivered to the crops is calculated as the difference between seasonal evapotranspiration and precipitation deficit. Weekly irrigation volumes applied by the farmer and those simulated by the model are depicted in Figure 4, highlighting the significant role of irrigation trends on yield response.
Some differences are evident due to the weekly strategy used for water application. In the FARMER scenario, irrigation was performed biweekly at a fixed rate. In contrast, the ON-DEMAND scenario modulated the frequency and amount of water applied to maintain an ECe of 2.5 dS·m−1 or less, assuming this salinity control would not compromise alfalfa yield. The higher irrigation rates suggested by the SIM model, particularly for the drip system (Figure 4a) are due to the high irrigation frequency needed to keep the root zone wetter. This ensures no-harm TWW irrigation and maintains an adequate ECe threshold, preventing salt accumulation. Consequently, drained water moves salt below the root zone, reducing salt-induced crop stress.
The ON-DEMAND scenario also suggested additional water application during periods of high evapotranspiration demand, especially in the absence of rainfall, to control soil salinity levels and to reduce water stress. The differences between the four irrigation systems are noticeable, with irrigation volumes differentiated in the SIM model based on the actual water required to restore evapotranspiration and reduce potential salt accumulation. However, the SIM model cannot distinguish irrigation volumes per method applied. This differentiation was made outside the model, accounting for distribution uniformity, i.e., 65, 70, 85, and 90% for surface, sprinkler, surface drip, and subsurface drip irrigation systems, respectively. In this regard, another similar study assessed the impact of four irrigation systems—surface-drip, surface (flood), sprinkler, and subsurface-drip—on alfalfa under a treated wastewater irrigation regime, finding that subsurface-drip irrigation might be considered an efficient irrigation method [26].
However, good potential could arise from combining drip and sprinkler systems for forage cultivation, as the sprinkler method can induce microclimatic conditions within the alfalfa canopy, potentially improving its growth.
One study, although related to an experiment carried out under conventional water irrigation, showed that using a sprinkler irrigation system affected water distribution and led to increased alfalfa water productivity [27]. Additionally, further results related to alfalfa irrigated with TWW using a sprinkler system demonstrated that this system met optimal water and nutrient requirements while respecting irrigation water standards [28].

3.1.3. Nutrient Management for Alfalfa

Figure 5 shows the cumulative nutrient uptake in terms of P and N for the FARMOD and ON-DEMAND scenarios. It is relevant that for nitrogen, the ON-DEMAND scenario showed higher values (Figure 5a) which could be explained by the model suggesting a higher amount of water be applied, meaning a higher amount of nitrogen is supplied, leading to better absorption. On the other hand, the difference between the scenarios was not too significant in terms of P (Figure 5b), indicating that a slight increase in the volume of water does not influence P uptake.
Literature reviews indicate that most crops cannot remove the total amount of P applied with secondary TWW. The additional P accumulates in the upper soil layers, depending on soil properties such as pH. The soil’s pH value also limits the mobility of P and influences the timing of its application [29].
The impact of TWW on soil P dynamics depends significantly on the quality of the wastewater itself. Secondary TWW often contains both organic and inorganic forms of P, with the latter being more readily available for crop uptake. However, the consistent use of TWW may alter soil microbial communities, affecting the mineralization of organic P and, ultimately, its availability to plants [30]. Proper management strategies are essential to ensure sustainable agricultural practices while minimizing the risk of P accumulation and environmental pollution [31].

3.1.4. Salinity and Escherichia coli Management for Alfalfa

Soil salinity is a crucial factor to assess. The trend line of soil ECe values is shown in (Figure 6a) and the risk of E. coli associated with TWW reuse is also to be considered. (Figure 6b) shows the simulated E. coli trend in the soil between the FARMOD and ON-DEMAND scenarios, with higher E. coli values observed in the FARMOD scenario.
In the FARMOD scenario, soil ECe was higher than in the ON-DEMAND scenario. Controlling soil ECe to achieve a range of less than 2 dS·m−1 has helped contain the risk of salt accumulation and potential leaching. In contrast, the FARMOD scenario saw ECe exceed 2.5 dS·m−1. Soil salinity gradually and steadily increases until it peaks during the season when alfalfa requires a high amount of water. The SIM model suggests that supplying higher amounts of water can help gradually decrease soil salinity.
Consequently, the SIM schedule considers longer intervals between irrigation events and larger application volumes. This strategy may slow down drainage fluxes and improve nutrient distribution in the root zone, thereby reducing groundwater contamination. This approach can mitigate the osmotic impact caused by excessive salt introduced with TWW irrigation, which compromises soil physical and hydraulic characteristics, reducing water absorption and root activity [28]. ECe values vary according to irrigation events, nutrient management, and soil water patterns. Although treatment procedures tend to eliminate salts and bring the water below critical values compared to TWW guidelines, irrigation events can still influence the soil’s response to salinity, especially in the long term. Part of the salts remain in the irrigation water, and even if TWW reaches acceptable values, this does not mean that no harm reaches the soil due to complex processes.
The ON-DEMAND scenario generated by the model shows lower values of E. coli, indicating better results. This implies that the irrigation strategies suggested by the model can improve E. coli trends and have a better environmental impact. Regarding the irrigation system, the subsurface showed higher values of E. coli, which is explained by the fact that the subsurface has the highest direct contact with soils. This result aligns with findings by the authors of [32], who found that increased irrigation frequency increased the short-term E. coli contamination of soils by increasing the chances of interaction between wastewater and soils.
Extending irrigation durations can increase Escherichia coli exposure to environmental stressors, promoting their die-off. Factors such as soil moisture, temperature, and sunlight significantly influence E. coli survival in soils irrigated with TWW. High temperatures and desiccation reduce E. coli viability, while UV radiation from sunlight can cause DNA damage, leading to bacterial inactivation. Additionally, soil properties like pH and microbial competition play roles in E. coli persistence. Acidic or alkaline soils can disrupt bacterial processes, and native soil microbiota can outcompete E. coli, further diminishing their survival [33].
However, E. coli may persist in shaded, moist, or nutrient-rich microenvironments within the soil, posing potential contamination risks to crops or groundwater. Therefore, managing irrigation practices, including timing and duration, is crucial to minimize public health risks associated with E. coli in TWW irrigation [34].

3.2. Case Study 2: Citrus in Palestine

3.2.1. Yield and Nutrient Efficiency for Citrus

The citrus case study was set up through the model, and two scenarios were created for comparison. Table 2 compares the FARMER observations and the FARMOD and ON-DEMAND scenarios. FARMER observations and FARMOD outputs were compared to calibrate the SIM model and very similar results were observed, validating the calibration. However, in the ON-DEMAND scenario, it was clear that by selecting an appropriate irrigation schedule, N and P uptake by roots was greater, leading to a higher yield. The farmer’s yield was 22,000 kg/ha compared to 24,260 kg/ha in the ON-DEMAND scenario.

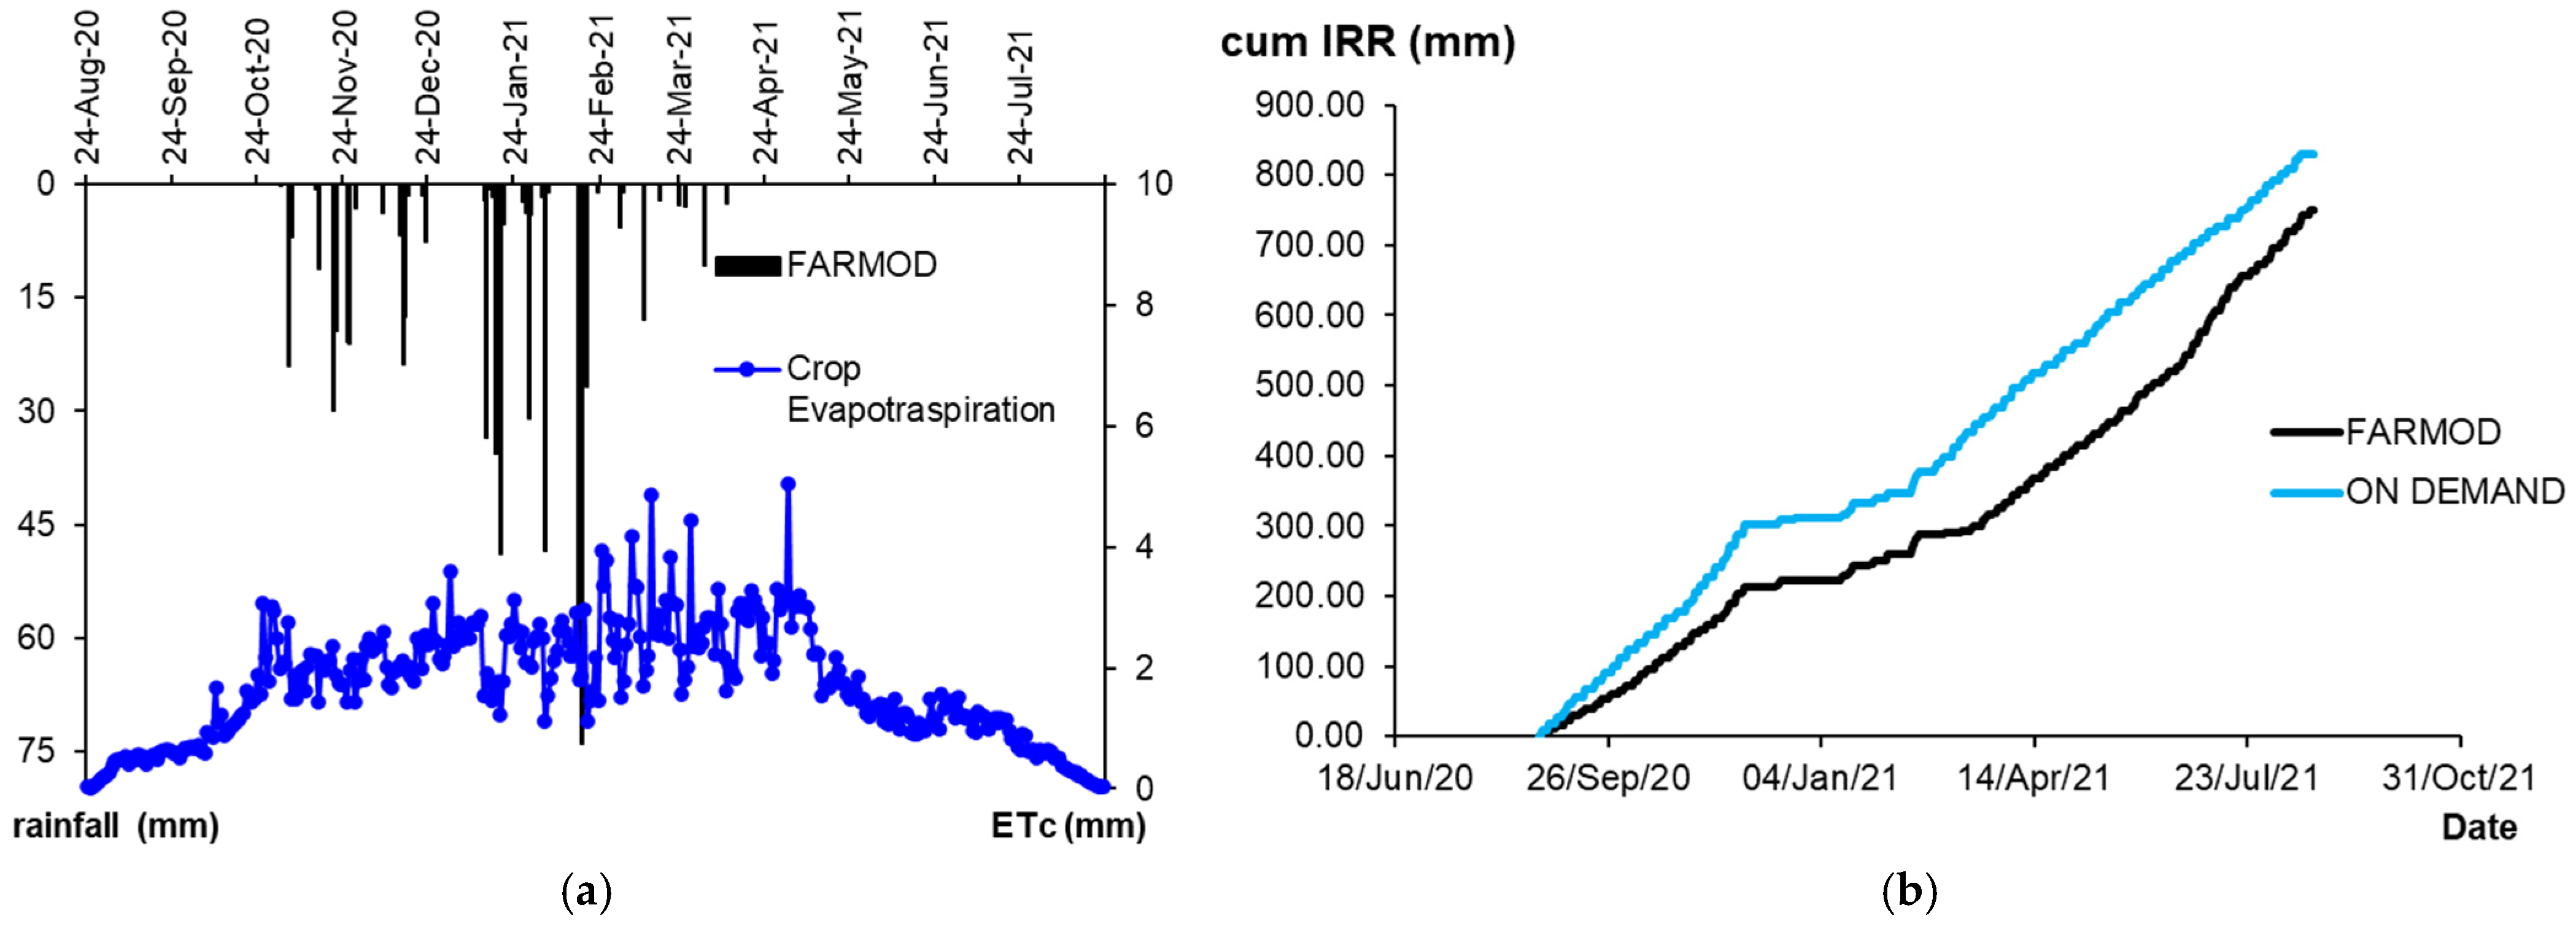
3.2.2. Irrigation Management for Citrus

The irrigation scenario was also modeled by SIM using climate data, as depicted in (Figure 7a). The trendline of cumulative irrigation in the middle of the season tends to stabilize (Figure 7b). The presence or absence of irrigation events across two TWW irrigation years (August 2020 to October 2021) justifies this behavior. After April, rainfall events are no longer present (Figure 7b). The cumulative irrigation trendline tends to grow to compensate for the water needed for plant growth.
The flowering season begins in April and is highly susceptible to insufficient water. A more severe water shortage during the summer, followed by irrigation events, may encourage out-of-season flowering, typically resulting in the production of non-viable second fruits and diminishing the yield of the subsequent main crop [35]. Water availability directly impacts the fruit set, as sufficient water is required to make nutrients, particularly N, available to the crop. Additionally, a lack of water during the fruit set can lead to a significant fruit drop in June or December. Therefore, proper irrigation management is essential [36]. In this scenario, the SIM model recommends utilizing larger amounts of water to meet the requirement. The use of TWW is considered a sustainable approach to alleviate the pressure on freshwater [37].

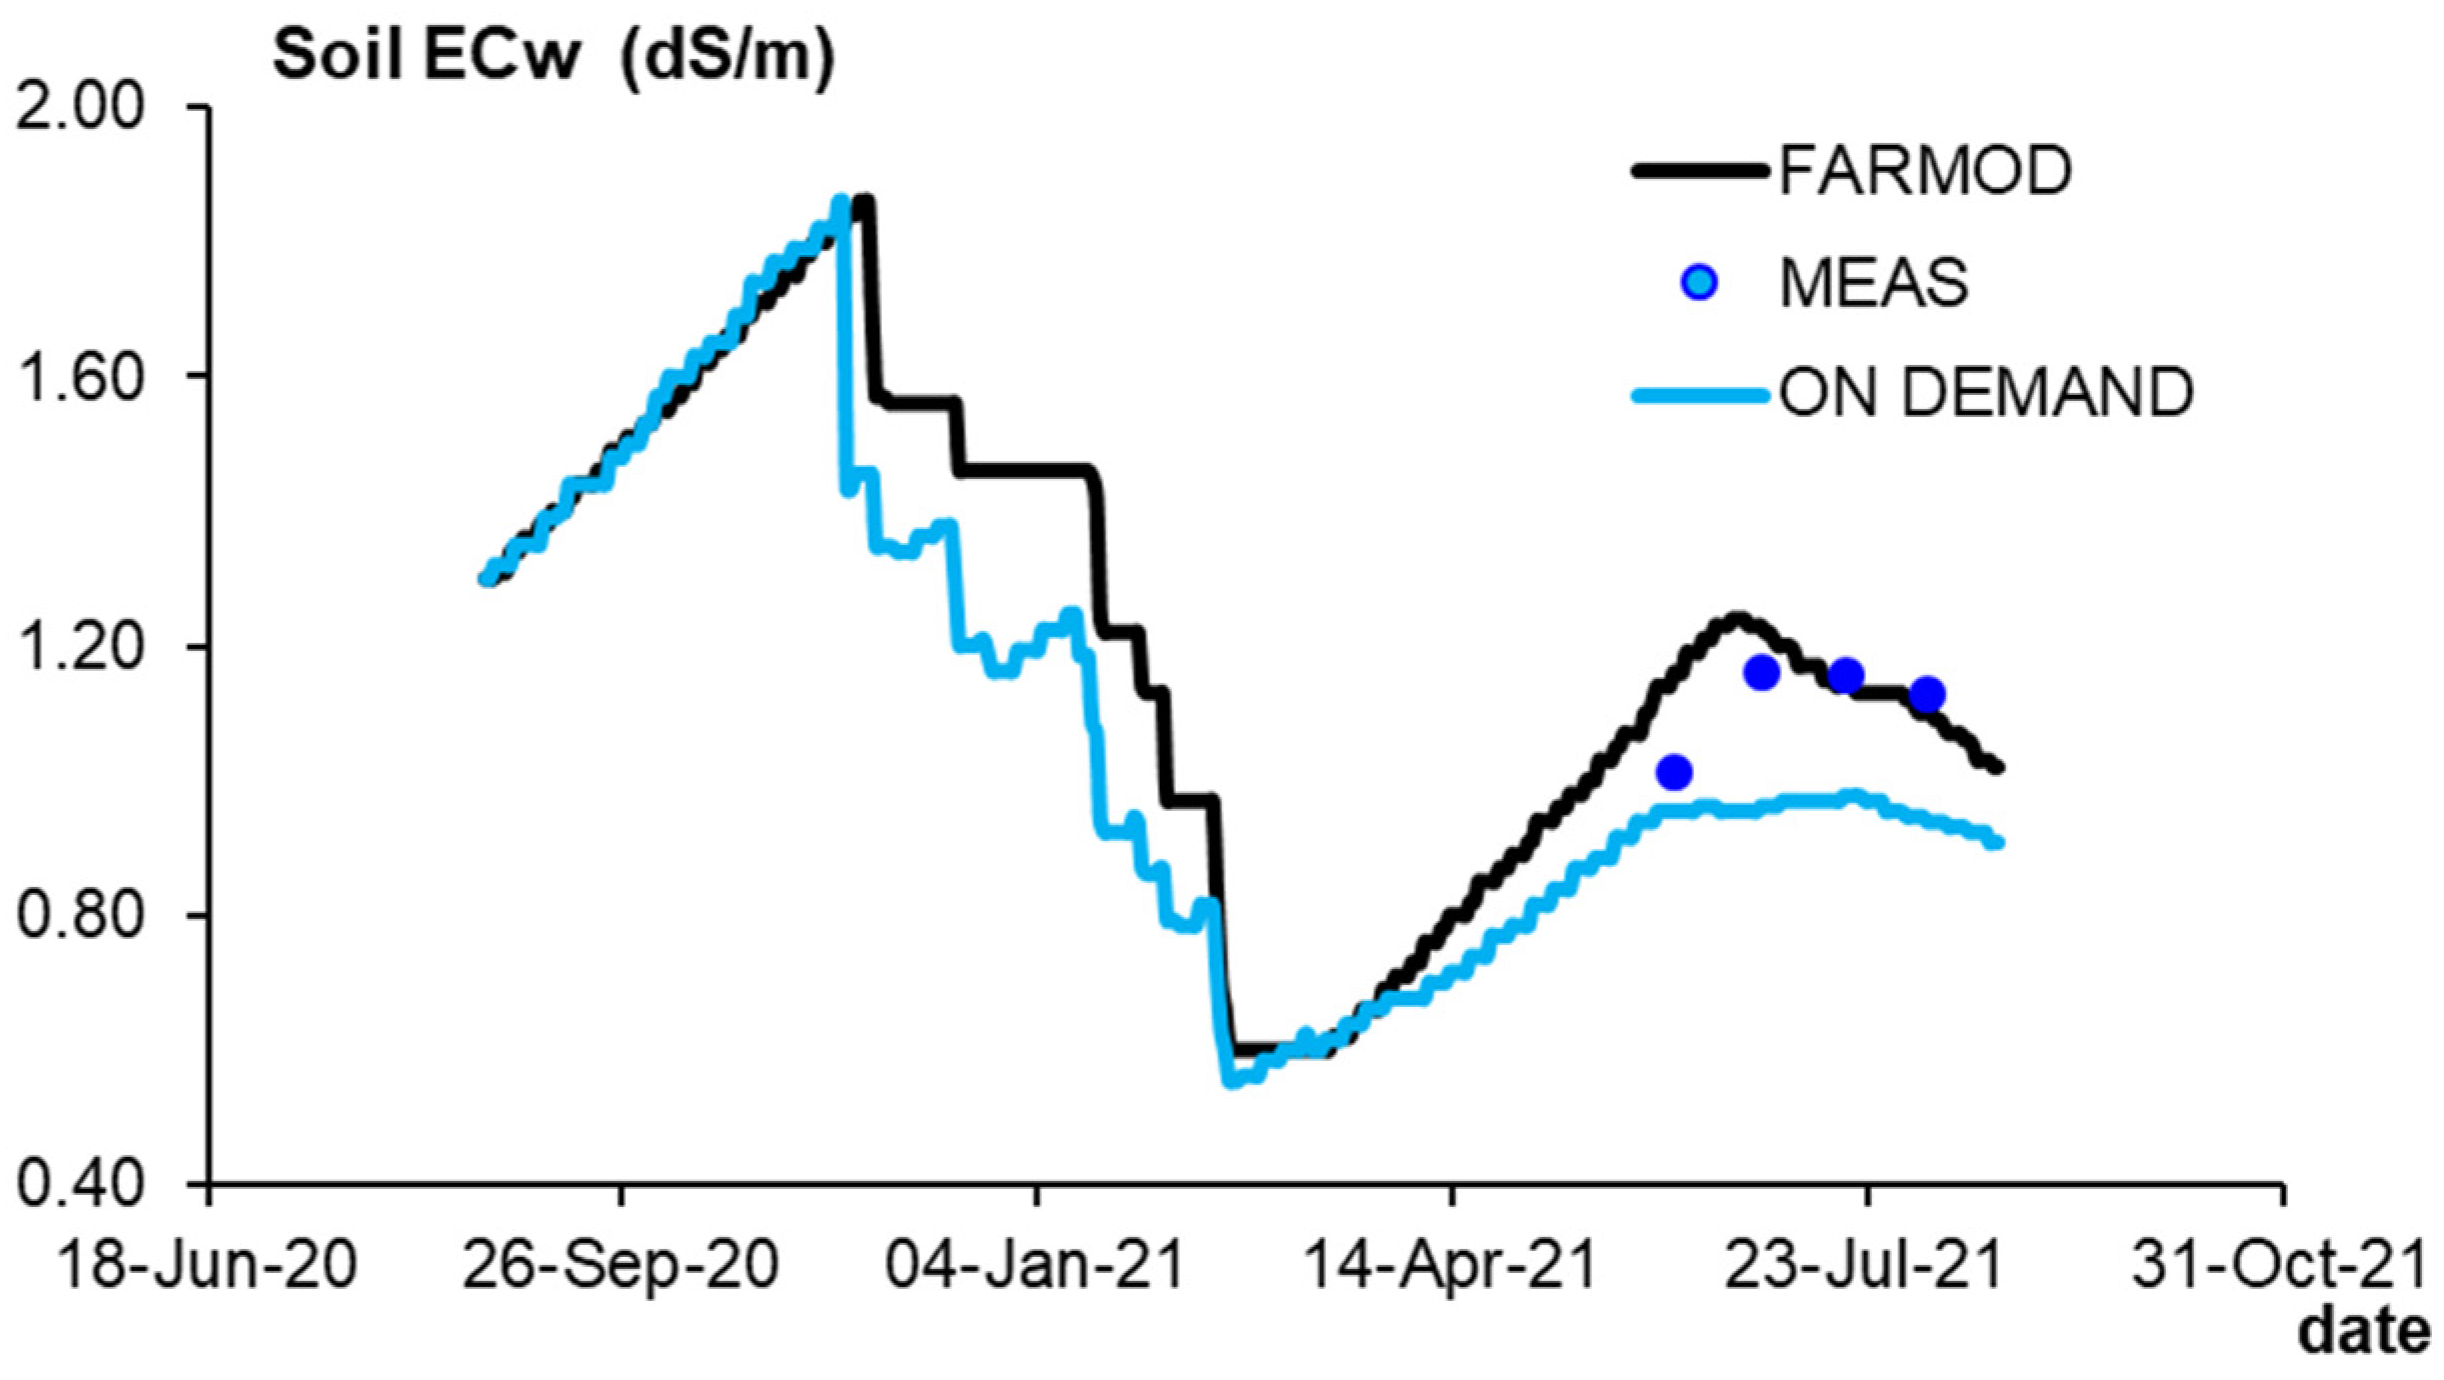
3.2.3. Salinity Management for Citrus

Salinity levels in the soil also play an essential role. Yield could decrease after ten years of supply with TWW irrigation [38]. In (Figure 8), it is clear how ECe levels are related to irrigation events. In the ON-DEMAND scenario, during the irrigation period, ECe values tend to rise, then decline when irrigation is no longer present. This could be due to the rainfall events reducing the trend of ECe from 1.60 to 0.80 dS·m−1, which can trigger water drainage. The blue dots (MEAS) refer to the measurements obtained by four field campaigns: 7 June, 28 June, 18 July, and 28 August, conducted in the Palestine citrus case study in 2021, which agree with ECe values simulated by SIM.
According to Maas and Hoffman’s salinity range, problems appear when the irrigation water’s electric conductivity (ECe) is higher than 1.5 dS·m−1. Both types of water fail to meet all the requirements for use, posing a severe issue for citrus trees, which are sensitive to salinity. High concentrations of Cl and Na+ in leaves inhibit CO2 assimilation, impacting various mechanisms [39,40,41].

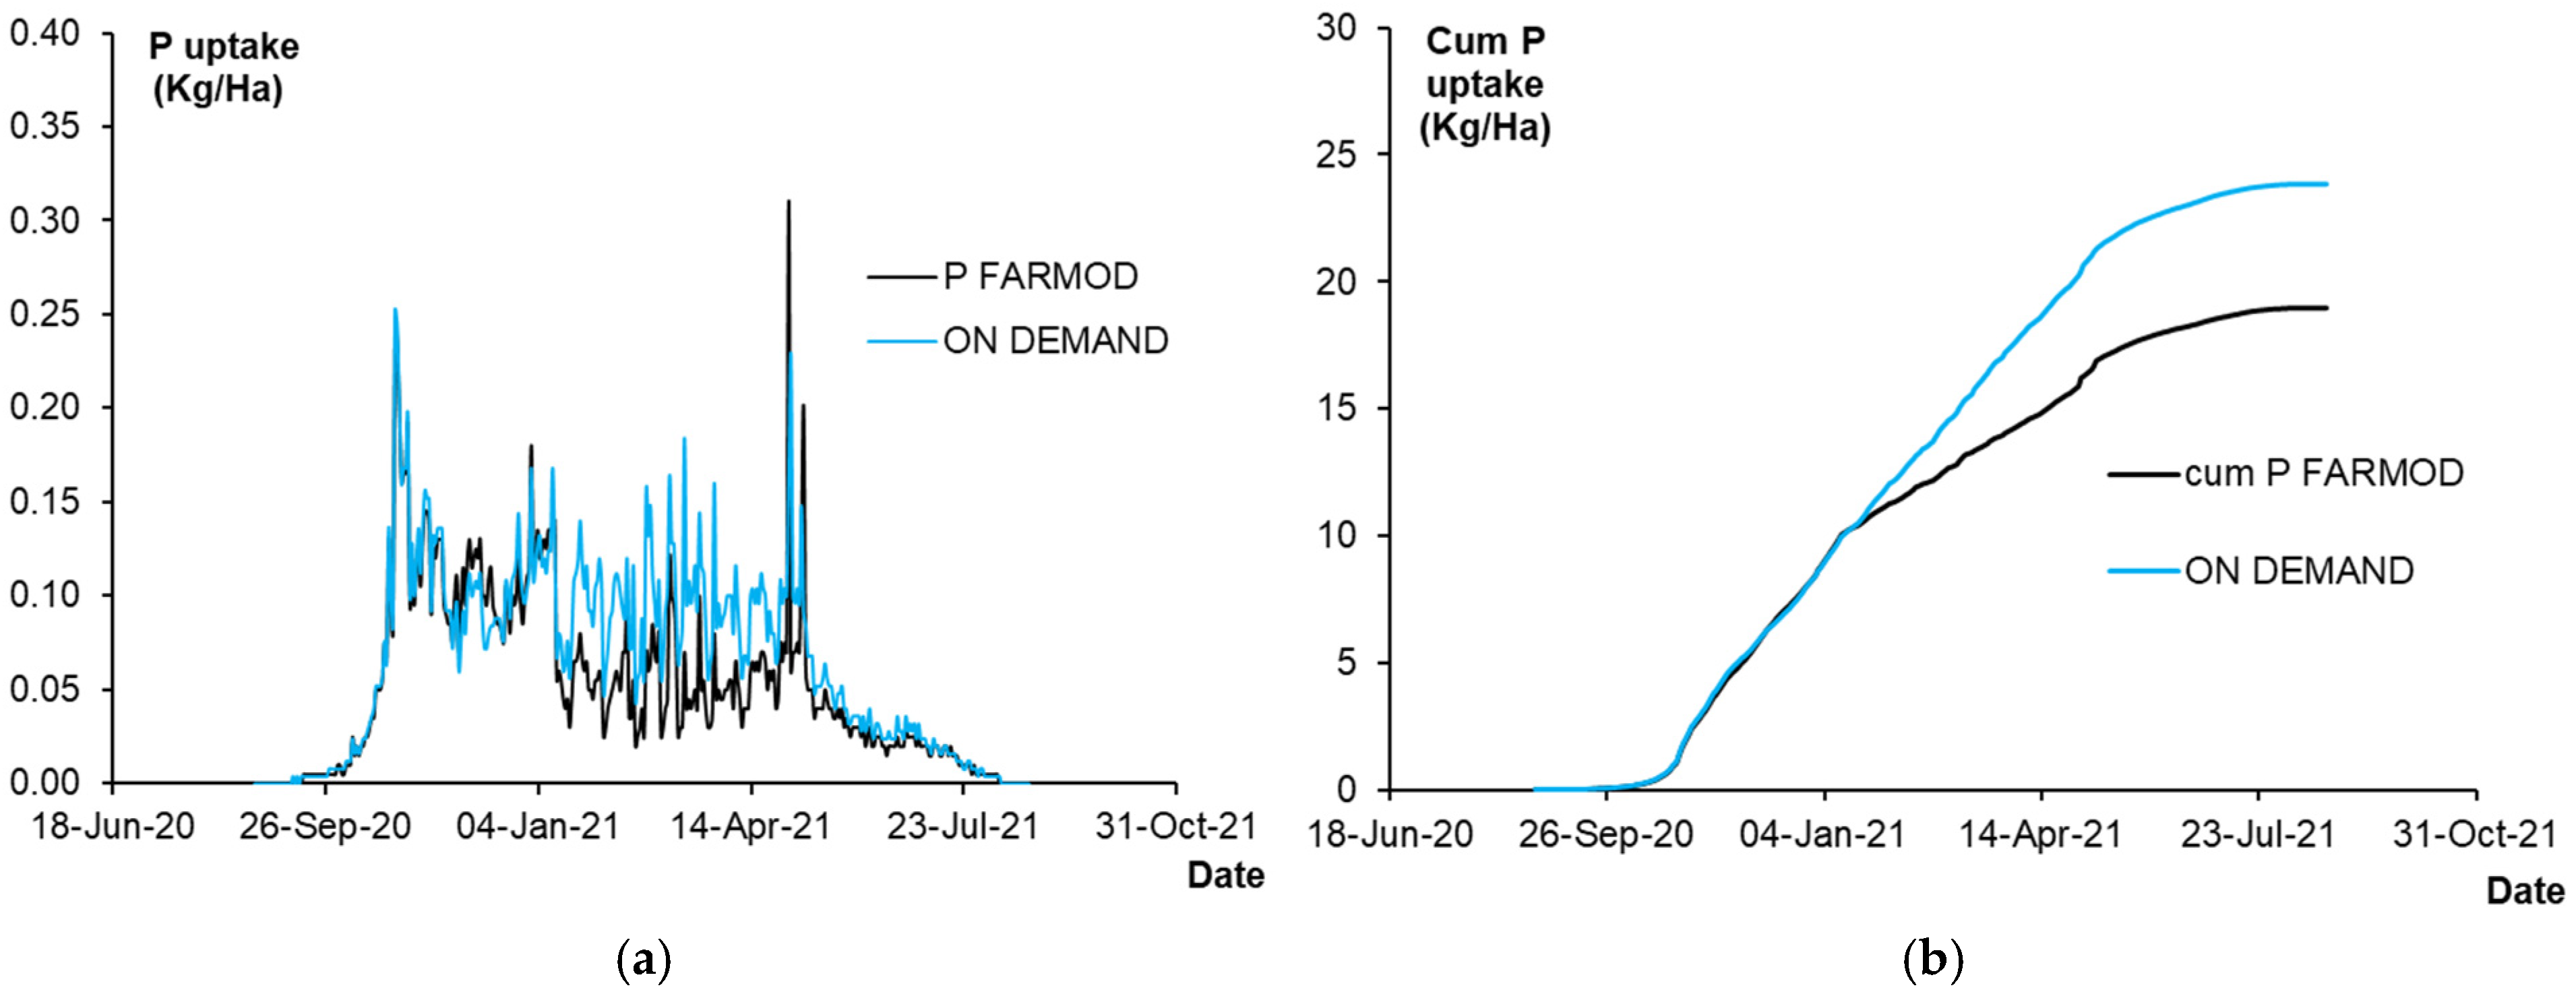
3.2.4. Nutrients Management for Citrus

Nutrient management is fundamental for maximizing citrus productivity, especially concerning nitrogen (N) and phosphorus (P). Nitrogen is indispensable for citrus tree growth, fruit yield, and quality, playing a critical role in protein synthesis, photosynthesis, and other metabolic processes. Adequate N levels are especially crucial during key phenological stages such as fruit initiation and development [42]. For optimal nutrient utilization, it is vital to align N supply with the tree’s physiological demand throughout the growth cycle.
The study’s findings highlight the effectiveness of the SIM model’s “ON DEMAND” irrigation strategy in improving nutrient uptake. Figure 9 and Figure 10 show the daily and cumulative N and P uptake, respectively. Blue symbols represent nitrogen concentration values measured in four field campaigns. The cumulative N and P uptake patterns closely followed the irrigation curve, indicating that timely irrigation enhances nutrient availability and uptake efficiency. Previous research underscores that matching irrigation to crop demand reduces nutrient leaching and maximizes N utilization [43].
In this case, the farmer’s application rate of 190 kg/ha of N was lower than the SIM models recommended 240 kg/ha, which was closer to the optimal range for citrus production (160–232 kg/ha/year). This suggests that the “ON DEMAND” strategy aligns more effectively with crop nutrient requirements, minimizing waste and the environmental impact.
Phosphorus, though not classified as a major nutrient for citrus production, remains essential for photosynthesis, energy transfer, and carbohydrate metabolism. P uptake was higher under the “ON DEMAND” scenario, indicating that proper irrigation timing can improve P availability and uptake. TWW often contains high concentrations of P, which, if not managed effectively, can lead to soil P accumulation and potential environmental issues such as runoff-induced eutrophication [44]. While citrus trees generally require less P than N, maintaining balanced P levels is essential for supporting overall tree health and productivity. The findings also highlight the importance of integrating advanced models like SIM to guide irrigation and nutrient strategies effectively. Tools like SIM can assist growers in achieving a balance between crop performance and sustainable resource use by tailoring irrigation and fertilization practices to specific crop needs and environmental conditions.

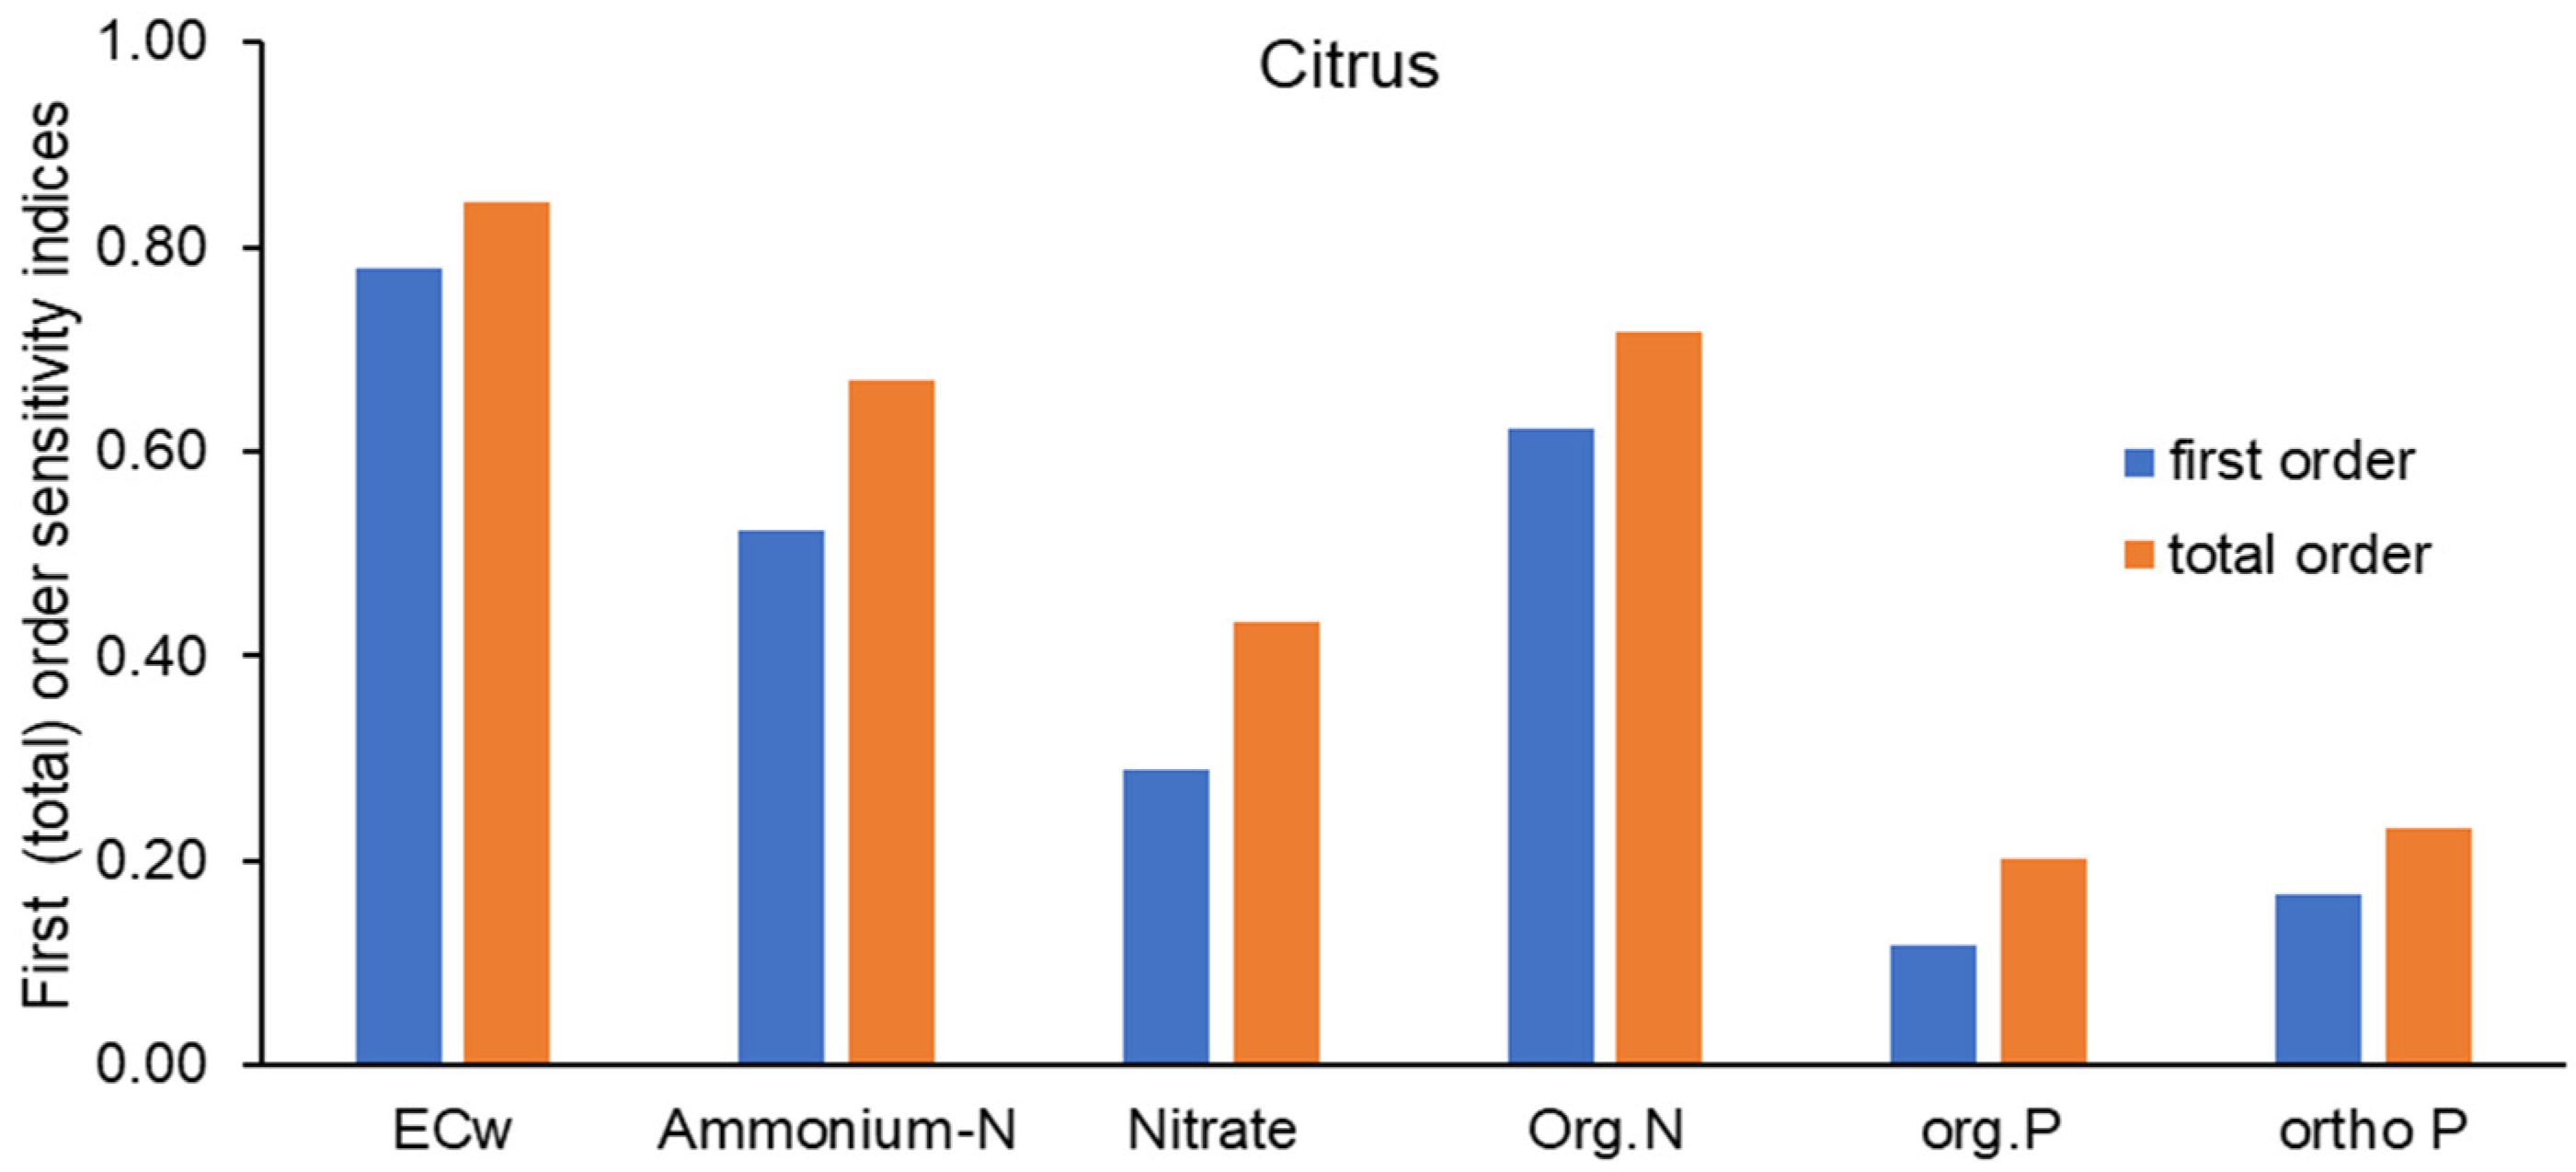
3.3. Sensitivity Analysis for Alfalfa and Citrus

The Sobol method was used for case studies 1 and 2 to compute the most sensitive parameters. Both, the first order and total order indices were calculated. The X-axis shows the parameters generated as the output. The Multi Objective Evolutionary Algorithm (MOEA) framework software was used to compute the indexes [45]. For alfalfa, salinity and N were identified as the most sensitive parameters that need to be monitored for future long-term irrigation performed with TWW (Figure 11).
This is very crucial because alfalfa is significantly affected by high salinity levels. As a legume, alfalfa is more susceptible to salt stress than cereals. Salt stress lowers alfalfa germination by weakening respiration, reduces biomass output by impeding photosynthesis, and affects fodder quality by lowering soluble protein and P levels. Furthermore, salt stress impacts plant nutrient adsorption capacity, especially N adsorption ability, indirectly reducing plant development [46]. For citrus, ECe and N are the most sensitive parameters affecting simulation performance (Figure 12).
Proper TWW irrigation practices require monitoring of these parameters. ECe is particularly critical since citrus trees are very sensitive to salinity. It was found that soil salinity significantly limits citrus production worldwide. Although data on fruit yields in response to salinity is limited, it indicates that grapefruit, lemons, and oranges are among the most sensitive crops. Fruit yields decrease by about 13% for each 1.0 dS·m−1 increase in the electrical conductivity of the saturated soil extract (ECe) once soil salinity exceeds a threshold ECe of 1.4 dS·m−1 under conventional irrigation practices. Canopy thinning, severe leaf loss, and twig dieback can all be caused by salinity. Salt stress can also cause fruit maturity to be delayed and fruit production to be reduced by reducing the number of fruits produced per tree and the size of the fruit [47].

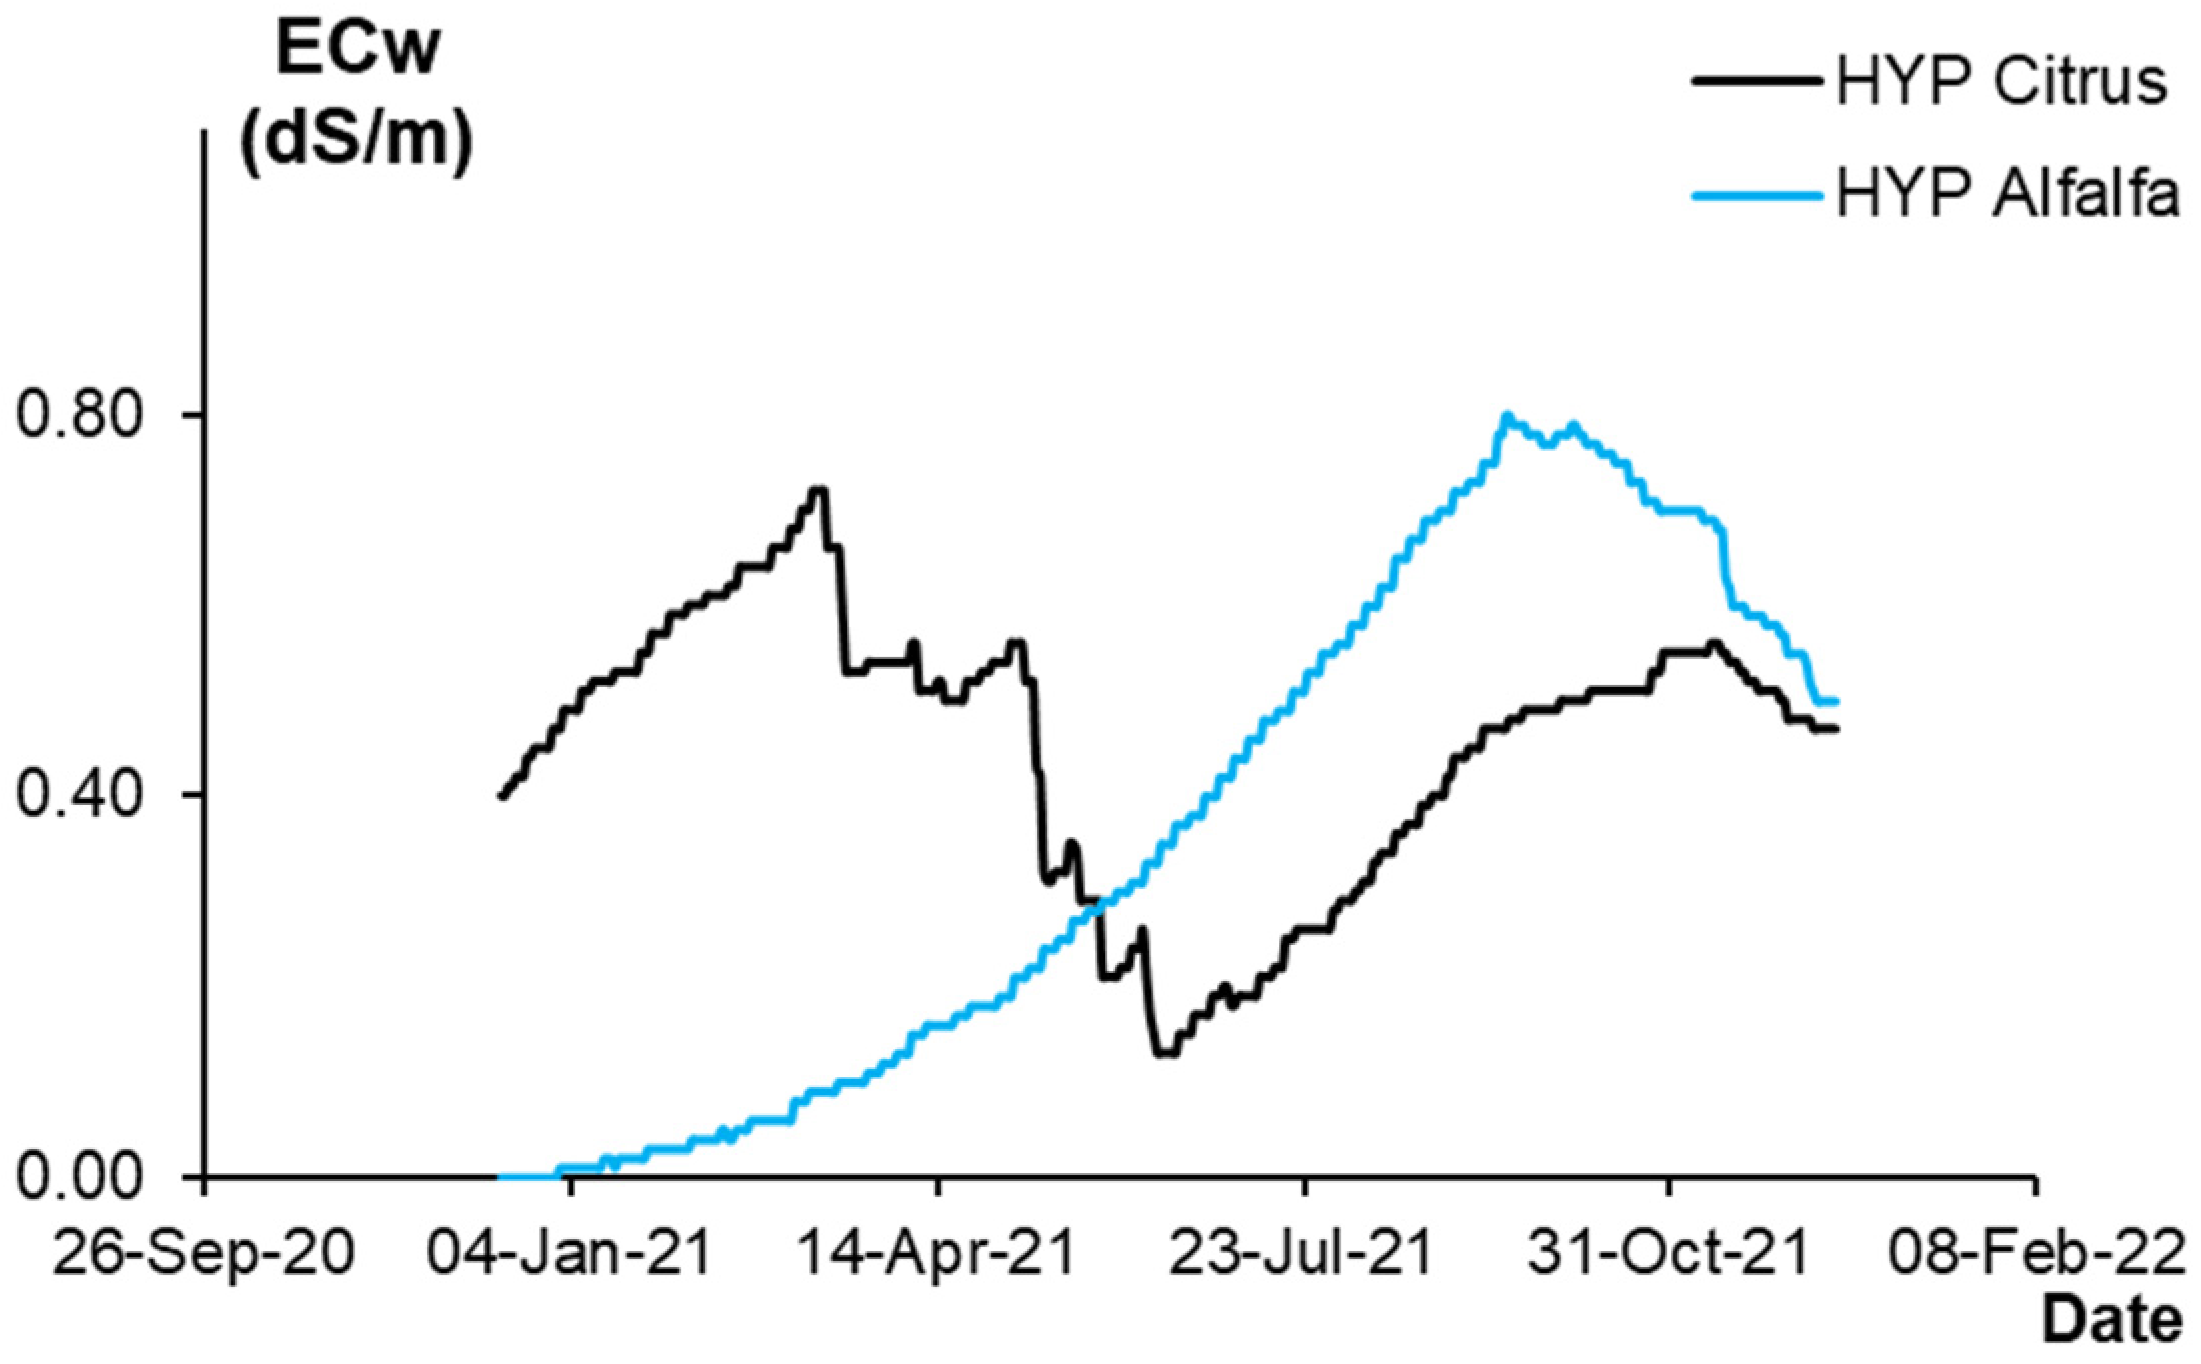
3.4. Simulated Outcomes for Alfalfa and Citrus Hypothetical Scenario

The alfalfa experiment was conducted on Vertisol soil. Optimal Vertisol characteristics were selected as the input for the hypothetical HYP scenario, based on good initial soil conditions and TWW quality extrapolated from literature review research [48]. Specifically, the soil had 0.12% N, 0.007% P, 1.96% organic matter, and an ECe of 0.144 dS·m−1. Optimal water quality, identified from secondary treatment plants in the literature and successful case studies included 0.69 mg.L−1 N, 4.5 mg.L−1 P, 0.3 dS·m−1 electrical conductivity, and 4.9 CFU/100 mL E. coli [49].
For citrus, grown on Terra Rossa soil, optimal values from the literature [50] were used in the SIM model to improve TWW irrigation outputs provided by the ON-DEMAND scenario. These values, collected under TWW irrigation long-term conditions, included 0.167% N, 4.35 ppm P, 1.68% organic matter, and an ECe of 0.3 dS·m−1. Water quality parameters from tertiary treatment, considered very good, were also used in SIM, with 12.1 mg.L−1 N, 7.16 mg.L−1 P, and 0.87 dS·m−1 ECe [51]. The results for ECe, N, and P for case studies 1 and 2 were provided. In addition, E. coli values for alfalfa were noted as potentially dangerous to livestock feed, especially in the Al Ramtha area, where husbandry activities are high. Figure 13 shows the trendline for ECe in alfalfa and citrus.
For citrus, the trendline of ECe values in the winter season decreases due to rainfall events and the halt of the irrigation period, while they start to grow when irrigation resumes. On the contrary, for alfalfa, the ECe trend increases during the first winter season (January–March 2021), while the values decrease during the second winter season since it reached the end of the experiment for alfalfa. However, throughout the entire season, ECe values did not exceed 0.8 dS·m−1, indicating acceptable results. Low salinity levels enhance nutrient absorption, reduce plant stress, and improve soil structure.
Figure 14 shows improved nitrogen uptake compared to poor initial conditions. The amount of N absorbed by alfalfa and citrus meets the nutrient requirements for the hypothetical scenario. For citrus, N uptake reaches 250 kg/ha. In contrast, it was demonstrated that applying 200 kg N/ha yearly is adequate to maintain high-quality citrus yields and obtain good tree development [52]. Similarly, for alfalfa, SIM generated 650 kg/ha in the optimum scenario, whereas 500 kg/ha is considered the average value for good yield and production [53].
In the HYP scenario, the E. coli level in the alfalfa soil did not exceed 3.3 log CFU/g. (Figure 15). Integrating appropriate practices with irrigation management can limit the bacterial contaminants that pose hazards to humans. For example, E. coli levels decreased from 6 log CFU/g in the FARMOD scenario to a maximum of 3.3 log CFU/g in the hypothetical scenario by improving water quality and soil conditions. This scenario aligns with observations from the same experiment, showing low E. coli values. The findings are consistent with previous research on the risks associated with infections in agricultural water irrigation. One study showed that for water with less than or equal to 2 log E. coli CFU/100 mL, no pathogens were found on crops regardless of irrigation methods [54].
For a significant period during the year, as shown in Figure 15, E. coli levels were slightly higher than 2 log CFU/g. This suggests that alfalfa could be safe with an acceptable E. coli infection limit. It is well known that the main factors affecting soil contamination when using partially TWW are E. coli concentration in the irrigation water and its natural die-off. Studies have demonstrated that E. coli can survive in soil for several days to several months, depending on soil temperature and moisture [55]. Therefore, implementing a no-harm TWW irrigation management plan, combined with subsurface drip irrigation, can also be a strategy to avoid E. coli contamination when applying TWW effluent.
Overall, integrating proper practices based on field data, modeling, and soil tilth management could be a potential strategy to preserve soil quality for long-term TWW reuse scenarios in Jordan and Palestine, where TWW irrigation is a well-established practice.

4. Conclusions

The reuse of TWW, particularly in agriculture, is often promoted as an appealing and pragmatic solution that significantly relieves pressure on water resources while providing additional agronomic benefits due to TWW’s high nutritive value. However, the reuse of TWW may also have negative impacts, such as the accumulation of salts and contaminants, which can degrade soil health and enter the food chain. This study explored irrigation approaches for alfalfa in Jordan and citrus in Palestine, comparing current farmer practices (FARMOD) with optimized scheduling (ON-DEMAND) using the SIM model. Results showed that ON-DEMAND significantly improved outcomes: alfalfa yield increased to 17,250 kg/ha from 15,600 kg/ha, nitrogen uptake rose to 668 kg/ha from 502 kg/ha, and phosphorus uptake reached 47 kg/ha from 42 kg/ha, with soil salinity (ECe) staying below 2.0 dS·m−1. E. coli levels were also notably lower (2 vs. 6 log10 CFU·g−1). For citrus, ON-DEMAND boosted the yield to 24,260 kg/ha from 22,000 kg/ha, nitrogen uptake to 240 kg/ha from 190 kg/ha, and phosphorus uptake to 23.7 kg/ha from 18.9 kg/ha, while reducing ECe to 1.2 dS·m−1 from 2.0 dS·m−1. A simulated scenario with improved initial soil conditions further minimized ECe (0.8 dS·m−1) and E. coli levels (3.3 log10 CFU·g−1). These findings emphasize the critical role of combining field data with modeling to optimize TWW irrigation, achieving better yields, improved nutrient uptake, and minimized environmental risks.
Modeling alone cannot determine the best irrigation strategy for TWW due to changing conditions. The SIM model combined with field data and monitoring effectively maximizes benefits and mitigates risks. Reliable prediction models should be integral to policies promoting sustainable TWW use in agriculture.
Establishing a community of practice may constitute a vital step forward in TWW reuse, as it allows for an exchange of results and the application of proper practices. This requires a series of practices that could be applied and implemented in future work for sustainable TWW reuse, including farm filtration techniques; crop selection considering salinity, toxicity, and health hazards; the selection of irrigation methods; and field management practices, including soil tilth and the timing of irrigation to withholding before harvest.

Author Contributions

Conceptualization, R.K. and G.D.; methodology, G.D., R.A. and R.K.; software, R.A. and G.D.; validation, R.A., G.D. and R.K.; formal analysis, R.A. and G.D.; investigation, G.D. and R.K.; resources, R.K.; data curation, G.D.; writing—original draft preparation, R.A.; writing—review and editing, G.D. and R.K.; visualization, R.A. and G.D.; supervision, G.D. and R.K.; project administration, R.K.; funding acquisition, R.K. All authors have read and agreed to the published version of the manuscript.

Funding

This research received no external funding.

Data Availability Statement

Data available based on request from authors.

Acknowledgments

This research was carried out within the framework of the MENAWARA project: Non-Conventional Water Re-use in Agriculture in Mediterranean Countries, funded by the European Union (https://www.enicbcmed.eu/projects/menawara (accessed on 5 November 2024)). Deep gratitude is owed to WeWorld (Palestine), the National Agricultural Research Center (NARC) (Jordan), and all the partners, local agricultural cooperatives, and ministries in Jordan and Palestine for providing all the necessary data.

Conflicts of Interest

The authors declare no conflicts of interest.

References

  1. Ofori, S.; Abebrese, D.K.; Růžičková, I.; Wanner, J. Reuse of treated wastewater for crop irrigation: Water suitability, fertilization potential, and impact on selected soil physicochemical properties. Water 2024, 16, 484. [Google Scholar] [CrossRef]
  2. Liu, J.; Yang, H.; Gosling, S.N.; Kummu, M.; Flörke, M.; Pfister, S.; Hanasaki, N.; Wada, Y.; Zhang, X.; Zheng, C.; et al. Water scarcity assessments in the past, present, and future. Earths Future 2017, 5, 545–559. [Google Scholar] [CrossRef] [PubMed]
  3. Shemer, H.; Wald, S.; Semiat, R. Challenges and solutions for global water scarcity. Membranes 2023, 13, 612. [Google Scholar] [CrossRef]
  4. Qadir, M.; Sharma, B.R.; Bruggeman, A.; Choukrallah, R.; Karajeh, F. Non-conventional water resources and opportunities for water augmentation to achieve food security in water scarce countries. Agric. Water Manag. 2007, 87, 2–22. [Google Scholar] [CrossRef]
  5. Silva, J.A. Wastewater treatment and reuse for sustainable water resources management: A systematic literature review. Sustainability 2023, 15, 10940. [Google Scholar] [CrossRef]
  6. Dakkak, A. Water Scarcity in Jordan: An Overview. Available online: https://www.ecomena.org/water-jordan/ (accessed on 21 November 2024).
  7. Almanaseer, N.; Hindiyeh, M.; Al-Assaf, R. Hydrological and environmental impact of wastewater treatment and reuse on Zarqa river basin in Jordan. Environments 2020, 7, 14. [Google Scholar] [CrossRef]
  8. Ait-Mouheb, N.; Mayaux, P.L.; Mateo-Sagasta, J.; Hartani, T.; Molle, B. Water reuse: A resource for mediterranean agriculture. In Water Resources in the Mediterranean Region; Zribi, M., Brocca, L., Icamblay, Y., Molle, F., Eds.; Elsevier: Amsterdam, The Netherlands, 2020; pp. 107–136. [Google Scholar] [CrossRef]
  9. Jaramillo, M.F.; Restrepo, I. Wastewater reuse in agriculture: A review about its limitations and benefits. Sustainability 2017, 9, 1734. [Google Scholar] [CrossRef]
  10. Christou, A.; Agüera, A.; Bayona, J.M.; Cytryn, E.; Fotopoulos, V.; Lambropoulou, D.; Manaia, C.M.; Michael, C.; Revitt, M.; Schröder, P.; et al. The potential implications of reclaimed wastewater reuse for irrigation on the agricultural environment: The knowns and unknowns of the fate of antibiotics and antibiotic resistant bacteria and resistance genes—A review. Water Res. 2017, 123, 448–467. [Google Scholar] [CrossRef]
  11. Pedrero, F.; Kalavrouziotis, I.; Alarcón, J.J.; Koukoulakis, P.; Asano, T. Use of treated municipal wastewater in irrigated agriculture—Review of some practices in Spain and Greece. Agric. Water Manag. 2010, 97, 1233–1241. [Google Scholar] [CrossRef]
  12. Ghaitidak, D.M.; Yadav, K.D. Characteristics, and treatment of greywater—A review. Environ. Sci. Pollut. Res. 2013, 20, 2795–2809. [Google Scholar] [CrossRef]
  13. Isayenkov, S.V.; Maathuis, F.J.M. Plant salinity stress: Many unanswered questions remain. Front. Plant Sci. 2019, 10, 80. [Google Scholar] [CrossRef]
  14. Snapp, S.; Sapkota, T.B.; Chamberlin, J.; Cox, C.M.; Gameda, S.; Jat, M.L.; Marenya, P.; Mottaleb, K.A.; Negra, C.; Senthilkumar, K.; et al. Spatially differentiated nitrogen supply is key in a global food–fertilizer price crisis. Nat. Sustain. 2023, 6, 1268–1278. [Google Scholar] [CrossRef]
  15. Sdiri, W.; AlSalem, H.S.; Al-Goul, S.T.; Binkadem, M.S.; Ben Mansour, H. Assessing the effects of treated wastewater irrigation on soil physico-chemical properties. Sustainability 2023, 15, 5793. [Google Scholar] [CrossRef]
  16. Dragonetti, G.; Khadra, R. Assessing soil dynamics and improving long-standing irrigation management with treated wastewater: A case study on citrus trees in Palestine. Sustainability 2023, 15, 13518. [Google Scholar] [CrossRef]
  17. Lonigro, A.; Montemurro, N.; Rubino, P.; Vergine, P.; Pollice, A. Reuse of treated municipal wastewater for irrigation in Apulia region: The “IN.TE.R.R.A.” project. Environ. Eng. Manag. J. 2015, 14, 1665–1674. [Google Scholar] [CrossRef]
  18. Shelia, V.; Šimůnek, J.; Boote, K.; Hoogenbooom, G. Coupling DSSAT and HYDRUS 1-D for simulations of soil water dynamics in the soil-plant-atmosphere system. J. Hydrol. Hydromech. 2018, 66, 232–245. [Google Scholar] [CrossRef]
  19. Khadra, R.; Sagardoy, J.A.; Taha, S.; Lamaddalena, N. Participatory irrigation management and transfer: Setting the guiding principles for a sustaining monitoring & evaluation system—A focus on the mediterranean. Water Resour. Manag. 2017, 31, 4227–4238. [Google Scholar] [CrossRef]
  20. Mazahrih, N.T.; Albalawneh, A.; Bani Hani, N.; Khadra, R.; Abo Dalo, A.; Al-Omari, Y.; Alomari, B.; Abu Hammad, M.; Martin, I.; Fahd, K.; et al. Impact of reclaimed wastewater on alfalfa production under different irrigation methods. Water Pract. Technol. 2024, 19, 2226–2236. [Google Scholar] [CrossRef]
  21. American Public Health Association; American Water Works Association, W.E.F. Standard Methods for the Examination of Water and Wastewater, 24th ed.; APHA Press: Washington, DC, USA, 2023. [Google Scholar]
  22. Dragonetti, G.; Khadra, R.; Daccache, A.; Oubelkacem, A.; Choukrallah, R.; Lamaddalena, N. Development and application of a predictive model for treated wastewater irrigation management in a semiarid area. Integr. Environ. Assess. Manag. 2020, 16, 910–919. [Google Scholar] [CrossRef]
  23. Pichery, C. Sensitivity analysis. In Encyclopedia of Toxicology, 3rd ed.; Wexler, P., Ed.; Academic Press: Oxford, UK, 2014; pp. 236–237. ISBN 978-0-12-386455-0. [Google Scholar]
  24. Hamby, D.M. A review of techniques for parameter sensitivity analysis of environmental models. Environ. Monit. Assess. 1994, 32, 135–154. [Google Scholar] [CrossRef] [PubMed]
  25. Shin, M.-J.; Choi, Y.S. Sensitivity analysis to investigate the reliability of the grid-based rainfall-runoff model. Water 2018, 10, 1839. [Google Scholar] [CrossRef]
  26. Montazar, A.; Sadeghi, M. Effects of applied water and sprinkler irrigation uniformity on alfalfa growth and hay yield. Agric. Water Manag. 2008, 95, 1279–1287. [Google Scholar] [CrossRef]
  27. Lahlou, F.; Mackey, H.R.; McKay, G.; Onwusogh, U.; Al-Ansari, T. Water planning framework for alfalfa fields using treated wastewater fertigation in Qatar: An energy-water-food nexus approach. Comput. Chem. Eng. 2020, 141, 106999. [Google Scholar] [CrossRef]
  28. Hettiarachchi, H.; Ardakanian, R. Safe Use of Wastewater in Agriculture: Good Practice Examples; United Nations University, Institute for Integrated Management of Material Fluxes and Resources: Dresden, Germany, 2016; ISBN 978-3-944863-30-6. [Google Scholar]
  29. Assouline, S.; Russo, D.; Silber, A.; Or, D. Balancing water scarcity and quality for sustainable irrigated agriculture. Water Resour. Res. 2015, 51, 3419–3436. [Google Scholar] [CrossRef]
  30. Schneider, K.D.; Thiessen Martens, J.R.; Zvomuya, F.; Reid, D.K.; Fraser, T.D.; Lynch, D.H.; O’Halloran, I.P.; Wilson, H.F. Options for improved phosphorus cycling and use in agriculture at the field and regional scales. J. Environ. Qual. 2019, 48, 1247–1264. [Google Scholar] [CrossRef]
  31. Cordell, D.; Drangert, J.-O.; White, S. The story of phosphorus: Global food security and food for thought. Glob. Environ. Change 2009, 19, 292–305. [Google Scholar] [CrossRef]
  32. Li, J.; Wen, J. Effects of water managements on transport of E. coli in soil-plant system for drip irrigation applying secondary sewage effluent. Agric. Water Manag. 2016, 178, 12–20. [Google Scholar] [CrossRef]
  33. Estrada, I.B.; Aller, A.; Gomez, X.; Moran, A.; Garcia, A.I. The survival of Escherichia coli, faecal coliforms and Enterobacteriaceae in general in soil treated with sludge from wastewater treatment plants. Bioresour. Technol. 2004, 93, 191–198. [Google Scholar] [CrossRef]
  34. Malkawi, H.I.; Mohammad, M.J. Survival and accumulation of microorganisms in soils irrigated with secondary treated wastewater. J. Basic Microbiol. 2003, 43, 47–55. [Google Scholar] [CrossRef]
  35. Citrus, Food and Agriculture Organization of the United Nations. Available online: https://www.fao.org/land-water/databases-and-software/crop-information/citrus/es/ (accessed on 24 November 2024).
  36. Intrigliolo, F.; Intelisano, S. Effects of differential nitrogen application on nutrition, growth, yield, and fruit quality in young lemon trees. Acta Hort. 1997, 448, 499–507. [Google Scholar] [CrossRef]
  37. Khan, M.M.; Siddiqi, S.A.; Farooque, A.A.; Iqbal, Q.; Shahid, S.A.; Akram, M.T.; Rahman, S.; Al-Busaidi, W.; Khan, I. Towards sustainable application of wastewater in agriculture: A review on reusability and risk assessment. Agronomy 2022, 12, 1397. [Google Scholar] [CrossRef]
  38. Syvertsen, J.P.; Garcia-Sanchez, F. Multiple abiotic stresses occurring with salinity stress in citrus. Environ. Exp. Bot. 2014, 103, 128–137. [Google Scholar] [CrossRef]
  39. Russo, D.; Laufer, A.; Bardhan, G.; Levy, G.J. Salinity control in a clay soil beneath an orchard irrigated with treated wastewater in the presence of a high-water table: A numerical study. J. Hydrol. 2015, 531, 198–213. [Google Scholar] [CrossRef]
  40. García-Sánchez, F.; Syvertsen, J.P. Salinity tolerance of cleopatra mandarin and carrizo citrange citrus rootstock seedlings is affected by CO2 enrichment during growth. J. Am. Foc. Hortic. Sci. 2006, 131, 24–31. [Google Scholar] [CrossRef]
  41. Hammami, A.; Rezgui, S.; Hellali, R. Leaf nitrogen and potassium concentrations for optimum fruit production, quality and biomass tree growth in clementine mandarin under mediterranean climate. J. Hortic. For. 2010, 2, 161–170. [Google Scholar]
  42. Alva, A.K.; Paramasivam, S.; Fares, A.; Obreza, T.A.; Schumann, A.W. Nitrogen best management practice for citrus trees: II. Nitrogen fate, transport, and components of N budget. Sci. Hortic. 2006, 109, 223–233. [Google Scholar] [CrossRef]
  43. Morgan, K.T.; Obreza, T.A.; Kadyampakeni, D.; Hamido, S.; Ferrarezi, R.S.; Zekri, M. Nutrition of Florida citrus trees, 3rd edition: Chapter 9. Irrigation management to improve nutrient uptake: SL463 SS676, 2 2020. EDIS 2020, 65–70. [Google Scholar] [CrossRef]
  44. Jarvie, H.P.; Neal, C.; Withers, P.J. Sewage-effluent phosphorus: A greater risk to river eutrophication than agricultural phosphorus? Sci. Total Environ. 2006, 360, 246–253. [Google Scholar] [CrossRef]
  45. Zhang, X.-Y.; Trame, M.; Lesko, L.; Schmidt, S. Sobol sensitivity analysis: A tool to guide the development and evaluation of systems pharmacology models. CPT Pharmacomet. Syst. Pharmacol. 2015, 4, 69–79. [Google Scholar] [CrossRef] [PubMed]
  46. Wan, W.; Liu, Q.; Zhang, C.; Li, K.; Sun, Z.; Li, Y.; Li, H. Alfalfa growth and nitrogen fixation constraints in salt-affected soils are in part offset by increased nitrogen supply. Front. Plant Sci. 2023, 14. [Google Scholar] [CrossRef] [PubMed]
  47. Maas, E.V. Salinity and citriculture. Tree Physiol. 1993, 12, 195–216. [Google Scholar] [CrossRef] [PubMed]
  48. Kuntyastuti, H.; Lestari, S.A.D. Application of manure and npk fertilizer on grobogan variety and aochi/w-c-6-62 soybean as promise line in lowland vertisol ngawi, Indonesia. Nusant. Biosci. 2017, 9, 120–125. [Google Scholar] [CrossRef]
  49. Safari, G.H.; Yetilmezsoy, K.; Mahvi, A.H.; Zarrabi, M. Post-treatment of secondary wastewater treatment plant effluent using a two-stage fluidized bed bioreactor system. J. Environ. Health Sci. Eng. 2013, 11, 10. [Google Scholar] [CrossRef] [PubMed]
  50. Ayodele, F.; Babalola, T. Physico-chemical properties of an alfisol under different tillage systems in the basement complex of kogi state. Sci. Forum J. Pure Appl. Sci. 2021, 21, 286–290. [Google Scholar] [CrossRef]
  51. Chien, S.H.; Dzombak, D.A.; Vidic, R.D. Comprehensive evaluation of biological growth control by chlorine-based biocides in power plant cooling systems using tertiary effluent. Environ. Eng. Sci. 2013, 30, 324–332. [Google Scholar] [CrossRef]
  52. Legaz, F.; Primo-Millo, E.; Primo-Yufera, E.; Gil, C.; Rubio, J.L. Nitrogen fertilization in citrus. Plant Soil 1982, 66, 339–351. [Google Scholar] [CrossRef]
  53. Yang, M.; Long, Q.; Li, W.; Wang, Z.; He, X.; Wang, J.; Wang, X.; Xiong, H.; Guo, C.; Zhang, G.; et al. Mapping the environmental cost of a typical citrus-producing county in China: Hotspot and optimization. Sustainability 2020, 12, 1827. [Google Scholar] [CrossRef]
  54. Abi Saab, M.T.; Jomaa, I.; El Hage, R.; Skaf, S.; Fahed, S.; Rizk, Z.; Massaad, R.; Romanos, D.; Khairallah, Y.; Azzi, V.; et al. Are fresh water and reclaimed water safe for vegetable irrigation? empirical evidence from Lebanon. Water 2022, 14, 1437. [Google Scholar] [CrossRef]
  55. Wu, S.; Nishihara, M.; Kawasaki, Y.; Yokoyama, A.; Matsuura, K.; Koga, T.; Ueno, D.; Inoue, K.; Someya, T. Inactivation of Escherichia coli in soil by solarization. Soil Sci. Plant Nutr. 2009, 55, 258–263. [Google Scholar] [CrossRef]
Figure 1. (a) Experimental design and (b) field layout for alfalfa in Jordan.
Water 17 00228 g001
Figure 2. (a) On site citrus experiment in Palestine and (b) experimental design for citrus in Palestine.
Water 17 00228 g002
Figure 3. (a) The trend of the upward (crop evapotranspiration) and downward fluxes (precipitation) for alfalfa season, and (b) the comparison between the cumulative TWW irrigation requirements between the two scenarios: FARMOD and ON-DEMAND.
Water 17 00228 g003
Figure 4. Weekly irrigation volume accounted for (a) surface drip irrigation, (b) sprinkler irrigation, (c) subsurface drip irrigation, and (d) surface irrigation.
Water 17 00228 g004
Figure 5. (a) The cumulative trend of nitrogen and (b) phosphorus uptake simulated for two scenarios: FARMOD and ON-DEMAND.
Water 17 00228 g005
Figure 6. The trend of (a) soil ECe and (b) soil E. coli in the FARMOD and ON-DEMAND scenarios.
Water 17 00228 g006
Figure 7. (a) The trend of the upward (crop evapotranspiration) and downward fluxes (rainfall) throughout TWW irrigation season, and (b) comparison between the cumulative TWW irrigation requirement of the two scenarios: FARMOD and ON-DEMAND.
Water 17 00228 g007
Figure 8. Soil ECe variation in soil for citrus.
Water 17 00228 g008
Figure 9. (a) Daily nitrogen uptake and (b) cumulative nitrogen uptake for citrus.
Water 17 00228 g009
Figure 10. (a) Daily phosphorus uptake and (b) cumulative phosphorus uptake for citrus.
Water 17 00228 g010
Figure 11. Sensitivity analysis for alfalfa.
Water 17 00228 g011
Figure 12. Sensitivity analysis for citrus.
Water 17 00228 g012
Figure 13. The trend of ECe for citrus and alfalfa in the HYP scenario under optimal TWW irrigation management based on both good water and soil quality.
Water 17 00228 g013
Figure 14. Cumulative nutrient uptake in the HYP scenario for citrus and alfalfa under optimal TWW irrigation management based on both good water and soil quality.
Water 17 00228 g014
Figure 15. E. coli trend in the HYP scenario for alfalfa under optimal TWW irrigation management based on both good water and soil quality.
Water 17 00228 g015
Table 1. Comparison between FARMER (observations), FARMOD, and ON-DEMAND simulations in terms of yield (kg/ha) and nutrient (N and P uptake) efficiency for alfalfa with different irrigation systems.
FARMERFARMODON-DEMAND
Irrigation systemsYieldNPYieldNPYieldNP
Subsurface15,6004914515,5105334217,25063547
Drip14,2005044114,8615024216,41066845
Surface12,3004283811,6004034012,35036428
Sprinkler92003252899803803211,65044533
Table 2. Comparison between FARMER (observations), FARMOD, and ON-DEMAND simulations in terms of yield (kg/ha) and nutrient (N and P uptake) efficiency for citrus with different irrigation systems.
FARMERFARMODON-DEMAND
IRR systemYieldNPYieldNPYieldNP
Drip22,000191.6018.9621,910190.418.9824,260240.0223.7
Disclaimer/Publisher’s Note: The statements, opinions and data contained in all publications are solely those of the individual author(s) and contributor(s) and not of MDPI and/or the editor(s). MDPI and/or the editor(s) disclaim responsibility for any injury to people or property resulting from any ideas, methods, instructions or products referred to in the content.

