1. Introduction
Taiwan, an island situated southeast of China, experiences abundant rainfall, but faces water scarcity, with the per capita annual water resources amounting to only about 20% of the global figure [
1]. Taiwan has historically relied on a combination of the unsustainable use of local ground water and surface waters to meet its water needs. However, growing economic development and increasing precipitation variability due to climate change have prompted policymakers to seek more resilient and sustainable water supply solutions. As early as 2003, Taiwan’s Green Building initiative recognized rooftop rainwater harvesting (RWH) as a key water resource indicator, requiring it to account for at least 4% of a building’s total water consumption [
2]. In 2009, the Water Resources Agency (WRA) under the Ministry of Economic Affairs enacted regulations acknowledging RWH as a viable supplementary source for domestic water use. To promote the adoption of RWH, the Architecture and Building Research Institute (ABRI) and the WRA published two key documents: the 2021 Rainwater Harvesting Systems Design Manual for Green Buildings and the 2022 Rainwater Harvesting Systems Design and Construction Guideline for School Campuses. These efforts aim to accelerate the implementation of RWH systems in buildings across Taiwan [
3,
4].
In urban water management, the traditional sectoral approach (including potable water, wastewater, stormwater, rainwater, and processed water) often hinders the implementation of integrated strategies. In Taiwan, stormwater management has historically been addressed separately from other water-related issues. Developers should be aware that regulations require the control of peak runoff discharged from development sites. Since detention systems, which are implemented to meet regulatory requirements, serve a different purpose than rainwater-harvesting systems, the required detention volume must be independent of the proposed rainwater collection volume.
The traditional separation of water management sectors has proven insufficient in addressing challenges such as flooding, water pollution, and rising costs. Therefore, it is crucial to expand the consideration of interactions between stormwater management and other urban water issues, such as RWH systems. For example, the Star City building in Seoul features a real-time control (RTC) system that manages water volumes in a 3000 m
3 shared tank, with each section serving a specific purpose: flood control, water conservation, and firefighting [
5]. At the Institute of Physics at the University of Berlin, the overflow tank, which serves both the green façades and the central air-conditioning system, is connected to a small constructed pond [
6]. In the Hohlgrabenäcker area of Germany, 56 rainwater tanks have overflows that connect to local infiltration areas [
7]. The storage tanks at Changbei and Qingyang Airports located in the southern China were built to collect rainwater based on relevant policies. Those tanks not only control floods, but also provide water for the airports’ grassland and landscape and improve the surrounding environment at the airports [
8]. Parker, etc. [
9], investigated the potential best case limits of water supply and stormwater retention benefits delivered by a 10,000 m
3 stormwater capture system equipped with real-time control on a university campus in Southern California. Those design principles mentioned above suggest a general approach for sharing collection areas to enhance the yield of a rainwater collection system, with the overflow of the tank connected to a stormwater tank. The consideration of a combined rainwater-harvesting (RWH) and stormwater-detention (SWD) system is mentioned in the Guidelines for Residential Rainwater Harvesting Systems Handbook [
10]. This approach uses a single rainwater storage tank for both retention and detention to manage stormwater, with the design based on local regulations for retention and detention volumes. The overflow outlet is placed between the two volume sections, with the outlet size determined by the 24 h average peak flow rate.
The Guide for Water Sensitive Urban Design [
11] suggests a combined design where the detention volume is based on the ratio of impervious surface area and paired with the required retention volume. It recommends using a 20–25 mm diameter slow-release orifice located between the two volume sections.
The Technical Guide for On-site Stormwater Detention Tank Systems [
12] advises developers consider using the water stored in the detention system for non-potable use by pumping and storing the water in a separate tank, or designing a larger tank to cater for both detention and rainwater harvesting purposes, provided that the required volume for each purpose is catered for separately. Tsai et al. [
13] proposed a comprehensive approach to modifying the traditional RWH systems, enabling them to address both the stormwater management and water conservation objectives. Their framework highlights critical design elements, such as the configuration, dimensions, and placement of passive discharge outlets, along with the development of a sustainable operational strategy for long-term use.
Developers may choose to implement RWH systems in their projects to supplement non-potable water use and meet the Green Building requirements. It is also important for developers to comply with regulations that control peak runoff discharges from the development site. While stormwater tanks are implemented to meet regulatory requirements and serve different purposes than RWH systems, the required stormwater volume must be independent of the volume proposed for RWH systems. Currently, there are no combined design guidelines for these systems in Taiwan.
A combined RWH and SWD system can be considered under the following conditions: the required stormwater detention volume is separate from the rainwater harvesting volume, and developers utilize the water stored in the stormwater tank for non-potable purposes by designing a larger tank to accommodate both the functions. Integrating a rainwater-harvesting tank with a stormwater-detention tank offers a more cost-effective approach to managing rainfall. This combined system efficiently collects rainwater for immediate use, while also leveraging the stormwater management capabilities of the dedicated tank. The benefits of installing a combined system include the following:
Increase amount of reusable water—Storing rainwater is an effective way to reduce water bills, while converting runoff into a valuable resource.
Enhance flood protection—Stormwater tanks retain and gradually release water during heavy rainfall, reducing the risk of flooding and helping to protect the local environment.
Save time and space—A combined system requires only one setup instead of two. Monitoring and maintaining a combined system is also simplified, as it involves overseeing just one system.
Increase cost efficiency—By integrating both the systems into a single tank, the costs associated with purchasing and maintaining two separate tanks are reduced.
According to Gerolin et al. [
14,
15], four simplified approaches have been proposed for combining RWH with stormwater management (SWM) as source control strategies: maintaining the existing system without adaptation, implementing RWH and SWM independently in parallel, integrating RWH and SWM sequentially in series, and employing RTC in RWH system configurations. These typologies focus on integrating RWH into SWM within the context of construction development. It is important to highlight the key considerations during the design, sizing, installation, operation, and maintenance phases. Xu et al. [
16] classified RWH systems at the allotment scale into three distinct categories, (1) conventional, (2) passive release, and (3) active release with RTC systems. The passive release system discharges stormwater by gravity through a discharge outlet, making it simple and cost-effective, particularly for smaller systems. In contrast, the active release system incorporates RTC technology [
17,
18], which enhances their suitability for larger-scale applications, particularly those involving the use of harvested rainwater or compliance with stormwater regulations. Despite these advantages, their higher cost and greater complexity may hinder widespread adoption.
DeBusk et al. [
19] and Jones et al. [
20] found that rainwater-harvesting systems are often underutilized during wet seasons, leading to full tanks and limiting the benefits of stormwater detention. In contrary, the stormwater detention volume is often underutilized during dry seasons. In Taiwan, rainfall distribution is highly seasonal, with the wet season contributing approximately 65% of the total precipitation in the northern region and as much as 90% in the southern region [
1]. This pronounced seasonal pattern significantly influences the design and operational strategies of combined systems.
Traditionally, RWH systems have focused on water conservation rather than stormwater management. This trend is especially prevalent in Taiwan, where few examples exist of RWH systems designed with stormwater management in mind [
21]. The selection of a combined system depends on various factors, including space availability, site topography, construction, and operation and maintenance considerations. This paper presents a framework for selecting and designing a combined system that utilizes a passive release mechanism for both stormwater management and water conservation. The recommended type and size of discharge outlets by Tsai et al. [
13] will be used in this study. In this context, the issues related to the integration of a rainwater-harvesting and stormwater-detention tank, focusing on (1) identifying and analyzing different alternatives for a combined system and (2) evaluating the benefits of these alternatives using short-term (design storms) and long-term continuous rainfall data, considering long-term operational policies.
2. Materials and Methods
2.1. Case Study and Tank Volume Requirements
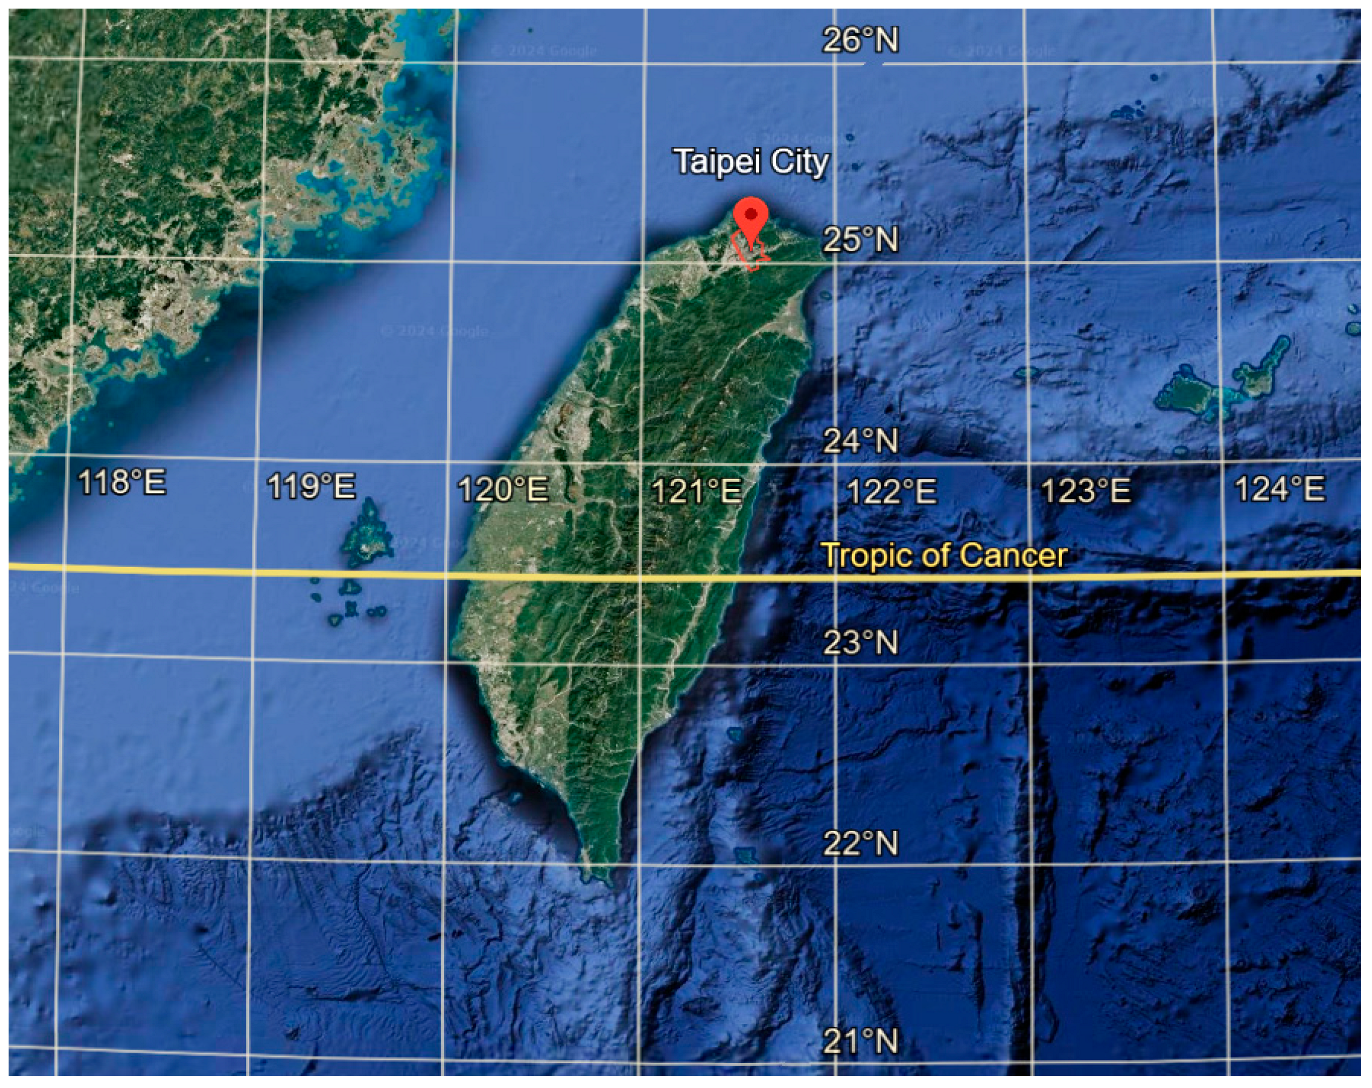
The study area selected for this research is Taipei City, the capital of Taiwan, which is located in the northern part of the island. Its location is shown in
Figure 1, which was visualized using Geographic Information System tools, specifically Google Earth (
https://earth.google.com/web/search/Taipei/, accessed on 7 January 2025). This region characterized by relatively high-level rainfall and a fairly balanced distribution of precipitation between the wet and dry seasons. The average annual rainfall is approximately 2368.5 mm, with a wet-to-dry ratio of about 6:4.
According to local regulations, stormwater-detention facilities are required for buildings with a total development area exceeding 300 square meters. Based on this, this study assumes a low-rise apartment building, which is three stories in height, with a total floor area of 300 square meters. Additionally, according to statistical data, the floor area of a single housing unit in Taipei is 99.14 m
2 [
22]. Therefore, there are approximately three households per floor, totaling nine households. The average number of people per household in Taipei is 3.01. Thus, the total number of residents in the building would be approximately 27 people. Each person’s daily potable water requirement is about 0.25 m
3, with rainwater providing about four-tenths of this demand, mainly for non-potable uses, such as irrigation, cleaning, and toilet flushing. This allows for a maximum allocation of 100 L of rainwater per person per day for these purposes [
2].
The storage tank volume required of the RWH systems in Taiwan is calculated based on the method provided by the Green Building Evaluation Manual—Basic Type (GBEM-BC) and is shown in the Equation (1) [
2]:
where
= the RWH system’s tank volume (m
3);
= the effective catchment area (m
2);
R = the average daily precipitation for the specified region (mm/day); and
= the number of storage days (days) applicable to that region. In the Taipei area,
R and
are 6.31 and 8.12, respectively [
2].
According to Taiwan’s regulatory standards [
23,
24], buildings undergoing new construction or renovation with a footprint exceeding 300 m
2 are required to incorporate SWD, providing 0.045 m
3 of storage per square meter of construction area. In the Taipei areas with more frequent flooding, they have a stricter requirement, which requires 0.078 m
3 per m
2 of storage capacity at construction area [
25] and is calculated by Equation (2).
where
= the SWD volume requirement (m
3);
= the construction area (m
2), which is equivalent to the effective catchment area (
) in this study.
2.2. Layouts of a Combined System
A typical domestic RWH tank in Taiwan can be installed at the ground level, semi-buried, or underground, operating through a combination of gravity and mechanical control. In the system, rooftop runoff is collected and directed to the RWH tank. From there, water is pumped to the rooftop distribution tank for storage and use. The stored rainwater is then distributed by gravity for applications such as toilet flushing or irrigation. If rainwater alone does not meet the demand, the municipal water supply automatically supplements it to ensure a reliable water supply.
An SWD tank can be installed above ground or underground, depending on the site size. For smaller sites, a single ground-level tank may suffice, while larger sites may require underground or multiple tanks. A single tank on a larger site would need to accommodate a larger stormwater volume and should be positioned at the downstream end of the internal drainage network.
In engineering, passive and active release refer to two methods of water discharge that differ in control, energy input, and design purpose. Passive release relies on natural forces, such as gravity or pressure differentials, to allow for water to flow without mechanical or electrical intervention. It is typically designed to activate automatically when certain conditions, such as a set water level, are met, without the need for dynamic control systems. In contrast, active release uses mechanical or electrical devices, such as pumps, valves, or automated systems, to regulate timing, the rate, or the volume of discharge. This method requires active management and an energy source, enabling precise control over water release. The distinctions between the two methods are summarized in
Table 1.
Passive release does not require additional mechanical or electrical components, making it easier to maintain than active release. Both the national regulations of the Standards for Permeable and Retention or Detention Facilities in Buildings by the WRA, the Ministry of Economic Affairs [
23], and the Building Technical Regulations—Building Design and Construction Chapter by the NLMA, the Ministry of the Interior [
24], prioritize passive release in the design of SWD systems. Therefore, this study adopts passive release as the discharge mechanism for the detention tank in the combined RWH and SWD system.
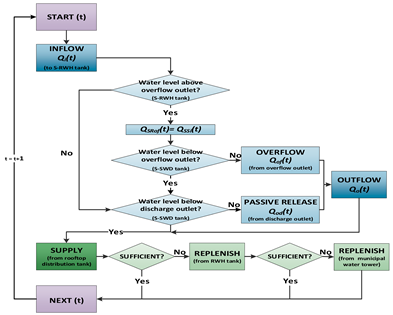
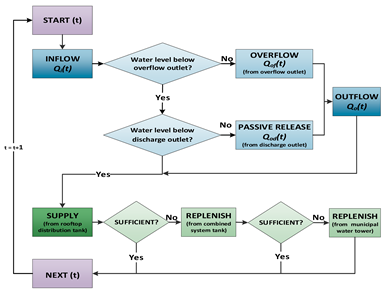
A combined RWH and SWD system with a passive release mechanism can be designed in series or parallel, depending on the construction requirements, as illustrated in
Figure 2.
In
Figure 2a, rainwater is collected and directed into the RWH tank, while excess water overflows into the SWD tank. In
Figure 2b, both the tanks are combined into a single unit, dividing the system into two sections: the designed detention volume and the designed retention storage volume. A passive discharge outlet is placed on one side of the tank’s wall, located at the boundary between the designed detention and retention volumes. The space below the outlet serves as rainwater storage for supply, while the space above functions for detention. Stormwater runoff held above the outlet is gradually released into the storm sewer system. In
Figure 2c, an enhanced parallel system is presented, where the discharge outlet is moved to the bottom of the tank, with a valve added to increase operational flexibility and maximize both water supply and stormwater detention benefits.
Based on Equations (1) and (2), both the RWH and SWD tank volumes and water demand were calculated for the case study shown in
Table 2.
2.3. Configuration of Discharge Outlet
The configuration of discharge outlets significantly impacts system performance. Tsai et al. [
13] examined three widely used types of gravity-fed passive discharge outlet in RWH systems: an orifice, a short stub fitting, and a drainage pipe. Discharge rate equations for each outlet type were derived, factoring in different diameters. Among all the outlet configurations, the short stub fitting consistently yielded the highest discharge rates, followed by the drainage pipe with lengths under 4 m. The short stub fitting is characterized by a discharge length from approximately 3 to 4 times larger than its outlet diameter. The peak flow mitigation performance across various diameters was assessed using a 5-year return period design storm in the Taipei area to determine the optimal outlet diameter. These findings were verified with observed hazardous rainfall events. The design of the discharge outlet diameter, in addition to aligning with domestic design standards, also considers local regulations on the maximum allowable discharge from building sites [
25]. Tsai et al. [
13] concluded that a 15 mm discharge outlet diameter for passive release is the most effective choice.
This study further compares these three types of outlet openings, considering the variables required in the discharge rate equations and the operational characteristics, as summarized in
Table 3. The results show that the short stub fitting requires fewer variables for discharge rate calculations and offers advantages in detention efficiency, cost-effectiveness, ease of operation, and maintenance. Therefore, in the following simulations of stormwater detention and water supply benefits, a 15 mm diameter short stub fitting outlet, paired with a valve for on/off operation, was used in the models.
2.4. Models Development
This study examines a combined rainwater-harvesting (RWH) and stormwater-detention (SWD) system with passive release, consisting of three configurations: series, parallel, and enhanced parallel systems. For the enhanced parallel systems, both the RWH and SWD volumes function as detention volumes when the valve at the discharge outlet is open. This approach is typically used and recommended during the wet season to manage stormwater and reduce the strain on downstream storm sewer systems. Conversely, when the valve is closed, the system operates in retention mode, capturing more rainfall for water supply during the dry season. To simulate RWH behavior, a conservative approach was applied using the Yield After Spillage (YAS) method [
26]. The mathematical simulation models for the series, parallel, and enhanced parallel systems are detailed in
Table 4, which includes inflow estimation, water balance calculations, outflow estimation, and a flowchart of the calculation process. Microsoft Office Excel was used to develop the model, with Visual Basic for Applications (VBAs) programming employed to assist in the decision analysis processes.
To evaluate the performance of the combined system in terms of flood reduction for short-term simulations, two dimensionless indexes are commonly used [
14]: the peak flow mitigation rate (
) and the peak flow lag time (
) difference.
represents the efficiency of the combined system in mitigating peak flow, measured against the peak inflow rate into the tank during a rainfall event, as outlined in Equation (3). A higher
indicates an enhanced ability of the system to mitigate peak flow.
where
= maximum inflow during a rainfall event;
= maximum flow of regulated stormwater release during a rainfall event.
represents the time lag between peak flow and maximum inflow during a rainfall event, as defined in Equation (4). A larger
value effectively alleviates the immediate pressure on the storm sewer system from rainwater inflow, highlighting the system’s stormwater management performance and serving as a critical reference in design. In this study,
was calculated using short-term rainfall event simulations. Hydrologic routing methods were employed to analyze inflow and outflow hydrographs, identifying the time delay between their respective peaks to determine
.
where
= point in time when peak inflow occurs during a rainfall event;
= point in time when peak regulated stormwater release occurs during a rainfall event.
For the long-term simulations, both water supply and stormwater detention effectiveness were considered. Therefore, three dimensionless indexes were used: volumetric reliability (), the stormwater retention ratio (ER), and the stormwater detention ratio (ED).
Volumetric reliability (
) is defined as the ratio of actual water supply to water demand. In this study, it was calculated annually and expressed mathematically in Equation (5) [
27].
where
= reliability of water supply (%);
= total actual rainwater supply (m
3); and
= total water demand (m
3).
The stormwater retention ratio
(ER) is defined as the ratio of total inflow minus overflow to total inflow. This study evaluated the long-term historical rainfall data on an annual basis; a higher value indicates better rainwater retention for supply and stormwater discharge regulation, as shown in Equation (6) [
28].
The stormwater detention ratio (
ED) is defined as the ratio of total outflow (including both overflow and discharge from the outlet) minus overflow to total outflow calculated on an annual basis. A higher value indicates the better regulation of stormwater discharge, as expressed in Equation (7) [
13].
2.5. Climate Data
To assess and compare the performances of the three different types of the combined system, firstly, this study used short-term design storms with selected return periods to simulate and compare the stormwater reduction effectiveness. Then, long-term continuous rainfall data were used to simulate and analyze the rainwater utilization performance and stormwater reduction effectiveness.
Since the design capacity for SWD in Taipei is based on a 5-year return period rainfall event, and considering the impact of climate change and the growing occurrence of extreme rainfall events, it is expected that the return period will progressively rise to 10 years in the next decade [
29,
30,
31]. Consequently, the simulations in this study consider design storms with return periods of 5, 10, and 25 years, each having a rainfall duration of 120 min and 5 min time intervals. The design storm profiles were derived using the Horner rainfall intensity formula [
31]:
where
= the amount of rainfall at time
t (mm/5 min); and
= the period of rainfall (min); and
,
b, and
c are as follows [
31]:
5-year return period: a = 2729.325, b = 41.824, c = 0.756;
10-year return period: a = 2997.153, b = 47.103, c = 0.756;
25-year return period: a = 3123.763, b = 50.880, c = 0.754.
To structure the rainfall events used in the simulations, this study employed the widely applied Alternating Block Method (ABM), a technique commonly used in hydrological engineering. The ABM arranges the design rainfall intensities into a time distribution that reflects realistic temporal rainfall patterns. This method ensures that the simulations accurately capture the stormwater detention performance under different system configurations. By aligning the constructed rainfall events with regional hydrological practices, the reliability of performance evaluations is enhanced, providing a robust basis for assessing the systems’ effectiveness.
The historical rainfall data for this study were sourced from the Central Weather Bureau, the Ministry of Transportation and Communications [
32]. The dataset includes continuous precipitation records from a gauging station in northern Taipei, positioned approximately 5.3 m above sea level. This station measures rainfall with a 1 h resolution and an accuracy of 0.2 mm. The long-term simulation for water supply and stormwater management effectiveness used data from 2014 to 2023. To minimize the influence of negligible rainfall events on the analysis, while still accounting for smaller precipitation amounts relevant to hydrological processes, a rainfall threshold of 1 mm was established to more accurately represent effective rainfall events. In the segmentation of long-term continuous rainfall events, a rainfall event is defined as starting when the hourly amount of rainfall exceeds or equals 1 mm. The event is considered to end when the subsequent hourly rainfall remains below 1 mm for three consecutive hours. The period from the identified start time to the end time is classified as a single rainfall event.
2.6. Simulation Parameters
2.6.1. Short-Term Simulation
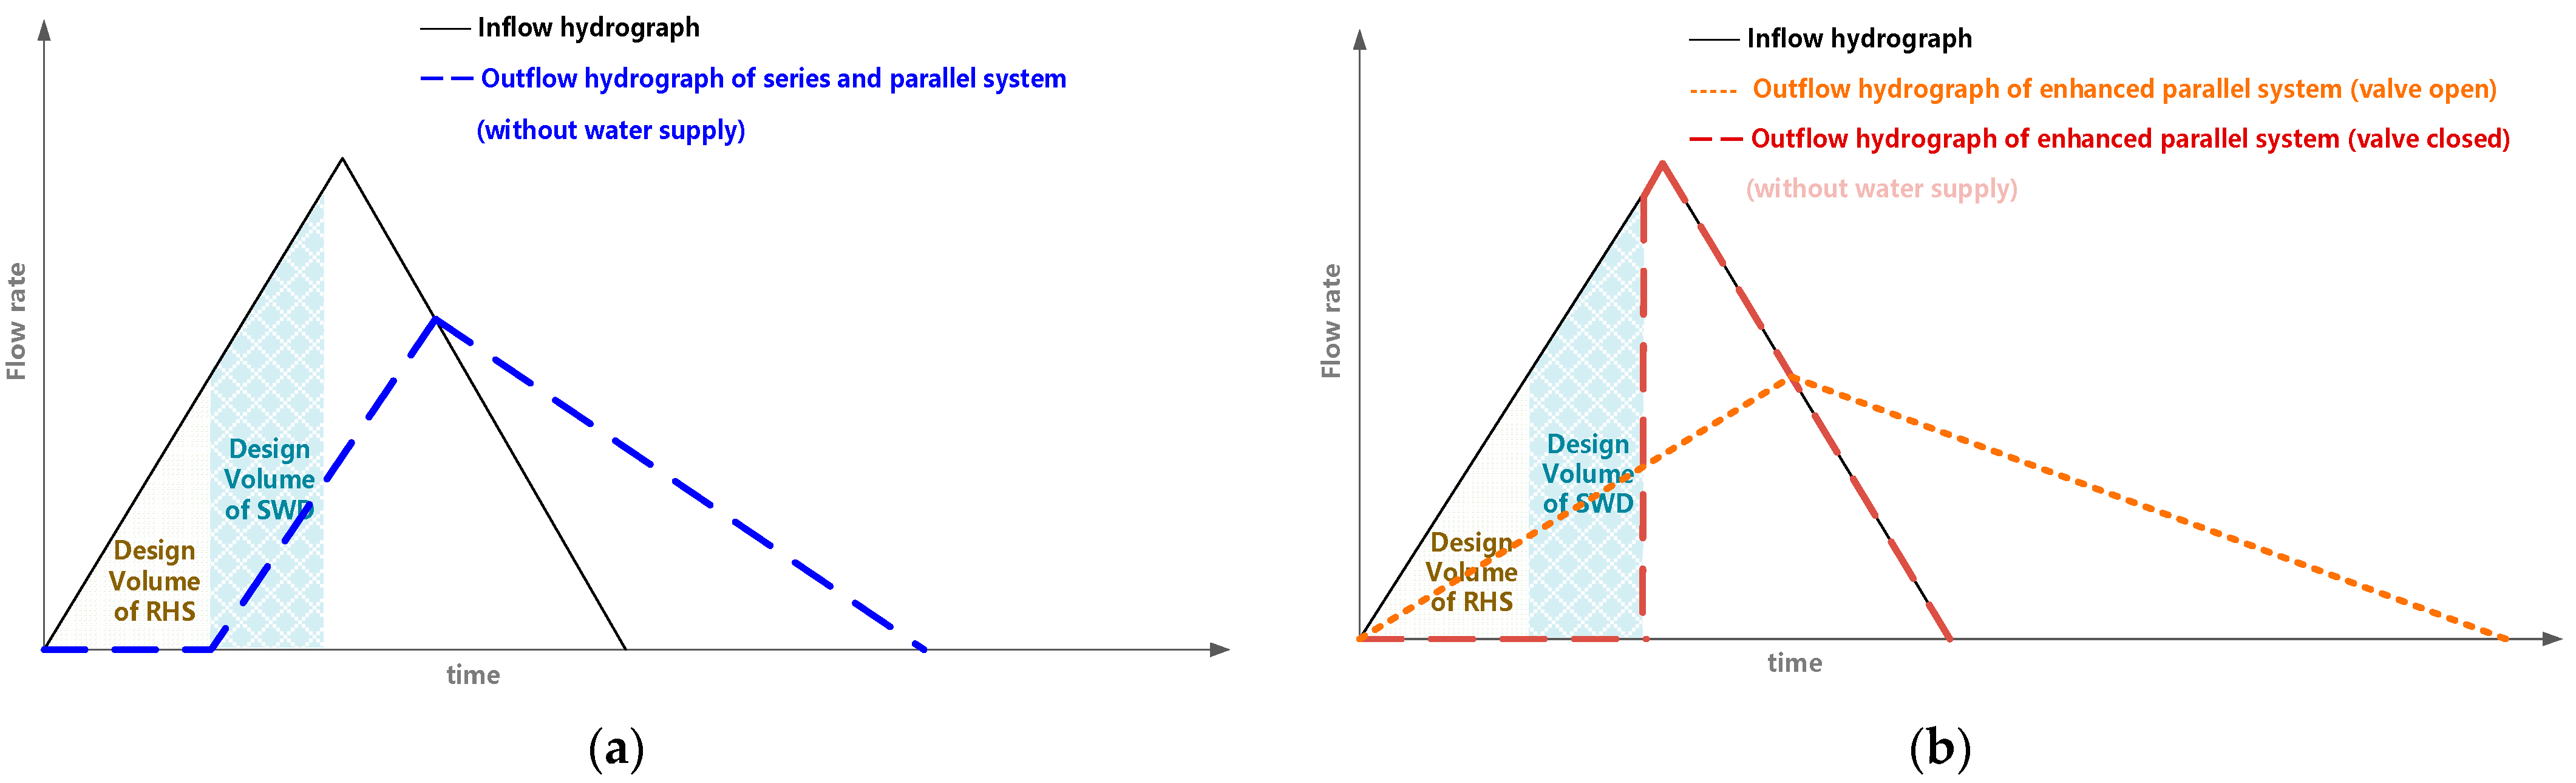
The short-term design storm simulations focus primarily on comparing the stormwater detention performances of the three combined systems, with the water supply performance excluded from consideration. In practice, variations in rainfall intensity and temporal distribution make it challenging to standardize outflow representation. To address this, this study employed a simplified triangular hydrograph for illustration, deliberately excluding factors such as flow variations influenced by water levels, overflow timing, the runoff concentration time, time lag, and other complex variables. Discharge hydrographs for the series and parallel systems are shown in
Figure 3a. The enhanced parallel system equipped with a valve offers greater flexibility by allowing the tank space to switch between water supply and stormwater detention. Therefore, the performance under both valve-on and valve-off conditions is examined in the short-term design storm simulations. The corresponding discharge hydrographs for these conditions are presented in
Figure 3b.
To summarize the methodology, the calculation parameters used for the short-term design storm simulations across the series, parallel, and enhanced parallel systems are detailed in
Table 5.
The short-term simulations were conducted using design storms with return periods of 5, 10, and 25 years for the three combined systems, series, parallel, and enhanced parallel systems with valve on/off conditions (E. parallel-valve closed system with the valve closed, and E. parallel-valve open system with the valve open). In general, the system’s performance in short-term simulations is influenced by the initial conditions of the tanks. Therefore, four scenarios based on different initial tank volumes were examined, as outlined below:
Scenario 1 (S1): Drought scenario—The tank is initially empty of water;
Scenario 2 (S2): Normal scenario—The tank is initially filled to half of its designed RWH capacity;
Scenario 3 (S3): Intermittent rainfall scenario—The tank is initially filled to its full RWH design capacity;
Scenario 4 (S4): Continuous rainfall scenario—The tank is initially filled to its full RWH design capacity, and the SWD tank is half-full.
2.6.2. Long-Term Simulation
The operation of the series and parallel systems in long-term simulations primarily relies on the passive operation of the initial design, requiring no active intervention. In contrast, this study also examines the enhanced parallel system, which accounts for the effects of valve operation. The valve operation plan is developed based on the local climate characteristics and relevant regulations. The performances of both water supply and stormwater mitigation were assessed.
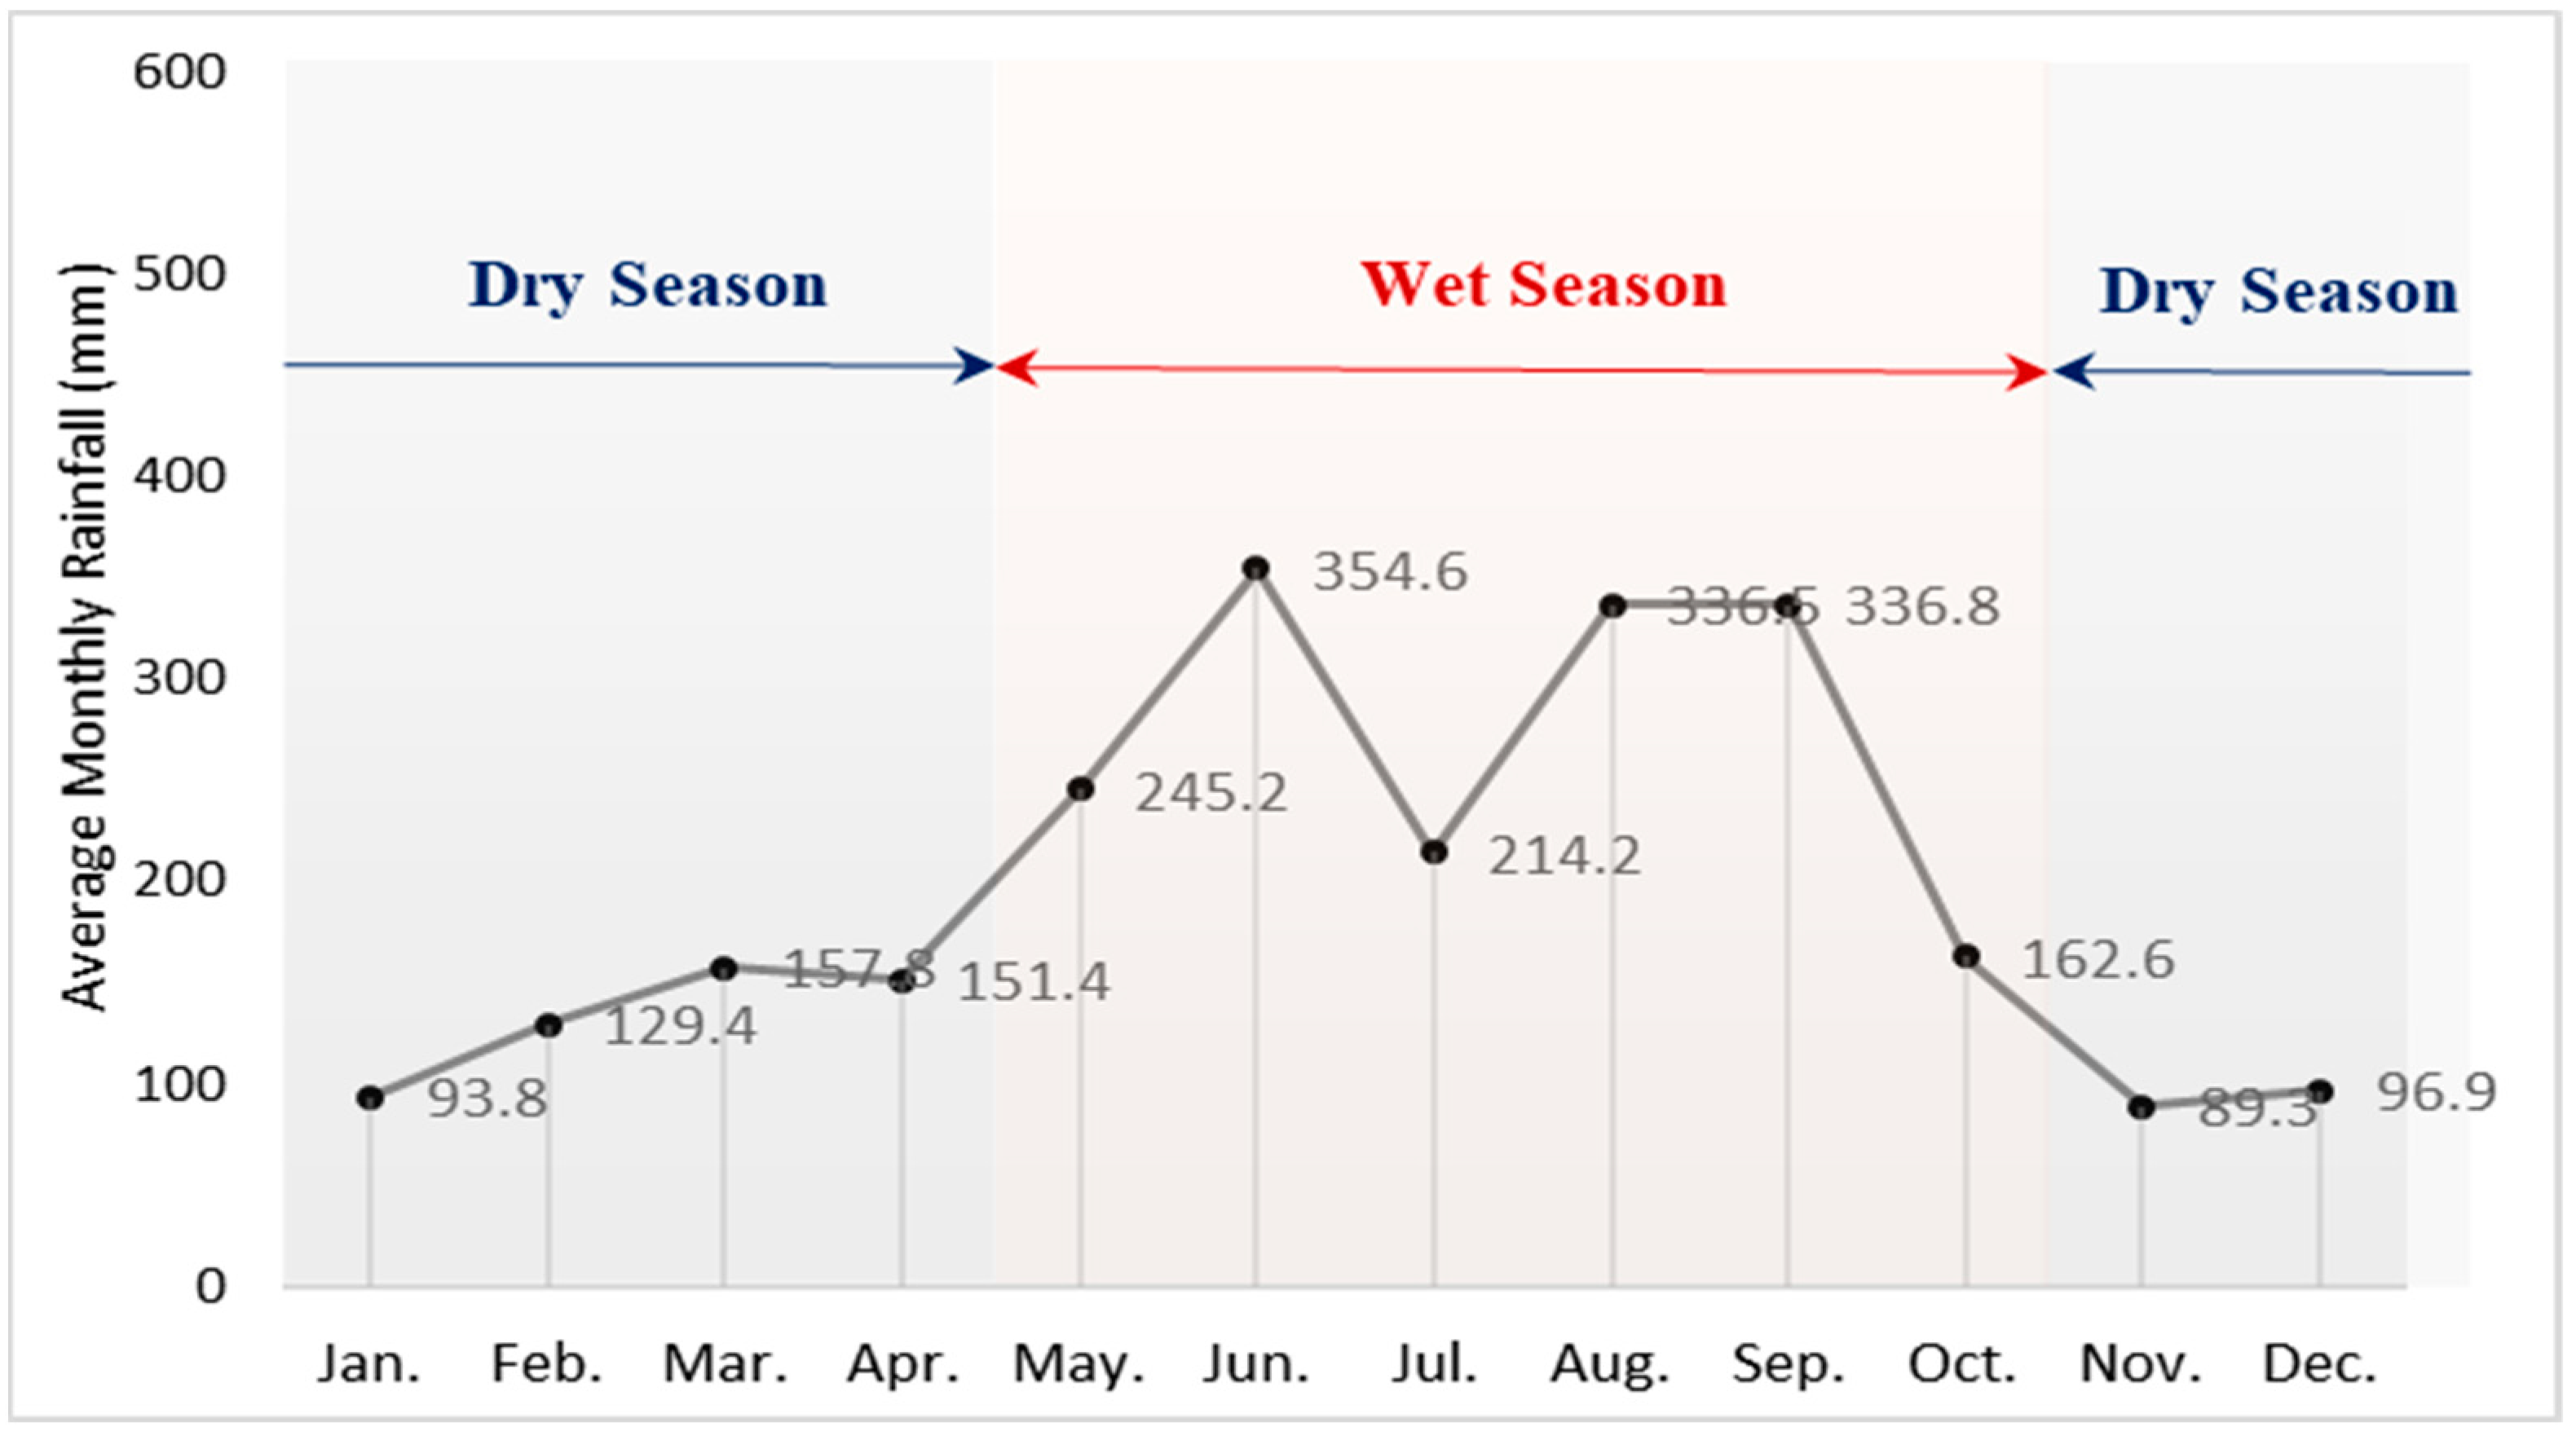
Taiwan experiences uneven rainfall distribution throughout the year. For example, in Taipei City, the wet season occurs primarily from May to October, while the dry season spans from November to April.
Figure 4 [
32] illustrates the rainfall distribution chart for the wet and dry seasons in Taipei rain gauge station. Based on this variation, the valve can be adjusted accordingly in the enhanced parallel system. For long-term continuous rainfall simulations, the enhanced parallel system with valve operation according to the dry and wet seasons is treated as plan 1 (E. parallel-P1).
For plan 2 (E. parallel-P2), the operation rule follows the regulatory guidelines for SWD facilities, which require building managers to empty the SWD tank prior to rainfall events exceeding a certain torrential rainfall intensity, or when a typhoon warning is issued [
33]. Rainfall events exceeding this torrential intensity are classified into three categories based on rainfall intensity, torrential rainfall (TR), severe torrential rainfall (STR), and extreme torrential rainfall (ETR) [
34], as shown in
Table 6. Based on this classification, nine TR events and one severe STR event were identified from the continuous rainfall records between 2014 and 2023, as presented in
Table 7.
The number, duration interval, name, and intensity of typhoons at the time of the typhoon warning announcement from 2014 to 2023 [
35] were compiled and are presented in
Table 8.
The calculation parameters for the long-term continuous rainfall simulations are summarized in
Table 9.
3. Results and Discussion
3.1. Performance of Stormwater Detention in Short-Term Simulations
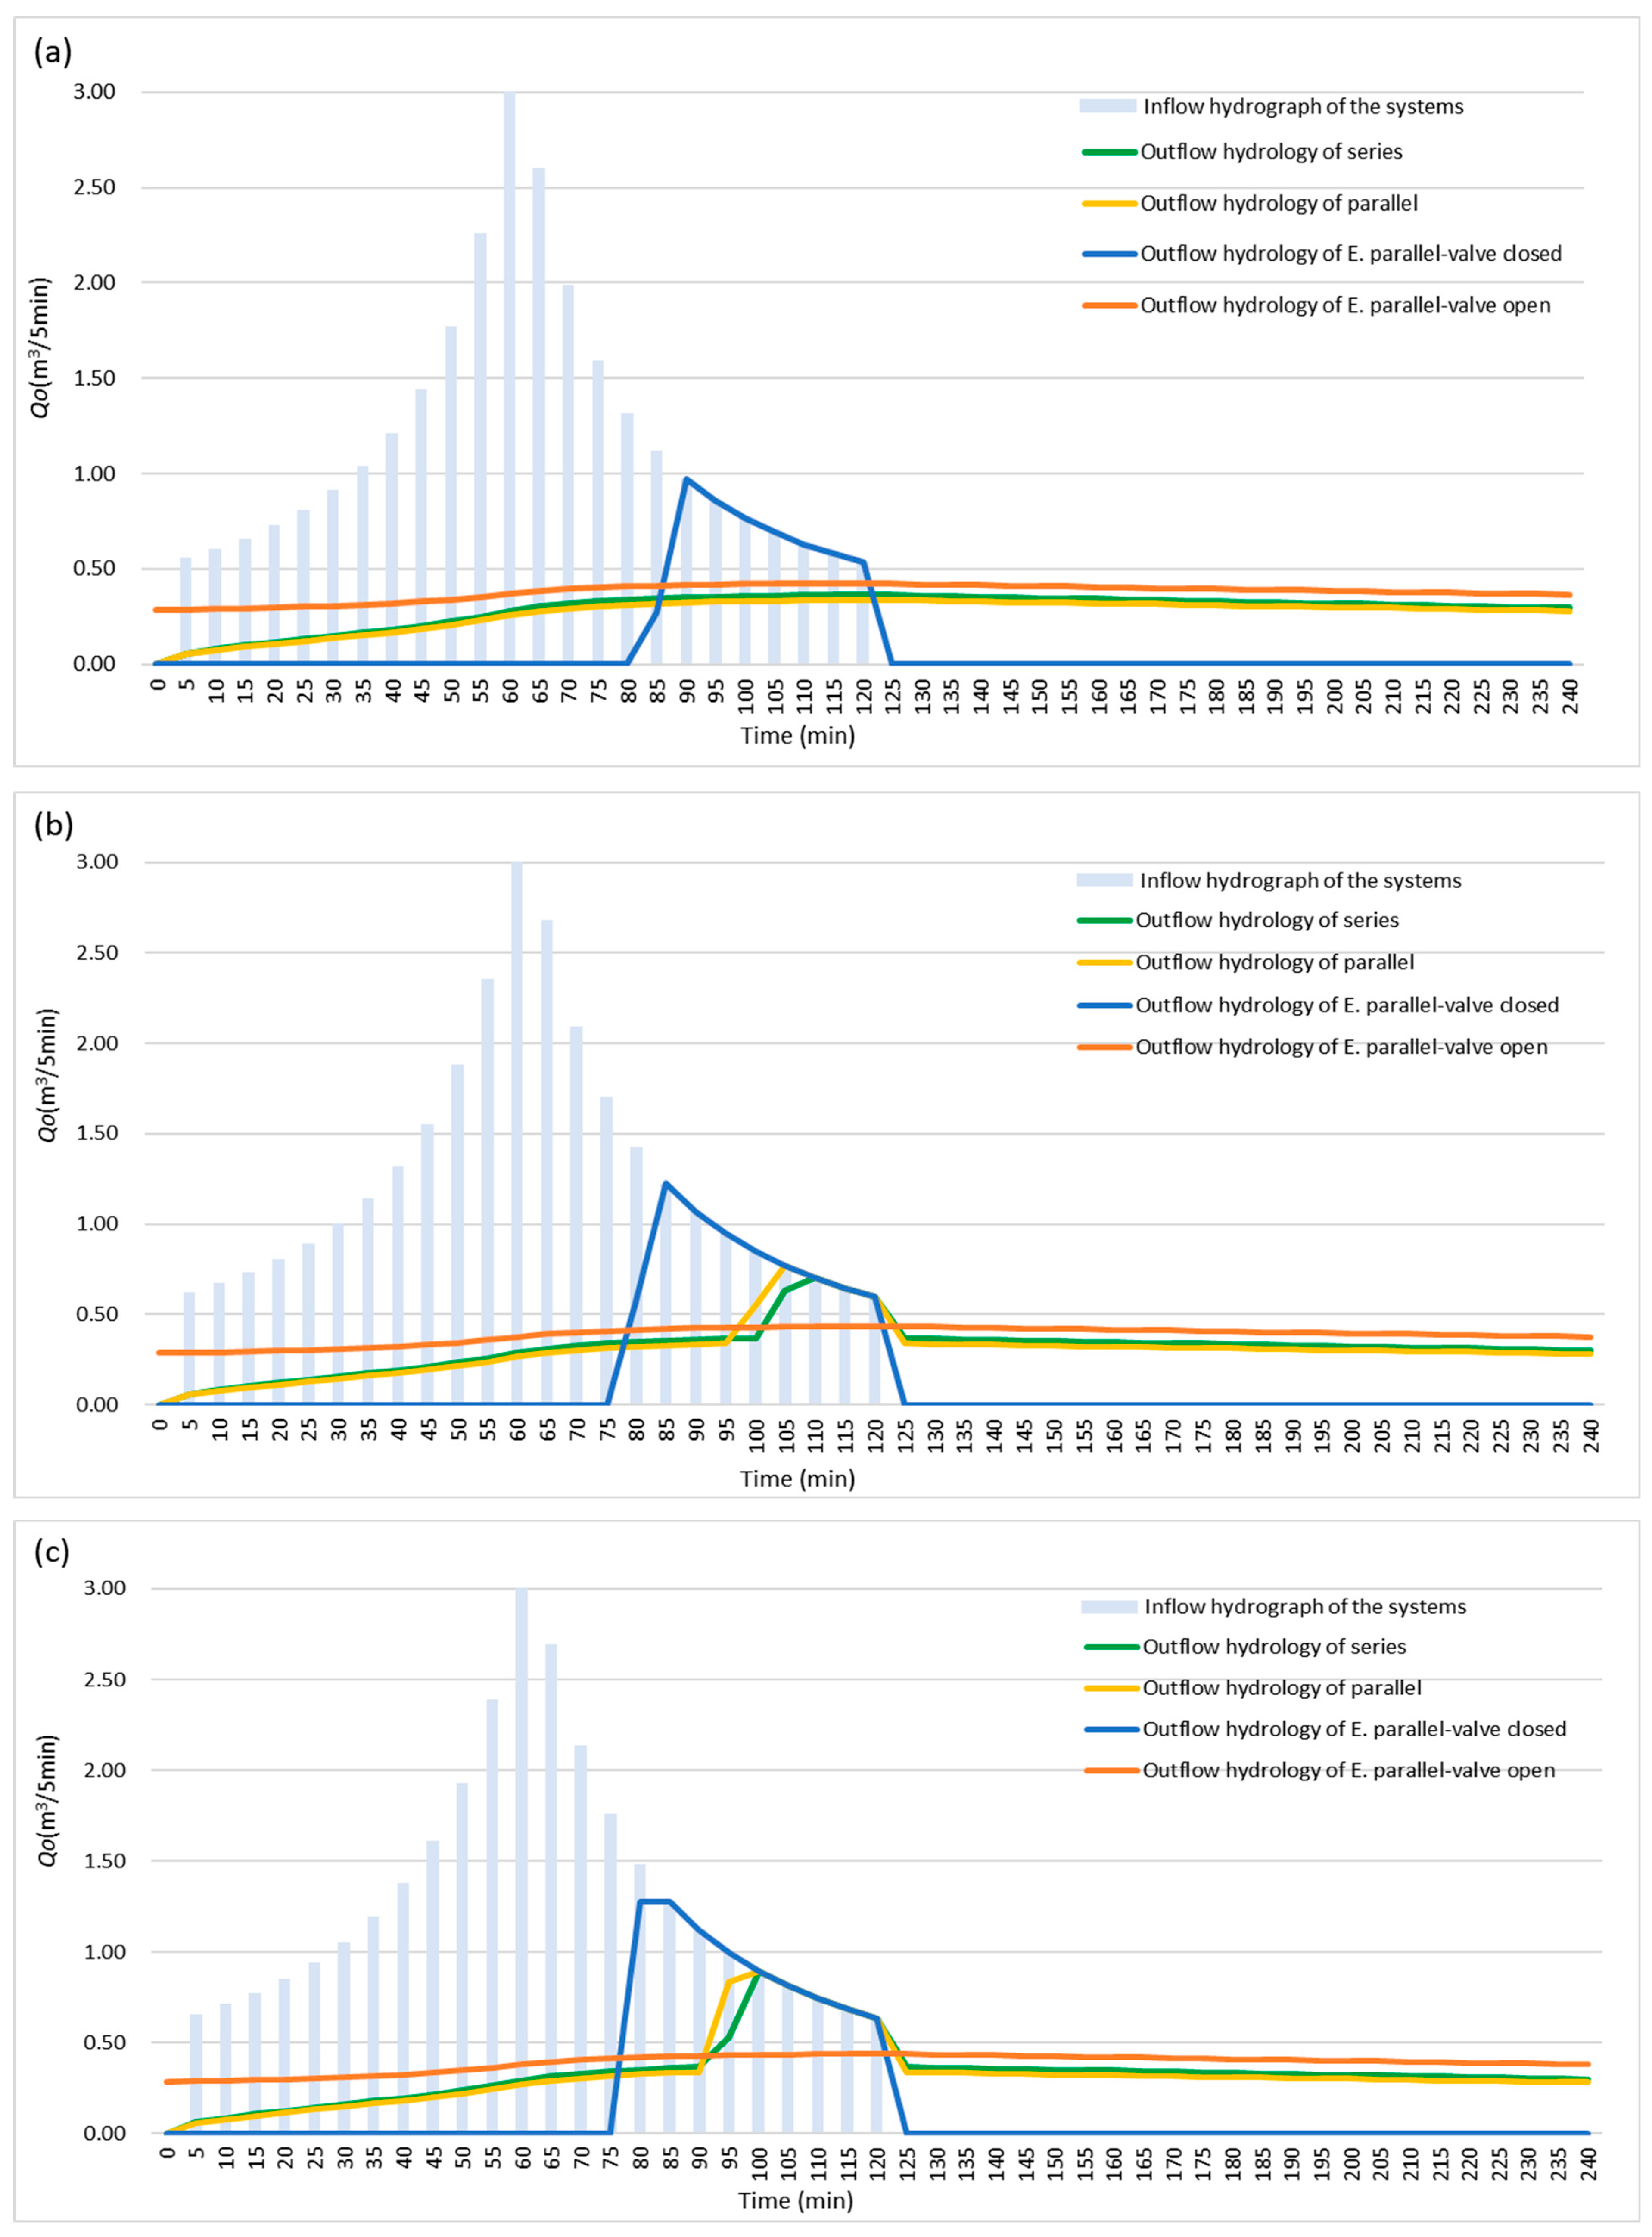
Since short-term simulations consider various system combinations, design storms, and initial condition scenarios, there are numerous results. Therefore, for the discussion of hydrographs, Scenario S3 is used as an example. Simulated outflow hydrographs for the three systems under the different return period design storms are presented in
Figure 5a,
Figure 5b, and
Figure 5c, respectively.
The bar charts with a light blue color in the figures represent the inflow hydrograph of the systems. The outflow hydrographs consist of two components: overflow and discharge from the outlet. A smooth outflow hydrograph indicates that outflow is caused solely by the discharge outlet. Otherwise, both overflow and outlet discharge are involved. In
Figure 5a, neither the series nor the parallel systems experience overflow. However, in
Figure 5b,c, overflow occurs in the middle part of the curves. From
Figure 4, both the systems show significant peak flow reduction and delays across all the design storms. Among the three parallel systems, which include two enhanced parallel systems, the enhanced parallel system with the valve open consistently produces a smoother outflow hydrograph and delivers the best stormwater detention performance for all the design storms. Overall, the enhanced parallel system outperforms the parallel system. The enhanced parallel system with the valve closed can fully retain inflow during the early stages, but exhibits higher peak outflow once the retention capacity is filled. This demonstrates that the enhanced parallel system can improve both the retention and stormwater detention performances through valve on/off operation.
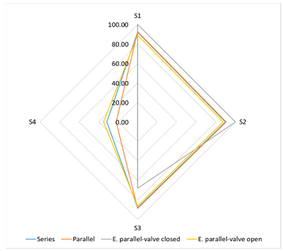
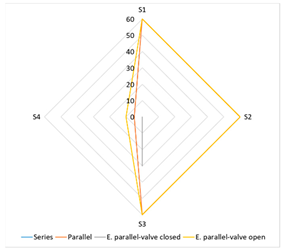
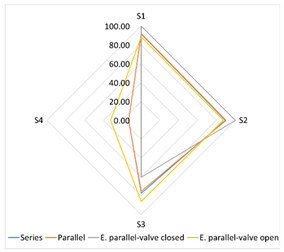
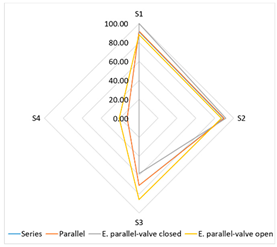
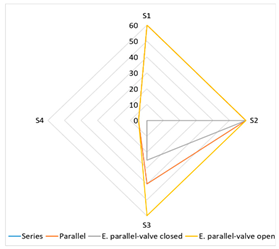
To further clarify the complexity of the simulation results for various combinations, the peak flow mitigation rates and the peak flow delay times are presented in radar charts, along with quantitative assessment indicators for the different return periods of design storms, as shown in
Table 10,
Table 11 and
Table 12.
The results presented in
Table 10,
Table 11 and
Table 12 indicate that the stormwater detention performances of all the combined systems are significantly influenced by the initial water volume in the tanks. The efficiency of peak flow mitigation rates and lag times decreases progressively from scenarios S1 to S4.
For the 5-, 10-, and 25-year return period design storms, the series and parallel systems exhibit a nearly identical performance. In scenarios S1 and S2, both the systems achieve approximately 90% peak flow mitigation and a lag time of 60 min. In scenario S3, the mitigation rate decreases to around 70–80%, with the lag times ranging from 40 to 60 min. By scenario S4, the performance deteriorates further, with the mitigation rates dropping to 10–30% and the lag times reduced to about 5 min.
The enhanced parallel system with the valve open outperforms the series and parallel systems in scenarios S3 and S4. Notably, under scenario S4, where the series and parallel systems show minimal detention effectiveness, the enhanced parallel system with the valve open achieves a peak flow mitigation rate of up to 30% and a lag time of 10 min. In contrast, the enhanced parallel system with the valve closed performs poorly in scenarios S3 and S4, with a peak flow mitigation rate of 0% and no delay effect observed in scenario S4. However, this system demonstrates significant advantages in scenarios S1 and S2, achieving 100% peak flow mitigation. It effectively prevents overflow and retains more rainwater for future use.
3.2. Performance of Water Supply and Stormwater Detention in Long-Term Simulations
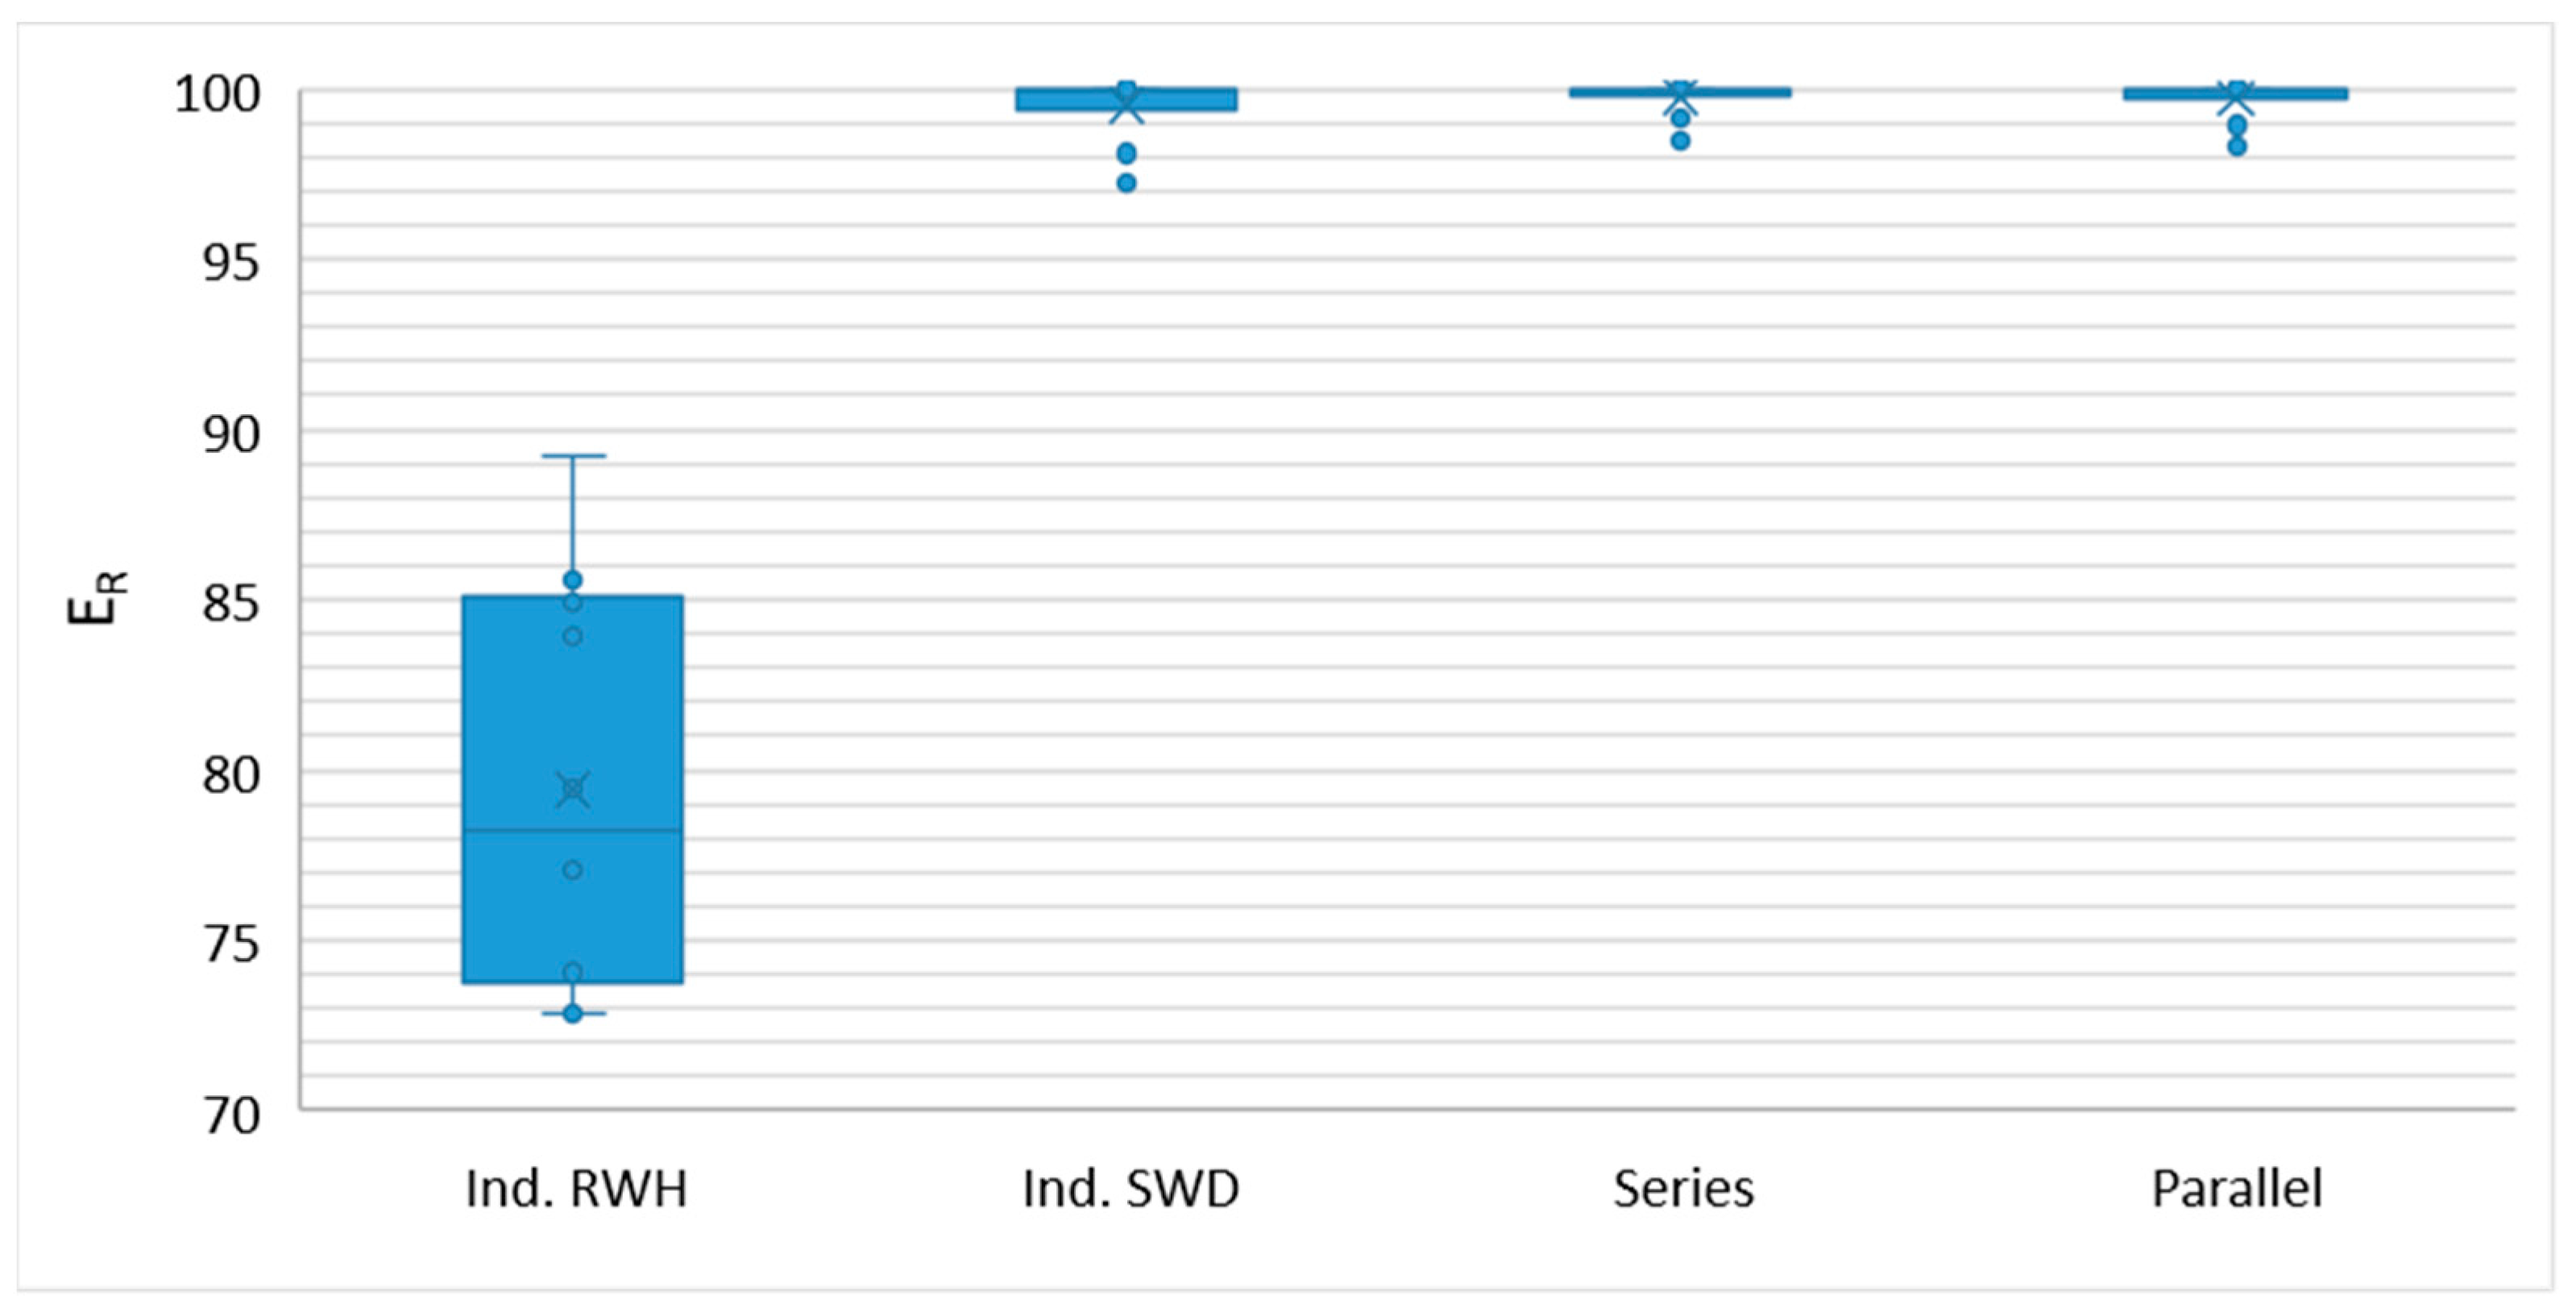
The annual stormwater retention ratio (
ER) for independently designed rainwater-harvesting (Ind. RWH) systems, stormwater detention (Ind. SWD) systems, and the combined series and parallel systems was evaluated through long-term simulations from 2014 to 2023. The annual
ER values, based on historical rainfall data over a 10-year period, are presented in box plots, as shown in
Figure 6. The results indicate that the Ind. RWH system, primarily designed for water supply rather than stormwater detention, has relatively lower
ER values, ranging from 72.8% to 89.2%, compared to those of the other systems. In contrast, the Ind. SWD, series, and parallel systems exhibit high
ER values, approaching nearly 100%. While the Ind. SWD system effectively regulates stormwater discharge, it does not provide water supply benefits. As a result, it lacks the dual functionality offered by the series and parallel systems.
The box plot analysis in
Figure 6 highlights that the series and parallel systems demonstrate similar
ER variations. Both the systems achieve higher
ER values with smaller variation ranges compared to those of the Ind. RWH and SWD systems. These findings suggest that the series and parallel systems provide a more effective solution for stormwater management, successfully combining the stormwater detention and rainwater harvesting benefits.
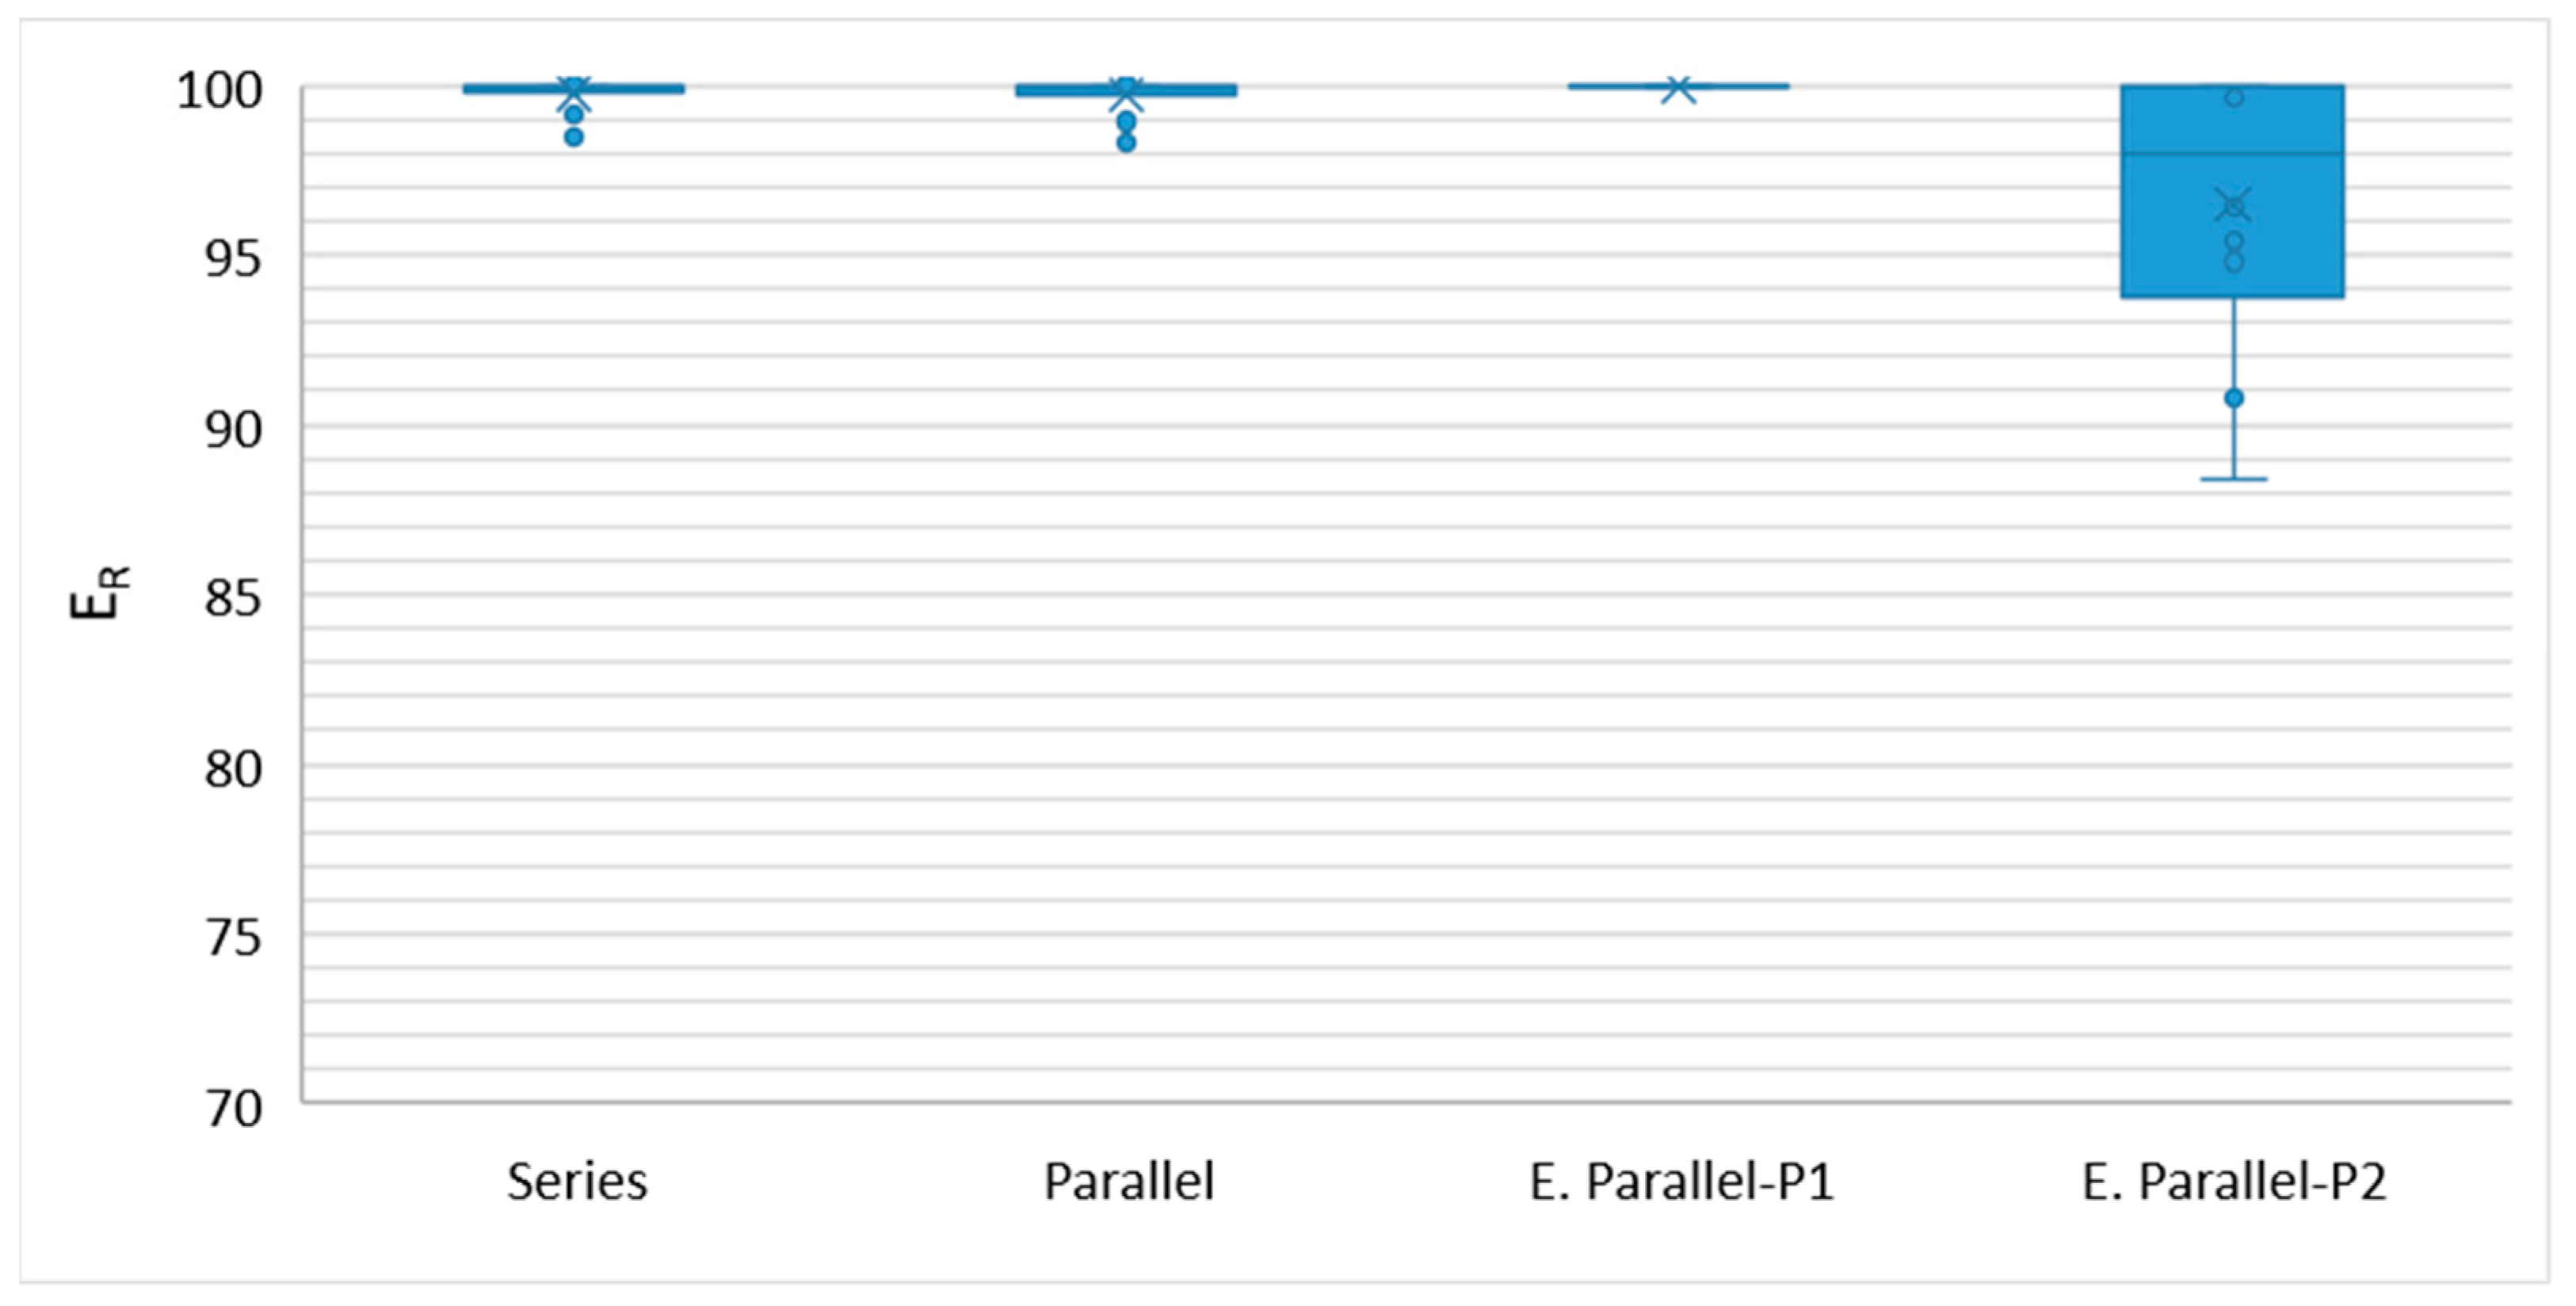
Additionally,
Figure 7 illustrates the annual
ER values for three combined systems, including the series, parallel, and enhanced parallel systems under plan 1 and plan 2 over the same long-term simulation period. The enhanced parallel system under plan 1 (E. parallel-P1), which integrates valve operation tailored for wet and dry seasons, demonstrates the highest
ER values and the smallest data variation among the three systems. Conversely, the enhanced parallel system under plan 2 (E. parallel-P2), designed to operate with the valve open prior to torrential rain or typhoon warnings, shows a comparatively poorer
ER performance.
However, the stormwater retention ratio (
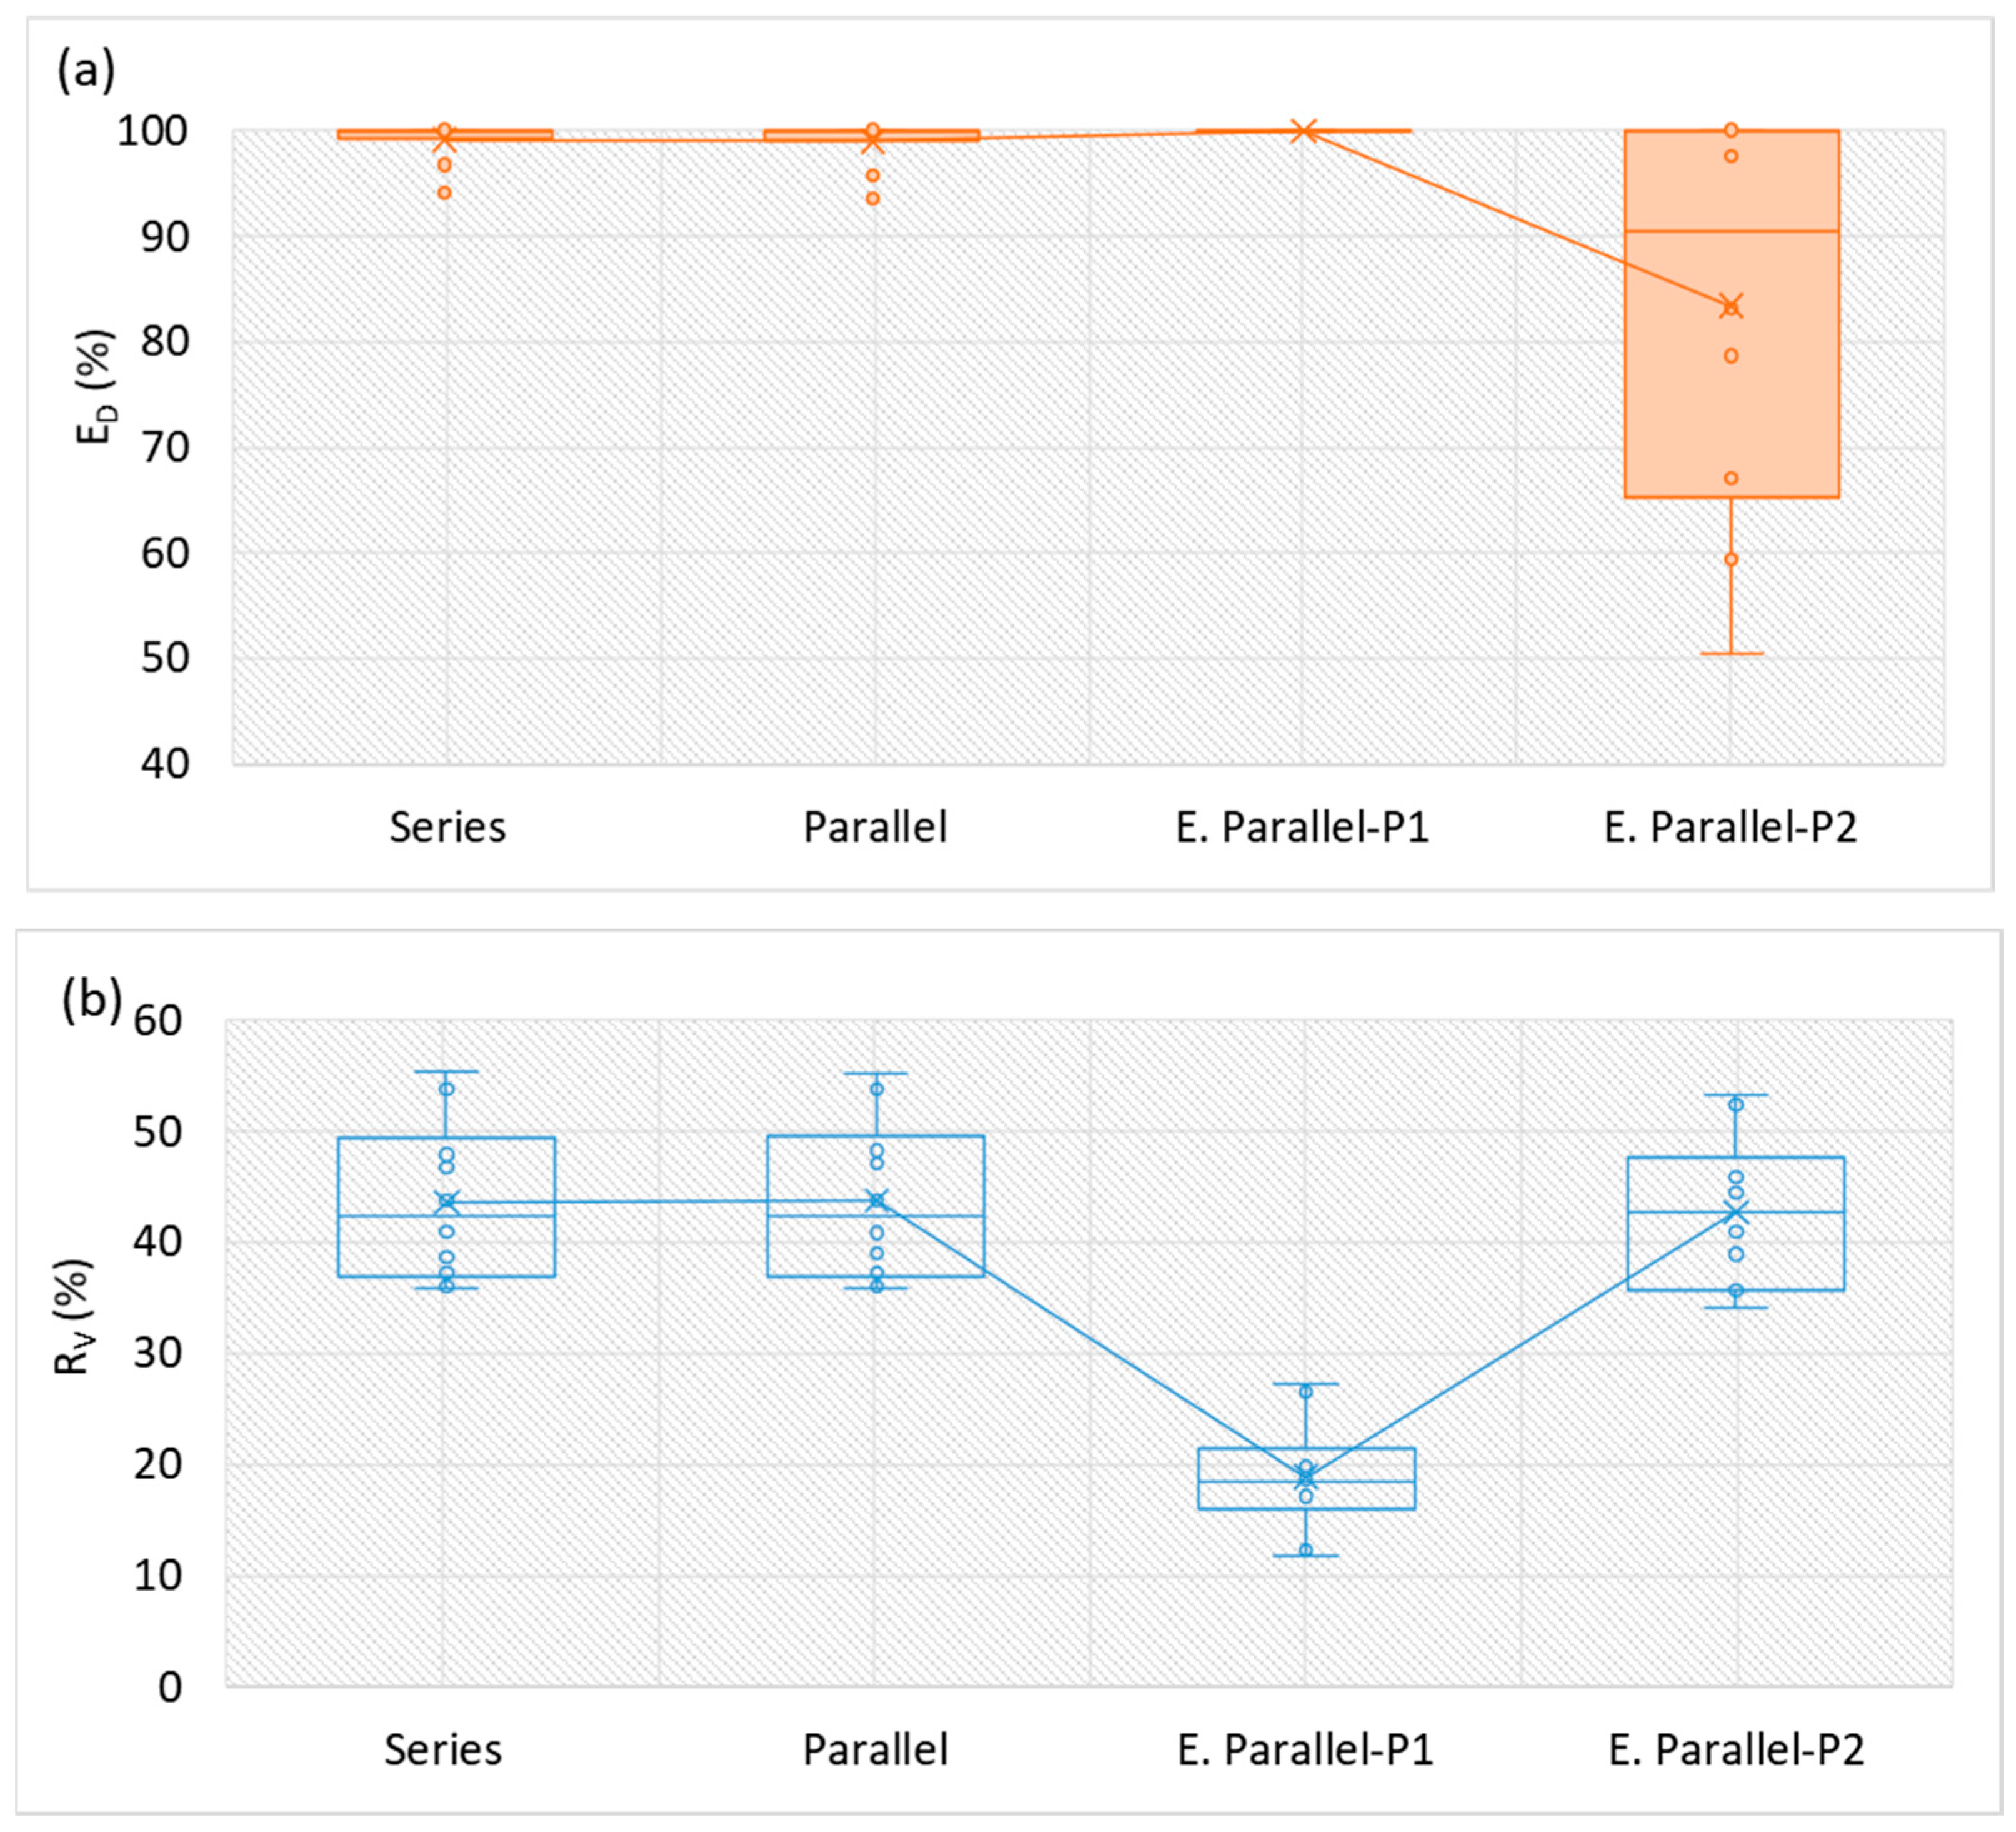
ER) accounts only for the volume of retained stormwater, excluding overflow, and does not effectively differentiate between stormwater detention and rainwater harvesting for water supply. To address this limitation, this study also evaluates the annual stormwater detention ratio (
ED), and annual water supply volumetric reliability (
) was analyzed to evaluate the performance of stormwater retention and water supply reliability for the three combined systems using historical rainfall data over a 10-year period. The results are presented in box plots, as shown in
Figure 8a,b.
The long-term continuous rainfall event simulations show that the parallel system does not provide the expected advantage in utilizing stormwater detention volume for water supply, resulting in higher values compared to those of the series system. In fact, both the systems perform similarly in terms of stormwater detention and water supply reliability. This outcome may be due to the fact that over the course of the simulations, the rainfall events rarely exceeded the design volume of the RWH, except during very large rainfall events, which had a minimal impact on the long-term performance of both the series and parallel systems.
When examining the changes in stormwater detention ratio (
ED) and water supply volumetric reliability (
) with valve operation for the E. parallel-P1 and E. parallel-P2 systems, the E. parallel-P1 system shows a better
ED performance in
Figure 8a, consistent with the
ER value in
Figure 7. However, neither the E. parallel-P1 nor E. parallel-P2 systems demonstrate the anticipated improvements in
ED and
compared to those of the parallel system without valve operation.
Additionally, the significant decrease in water supply volumetric reliability for the E. parallel-P1 system is primarily due to its operational plan, which discharges most of the rainwater flowing into the system during the wet season. With limited rainwater storage during the dry season and insufficient storage during the wet season, water supply efficiency is reduced, leading to a decrease in water supply volumetric reliability. This likely explains the improvement in stormwater detention performance, but the significant decline in water supply volumetric reliability () for the E. parallel-P1 system. For the E. parallel-P2 system, valve operation did not improve the water supply or the stormwater detention performance. This is mainly due to the timing of the valve operation, which often fails to predict rainfall events accurately following typhoon warnings. Additionally, there are limited instances of heavy rainfall events. Therefore, the design of the E. parallel-P2 system is not recommended.
Based on the simulation results and analysis,
Table 13 presents the key factors influencing the design selection of the three combined systems: series, parallel, and enhanced parallel (plan 1 and plan 2).
From
Table 13, it is clear that the parallel system offers several advantages over the series system, including a smaller installation space, lower setup costs, and easier maintenance. Additionally, the parallel system outperforms the enhanced parallel systems in both water supply and stormwater detention, even without any additional valve operation. Therefore, the parallel system is recommended as the optimal approach for combining rainwater-harvesting and stormwater-detention tank volumes in practical applications in Taipei. For implementation in different regions, combined system design should be tailored to key factors, such as the available installation space, the building characteristics, and the local precipitation patterns (e.g., wet and dry season characteristics and heavy rainfall events), ensuring the most suitable solution based on these considerations.
4. Conclusions and Recommendations
The challenges of water scarcity and extreme rainfall events in Taiwan are becoming more pronounced, largely due to climate change and continued urbanization. Promoting RWH and SWD policies has emerged as an effective strategy for managing urban stormwater. The integration of RWH and SWD systems to enhance both water supply and the stormwater detention benefits is a critical topic gaining international attention. Among the available solutions, passive release mechanisms offer a simple, cost-effective approach, making them particularly suitable for Taiwan, especially for household-level applications. This study proposes a passive release design that combines the RWH and SWD systems, encompassing series, parallel, and enhanced parallel configurations, and aligns with local regulatory requirements for application in new building designs. This study also compares the characteristics, advantages, and limitations of passive versus active release systems. Passive release relies primarily on flow control devices and system design, eliminating the need for additional mechanical equipment or energy consumption. Gravity-driven passive release is identified as the preferred method for RWH and SWD designs in Taiwan due to its simplicity and cost-effectiveness. For the passive release discharge outlet, this study draws on recommendations from the relevant literature to evaluate the discharge rates, the variability requirements, and the operational characteristics. Based on these assessments, a 15 mm diameter short stub fitting is identified as the optimal design for this study.
Short-term design storm simulations based on 5-, 10-, and 25-year return period events were conducted under four initial tank water level scenarios: S1 (drought), S2 (normal), S3 (intermittent rainfall), and S4 (continuous rainfall). The results showed that the series and parallel systems delivered a comparable and satisfactory performance. In S1 and S2, the enhanced parallel system with the valve closed demonstrated the best performance, effectively mitigating peak flow by 70–90% and achieving lag times of 40–60 min in S1–S3. However, in S4, the peak flow mitigation rate dropped to 10–30%, with a lag time of only around 5 min. The enhanced parallel system with the valve closed performed best in S1 and S2, achieving 100% rainwater retention, surpassing the other systems. Nevertheless, its effectiveness declined significantly in S3 and S4, with no peak flow mitigation and lag time observed in S4. On the other hand, when the valve was open, the enhanced parallel system improved peak flow mitigation by 20–40% and achieved a lag time of 5–10 min in S4, but performed worse in S1 and S2, with only 80–90% peak flow mitigation, which was noticeably less effective than that when the valve was closed. For the long-term simulations, the continuous rainfall data from 2014 to 2023 were analyzed, comparing the performance of the independent RWH and SWD systems with the combined systems (series, parallel, and enhanced parallel configurations). The enhanced parallel system was evaluated under two valve operation plans, plan 1, which differentiated dry and wet seasons, and plan 2, which operated the valve before rainfall events exceeding a certain torrential intensity or typhoon warnings. The results revealed that the series and parallel systems provided similar outcomes, offering the best performance in both water supply and stormwater detention, achieving 98–100% ER values, surpassing the independent systems. In contrast, while the enhanced parallel system under plan 1 achieved close to 100% ED values, delivering the best stormwater detention performance among all the configurations, but exhibited the poorest water supply performance, with Rv values only 10–30% compared to 35–55% for the series and parallel systems. Plan 2, involving frequent valve adjustments, resulted in the weakest overall performance, with ED values ranging from 50% to 100%, showing more instability compared to that of the other combined systems.
In summary, the results of both the short-term and long-term simulations further underscore the advantages of the series and parallel systems. These systems consistently delivered a reliable performance without requiring additional operational adjustments. Although the enhanced parallel system optimized stormwater detention in the short-term simulations by adjusting the valve (open or closed) under different initial water levels, its long-term performance during continuous rainfall events was less consistent. Only under valve operation Plan 1 did the enhanced parallel system improve stormwater detention efficiency, but this improvement came at the cost of significantly reduced water supply efficiency. In contrast, the series and parallel systems maintained a better balance between the water supply and stormwater detention benefits. The parallel system, in particular, stands out for its additional advantages over the series system, including a reduced installation space, lower setup costs, and simpler maintenance. Therefore, it is recommended to prioritize the parallel system design in new buildings to achieve optimal efficiency and practicality for the dual purpose of both rainwater supply and stormwater detention. If the priority is enhancing the stormwater detention performance, and reducing rainwater utilization efficiency is acceptable, the enhanced parallel system should be considered. This system improves detention capacity during the rainy season through valve operation under plan 1.
As climate change progresses, longer droughts and more frequent heavy rainfall events are increasing both water scarcity and flood risks. To enhance the performance of rainwater-harvesting and stormwater-detention systems, combining these two systems is an effective strategy. This approach improves stormwater detention during heavy rainfall events, while ensuring long-term water availability, offering a flexible solution to climate change challenges. However, the actual performance of the water supply is significantly influenced by the specific water usage patterns and supply demands of different buildings. Additionally, regional differences in flood discharge regulations and rainfall patterns require further research and policy development to design more precise integrated system operations. For instance, adjusting the outlet diameters to meet the local discharge regulations, or implementing valve-controlled systems in areas facing water shortages or frequent flooding could optimize the system performance. These systems require the precise control of discharge timing for effective operation. Therefore, future research should focus on developing or integrating rainfall prediction mechanisms, including forecasting event timing and rainfall volumes and improving the integration of information and communication technologies (ICT). Such advancements will enable the combined system to operate more efficiently, improving both the water supply and stormwater detention performance. Additionally, to enhance water supply performance in the series system, it is recommended to install a water replenishment pump to transfer water from the stormwater-detention tank back to the rainwater-harvesting tank when its water level is low. This will increase operational flexibility and improve system management.


