Article

Spatial Coupling Relationship Between Water Area and Water Level of Dongting Lake Based on Multiple Temporal Remote Sensing Images Data at Its Several Hydrological Stations

1
Hunan Provincial Key Laboratory of Remote Sensing Monitoring of Ecological Environment in Dongting Lake Area, Hunan Center of Natural Resources Affairs, Changsha 410004, China
2
The School of Computational Science and Electronics, Hunan Instititue of Engineering, Xiangtan 411104, China
*
Authors to whom correspondence should be addressed.
Water 2025, 17(2), 199; https://doi.org/10.3390/w17020199
Submission received: 2 December 2024 / Revised: 31 December 2024 / Accepted: 6 January 2025 / Published: 13 January 2025

Abstract

:
It is very well-known that the reliable coupling relationship between water area and water level is very important in analyzing the risks of floods and droughts for big lakes, such as Dongting Lake, especially when remote sensing images are absent and in situ measurements cannot be carried out. To obtain this relationship, two types of mathematical models—polynomial regression (PR) based on the least square algorithm and machine learning regression (MLR) based on the BP (Backpropagation) neural network algorithm—are constructed using the water area data extracted from multiple temporal remote sensing images and water levels recorded at several representative hydrological stations for nearly 30 years. In this study, Dongting Lake is divided into three parts: East Dongting Lake (EDL), South Dongting Lake (SDL), and West Dongting Lake (WDL). This is because water slope exists on its surface, which is formed by several inflow rivers and the high and low terrain. To calculate the total water area of this lake, two ways are put forward by choosing the water levels: from EDL, SDL, and WDL in their turn; or from all three simultaneously. In other words, three univariate and one multivariate regression. For PR, there are perfect coefficients of determination (most nearly 0.95, the smallest being 0.76), which is in line with regression test relative errors (between 0.27% and 6.7%). For MLR, which was initially applied to this problem, the best node number (10 for the first way, 8 for the second way) in the hidden layer of the neural network is adaptively chosen, with coefficients of determination (similar to PR), together with training and testing error performances (between 1% and 10%). These results confirm the validity and reliability of them. The regression and prediction results on the two models are better than the documented way (only focus on the water level of EDL). These results can provide some references for researchers and decision makers in studying similar big Lakes.

1. Introduction

Water area or marshland area is the fundamental feature of any lake, which constitutes an important part of the natural ecosystem. It will cost a great deal of time or money to obtain the value of this index by in situ measurements. It is especially true in circumstances where a lake has a large water area, such as Dongting Lake (DL), where a survey cannot be carried out due to bad weather conditions, or where the fast-changing water level makes it very difficult to survey in a short period of time. The satellite remote sensing technique has the advantage of receiving, calculating, quantifying, and retrieving data in real-time, not only for a large scale operation but also for some repeated observations. Hence, it can provide good technical support for overcoming the difficulties appearing during the course of data collection. Many articles have documented the remote sensing imagery applications and their effectiveness [1,2,3,4,5,6,7,8,9,10]. In these references, Yang, Godson, and Tiit reviewed the developments and applications of remote sensing imagery in many fields, such as water quality retrieval, water quality parameter monitoring, and so on, Zhang presented the future direction of intelligent remote sensing satellite systems, and Yuan et al. focused on the neural network and deep learning methods for advancing the environmental remote sensing process. Therefore, the remote sensing technique for the water areas or marshland areas in the natural ecosystem has been continuously developed and improved.
When obtaining water areas or marshland areas, the researchers often resort to remote sensing equipment to obtain the needed data. Remote sensing data, such as China and Brazil Earth Resource Satellite (CBERS) data, are often used for water body extraction [11,12,13]. Through the years, many kinds of remote imageries with different resolutions are applied to extracting the water body edge of the river, lake, or reservoir. Cai used 217 scenes of Moderate Resolution Imaging Spectroradiometer (MODIS) images to obtain the water area of Poyang Lake and constructed the relationship between water level and water area [14]. Ding et al. used the Advanced Synthetic Aperature Radar (ASAR) image to monitor the water area variations of Dongting Lake and researched the relationship between water storage change and water area [15]. Hu and his team, using MODIS time series imagery during the period from 2000 to 2012, analyzed some spatial and temporal dynamics parameters of a flood regime [16]. Recently, Paul et al. employed some supervised classification methods (support vector machine, artificial neural network) for the extraction of water bodies from multispectral LANDSAT images [17]. Nascimento et al. considered the determination of physical values in (CBERS-4/MUX satellite) remote sensing images for some indices such as the Water Index with normalized difference (NDWI) [18]. Serban et al. aimed to identify the variation of the Nuntasi-Tuzla Lake surface water over a long-term period in accordance with human intervention and climate change from Landsat TM/ETM+/OLI and MODIS dataset, and they provided an analysis by hydrological drought indices [19]. Due to the wide coverage area and high frequency characteristics, several kinds of remote sensing data are often utilized for large area monitoring.
While studying the relationship between water area and water level for Dongting Lake, most researchers regard the lake as a whole rather than as being constituted of several parts. However, the water level value of one station cannot represent that of the whole lake due to the existing elevation gradient from the west of the lake to the east [20,21]. Only a few researchers separated the lake into several parts according to its geographical characteristics [22]. According to the spatial distribution, Dongting Lake is split into four segments: EDL, SDL, WDL, and Qili Lake. There are many hydrologic stations around the lake, which record the water levels or sediments of the area of this lake. Hence, the relationship between water area and water level is very complicated [23,24,25].
To study the relationship between water area and water level, the polynomial regression method, which is very popular, was introduced by many researchers [26,27,28,29,30,31,32,33,34]. Du et al. obtained the water body information of Dongting Lake for four years and in different months, and they established the stepwise regression model for the relationship between water area and water levels at several hydrologic stations [26]. Ke et al. presented spatial-temporal variation in the water surface area of Dongting Lake, which was extracted from the multitemporal images of the Terra MODIS for twelve years, and it has a good linear correlation with the water level at Chenglingji hydrologic station [27]. Cheng J et al. discussed the driving factors of the temporal and spatial variations of water level in Dongting Lake using multiple stepwise regression models at six hydrologic stations [33]. Yang et al. analyzed the variations of the water body, based on remote sensing images, during the period from 2000 to 2019, established the regression models between water volume and water level at Chenglingji, analyzed the change trends, and explored the related driving forces [30]. Cheng H et al. studied some related factors of the flood level fluctuation phenomenon at Dongting Lake, and the binary logistic regression analysis, fast Fourier transform, and local regression are used to deal with the water level fluctuation sequence [34]. Many kinds of regression methods are applied to the variations of water body or water level as well as the relationships between water area and water level. Some good results are obtained, but there exist some disadvantages, including only univariate regression for the total water area of Dongting Lake, multivariate (the water levels at several hydrologic stations) regression with very short time period data, no consideration of the hydraulic gradient in Dongting Lake, and so on. It encourages us to further study the synthetical regression models and the relationship between the water area and water level of Dongting Lake.
The machine learning method has played a vital role in environmental remote sensing research [10,35,36,37,38,39,40]. The support vector machine (SVM) is an important member of this family. Wang et al. established one support vector regression method for predicting the water level of Dongting Lake rapidly and accurately under the influence of the impoundment of the Three Gorges Reservoir (TGR). Recently, Liang et al. discussed the water level variation of Dongting Lake and its relationship with the upstream TGR and applied a deep learning method to predict the daily water levels of this lake. BP neural network and convolutional neural network (CNN) are also popular in this field. Yuan et al. took the time series of outflow discharge of the TGR and water level at Chenglingji as training samples, based on Levenberg–Marquardt algorithm, one BP neural network with four layers was established, which well expressed the relationship between outflow discharge and water level. Chen et al. proposed a new CNN architecture and extracted good features of water bodies from some urban background data. Guo and Lai proposed two types of recurrent neural network methods for constructing one prediction model for Dongting Lake’s water level under the synthetical influence of the Yangtze river and four sub-tributaries. The machine learning method has been widely employed for time series analysis, the prediction or variation of water level, and water body extraction for Dongting Lake. To our knowledge, there exist few publications in the literature on the relationship between water area and water level by machine learning methods, with none showing some adaptive algorithms for the best number of neurons. Hence, it inspires us to design some novel machine learning algorithms for this problem.
In this paper, the coupling relationship between the water area and water level of Dongting Lake is obtained by multiple temporal remote sensing image data at several hydrological stations. Firstly, Qili Lake, as one part of Dongting Lake, has become a dry lake whether in rainy season or dry season, and thus, does not play a role in controlling flooding or impounding. Dongting Lake is initially divided into three parts—EDL, SDL, and WDL—because it is not a plane and there exists water slope on the lake surface. Correspondingly, one representative hydrological station is chosen to monitor the water level for each sub-lake. Secondly, to obtain the water area data, remote sensing images with high spatial resolutions have been collected to extract the water body edge of the lake during the past nearly 30 years. Thirdly, To obtain the coupling relationship between water area and water level, two types of mathematical models are constructed: polynomial regression based on the least square algorithm and machine learning regression based on the BP-neural network algorithm. To calculate the total water area of Dongting Lake, three ways are discussed for the calculation by choosing different water levels: only from EDL; from EDL, SDL, and WDL in their turn; or from all three simultaneously. This corresponds to the univariate and multivariate regressions. The regression and prediction results of the two models indicate that they are valid and reliable.
The remainder of this paper is organized as follows. In the following section, we introduce the relative materials and methods. In Section 3, we present the construction and its results on the relationship between water area and water level. In Section 4, we present the discussion. In Section 5, we draw the conclusions.

2. Materials and Methods
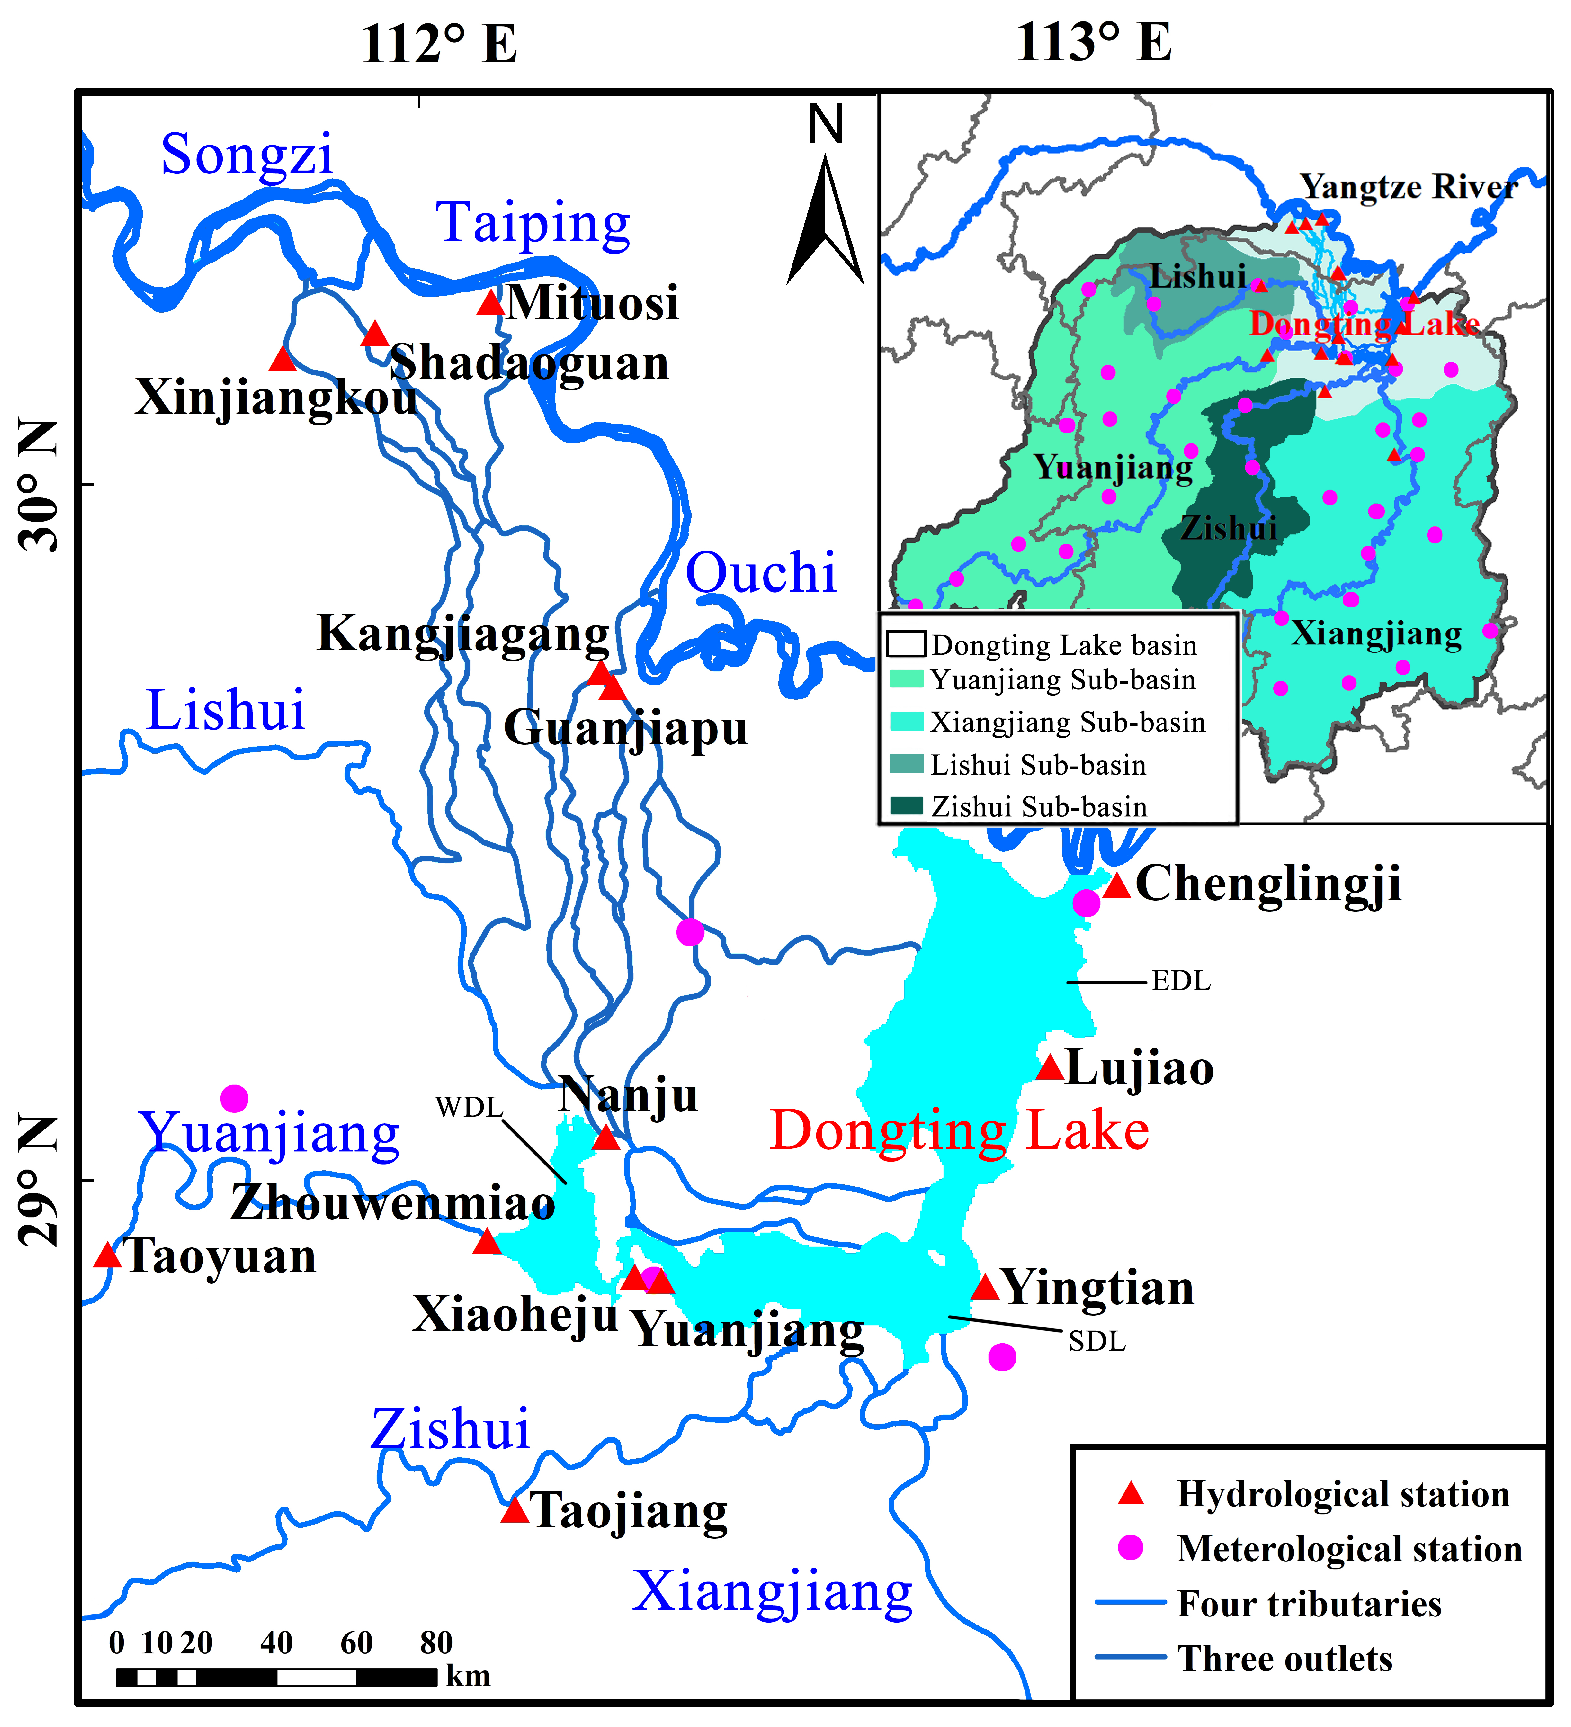
2.1. Study Area

Dongting Lake is located in the north of Hunan Province, China, on the south bank of the middle reaches of the Yangtze (Changjiang) River ( 27 ° 39 29 ° 51 N and 111 ° 19 113 ° 34 E; see Figure 1). The storage capacity of Dongting Lake is about 22 billion m3, when the water level at Chenlingji is 35 m.
Dongting Lake is the second largest freshwater lake in China and contains three international nature conservation wetlands (EDL, SDL and WDL, 2550.72 km2 in total), and one provincial Heng-ling lake wetland conservation region. The three outfalls (Songzi, Taiping, and Ouchi), which connect the Yangtze River with Dongting Lake together, on average, carry 86 billion m3 of runoff and 110.98 million tons of sediment annually for nearly 70 years from 1955 to 2023. This accounts for about 30.7% of the total runoff and about 80.9% of the total sediment, respectively. The average annual temperature is 16.6–17.6 °C, and the temperature is approximately 4.5 °C in January, and usually higher than 30 °C in July. The average annual precipitation is 1303 mm. There are 11 crucial and 24 general embankments around Dongting Lake to draw off flood water during the flood period.
The area of Dongting Lake has reduced from 5216.37 km2 in 1896 to 2702.74 km2 at present [41]. Its decrease has been been greatly due to the building of dykes from the 1950s to 1980s. In 1998, the government implemented a policy “reduce land to lake” to reduce potential future damages to the Yangtze River basin. However, there still exists an illegal dyke, which was about 25 km2 from 2012 to 2015. This is according to the result of national geography condition monitoring in Dongting Lake’s ecological economic zone.
The overall topography of the Dongting Lake region is characterized by high elevations in the east, south, and west, with low elevations in the central and northern areas. The lowest point in the region is Huanggai Lake in Linxiang, with an elevation of 21.0 m, while the highest point is Huping Mountain in Shimen, with an elevation of 2098.7 m. The region presents a stepped inclination toward the Dongting Lake basin, with mountains, hills, and river-lake alluvial plains surrounding the central area in sequence. The central part of the region is the Dongting Lake Plain, bordering the Jianghan Plain to the north and surrounded by hilly areas on the east, south, and west. The region is dotted with a network of waterways and lakes of various sizes, exhibiting a plain landscape of marshy waters and dense river networks. The terrain is flat and open, with an elevation generally ranging from 26 to 38 m. To the east lies the Mufu Mountains, with an elevation generally ranging from 110 to 1800 m; to the northwest, the Wuling Mountains, with an elevation generally ranging from 170 to 2000 m; and to the southwest, the Xuefeng Mountains, with an elevation generally ranging from 56 to 700 m. Hence, these topographical features are one of the important factors leading to the hydraulic gradient of Dongting Lake’s surface.

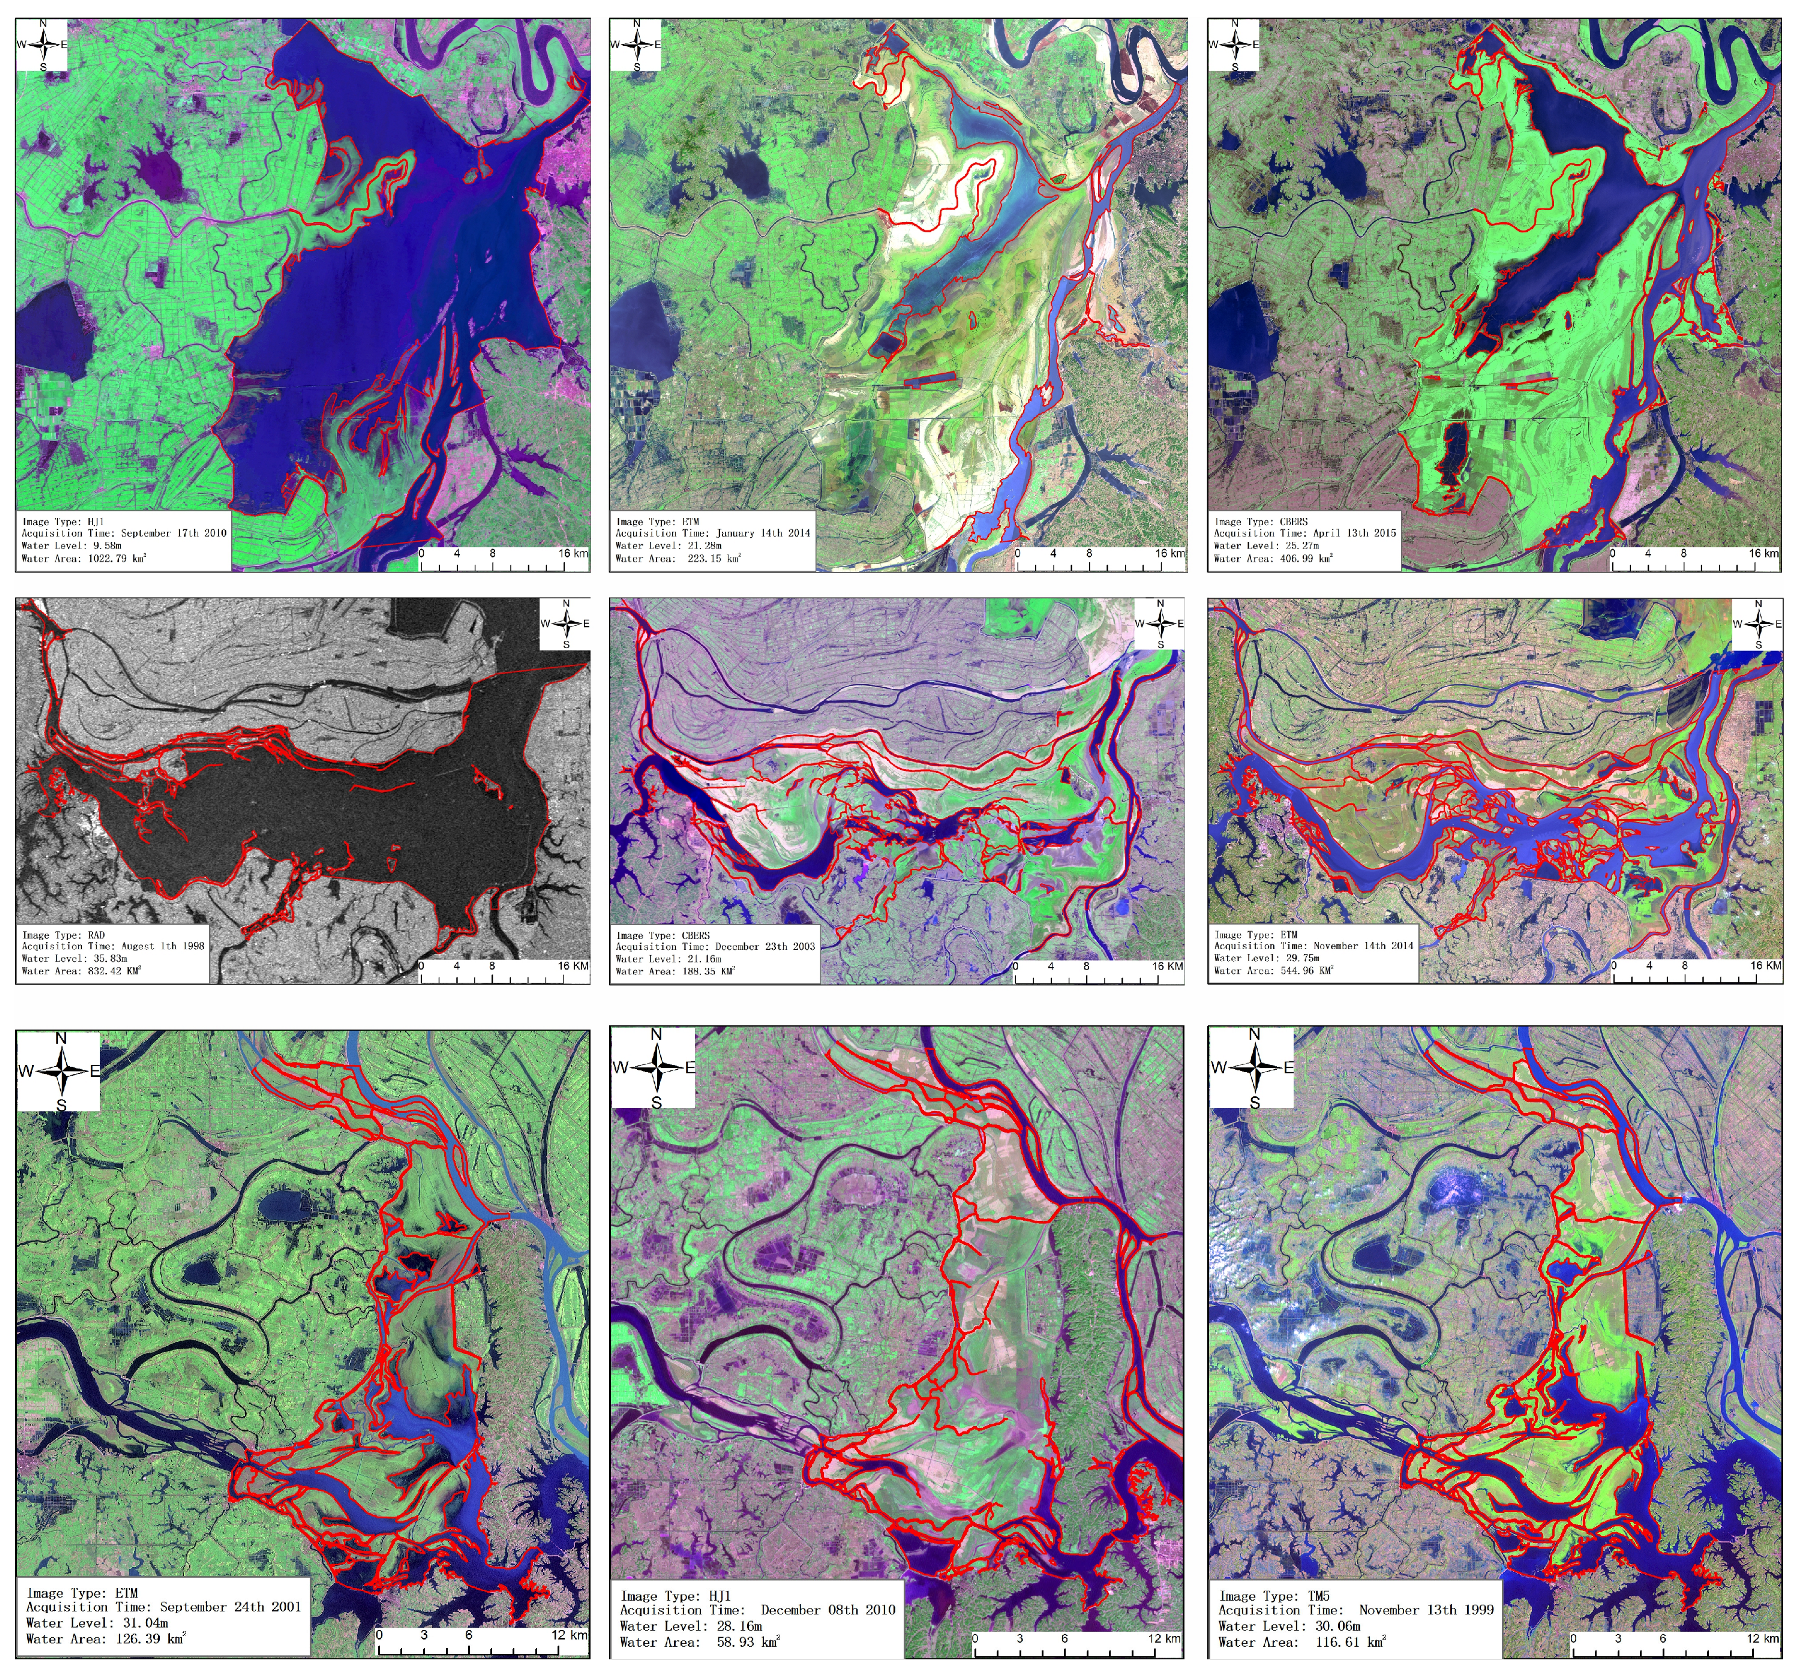
2.2. Remote Sensing Imagery Data for Water Area

Due to the ground swath of the satellite and its slow accessibility to high-resolution images from a large area, it is difficult to access and analyze all images collected each day. To solve this problem, we have taken different parts of Dongting Lake using different remote sensing imagery to meet the shortfall. All the images are obtained from the United States Geological Survey (USGS, VA, US) (http://glovis.usgs.gov/app, accessed on 1 September 2024) and the China Centre for Resources Satellite Data and Application (https://data.cresda.cn/#/home, accessed on 10 August 2024) and Copernicus Data SpaceE cosystem (https://dataspace.Copernicus.eu, accessed on 15 September 2024), and cover different parts of Dongting Lake from 1994 to 2024.
In this paper, different remote sensing imagery is involved for Dongting Lake (shown in Figure 2). Firstly, we used a Thematic Mapper (TM), Enhanced TM Plus images (ETM+), and an Operational Land Imager (OLI)—15 m) of LandSat of America with resolutions of 30 m and 15 m. Secondly, we used a Resources Satellite of China (HJ1—30 m and CBERS04—20 m). Thirdly, we used radar images. Fourthly, we also used data from Sentinel-1 and Sentinel-2 launched by the European Space Agency in 2014 and 2015, respectively. We chose the images of Dongting Lake from different time periods.
On the accuracy of remote sensing data, the following can be observed. As satellites developed, the spatial resolution of imagery continuously improved, ranging from 79 m to 10 m or even higher during the period from 1994 to 2023. To obtain imagery covering the entire Dongting Lake area at the same time, we made a trade-off between image resolution and image swath width, opting for medium- to low-resolution imagery. And we fused low-resolution bands with the high-resolution band. During image processing, we uniformly resampled the spatial resolution of all imagery to 15 m. All the images were geometrically rectified by the image of the National Third Land Survey, and the quality of it is examined by certificate authority. thereby eliminating the impact of different image resolutions on the statistical results of the Dongting Lake water surface area.
To delineate the water area of Dongting Lake, we take the human–computer interaction manner during the course of our research, which is due to the shortage of extraction water body algorithms. We have divided and grouped the remote sensing images into several classes according to their type and time period. Firstly, we have delineated the water/land boundary for each image group as the foundation and built the direct or indirect interpretation key. Secondly, we rectified the boundary of the obtained results from the similar image texture feature to form the water area for the next period image. Thirdly, the technical procedure above is utilized for different types of images. Different image types utilized the same technical procedure and Figure 2 presents a schematic view of this method for extracting water.
In addition, the surface condition of the water body has little impact on this remote sensing study, as the research primarily focuses on extracting the horizontal spatial distribution of the water surface from remote sensing imagery. The vertical distribution of water bodies pertains to research on water volume. Underwater vegetation can have a certain impact when using machine methods to extract water surface information as it can affect the algorithm’s discrimination between the water body itself and underwater vegetation.

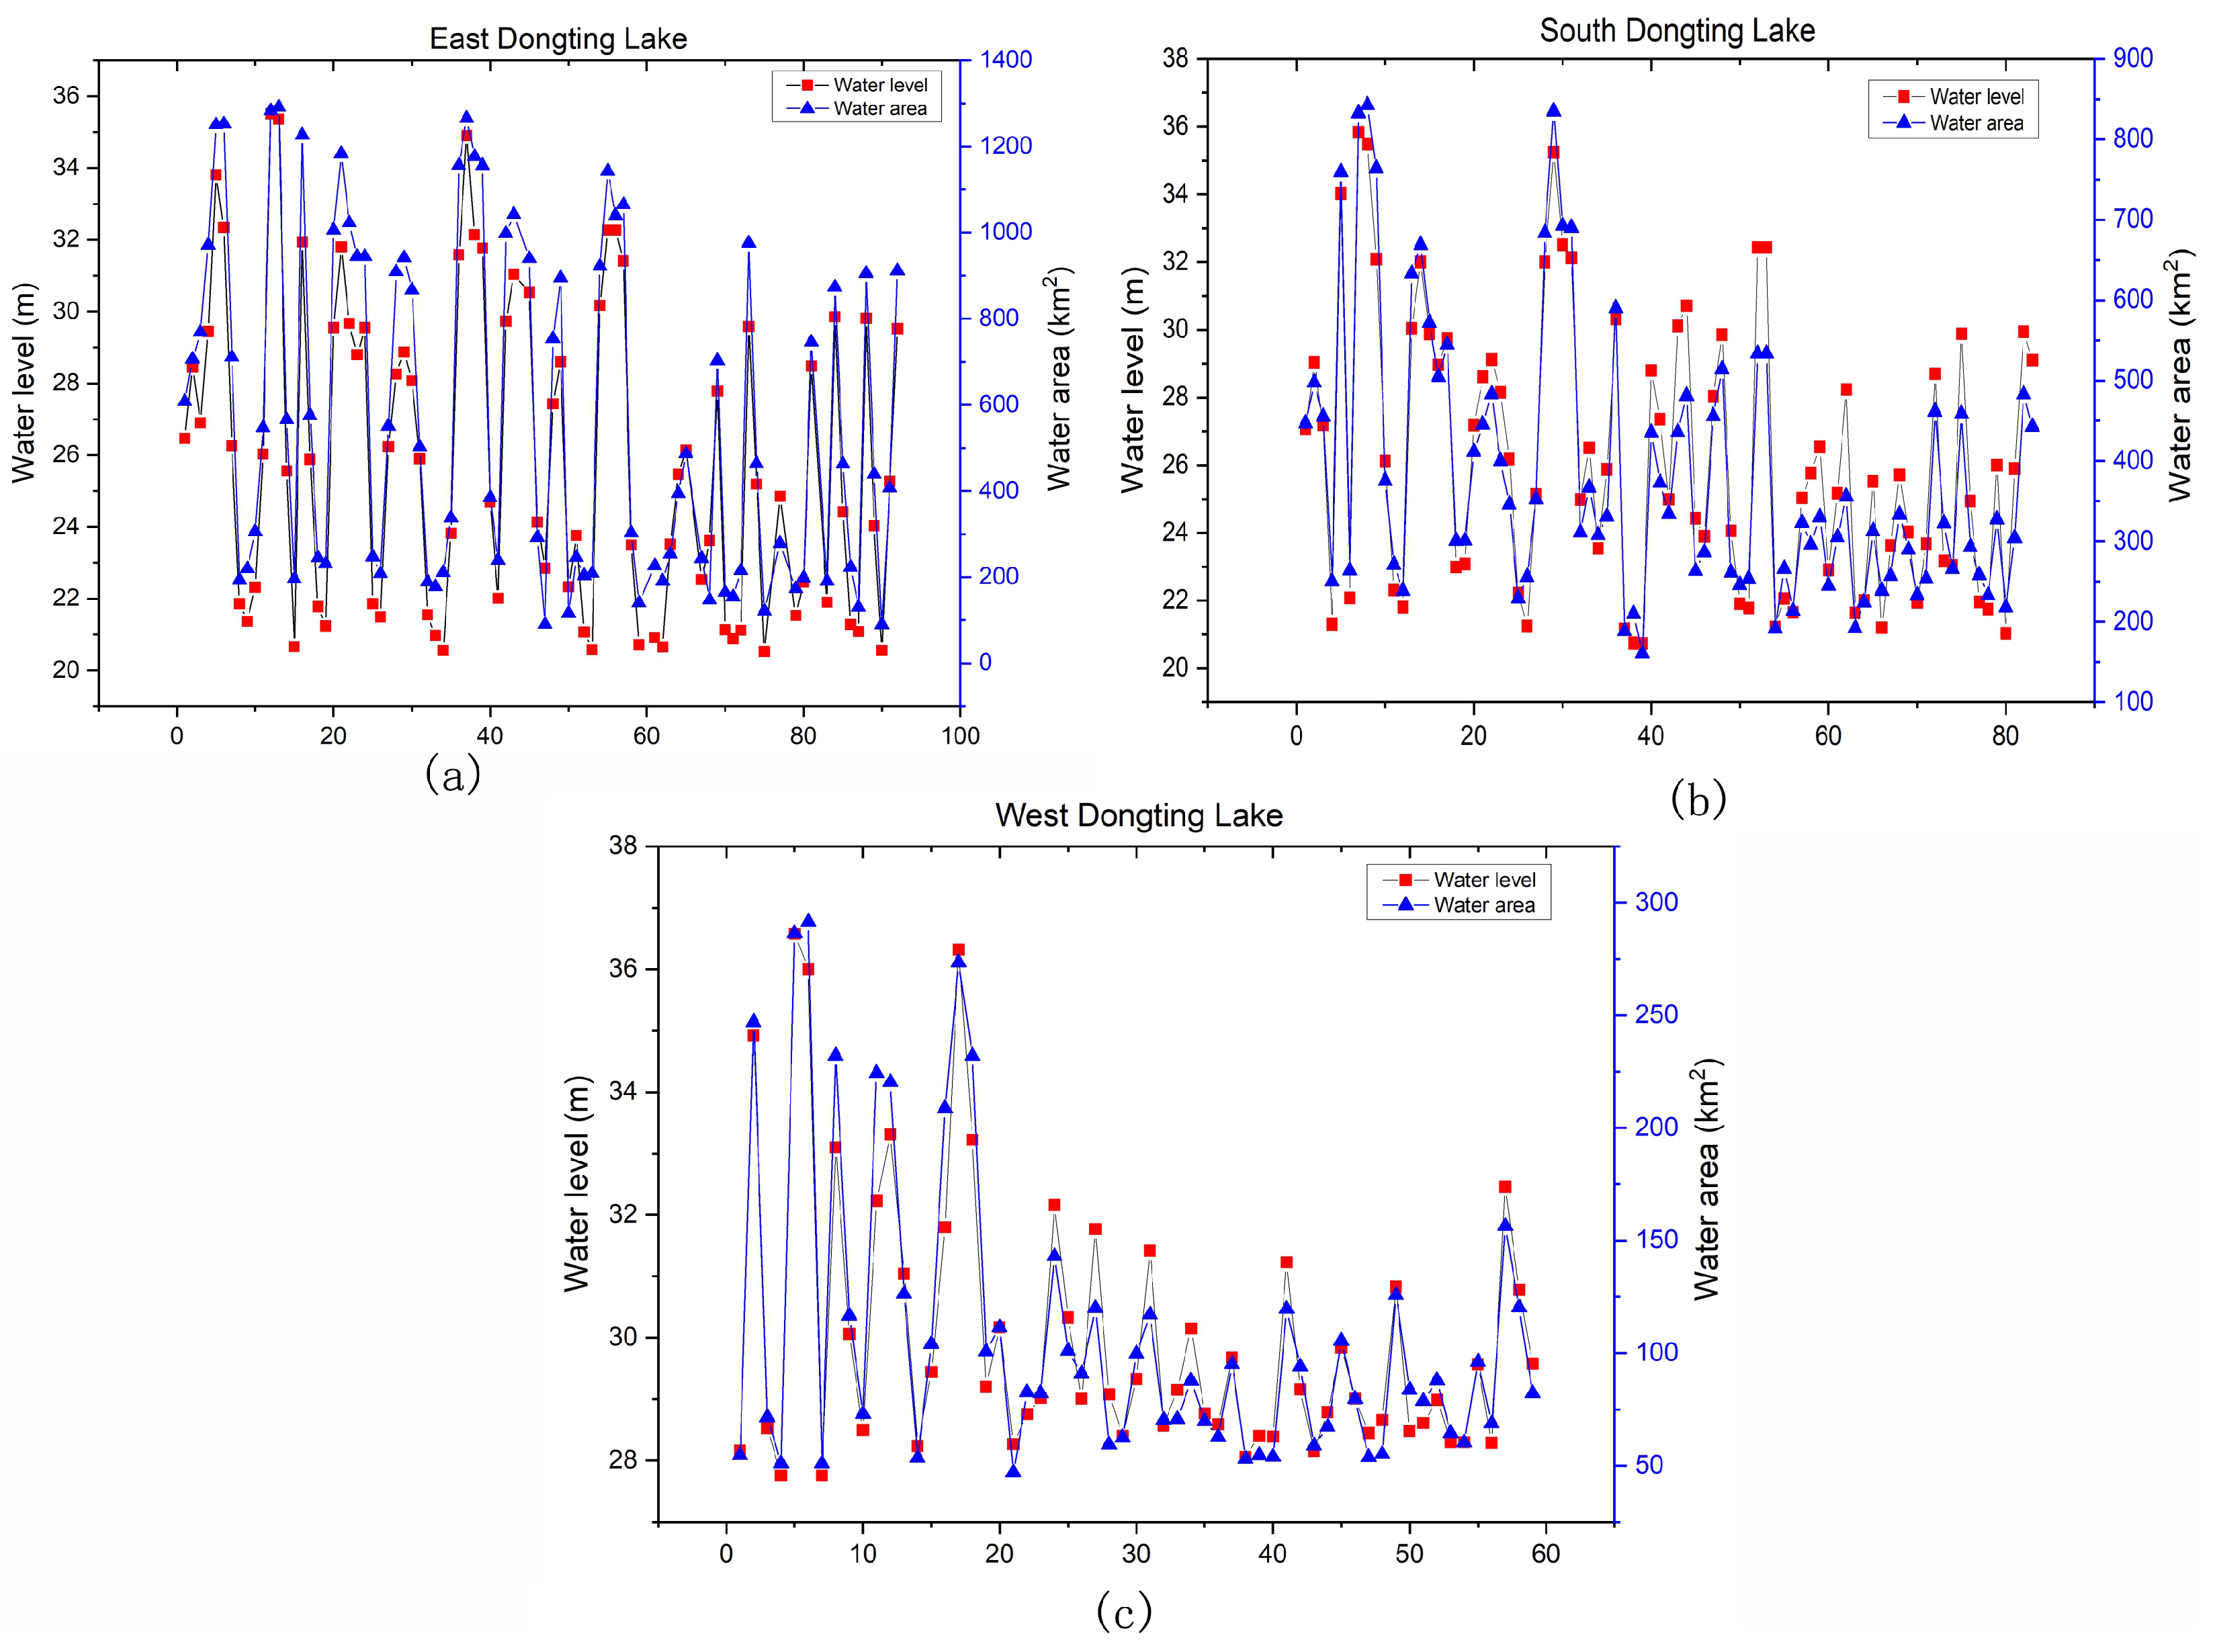
2.3. Hydrological Data for Water Level

In this study, we take the water level data of Chenglingji, Yangliutan, and Xiaoheju hydrological stations as the water level of EDL, SDL, and WDL (shown in Figure 1), respectively.
In situ water level measurements are carried out by water level and water volume monitoring equipment deployed by the water conservancy department in the Dongting Lake area. There are more than 20 such monitoring stations in the Dongting Lake region, providing real-time monitoring with updates every 2 h. These data can be obtained from the “Hunan Hydrological Public Service Map” (http://yzt.hnswkcj.com:9090/#/, accessed on 8 August 2024). The revisit times of different satellites vary, so to improve the accuracy and reliability of our study model, we used multiple types of satellite data. When selecting water level data, we chose data that corresponded to the time when the remote sensing images were acquired, meaning the image acquisition time was synchronized with the water level time. Only by matching the actual water level measurement time with the image capture time can the obtained images reflect the spatial distribution of the Dongting Lake water surface at that water level, allowing the computer-extracted water surface area of Dongting Lake to accurately represent the area at that specific water level.

2.4. Methodology

It is known that the water area of one lake or marshland is closely related to its water level.
The water area changes with its flexible water levels, and they are usually positively correlated. To verify it, we choose 234 images and calculate the water area by software ArcGIS 10.8, and then put the results about water area and water level data in one coordinate system (see Figure 3a–c for EDL, SDL, and WDL, respectively). From the figure, one can find that water area increases as the water level value becomes large, and vice versa. Hence, there exists a spatial coupling relationship between these two variables.
In this study, we select two methods to construct the relationship between water area and water level. One is the polynomial regression based on the least square algorithm; the other is the machine learning regression based on the BP neural network algorithm.
We focus on the total water area of Dongting Lake, denote it as y, and denote y 1 , y 2 , and y 3 (resp. x 1 , x 2 , and x 3 ) as the water areas (resp. water levels) of EDL, SDL, and WDL at the corresponding representative hydrological station (resp. Chenglinji, Yangliutan, and Xiaoheju). One can see that
y = y 1 + y 2 + y 3 ,
where y 1 , y 2 and y 3 is, respectively, the water area of EDL, SDL, and WDL.
For PR, we introduce the linear regression model. Assuming that the dependent variable is a linear function of multiple independent variables and a random error term, it can be expressed as follows:
y = β 0 + β 1 x 1 + β 2 x 2 + β 3 x 3 + ϵ ,
where y is the random dependent variable (water area), x 1 , x 2 and x 3 are the deterministic independent variables (water level of EDL, SDL, and WDL, respectively), ϵ is the random error term, β i , 0 i 3 is the regression coefficient. This equation is known as the multivariate linear regression model.
In regression analysis, the Least Squares Method (LSM) is particularly used for solving overdetermined systems of equations (i.e., systems with no exact solution and can only be approximated) when the number of equations exceeds the number of unknowns. It seeks to find the optimal parameter values by minimizing the sum of the squares of the residuals, which are the differences between the observed values (true or observed response variables) and the predicted values (response variables calculated by the model). In this study, we mainly focus on the Linear Least Squares, which is a method suitable for linear regression models.
Let y ^ = β 0 + i = 1 3 β i x i be such that
min F ( β ) = min j = 1 n ( y j y ^ j ) 2 = min j = 1 n ( y j ( β 0 + i = 1 3 β i x i j ) ) 2 ,
where β = ( β 0 , β 1 , β 2 , β 3 ) .
Based on advanced mathematics knowledge, we can derive the following system of normal equations.
A A β = A Y ,
where Y = ( y 1 , y 2 , , y n ) ,
A = X 1 X 2 X 3 , X i = ( 1 , x 1 i , x 2 i , x 3 i ) , 1 i 3 .
By solving Equation (2), we can obtain the regression coefficients β i , 0 i 3 . Hence, the regression model is determined.
The univariate polynomial regression model can be similarly obtained.
For MLR, we will introduce it based on the BP-neural network algorithm. The basic principle of the BP neural network is rooted in the gradient descent method, where the weights and thresholds of the network are continuously adjusted to make the network’s output as close as possible to the desired output. Structure and Parameter Settings of BP Neural Networks: BP neural networks typically consist of an input layer, hidden layers, and an output layer. The number of hidden layers can be set according to needs, and usually, a BP network with one hidden layer can accomplish complex mapping tasks. The number of nodes in the hidden layers has a significant impact on the network’s performance, and it is usually determined based on the number of nodes in the input and output layers, as well as empirical formulas.
In this study, we choose one three-layer BP neural network structure shown in Figure 4, where the number of input nodes is adaptively chosen.

3. Results on the Relationship Between Water Area and Water Level

In this section, we will construct several regression models for the relationship between total water area (corresponding to variable y) and water levels for Dongting Lake based on the collected and extracted data in Section 2 from 1994 to 2023. Three ways are, respectively, presented for polynomial regression and machine learning regression. The three ways are as follows: univariate regression only based on variable x 1 , univariate regression based on variables x 1 , x 2 , and x 3 in their turn, and taking the sum and multivariate regression.

3.1. Polynomial Regression

In this subsection, we will develop three polynomial regression models for the relationship between water area and water level. We will first focus on the univariate polynomial regression.
The first way is to obtain total water area y only from water level of EDL x 1 , which is always used in the literature [42] when a model was obtained by the data during the period from 2000 to 2015.
We obtain the regression model
y = 123.52 x 1 2197.98 ,
where the confidence intervals with the confidence level 95 % for the regression coefficients (intercept, slope) are, respectively, as follows: [ 2346.11 , 2049.86 ] and [ 117.73 , 129.31 ] .
The relationship between total water area y and water level x 1 , together with the confidence intervals is, respectively, shown as Figure 5a,b. In Figure 5b, the start is the raw data, and there are two banded area bounded by three lines: middle (green) line is (3), and below (purple) line: y = 117.73 x 1 2346.11 , above (purple) line: y = 129.31 x 1 2049.86 . The below and above lines are corresponding to the intervals [ 2346.11 , 2049.86 ] and [ 117.73 , 129.31 ] .
The different symbol and lines in following confindence interval subfigures are similar with Figure 5b, and no further descriptions will be given in the following.
The coefficient of determination R-square is 0.9506, which means that there exists a strongly positive linear relationship between the water area of Dongting Lake and the water level at Chenglingji. The F statistical variable is 1804.5 and the p-value is nearly zero which mean that the regression equation is highly significant.
The second way is to obtain the total water area y from the relation (1). One can see that three regression models for the water areas ( y 1 , y 2 , and y 3 ) of sub-lakes (EDL, SDL, and WDL) need to be constructed according to the corresponding water levels, respectively. we will discuss three regression models for them as follows.
For EDL, we can obtain the regression equation
y 1 = 88.68 x 1 1741.45 ,
where the confidence intervals with the confidence level 95 % for the regression coefficients (intercept, slope) are, respectively, as follows: [ 1848.44 , 1634.46 ] and [ 84.52 , 92.845 ] . This is shown in Figure 6a,b, respectively. This model accords with that found in the literature [28], where the model was obtained using the data from 2000 to 2017.
Equation (4) reveals the relationship between the water area of EDL and the water level at Chenglinji. The coefficient of determination R-square 0.9564 means that there exists strongly positive linear relationship between water area of East Dongting Lake and water level at Chenglingji, where the F statistical variable is 1799.08 and the p-value is nearly zero, which mean that the regression equation is highly significant.
For SDL, we can obtain the regression equation where the scatter plot reveals the quadratic relationship between these two variables
y 2 = 3.963 x 2 2 183.94 x 2 + 2373.33 .
In Equation (5), the confidence intervals with the confidence level 95 % for the regression coefficients (intercept, slope, the coefficient before the quadratic term) are, respectively, as follows: [ 1825.35 , 2921.31 ] , [ 224.36 , 143.51 ] and [ 3.22 , 4.70 ] , shown as Figure 7a,b. In Figure 7b, the start is the raw data, and there are two banded area bounded by three parabolic curves: middle (green) curve is (5), and below (purple) curve: y = 3.22 x 2 2 224.36 x 2 + 1825.35 , above (purple) curve: y = 4.70 x 2 2 143.51 x 2 + 2921.31 . The below and above curves are corresponding to the intervals [ 1825.35 , 2921.31 ] , [ 224.36 , 143.51 ] and [ 3.22 , 4.70 ] .
Equation (5) indicates the relationship between the water area of SDL and the water level at Yangliutan. The coefficient of determination R-square 0.7604 means that there exists a strongly positive quadratic relationship between the water area of the South Dongting Lake and the water level at Yangliutan, where the F statistical variable is 247.37 and the p-value is nearly zero, which means that the regression equation is highly significant.
For WDL, we can obtain the regression equation
y 3 = 25.49 x 3 663.18 ,
where the confidence intervals with the confidence level 95 % for the regression coefficients (intercept, slope) are, respectively, [ 703.87 , 622.49 ] and [ 24.12 , 26.85 ] , which are shown in Figure 8a,b.
Equation (6) dislays the relationship between the water area of WDL and the water level at Xiaoheju. The coefficient of determination R-square 0.9293 means that there exists a strongly positive linear relationship between the water area of West Dongting Lake and the water level at Xiaoheju. The F statistical variable is 1369.83 and the p-value is nearly zero, which mean that the regression equation is highly significant.
From the models (4)–(6), we can obtain y 1 , y 2 , and y 3 , respectively, and obtain the total water area of Dongting Lake from (1).
The third way is the multivariate regression, which we will focus on in the following.
The main idea is to obtain total water area y by one multiple regression model simultaneously utilizing three water levels x 1 , x 2 and x 3 of the sub-lakes (EDL, SDL and WDL).
To find the regression model, we first present the correlation between total water area and three water levels ( x 1 , x 2 and x 3 ) by scatter plots, respectively (Shown as Figure 9a, from above to bottom: Chenglinji, Yangliutan, and Xiaoheju), where the icons start, cycle and plus denote the raw data point. From the figure, one can find that there exists a linear correlation between total water area and three water levels, respectively.
We can obtain the initial regression model
y = 2509.7 + 118.04 x 1 + 9.0822 x 2 + 6.7449 x 3 ,
where y is total water area of DL, and  x 1 , x 2 , and x 3 are the water levels of EDL, SDL, and WDL, respectively.
Although the coefficient of determination R-square of this Equation (7) is 0.9120; there exist some singular values (four red small cycle points) that should be eliminated from the Studentized residual figure (Shown as Figure 9b).
After eliminating singular values, we obtain the new multiple linear model
y = 2547.6 + 113.8 x 1 + 8.8848 x 2 + 8.5458 x 3 ,
where the coefficient of determination R-square is 0.9584, which means that there exists a strongly positive multilinear correlation. The root mean square error is 90.3, the statistical variable F is 587, and the p-values is nearly zero and very small, which mean that the regression equation is highly significant.
The regression Equation (8) and its statistical test indicate a strong trivariate linear relationship between the water area of DL and the water levels at Chenglingji, Yangliutan, and Xiaoheju.
To compare with the three ways above, we choose the testing data on (8 August 2023 and 7 October 2023), including water levels and corresponding water areas, and compare them with the models’ results shown as Table 1 and 2, respectively.
In Table 1, L w , S w , S m , S t , E s are, respectively, denoted as water level (unit: m), water area (unit: km2) variables, water area calculated from models, from test data, and the relative error (%) of water area between models and tests, and “By (8)” and “By (3)” indicate water area calculated by Formula (8) and Formula (3), respectively.
From Table 1, one can find that the error of the total water area of Dongting Lake by the second way is the smallest (0.27%), where the error of the water area of EDL, SDL, and WDL is, respectively, 9.49%, 6.71% and 2.29%, and relatively small, and that of the first way is the biggest (12.89%), and that of the third way is suitable (6.70%). The above results also confirm the validity of the second and third ways.
In Table 2, L w , S w , S m , S t , E s are similar to those in Table 1.
From Table 2, one can find that the error of the total water area of Dongting Lake by the third way is the smallest (1.70%), that of the first way is the biggest (16.35%), and that of the second way is suitable (5.06%), where the error of water area of EDL, SDL, and WDL is, respectively, 9.05%, 2.06%, and 1.33%, and relatively small. The above results also confirm the validity of the second and third ways.
To sum up, one can find that the second and third ways are better than the first one.

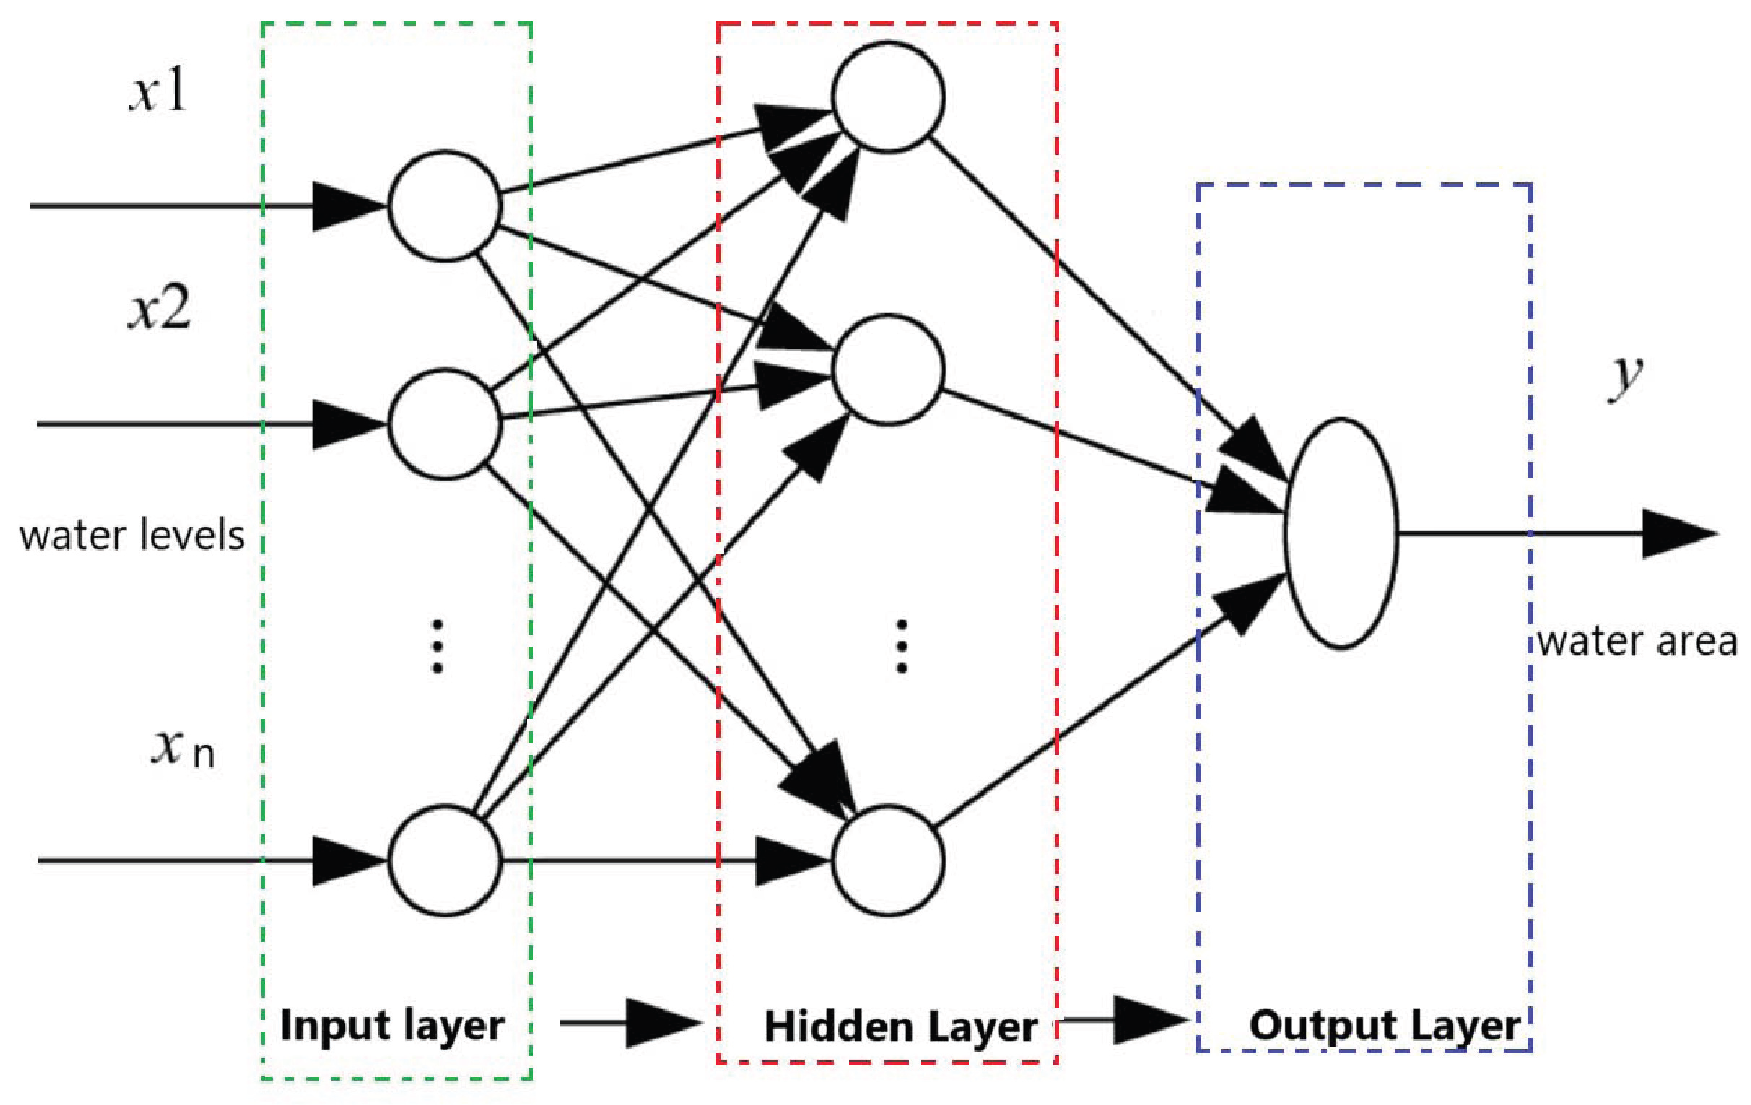
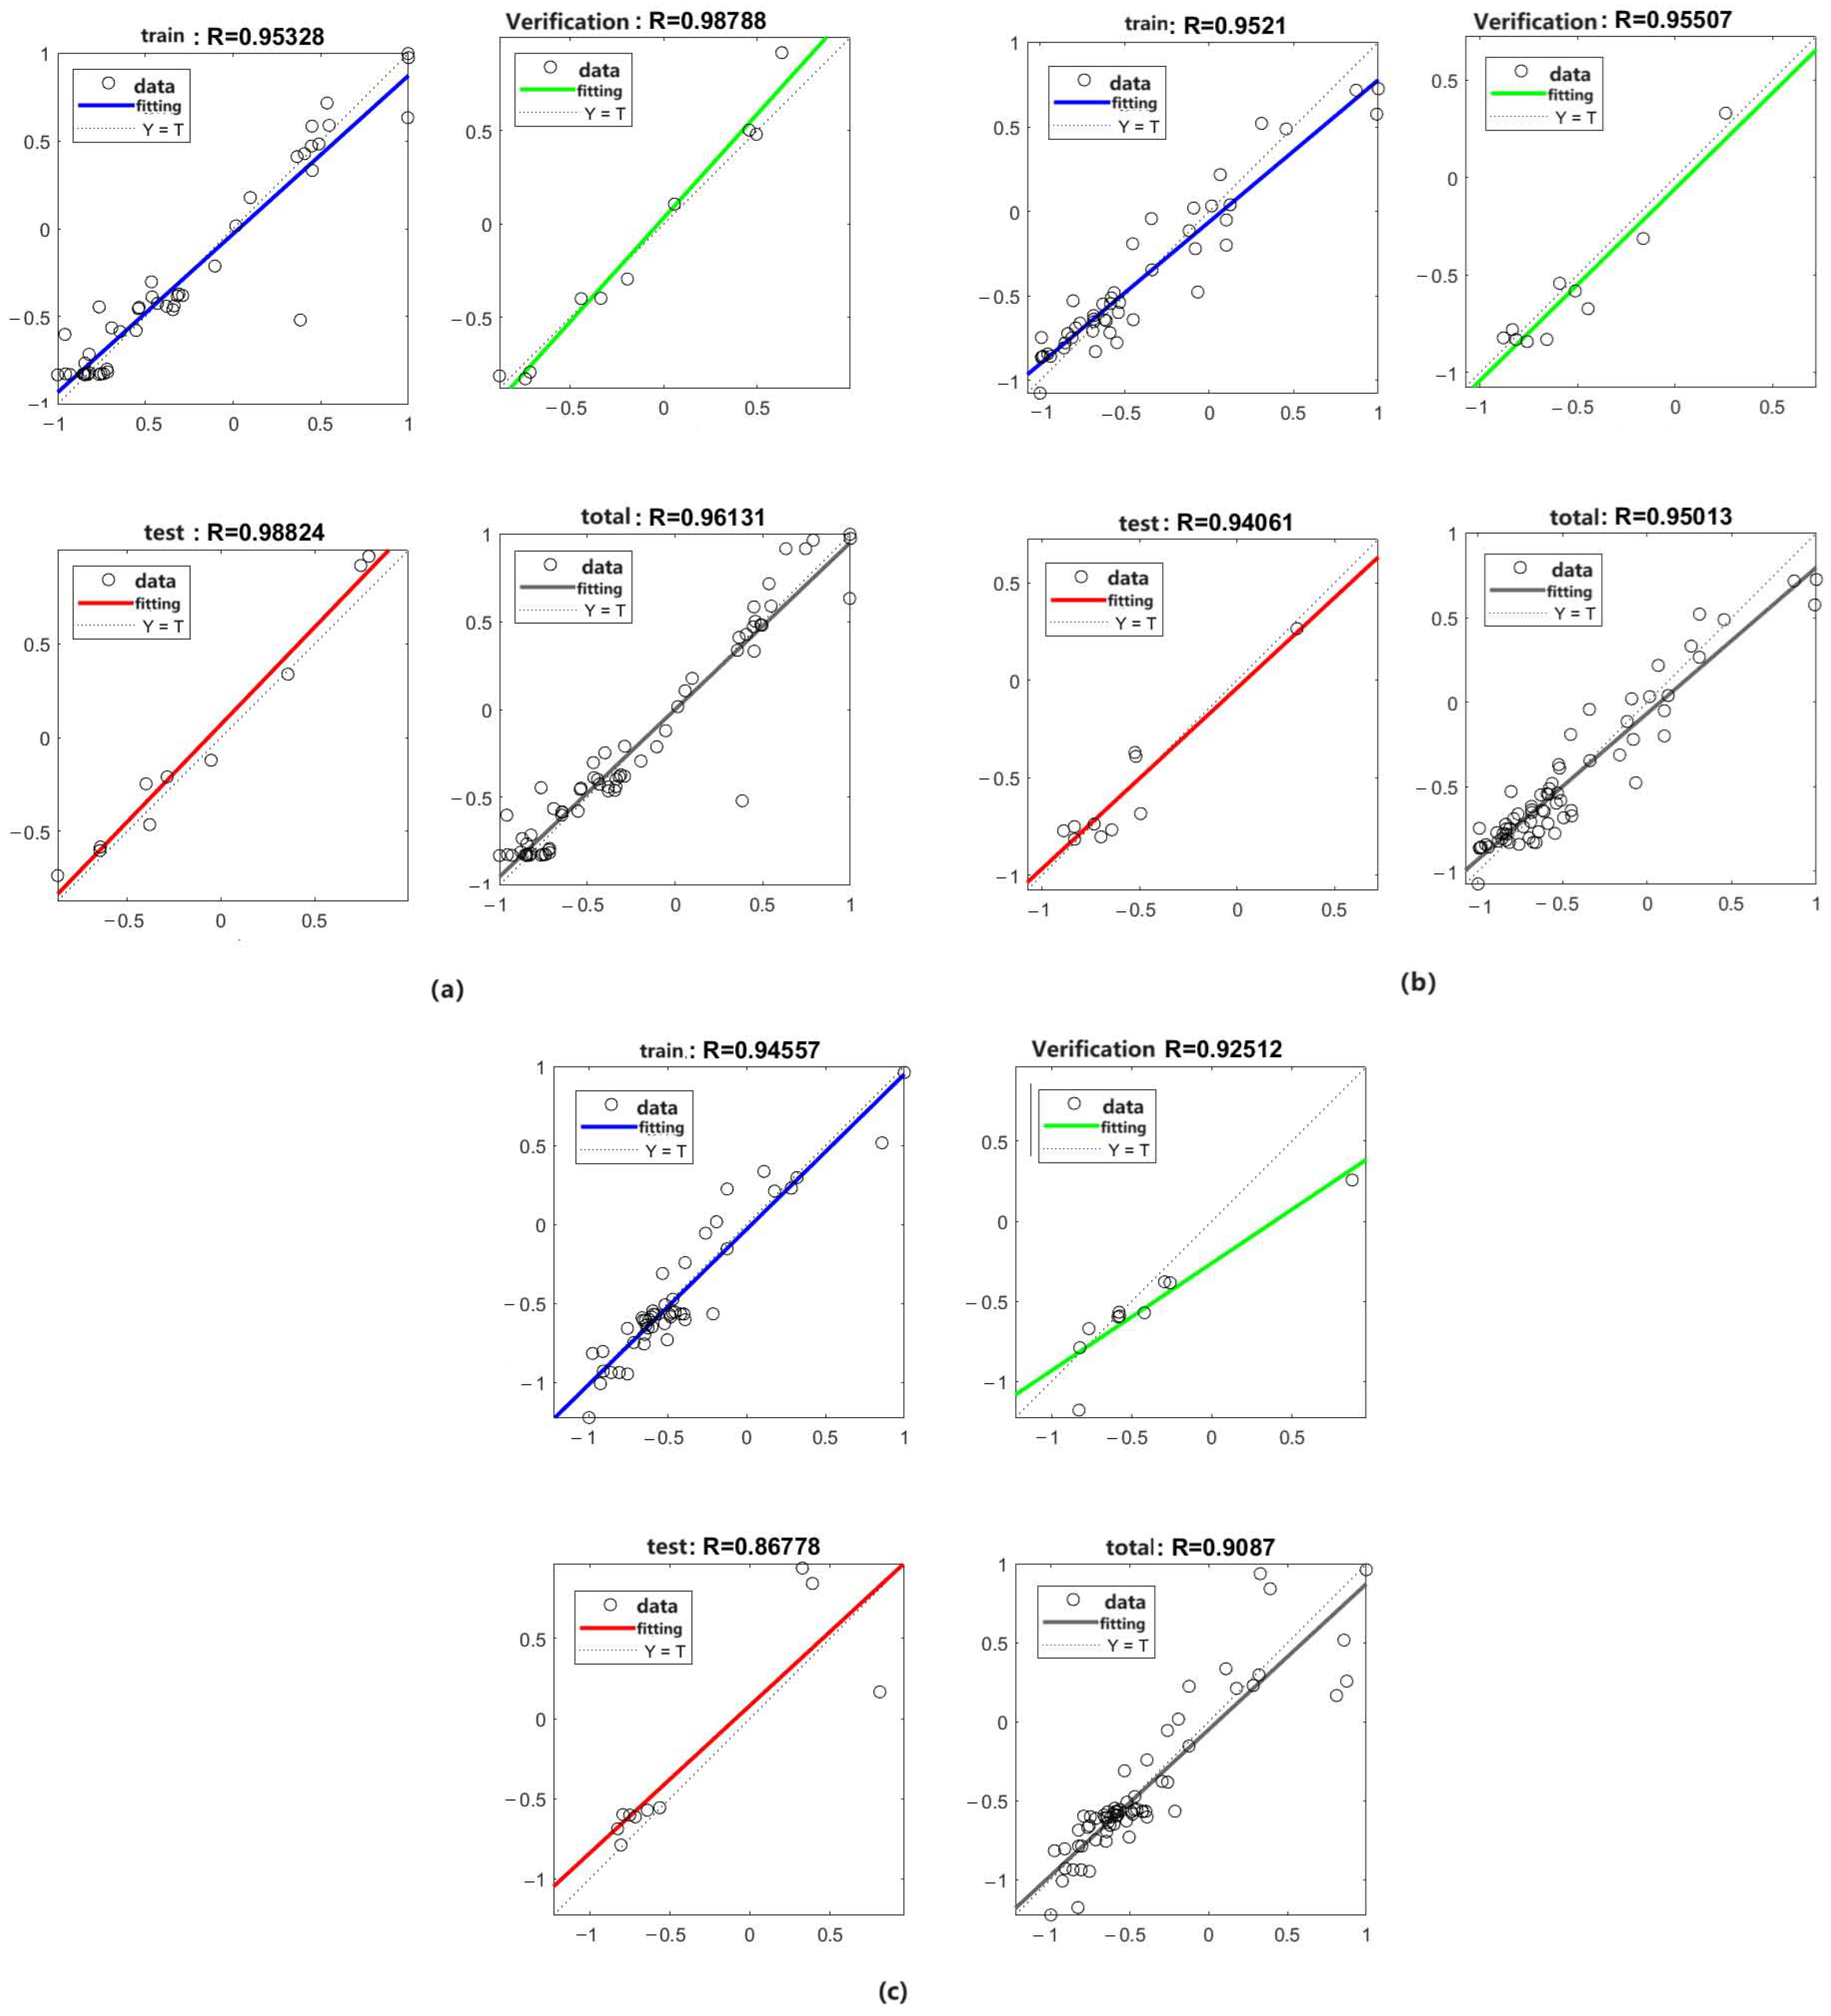
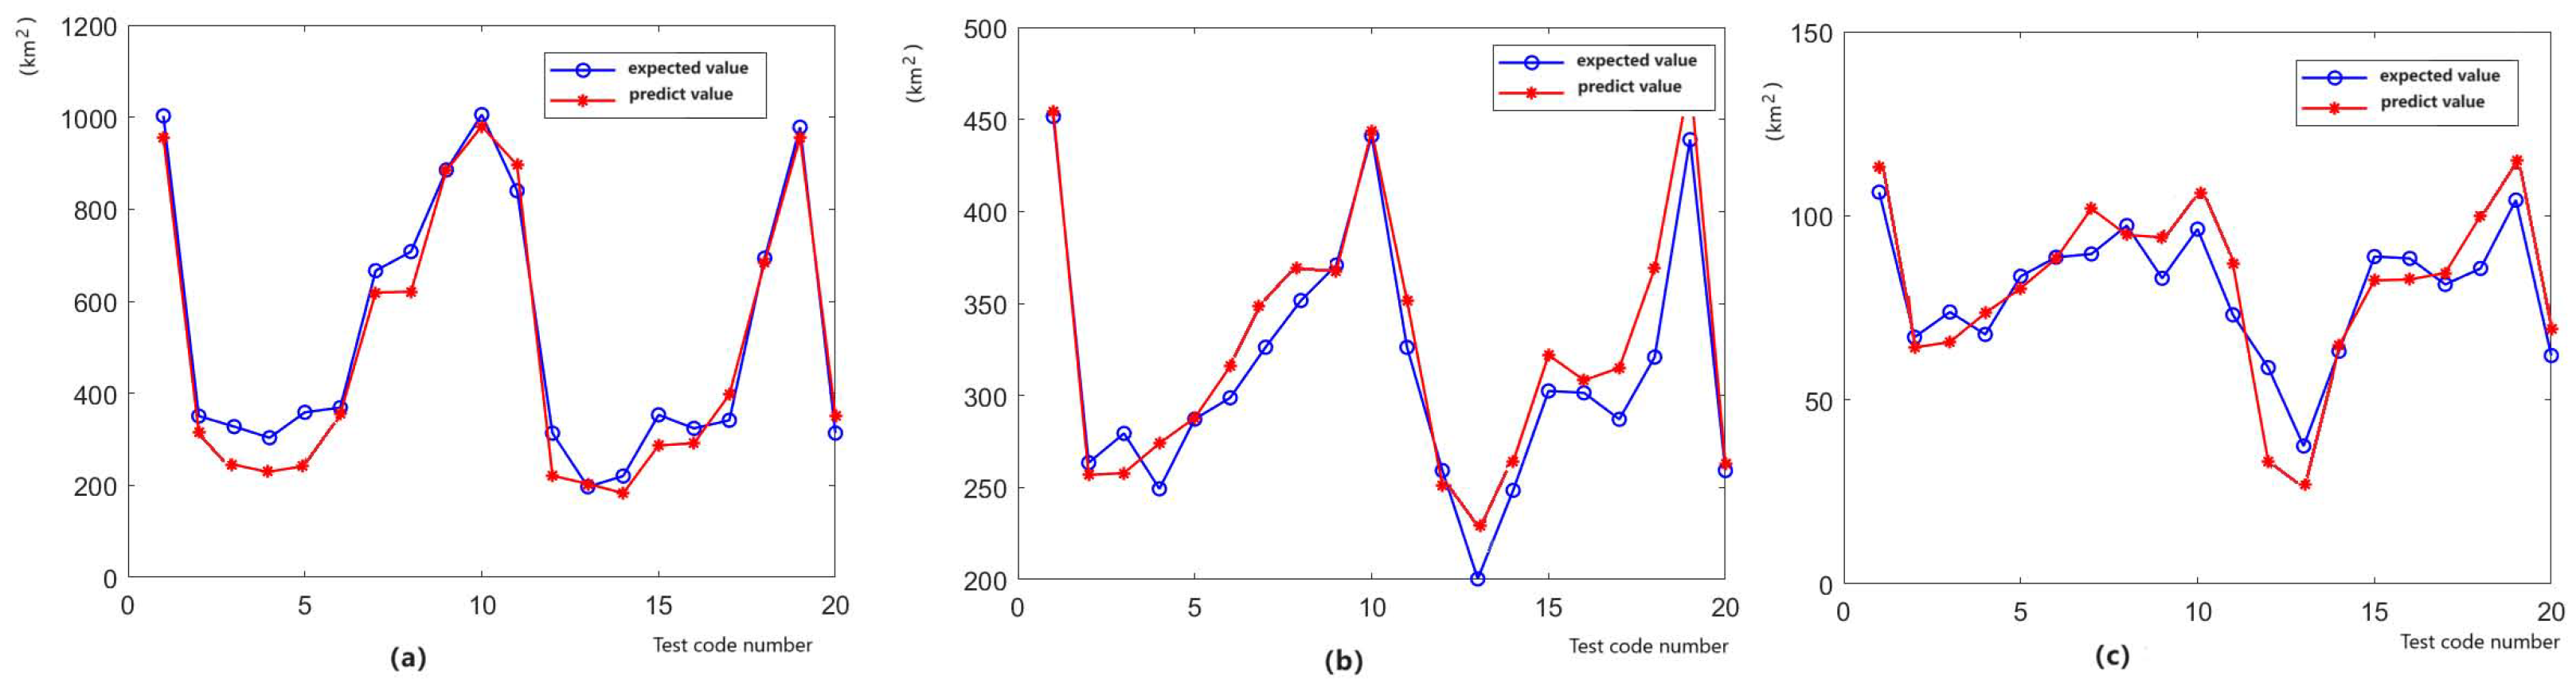
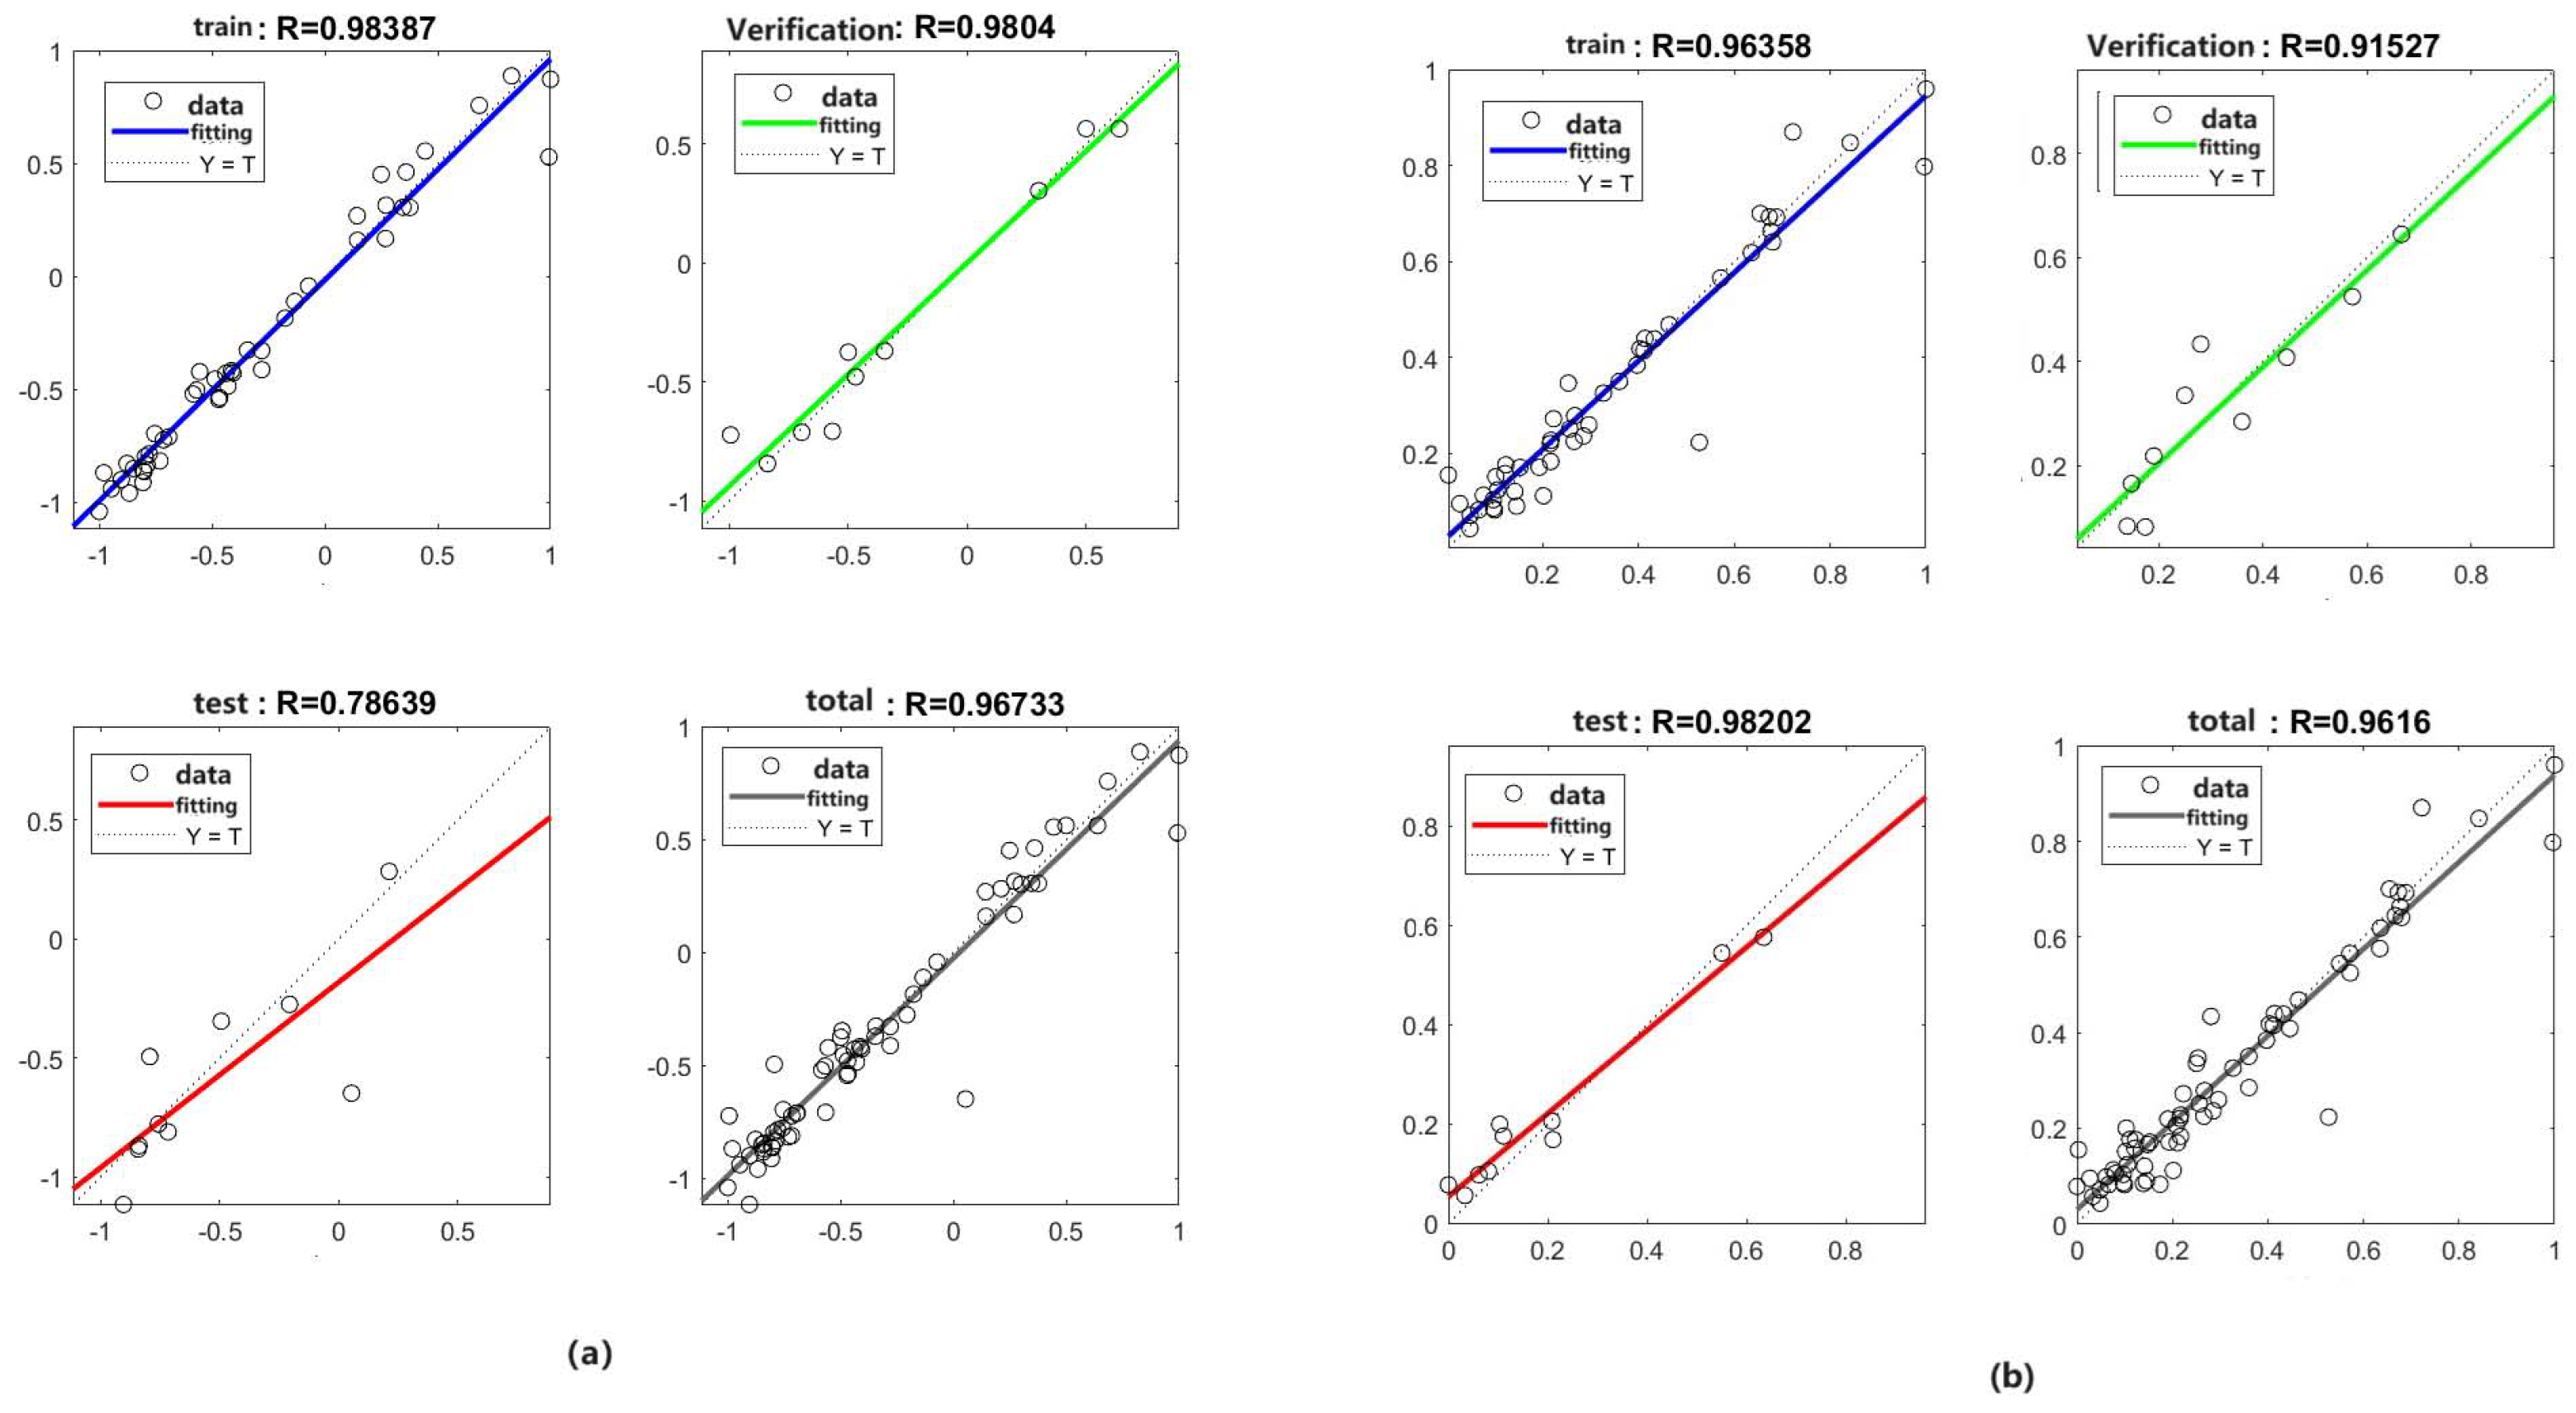
3.2. Machine Learning Regression

In this subsection, we will discuss the machine learning regression model for the relationship between water area and water level for Dongting Lake. Three ways are presented correspondingly to those in Section 3.1. The first way is univariate regression for the total water area of Dongting Lake. The second one is univariate regression for EDL, SDL, and WDL, respectively; take the sum as Formula (1). The third one is the multivariate regression for the total water area.
In recent years, machine learning (ML) algorithms have been increasingly applied in many fields. The BP-neural network method, as a representative shallow machine learning algorithm, plays an important role in many practical fields. Firstly, we design one machine learning algorithm based on BP-neural networks, a single input variable for the water level of sublakes (EDL, SDL, and WDL), respectively. The algorithm is displayed as follows (the algorithm for multiple input variables is similar).
We employ Algorithm 1 to the univariate regression about the relationship between water area and water level for EDL, SDL, and WDL, respectively, where the data about water area and water level are, respectively, chosen as output and input data, whether training or testing.
Algorithm 1: Machine Learning Algorithm on the Regression for the relationship between water area and water level
Step 1. Divide input data: S = S 1 S 2 , where S 1 , S 2 are for training and testing;
Step 2. Normalize the data: [ ] = mapminmax( );
Step 3. H n = n 1 + n 2 M S E 0 = 10 5 ;
Step 4. F 1 = {‘tansig’, ‘purelin’}, F 2 = {‘trainlm’};
Step 5. for i = H n + 1, H n + 10
        n e t i = newff(rin,rout, H n , F 1 , F 2 );
       Parametres = { e p o c h s : = 2000 ; l r = 0.01 ; g o a l = 0.000001 } ;
        n e t i = train( n e t i , i n p u t i , o u t p u t i );
        A i = sim( n e t i , r i ); MSE = mse( r i , A i );
       if (MSE < M S E 0 ) then
                  M S E 0 = MSE; H n 1 = H n ;
       end if
     end for
Step 6. n e t e = newff(rin, rout, H n 1 , F 1 , F 2 );
       Parametres = { e p o c h s : = 2000 ; l r = 0.01 ; g o a l = 0.000001 } ;
Step 7. n e t e = train( n e t e , rin, rout);
Step 8. A e = sim(net,xin);
       [xin,yout] = mapminmax( ).
The training, testing and verifying performance error curves are shown as Figure 10a–c, for EDL, SDL and WDL, respectively. The performance errors for EDL and SDL are about 10 2 , and better than those (nearly 10 1 ) for WDL.
The regression results are shown in Figure 11a–c, respectively, for EDL, SDL, and WDL. Each includes four sub-figures, respectively, for the training, the verification, the testing, and the total. They are suitable, where the best one is the EDL from the coefficient of determination R-square for the totals of 0.9241, 0.9027, and 0.8257 for SDL and WDL. The coefficient of determination R-square for testing is 0.9766, 0.8951, and 0.7530, respectively, for EDL, SDL, and WDL, which are consistent with the results on performance error curves in Figure 10.
At the same time, we also display the comparisons between predicted values and expected values, which are shown as Figure 12a–c for EDL, SDL, and WDL, respectively. From this figure, one can find that there exist some errors in the predictions, where some are very small and others are relatively big, which may be due to the complexity of this problem.
So far, we have finished the second way and can obtain the total water area of Dongting Lake by Formula (1).
In the following, we will display two other ways to obtain the total water area for Dongting Lake. One is a single input variable (water level x 1 of EDL at Chenglingji) and a single output variable (total water area y). The other is three input variables ( x 1 , x 2 , x 3 ) and one output variable y about the total water area of Dongting Lake.
The training, testing and verifying performance error curves are shown as Figure 13a,b: the machine learning method for single variable regression (only water level at Chenglinji) and multivariable regression, respectively. Both of the performance errors are similar and nearly 10 2 .
The regression results on total water area are shown as Figure 14a,b, respectively for the machine learning method by single variable regression and multivariable regression. Each includes four sub-figures, respectively, for training, verification, testing and total. They are in agreement, and the better one is the EDL from the coefficient of determination R-square for the total R = 0.9365.
Simultaneously, we also display the relative error comparisons between predicted values and expected values by the machine learning method (Shown as Figure 15), respectively, for total water area in three ways: one linear regression, three linear regressions, and multivariable regression. From this figure, one can find that there exist some errors in the predictions, where some are very small and others are relatively big, which may be due to the complexity of this problem. The best one is the multivariable regression method (the third way), and the worst one is the linear regression method (the second way). These results accord with those in Section 3.1 by polynomial regression methods.

4. Discussion

Dongting Lake, a crucial regulation and storage lake in the middle reaches of the Yangtze River in China and the second largest freshwater lake, receives water inflow from the upper reaches of the Yangtze River through the “Three Outlets” (Songzikou, Taipingkou, and Ouchikou) in the north. Additionally, water from the “Four Rivers” (Xiangjiang, Zijiang, Yuanjiang, and Lishui) flows into Dongting Lake from the west and south. After regulation and storage, the water exits through Chenglingji and flows back into the Yangtze River, forming a complex river-lake system (Seen Figure 1). In 1954 and 1998, Dongting Lake suffered from two catastrophic floods. Particularly in 1998, the water level at Chenglingji, the outlet of Dongting Lake, reached an unprecedented height of 35.94 m, surpassing the previous record and resulting in significant economic damage. On the other hand, Dongting Lake, affected by human activities, climate change, environmental factors, and TGR, has been gradually shrinking to 2702.74 km2 at present. Hence, scholars have been paying close attention to the intricate relationship between the water body, water surface, and water level of Dongting Lake through the years.
In this study, we have constructed the spatial coupling relationship between water area and water level using two (univariate and multivariate) regression methods. Whether polynomial regression or machine learning regression, one can see that the relative errors of these two ways (Way 2: 0.27%, 5.6%, Way 3: 6.7%, 1.7%) are better than those of univariate (Way 1: 12.89%, 16.35%) linear regression model shown as Table 1 and Table 2. The advantages are also apparent from the comparisons in Figure 15.
In the literature, Chenglingji water level is usually used as the independent variable when the PR method is employed for the relationship between water area and water level, and there are two kinds of research: one is to determine the water area of East Dongting Lake, and the other is to determine the water area of the (entire) Dongting Lake.
For the former study, Peng [28] found that both linear and polynomial models can accurately describe the relationship between the water area of East Dongting Lake region and the water level at Chenglingji for the period from 2001 to 2017. Influenced by the topographical distribution of the lake region, the correlation between water area and water level is closer during the high-water season, while it significantly decreases during the low-water season, with coefficients of determination of 0.90 and 0.68, respectively. In the article [27], which is based on the remote sensing and hydrological data from 2000 to 2012, Ke reported a high correlation between the water area of East Dongting Lake and the water level at Chenglingji. The inflow of water from the Yangtze River has a significant impact on this correlation during both low-water and high-water seasons for East Dongting Lake, with a coefficient of determination of 0.937. In this study, a linear model based on the data taken during nearly 30 years for the water area of East Dongting Lake and the water level at Chenglingji is presented, which is consistent with the aforementioned findings, with a coefficient of determination of 0.956. Therefore, one can infer that the linear regression model provides a very accurate description of the relationship between the water area of East Dongting Lake and the water level. The comparison results are shown in Figure 16a.
For the latter study, Ke in an article [27] found the correlation between the changes in water area of Dongting Lake and water level at Chenglingji is relatively high. The coefficient of determination for the linear regression model is 0878. Long [42] found that the water area of Dongting Lake and the water level at Chenglingji station tended to be linearly correlated, and the correlation coefficients were greater than those for other stations; the coefficient of determination is 0.7849. In this study, the corresponding coefficient of determination is 0.95, and it seems that the linear regression model can also be used for the water area of Dongting Lake as Chenglingji water level can be considered as the independent variable. The comparison of relative regression results with the water level at Chenglingji is shown in Figure 16b. The slope of our linear model is less than the other two, which may be due to the maximum time span in our study.
Although the water level at the Chenglingji station plays an essential role in estimating the water area of Dongting Lake, it seems that such a single measure can represent, but not adequately, the complex water exchange between rivers and lakes in such a big lake. Hence, the water levels at multiple hydrological stations should be considered. Long [42] put forward a good idea and developed several stepwise multiple linear regression models about the water level and its difference from four hydrological stations. Their coefficients of determination are 0.770, 0.795, 0.889, and 0.942, respectively. Du, in the literature [26], used the measured water level values from seven hydrological stations in the lake area as independent variables, conducted a multivariate nonlinear stepwise regression to establish a fitting formula for the relationship between water area and water level of Dongting Lake from 2003 to 2006. The coefficient of determination was greater than 0.96. In this study, a three-variable linear regression model has been established with a coefficient of determination of 0.958. One can see that the regression effect is extraordinary from calculating the water area of Dongting Lake as seen in Table 1 and Table 2, together with Figure 15.
To our knowledge, machine learning, neural networks, and support vector machines are currently mainly applied to predict water levels based on historical water level and flow data [35,36,39]. However, there have been few researches on obtaining water area regression using machine learning methods based on water level and water area data. This study is the first to utilize this method and has achieved good regression results from Figure 12 and Figure 16. One of its advantages is adapatively choosing the node number of hidden layer.
Finally, when remote sensing images are absent and the in situ measurement cannot be carried out, it is important that water area can be calculated according to water level by regression models. In fact, it also provides the possibility for the situation that water level can also be predicted from univariate or multivariate linear regression models.

5. Conclusions

To obtain the relationship between the water area and water level of Dongting Lake, two types of mathematical models—polynomial regression based on the least square algorithm and machine learning regression based on the BP-neural network algorithm—are constructed in this study using the water area data extracted from multiple temporal remote sensing images and water levels recorded at several representative hydrological stations for nearly 30 years. We have obtained several results, which are as follows.
(1)
The coupling relationship between water area and water level has been constructed by the data from remote sensing images and water levels at several hydrological stations.
(2)
It is feasible to divide Dongting Lake into three parts (EDL, SDL, and WDL), and one representive hydrological station is chosen to monitor the water level for each part of the lake in our research.
(3)
To obtain the total water area of Dongting Lake according to water levels, the regression and prediction models are effective for both polynomial regression and machine learning regression.
(4)
The validity of the machine learning method based on the BP-neural network algorithm, with an adaptively chosen number of neurons, is confirmed to calculate total water area.
(5)
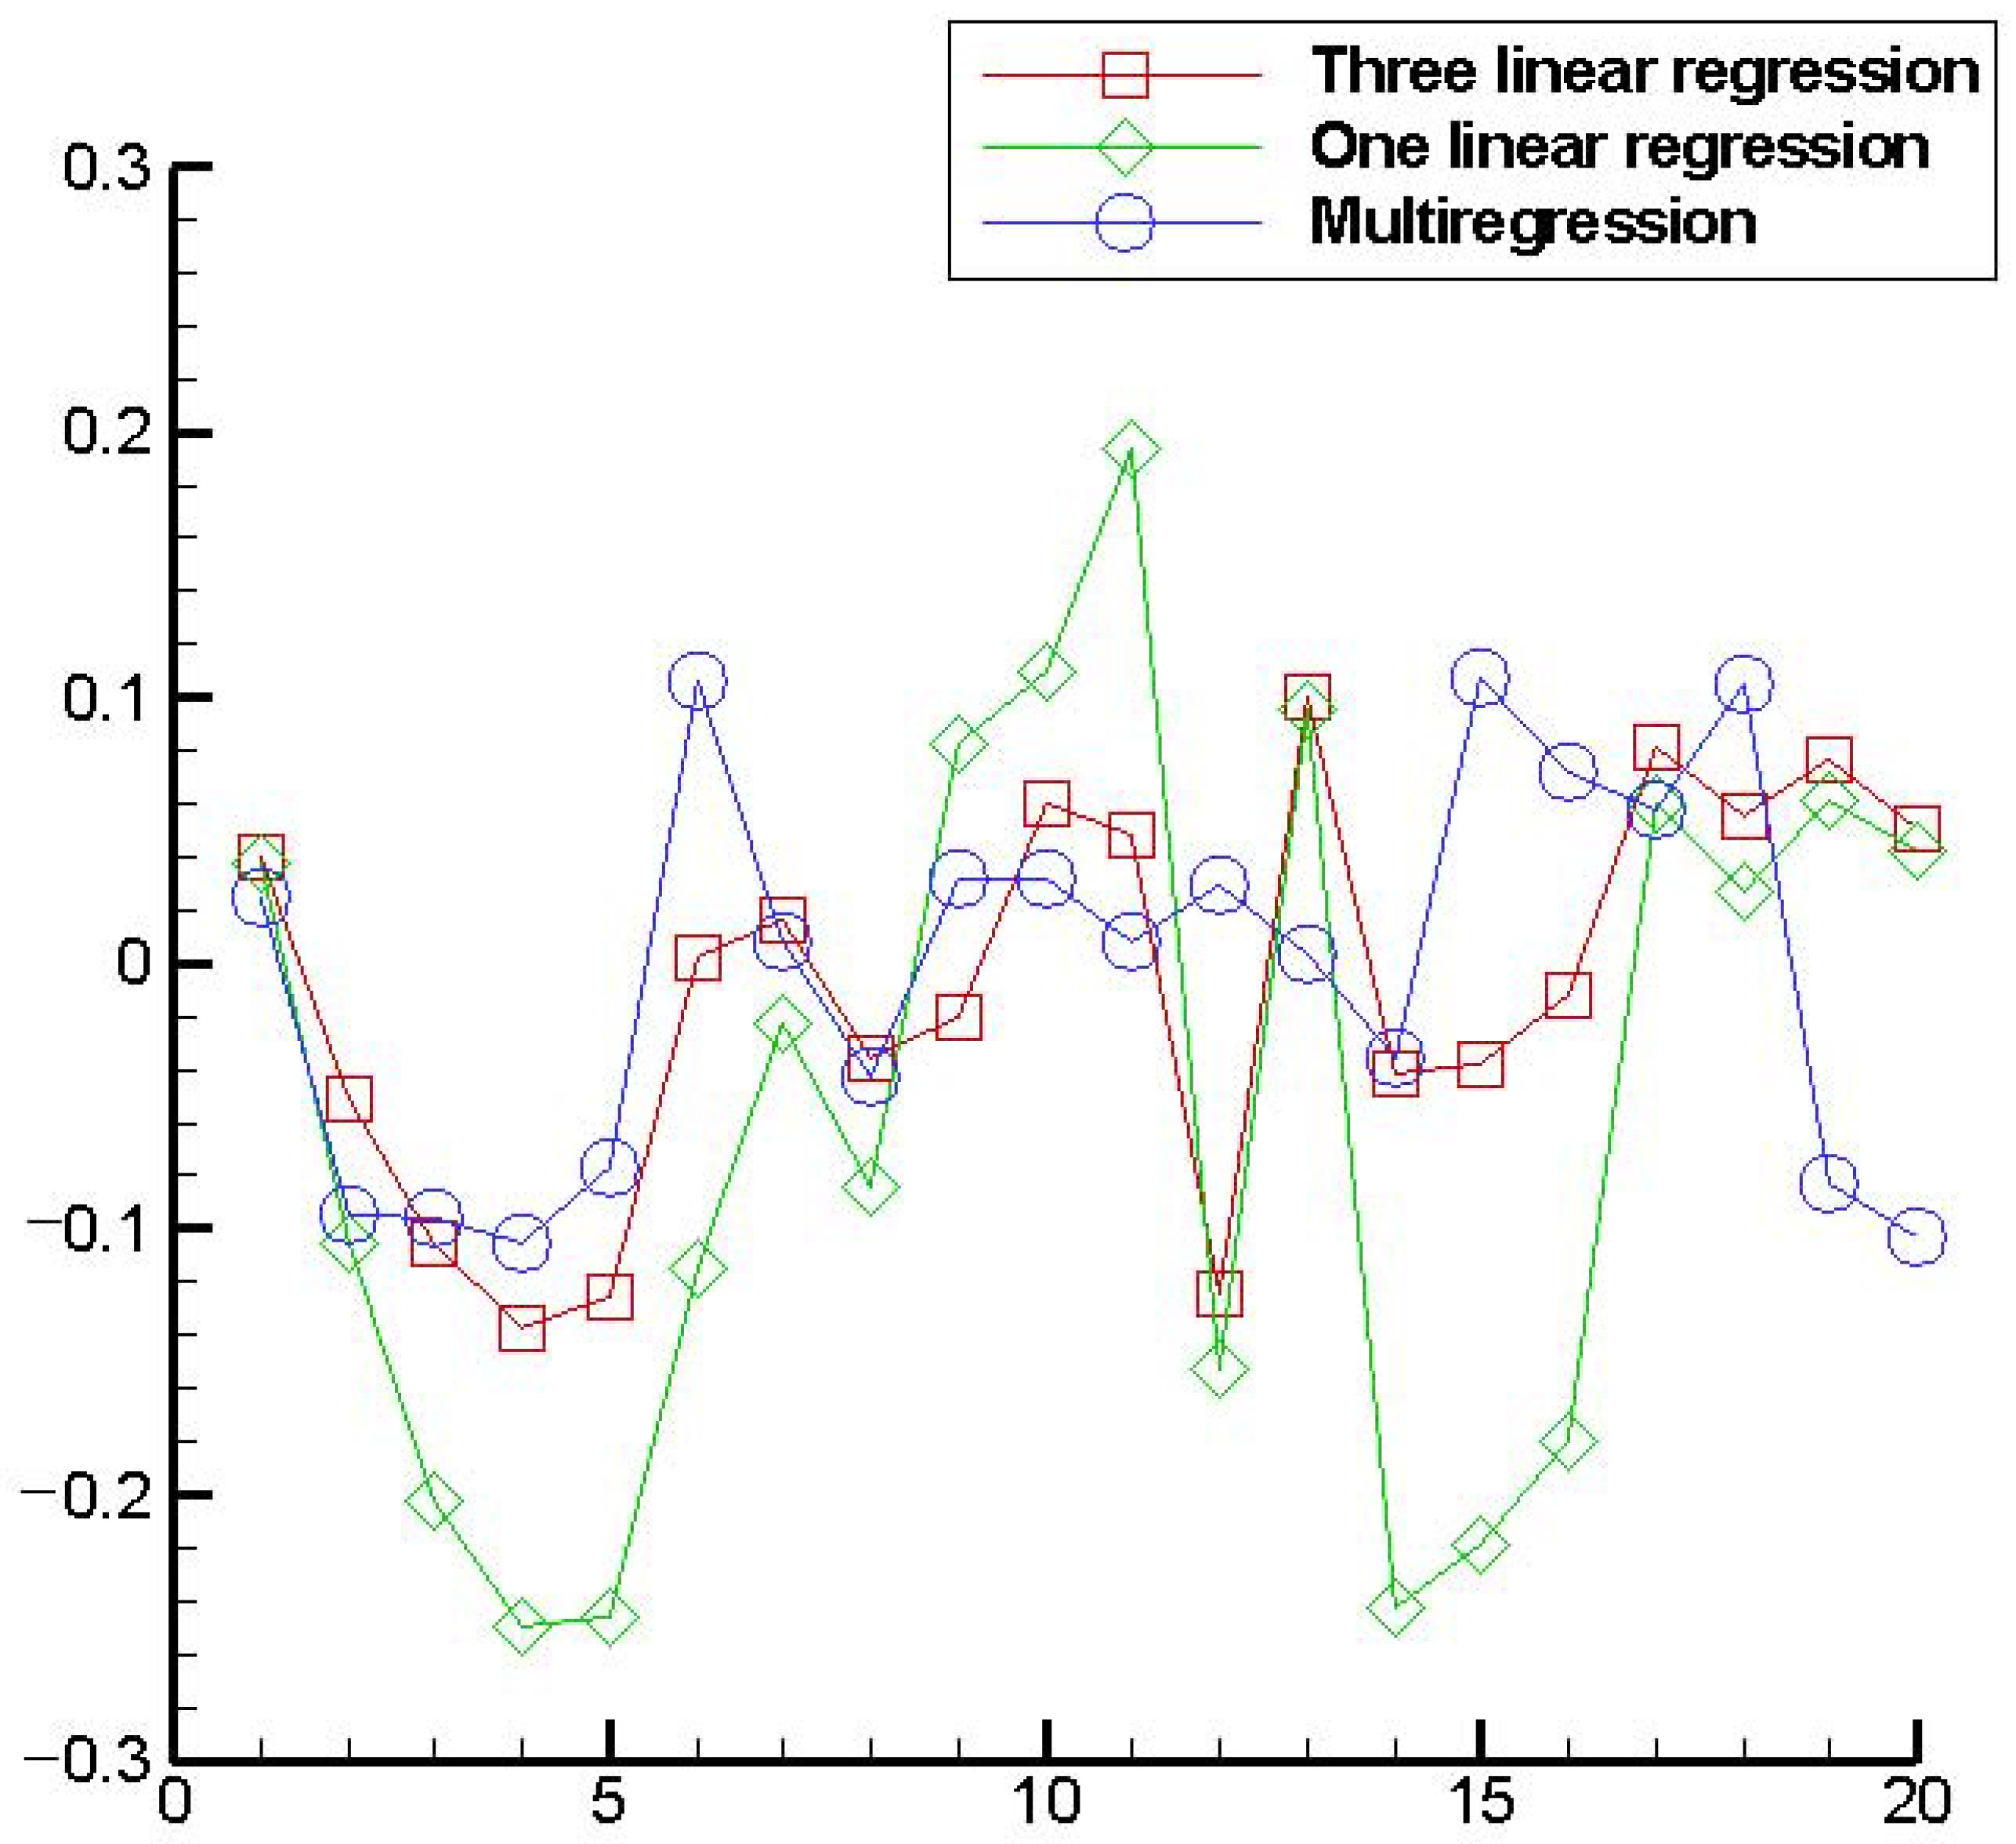
The regression methods using three variables x 1 , x 2 , x 2 are better than by simple variable x 1 .
The above results can be used for the prediction of water level or water area information. When the information of one variable is easily accessible or known, and while the value of another variable is difficult to obtain or unknown, these coupling relationships can be utilized to determine the numerical value. Especially during floods, this can provide important evidence and references for decision makers and managers when making critical decisions. Furthermore, based on the previous discussion and numerical verification, the spatial coupling relationship is reliable and highly suitable because the data used to establish the model span a long time period. Finally, we develop one novel way to predict water level or water area using the machine learning regression method. Of course, these results can also provide some references for the researchers and decision makers in studying similar big Lakes.

Author Contributions

Q.H. developed the original ideas and methodology and drafted the manuscript. C.N. undertook the studies and further developed and improved on the original ideas as reported herein. S.Y. obtained the corresponding water area and water level data. J.Z. obtained the corresponding water area and water level data. L.Q. drafted the manuscript. S.S. finished the data processing. This highlight mark need be deleted. All authors have read and agreed to the published version of the manuscript.

Funding

The work is partially funded by the Open Topic of Hunan Key Laboratory of Remote 571 Sensing Monitoring of Ecological Environment in Dongting Lake area (No. DTH Key Lab.2024-07), and by Research on Remote Sensing Monitoring of Water Quality in the Dongting Lake Basin, Environmental Protection Scientific Research Project in 2022, Project No. HBKT-2022023, Ecology and Environment Department of Hunan, and by Hunan Provincial Natural Science Foundation (No. 2024JJ8320), and by Hunan Province Natural Resources Science and Technology Plan Project (No. 20230142ST).

Data Availability Statement

The original contributions presented in this study are included in the article. Further inquiries can be directed to the corresponding author.

Acknowledgments

The authors thank Zhen Wang for the valuable discussion with us. The authors would like to thank the referees for the helpful and valuable suggestions to improve this paper greatly.

Conflicts of Interest

The authors declare no conflicts of interest.

Abbreviations

The following abbreviations are used in this manuscript:
PRpolynomial regressio
MLRmachine learning regression
LSMLeast Squares Method
CBERSChina and Brazil Earth Resource Satellite
ASARAdvanced Synthetic Aperature Radar
MODISModerate Resolution Imaging Spectroradiometer
NDWIWater Index with normalized difference
TGRThree Gorges Reservoir
CNNconvolutional neural network
EDLEast Dongting Lake
SDLSouth Dongting Lake
WDLWest Dongting Lake

References

  1. Li, Y.; He, L.; Zhang, Q.; Wang, X. Landsat TM data based study on dynamic changes of the typical wetlands of Poyang Lake. Rev. Remote Sens. Inf. 2010, 6, 48–54. [Google Scholar]
  2. Lei, C.; Xu, Z.; Zuo, D.; Li, L. Identiffcation of water bodies in the loess plateau based on Landsat TM dataset. J. Beijing Norm. Univ. (Nat. Sci.) 2016, 3, 424–430. (In Chinese) [Google Scholar]
  3. Huang, Q.; Sun, Z.; Opp, C.; Lotz, T.; Jiang, J.; Lai, X. Hydrological drought at Dongting Lake: Its detection, characterization, and challenges associated with Three Gorges Dam in central Yangtze, China Rev. Water Resour. Manag. 2014, 28, 5377–5388. [Google Scholar] [CrossRef]
  4. Silveira, M.; Heleno, S. Separation between water and Land in SAR Images using region based on level sets. IEEE Geosci. Remote. Sens. Lett. 2009, 6, 471–475. [Google Scholar] [CrossRef]
  5. Li, J.; Pei, Y.; Zhao, S.; Xiao, R.; Sang, X.; Zhang, C. A review of remote sensing for environmental monitoring in China. Remote Sens. 2020, 12, 1130. [Google Scholar] [CrossRef]
  6. Yang, H.; Kong, J.; Hu, H.; Du, Y.; Gao, M.; Chen, F. A review of remote sensing for water quality retrieval: Progress and challenges. Remote Sens. 2020, 14, 1770. [Google Scholar] [CrossRef]
  7. Godson, E.A.; Haroon, S.; James, D.; Ahmad, S. Overview of the application of remote sensing in effective monitoring of water quality parameters. Remote Sens. 2023, 15, 1938. [Google Scholar] [CrossRef]
  8. Tiit, K.; John, H.; Claudia, G.; Chris, R.; Vittorio, E.B. Remote sensing of shallow waters—A 50 year retrospective and future directions. Remote Sens. Environ. 2020, 240, 111619. [Google Scholar]
  9. Zhang, B.; Wu, Y.; Zhao, B.; Chanussot, J.; Hong, D.; Yao, J.; Gao, L. Progress and challenges in intelligent remote sensing satellite systems. IEEE J. Sel. Top. Appl. Earth Obs. Remote Sens. 2022, 15, 111619. [Google Scholar] [CrossRef]
  10. Yuan, Q.; Shen, H.; Li, T.; Li, Z.; Li, S.; Jiang, Y.; Xu, H.; Tan, W.; Yang, Q.; Wang, J.; et al. Deep learning in environmental remote sensing: Achievements and challenges. Remote Sens. Environ. 2020, 241, 111716. [Google Scholar] [CrossRef]
  11. Wang, A.; Jiang, X.; Pan, J. Comparative study between CBERS and TM Data in water pollution remote sensing monitoring. Rev. Remote Sens. 2008, 20, 46–50. [Google Scholar]
  12. Huang, C.; Chen, Y.; Zhang, S.; Wu, J. Detecting, extracting, and monitoring surface water from space using optical sensors. Rev. Geophy. 2018, 56, 333–360. [Google Scholar] [CrossRef]
  13. Hu, W.; Meng, L.; Zhang, D.; Fan, Z.; Cheng, J.; Li, X. Methods of water extraction from ZY-102C satellite imagery. Rev. Remote Sens. Land Resour. 2014, 26, 43–47. [Google Scholar]
  14. Cai, X. The Change Analysis of Water Stage and Beach Wetland in Poyang Lake with the Aid of Multi-Temporal Active and Passive Remote Sensing Data. Ph.D. Dissertation, University of Wuhan, Wuhan, China, 2010. (In Chinese). [Google Scholar]
  15. Ding, X.; Li, X. Monitoring of the water-area variations of Lake Dongting in China with ENVISAT ASAR images. Int. J. Appl. Earth. Obs. 2011, 13, 894–901. [Google Scholar] [CrossRef]
  16. Hu, Y.; Huang, J.; Du, Y.; Han, P.; Huang, W. Monitoring spatial and temporal dynamics of flood regimes and their relation to wetland time-series imagery. Remote Sens. 2015, 7, 7494–7520. [Google Scholar] [CrossRef]
  17. Paul, A.; Tripathi, D.; Dutta, D. Application and comparison of advanced supervised classifiers in extraction of water bodies from remote sensing images. Sustain. Water Resour. Manag. 2017, 4, 905–919. [Google Scholar] [CrossRef]
  18. Manag, E.F.; Nascimento; Lazy, D.; Azevedo, S.; Candeias, A.B.; Tavares, J.R. Comparison of water index for MUX or CBERS-4 digital number and monochrome reffectance images. J. Hyperspectral Remote Sens. 2020, 10, 34–44. [Google Scholar]
  19. Serban, S.; Maftei, C.; Dobrica, C. Surface water change detection via water indices and predictive modeling using remote sensing imagery: A case study of Nuntasi-Tuzla Lake. Romania. Water 2022, 14, 556. [Google Scholar] [CrossRef]
  20. Chen, X.; Li, X.; Xie, Y.; Li, F.; Hou, Z.; Zeng, J. Combined influence of hydrological gradient and edaphic factors on the distribution of macrophyte communities in Dongting Lake wetlands, China. Wetl. Ecol. Manag. 2015, 23, 481–490. [Google Scholar] [CrossRef]
  21. Cui, L.; Li, Y.; Huang, G.; Zeng, X. Dynamic changes of Dongting Lake based on Landsat-TM remote sensing data. Rev. South North Water Transf. Water Sci. Tech. 2015, 13, 63–66. [Google Scholar]
  22. Kameyama, S.; Zhang, J.; Wang, Q.; Xu, K.; Katoh, T.; Masataka, W. An approach to estimate the water level and volume of Dongting Lake using Terra/MODIS data. Rev. Acta Geogr. Sin. 2004, 59, 88–94. [Google Scholar]
  23. Li, H.; Li, C.; Zhang, L.; Tian, L. Relationship between water level and water area in Poyang Lake based in MODIS image. Quater. Sci. 2008, 28, 332–337. [Google Scholar]
  24. Lu, S.; Ouyang, N.; Wu, B.; Wei, Y.; Tesemma, Z. Lake water volume calculation with time series remote-sensing images. Int. J. Remote Sens. 2013, 34, 7962–7973. [Google Scholar] [CrossRef]
  25. Tong, X.; Pan, H.; Xie, H.; Xu, X.; Li, F.; Chen, L.; Luo, X.; Liu, S.; Chen, P.; Jin, Y. Estimating water volume variations in Lake Victoria over the past 22 years using multi-mission altimetry and remotely sensed images. Remote Sens. Environ. 2016, 187, 400–413. [Google Scholar] [CrossRef]
  26. Du, T.; Xiong, L.; Yi, F.; Xiao, Y.; Song, Q. Relation of the water area of Dongting Lake to the water level of Hydrological stations based on MODIS images. Rev. Resour. Environ. Yangtze Basin 2012, 21, 756–765. (In Chinese) [Google Scholar]
  27. Ke, W.; Chen, C.; Ji, H.; Chen, M.; Liu, Y. A loop-like relationship between water surface area of Lake Dongting and water level at Chenglingji, the Yangtze River. J. Lake Sci. 2017, 29, 753–764. [Google Scholar]
  28. Peng, H.; Zhang, J.; Liang, J.; Chen, H. Monitoring the changes of water area and its relation with water levels of hydrological station in East Dongting Lake. Resour. Environ. Yangtze Basin 2020, 12, 2770–2780. [Google Scholar]
  29. Jiang, Y.; Wen, Y.; Zhao, G.; Li, X.; Ju, R. Monitoring hydrological characteristics of east Dongting Lake based on sentinel-remote sensing dada. J. Hunan Norm. Univ. (Nat. Sci.) 2023, 46, 88–96. [Google Scholar]
  30. Yang, L.; Wang, L.; Zhang, M.; Niu, Z.; Yao, R.; Yu, D.; Li, C.; He, Q. Variation of water body in Dongting Lake from in situ measurements and MODIS observations in recent decades. Int. J. Digital Earth 2021, 14, 959–984. [Google Scholar] [CrossRef]
  31. Xu, Y.; Li, J.; Wang, J.; Chen, J.; Liu, Y.; Ni, S.; Zhang, Z.; Ke, C. Assessing Water Storage Changes of Lake Poyang from Multi-Mission Satellite Data and Hydrological Models. J. Hydrol. 2020, 590, 125229. [Google Scholar] [CrossRef]
  32. Yuan, Y.; Zeng, G.; Liang, J.; Huang, L.; Hua, S.; Li, F.; Zhu, Y. Variation of water level in Dongting Lake over a 50-year period: Implications for the impacts of anthropogenic and climatic factors. Rev. J. Hydrol. 2015, 525, 450–456. [Google Scholar] [CrossRef]
  33. Cheng, J.; Xu, L.; Wang, Q.; Yan, B.; Wan, R.; Jiang, J. Temporal and spatial variations of water level and its driving forces in Lake Dongting over the last three decades. J. Lake Sci. 2017, 29, 974–983. [Google Scholar]
  34. Cheng, H.; Xiang, T.; Tang, C. Abnormal fluctuation of water level in the Chenglingji reach of the middle Yangtze River during flood seasons, 2016–2020: Influencing factors and filtering correction. J. Lake Sci. 2022, 34, 286–295. [Google Scholar]
  35. Wang, M.; Dai, L.; Dai, H.; Liang, L. Support vector regression based model for predicting water level of Dongting Lake. J. Drain. Irrig. Mach. Eng. 2017, 35, 954–960. [Google Scholar]
  36. Yuan, Y.; Liang, J.; Huang, L.; Yu, X.; Peng, Y.; Zeng, G. Prediction of the water level fluctuation of Dongting Lake based on BP neural network. J. Water Resour. Res. 2012, 1, 222–226. [Google Scholar] [CrossRef]
  37. Chen, Y.; Fan, R.; Yang, X.; Wang, J.; Latif, A. Extraction of urban water bodies from high resolution remote-sensing imagery using deep learning. Water 2018, 10, 585. [Google Scholar] [CrossRef]
  38. Liang, C.; Li, H.; Lei, M.; Du, Q. Dongting Lake water level forecast and its relationship with the Three Gorges Dam based on a long short-term memory network. Water 2018, 10, 1389. [Google Scholar] [CrossRef]
  39. Guo, Y.; Lai, X. Research on water level prediction of Dongting Lake based on recurrent neural network. Resour. Environ. Yangtze Basin 2021, 30, 689–698. [Google Scholar]
  40. Ma, J.; Lei, D.; Ren, Z.; Tan, C.; Ding, X.; Guo, H. Automated Machine Learning-Based Landslide Susceptibility Mapping for the Three Gorges Reservoir Area, China. Math. Geosci. 2024, 56, 975–1010. [Google Scholar] [CrossRef]
  41. Yu, S.; Wang, L.; Xia, W.; Yu, D.; Li, C.; He, Q. Spatio-temporal evolution of riparian lakes in Dongting Lake area since the late Qing Dynasty. Acta Geogr. Sin. 2020, 75, 2346–2361. [Google Scholar]
  42. Long, Y.; Wu, C.; Jiang, C.; Hu, S. Estimating real-time water area of Dongting Lake using water level information. Water 2019, 11, 1240. [Google Scholar] [CrossRef]
Figure 1. Location of Dongting Lake. The lake has four tributaries and is connected to the Yangtze River through three outlets and Chenglingji.
Water 17 00199 g001
Figure 2. Partial results on water bodies delimitated annually by different types and different period images of Dongting Lake.
Water 17 00199 g002
Figure 3. Positive correlationship between water area and water level: (a) EDL. (b) SDL. (c) WDL.
Water 17 00199 g003
Figure 4. Three-layer BP neural network structure diagram.
Water 17 00199 g004
Figure 5. The relationship between total water area in DL and water level in EDL.
Water 17 00199 g005
Figure 6. (a) The relationship between water area y 1 and water level x 1 in EDL. (b) The confidence intervals.
Water 17 00199 g006
Figure 7. (a) The relationship between water area y 2 and water level x 2 in SDL. (b) The confidence intervals.
Water 17 00199 g007
Figure 8. (a) The relationship between water area y 3 and water level x 3 in WDL. (b) The confidence intervals.
Water 17 00199 g008
Figure 9. (a) The scatter plots: above (total water area and water level at Chenglinji), middle (total water area and water level at Yangliutan), and bottom (total water area and water level at Xiaoheju). (b) Studentized residual plot.
Water 17 00199 g009
Figure 10. The training, testing, and verifying performance error curves: (a) For EDL. (b) For SDL. (c) For WDL.
Water 17 00199 g010
Figure 11. The regression results, including training, verification, testing, and total: (a) For EDL. (b) For SDL. (c) For WDL.
Water 17 00199 g011
Figure 12. The comparative results on testing values and the expected values: (a) For EDL. (b) For SDL. (c) For WDL.
Water 17 00199 g012
Figure 13. The training, testing, and verifying performance error curves for obtaining total water area: (a) Single variable regression. (b) Multivariable regression.
Water 17 00199 g013
Figure 14. The regression results, including the training, the verification, the testing, and the total for total water area: (a) Single variable regression. (b) Multivariable regression.
Water 17 00199 g014
Figure 15. The comparisons of the relative errors for testing data about one linear regression, three linear regressions, and multivariable regression, respectively.
Water 17 00199 g015
Figure 16. The comparison of relative regression results with water level at Chenglingji: (a) Linear regression for EDL. (b) Linear regression for DL.
Water 17 00199 g016
Table 1. Results compared with three regression ways for total water area of Dongting Lake on 8 August 2023.
EDLSDLWDL Total Area
L w 25.429.7128.39Way 1Way 2Way 3
S w y 1 y 2 y 3 By (3) y i By (8)
S m 510.286.69298.82947.91836.94895.74
S t 44681.25291.98839.23839.23839.23
E s 9.496.712.2912.890.276.70
Table 2. Results compared with three regression ways for total water area of Dongting Lake on 7 October 2023.
EDLSDLWDL Total Area
L w 2629.227.99Way 1Way 2Way 3
S w y 1 y 2 y 3 By (3) y i By (8)
S m 563.10877.68283.091023.16923.88864.34
S t 516.3576.12286.85879.32879.23879.23
E s 9.052.061.3316.355.061.70
Disclaimer/Publisher’s Note: The statements, opinions and data contained in all publications are solely those of the individual author(s) and contributor(s) and not of MDPI and/or the editor(s). MDPI and/or the editor(s) disclaim responsibility for any injury to people or property resulting from any ideas, methods, instructions or products referred to in the content.

