Assessment of Future Climate Change in the Huaihe River Basin Using Bias-Corrected CMIP5 GCMs with Consideration of Climate Non-Stationarity
Abstract
1. Introduction
2. Study Area and Data
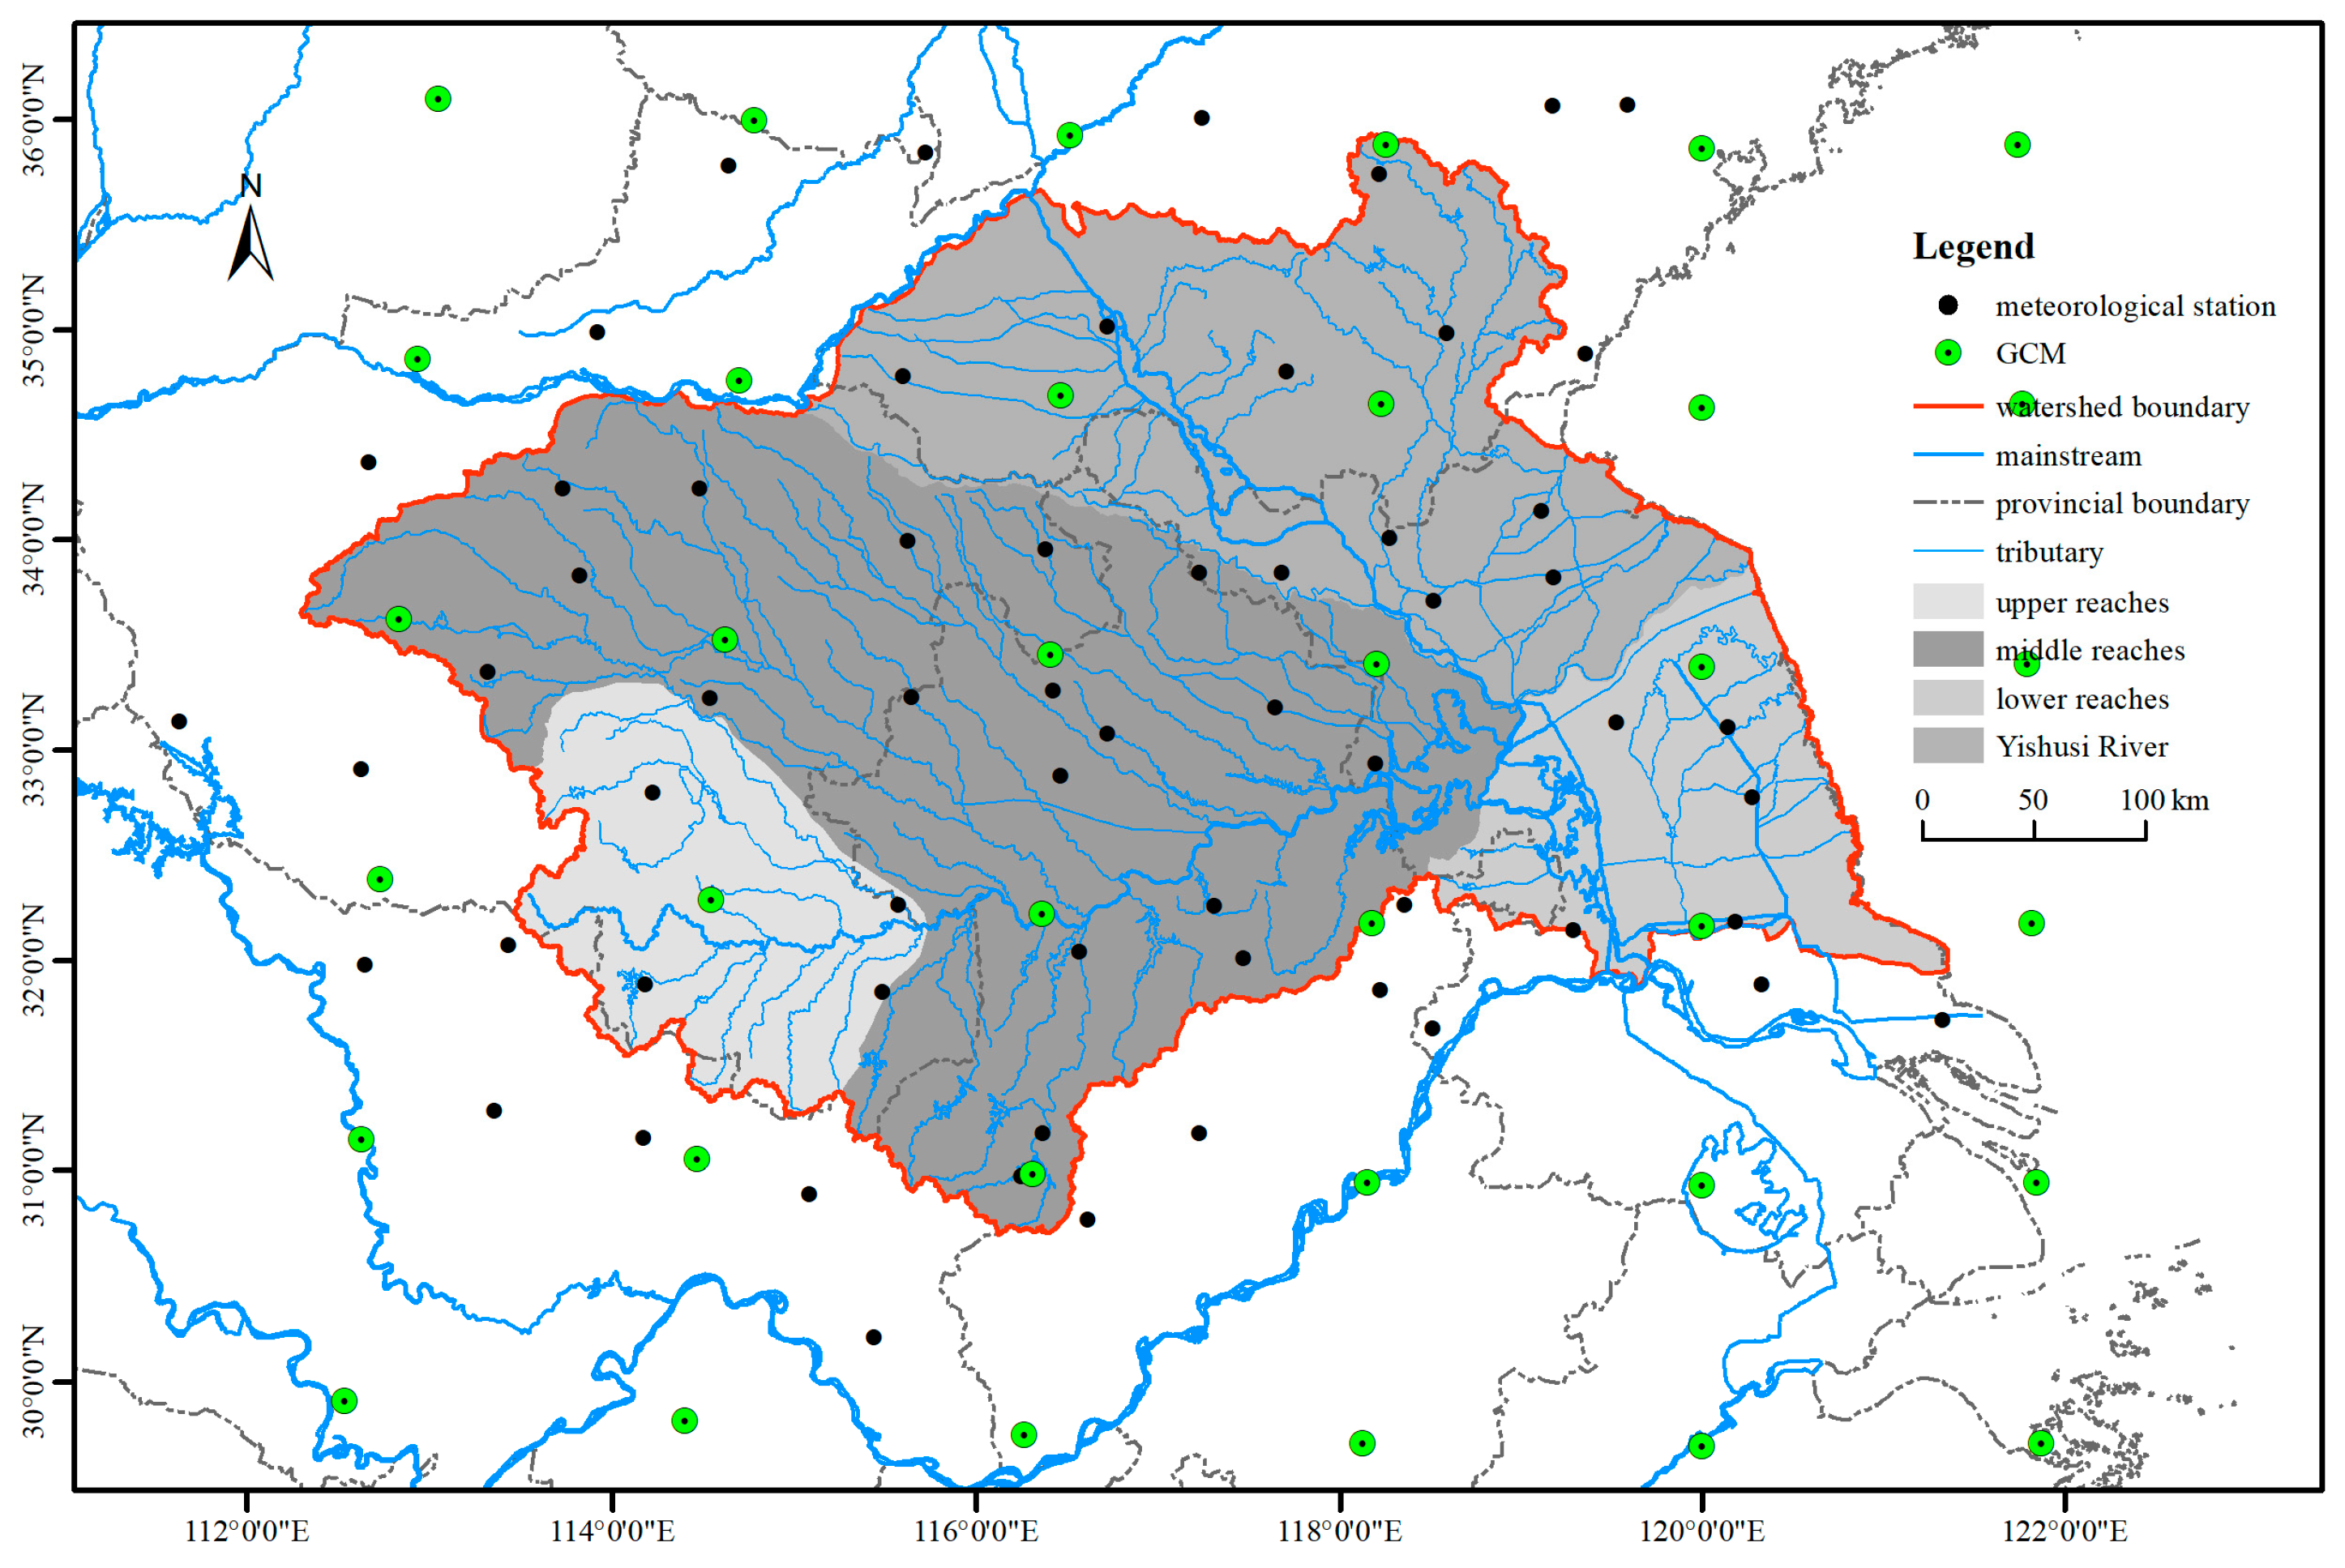
2.1. Study Area
2.2. Observed Data
3. Methodology
3.1. Coupled Model Intercomparison Project 5
3.2. Spatial Interpolation Methods
3.2.1. Inverse Distance Weighting
3.2.2. Ordinary Kriging
3.2.3. Global Polynomial Interpolation
3.2.4. Local Polynomial Interpolation
3.2.5. Radial Basis Function
3.2.6. Comprehensive Index of Spatial Interpolation
3.3. GCMs Performance Evaluation Methods
3.3.1. Taylor Diagram
3.3.2. Comprehensive Index of Evaluating Model Skill
3.4. Bias Correction Methods
3.4.1. Delta Method
3.4.2. Quantile Mapping
3.4.3. Improved Quantile Mapping
4. Results and Discussion
4.1. Optimal Spatial Interpolation Method
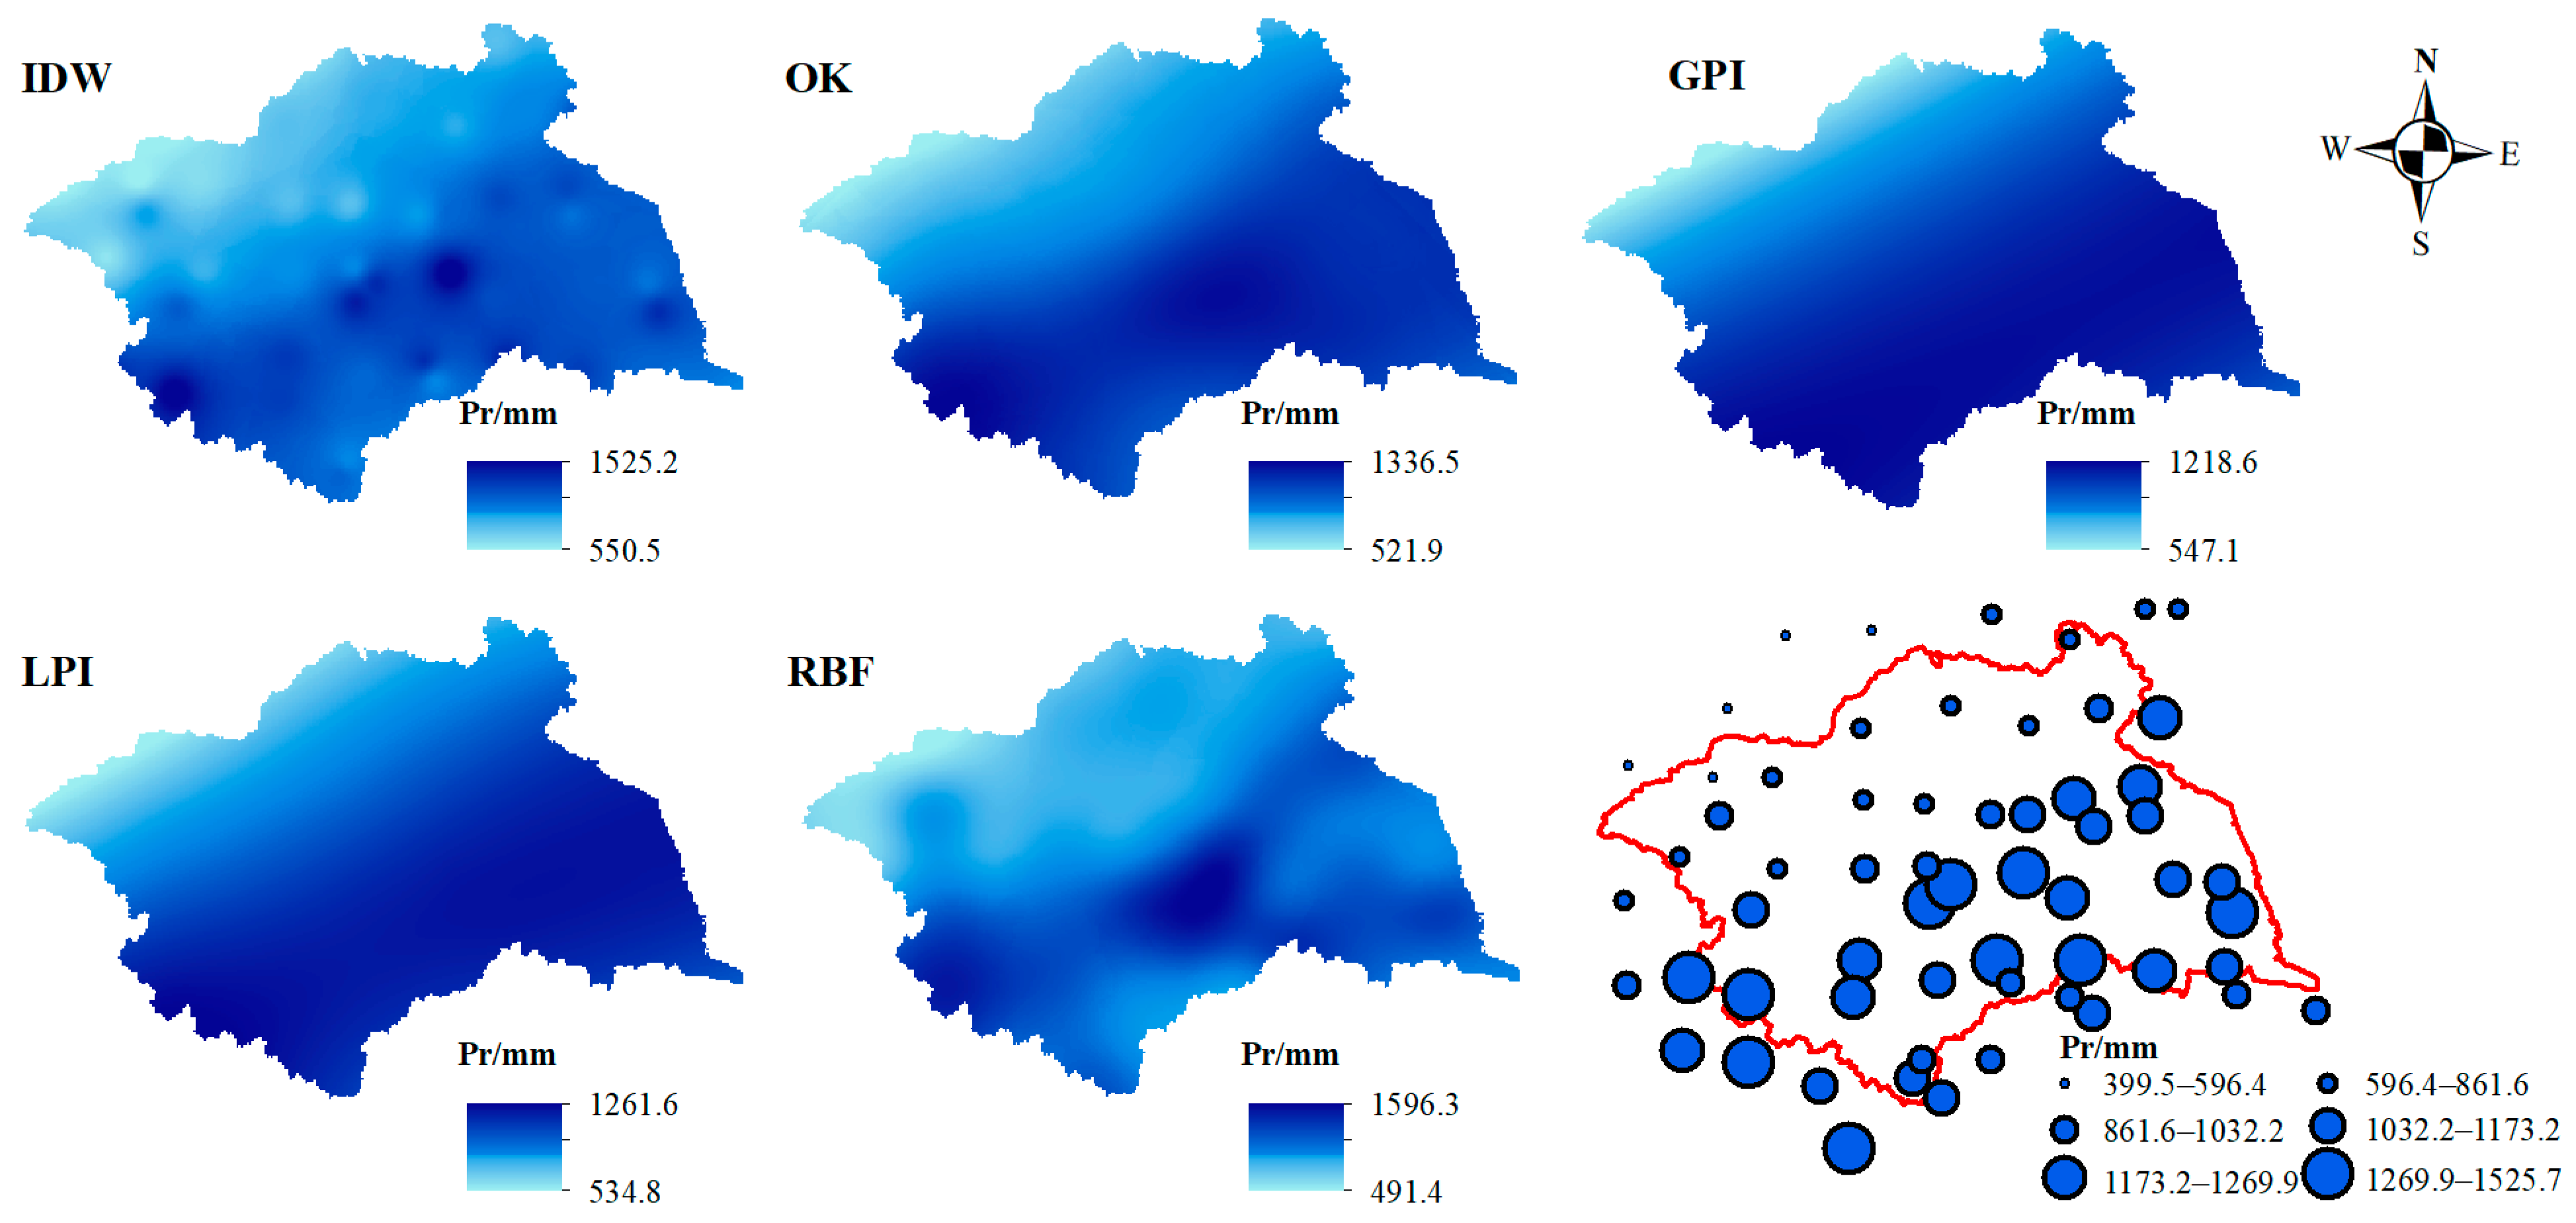
4.1.1. Rainfall
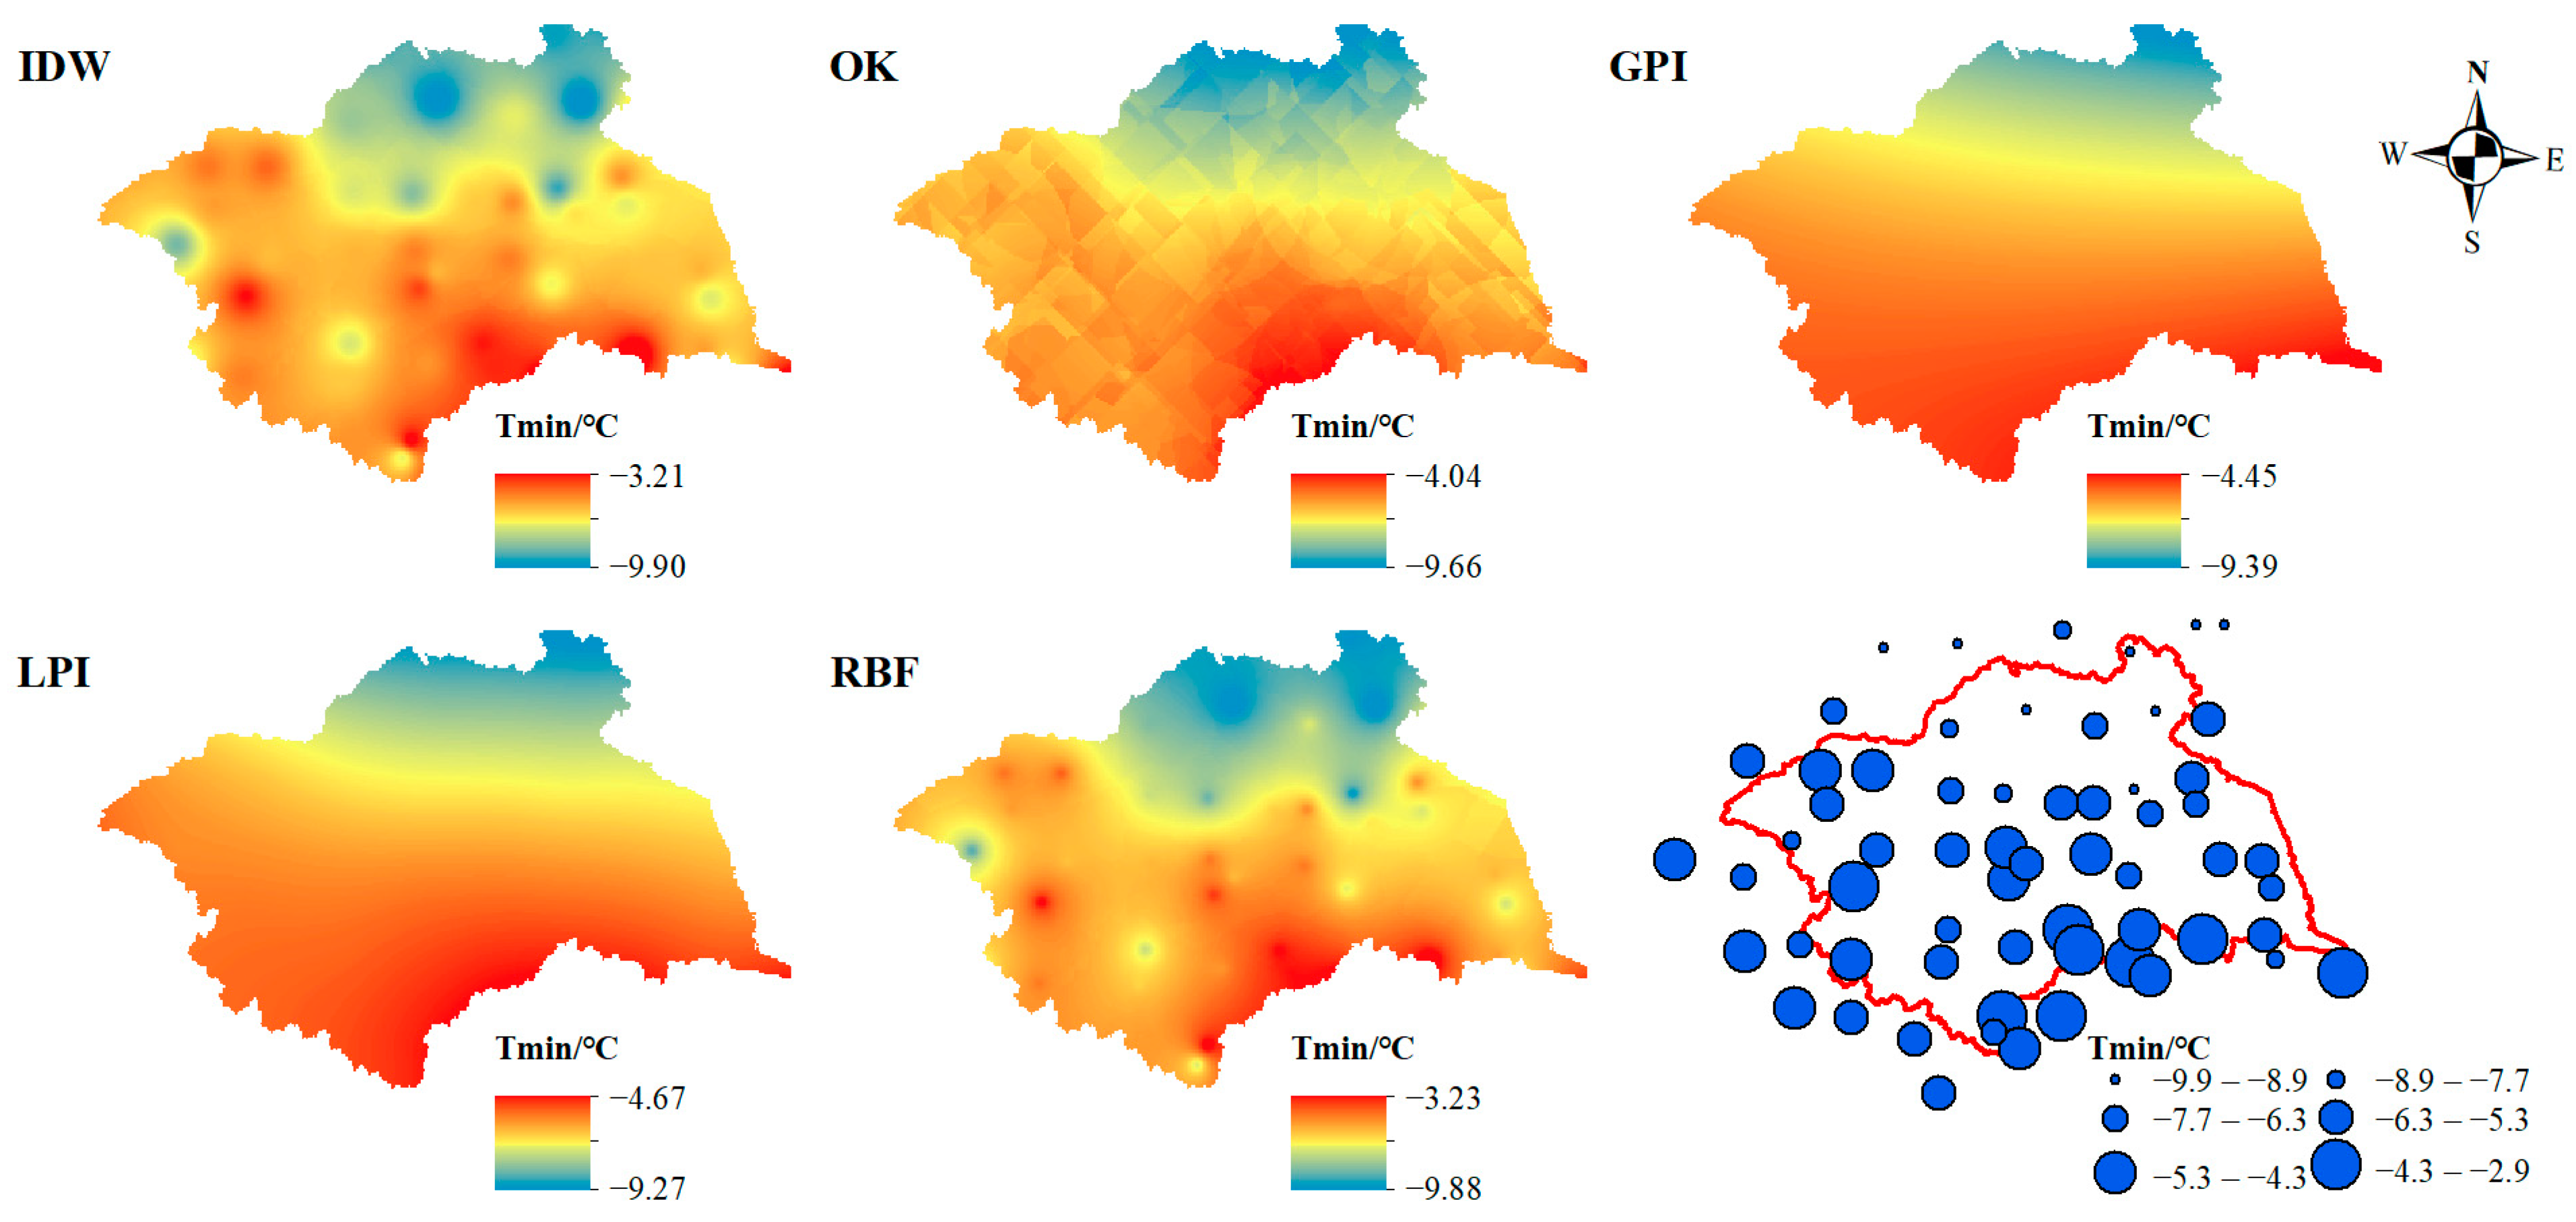
4.1.2. Air Temperature
4.2. GCM Performance Evaluation
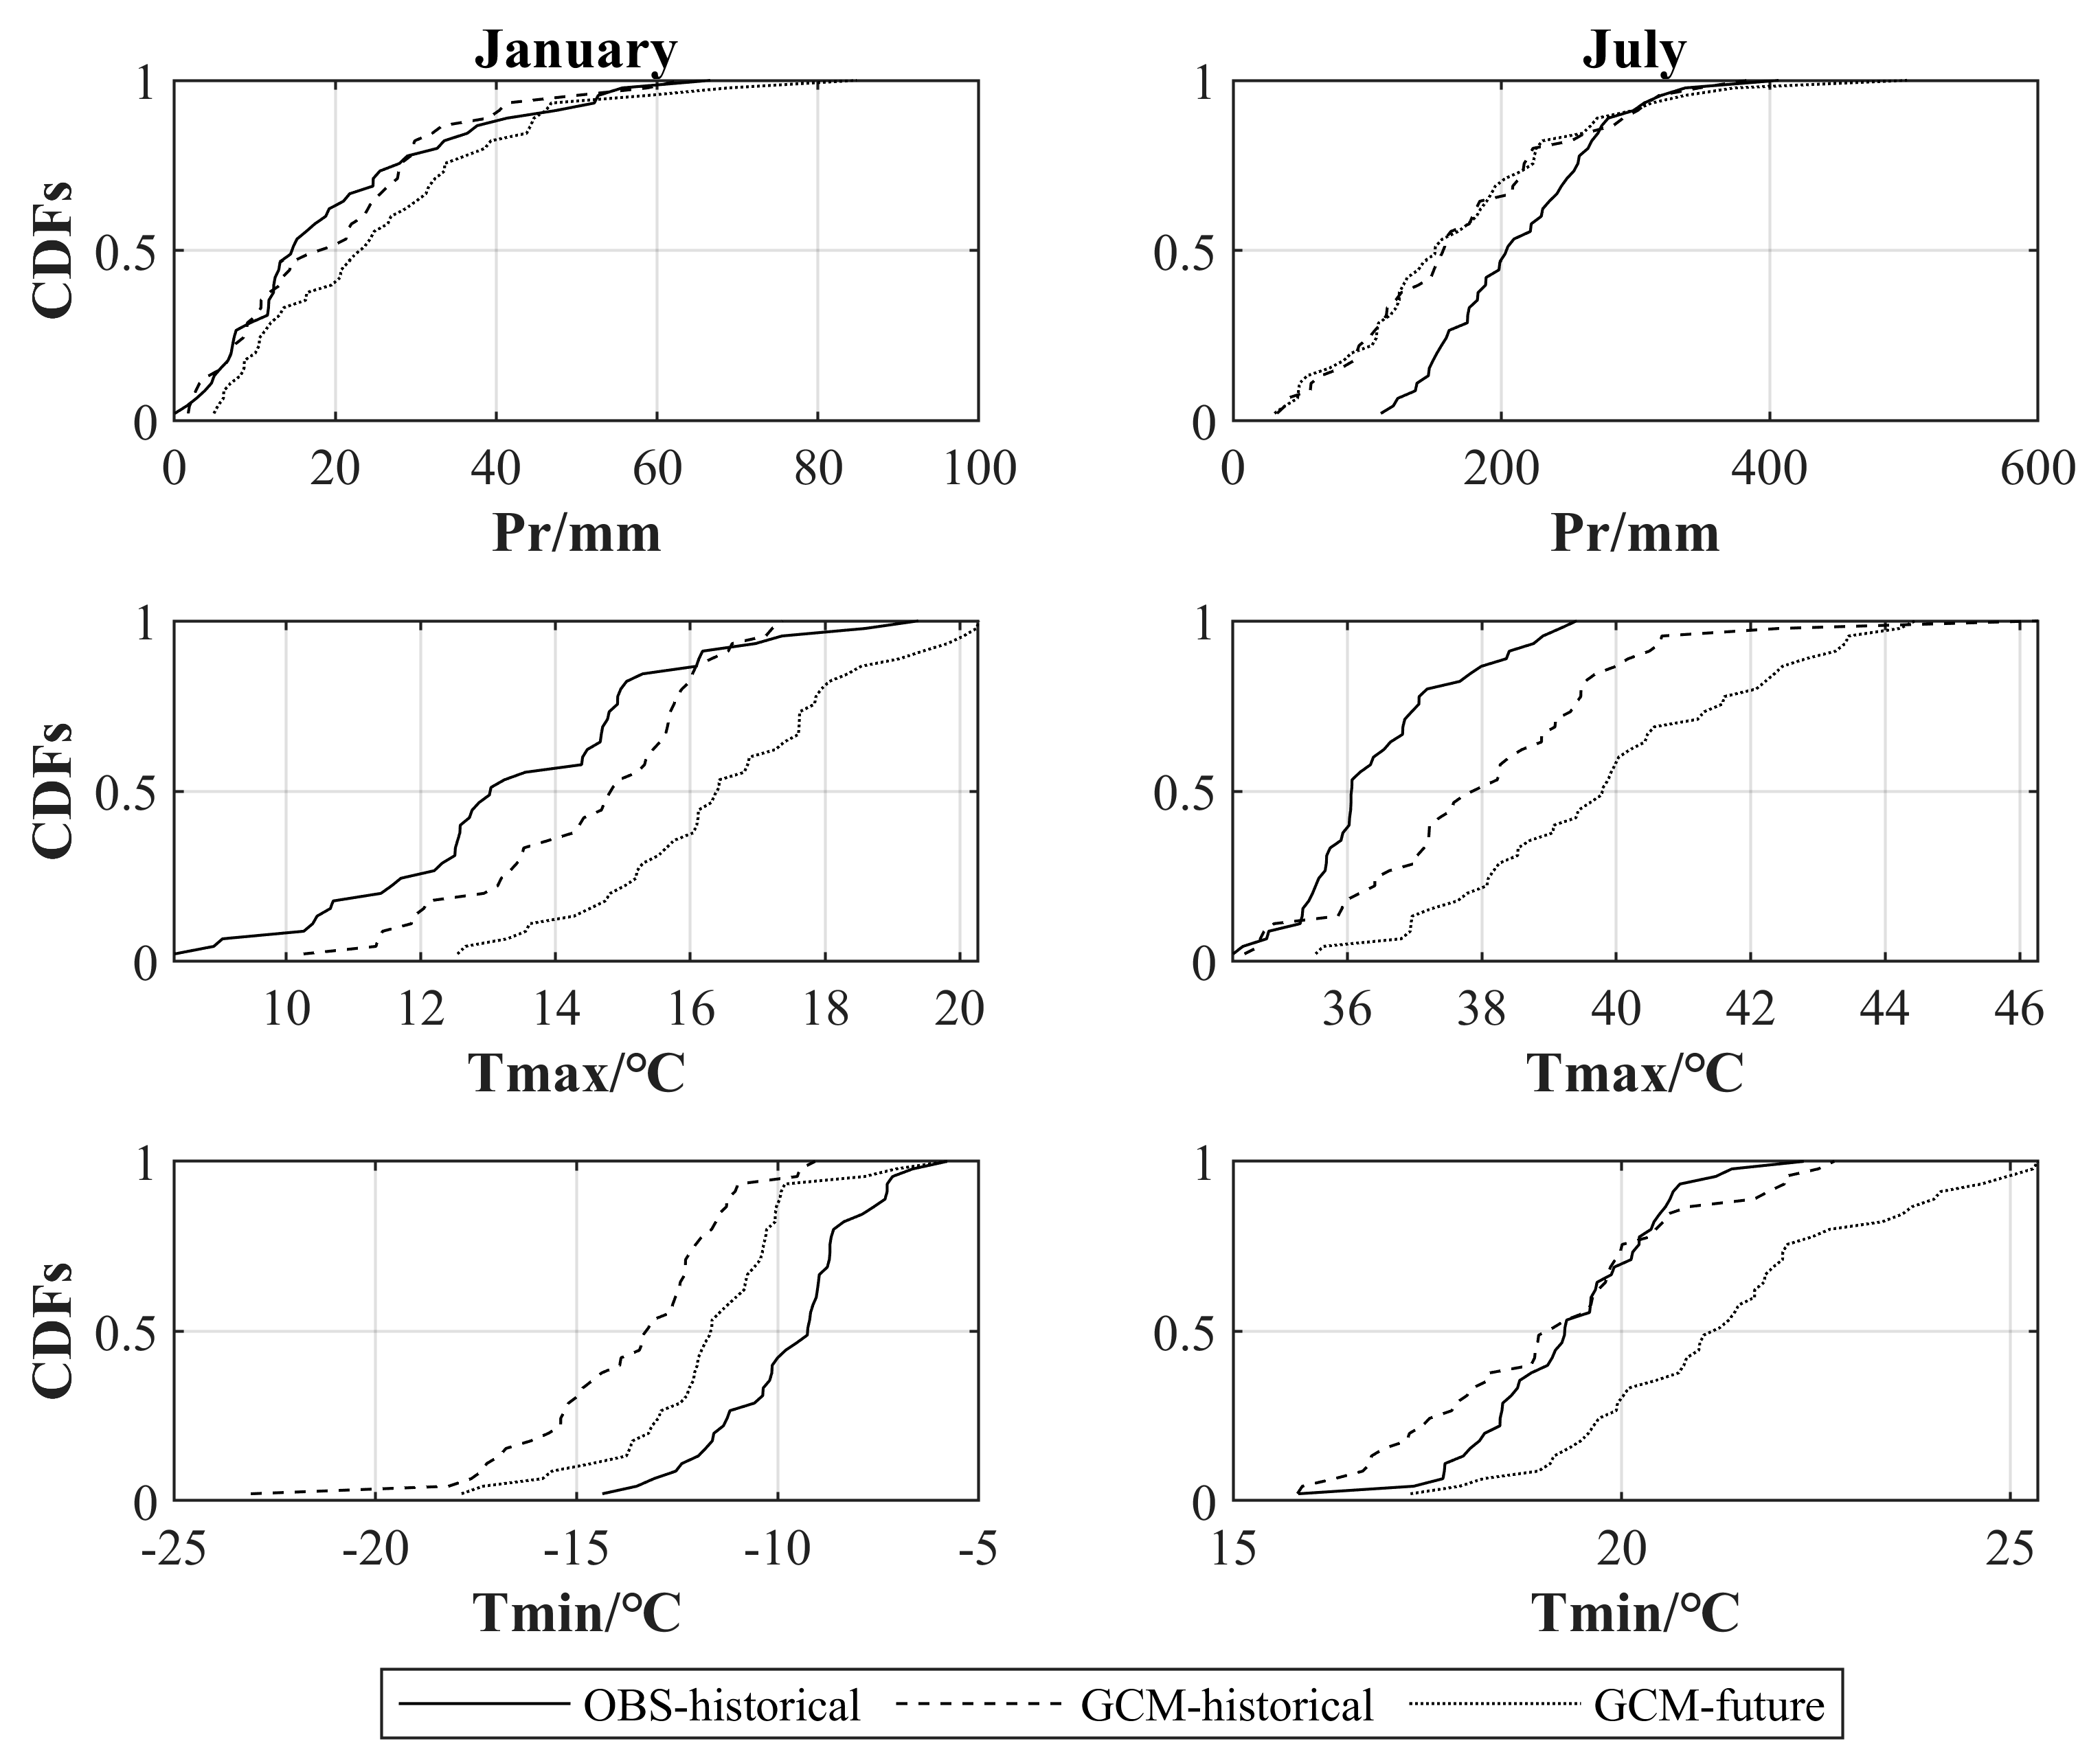
4.3. Evaluation of GCM Bias Correction Methods
4.4. Future Climate Projections
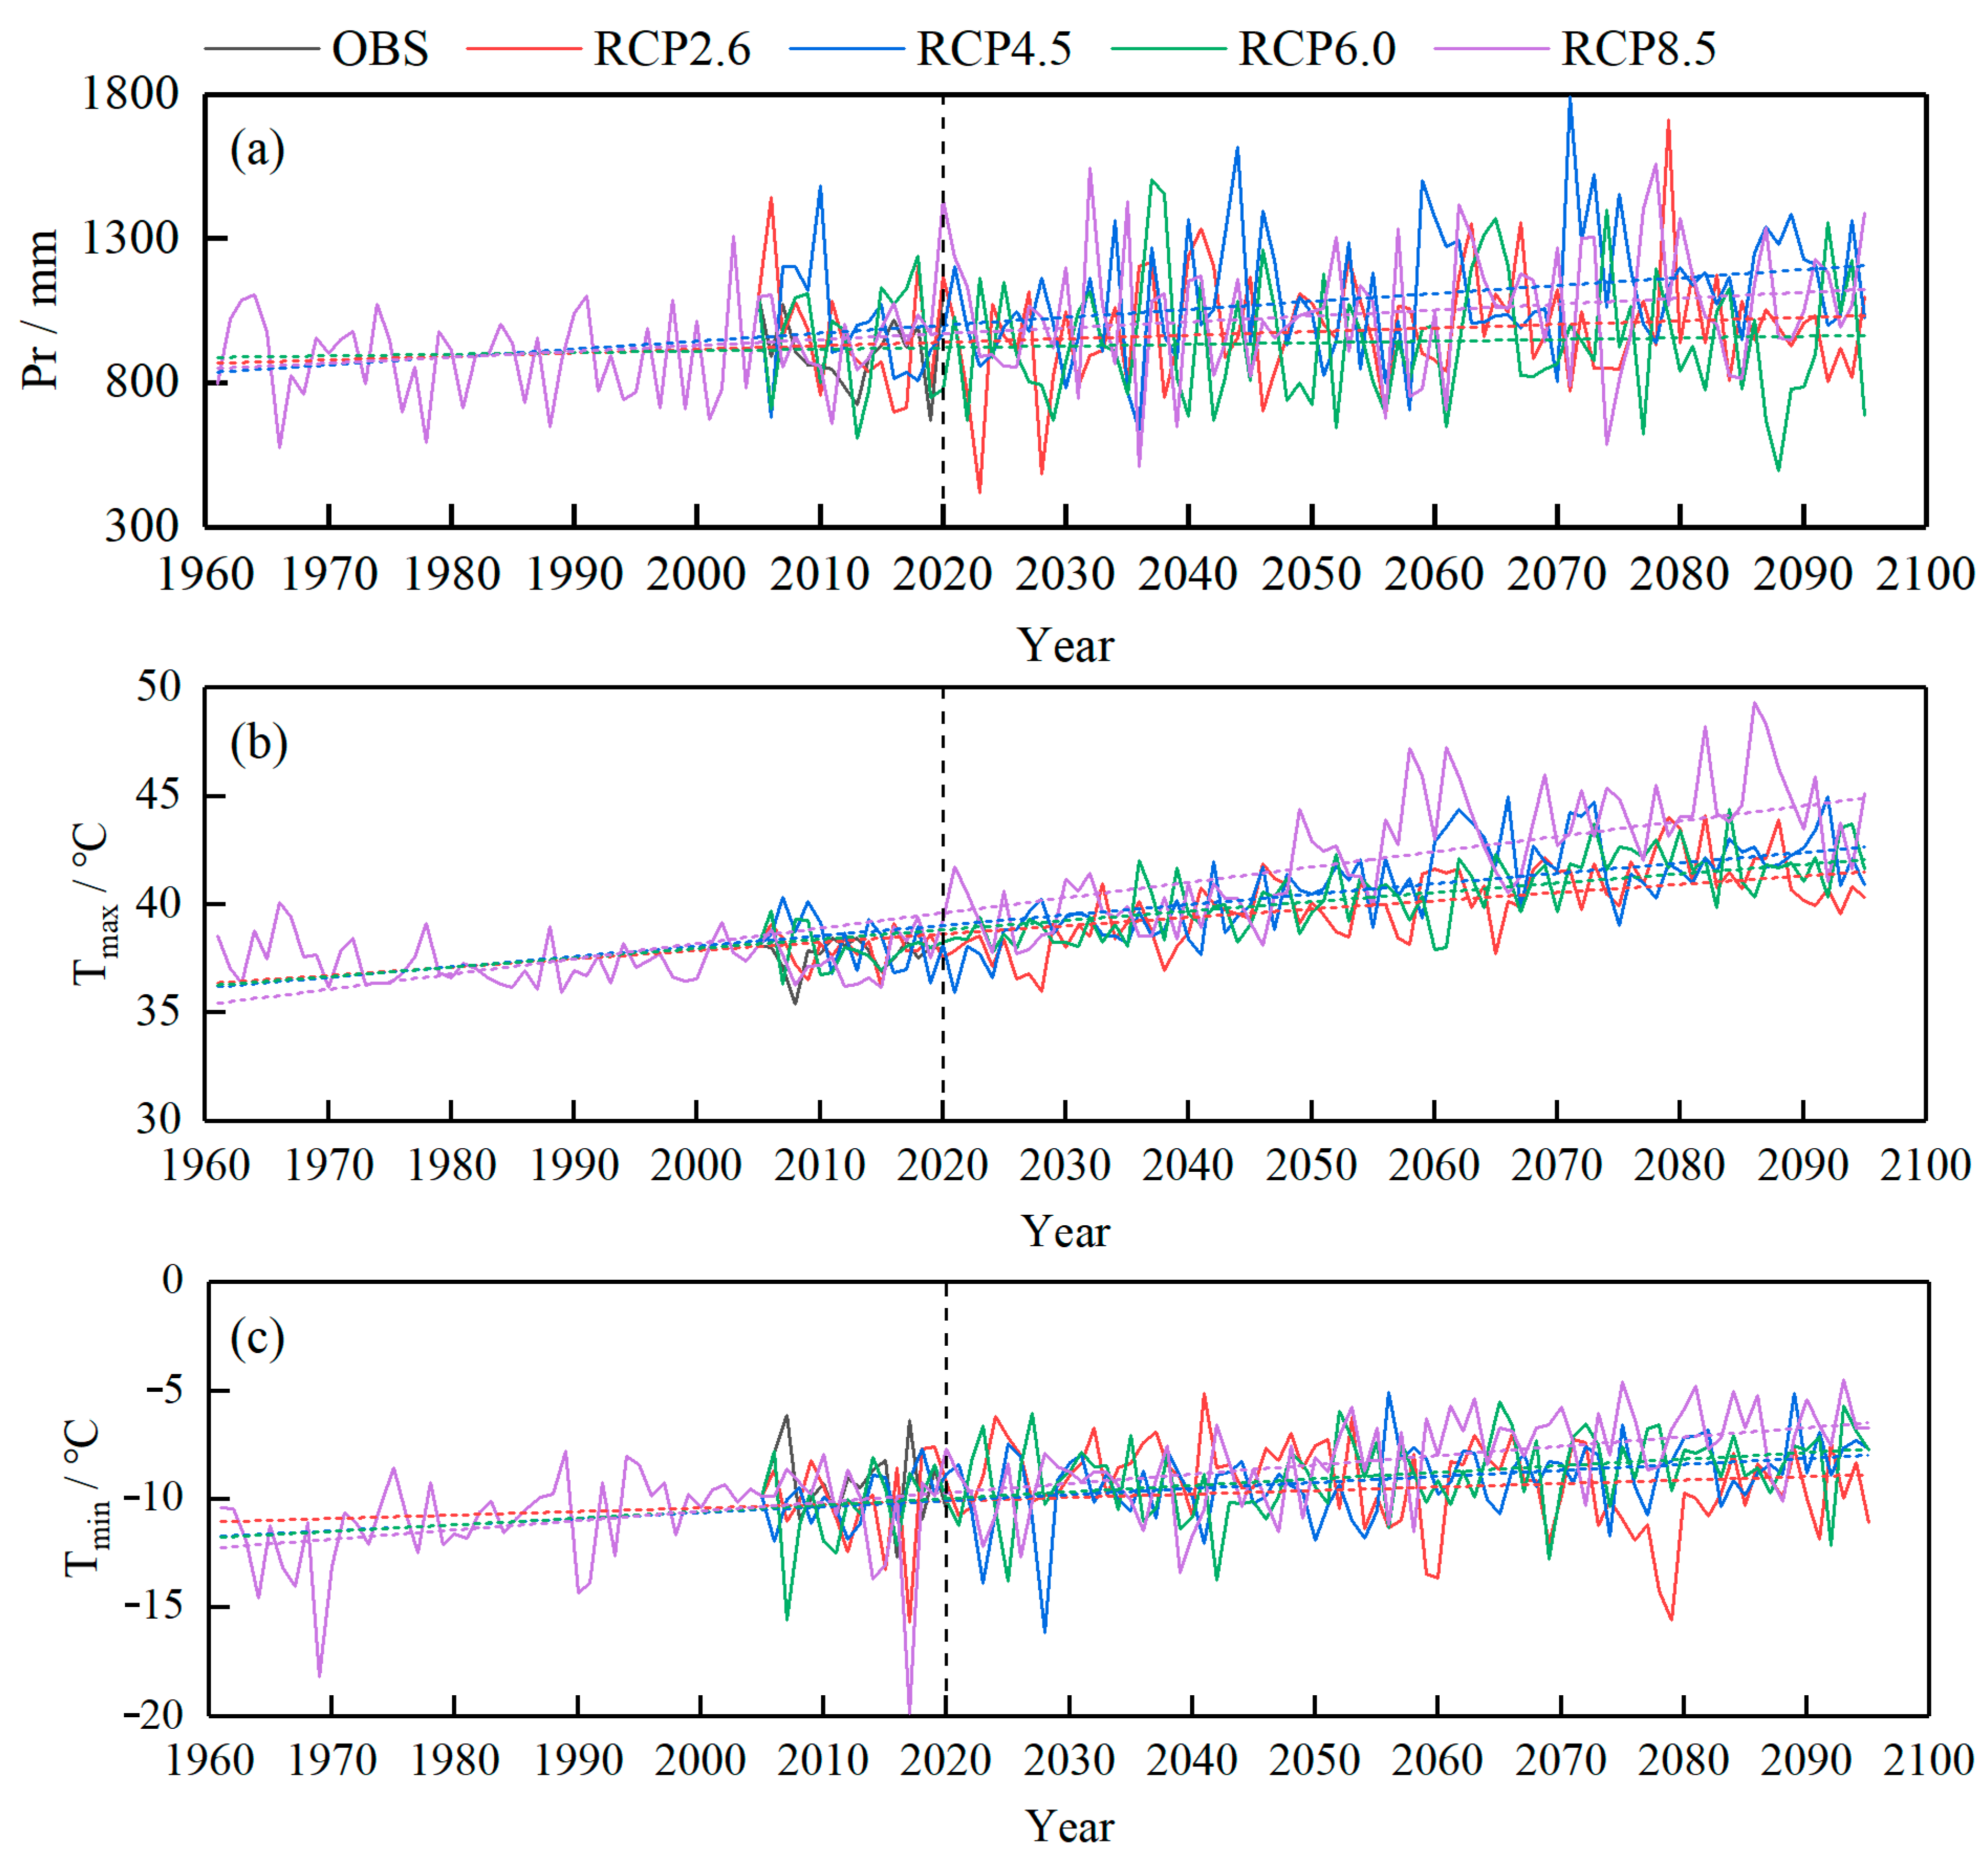
4.4.1. Inter-Annual Variation
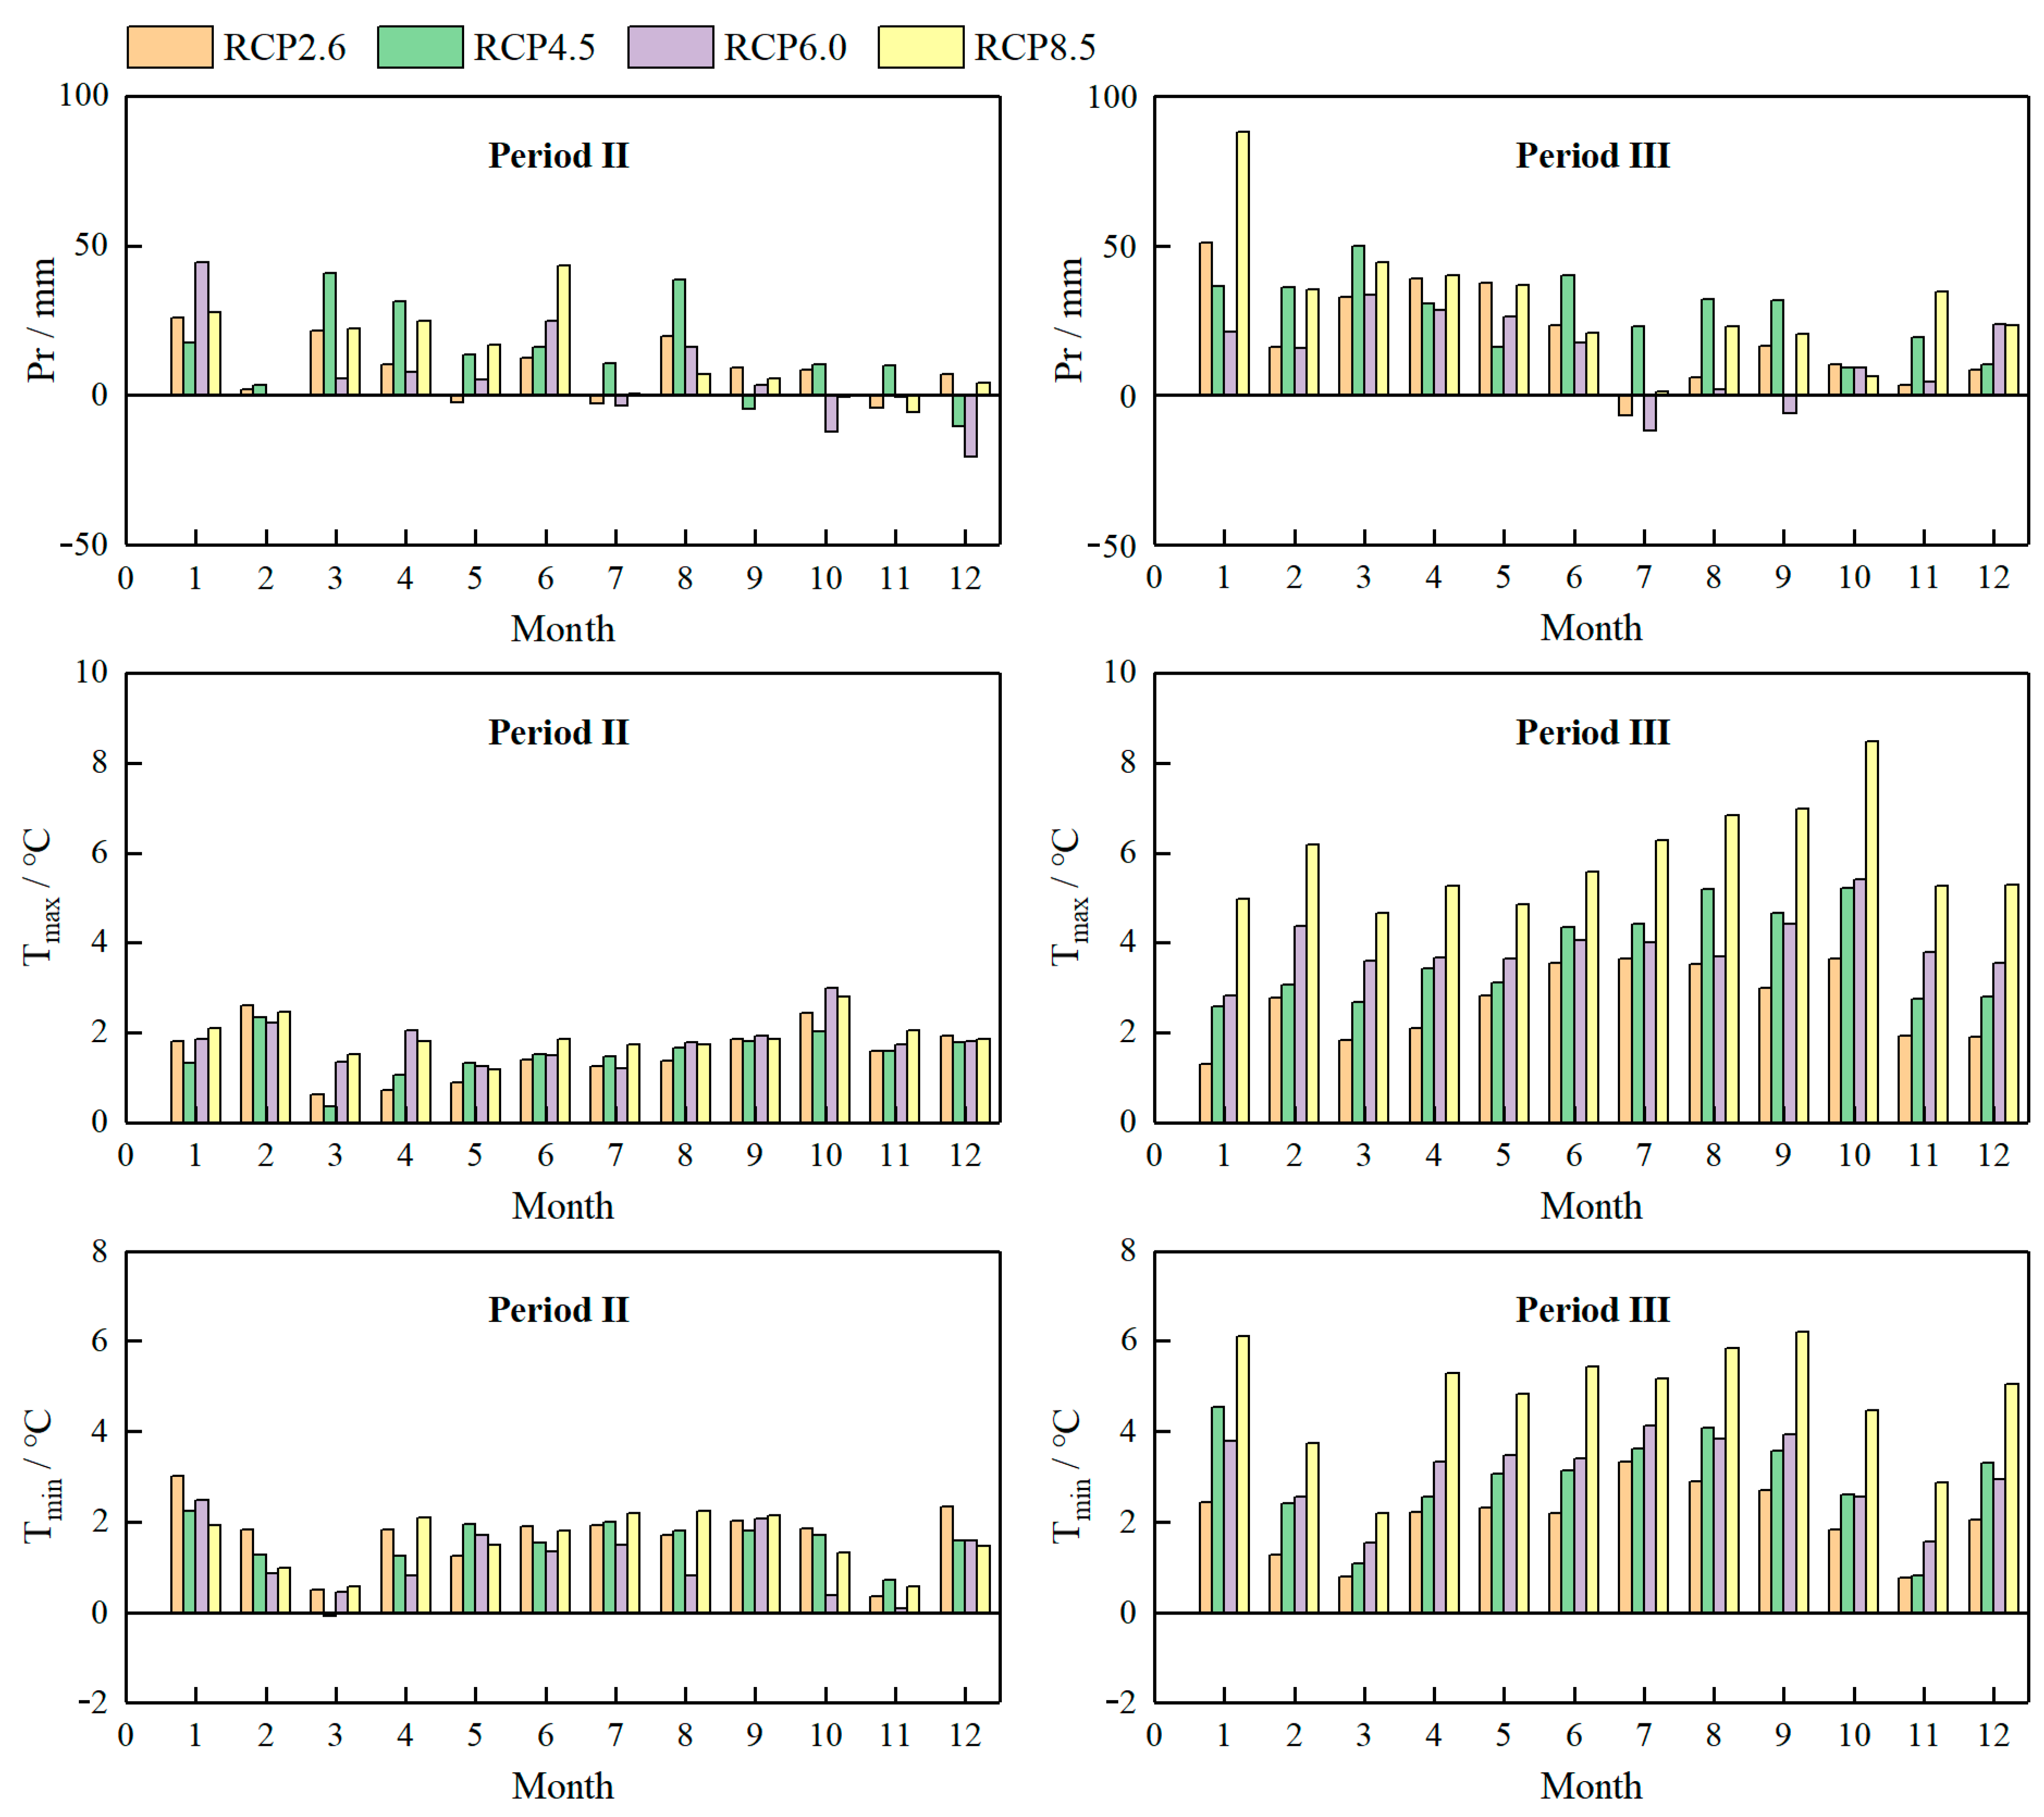
4.4.2. Intra-Year Variation
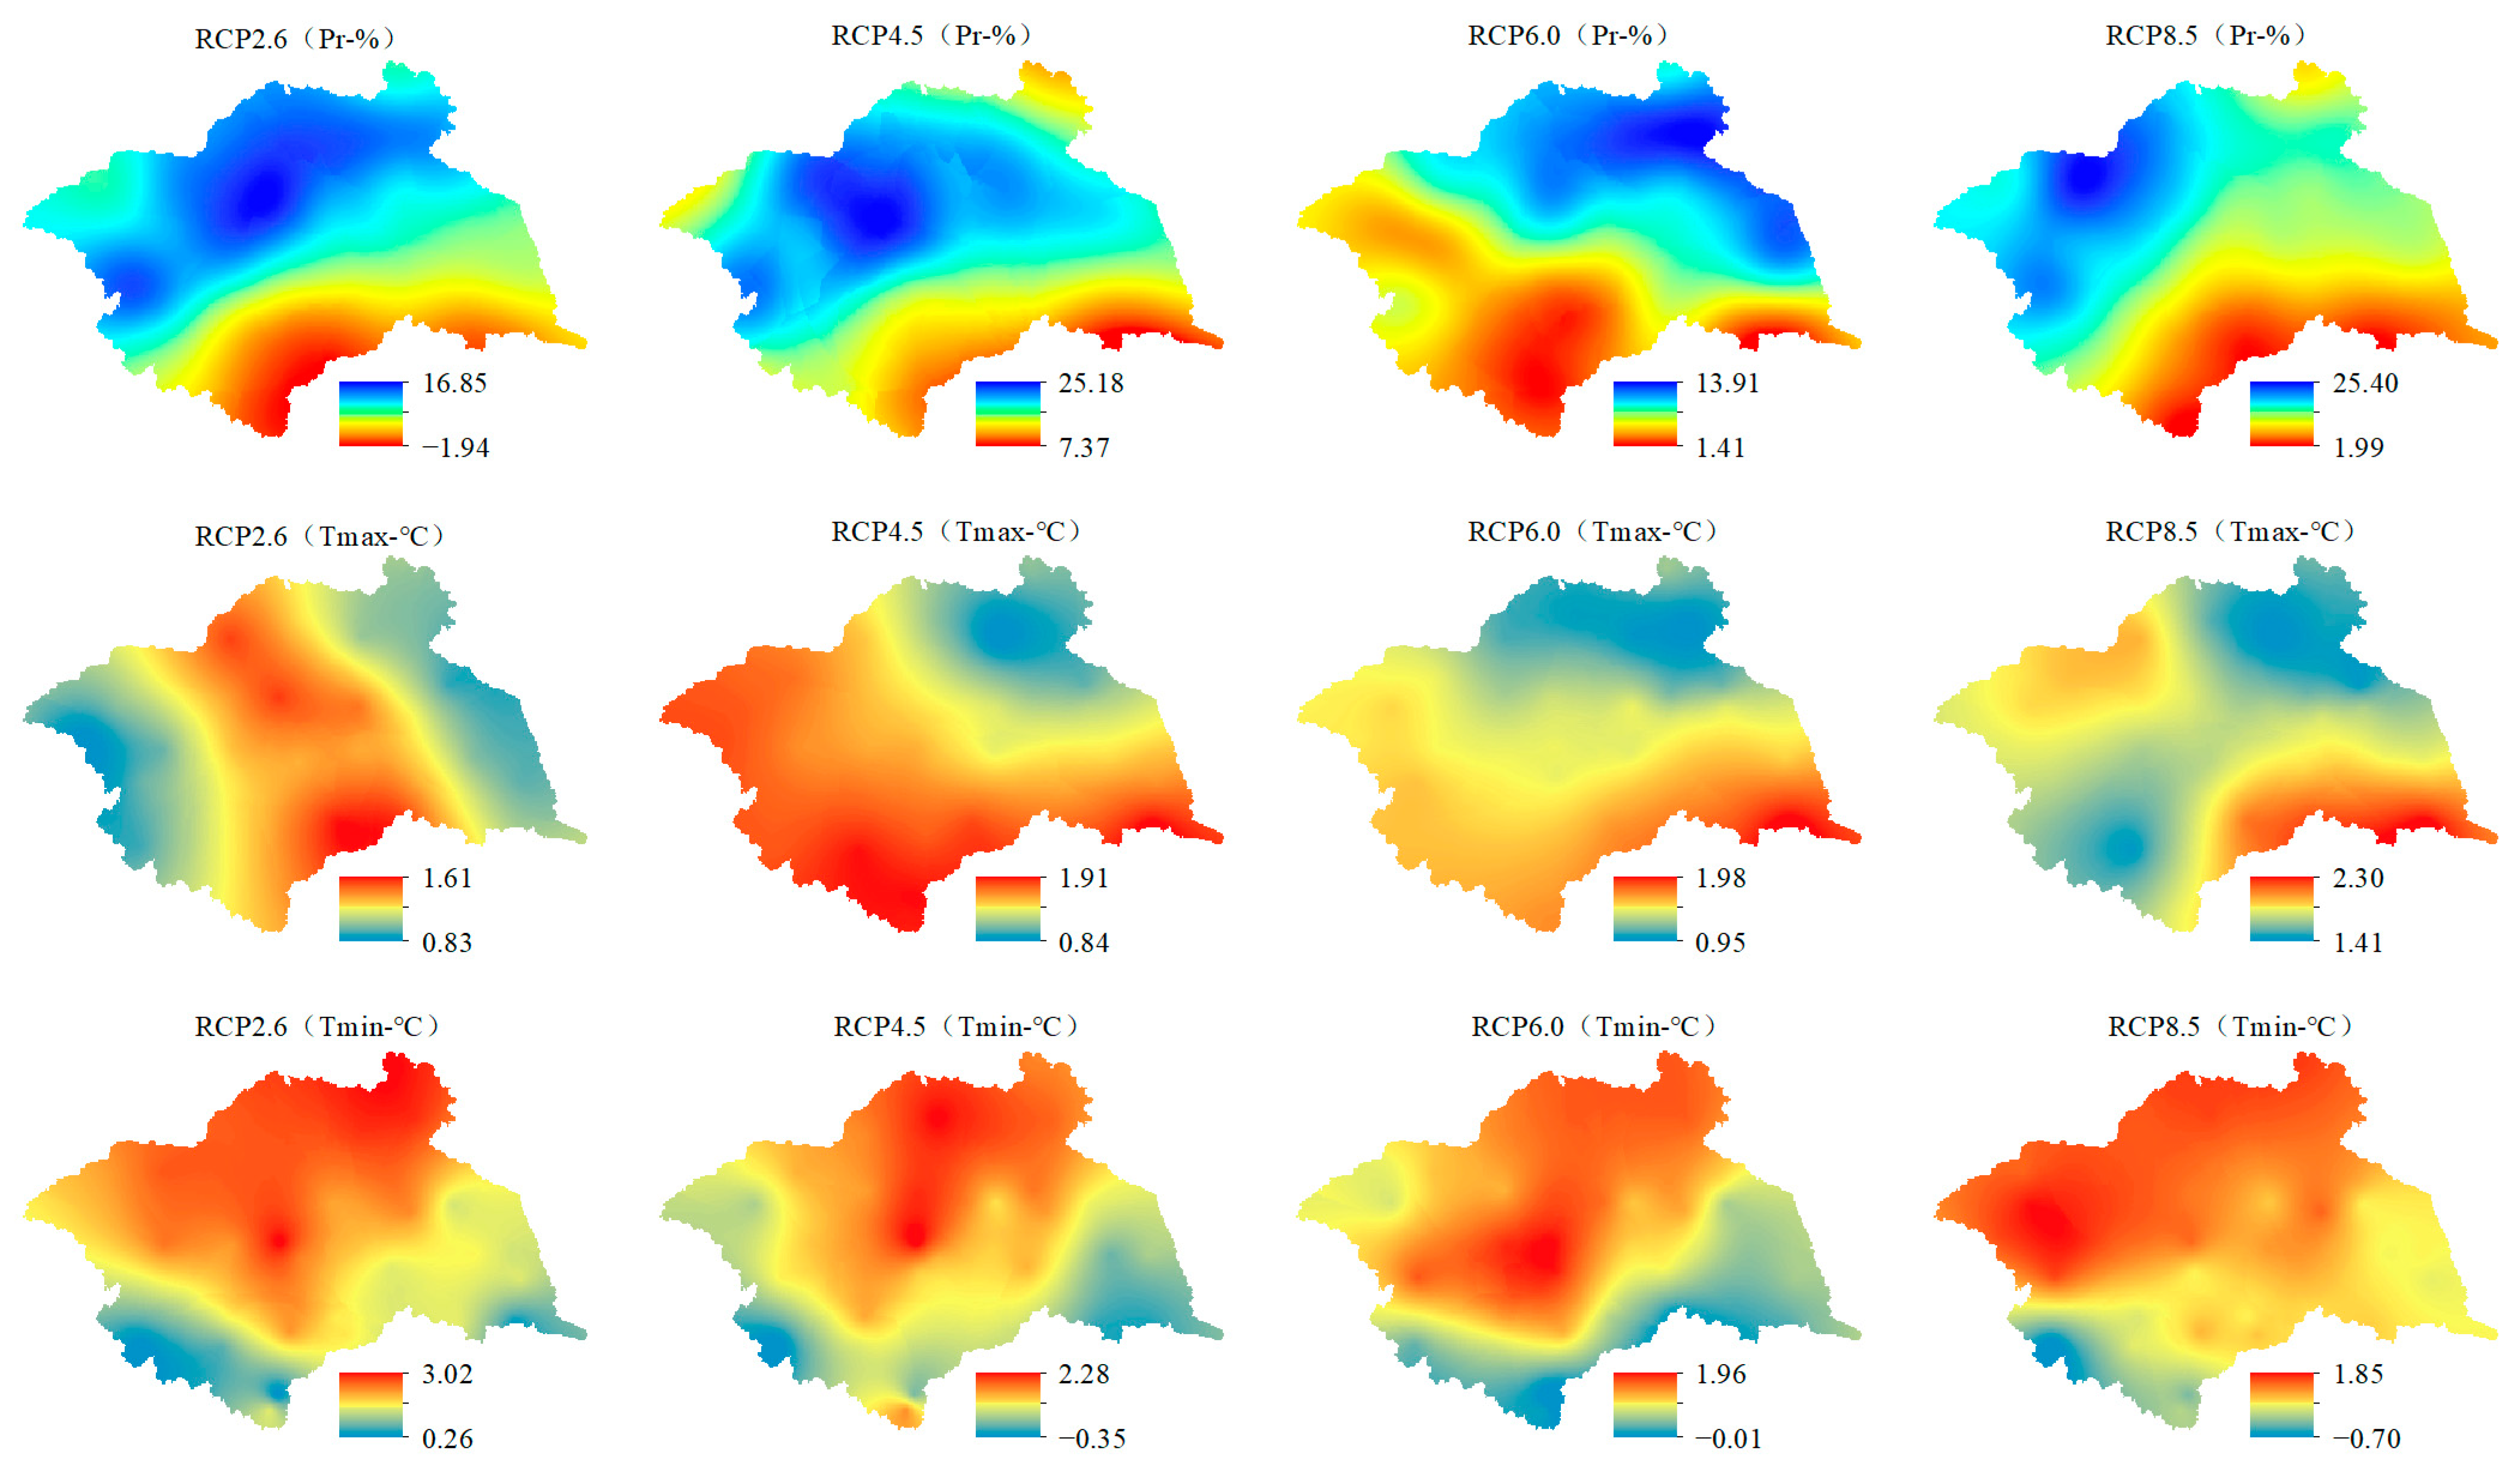
4.4.3. Spatial Distribution Variation
4.5. Discussion
5. Conclusions
6. Study Limitations and Prospects
Author Contributions
Funding
Data Availability Statement
Acknowledgments
Conflicts of Interest
Appendix A
| No. | Name | Longitude | Latitude | No. | Name | Longitude | Latitude |
|---|---|---|---|---|---|---|---|
| 1 | Yiyuan | 118°05′ E | 36°06′ N | 32 | Shouxian | 116°28′ E | 32°19′ N |
| 2 | Dingtao | 115°19′ E | 35°03′ N | 33 | Bengbu | 117°13′ E | 32°34′ N |
| 3 | Yanzhou | 116°30′ E | 35°20′ N | 34 | Dingyuan | 117°24′ E | 32°19′ N |
| 4 | Feixian | 117°34′ E | 35°09′ N | 35 | Gaoyou | 119°16′ E | 32°28′ N |
| 5 | Juxian | 118°30′ E | 35°21′ N | 36 | Dongtai | 120°11′ E | 32°31′ N |
| 6 | Zhengzhou | 113°23′ E | 34°25′ N | 37 | Liuan | 116°18′ E | 31°27′ N |
| 7 | Xuchang | 113°31′ E | 34°01′ N | 38 | Huoshan | 116°11′ E | 31°14′ N |
| 8 | Kaifeng | 114°10′ E | 34°28′ N | 39 | Anyang | 114°14′ E | 36°01′ N |
| 9 | Baofeng | 113°01′ E | 33°31′ N | 40 | Xinxiang | 113°31′ E | 35°11′ N |
| 10 | Xihua | 114°18′ E | 33°28′ N | 41 | Shenxian | 115°24′ E | 36°08′ N |
| 11 | Zhuma | 114°00′ E | 33°00′ N | 42 | Jinan | 117°01′ E | 36°21′ N |
| 12 | Xinyang | 114°01′ E | 32°04′ N | 43 | Pingdu | 119°33′ E | 36°27′ N |
| 13 | Shangqiu | 115°24′ E | 34°16′ N | 44 | Weifang | 119°06′ E | 36°27′ N |
| 14 | Tangshan | 116°12′ E | 34°15′ N | 45 | Rizhao | 119°19′ E | 35°15′ N |
| 15 | Pizhou | 117°34′ E | 34°10′ N | 46 | Mengjin | 112°15′ E | 34°29′ N |
| 16 | Xuzhou | 117°05′ E | 34°10′ N | 47 | Xixia | 111°18′ E | 33°10′ N |
| 17 | Tancheng | 118°11′ E | 34°21′ N | 48 | Nanyang | 112°21′ E | 33°01′ N |
| 18 | Shuyang | 118°27′ E | 34°03′ N | 49 | Zaoyang | 112°27′ E | 32°05′ N |
| 19 | Ganyu | 119°04′ E | 34°30′ N | 50 | Tongbai | 113°15′ E | 32°13′ N |
| 20 | Guanyun | 119°08′ E | 34°10′ N | 51 | Suizhou | 113°13′ E | 31°25′ N |
| 21 | Bozhou | 115°27′ E | 33°31′ N | 52 | Dawu | 114°04′ E | 31°20′ N |
| 22 | Yongcheng | 116°16′ E | 33°34′ N | 53 | Macheng | 115°00′ E | 31°06′ N |
| 23 | Mengcheng | 116°19′ E | 33°10′ N | 54 | Xuyi | 118°18′ E | 32°35′ N |
| 24 | Xiuzhou | 116°35′ E | 33°22′ N | 55 | Chuzhou | 118°10′ E | 32°10′ N |
| 25 | Suining | 117°33′ E | 33°31′ N | 56 | Nanjing | 118°28′ E | 32°00′ N |
| 26 | Sihong | 118°07′ E | 33°16′ N | 57 | Rugao | 120°20′ E | 32°13′ N |
| 27 | Funing | 119°30′ E | 33°28′ N | 58 | Lvsi | 121°21′ E | 32°02′ N |
| 28 | Sheyang | 120°09′ E | 33°27′ N | 59 | Tongcheng | 116°34′ E | 31°02′ N |
| 29 | Dafeng | 120°17′ E | 33°07′ N | 60 | Hefei | 117°10′ E | 31°28′ N |
| 30 | Fuyang | 115°26′ E | 32°31′ N | 61 | Yingshan | 115°24′ E | 30°26′ N |
| 31 | Gushi | 115°22′ E | 32°06′ N |
References
- Diabat, M.; Haggerty, R.; Wondzell, S.M. Diurnal timing of warmer air under climate change affects magnitude, timing and duration of stream temperature change. Hydrol. Process. 2013, 27, 2367–2378. [Google Scholar] [CrossRef]
- Taye, M.T.; Ntegeka, V.; Ogiramoi, N.P.; Willems, P. Assessment of climate change impact on hydrological extremes in two source regions of the Nile River Basin. Hydrol. Earth Syst. Sci. 2011, 15, 209–222. [Google Scholar] [CrossRef]
- Eum, H.I.; Simonovic, S.P. Assessment on variability of extreme climate events for the Upper Thames River basin in Canada. Hydrol. Process. 2011, 26, 485–499. [Google Scholar] [CrossRef]
- Dobler, C.; Bürger, G.; Stötter, J. Assessment of climate change impacts on flood hazard potential in the Alpine Lech watershed. J. Hydrol. 2012, 460, 29–39. [Google Scholar] [CrossRef]
- Zhang, W.; Pan, S.M.; Cao, L.G.; Cai, X.; Zhang, K.X.; Xu, Y.H.; Xu, W. Changes in extreme climate events in eastern China during 1960–2013: A case study of the Huaihe River Basin. Quat. Int. 2015, 380, 22–34. [Google Scholar] [CrossRef]
- Zhou, P.P.; Wang, G.C.; Duan, R.Q. Impacts of long-term climate change on the groundwater flow dynamics in a regional groundwater system: Case modeling study in Alashan, China. J. Hydrol. 2020, 590, 125557. [Google Scholar] [CrossRef]
- Moradian, S.; Iglesias, G.; Broderick, C.; Olbert, I.A. Assessing the impacts of climate change on precipitation through a hybrid method of machine learning and discrete wavelet transform techniques, case study: Cork, Ireland. J. Hydrol. Reg. Stud. 2023, 49, 101523. [Google Scholar] [CrossRef]
- Raju, K.S.; Kumar, D.N. Review of approaches for selection and ensembling of GCMs. J. Water Clim. Chang. 2020, 11, 577–599. [Google Scholar] [CrossRef]
- Xue, P.P.; Zhang, C.G.; Wen, Z.; Yu, F.R.; Park, E.; Nourani, V. Climate variability impacts on runoff projection in the 21st century based on the applicability assessment of multiple GCMs: A case study of the Lushi Basin, China. J. Hydrol. 2024, 638, 131383. [Google Scholar] [CrossRef]
- Iqbal, Z.; Shahid, S.; Ahmed, K.; Ismail, T.; Ziarh, G.F.; Chung, E.-S.; Wang, X.J. Evaluation of CMIP6 GCM rainfall in mainland Southeast Asia. Atmos. Res. 2021, 254, 105525. [Google Scholar] [CrossRef]
- Sun, L.; Lan, Y.F.; Jiang, R.S. Using CNN framework to improve multi-GCM ensemble predictions of monthly precipitation at local areas: An application over China and comparison with other methods. J. Hydrol. 2023, 623, 129866. [Google Scholar] [CrossRef]
- Taylor, K.E.; Stouffer, R.J.; Meehl, G.A. An overview of CMIP5 and the experiment design. Bull. Am. Meteorol. Soc. 2012, 93, 485–498. [Google Scholar] [CrossRef]
- De Medeiros, F.J.; De Oliveira, C.P.; Avila-Diaz, A. Evaluation of extreme precipitation climate indices and their projected changes for Brazil: From CMIP3 to CMIP6. Weather Clim. Extrem. 2022, 38, 100511. [Google Scholar] [CrossRef]
- Alves, J.M.B.; Vasconcelo, F.C., Jr.; Chaves, R.R.; Silva, E.M.; Jacques, S.; Costa, A.A.; Sombra, S.S.; Barbosa, A.C.B.; dos Santos, A.C.S. Evaluation of the AR4 CMIP3 and the AR5 CMIP5 model and projections for precipitation in northeast Brazil. Front. Earth Sci. 2016, 4, 44. [Google Scholar] [CrossRef][Green Version]
- Xu, K.; Xu, B.B.; Ju, J.L.; Wu, C.H.; Dai, H.; Hu, B.X. Projection and uncertainty of precipitation extremes in the CMIP5 multimodel ensembles over nine major basins in China. Atmos. Res. 2019, 226, 122–137. [Google Scholar] [CrossRef]
- Das, L.; Meher, J.K.; Dutta, M. Construction of rainfall change scenarios over the Chilka Lagoon in India. Atmos. Res. 2016, 182, 36–45. [Google Scholar] [CrossRef]
- Gobie, B.G.; Assamnew, A.D.; Habtemicheal, B.A.; Woldegiyorgis, T.A. Comparison of GCMs Under CMIP5 and CMIP6 in Reproducing Observed Precipitation in Ethiopia During Rainy Seasons. Earth Syst. Environ. 2024, 8, 265–279. [Google Scholar] [CrossRef]
- Dong, T.Y.; Dong, W.J.; Guo, Y.; Chou, J.M.; Yang, S.L.; Tian, D.; Yan, D.D. Future temperature changes over the critical Belt and Road region based on CMIP5 models. Adv. Clim. Chang. Res. 2018, 9, 57–65. [Google Scholar] [CrossRef]
- Ahmad, M.J.; Choi, K.S. Spatial-temporal evolution and projection of climate extremes in South Korea based on multi-GCM ensemble data. Atmos. Res. 2023, 289, 106772. [Google Scholar] [CrossRef]
- Tsujimoto, K.; Kuriya, N.; Ohta, T.; Homma, K.; Im, M.S. Quantifying the GCM-related uncertainty for climate change impact assessment of rainfed rice production in Cambodia by a combined hydrologic-rice growth model. Ecol. Model. 2022, 464, 109815. [Google Scholar] [CrossRef]
- Lima, C.H.R.; Kwon, H.H.; Kim, Y.T. A Bayesian Kriging model applied for spatial downscaling of daily rainfall from GCMs. J. Hydrol. 2021, 597, 126095. [Google Scholar] [CrossRef]
- Ghosh, S.; Mujumdar, P.P. Statistical downscaling of GCM simulations to streamflow using relevance vector machine. Adv. Water Resour. 2008, 31, 132–146. [Google Scholar] [CrossRef]
- Cloke, H.L.; Wetterhall, F.; He, Y.; Freer, J.E.; Pappenberger, F. Modelling climate impact on floods with ensemble climate projections. Q. J. R. Meteorol. Soc. 2013, 139, 282–297. [Google Scholar] [CrossRef]
- Song, Y.H.; Chung, E.S.; Shiru, M.S. Uncertainty analysis of monthly precipitation in GCMs using multiple bias correction methods under different RCPs. Sustainability 2020, 12, 7508. [Google Scholar] [CrossRef]
- Zhang, W.Q.; Liu, L.; Li, X.P.; Cheng, L.; Cheng, Y.C.; Li, H. Intensified response of extreme precipitation to rising temperature over the Tibetan Plateau from CMIP6 multi-model ensembles. J. Hydrol. 2024, 637, 131397. [Google Scholar] [CrossRef]
- Schmidli, J.; Frei, C.; Vidale, P.L. Downscaling from GCM precipitation: A benchmark for dynamical and statistical downscaling methods. Int. J. Climatol. 2006, 26, 679–689. [Google Scholar] [CrossRef]
- Maurer, E.P.; Hidalgo, H.G.; Das, T.; Dettinger, M.D.; Cayan, D.R. The utility of daily large-scale climate data in the assessment of climate change impacts on daily streamflow in California. Hydrol. Earth Syst. Sci. 2010, 14, 1125–1138. [Google Scholar] [CrossRef]
- Rohith, A.N.; Cibin, R. An extremes-weighted empirical quantile mapping for global climate model data bias correction for improved emphasis on extremes. Theor. Appl. Clim. 2024, 155, 5515–5523. [Google Scholar] [CrossRef]
- Mpelasoka, F.S.; Chiew, F.H. Influence of rainfall scenario construction methods on runoff projections. J. Hydrometeorol. 2009, 10, 1168–1183. [Google Scholar] [CrossRef]
- Chen, J.; Brissette, F.P.; Chaumont, D.; Braun, M. Performance and uncertainty evaluation of empirical downscaling methods in quantifying the climate change impacts on hydrology over two North American river basins. J. Hydrol. 2013, 479, 200–214. [Google Scholar] [CrossRef]
- Themeßl, M.J.; Gobiet, A.; Heinrich, G. Empirical-statistical downscaling and error correction of regional climate models and its impact on the climate change signal. Clim. Chang. 2012, 112, 449–468. [Google Scholar] [CrossRef]
- Ngai, S.T.; Tangang, F.; Juneng, L. Bias correction of global and regional simulated daily precipitation and surface mean temperature over Southeast Asia using quantile mapping method. Glob. Planet. Chang. 2017, 149, 79–90. [Google Scholar] [CrossRef]
- Li, H.B.; Sheffield, J.; Wood, E.F. Bias correction of monthly precipitation and temperature fields from Intergovernmental Panel on Climate Change AR4 models using equidistant quantile matching. J. Geophys. Res. 2010, 115, D10101. [Google Scholar] [CrossRef]
- Chen, F.W.; Liu, C.W. Estimation of the spatial rainfall distribution using inverse distance weighting (IDW) in the middle of Taiwan. Paddy Water Env. 2012, 10, 209–222. [Google Scholar] [CrossRef]
- Oliver, M.A.; Webster, R. Kriging: A method of interpolation for geographical information systems. Int. J. Geogr. Inf. Syst. 1990, 4, 313–332. [Google Scholar] [CrossRef]
- Miller, R.L. Trend surfaces: Their application to analysis and description of environments of sedimentation. J. Geol. 1956, 64, 425–446. [Google Scholar] [CrossRef]
- Tanjung, M.; Syahreza, S.; Rusdi, M. Comparison of interpolation methods based on Geographic Information System (GIS) in the spatial distribution of seawater intrusion. J. Nat. 2020, 20, 24–30. [Google Scholar] [CrossRef]
- Buhmann, M.D. Multivariate cardinal interpolation with radial-basis functions. Constr. Approx. 1990, 6, 225–255. [Google Scholar] [CrossRef]
- Taylor, K.E. Summarizing multiple aspects of model performance in a single diagram. J. Geophys. Res. Atmos. 2001, 106, 7183–7192. [Google Scholar] [CrossRef]
- Chen, J.; Brissette, F.P.; Leconte, R. Uncertainty of downscaling method in quantifying the impact of climate change on hydrology. J. Hydrol. 2011, 401, 190–202. [Google Scholar] [CrossRef]
- Piani, C.; Haerter, J.O.; Coppola, E. Statistical bias correction for daily precipitation in regional climate models over Europe. Theor. Appl. Clim. 2010, 99, 187–192. [Google Scholar] [CrossRef]
- Aloysius, N.R.; Sheffield, J.; Saiers, J.E.; Li, H.B.; Wood, E.F. Evaluation of historical and future simulations of precipitation and temperature in central Africa from CMIP5 climate models. J. Geophys. Res. Atmos. 2016, 121, 130–152. [Google Scholar] [CrossRef]
- Liu, Z.; Mehran, A.; Phillips, T.J.; AghaKouchak, A. Seasonal and regional biases in CMIP5 precipitation simulations. Clim. Res. 2014, 60, 35–50. [Google Scholar] [CrossRef]
- Mumo, L.; Yu, J.H. Gauging the performance of CMIP5 historical simulation in reproducing observed gauge rainfall over Kenya. Atmos. Res. 2020, 236, 104808. [Google Scholar] [CrossRef]
- Dong, S.; Xu, Y.; Zhou, B.; Shi, Y. Assessment of indices of temperature extremes simulated by multiple CMIP5 models over China. Adv. Atmos. Sci. 2015, 32, 1077–1091. [Google Scholar] [CrossRef]
- Gong, J.C.; Hu, Y.B.; Yao, C.; Ma, Y.N.; Sun, M.K.; Gong, J.F.; Shi, Z.; Li, J.B. The WRF-Driven Grid-Xin’anjiang Model and Its Application in Small and Medium Catchments of China. Water 2024, 16, 103. [Google Scholar] [CrossRef]
- Stahl, K.; Moore, R.D.; Floyer, J.A.; Asplin, M.G.; McKendry, I.G. Comparison of approaches for spatial interpolation of daily air temperature in a large region with complex topography and highly variable station density. Agric. For. Meteorol. 2006, 139, 224–236. [Google Scholar] [CrossRef]
- Wagner, P.D.; Fiener, P.; Wilken, F.; Kumar, S.; Schneider, K. Comparison and evaluation of spatial interpolation schemes for daily rainfall in data scarce regions. J. Hydrol. 2012, 464, 388–400. [Google Scholar] [CrossRef]
- Mohan, S.; Bhaskaran, P.K. Evaluation and bias correction of global climate models in the CMIP5 over the Indian Ocean region. Env. Monit. Assess. 2019, 191, 806. [Google Scholar] [CrossRef]
- Navarro-Racines, C.; Tarapues, J.; Thornton, P.; Jarvis, A.; Ramirez-Villegas, J. High-resolution and bias-corrected CMIP5 projections for climate change impact assessments. Sci. Data 2020, 7, 7. [Google Scholar] [CrossRef] [PubMed]
- Yao, T.; Wu, C.H.; Yeh, P.J.F.; Li, J.Y.; Wang, X.; Cheng, J.H.; Zhou, J.; Hu, B.X. Extreme climate events and future population exposure under climate change in the Huaihe River basin of China based on CMIP6 multimodel ensembles projections. Int. J. Climatol. 2024, 44, 3655–3680. [Google Scholar] [CrossRef]
- Wu, Y.A.; Zhong, P.A.; Xu, B.; Zhu, F.L.; Ma, B. Changing of flood risk due to climate and development in Huaihe River basin, China. Stoch. Env. Res. Risk Assess. 2017, 31, 935–948. [Google Scholar] [CrossRef]






| No. | GCMs | Institution (Country) | Resolution (°) |
|---|---|---|---|
| 1 | CSIRO-Mk3.6.0 | CSIRO-QCCCE (Australian) | 1.88 × 1.87 |
| 2 | GFDL-CM3 | NOAA-GFDL (USA) | 2.50 × 2.00 |
| 3 | GFDL-ESM2G | NOAA-GFDL (USA) | 2.50 × 2.02 |
| 4 | GFDL-ESM2M | NOAA-GFDL (USA) | 2.50 × 2.02 |
| 5 | HadGEM2-AO | NIMR/KMA (Korea) | 1.88 × 1.25 |
| 6 | HadGEM2-ES | MOHC (UK) | 1.88 × 1.25 |
| 7 | IPSL-CM5A-LR | IPSL (France) | 3.75 × 1.89 |
| 8 | IPSL-CM5A-MR | IPSL (France) | 2.50 × 1.27 |
| 9 | MIROC5 | JAMSTEC/AORI (UTokyo) (Japan) | 1.41 × 1.40 |
| 10 | MIROC-ESM | JAMSTEC/AORI (UTokyo) (Japan) | 2.81 × 2.79 |
| 11 | MIROC-ESM-CHEM | JAMSTEC/AORI (UTokyo) (Japan) | 2.81 × 2.79 |
| 12 | MRI-CGCM3 | MRI (Japan) | 1.13 × 1.12 |
| Year | IDW | OK | GPI | LPI | RBF | Month | IDW | OK | GPI | LPI | RBF |
|---|---|---|---|---|---|---|---|---|---|---|---|
| 2003 | 0.1937 | 0.1797 | 0.1768 | 0.1759 | 0.1825 | 1 | 0.2962 | 0.2159 | 0.2153 | 0.2291 | 0.2434 |
| 2004 | 0.2786 | 0.2676 | 0.2726 | 0.2648 | 0.2536 | 2 | 0.2303 | 0.1722 | 0.1755 | 0.1680 | 0.1728 |
| 2005 | 0.2826 | 0.2636 | 0.2816 | 0.2431 | 0.2621 | 3 | 0.2171 | 0.1428 | 0.1496 | 0.1320 | 0.1216 |
| 2006 | 0.2806 | 0.2878 | 0.2708 | 0.2731 | 0.269 | 4 | 0.1969 | 0.1298 | 0.1364 | 0.1274 | 0.1156 |
| 2007 | 0.242 | 0.2123 | 0.2366 | 0.2203 | 0.1804 | 5 | 0.1856 | 0.1236 | 0.1878 | 0.1540 | 0.1179 |
| 2008 | 0.2283 | 0.2318 | 0.2433 | 0.2111 | 0.2109 | 6 | 0.2126 | 0.1773 | 0.1860 | 0.1612 | 0.1824 |
| 2009 | 0.2335 | 0.2253 | 0.2231 | 0.2211 | 0.2306 | 7 | 0.1314 | 0.1329 | 0.1482 | 0.1331 | 0.1227 |
| 2010 | 0.2537 | 0.2552 | 0.2842 | 0.2174 | 0.2227 | 8 | 0.1830 | 0.1768 | 0.2010 | 0.1847 | 0.1744 |
| 2011 | 0.2318 | 0.2656 | 0.2588 | 0.2411 | 0.2239 | 9 | 0.1835 | 0.1678 | 0.1660 | 0.1568 | 0.1684 |
| 2012 | 0.2589 | 0.245 | 0.2538 | 0.2227 | 0.2357 | 10 | 0.1532 | 0.1458 | 0.1479 | 0.1483 | 0.1399 |
| 2013 | 0.2266 | 0.2217 | 0.2595 | 0.2207 | 0.214 | 11 | 0.1976 | 0.1806 | 0.1855 | 0.1637 | 0.1469 |
| 2014 | 0.3181 | 0.3166 | 0.2833 | 0.2924 | 0.2986 | 12 | 0.2360 | 0.1856 | 0.1940 | 0.1892 | 0.2049 |
| Year | IDW | OK | GPI | LPI | RBF | Month | IDW | OK | GPI | LPI | RBF |
|---|---|---|---|---|---|---|---|---|---|---|---|
| 2003 | 0.0416 | 0.0389 | 0.0415 | 0.0387 | 0.0400 | 1 | 0.0879 | 0.0840 | 0.0878 | 0.0844 | 0.0810 |
| 2004 | 0.0347 | 0.0366 | 0.0395 | 0.0378 | 0.0347 | 2 | 0.0640 | 0.0645 | 0.0639 | 0.0637 | 0.0635 |
| 2005 | 0.0345 | 0.0332 | 0.0417 | 0.0340 | 0.0336 | 3 | 0.0493 | 0.0519 | 0.0518 | 0.0504 | 0.0489 |
| 2006 | 0.0345 | 0.0321 | 0.0371 | 0.0336 | 0.0331 | 4 | 0.0519 | 0.0484 | 0.0503 | 0.0487 | 0.0503 |
| 2007 | 0.0328 | 0.0335 | 0.0357 | 0.0342 | 0.0315 | 5 | 0.0351 | 0.0308 | 0.0316 | 0.0314 | 0.0335 |
| 2008 | 0.0341 | 0.0309 | 0.0357 | 0.0339 | 0.0304 | 6 | 0.0330 | 0.0290 | 0.0338 | 0.0310 | 0.0310 |
| 2009 | 0.0446 | 0.0393 | 0.0398 | 0.0392 | 0.0425 | 7 | 0.0344 | 0.0370 | 0.0384 | 0.0378 | 0.0342 |
| 2010 | 0.0295 | 0.0278 | 0.0275 | 0.0274 | 0.0288 | 8 | 0.0332 | 0.0308 | 0.0306 | 0.0314 | 0.0325 |
| 2011 | 0.0387 | 0.0374 | 0.0437 | 0.0370 | 0.0355 | 9 | 0.0364 | 0.0359 | 0.0421 | 0.0382 | 0.0359 |
| 2012 | 0.0296 | 0.0292 | 0.0350 | 0.0307 | 0.0295 | 10 | 0.0397 | 0.0429 | 0.0408 | 0.0396 | 0.0375 |
| 2013 | 0.0262 | 0.0271 | 0.0285 | 0.0277 | 0.0258 | 11 | 0.0389 | 0.0422 | 0.0438 | 0.0391 | 0.0372 |
| 2014 | 0.0338 | 0.0314 | 0.0301 | 0.0305 | 0.0328 | 12 | 0.0751 | 0.0731 | 0.0827 | 0.0773 | 0.0698 |
| Year | IDW | OK | GPI | LPI | RBF | Month | IDW | OK | GPI | LPI | RBF |
|---|---|---|---|---|---|---|---|---|---|---|---|
| 2003 | 0.2424 | 0.2137 | 0.2155 | 0.2106 | 0.2206 | 1 | 0.1879 | 0.1781 | 0.1876 | 0.1806 | 0.1808 |
| 2004 | 0.2184 | 0.2245 | 0.2161 | 0.1981 | 0.2136 | 2 | 0.2072 | 0.1683 | 0.1976 | 0.1743 | 0.1779 |
| 2005 | 0.2406 | 0.2404 | 0.2409 | 0.2439 | 0.2398 | 3 | 0.3114 | 0.2827 | 0.2949 | 0.2729 | 0.2744 |
| 2006 | 0.252 | 0.2484 | 0.2587 | 0.2469 | 0.2438 | 4 | 0.7912 | 0.7428 | 0.7926 | 0.7695 | 0.7568 |
| 2007 | 0.3544 | 0.3513 | 0.3426 | 0.345 | 0.3532 | 5 | 0.4590 | 0.5004 | 0.4924 | 0.4706 | 0.4609 |
| 2008 | 0.1847 | 0.1754 | 0.1820 | 0.1794 | 0.1876 | 6 | 0.1485 | 0.1521 | 0.1447 | 0.1484 | 0.1492 |
| 2009 | 0.2443 | 0.242 | 0.2248 | 0.2307 | 0.2401 | 7 | 0.0715 | 0.0716 | 0.0781 | 0.0764 | 0.0693 |
| 2010 | 0.2608 | 0.2428 | 0.2456 | 0.2469 | 0.2531 | 8 | 0.0786 | 0.0785 | 0.0823 | 0.0766 | 0.0738 |
| 2011 | 0.2804 | 0.2517 | 0.2592 | 0.2524 | 0.2719 | 9 | 0.2985 | 0.2877 | 0.2922 | 0.2859 | 0.2960 |
| 2012 | 0.2309 | 0.2169 | 0.2062 | 0.2135 | 0.2268 | 10 | 1.4720 | 1.4480 | 1.3640 | 1.3870 | 1.4570 |
| 2013 | 0.2431 | 0.2119 | 0.2085 | 0.2062 | 0.2304 | 11 | 0.2345 | 0.2397 | 0.2458 | 0.2460 | 0.2354 |
| 2014 | 0.2502 | 0.2178 | 0.2149 | 0.2183 | 0.2404 | 12 | 0.2359 | 0.2265 | 0.2183 | 0.2248 | 0.2336 |
| GCMs | Pr | Tmax | Tmin | |||||||||
|---|---|---|---|---|---|---|---|---|---|---|---|---|
| R | SD | RMSE | CIES | R | SD | RMSE | CIES | R | SD | RMSE | CIES | |
| OBS | 1 | 154.6 | 0 | 0 | 1 | 1.2 | 0 | 0 | 1 | 2.93 | 0 | 0 |
| CSIRO-Mk3-6-0 | 0.41 | 155.9 | 235.2 | 0.65 | 0.46 | 2.61 | 2.92 | 0.55 | 0.42 | 2.01 | 3.58 | 0.64 |
| GFDL-CM3 | 0.35 | 162.3 | 255.8 | 0.71 | 0.39 | 2.32 | 4.51 | 0.62 | 0.17 | 2.26 | 4.34 | 0.89 |
| GFDL-ESM2G | 0.28 | 159.5 | 236.1 | 0.77 | 0.43 | 2.47 | 4.91 | 0.59 | 0.59 | 2.29 | 4.38 | 0.53 |
| GFDL-ESM2M | −0.04 | 188.8 | 331.1 | 1.11 | 0.38 | 1.46 | 4.99 | 0.63 | 0.45 | 1.94 | 4.25 | 0.64 |
| HadGEM2-AO | 0.61 | 149.6 | 194.5 | 0.45 | 0.66 | 2.26 | 4.09 | 0.36 | 0.40 | 2.63 | 5.11 | 0.72 |
| HadGEM2-ES | 0.17 | 145.1 | 250.7 | 0.88 | 0.52 | 2.37 | 2.65 | 0.49 | 0.90 | 3.04 | 4.34 | 0.34 |
| IPSL-CM5A-LR | 0.20 | 144 | 218.3 | 0.84 | 0.50 | 1.07 | 3.38 | 0.51 | 0.26 | 1.87 | 3.66 | 0.80 |
| IPSL-CM5A-MR | 0.03 | 144.8 | 236.2 | 1.01 | 0.44 | 1.35 | 1.82 | 0.56 | 0.21 | 1.86 | 4.1 | 0.85 |
| MIROC5 | 0.19 | 150.7 | 357.6 | 0.91 | 0.17 | 1.16 | 3.63 | 0.84 | 0.60 | 2.18 | 5.93 | 0.60 |
| MIROC-ESM | 0.19 | 147.9 | 260 | 0.86 | 0.86 | 1.29 | 3.16 | 0.17 | 0.40 | 2.14 | 8.14 | 0.86 |
| MIROC-ESM-CHEM | 0.44 | 173.2 | 251.8 | 0.63 | 0.51 | 1.41 | 3.56 | 0.50 | 0.14 | 2.21 | 7.90 | 1.05 |
| MRI-CGCM3 | 0.13 | 95.9 | 376.5 | 0.97 | 0.24 | 1.49 | 2.17 | 0.76 | 0.55 | 2.87 | 4.16 | 0.55 |
| Climate Elements | Method | January | July | ||||||
|---|---|---|---|---|---|---|---|---|---|
| R | SD | RMSE | CIES | R | SD | RMSE | CIES | ||
| Pr | OBS | 1.00 | 14.69 | 0.00 | 0.00 | 1.00 | 55.39 | 0.00 | 0.00 |
| GCM | 0.51 | 12.77 | 17.29 | 0.87 | 0.45 | 68.30 | 101.42 | 0.73 | |
| Delta | 0.51 | 17.46 | 20.52 | 0.98 | 0.47 | 77.19 | 106.99 | 0.73 | |
| QM | 0.58 | 19.32 | 22.99 | 1.05 | 0.62 | 67.32 | 99.72 | 0.60 | |
| IQM | 0.63 | 15.61 | 18.20 | 0.84 | 0.67 | 54.93 | 96.45 | 0.55 | |
| Tmax | OBS | 1.00 | 2.67 | 0.00 | 0.00 | 1.00 | 1.25 | 0.00 | 0.00 |
| GCM | 0.35 | 1.06 | 3.27 | 0.70 | 0.63 | 1.46 | 1.99 | 0.37 | |
| Delta | 0.35 | 1.06 | 3.33 | 0.70 | 0.63 | 1.46 | 1.82 | 0.37 | |
| QM | 0.15 | 2.81 | 4.81 | 0.91 | 0.52 | 1.86 | 2.22 | 0.48 | |
| IQM | 0.78 | 1.70 | 3.02 | 0.31 | 0.76 | 1.20 | 1.61 | 0.25 | |
| Tmin | OBS | 1.00 | 2.23 | 0.00 | 0.00 | 1.00 | 1.32 | 0.00 | 0.00 |
| GCM | 0.52 | 1.83 | 5.08 | 0.66 | 0.44 | 1.35 | 1.95 | 0.57 | |
| Delta | 0.52 | 1.83 | 5.21 | 0.67 | 0.44 | 1.35 | 2.11 | 0.57 | |
| QM | 0.54 | 1.38 | 5.09 | 0.65 | 0.47 | 0.99 | 2.00 | 0.54 | |
| IQM | 0.63 | 1.52 | 4.89 | 0.58 | 0.75 | 0.98 | 1.85 | 0.27 | |
| Climate Elements | Period II | Period III | ||||||
|---|---|---|---|---|---|---|---|---|
| RCP2.6 | RCP4.5 | RCP6.0 | RCP8.5 | RCP2.6 | RCP4.5 | RCP6.0 | RCP8.5 | |
| Pr/% | 7.81 | 17.16 | 6.47 | 11.93 | 13.70 | 28.36 | 6.87 | 21.83 |
| Tmax/°C | 1.24 | 1.52 | 1.44 | 1.78 | 3.52 | 4.67 | 4.01 | 6.67 |
| Tmin/°C | 1.96 | 1.11 | 1.17 | 1.06 | 1.19 | 2.37 | 2.66 | 3.88 |
Disclaimer/Publisher’s Note: The statements, opinions and data contained in all publications are solely those of the individual author(s) and contributor(s) and not of MDPI and/or the editor(s). MDPI and/or the editor(s) disclaim responsibility for any injury to people or property resulting from any ideas, methods, instructions or products referred to in the content. |
© 2025 by the authors. Licensee MDPI, Basel, Switzerland. This article is an open access article distributed under the terms and conditions of the Creative Commons Attribution (CC BY) license (https://creativecommons.org/licenses/by/4.0/).
Share and Cite
Fu, X.; Wang, P.; Cheng, L.; Han, R.; Dong, Z.; Li, Z. Assessment of Future Climate Change in the Huaihe River Basin Using Bias-Corrected CMIP5 GCMs with Consideration of Climate Non-Stationarity. Water 2025, 17, 195. https://doi.org/10.3390/w17020195
Fu X, Wang P, Cheng L, Han R, Dong Z, Li Z. Assessment of Future Climate Change in the Huaihe River Basin Using Bias-Corrected CMIP5 GCMs with Consideration of Climate Non-Stationarity. Water. 2025; 17(2):195. https://doi.org/10.3390/w17020195
Chicago/Turabian StyleFu, Xiaohua, Pan Wang, Long Cheng, Rui Han, Zengchuan Dong, and Zufeng Li. 2025. "Assessment of Future Climate Change in the Huaihe River Basin Using Bias-Corrected CMIP5 GCMs with Consideration of Climate Non-Stationarity" Water 17, no. 2: 195. https://doi.org/10.3390/w17020195
APA StyleFu, X., Wang, P., Cheng, L., Han, R., Dong, Z., & Li, Z. (2025). Assessment of Future Climate Change in the Huaihe River Basin Using Bias-Corrected CMIP5 GCMs with Consideration of Climate Non-Stationarity. Water, 17(2), 195. https://doi.org/10.3390/w17020195


