Abstract
This study examines the efficacy of biochar in improving water quality in urban artificial landscape water bodies. Three biochar types—wood biochar, coconut shell biochar, and apricot kernel biochar—were systematically evaluated, along with the purification effects of varying biochar dosages on landscape water. Water quality parameters were quantified using a multiparameter water quality meter, while the enhancement of visual aesthetics was validated through online questionnaires distributed to citizens. The findings include the following: All biochar types significantly reduced eutrophication indices and enhanced visual quality metrics, with coconut shell biochar demonstrating the most pronounced effects. The purification effect correlates with initial water quality and biochar dosage. Water bodies with poorer initial quality tend to show better purification results. While optimal biochar dosage improves water quality parameters, excessive application leads to decreased performance and potential water quality deterioration. Questionnaire analysis of visual preferences for the purified water showed that among biochar types, coconut shell biochar was most preferred (53.2%), followed by apricot kernel biochar (22.8%) and wood biochar (17.2%), while untreated water received the lowest preference (6.8%). When evaluating coconut shell biochar dosages, the 10 g/L treatment achieved the highest preference (67.4%), followed by 5 g/L (18.2%), while both the 15 g/L treatment and untreated water received notably lower preferences (7.1% and 7.3%, respectively). These findings highlight biochar as a promising tool for enhancing both the ecological and aesthetic qualities of urban water bodies, provided its application is carefully tailored to variable environmental conditions.
1. Introduction
Urban artificial landscape water bodies (ALWs) play a crucial role in enhancing the ecological and aesthetic fabric of urban environments. These water features fulfill a diverse range of functions, including enhancing landscape aesthetics, providing recreational spaces, supporting ecological diversity, and acting as critical flood storage reservoirs. Serving as a primary interface between the public and surface water systems, they significantly contribute to urban aesthetics and biodiversity by providing habitats for diverse species, supporting local ecosystems, and promoting ecological balance [1]. Due to the complexity of urban environments, ALWs are susceptible to various pollution sources, including atmospheric deposition (nitrogen, sulfur, and heavy metals), surface runoff pollutants, domestic sewage discharge or leakage, inappropriate disposal of food waste, internal pollution from sediments, and garden construction and plant waste. ALWs are characterized by small surface areas, shallow depths, and low flow rates, resulting in weak self-purification capabilities and fragile ecosystems. This makes them prone to issues such as water malodor, poor aesthetic quality, and eutrophication [2]. Collectively, these issues not only diminish the visual attractiveness of urban landscapes but also adversely affect the quality of life and health of urban residents [3].
Conventional strategies for treating polluted urban ALWs encompass a range of physical, chemical, and biological approaches. Physical approaches include environmental water diversion, artificial aeration, and sediment dredging [4].Chemical techniques include flocculation, chemical algae control, and the addition of iron or aluminum salts [5].Biological interventions leverage ecological processes to restore water quality and include methods such as microbial enhancement, the use of aquatic plants, ecological floating beds, and the establishment of constructed wetland [6,7,8].
These water purification measures have played a positive role in improving urban water quality. However, researchers have been exploring more economical, efficient, and environmentally friendly alternatives to address the various pollution issues present in urban ALWs. Driven by this need, biochar, as an environmentally advantageous material with multiple benefits, has gradually gained attention in the research field. Produced from biomass through pyrolysis under anoxic or low-oxygen conditions, biochar is a stable, carbon-rich material with a porous structure, high specific surface area, and robust adsorption capacity [9,10]. These attributes have facilitated its widespread application in soil amendment, carbon sequestration, and environmental remediation [11,12,13]. Furthermore, emerging studies have demonstrated its remarkable efficacy in water purification and the adsorption of diverse pollutants, positioning biochar as a promising solution for addressing pressing environmental challenges [14,15,16,17].
Qiu and Duan [18] discovered that biochar derived from biomass rich in metals such as aluminum, calcium, magnesium, and iron—or their hydroxides—exhibited high efficiency in phosphorus recovery from aqueous solutions. Ye et al. [19] observed that treatment with biochar compost effectively reduced the bioavailable metals and arsenic content in wetland soils. Tan et al. [20] demonstrated that biochar with a high calcium content could lower phosphorus concentrations in aqueous solutions through calcium–phosphorus precipitation. Research by Li et al. [21] indicated that alkaline oxides embedded in biochar could serve as pH adjusters in wastewater. Huggins et al. [22] noted biochar’s effectiveness in recovering nitrogen from wastewater. Gwenzi et al. [23] highlighted biochar’s substantial potential for absorbing heavy metals from aqueous solutions. Moreover, biochar has also demonstrated significant potential in purifying urban stormwater runoff, with studies showing that its presence reduced the concentration of various pollutants in water treatments [19,24]. Furthermore, extensive research has shown that biochar can effectively adsorb organic pollutants from industrial and agricultural wastewater, including phenols [25], dyes [26,27], and pesticides [28]. The remedial effectiveness and mechanisms of biochar are closely related to the production process and the vegetative materials used [29]. Furthermore, several studies have analyzed the regeneration potential of biochar after water treatment. Biochar regeneration can be achieved through decomposition and degradation of organic compounds directly on the biochar surface using techniques based on heat, microwave irradiation, or chemical oxidation. Chemical regeneration has been recognized as one of the most widely applied techniques. These technologies highlight biochar’s potential in sustainable water treatment, supporting long-term water purification by extending its lifecycle through effective regeneration.
While extensive studies have explored the application of biochar in water purification, the existing literature predominantly emphasizes its efficacy in treating urban sewage, industrial wastewater, and agricultural runoff, which have well-defined pollution sources and require centralized treatment following strict industrial purification processes and standards. These studies have yielded valuable insights into the underlying mechanisms of biochar-based purification and its potential applications in diverse environmental contexts. However, research on biochar applications in urban ALWs remains limited. Compared to other types of polluted water bodies, urban ALWs are characterized by complex pollution sources, variable environmental conditions, and high landscape function requirements. Urban ALWs are particularly vulnerable to multiple pollution sources, including atmospheric deposition, surface runoff, and human activities. The sensory qualities of water bodies, such as clarity and transparency, directly influence their landscape value and public acceptance. Therefore, in addition to considering biochar’s efficiency in purifying eutrophic water, it is crucial to focus on its effects on aesthetic factors like chromaticity and transparency, as well as whether these purification effects can be perceived through subjective visual assessment.
This study aimed to investigate the dual-role efficacy of biochar in urban ALWs, focusing on both pollutant removal efficiency and enhancement of visual water quality. Specifically, the objectives of this study were as follows: (1) to assess the impact of biochar on mitigating eutrophication and enhancing the visual quality of urban ALWs; (2) to analyze the influence of biochar type and dosage on its purification performance; and (3) to determine the perceptibility of biochar’s purification effects through subjective visual assessments.
2. Materials and Methods
2.1. Experimental Procedure
- (1)
- Water Sample Collection: Water samples were collected from typical ALWs. A multiparameter water quality meter was used to test the water quality of the samples. Appropriate sampling points were selected for the experiments.
- (2)
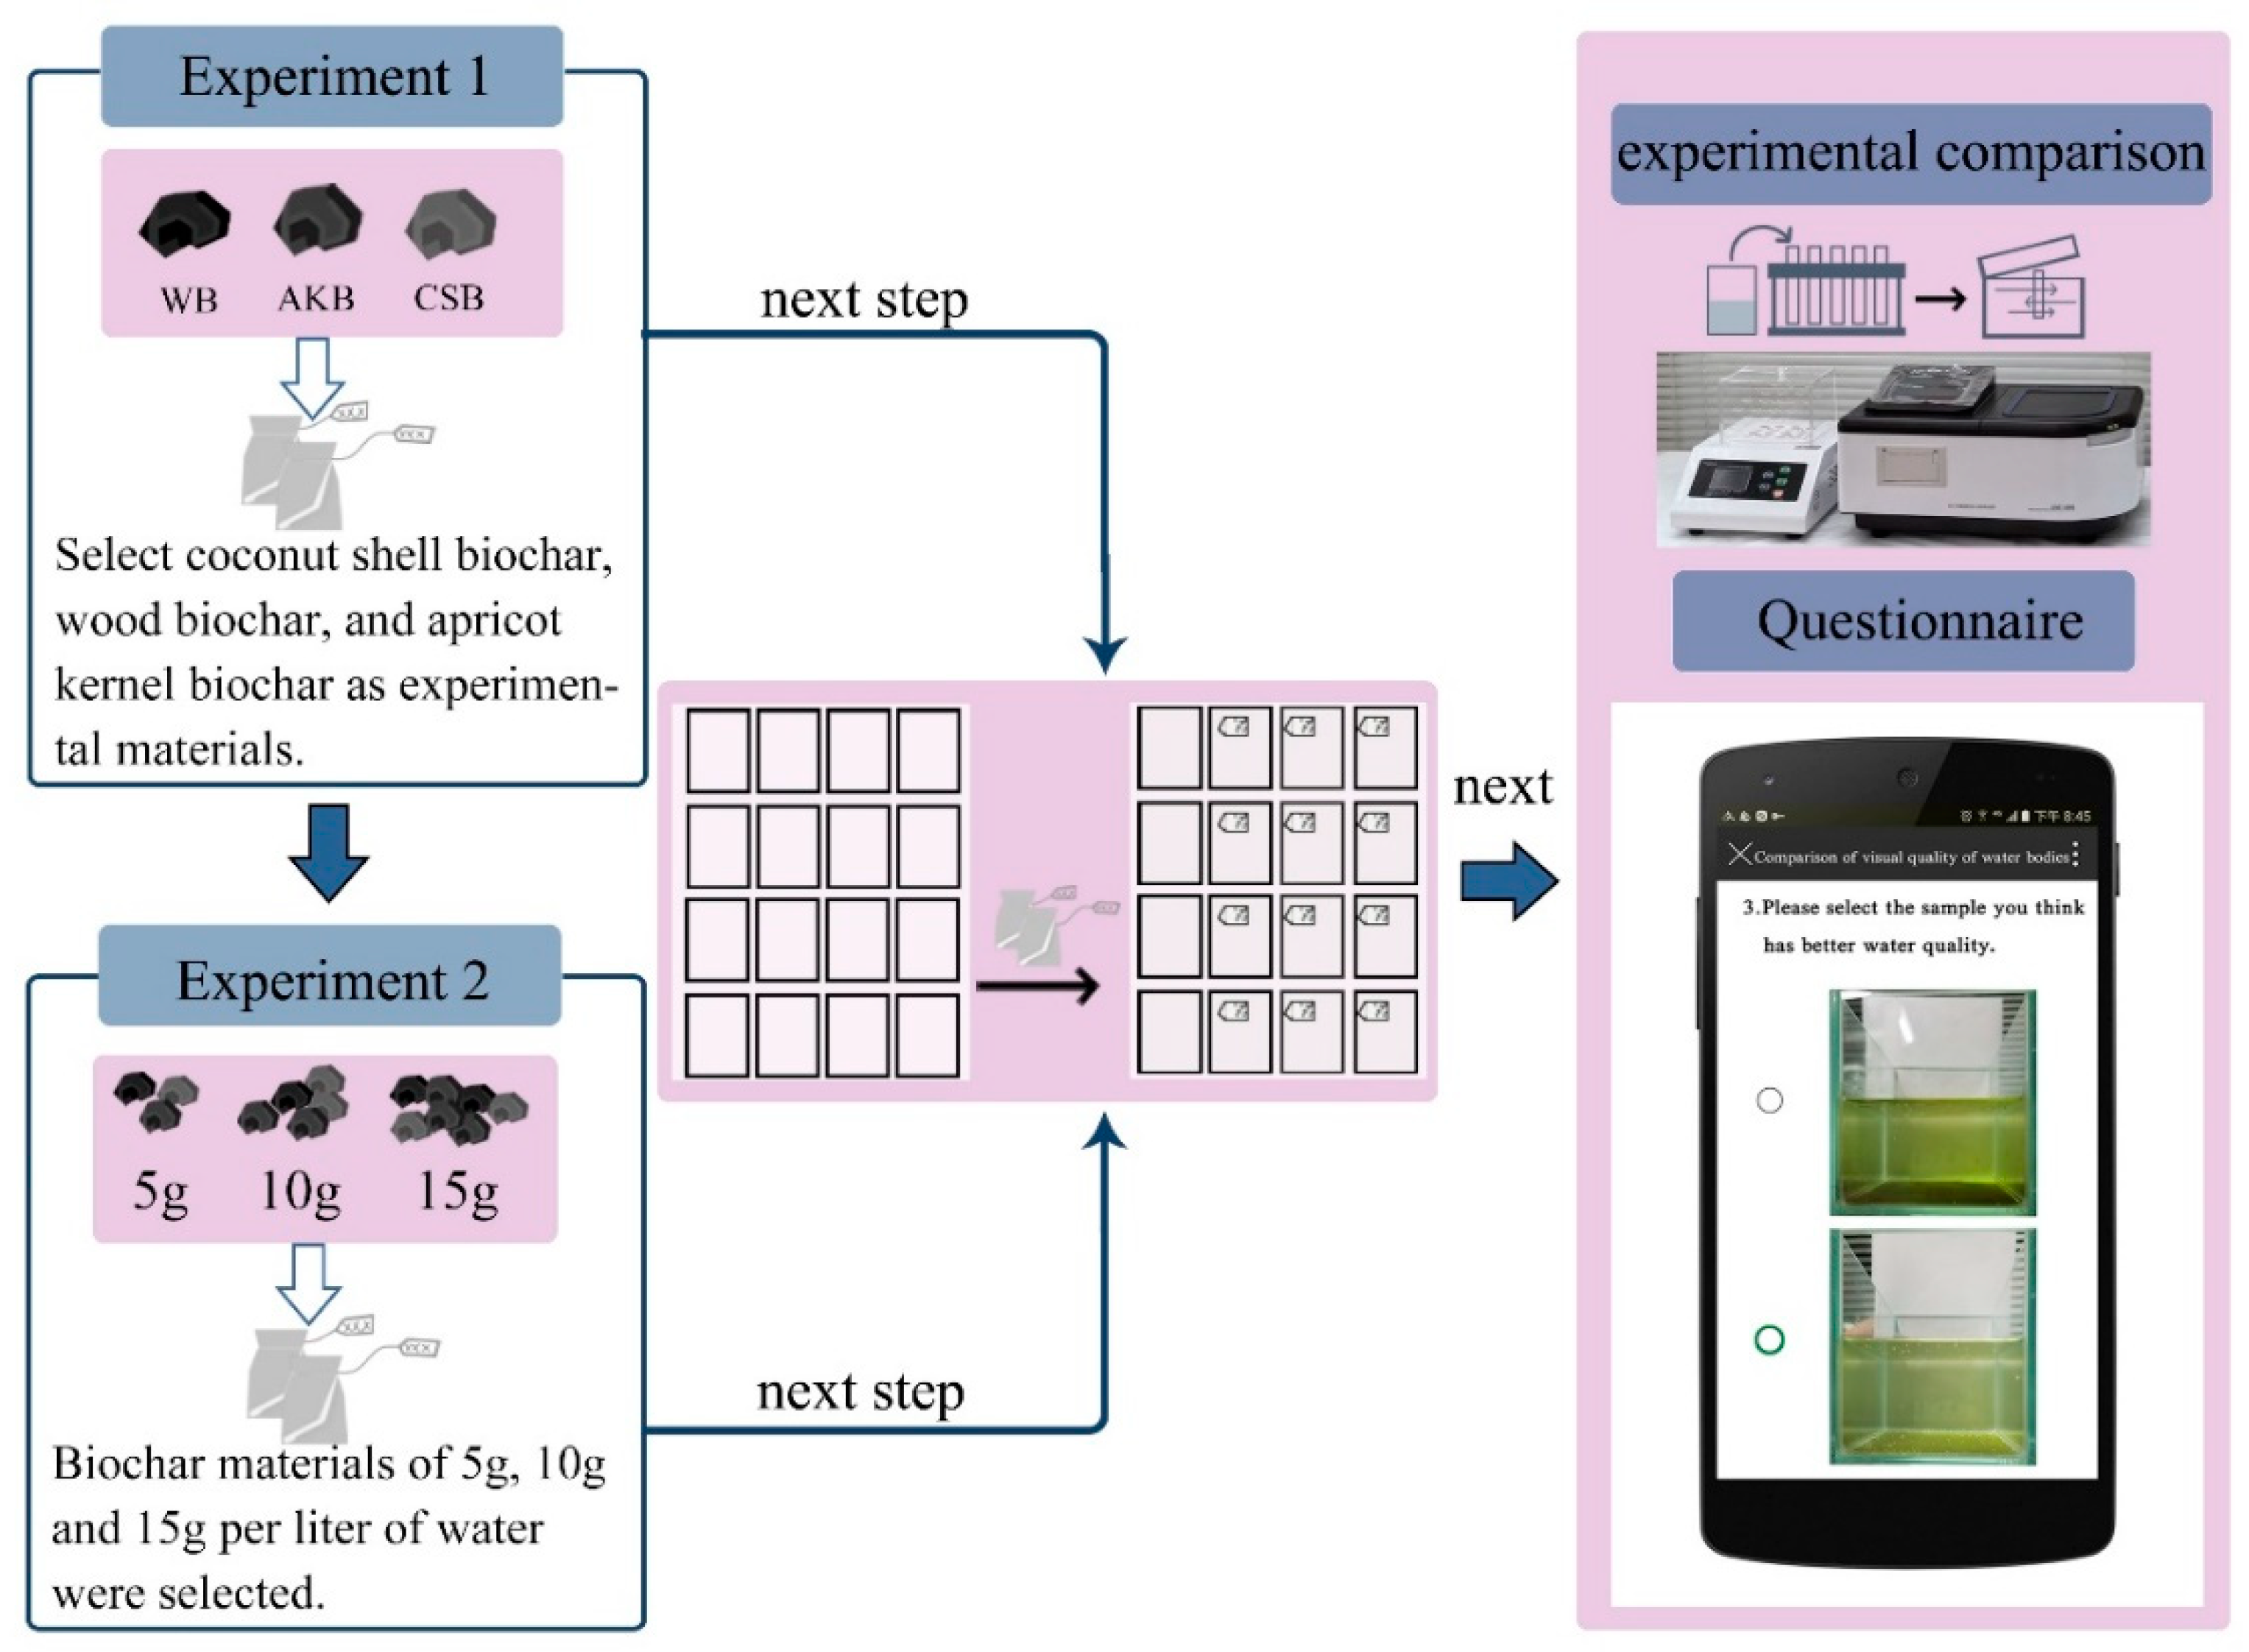
- First Phase of the Experiment: This phase aimed to compare the effects of different types of biochar on purifying ALWs. Coconut shell biochar, wood biochar, and apricot kernel biochar were selected as experimental materials, each added at a dosage of 5 g/L. A control group with no biochar addition was also established. This phase lasted for 15 days. During the experiment, objective water quality indices were measured every three days. Four samples were taken from each group, and the results were averaged (Figure 1).
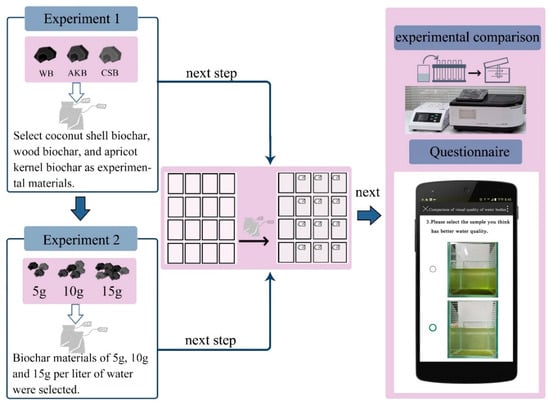 Figure 1. Experimental procedure.
 - (3)
- Second Phase of the Experiment: After determining the most effective biochar type in the first phase, further quantitative experiments were conducted to compare the effects of different biochar dosages on water purification. This phase lasted for 18 days. Dosages of 5 g, 10 g, and 15 g per liter of water were tested, with a control group that had no biochar. The same equipment and methods as in the first phase were used (Figure 1).
- (4)
- Visual Impact Assessment: After both experimental phases, vertical images of the water samples were collected. An electronic survey questionnaire was distributed to assess the visual impacts of various types and dosages of biochar on water purification.
2.2. Collection of Landscape Water Samples
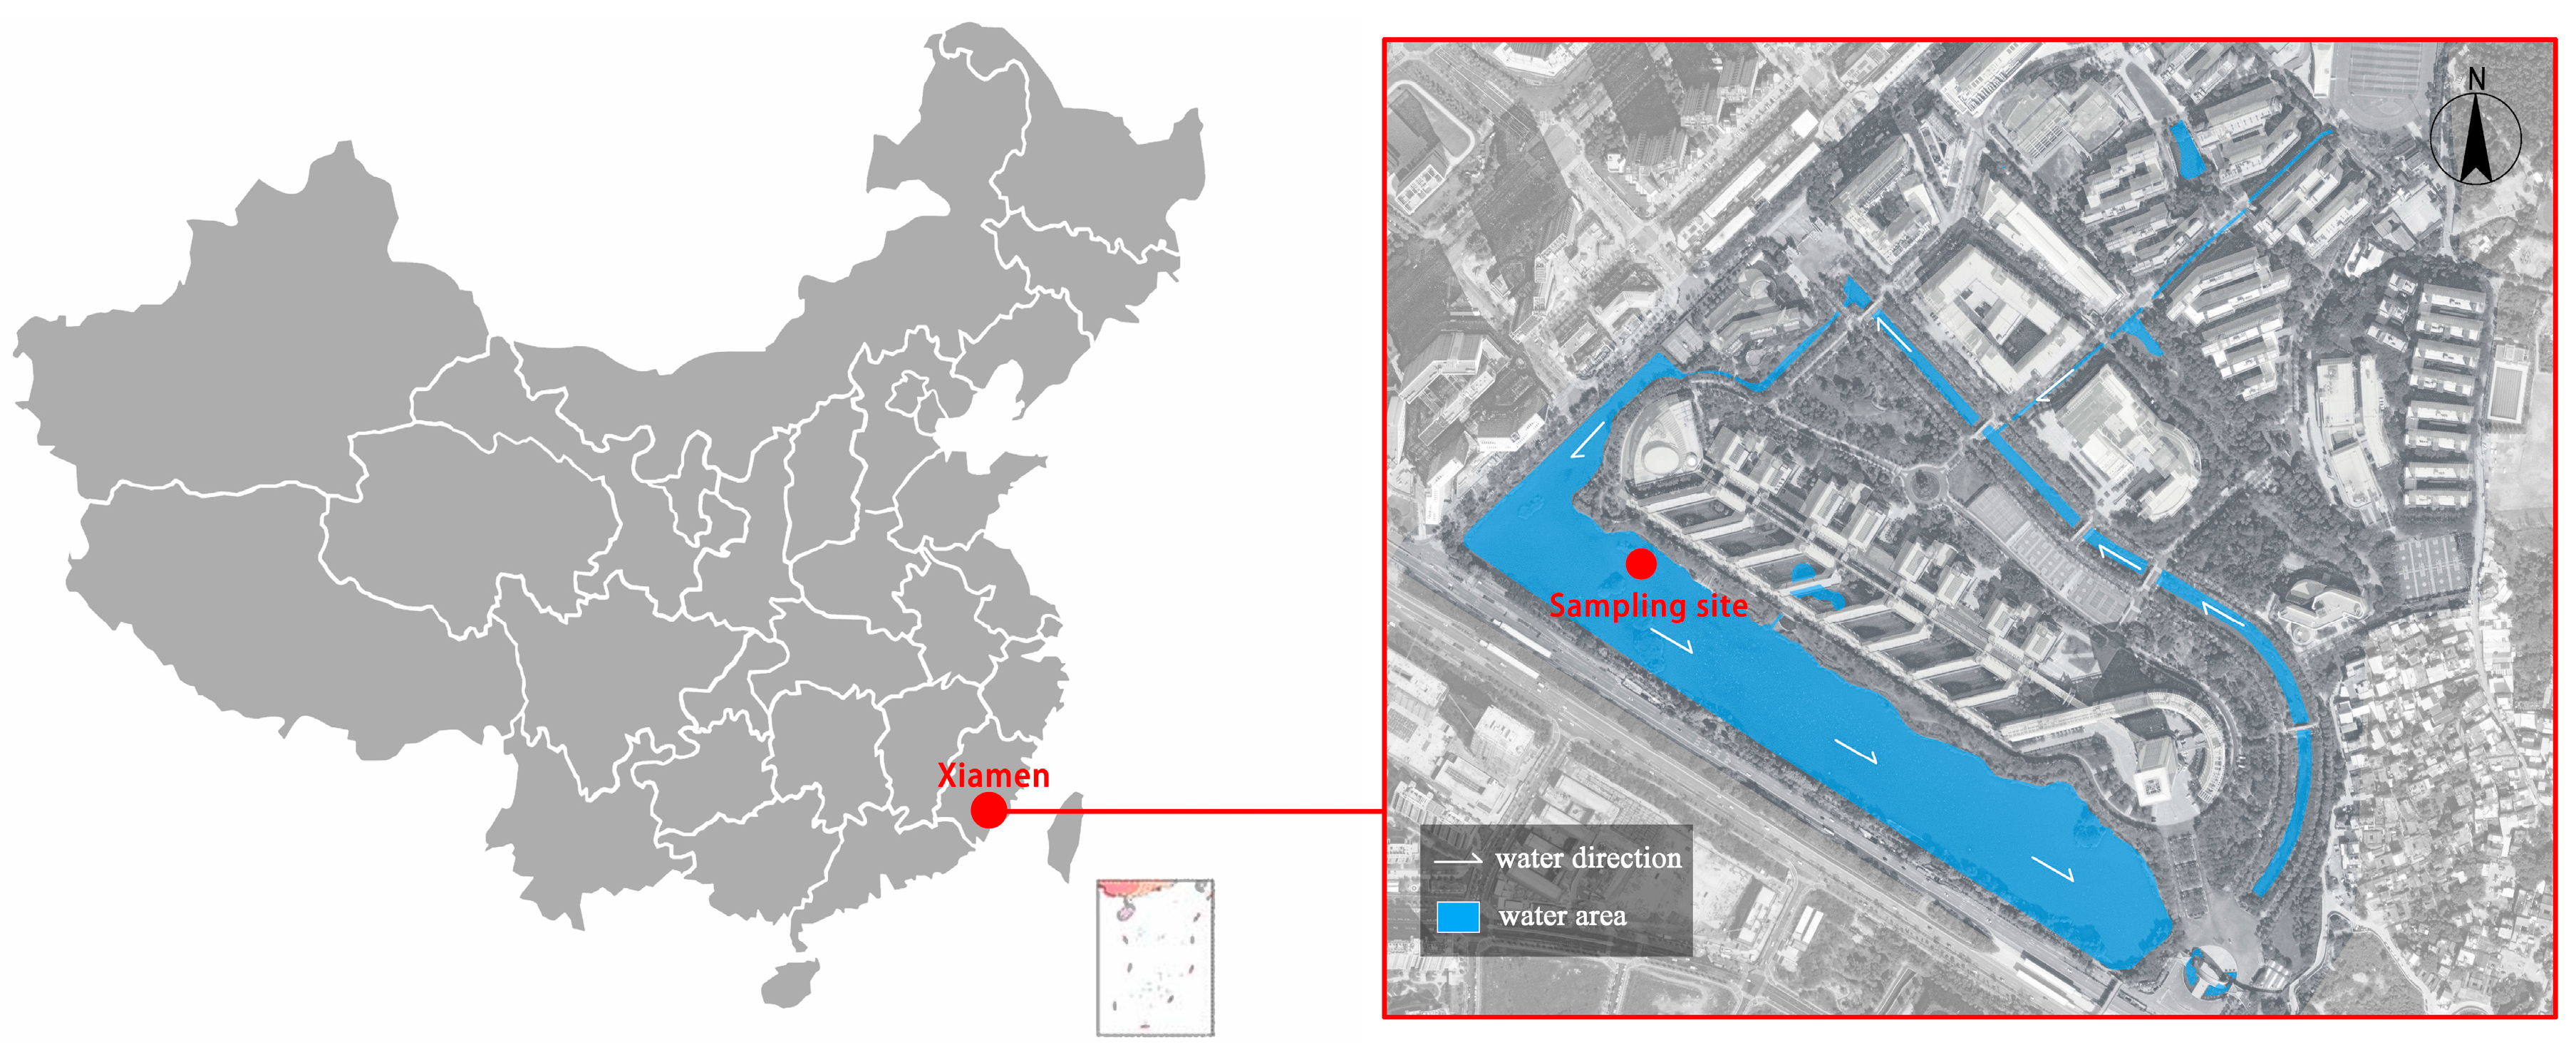
This study was conducted at Huaqiao University in Xiamen, China (N24°43′, E118°10′). The sampling site for the ALWs was the artificial wetland on the university campus (Figure 2). The wetland system, consisting of artificial rivers, lakes, and ponds, primarily serves the campus community, integrating educational, recreational, and ecological water storage functions. The water circulation in this artificial wetland is artificially controlled with minimal involvement in external natural water cycles, making it a representative sample of urban artificial landscape water bodies. Major pollution sources likely include the following: campus surface runoff pollutants; partially treated greywater from campus activities; food and waste disposal by faculty, students, and visitors; internal pollution release from sediments; and decomposition of aquatic organisms.

Figure 2.
Sampling locations.
Water samples were collected in April and November 2023, with the April samples used to compare the purification effects of different types of biochar and the November samples used to compare different biochar dosages. For each collection, sufficient water was obtained and thoroughly mixed before being equally distributed into 16 identical glass containers, with each sample containing 1 L of water. This ensured consistent initial water quality indicators across all samples. All tests were conducted on the day of collection. Due to evaporation during the experimental period, which could have led to increased concentrations of water quality indicators, distilled water was added daily to the containers to maintain a constant volume of 1 L.
2.3. Biochar Samples
The biochar used in this study was produced by a technology company in Henan Province, China, including wood biochar, apricot kernel biochar, and coconut shell biochar, which were obtained through high-temperature pyrolysis of wood sawdust, coconut shells, and apricot kernels, respectively. The production processes for the three types of biochar were essentially the same. Raw materials were cleaned of surface attachments and air-dried before crushing. The materials were then pyrolyzed in a carbonization furnace with a heating rate of 10 °C/min until a temperature of 500 °C was reached. Pyrolysis was conducted under oxygen-limited conditions for 2–3 h, depending on specific conditions. The carbonized material was subsequently cooled to approximately 25 °C using a cooling system before being discharged intermittently. The selected biochar types are common products in the market and have been widely used in soil improvement, heavy metal adsorption, and other production and living applications. The wood biochar had a particle size of 150 mesh, while the coconut shell and apricot kernel biochar had particle sizes of 6–12 mesh. The different raw materials used in preparing these three types of biochar may have resulted in significant differences in their physicochemical properties, which could have consequently led to variations in their water purification effects.
During the experiment, the required biochar dosage was measured using a high-precision electronic balance. The biochar was then placed in a nonwoven filter bag and submerged in the experimental water body, ensuring complete immersion below the water surface.
2.4. Biochar Characterization Methods
To gain a deeper understanding of the water purification mechanisms of biochar, this study examined the surface properties and textural structure of the biochar. The biochar’s physical surface characteristics were analyzed using a scanning electron microscope (SEM; TESCAN MIRA LMS, TESCAN, Brno, Czech Republic) at a magnification of ×500. Additionally, Fourier-transform infrared spectroscopy (FTIR) was used to identify the functional groups on the biochar’s surface. FTIR measurements were conducted over a wavenumber range of 400–4000 cm−1 using a Nicolet iS20 instrument (Thermo Fisher Scientific, Waltham, MA, USA).
2.5. Experimental Site
ALWs are typically located in various urban outdoor spaces, where environmental factors such as temperature, sunlight, insects, and fallen leaves can significantly impact water quality. To minimize external disturbances while closely simulating the outdoor environment, the experimental site was set up in a rooftop glasshouse at Huaqiao University [30,31]. This setup effectively isolated outdoor factors such as dust, insects, and debris, while maintaining the environmental temperature close to that of the outdoors and ensuring exposure to natural sunlight. The design of the glasshouse aimed to closely replicate real urban outdoor conditions, minimizing the influence of unpredictable factors.
2.6. Water Quality Testing Methods
2.6.1. Objective Water Quality Assessment
Based on GB 3838 [32], this study selected chemical oxygen demand (COD), ammonia nitrogen (NH3-N), total phosphorus (TP), and total nitrogen (TN) as indicators of water eutrophication. According to GB/T 18921 [33], chroma, turbidity, and suspended solids were chosen as visual quality assessment indicators for water bodies.
Water quality was assessed using a multiparameter water quality meter (GNST-900S, Henan Suijing Environmental Technology Co., Ltd., Luoyang, China) and a multifunctional intelligent digestion instrument (SJ-16X, Henan Suijing Environmental Technology Co., Ltd., Luoyang, China). The main chemical reagents used in the experiments included GNST-CODcr(L) for COD, GNST-TN(L) for total nitrogen, and specific reagents for total phosphorus and ammonia nitrogen, were all obtained from Henan Suijing Environmental Technology Co., Ltd. (Luoyang, China). The physicochemical indicators and testing methods employed in the water quality experiments are detailed in Appendix A.
2.6.2. Subjective Evaluation of Water Quality
At the end of the experiment, vertical profile images of the water bodies in glass containers were captured using a Sony ZV-E10 mirrorless camera (Sony Corporation, Tokyo, Japan). These images formed the basis for a visual experience survey, which was distributed electronically to the public to obtain subjective evaluations of water quality. To ensure uniformity, the glass containers were placed in a controlled indoor setting during the photography. Additionally, the containers’ exterior surfaces were cleaned to minimize potential distortions from lighting and background factors.
The visual quality assessment was conducted through pairwise comparisons of water-body profile images. Respondents selected images they perceived as having superior water quality and visual appeal between two options. The respondents were ordinary citizens aged 18 and above. The differences in water quality samples were analyzed using the Bradley–Terry (BT) model.
3. Results
3.1. Urban Landscape Water-Body Water Quality
Table 1 presents the water quality requirements for urban landscape water bodies as specified in the GB 3838 [32] and GB 18901 [33] standards, along with the initial water quality indicators of the experimental water bodies in April and November. The results reveal two key findings. First, the water quality of the experimental water bodies was poor, with most indicators failing to meet the standards for urban landscape water bodies. In April, only NH3-N met the required standard, while in November, only COD reached the standard. Second, there were significant differences in water quality indicators for the same location across different sampling times. The concentrations of total phosphorus, total nitrogen, and chemical oxygen demand in the April samples were significantly higher than those in the November samples. However, the suspended solids levels were similar for both periods, and the concentrations of NH3-N, turbidity, and chromaticity in April were lower than those in November. Overall, the water quality appeared to have improved in November. These fluctuations can be attributed to various factors, including short-term pollutant emissions, precipitation, and controlled water circulation. The results highlight the dynamic nature and complexity of urban landscape water bodies, with significant changes in water quality occurring over time, which is distinct from typical urban sewage or industrial and agricultural wastewater.

Table 1.
Water quality indices of initial water samples.
3.2. Effects of Biochar Types on Improving ALWs
3.2.1. Objective Water Quality Indices
The average values of the water quality indices from the last three measurements of each landscape water sample were calculated and compared between the control and experimental groups. Table 2 summarizes the changes in TN, NH3-N, TP, COD, turbidity, chroma, and suspended solids for the three types of biochar in comparison to the control group.
Table 2.
Impact of different types of biochar on water quality indices.
In general, all three types of biochar exhibited beneficial effects in improving water quality by reducing levels of TN, NH3-N, TP, COD, turbidity, and chroma. Among the biochar types, AKB was particularly effective in lowering TN and NH3-N concentrations, while CSB demonstrated the highest efficiency in reducing TP and COD. Furthermore, CSB also had a notable impact on reducing turbidity and chroma levels. WB, although less effective than CSB, also contributed positively to the reduction in TN, NH3-N, TP, and COD in the water. The observed differences in purification effectiveness between the biochar types may be attributed to variations in their surface properties and adsorption capacities, which influence their ability to interact with and remove contaminants from water.
In terms of visual water quality indicators, such as turbidity and chroma, CSB demonstrated the most significant improvement, indicating its particularly effective role in enhancing water clarity. This can be attributed to CSB’s strong capacity to remove suspended particles, which subsequently improved both the transparency and the overall visual appeal of the water.
It is also important to note that WB appeared to increase the concentration of suspended solids. This may have been due to its physical properties, such as a larger particle size or a tendency to aggregate in water, which resulted in higher levels of suspended solids. This observation highlights the importance of considering both the pollutant removal efficiency and the broader environmental impact when choosing biochar for water treatment applications.
3.2.2. Subjective Visual Evaluation of Water Quality
The comparison of the purified water quality was conducted using an electronic questionnaire for pairwise comparisons. Table 3 presents the results of the visual evaluation of the water purification effects, analyzed using the Bradley–Terry model. All p-values were below 0.05, indicating that the subjects’ preferences for the water bodies were statistically significant. The preference shares for the original water sample, WB, CSB, and AKB were 6.8%, 17.2%, 53.2%, and 22.8%, respectively, with strength parameters of −1.057, −0.123, 1.008, and 0.161. This indicates that all three types of biochar improved the visual appearance of the ALWs compared to the untreated original water sample, with CSB showing the best performance, followed by AKB, and WB being the least effective.
Table 3.
Bradley–Terry model analysis results.
3.3. Characterization of Biochar Before and After the Experiment
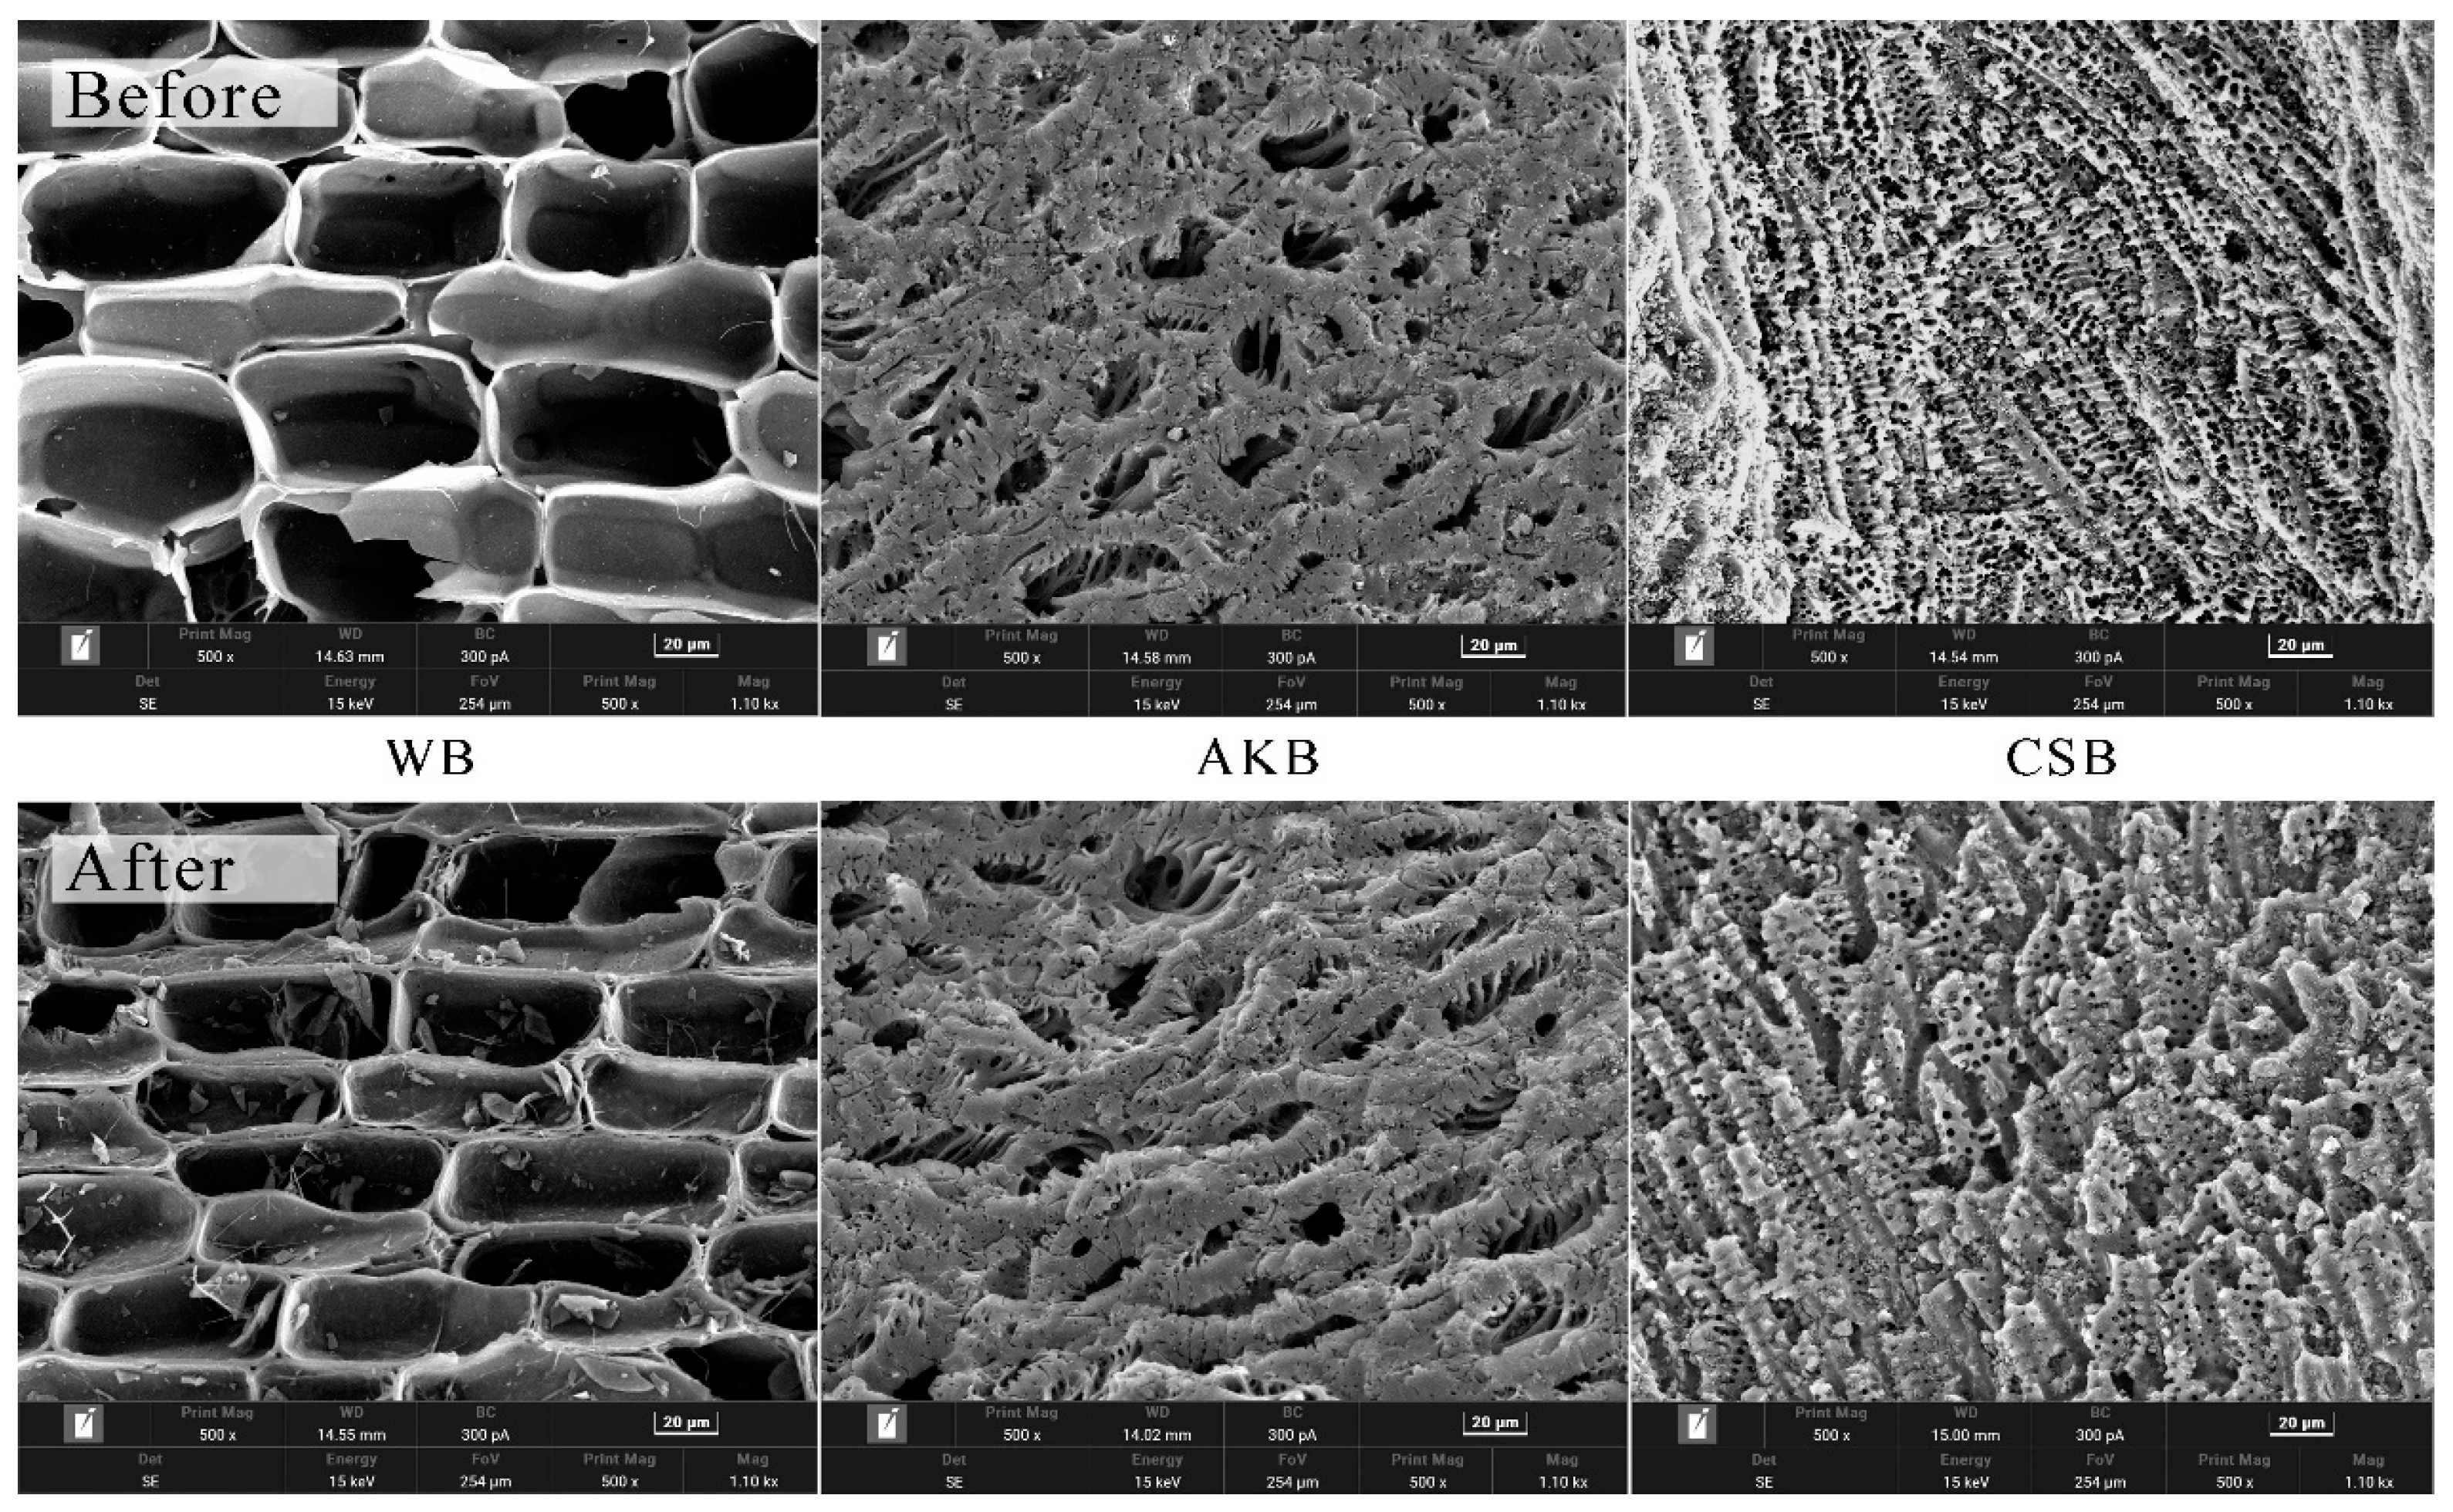
The biochar samples from the first phase of the experiment were characterized both before and after the experiments using SEM imaging (Figure 3) and FTIR (Figure 4) to determine if the properties of the biochar had changed. The SEM images revealed significant differences among the three types of biochar. WB exhibited large and highly regular pores, which are natural anatomical features of wood, such as vessels and tracheids, preserved in the biochar [34]. In contrast, AKB and CSB displayed many smaller pores, contributing to their higher surface areas. CSB, in particular, had denser pores with greater variation in size. This variation may be related to the type of biomass used. Previous research indicates that biomass rich in lignin, such as wood, tends to form biochar with larger pores, whereas biomass rich in cellulose, like apricot kernels, tends to produce biochar with micropores [35]. The diverse composition of CSB, rich in lignin, cellulose, and hemicellulose [36], may explain the presence of both macropores and micropores.

Figure 3.
SEM micrographs of WB, AKB, and CSB.
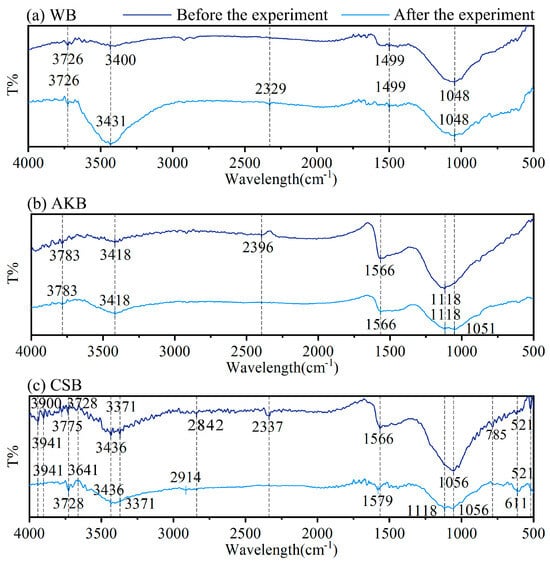
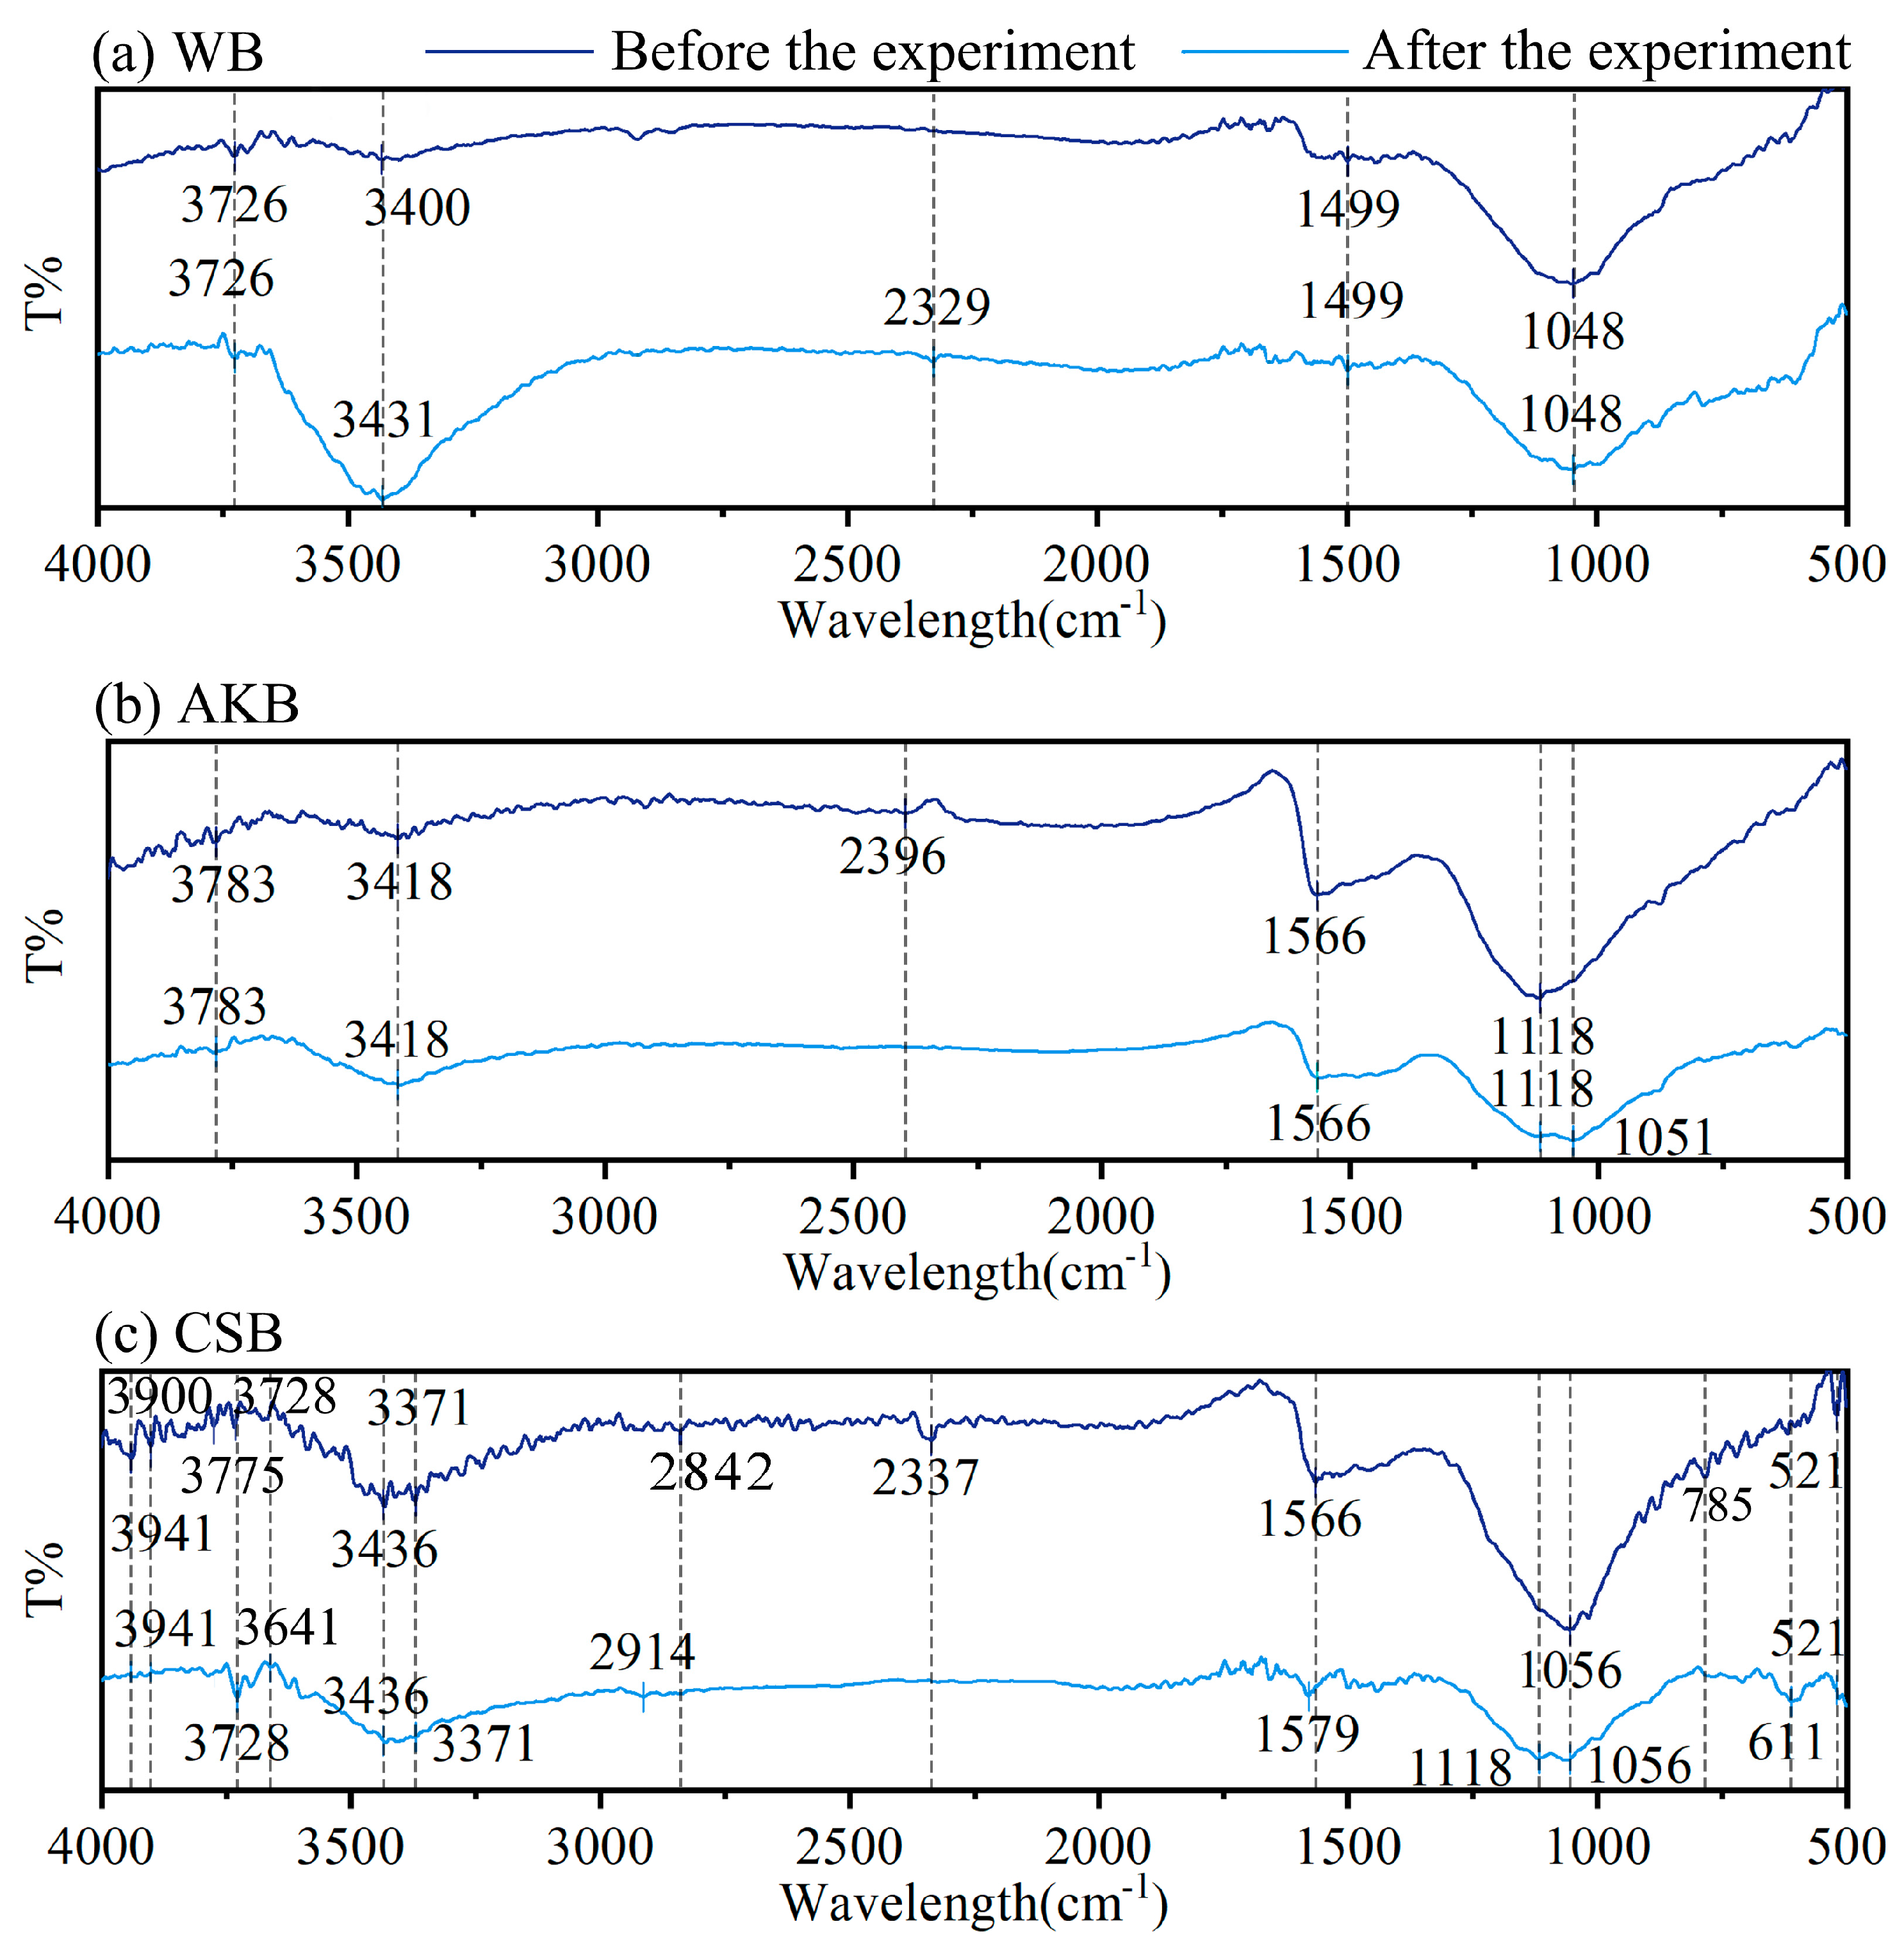
Figure 4.
FTIR spectra of WB, AKB, and CSB.
The SEM images of the three biochar types, taken before and after the experiment, reveal significant structural changes resulting from the water purification process. After the experiment, the biochars exhibited less defined pore structures, increased surface roughness, and partial occlusion of some pores. These changes were likely due to the adsorption of suspended solids or other impurities from the water, which were captured within the biochar’s surface.
Figure 4 presents the infrared spectra of the three biochars, recorded before and after the water purification process. The range from 3200 to 3900 cm−1 corresponds to the stretching vibrations of hydroxyl groups (-OH) [37,38]. At 2914 cm−1, symmetric stretching vibrations of methyl groups (-CH3) are observed, while the absorption peaks around 2842 cm−1 are linked to methylene (-CH2-) groups in long-chain saturated alkanes [39,40]. The stretching vibration band of the carbonyl (C=O) group is located at 1690–1700 cm−1. The peaks between 1540 and 1640 cm−1 are indicative of carboxyl (-COOH) groups and suggest the presence of carbonyl (-C=O) and carboxylic acids [41]. Additionally, a peak at 1556 cm−1 represents C–C aromatic stretching, and the band near 1063 cm−1 points to C-O-C vibrations. Finally, the peaks at 611 cm−1 and 521 cm−1 are associated with C-H bending vibrations.
Before the water purification experiments, CSB showed the most extensive range of infrared peaks, followed by AKB, with WB exhibiting the fewest. This indicates that CSB has a wider variety of chemical functional groups, including ethers, carbonyls, phenols, and aromatic compounds, which align with the presence of lignin and cellulose in the coconut shells [42,43]. In contrast, WB displayed fewer functional groups. When comparing the infrared spectra of the biochars before and after the purification process, WB and AKB showed relatively minor changes in peak positions. However, CSB exhibited more significant alterations, particularly a shift or decrease in absorption peaks within the 3200 to 3900 cm−1 range after the experiment. This shift was likely due to chemical adsorption interactions between the hydroxyl groups on the biochar surface and various compounds present in the water, such as organic solutes from decomposed plant matter and chlorophyll, as well as inorganic substances and metal ions like phosphorus and manganese. These interactions may account for the observed decrease or shift in the O-H absorption peaks.
3.4. Effects of Biochar Dosage on ALWs
For the experiments investigating the impact of biochar dosage on ALWs, CSB, which showed superior performance in the initial phase, was chosen as the biochar material for the subsequent trials. The experimental water bodies were located at the same sites as in the first phase. Since the indicator values had not stabilized within the 15-day duration of the initial experiment, the duration was extended to 18 days for the second phase.
3.4.1. Objective Water Quality Indices
Table 4 displays the changes in water environmental indices in the ALWs with different dosages of CSB over 18 days. These results reveal a key insight: the efficacy of biochar in purifying water is not linear but is influenced by a complex interplay of factors, including dosage, material properties, and the conditions of the water body.
Table 4.
Impact of different dosages of biochar on water quality indices.
As for the removal of TN, the removal rates increased with higher biochar dosages, indicating that within a certain range, the adsorption capacity of biochar improves as the dosage increases. However, for ammonia nitrogen removal, the highest effectiveness was achieved at a dosage of 10 g/L, with a decline in performance at 15 g/L. This nonlinear trend could have been due to the saturation of adsorption sites on the biochar surface at higher dosages, or it might have resulted from chemical reactions initiated by the biochar that altered the form of NH3-N. A similar pattern was observed in the removal of chemical oxygen demand. In contrast, the use of biochar for TP removal led to an unexpected increase in TP levels in the water, with the extent of the increase correlating with the biochar dosage. This result differs from the findings in the first phase of the experiment. This outcome is important for the practical use of biochar, as it suggests that, under certain conditions, excessive biochar may worsen environmental impacts rather than improve them.
The trends for turbidity and suspended solids also followed a nonlinear pattern. Compared to the control group without biochar, CSB at a dosage of 10 g/L yielded the most substantial improvement in turbidity, reducing the turbidity index by 42.4%, with CSB at 5 g/L showing the next best result. Interestingly, when CSB was applied at 15 g/L, turbidity actually increased. Regarding chroma, all biochar treatments resulted in lower chroma values than the control, with CSB at 10 g/L achieving the most significant reduction. For suspended solids, CSB at 5 g/L was the most effective, reducing the suspended solids index by 46%, while CSB at 10 g/L led to a more modest reduction. However, at a higher dosage of 15 g/L, CSB caused an increase in suspended solids. At the lower dosages, biochar effectively reduced both turbidity and suspended solids, but at the higher dosage, both indices rose. This increase could be attributed to the higher dosage promoting the formation of additional particles in the water or disrupting the balance of suspended solids.
3.4.2. Subjective Visual Evaluation of Water Quality
Table 5 shows the results of the subjective visual evaluation of water purification effects using various biochar dosages, analyzed through the Bradley–Terry model. The preference shares for the original water sample, CSB at 5 g/L, CSB at 10 g/L, and CSB at 15 g/L were 7.3%, 18.2%, 67.4%, and 7.1%, respectively, with corresponding strength parameters of −0.733, 0.181, 1.487, and −0.769. These findings suggest that, compared to the untreated original water sample, the visual quality of water improved with the addition of 5 g/L and 10 g/L of CSB, with the 10 g/L dosage yielding the most significant improvement. In contrast, the preference share and strength parameter for the 15 g/L biochar sample were slightly lower than those for the original water, indicating a diminished visual effect at this higher dosage.
Table 5.
Analysis results of the Bradley–Terry model.
4. Discussion
4.1. The Impact of Biochar Types on Landscape Water Purification
Different types of biochar have varying effects on the purification of eutrophication in ALWs. In this regard, CSB performs the best, followed by AKB, with WB being relatively less effective. This variation may be related to the pore structure and the number of functional groups on the surface of the biochar. Biochar, with its high specific surface area and porosity, provides a large surface area for adsorbing or capturing suspended particles and colored substances. These pores also facilitate physical adsorption between particles, thus reducing turbidity and chroma in water.
Larger pores in biochar can foster the growth of microorganisms, thereby enhancing the decomposition of organic matter in water. Smaller pores, on the other hand, are more efficient at adsorbing suspended particles. The study found that WB has larger pores, AKB has smaller pores, and CSB contains both micro- and macropores, giving it a more favorable pore structure compared to WB and AKB. CSB’s excellent hierarchical pore structure not only provided a greater specific surface area but also achieved synergistic optimization of mass transfer and adsorption. This superior pore structure likely accounts for CSB’s better performance in reducing turbidity, chroma, and suspended solids in ALWs.
From a chemical perspective, oxygen-containing functional groups on biochar surfaces (such as -COOH, -OH, and C=O) play crucial roles in pollutant removal. These groups interact with water pollutants through multiple mechanisms, including electrostatic attraction, ion exchange, and coordination complexation. For instance, -COOH groups can form inner-sphere complexes with metal ions, -OH groups can adsorb organic matter through hydrogen bonding, and C=O groups facilitate π-π stacking interactions. FTIR analysis revealed that CSB possessed the most diverse and abundant surface functional groups, explaining its superior chemical adsorption performance. The variety and quantity of functional groups directly influenced biochar surface charge distribution and acid–base properties, thereby affecting interaction intensities with different pollutants.
Additionally, Hale et al. [44] highlighted significant variations in nutrient content among different types of biochar. For instance, cocoa shell biochar contains 1.4% nitrogen and 0.40% phosphorus, whereas corn cob biochar contains 0.6% nitrogen and 0.07% phosphorus. When biochar is applied to water, these nutrients may be released, which could contribute to the observed differences in the purification performance of various biochars in water bodies.
The physicochemical properties of different biochar types directly influenced their purification effects and subsequently affected subjective perceptions of landscape water quality. Bradley–Terry model analysis showed preference shares of 53.2%, 22.8%, and 17.2% for CSB, AKB, and WB, respectively, all of which were superior to that of raw water (6.8%). The consistency between subjective evaluation results and objective indicators demonstrates that purification effects of different biochar types are visually perceptible, holding significant implications for practical landscape water applications.
4.2. The Impact of Biochar Dosage on Water-Body Eutrophication
Li et al. [45] found that low doses of biochar reduced the phosphorus content in water, while high doses increased it. This finding aligns with observations from the second phase of our study. At low doses (e.g., <5 g/L), limited active sites on biochar surfaces resulted in insufficient adsorption capacity. As the dosage increased, more effective adsorption sites became available, improving purification efficiency. However, when a critical threshold was exceeded, excessive biochar aggregated, reducing the effective specific surface area and potentially causing secondary pollution. Furthermore, data from both phases of this study indicated that biochar’s impact on eutrophication was influenced by initial water quality. Specifically, when the initial phosphorus content was high, biochar significantly reduced total phosphorus levels in ALWs. Conversely, when the initial phosphorus content was low, biochar potentially increased phosphorus concentration, with higher doses leading to greater increases. This observation is in agreement with the findings of Cui et al. [46]. The biochar used in the second stage of this study was CSB. Unmodified CSB typically contains over 0.1% TP [47,48]. As most commercially available biochars are currently used for soil improvement, focusing on increasing nutrient content, these biochars may cause a rise in eutrophication indicators in water bodies with low nutrient levels.
The release kinetics of nutrients from biochar are also dose-dependent. Under low-dose conditions, soluble phosphorus and nitrogen on biochar surfaces are released slowly; under high-dose conditions, rapid accumulation of these elements may increase nutrient salt concentrations, affecting water transparency.
Different biochar doses showed varying effectiveness in reducing turbidity and suspended solids in ALWs. This study demonstrated that increasing biochar dosage does not always result in better purification of turbidity, chromaticity, and suspended solids. In fact, when a critical threshold was exceeded, excessive biochar significantly increased turbidity and suspended solids, causing secondary pollution. This phenomenon was clearly reflected in the subjective visual evaluation: 10 g/L CSB achieved the highest preference share (67.4%) and intensity parameter (1.487), while 15 g/L resulted in visual effects inferior to those of raw water (preference share: 7.1% vs. 7.3%). Additionally, high doses of biochar may alter water pH, affecting the behavior of suspended solids, as well as their precipitation and dissolution, ultimately influencing turbidity.
4.3. Application Potential of Biochar in Landscape Water Purification
Different types of biochar offer flexibility in treatment design through their varying performances. For example, CSB, with its hierarchical pore structure and abundant functional groups, exhibited superior purification effects, while other types like AKB and WB showed varying degrees of effectiveness. Different types of biochar carry varying amounts of nutrients. For instance, cocoa shell biochar contains 1.4% nitrogen and 0.40% phosphorus, whereas corn cob biochar contains 0.6% nitrogen and 0.07% phosphorus [44]. This diversity allows for the selection of appropriate biochar types based on specific water quality issues and treatment requirements.
The impact of biochar dosage varies with initial water quality conditions. At higher pollutant concentrations, biochar showed enhanced removal efficiency, suggesting its potential application in heavily polluted water bodies. Through physical adsorption, chemical interactions, and biological processes, biochar can simultaneously reduce multiple pollutants (turbidity, nutrients, and suspended solids), making it a versatile option for integrated water treatment.
However, the practical implementation of biochar in landscape water treatment faces several challenges that need to be addressed. This study shows that biochar after water treatment exhibits pore blockage and partial deactivation of oxygen-containing functional groups, leading to decreased continuous water purification capacity. Biochar regeneration plays a crucial role in wastewater treatment, as it directly affects economic viability and helps reduce operational and management costs. Through regeneration, biochar can be reused multiple times, thereby improving the cost-effectiveness of the treatment method. Among various approaches, chemical regeneration has been recognized as one of the most commonly used techniques [49]. However, careful monitoring during regeneration is necessary to prevent potential nutrient release and secondary pollution. Recent studies have shown that using persulfate as an oxidant combined with thermal activation for regenerating saturated biochar can effectively treat complex pollutants while maintaining the integrity of the biochar’s pore structure [50]. This demonstrates the significant potential for cyclic utilization of biochar in treating urban landscape water bodies.
Future research should focus on optimizing biochar application strategies in real-world settings, considering factors such as seasonal variations, complex pollutant compositions, and long-term stability. Additionally, developing standardized protocols for biochar selection, application, and regeneration would facilitate wider adoption in landscape water treatment projects.
4.4. Limitations
This study primarily analyzed the effects of different types and dosages of biochar on ALWs under controlled environmental conditions. However, in urban outdoor environments, landscape water quality is influenced by numerous factors, which can cause significant fluctuations in water quality over short periods. Future research should explore the effectiveness of biochar in purifying water quality in dynamic urban landscape environments, taking into account factors such as the status of aquatic organisms, seasonal variations in temperature and precipitation, and other environmental factors specific to the urban setting. Additionally, this study only focused on three commonly available biochar materials in the market. Future studies should expand the range of biochar types, particularly focusing on modified biochars and their water purification characteristics, to determine whether modifications enhance adsorption capacity and affect other elements or components in water samples. Furthermore, it is necessary to thoroughly investigate the adsorption potential of biochar. Currently, there is a lack of detailed analysis regarding the reusability, usage limits, and optimal dosage of biochar, which warrants further research in the future.
5. Conclusions
The study employed comparative experimental methods to analyze the impact of three different types of biochar and varying dosages on the water quality of urban ALWs. The findings indicate the following:
Biochar affects total phosphorus, total nitrogen, ammonia nitrogen, chemical oxygen demand, turbidity, chroma, and suspended solids in urban ALWs. In terms of purifying landscape water, CSB is more effective than WB and AKB. This effectiveness is partly because CSB possesses a more abundant pore structure that facilitates the adsorption of impurities and a richer array of functional groups that more readily degrade organic substances and metal ions in water.
The dosage of biochar influences its water purification effectiveness. Within a certain range, increasing the dosage enhances purification effects. However, when the dosage exceeds a certain threshold, the chemical elements and impurities inherent in the biochar may be released into the water, potentially degrading water quality.
The use of biochar for water purification significantly improved the subjective aesthetic experience. The preference shares for water bodies without biochar and those treated with wood biochar, coconut shell biochar, and apricot kernel biochar were 6.8%, 17.2%, 53.2%, and 22.8%, respectively. The preference shares for water bodies without biochar and those treated with 5 g/L, 10 g/L, and 15 g/L coconut shell biochar were 7.3%, 18.2%, 67.4%, and 7.1%, respectively.
The water quality conditions of urban ALWs are unstable and influenced by human activities and climatic conditions such as rainfall. These factors can lead to significant changes in water quality over short periods, directly impacting the effectiveness of biochar purification. When eutrophication levels in ALWs are high, biochar can effectively purify the water; however, when water quality is already good, biochar might elevate certain indices. Therefore, the use of biochar for water purification should be dependent on specific water quality conditions, and biochar should be modified when necessary to achieve optimal purification results.
Author Contributions
Conceptualization, R.J. and Z.Z.; methodology, R.J., Z.Z. and L.D.; formal analysis, R.J.; investigation, R.J.; resources, M.W. and L.D.; data curation, R.J.; writing—original draft preparation, R.J. and Z.Z.; writing—review and editing, M.W. and L.D.; visualization, R.J.; project administration, Z.Z.; funding acquisition, M.W. All authors have read and agreed to the published version of the manuscript.
Funding
This work was supported by the Guangzhou City School (Institute) Enterprise Joint Funding Project, China [grant number 2024A03J0317].
Data Availability Statement
The data presented in this study are available on request from the corresponding author.
Conflicts of Interest
The authors declare no conflicts of interest.
Abbreviations
Artificial landscape water bodies, ALWs; wood biochar, WB; apricot kernel biochar, AKB; coconut shell biochar, CSB; control group, CG; total nitrogen, TN; ammonia nitrogen, NH3-N; total phosphorus, TP; chemical oxygen demand, COD.
Appendix A. Water Quality Monitoring Instruments, Reagents, and Testing Methods
Table A1.
Main instruments and equipment.
Table A1.
Main instruments and equipment.
| Name | Model | Manufacturer |
|---|---|---|
| Multiparameter Water Quality Meter | GNST-900S | Henan Suijing Environmental Technology Co., Ltd. (Luoyang, China) |
| Multifunctional Intelligent Digestion Instrument | SJ-16X | Henan Suijing Environmental Technology Co., Ltd. (Luoyang, China) |
| Electronic Balance | YH-B | Yiheng Electronic Technology Co., Ltd. (Shenzhen, China) |
Table A2.
Water quality testing indicators and methods.
Table A2.
Water quality testing indicators and methods.
| Reagent Name | Specification | Manufacturer |
|---|---|---|
| COD Reagent, GNST-CODcr(L) | Analytical Grade | Henan Suijing Environmental Technology Co., Ltd. (Luoyang, China) |
| Total Nitrogen Reagent, GNST-TN(L) | Analytical Grade | Henan Suijing Environmental Technology Co., Ltd. (Luoyang, China) |
| Total Phosphorus Reagent | Analytical Grade | Henan Suijing Environmental Technology Co., Ltd. (Luoyang, China) |
| Ammonia Nitrogen Reagent | Analytical Grade | Henan Suijing Environmental Technology Co., Ltd. (Luoyang, China) |
Table A3.
Selection and measurement methods for objective water quality indices.
Table A3.
Selection and measurement methods for objective water quality indices.
| Water Quality Indicator | Measurement Method | Wavelength (nm) |
|---|---|---|
| Chroma | Spectrophotometry | 420 |
| Turbidity | Spectrophotometry | - |
| Suspended Solids | Spectrophotometry | 630 |
| Chemical Oxygen Demand (COD) | Dichromate Spectrophotometry | 550 |
| Total Phosphorus (TP) | Ammonium Molybdate Spectrophotometry | 700 |
| Total Nitrogen (TN) | Colorimetric Spectrophotometry | 220 |
| Ammonia Nitrogen (NH3-N) | NH3-N Nessler’s Reagent Spectrophotometry | 650 |
Appendix B. Changes in Water Quality Indices for Control and Experimental Groups During the First Phase of the Experiment
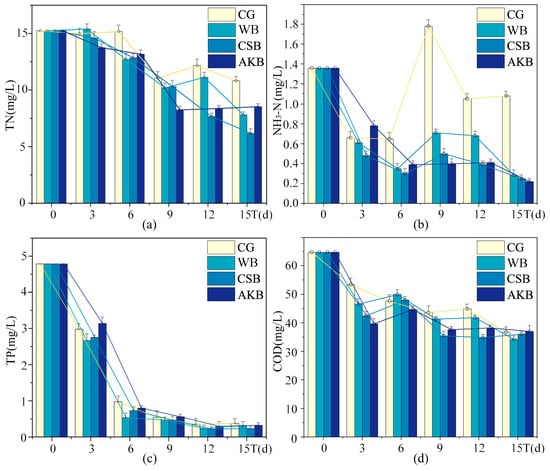
Figure A1.
Changes in visual quality indices of ALWs during the first phase of the experiment: (a) TN; (b) NH3-N; (c) TP; (d) COD.
Figure A1.
Changes in visual quality indices of ALWs during the first phase of the experiment: (a) TN; (b) NH3-N; (c) TP; (d) COD.
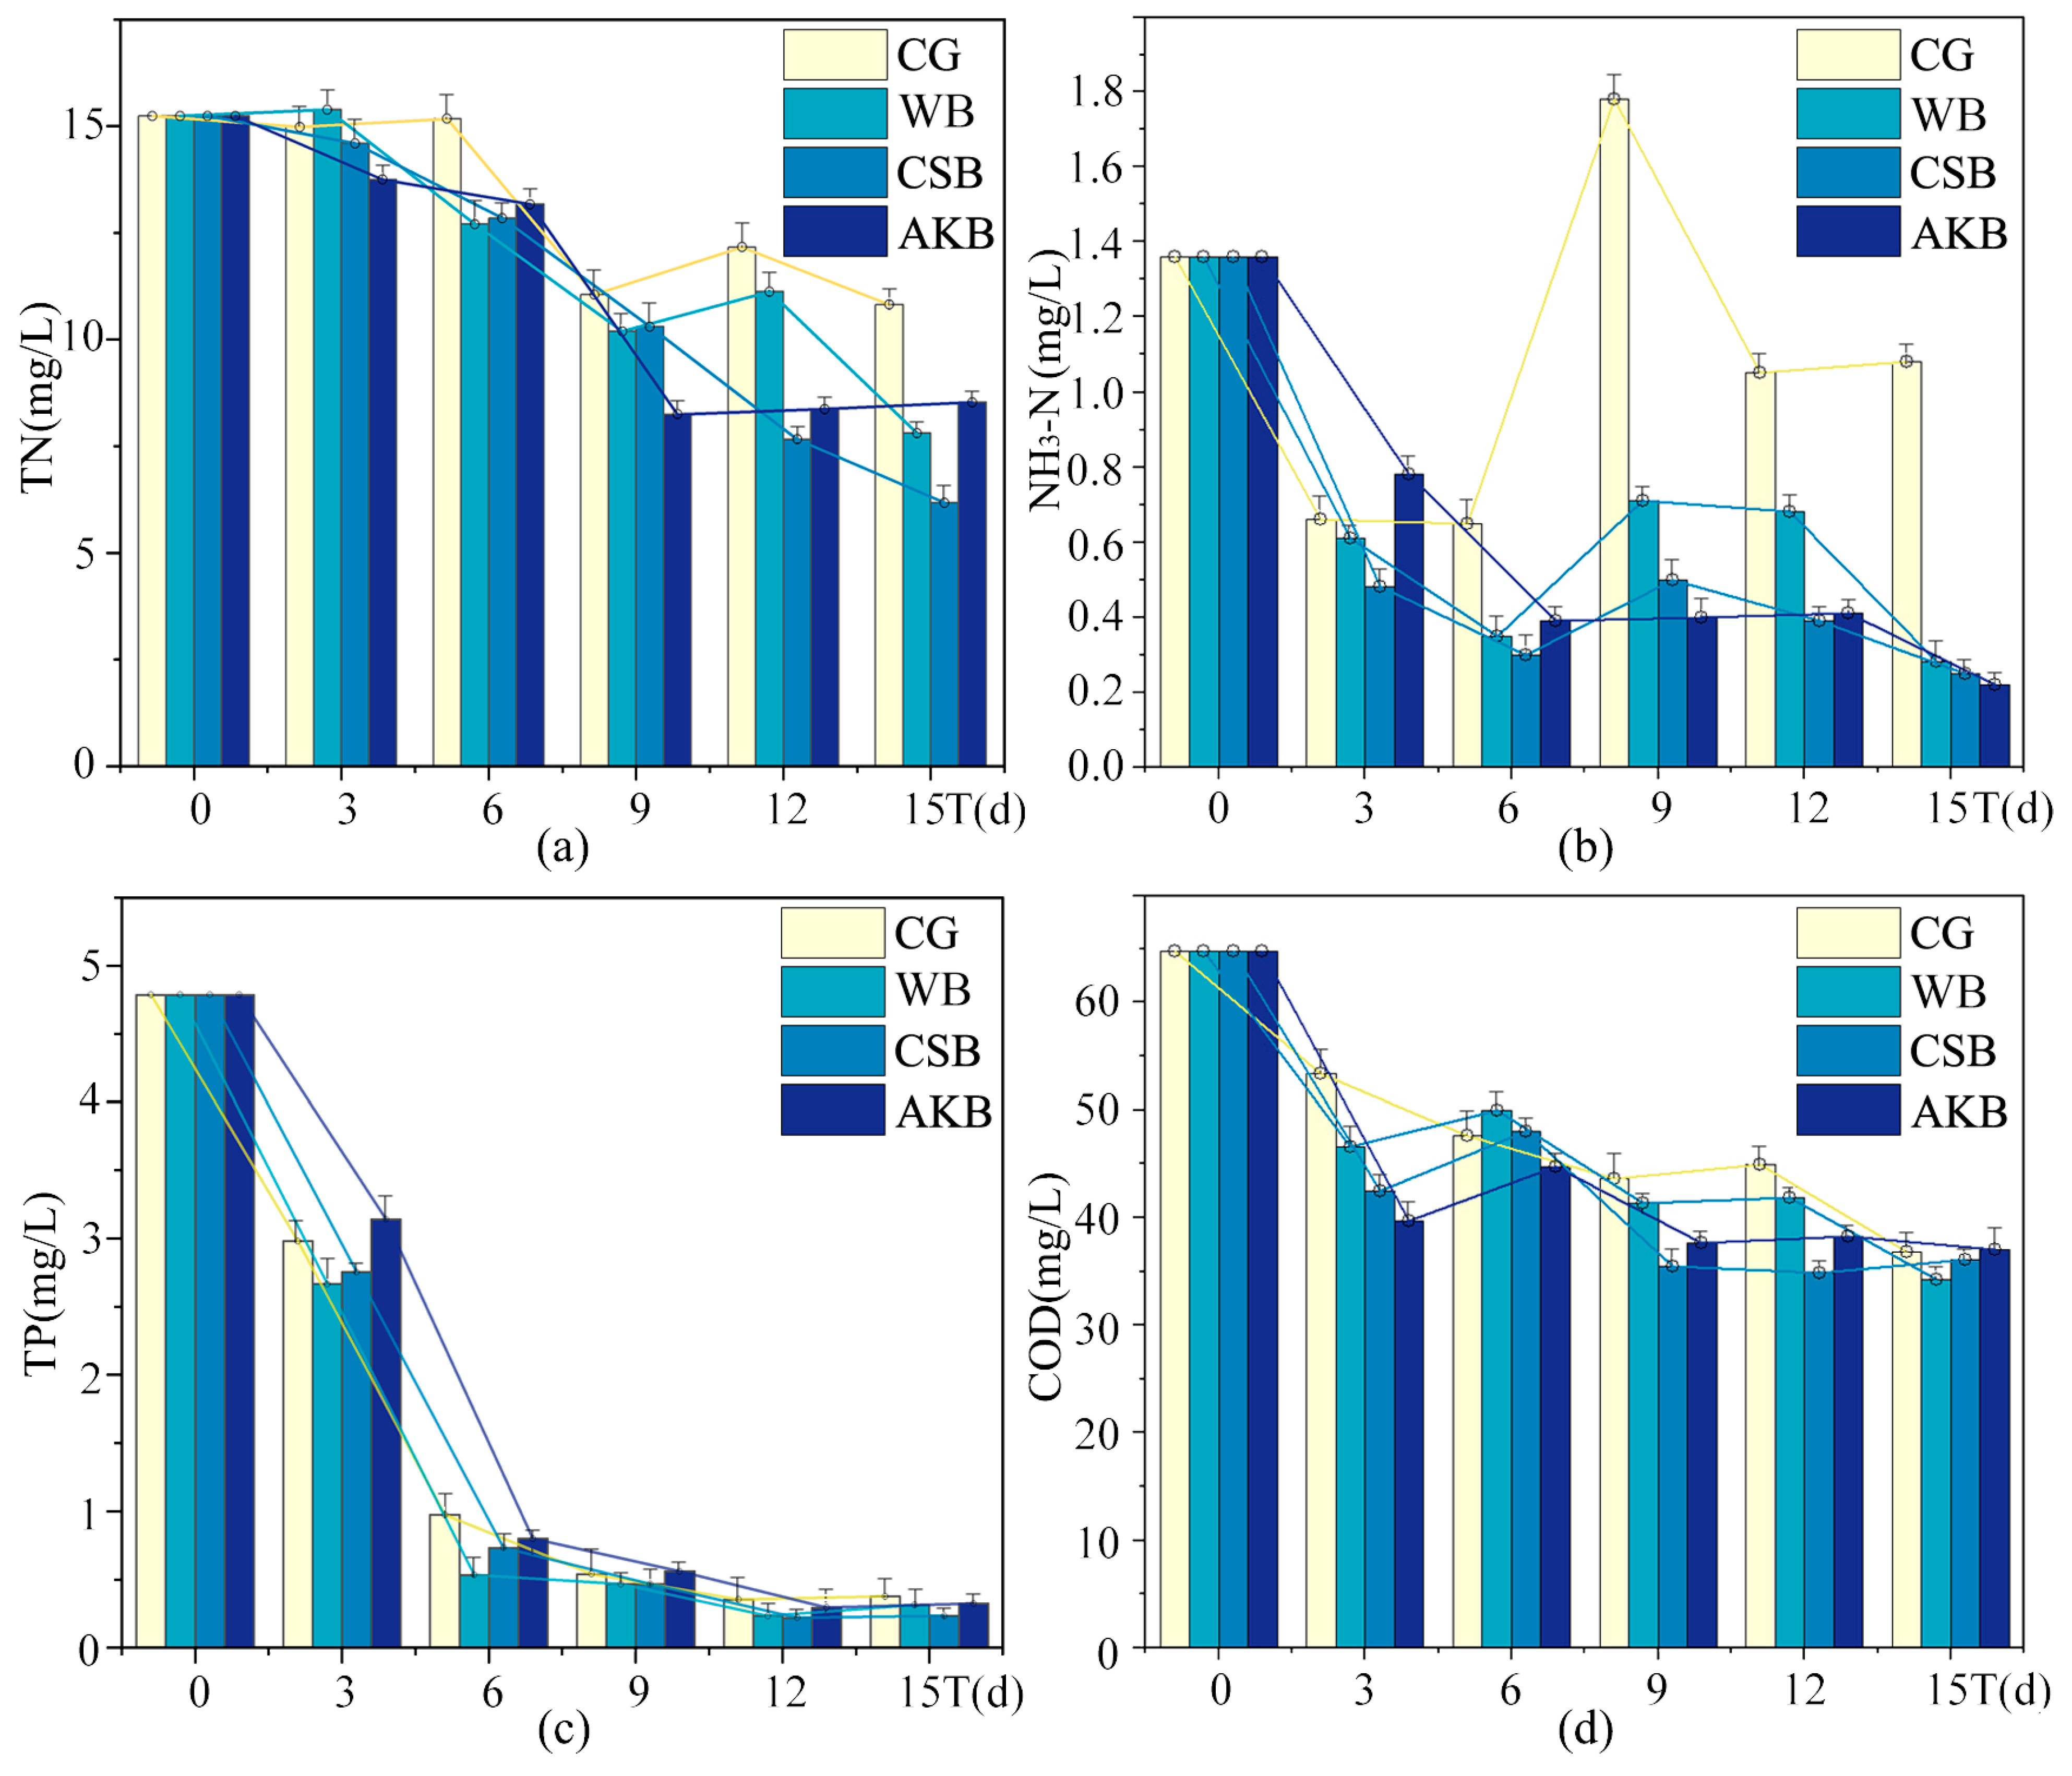
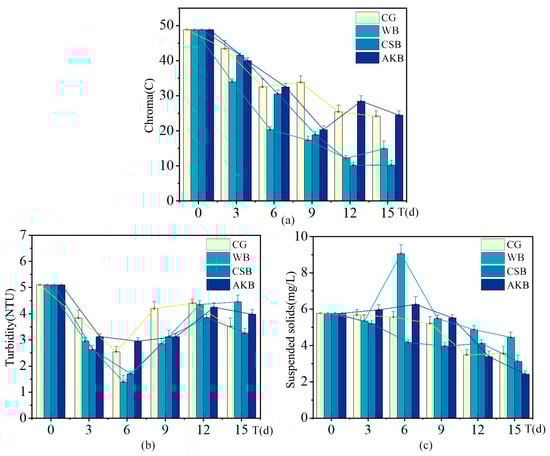
Figure A2.
Changes in visual quality indices of ALWs during the first phase of the experiment: (a) chroma; (b) turbidity; (c) suspended solids.
Figure A2.
Changes in visual quality indices of ALWs during the first phase of the experiment: (a) chroma; (b) turbidity; (c) suspended solids.

Appendix C. Changes in Water Quality Indices for Control and Experimental Groups During the Second Phase of the Experiment
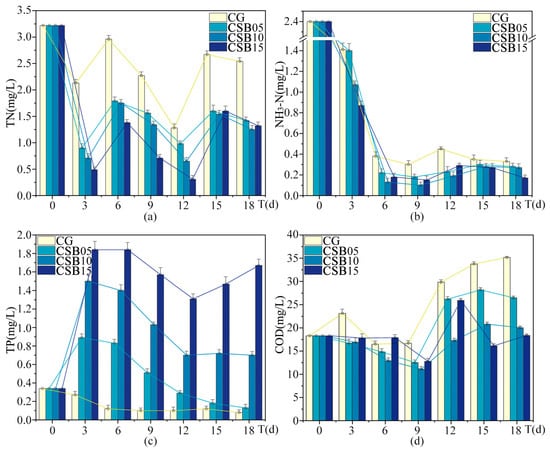
Figure A3.
Changes in eutrophication indices of ALWs during the second phase of the experiment: (a) TN; (b) NH3-N; (c) TP; (d) COD.
Figure A3.
Changes in eutrophication indices of ALWs during the second phase of the experiment: (a) TN; (b) NH3-N; (c) TP; (d) COD.


Figure A4.
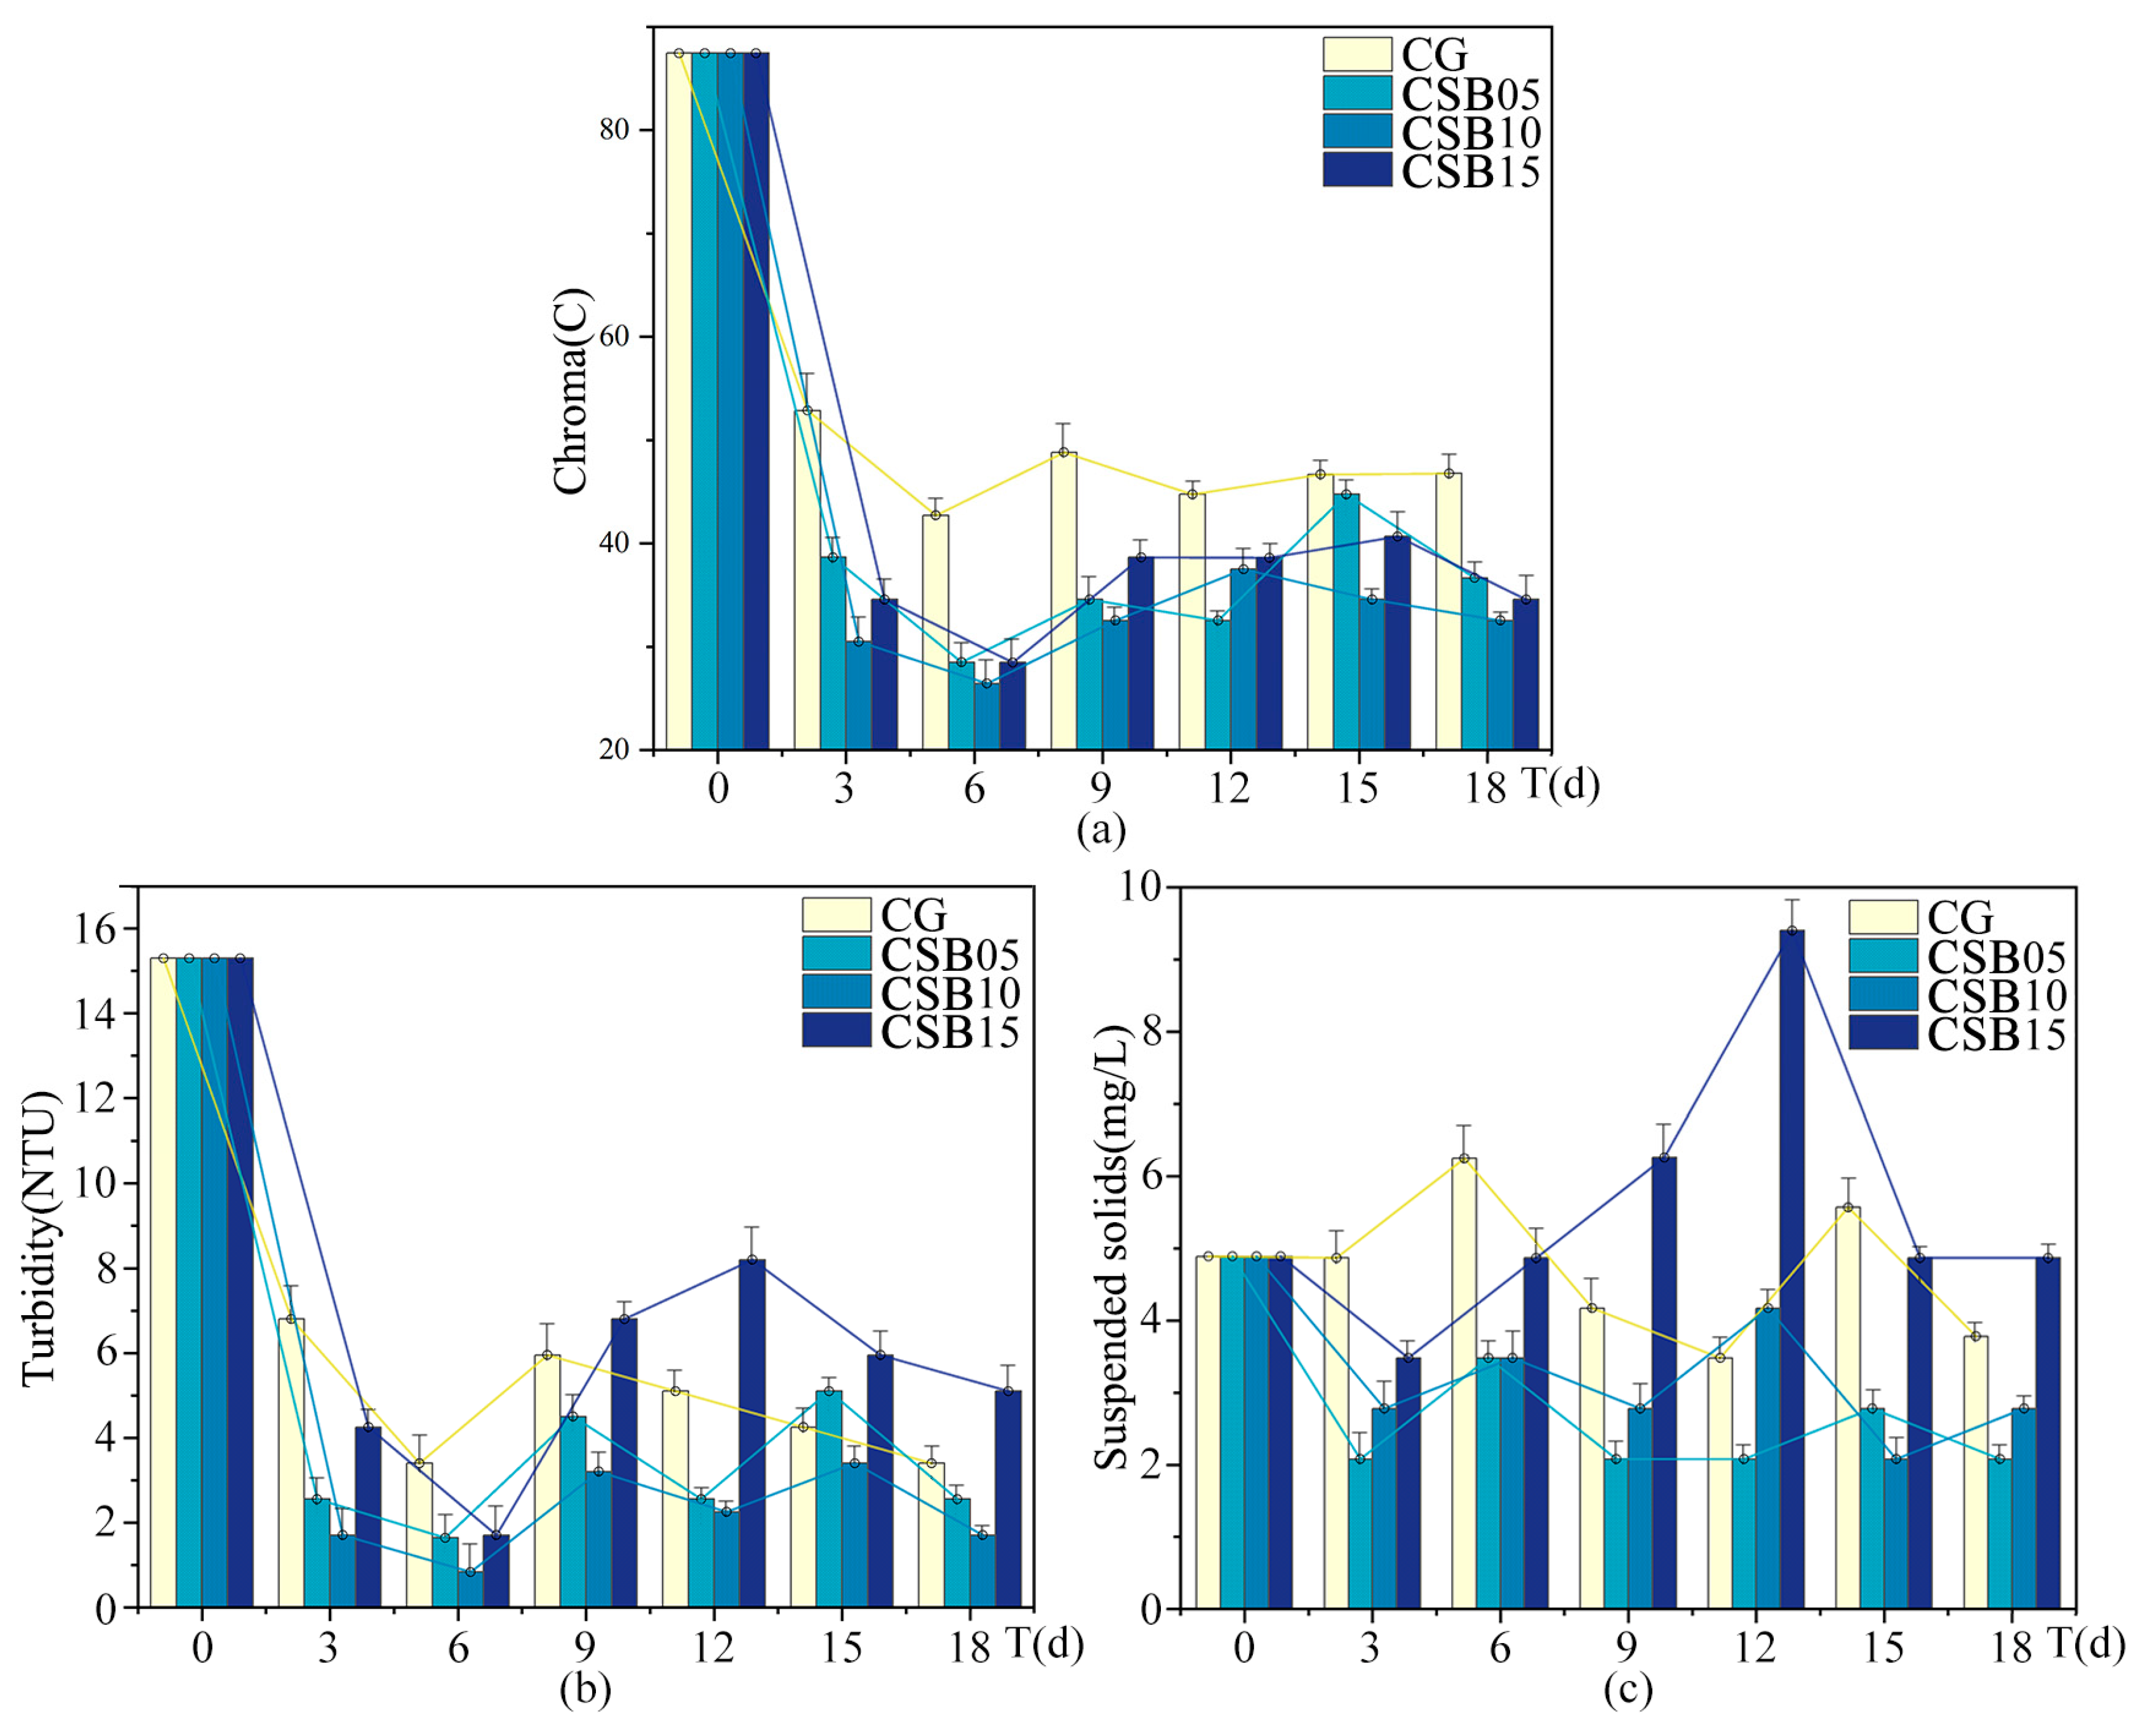
Changes in eutrophication indices of ALWs during the second phase of the experiment: (a) chroma; (b) turbidity; (c) suspended solids.
Figure A4.
Changes in eutrophication indices of ALWs during the second phase of the experiment: (a) chroma; (b) turbidity; (c) suspended solids.
References
- Birch, S.; McCaskie, J. Shallow urban lakes: A challenge for lake management. Hydrobiologia 1999, 395, 365–378. [Google Scholar] [CrossRef]
- Wang, W.; Wang, Y.; Fan, P.; Chen, L.; Chai, B.; Zhao, J.; Sun, L. Effect of calcium peroxide on the water quality and bacterium community of sediment in black-odor water. Environ. Pollut. 2019, 248, 18–27. [Google Scholar] [CrossRef]
- Wang, C.; He, R.; Wu, Y.; Lurling, M.; Cai, H.; Jiang, H.L.; Liu, X. Bioavailable phosphorus (P) reduction is less than mobile P immobilization in lake sediment for eutrophication control by inactivating agents. Water Res. 2017, 109, 196–206. [Google Scholar] [CrossRef] [PubMed]
- Freeman, A.I.; Surridge, B.W.; Matthews, M.; Stewart, M.; Haygarth, P.M. New approaches to enhance pollutant removal in artificially aerated wastewater treatment systems. Sci. Total Environ. 2018, 627, 1182–1194. [Google Scholar] [CrossRef] [PubMed]
- Yamagishi, T.; Horie, Y.; Tatarazako, N. Synergism between macrolide antibiotics and the azole fungicide ketoconazole in growth inhibition testing of the green alga Pseudokirchneriella subcapitata. Chemosphere Environ. Toxicol. Risk Assess. 2017, 174, 1–7. [Google Scholar] [CrossRef] [PubMed]
- Pavlineri, N.; Skoulikidis, N.T.; Tsihrintzis, V.A. Constructed floating wetlands: A review of research, design, operation and management aspects, and data meta-analysis. Chem. Eng. J. 2017, 308, 1120–1132. [Google Scholar] [CrossRef]
- Wu, Q.; Hu, Y.; Li, S.; Peng, S.; Zhao, H. Microbial mechanisms of using enhanced ecological floating beds for eutrophic water improvement. Bioresour. Technol. 2016, 211, 451–456. [Google Scholar] [CrossRef] [PubMed]
- Wang, W.; Wang, Y.; Sun, L.; Zheng, Y.; Zhao, J. Research and application status of ecological floating bed in eutrophic landscape water restoration. Sci. Total Environ. 2020, 704, 135434. [Google Scholar] [CrossRef]
- Qian, K.; Kumar, A.; Zhang, H.; Bellmer, D.; Huhnke, R. Recent advances in utilization of biochar. Renew. Sustain. Energy Rev. 2015, 42, 1055–1064. [Google Scholar] [CrossRef]
- Ahmed, M.B.; Zhou, J.L.; Ngo, H.H.; Guo, W. Insight into biochar properties and its cost analysis. Biomass Bioenergy 2016, 84, 76–86. [Google Scholar] [CrossRef]
- Ahmad, M.; Rajapaksha, A.U.; Lim, J.E.; Zhang, M.; Bolan, N.; Mohan, D.; Vithanage, M.; Lee, S.S.; Ok, Y.S. Biochar as a sorbent for contaminant management in soil and water: A review. Chemosphere 2014, 99, 19–33. [Google Scholar] [CrossRef] [PubMed]
- Mohan, D.; Sarswat, A.; Ok, Y.S.; Pittman, C.U., Jr. Organic and inorganic contaminants removal from water with biochar, a renewable, low cost and sustainable adsorbent—A critical review. Bioresour. Technol. 2014, 160, 191–202. [Google Scholar] [CrossRef]
- Song, X.; Razavi, B.S.; Ludwig, B.; Zamanian, K.; Zang, H.; Kuzyakov, Y.; Dippold, M.A.; Gunina, A. Combined biochar and nitrogen application stimulates enzyme activity and root plasticity. Sci. Total Environ. 2020, 735, 139393. [Google Scholar] [CrossRef]
- Kasak, K.; Truu, J.; Ostonen, I.; Sarjas, J.; Oopkaup, K.; Paiste, P.; Kõiv-Vainik, M.; Mander, Ü.; Truu, M. Biochar enhances plant growth and nutrient removal in horizontal subsurface flow constructed wetlands. Sci. Total Environ. 2018, 639, 67–74. [Google Scholar] [CrossRef]
- Clements, W.H.; Stahl, R.G., Jr.; Landis, R.C. Ecological effects of biochar on the structure and function of stream benthic communities. Environ. Sci. Technol. 2015, 49, 14649–14654. [Google Scholar] [CrossRef]
- Huang, Q.; Song, S.; Chen, Z.; Hu, B.; Chen, J.; Wang, X. Biochar-based materials and their applications in removal of organic contaminants from wastewater: State-of-the-art review. Biochar 2019, 1, 45–73. [Google Scholar] [CrossRef]
- Wang, H.; Xiao, K.; Yang, J.; Yu, Z.; Yu, W.; Xu, Q.; Wu, Q.; Liang, S.; Hu, J.; Hou, H. Phosphorus recovery from the liquid phase of anaerobic digestate using biochar derived from iron− rich sludge: A potential phosphorus fertilizer. Water Res. 2020, 174, 115629. [Google Scholar] [CrossRef] [PubMed]
- Qiu, B.; Duan, F. Synthesis of industrial solid wastes/biochar composites and their use for adsorption of phosphate: From surface properties to sorption mechanism. Colloids Surf. A Physicochem. Eng. Asp. 2019, 571, 86–93. [Google Scholar] [CrossRef]
- Ye, S.; Zeng, G.; Wu, H.; Liang, J.; Zhang, C.; Dai, J.; Xiong, W.; Song, B.; Wu, S.; Yu, J. The effects of activated biochar addition on remediation efficiency of co-composting with contaminated wetland soil. Resour. Conserv. Recycl. 2019, 140, 278–285. [Google Scholar] [CrossRef]
- Tan, X.; Liu, Y.; Gu, Y.; Liu, S.; Zeng, G.; Cai, X.; Hu, X.; Wang, H.; Liu, S.; Jiang, L. Biochar pyrolyzed from MgAl-layered double hydroxides pre-coated ramie biomass (Boehmeria nivea (L.) Gaud.): Characterization and application for crystal violet removal. J. Environ. Manag. 2016, 184, 85–93. [Google Scholar] [CrossRef] [PubMed]
- Li, R.; Wang, J.J.; Zhang, Z.; Awasthi, M.K.; Du, D.; Dang, P.; Huang, Q.; Zhang, Y.; Wang, L. Recovery of phosphate and dissolved organic matter from aqueous solution using a novel CaO-MgO hybrid carbon composite and its feasibility in phosphorus recycling. Sci. Total Environ. 2018, 642, 526–536. [Google Scholar] [CrossRef]
- Huggins, T.M.; Haeger, A.; Biffinger, J.C.; Ren, Z.J. Granular biochar compared with activated carbon for wastewater treatment and resource recovery. Water Res. 2016, 94, 225–232. [Google Scholar] [CrossRef] [PubMed]
- Gwenzi, W.; Chaukura, N.; Noubactep, C.; Mukome, F.N. Biochar-based water treatment systems as a potential low-cost and sustainable technology for clean water provision. J. Environ. Manag. 2017, 197, 732–749. [Google Scholar] [CrossRef] [PubMed]
- Ashoori, N.; Teixido, M.; Spahr, S.; LeFevre, G.H.; Sedlak, D.L.; Luthy, R.G. Evaluation of pilot-scale biochar-amended woodchip bioreactors to remove nitrate, metals, and trace organic contaminants from urban stormwater runoff. Water Res. 2019, 154, 1–11. [Google Scholar] [CrossRef] [PubMed]
- Heo, J.; Yoon, Y.; Lee, G.; Kim, Y.; Han, J.; Park, C.M. Enhanced adsorption of bisphenol A and sulfamethoxazole by a novel magnetic CuZnFe2O4-biochar composite. Bioresour. Technol. 2019, 281, 179–187. [Google Scholar] [CrossRef] [PubMed]
- Choudhary, M.; Kumar, R.; Neogi, S. Activated biochar derived from Opuntia ficus-indica for the efficient adsorption of malachite green dye, Cu+2 and Ni+2 from water. J. Hazard. Mater. 2020, 392, 122441. [Google Scholar] [CrossRef]
- Yang, Y.; Lin, X.; Wei, B.; Zhao, Y.; Wang, J. Evaluation of adsorption potential of bamboo biochar for metal-complex dye: Equilibrium, kinetics and artificial neural network modeling. Int. J. Environ. Sci. Technol. 2014, 11, 1093–1100. [Google Scholar] [CrossRef]
- Tao, Y.; Hu, S.; Han, S.; Shi, H.; Yang, Y.; Li, H.; Jiao, Y.; Zhang, Q.; Akindolie, M.S.; Ji, M. Efficient removal of atrazine by iron-modified biochar loaded Acinetobacter lwoffii DNS32. Sci. Total Environ. 2019, 682, 59–69. [Google Scholar] [CrossRef]
- He, M.; Xu, Z.; Hou, D.; Gao, B.; Cao, X.; Ok, Y.S.; Rinklebe, J.; Bolan, N.S.; Tsang, D.C.W. Waste-derived biochar for water pollution control and sustainable development. Nat. Rev. Earth Environ. 2022, 3, 444–460. [Google Scholar] [CrossRef]
- Zhou, Z.; Jiao, R.; Dong, L. The influence of perceived control on outdoor thermal comfort: A case study in a hot summer and warm winter climate. Build. Environ. 2023, 245, 110872. [Google Scholar] [CrossRef]
- Zhou, Z.; Dong, L. Experimental investigation of the effect of surgical masks on outdoor thermal comfort in Xiamen, China. Build. Environ. 2023, 229, 109893. [Google Scholar] [CrossRef]
- GB3838–2002; Sepa Environmental Quality Standard for Surface Water (EQSSW). Inspection and Quarantine of PR China: Beijing, China, 2002. (In Chinese)
- GB/T18921-2019; The Reuse of Urban Recycling Water-Water Quality Standard for Scenic Environment Use. Standardization Administration of the People’s Republic of China: Beijing, China, 2019.
- Li, T.; Kirk, D.W.; Jia, C.Q. Monolithic wood biochar as functional material for sustainability. Can. J. Chem. Eng. 2021, 99, 640–656. [Google Scholar] [CrossRef]
- Joseph, S.D.; Downie, A.; Munroe, P.; Crosky, A.; Lehmann, J. Biochar for Carbon Sequestration, Reduction of Greenhouse Gas Emissions and Enhancement of Soil Fertility; A Review of the Materials Science; University of Sydney: Sydney, Australia, 2007; pp. 130–133. [Google Scholar]
- Putrino, F.M.; Tedesco, M.; Bodini, R.B.; de Oliveira, A.L. Study of supercritical carbon dioxide pretreatment processes on green coconut fiber to enhance enzymatic hydrolysis of cellulose. Bioresour. Technol. 2020, 309, 123387. [Google Scholar] [CrossRef] [PubMed]
- Weng, X.; Chen, Z.; Chen, Z.; Megharaj, M.; Naidu, R. Clay supported bimetallic Fe/Ni nanoparticles used for reductive degradation of amoxicillin in aqueous solution: Characterization and kinetics. Colloids Surf. A Physicochem. Eng. Asp. 2014, 443, 404–409. [Google Scholar] [CrossRef]
- Fiorilli, S.; Rivoira, L.; Calì, G.; Appendini, M.; Bruzzoniti, M.C.; Coïsson, M.; Onida, B. Iron oxide inside SBA-15 modified with amino groups as reusable adsorbent for highly efficient removal of glyphosate from water. Appl. Surf. Sci. 2017, 411, 457–465. [Google Scholar] [CrossRef]
- Qiu, Y.; Ling, F. Role of surface functionality in the adsorption of anionic dyes on modified polymeric sorbents. Chemosphere 2006, 64, 963–971. [Google Scholar] [CrossRef]
- Özçimen, D.; Ersoy-Meriçboyu, A. Characterization of biochar and bio-oil samples obtained from carbonization of various biomass materials. Renew. Energ. 2010, 35, 1319–1324. [Google Scholar] [CrossRef]
- Reza, M.T.; Lynam, J.G.; Uddin, M.H.; Coronella, C.J. Hydrothermal carbonization: Fate of inorganics. Biomass Bioenergy 2013, 49, 86–94. [Google Scholar] [CrossRef]
- Yağmur, H.K.; Kaya, I. Synthesis and characterization of magnetic ZnCl2-activated carbon produced from coconut shell for the adsorption of methylene blue. J. Mol. Struct. 2021, 1232, 130071. [Google Scholar] [CrossRef]
- Castilla-Caballero, D.; Barraza-Burgos, J.; Gunasekaran, S.; Roa-Espinosa, A.; Colina-Márquez, J.; Machuca-Martínez, F.; Hernández-Ramírez, A.; Vázquez-Rodríguez, S. Experimental data on the production and characterization of biochars derived from coconut-shell wastes obtained from the Colombian Pacific Coast at low temperature pyrolysis. Data Brief 2020, 28, 104855. [Google Scholar] [CrossRef] [PubMed]
- Hale, S.E.; Ailing, V.; Martinsen, V.; Mulder, J.; Breedveld, G.D.; Cornelissen, G. The sorption and desorption of phosphate-P, ammonium-N and nitrate-N in cacao shell and corn cob biochars. Chemosphere 2013, 91, 1612–1619. [Google Scholar] [CrossRef]
- Li, W.; Zhou, J.; Ding, H.; Fu, H.; Liu, J.; Chen, Y.; Dai, T.; Lou, Q.; Zhong, X.; Fan, H. Low-dose biochar added to sediment improves water quality and promotes the growth of submerged macrophytes. Sci. Total Environ. 2020, 742, 140602. [Google Scholar] [CrossRef]
- Cui, X.; Hao, H.; He, Z.; Stoffella, P.J.; Yang, X. Pyrolysis of wetland biomass waste: Potential for carbon sequestration and water remediation. J. Environ. Manag. 2016, 173, 95–104. [Google Scholar] [CrossRef]
- Zhong, Z.; Yu, G.; Mo, W.; Zhang, C.; Huang, H.; Li, S.; Gao, M.; Lu, X.; Zhang, B.; Zhu, H. Enhanced phosphate sequestration by Fe(iii) modified biochar derived from coconut shell. RSC Adv. 2019, 9, 10425–10436. [Google Scholar] [CrossRef] [PubMed]
- Prakasha, H.C.; Gayathri, B.; Reddy, K.M.; Desai, N.; Mamatha, B.; Rohitha, D.S. Effect of coconut shell biochar on physical, chemical properties and available major nutrient status of acidic soil. Int. J. Plant Soil Sci. 2022, 34, 1147–1153. [Google Scholar]
- Alsawy, T.; Rashad, E.; El-Qelish, M.; Mohammed, R.H. A comprehensive review on the chemical regeneration of biochar adsorbent for sustainable wastewater treatment. npj Clean. Water 2022, 5, 29. [Google Scholar] [CrossRef]
- Baaloudj, O.; Chiron, S.; Zizzamia, A.R.; Trotta, V.; Del Buono, D.; Puglia, D.; Rallini, M.; Brienza, M. Efficient biochar regeneration for a circular economy: Removing emerging contaminants for sustainable water treatment. Colloids Surf. A Physicochem. Eng. Asp. 2025, 705, 135730. [Google Scholar] [CrossRef]
Disclaimer/Publisher’s Note: The statements, opinions and data contained in all publications are solely those of the individual author(s) and contributor(s) and not of MDPI and/or the editor(s). MDPI and/or the editor(s) disclaim responsibility for any injury to people or property resulting from any ideas, methods, instructions or products referred to in the content. |
© 2025 by the authors. Licensee MDPI, Basel, Switzerland. This article is an open access article distributed under the terms and conditions of the Creative Commons Attribution (CC BY) license (https://creativecommons.org/licenses/by/4.0/).