Article

Driving Factors and Variability of Cyanobacterial Blooms in Qionghai Lake, Yunnan–Guizhou Plateau, China

1
Key Laboratory of Plateau Wetland Ecology and Environmental Protection of Sichuan Province, Xichang University, Xichang 615013, China
2
National Engineering Laboratory for Lake Pollution Control and Ecological Restoration, Chinese Research Academy of Environmental Sciences, Beijing 100012, China
*
Authors to whom correspondence should be addressed.
Water 2025, 17(2), 169; https://doi.org/10.3390/w17020169
Submission received: 30 November 2024 / Revised: 1 January 2025 / Accepted: 8 January 2025 / Published: 10 January 2025

Abstract

:
Qionghai Lake is an important freshwater source in the Yunnan–Guizhou Plateau. However, cyanobacterial blooms have been observed recently in Qionghai Lake, but their formation mechanism and control management are not well understood. Herein, phytoplankton, zooplankton, eutrophication, nutrients, and biochemical indices were measured in Qionghai Lake from May 2022 to April 2023. The results showed that cyanobacterial blooms in Qionghai Lake predominated in Anabaena sp. with a density of 1.11 × 10⁷–18.87 × 10⁷ cells/L. Anabaena blooms started in the northwestern area of Qionghai Lake in November 2022 and then expanded to the entire lake until it peaked and subsided in February 2023. Protozoa dominated in zooplankton while having no significant relationship with Anabaena blooms in Qionghai Lake. The trophic level index and chlorophyll a showed similar spatiotemporal trends with Anabaena sp. density, and water quality in the northwest of the Qionghai Lake was worse than in other parts. Total nitrogen (TN) and total phosphorus (TP) were 0.41–0.54 and 0.021–0.045 mg/L from November 2022 to February 2023. TN and TP were positively correlated with Anabaena sp. density, but TP was the most significant environmental factor affecting Anabaena bloom in Qionghai Lake. These findings might provide essential information for improving bloom control and water quality remediation in Qionghai Lake.

1. Introduction

Algal blooms are widely distributed in inland waters, posing grave threats to aquatic ecosystem health and water security worldwide [1]. A study investigated the freshwater lakes that accounted for 57.1% of the global lake area from 1982 to 2019 and found that algal blooms have appeared in 21,878 lakes (8.8%) spread across six continents all have and the bloom frequency is increasing [2]. There are 2693 lakes in China, and one-third of them are freshwater lakes that are suffering from water quality decline. Studies have shown that eutrophication and algal blooms, with cyanobacterial blooms being the dominant type, have occurred in the lakes in the middle and lower reaches of the Yangtze River and Yunnan–Guizhou Plateau lakes [3,4]. Cyanobacteria, as crucial primary producers in aquatic ecosystems, exhibit extensive adaptations to temperature and light and possess diverse nutrient absorption strategies, promoting their proliferation and distribution [5]. However, cyanobacteria typically dominate harmful algal blooms and generate toxins like cylindrospermopsin and saxitoxin, endangering both aquatic life and human well-being [2,6].
Yunnan–Guizhou Plateau lakes are an important inland water resource, but they are encountering a series of serious water environment problems. Ran et al. [7] investigated 11 lakes on the Yunnan–Guizhou Plateau during 2005–2020 and pointed out that nutrient pollution and land degradation were driving factors of eutrophication in Dianchi, Qilu, Xingyun, and Yilong lakes. Wang et al. [8] found that the annual average of total nitrogen (TN) and total phosphorus (TP) was higher than 1.5 and 0.15 mg/L, which aggravated cyanobacterial blooms in Dianchi Lake during 1990–2015. Severe Microcystis blooms occurred in Erhai Lake from 2013 to 2015, and nutrients together with high temperature were the main factors causing these blooms [9]. In addition, eutrophication and cyanobacterial blooms of relatively lightly polluted lakes such as Yangzonghai, Chenghai, and Qionghai Lake are experiencing increasingly severe due to increased pollution loads [7].
Qionghai Lake is a typical Yunnan–Guizhou Plateau freshwater lake, with an area of more than 25 km2, and it plays an important role as an ecological barrier and water conservation area in the upper reaches of the Yangtze River. Water quality in Qionghai Lake was ecologically sound before 1991, but after that, this lake suffered from environmental problems, such as sedimentation, eutrophication, and a diminishing water surface [10]. The Qionghai Basin is dominated by sandstone and located in the earthquake zone prone to mountain torrents; soil erosion has led to sediment being input into the Qionghai Lake at a rate of 17.09 mm/a [11,12]. A study of ecological environment health assessment found that zooplankton Simpson diversity index, chlorophyll a, and TN were the main influencing factors of ecosystem health in Qionghai Lake from 2017 to 2020 [13]. Nutrient pollution was the main pollution factor in Qionghai Lake; TN and TP were 0.39–0.51 and 0.019–0.027 mg/L during 2011–2020, respectively [14]. Among Yunnan–Guizhou Plateau lakes, algal blooms in the moderately eutrophic Qionghai Lake were less severe than those in Dianchi and Qilu Lakes but posed a higher risk compared to Fuxian Lake [3,7]. The annual maximum bloom area of algal blooms in Qionghai Lake has been stable recently, while the duration is lengthening [3]. Therefore, exploring the bloom mechanism for environmental management is needed, though relevant studies are absent.
In this study, phytoplankton, zooplankton, eutrophication, nutrients, and biochemical indices were measured in Qionghai Lake from May 2022 to April 2023. The present study aimed to (1) investigate the composition and spatiotemporal variation of phytoplankton and bloom-forming algae species in Qionghai Lake, (2) illustrate the effects of zooplankton composition and changes on phytoplankton, and (3) probe the spatiotemporal variation in biochemical indices and identify the key driving factors of bloom occurrence. The results of this study could help provide important information for the formation mechanism and control management of blooms in Qionghai Lake.

2. Materials and Methods

2.1. Study Area

Qionghai Lake is located in Xichang City and is the second largest lake in Sichuan Province, China. The lake is characterized by a maximum and mean water depth of 34 and 14 m, an area of 31 km2, a residence time of 834 days, and a water storage capacity of 2.93 × 10⁸ m3 [15]. The main inflowing rivers of Qionghai Lake include the Gangou River, Guanba River, and Ezhang River, while the outlet river is the Haihe River. The regional geomorphology of the Qionghai basin is dominated by mountains and hills, with large vertical differences. A subtropical monsoonal climate predominates in the Qionghai basin, featuring an average humidity of 61.4% and an annual average temperature of 17.2 °C.

2.2. Sampling Methods

A total of eleven sampling sites (S1–S11) were investigated in the Qionghai Lake (Figure 1) from May 2022 to April 2023. Samples were collected once a month, and the number of samples at each sampling site was at least two. Qualitative phytoplankton samples and zooplankton samples were collected with plankton nets (64 μm mesh size) and preserved with 5% Lugol’s iodine solution and 4% formaldehyde solution. A 1 L water sample was stained with 5% Lugol’s iodine solution in the field, concentrated to 50 mL after 96 h precipitation in the lab, and then counted phytoplankton and small zooplankton (Protozoa and Rotifera). A 20 L water sample was collected and filtered through plankton nets into 100 mL portions; then 4% formaldehyde solution was added for preserving and counting large zooplankton (Copepoda and Cladocera). In addition, water samples were collected monthly in 500 mL plastic bottles and transported to the lab for biochemical parameters determination.

2.3. Analytical Methods and Data Source

Based on previous studies [16,17,18,19], phytoplankton and zooplankton were counted and identified using an CX41 microscope (Olympus, Tokyo, Japan). Chlorophyll a (Chl-a) was extracted with 90% acetone [20] and measured by using a UV-1900i spectrophotometer (Shimadzu, Kyoto, Japan). Potassium permanganate index (CODMn), ammonia nitrogen content index (NH3–N), TN, and TP were determined according to MEP [21]. The dissolved oxygen (DO), water temperature (WT), and pH values were measured using a portable multimeter (Hach HQ40D, Loveland, CO, USA). Transparency was measured by the Secchi disc (SD) method [22]. Trophic level index (TLI) was derived from TN, TP, CODMn, SD, and Chl-a [23]. Shannon–Wiener (H), Pielou (J), Margalef (D), and dominance (Y) indices were calculated according to [24,25]. Meteorological data were obtained from the Qionghai Administrative Bureau of Xichang City, including average wind speed, maximum wind speed, wind direction, and average temperature. Based on these data, the monthly average temperature, average wind speed, maximum wind speed, and frequency of dominant wind direction over the past 30 years were analyzed. The hydrodynamic flow distribution characteristics of Qionghai Lake under different meteorological conditions were simulated by using the environmental fluid dynamics code (EFDC) model [26].

2.4. Statistical Analysis

Data were analyzed using SPSS software v22.0 (IBM, Armonk, NY, USA). Statistically significant differences among data were determined by using Duncan’s multiple range test, with those at p < 0.05 considered significant and indicated by different lowercase letters. Diagrams were constructed using the Origin software v2019b (OriginLab Corporation, Northampton, MA, USA) and R software v4.3.3 (www.r-project.org). Redundancy analysis (RDA) was widely utilized in environmental and ecological research [27] and was employed in this study to examine the relationship between biochemical indicators and plankton. RDA analysis was conducted using Canoco v5.0 (Microcomputer Power, Ithaca, NY, USA) and ‘vegan’ packages in R software. Based on Bray–Curtis distance matrix, non-metric multidimensional scaling (NMDS) analysis was performed using the “vegan” package in R software. Network correlation analysis between biochemical indices and plankton was performed using the ‘Hmisc’ and ‘igraph’ packages in R software. The spatial distribution of biochemical indices was estimated using the inverse distance weighting method in ArcMap v10.5 [14].

3. Results and Discussion

3.1. Changes in Phytoplankton

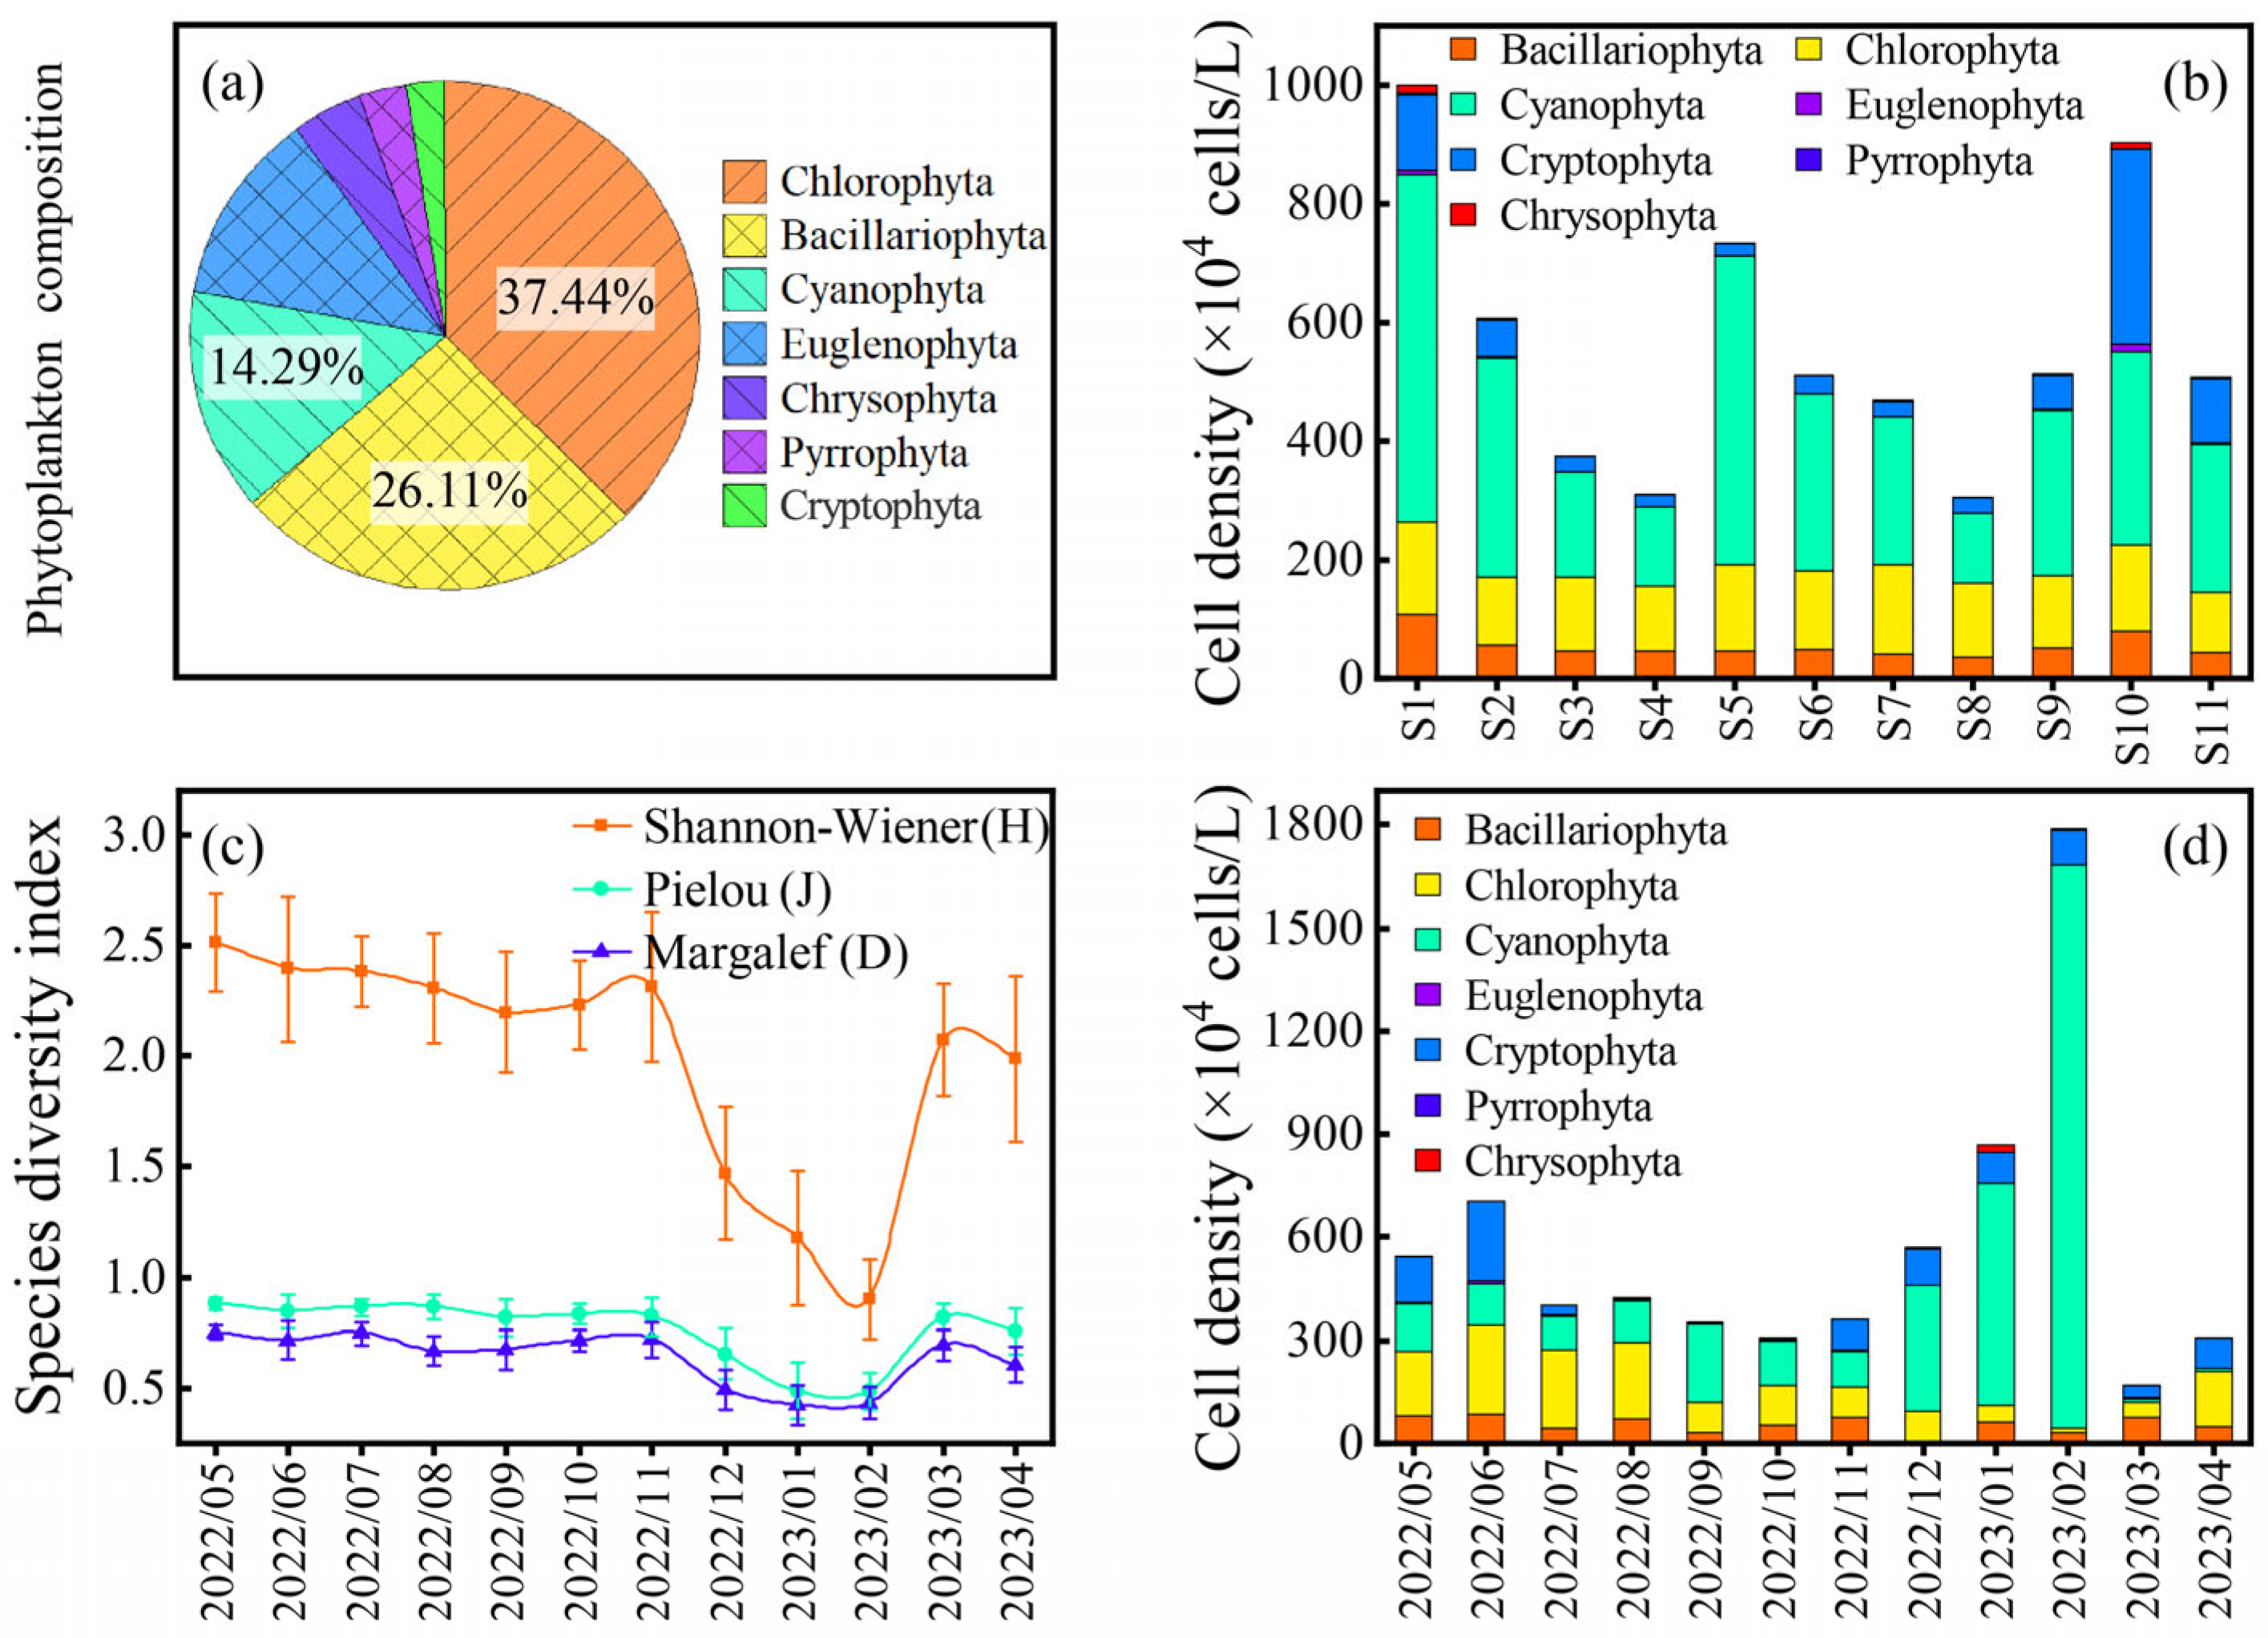
There were 203 species of phytoplankton in Qionghai Lake during 2022–2023, among which the Chlorophyta, Bacillariophyta, Cyanophyta, and Euglenophyta accounted for 37.44%, 26.11%, 14.29%, and 12.32% (Figure 2a), respectively. Temporally, the cell density of Qionghai Lake reached a peak value of 1.79 × 10⁷ cells/L in February 2023 and had an increasing trend from November 2022 to February 2023 (Figure 2d). NMDS analysis demonstrated that the phytoplankton community in Qionghai Lake during winter was dominated by Cyanophyta, which presented a notable disparity compared to those in other seasons (Figure S1). And Cyanophyta dominated during December 2022–February 2023, with cell density increasing from 3.66 × 10⁶ to 1.64 × 10⁷ cells/L, indicating that a Cyanophyta bloom occurred during this period. Similarly, the H, J, and D indices variation of phytoplankton might also demonstrate the dominance of Cyanophyta. Because the H, J, and D indices from November 2022 to February 2023 decreased sharply and were lower than values of other months (Figure 2c), implying a decrease in biodiversity in the ecosystem [24]. Spatially, phytoplankton had high density at S1 and S10 with 9.98 × 10⁶ and 9.04 × 10⁶ cells/L (Figure 2b), suggesting that the pollution in the northwest of Qionghai Lake might be serious.
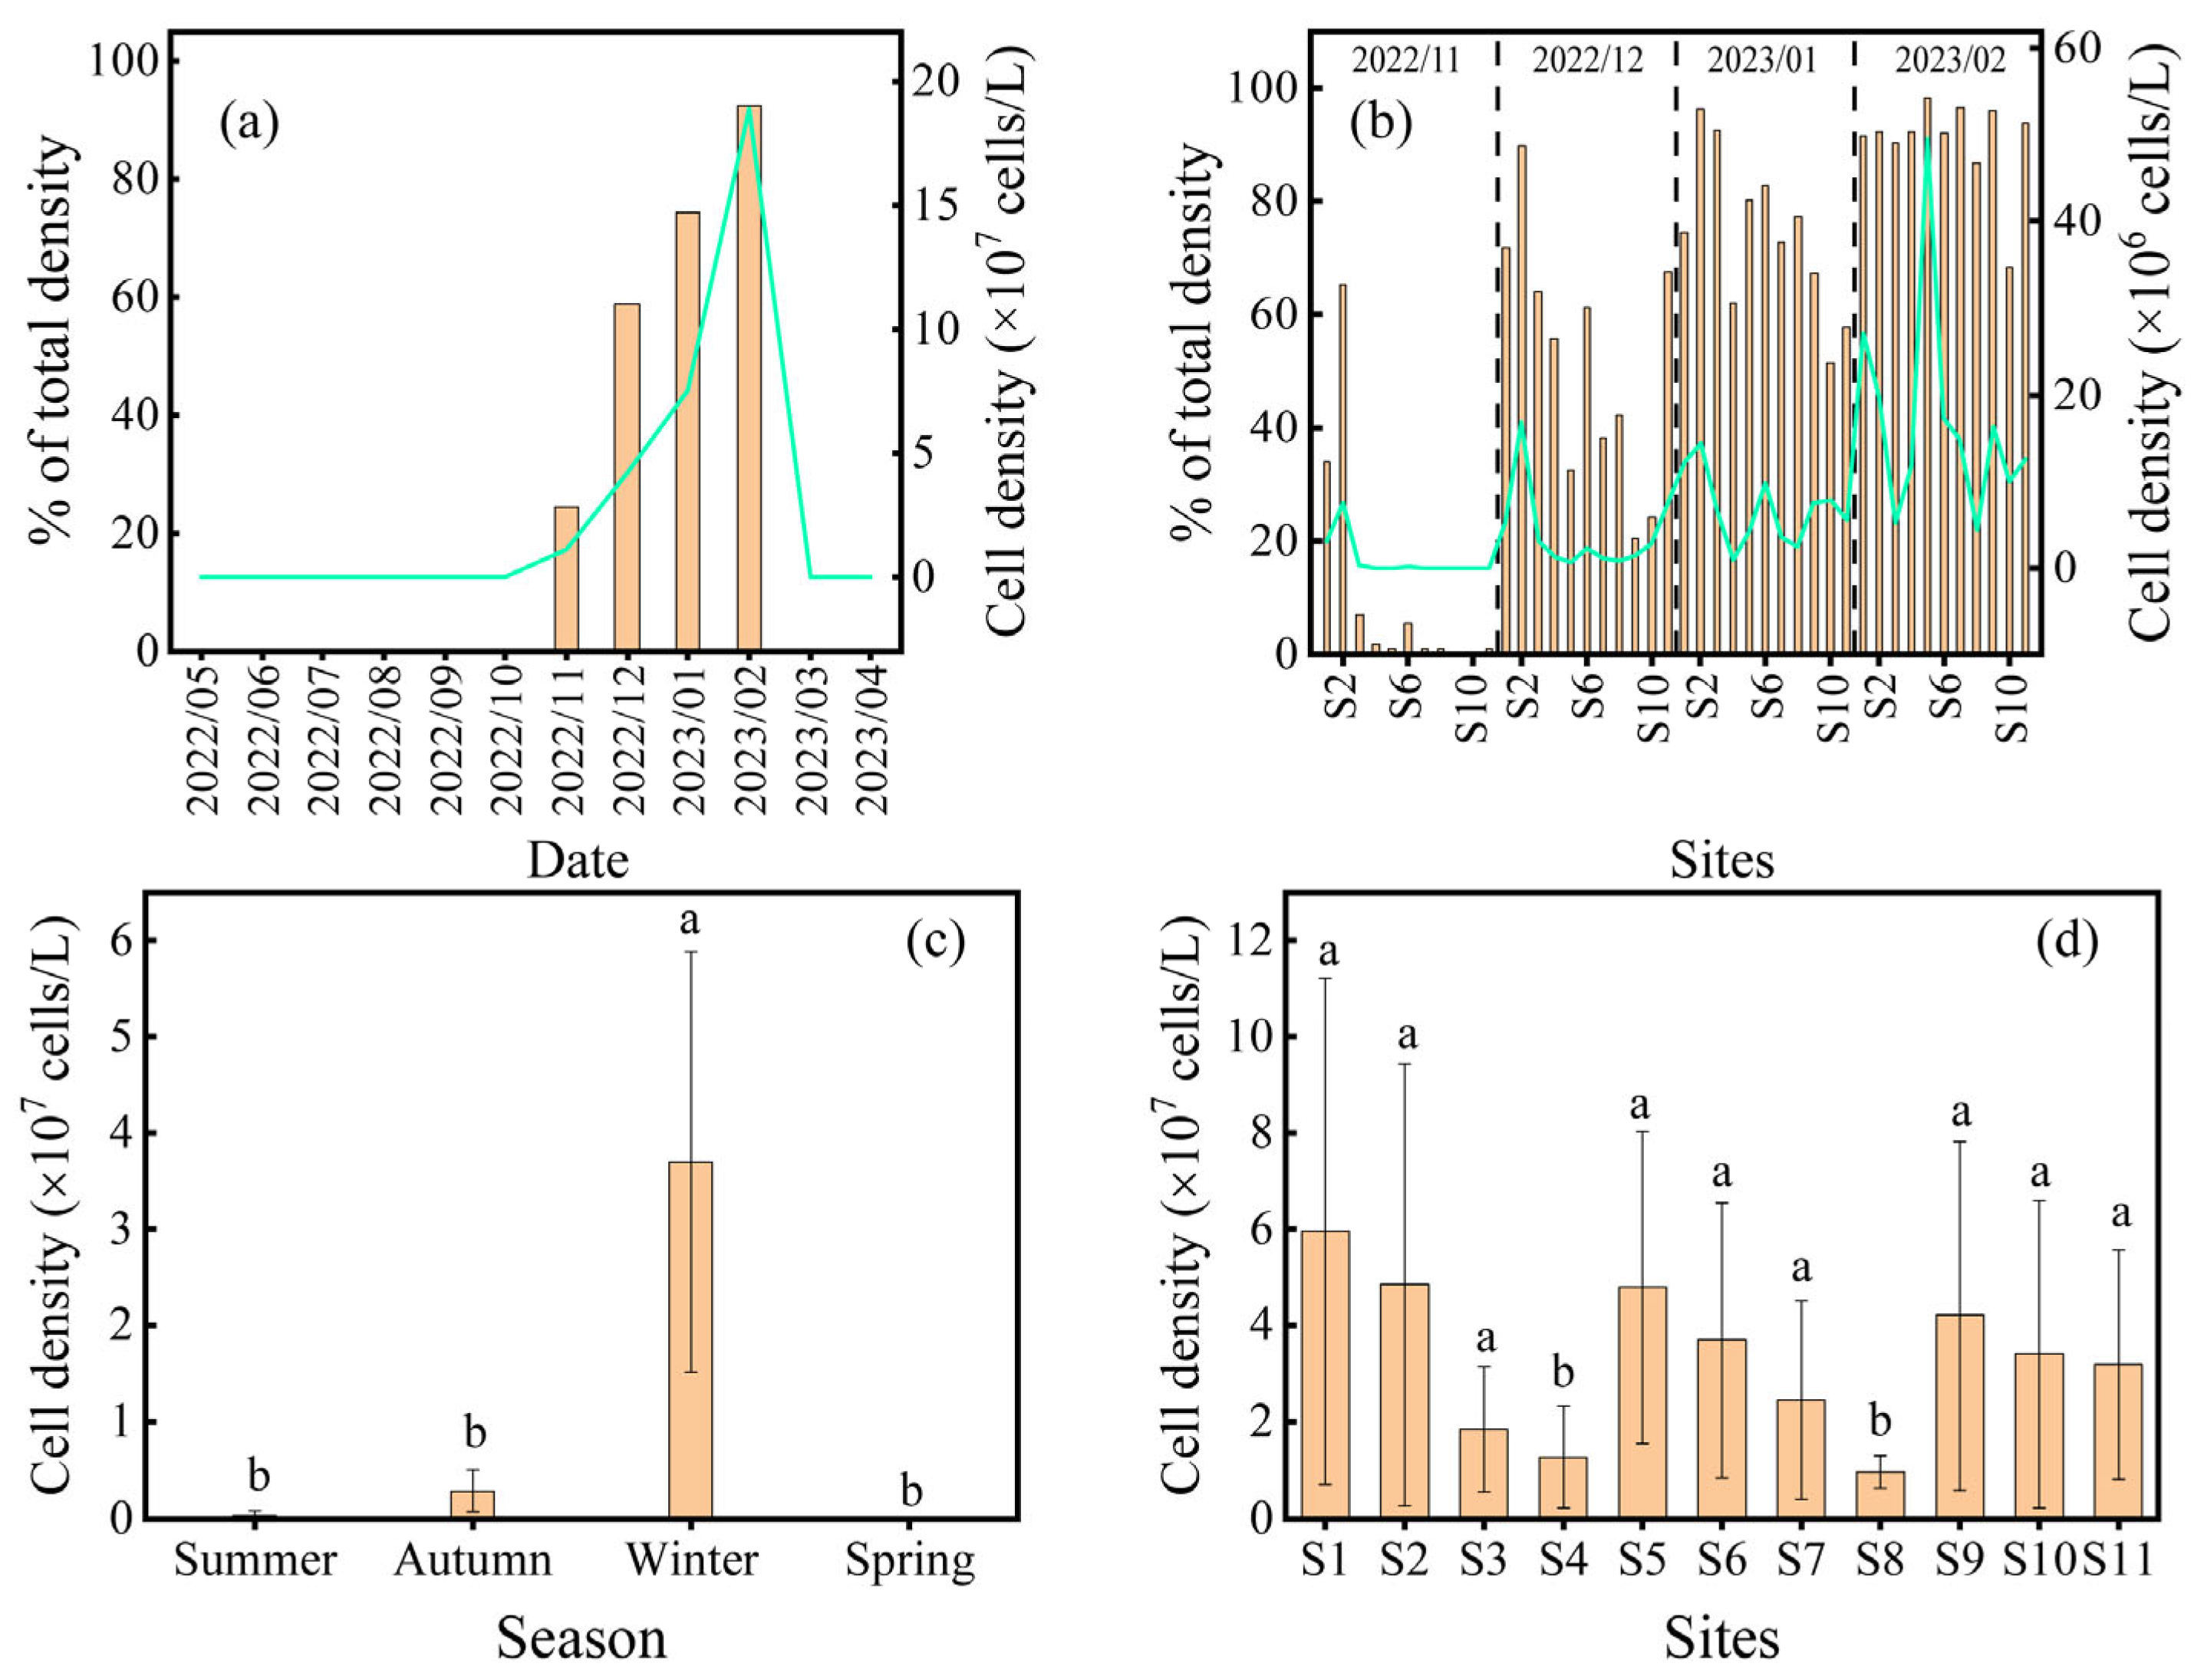
The cyanobacterial blooms in many lakes of China are usually dominated by Microcystis and occur in summer [2]. While the outbreak of Anabaena bloom was found in Dianchi Lake in the autumn and winter during 2017–2019 [28]. Similarly, cyanobacterial blooms in Qionghai Lake broke out from November 2022 to February 2023 and predominated in Anabaena sp. (Figure 3 and Tables S1 and S2). In temporal, the cell density of Anabaena sp. increased from 1.11 × 10⁷ cells/L in November 2022 to 18.87 × 10⁷ cells/L in February 2023, and the proportion of this species increased from 24.54% to 92.45% (Figure 3a). In addition, the cell density of Anabaena sp. exhibited a notably higher level in winter than in other seasons (Figure 3c). Moreover, the dominance of Anabaena sp. was in the range of 0.097 × 10⁷–0.317 × 10⁷ cells/L from December 2022 to February 2023 (Table S1). The cell density of Anabaena sp. in November 2022 had a high value at S1 and S2 sites, accounting for 34.02–65.13% of the total density (Figure 3b,d); in December 2022, it increased at all sites with values ranging from 0.57 × 10⁷ to 16.82 × 10⁷ cells/L. While Anabaena sp. in January–February 2023 has become the dominant species at all sites, its cell density ranged from 0.97 × 10⁷ to 49.55 × 10⁷ cells/L, accounting for 51.58–98.22% of the total density. These results suggested that the Anabaena bloom of Qionghai Lake might have originated from the northwestern area of this lake in November 2022, then expanded to the entire lake until it peaked and subsided in February 2023.

3.2. Effects of Zooplankton on Cyanobacterial Bloom

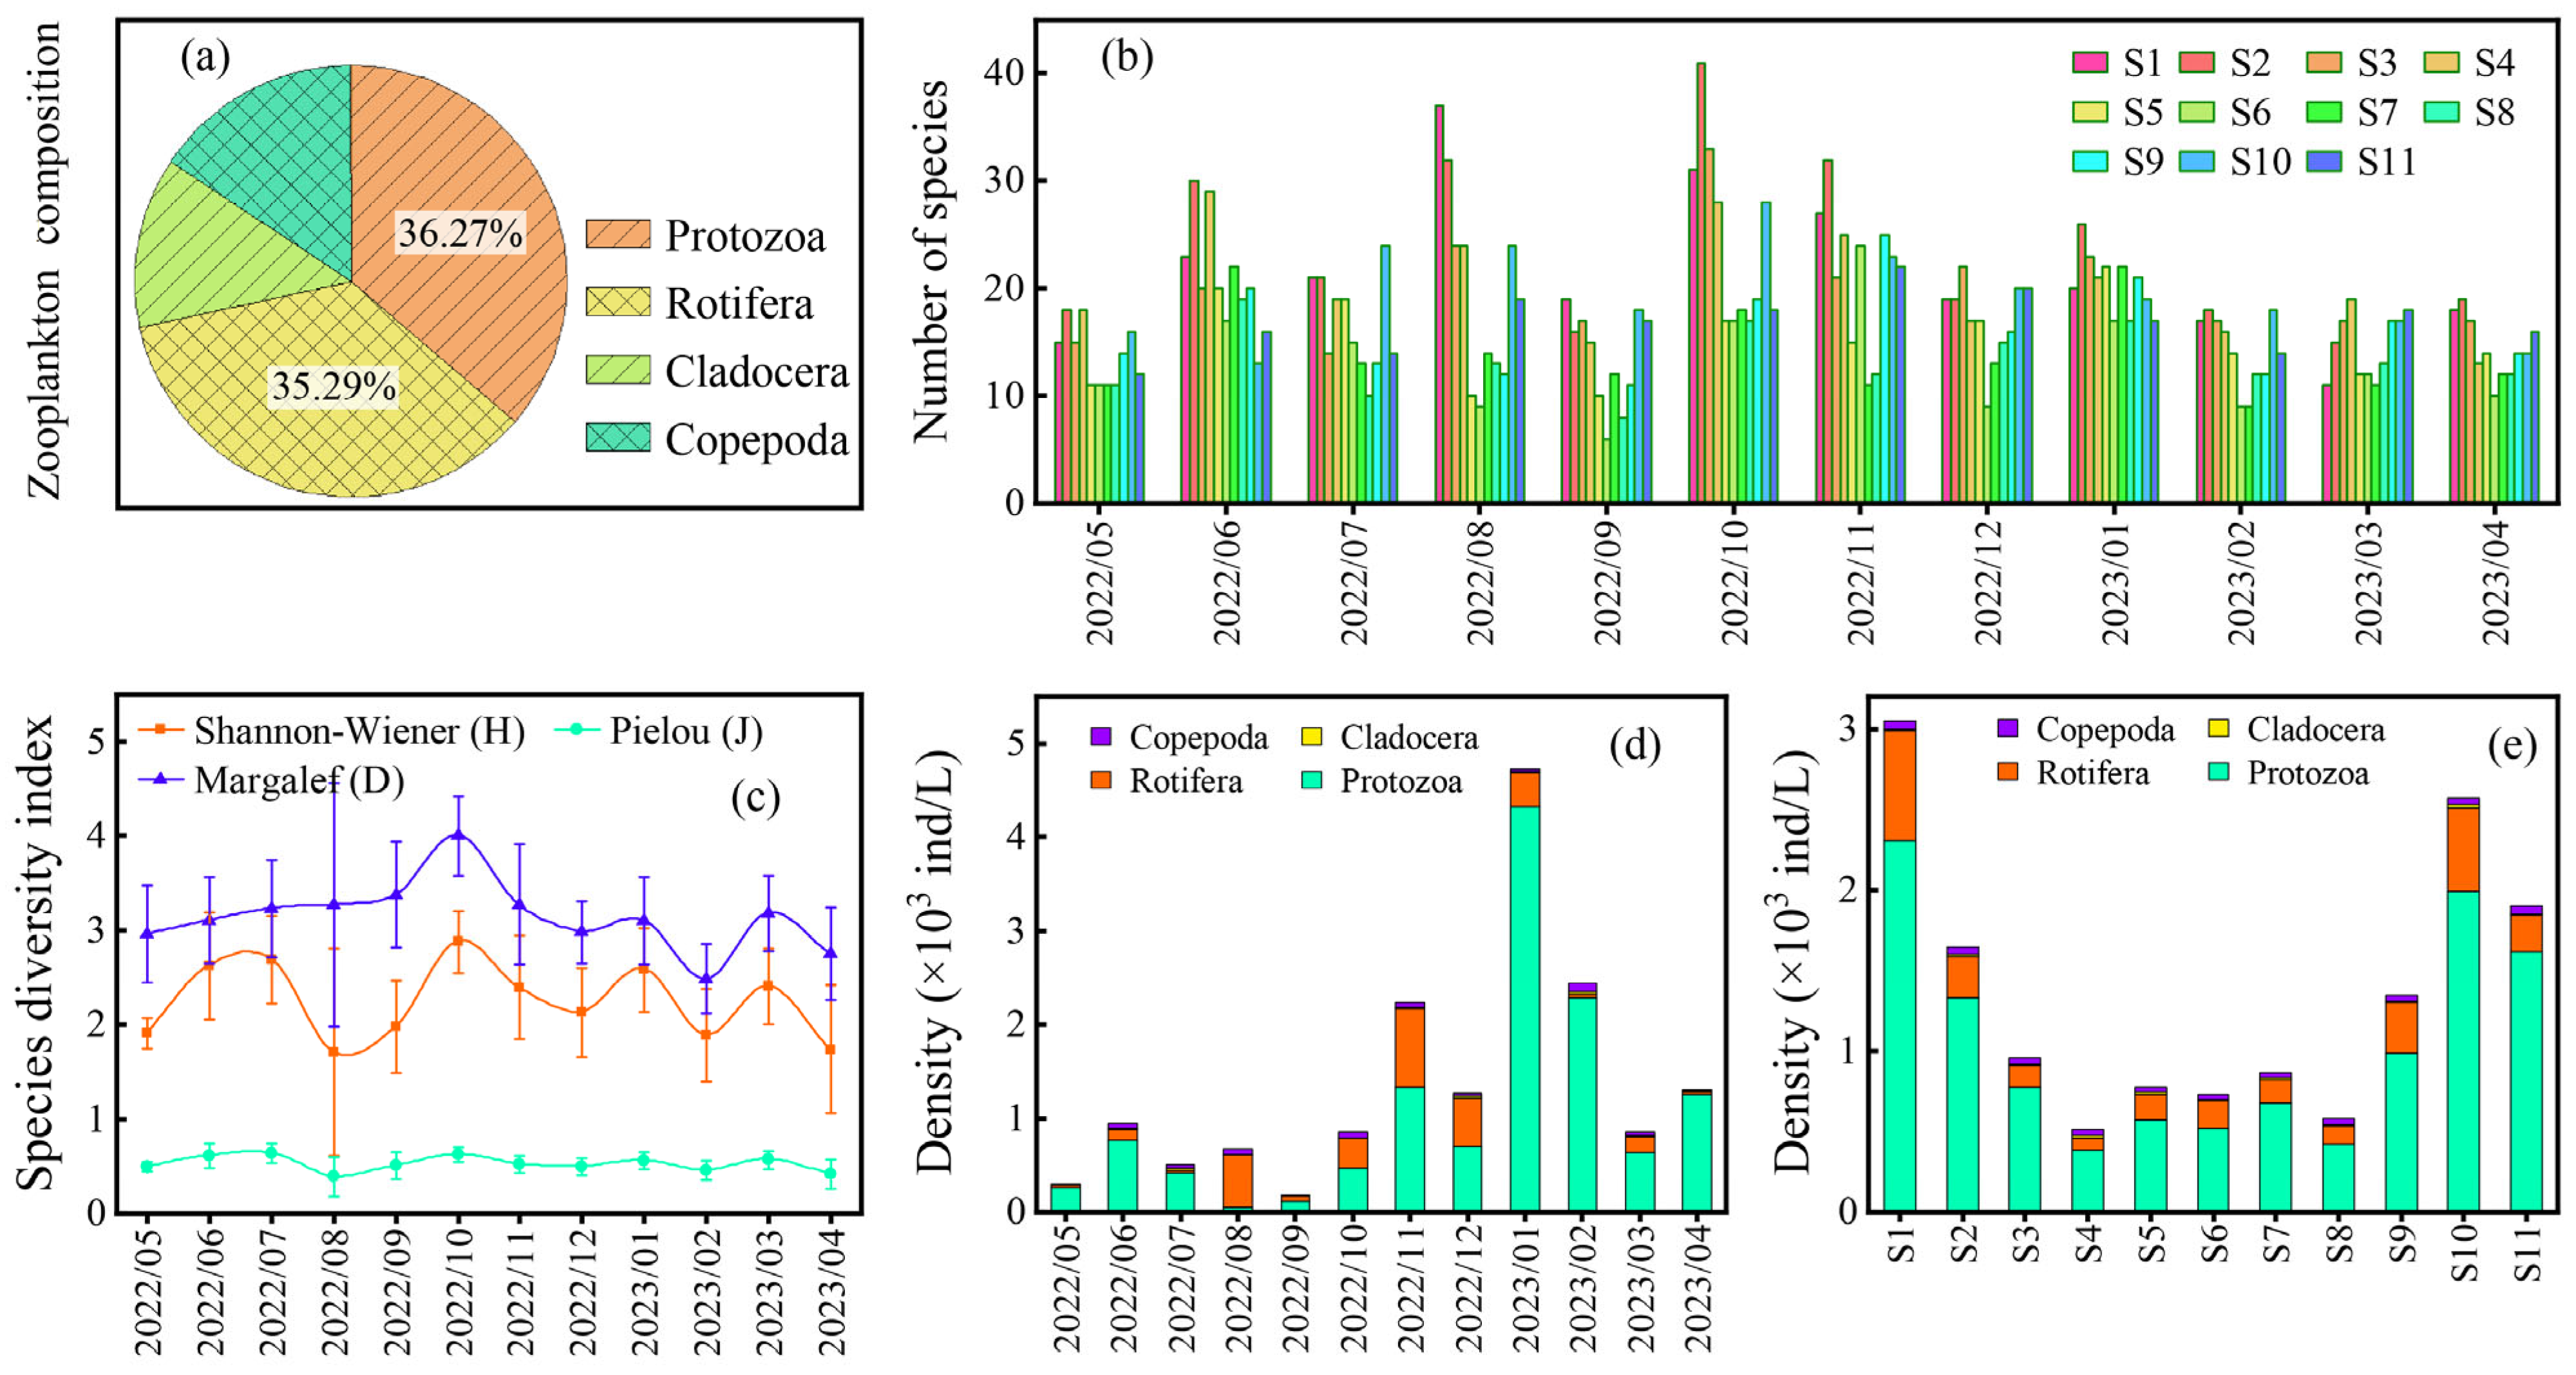
Zooplankton is the main phytoplankton consumer and affects phytoplankton biomass [29]. There were 73 genera and 102 species of zooplankton in Qionghai Lake during 2022–2023, of which Protozoa, Rotifera, Cladocera, and Copepoda accounted for 36.27%, 35.29%, 12.75%, and 15.69% (Figure 4a). And Protozoa had the highest number and density of dominant species (Table S3). The spatiotemporal variation of zooplankton species could be roughly divided into two parts (Figure 4b), part one, containing S1–S4 and S10–S11, showed relatively more species in summer and autumn, and part two. including S5–S9. did not change significantly within the year, and species in part one was higher than that in part two. The diversity index of H and D fluctuated between 2022 and 2023 but showed a downward trend from November 2022 to February 2023 (Figure 4c). Therefore, the decrease in species diversity and richness might be related to the outbreak of Anabaena bloom in Qionghai Lake.
In the present study, the spatiotemporal variation of zooplankton and Protozoa densities was similar to that of Cyanophyta and Anabaena sp. densities (Figure 2b,d). Temporally, zooplankton and Protozoa showed high density at 1.27 × 10³–4.73 × 10³ and 0.70 × 10³–4.32 × 10³ ind/L from November 2022 to February 2023 (Figure 4d), suggesting that Protozoa dominated among zooplankton during the Anabaena bloom period. Spatially, densities of zooplankton and Protozoa at S1 and S10 were higher than those at other sites; zooplankton density of the two sites was 3.05 × 10³ and 2.57 × 10³ ind/L, and the Protozoa density of the two sites was 2.30 × 10³ and 1.99 × 10³ ind/L (Figure 4e). Eutrophication is the important cause of bloom outbreak [6]; Protozoa abundance often increases with the enhancement of eutrophication [30]. Therefore, the Protozoa density increased in Qionghai Lake might be due to the enhanced eutrophication during the Anabaena bloom period. Nevertheless, Protozoa density was closely associated with the Cyanophyta and Anabaena sp. densities from May 2022 to April 2023, but the correlation was not significant between them during the Anabaena blooms period (Figure 5). In addition, filter-feeding Cladocera are able to reduce cyanobacteria abundance and create periods of clear water [29]. However, Cladocera density in Qionghai Lake was low (Figure 4) and had no significant correlation with Anabaena sp. density (Figure 5).

3.3. Effects of Biochemical Indicators on Cyanobacterial Bloom

3.3.1. Effects Analysis on Temporal Scale

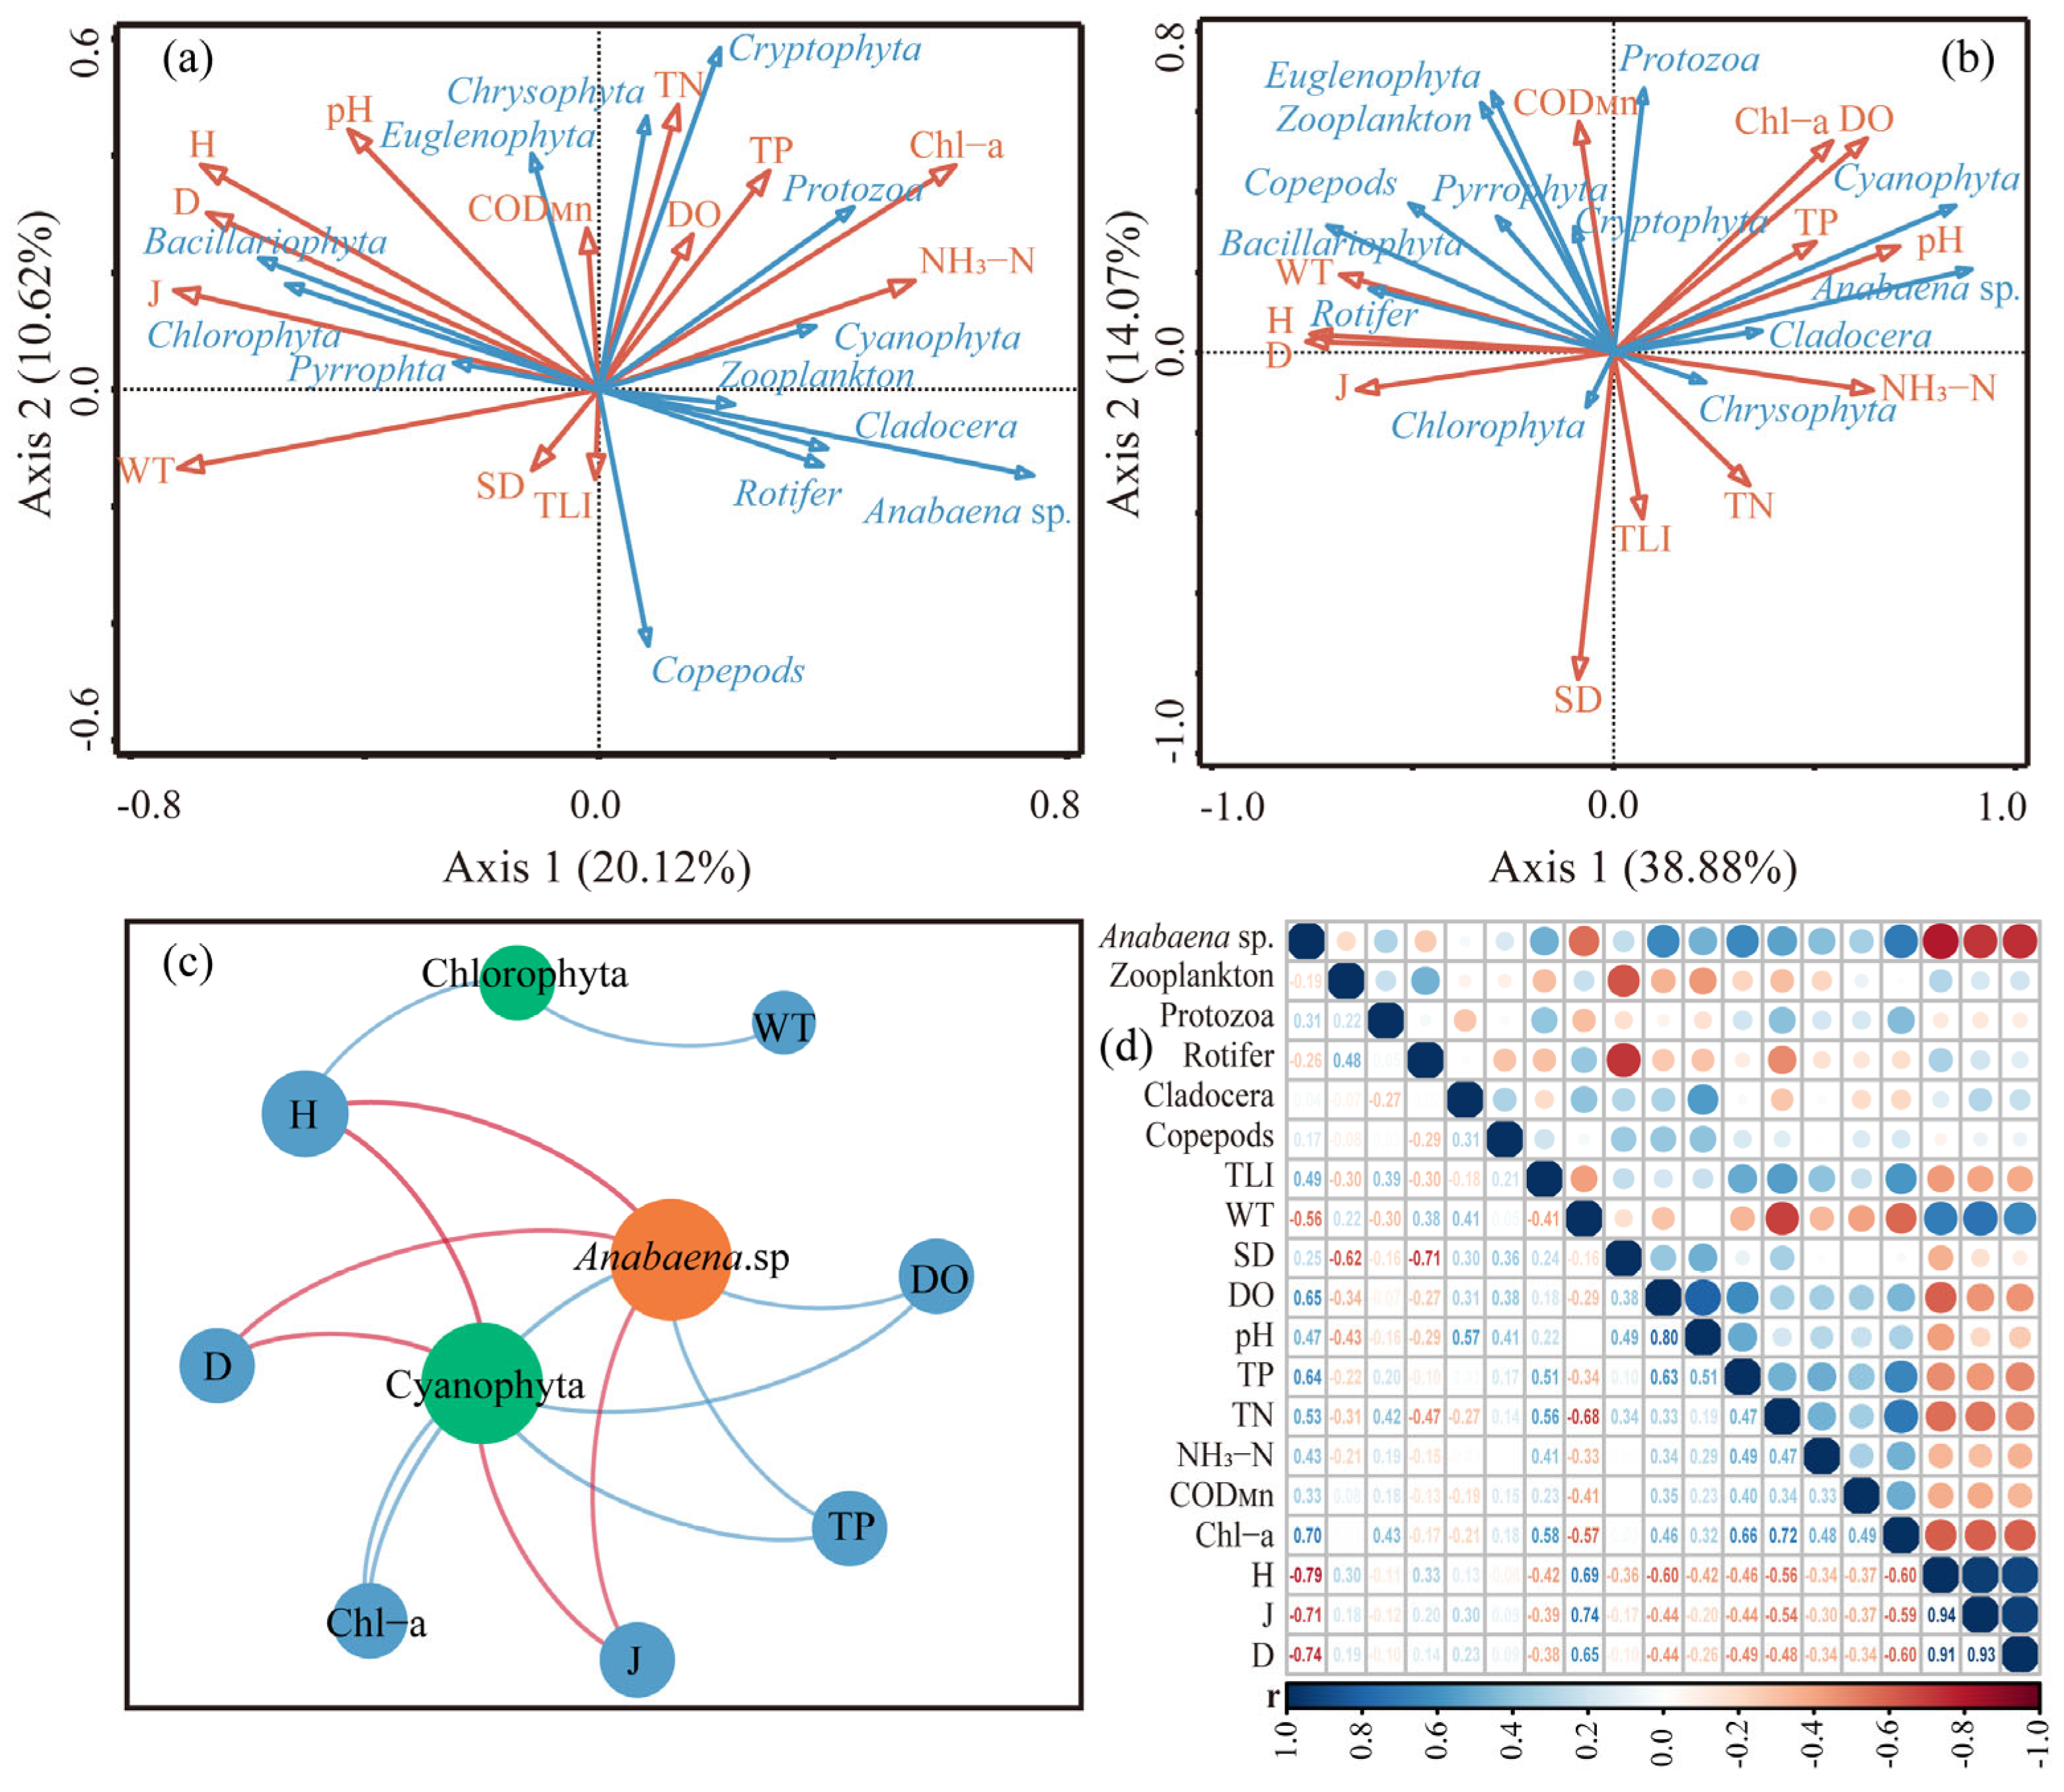
Yunnan–Guizhou Plateau Lakes of Dianchi, Qilu, Xingyun, and Yilong Lake were heavily polluted with TLI higher than 64 during 2005–2020 [7]. Nevertheless, the TLI of Qionghai Lake was lower than that of these lakes; its value ranged from 26.61 to 58.76 and exceeded 50 in February–Mar. 2023 (Figure 6a). The TLI and Chl-a increased significantly between December 2022 and February 2023, and the median Chl-a concentration rose from 6.00 to 19.94 μg/L during this period (Figure 6b). These results indicated that eutrophication enhancement was responsible for biomass increase and bloom outbreaks of Cyanophyta (Figure 2d) and Anabaena sp. (Figure 3) in Qionghai Lake [6]. Similarly, correlation analysis yielded the same result (Figure 5b): Cyanophyta and Anabaena sp. density had significant positive correlations with Chl-a (r = 0.70, p < 0.01) and TLI (r = 0.49, p < 0.01).
While eutrophication is primarily caused by high nitrogen and phosphorus, TN and TP on Qionghai Lake were in the range of 0.39–0.51 and 0.019–0.027 mg/L during 2011–2020 [14]. And many studies pointed out that excessive nitrogen and phosphorus were an important cause of cyanobacterial blooms in Dianchi Lake, Erhai, and Xingyun Lake [31]. At present, the TN (Figure 6c) and NH3–N (Figure 6e) concentrations showed similar trends; their values were 0.41–0.54 and 0.20–0.23 mg/L from December 2022 to February 2023 and were significantly higher than the values in other months. During the Anabaena bloom period of Qionghai Lake, TN and NH3–N were positively correlated with Anabaena sp. density (Figure 5b), and the correlation coefficient was 0.53 and 0.43 (Figure 5d). However, TP contributed more to Anabaena bloom than TN; it showed a strongly positive correlation (r = 0.64, p < 0.01) with Anabaena sp. density (Figure 5b). And the TP concentration had a similar trend with Chl-a and Anabaena sp. density (Figure 3); its median values were 0.021–0.045 mg/L from November 2022 to February 2023 (Figure 6d).
The CODMn concentration was less than 3.6 mg/L in the year (Figure 6f), and pH ranged from 7.0 to 8.9 and showed an overall decreasing trend over time (Figure 6g). The median SD was lower than 5 m between May 2022 and January 2023 but was 240–350 m from February to April 2023 (Figure 6h). Both CODMn and SD had no obvious correlation with Anabaena sp. density (Figure 5), but the increased SD during February–April 2023 might be associated with the bloom regression (Figure 3). The median WT between November 2022 and February 2023 decreased from 19.8 °C to 12.7 °C (Figure 6j), which was negatively correlated (r = −0.56, p < 0.01) with Anabaena bloom (Figure 5). The median value of DO concentration ranged from 5.13 to 10.57 mg/L; the maximum value was 10.57 mg/L, occurring in February 2023 (Figure 6i). And there was a significant positive correlation between DO and Anabaena sp. density (Figure 5), indicating that high DO concentration is a benefit from the strong algal photosynthesis during the bloom period [32].
Above all, TP had a high concentration from November 2022 to February 2023 (Figure 6) and showed the strongest correlation with Anabaena sp. density (Figure 5). Studies indicated that eutrophication occurs and the risk of bloom eruption exists when the TP concentration in water exceeds 0.02 mg/L [33].Therefore, TP might be the main environmental factor leading to Anabaena bloom in the Qionghai Lake. And the increase of TP concentration in the Qionghai Lake was mainly due to the large nutrient loads carried by non-point source pollution and surface runoff, especially in summer [14,34]. In addition, the TP concentration of the summer and autumn was 0.007–0.07 mg/L in 2019–2021 and 0.017–0.105 mg/L in 2022; TP of the summer in 2022 was significantly higher than that in 2019–2021 (Figure S2). The results suggested that high TP in summer might provide sufficient nutrients for the Anabaena bloom of Qionghai Lake in the autumn.

3.3.2. Effects Analysis on Spatial Scale

The TLI values of S3 and S10 were relatively high among all sites, being 44.96 and 40.53, respectively (Figure 7a). And all Chl-a, TN, NH3–N, TP, CDOMn, and pH showed higher values at S10 and S1 in the northwest of Qionghai Lake (Figure 7). The mean Chl-a content of S10, S1, and S2 sites was 18.72, 16.43, and 11.92 μg/L (Figure 7b), the mean TP concentration of these sites was 0.072, 0.054, and 0.031 mg/L (Figure 7d), and the mean pH of these sites was 8.35, 8.30, and 8.29 (Figure 7f), respectively. At S10, S1, and S11, the average TN values were 0.583, 0.527, and 0.474 mg/L (Figure 7c), and average NH3–N values were 0.259, 0.209, and 0.206 mg/L (Figure 7e); average CDOMn values were 2.936, 2.470, and 2.324 mg/L (Figure 7g), respectively. In addition, the SD and DO at S10 and S1 were significantly lower than those at other sites; the mean SD values of the two sites were 13.8 and 12.1 m (Figure 7h), and the mean DO values of the two sites were 7.217 and 7.163 mg/L (Figure 7i), respectively. Moreover, the phytoplankton had high density at S1 and S10 (Figure 2b), and Anabaena sp. density started to increase at S1 and S2 (Figure 3b). All these results indicated that the pollution is more serious at S10 and S1 in the northwest of Qionghai Lake, which might be the main cause of the Anabaena bloom first occurring in this area.
Land-use type reflects the intensity of human activities and has been considered to be the main driving force affecting water quality [35]. The western part of Qionghai Lake is close to the city and mainly consists of construction and agricultural land, with little distribution of ecological land such as forest and grassland [14], resulting in weaker adsorption and retention capacity of pollutants [36]. In addition, the average water depth was 2.94 m in the west area and could reach 18.32 m in the east area, which might lead to a worse ability to purify and contain pollutants in the west area of Qionghai Lake [14]. Therefore, these reasons might cause worse transparency and water quality in the northwest of Qionghai Lake (Figure 7).
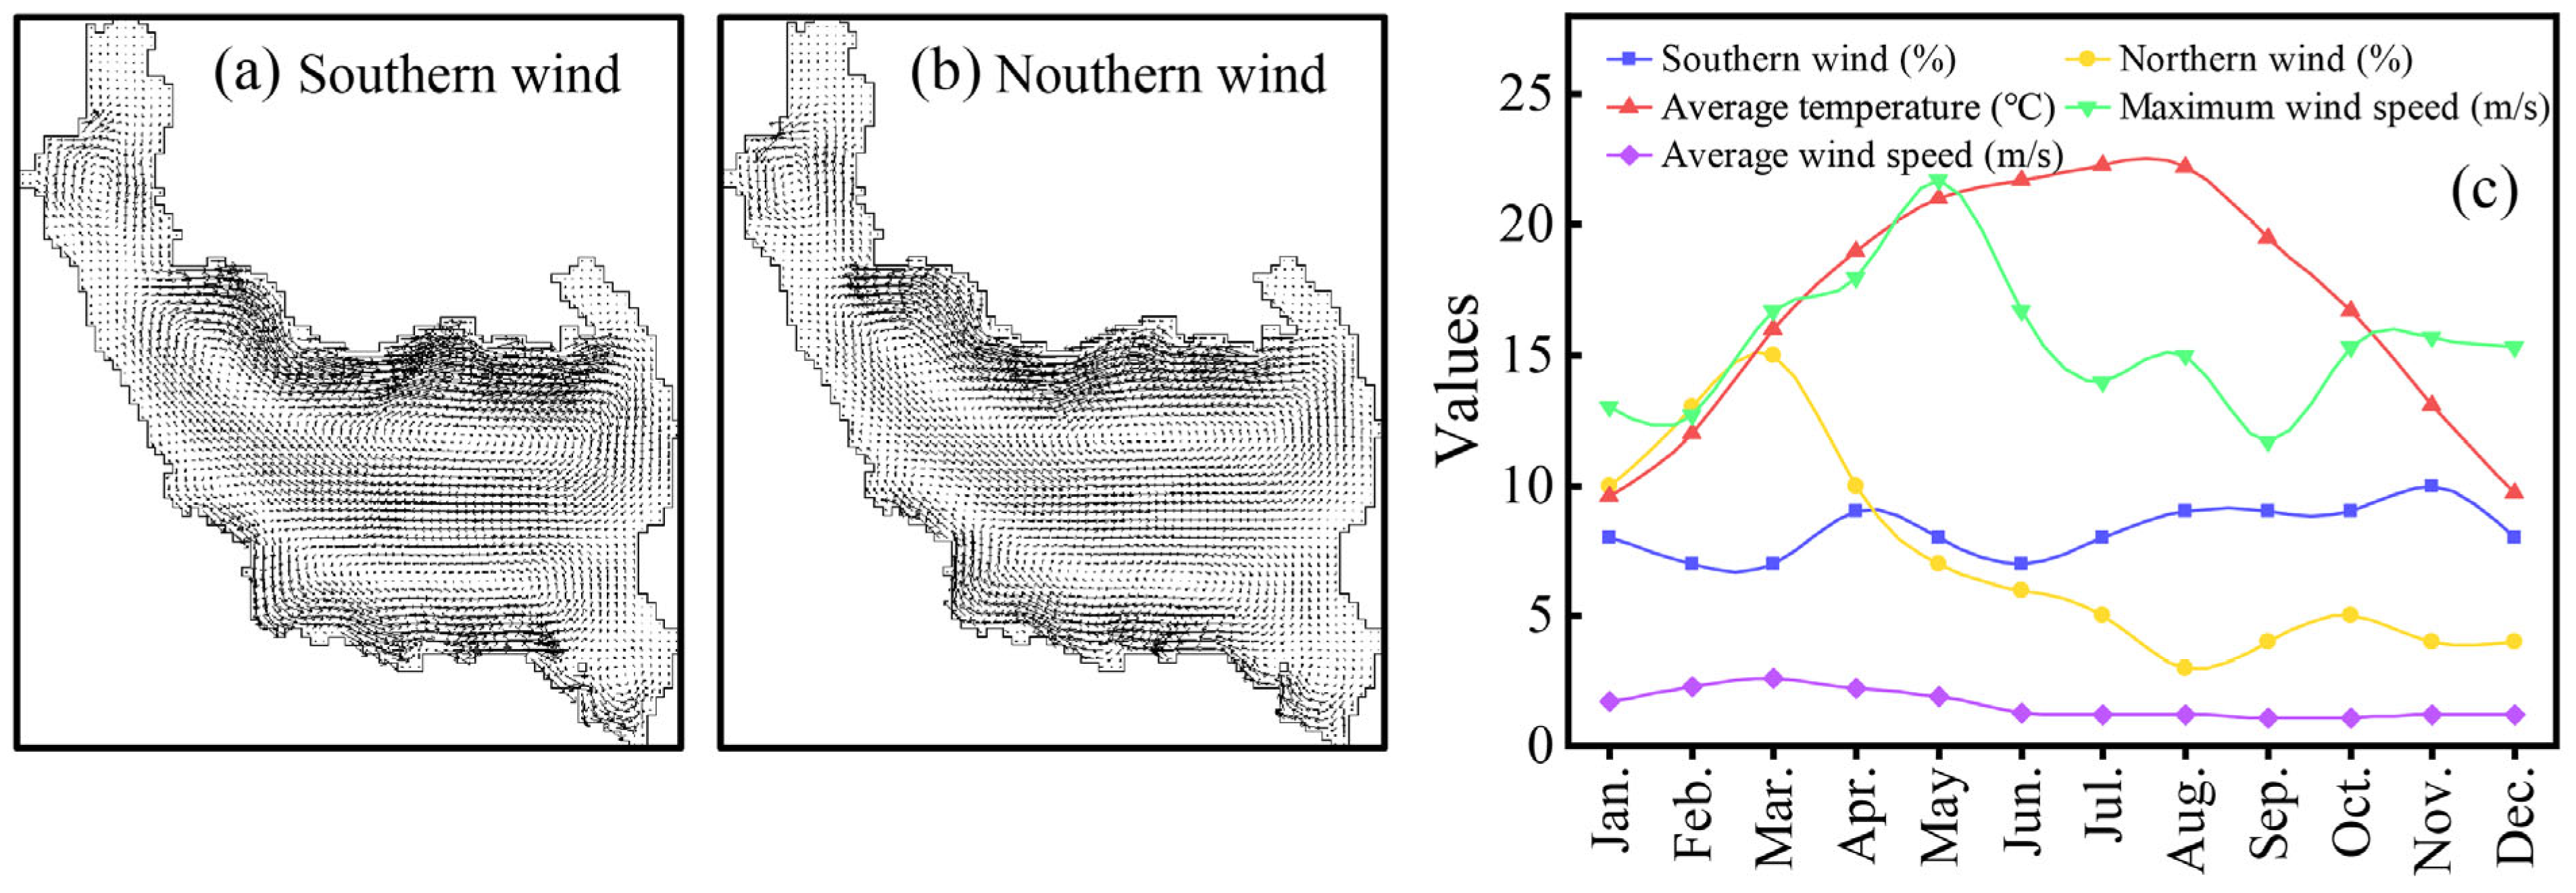
TP was the most significant environmental factor affecting the Anabaena bloom in Qionghai Lake (Figure 5). High TP concentration and wind prompted the Anabaena to bloom first in the northwest of Qionghai Lake. Firstly, the TP concentration of S10 and S1 sites was higher than 0.05 mg/L and was higher than that of other sites from May 2022 to April 2023 (Figure 7d). And TP concentration decreased further away from the northwest waters of Qionghai Lake (Figure S3a), and it of S1 and S10 sites in the summer of 2022 was significantly higher than that in 2019–2021 (Figure S2). These results suggested that adequate phosphorus in summer and autumn provided the material basis for the Anabaena bloom of Qionghai Lake. Secondly, the dominant wind direction was southern wind in summer and autumn with an average frequency of 7.7% and 9.0% (Figure 8). The maximum and average wind speeds were 21.7 and 1.6 m/s in recent 30 years (Figure 8c). The gas vesicles enable the Anabaena sp. to move [37], hence the southern wind could allow large numbers of algal cells to accumulate in the northwest of the Qionghai Lake. However, water exchange between the upper and lower layers provided abundant phosphorus, which might promote the Anabaena bloom throughout the Qionghai Lake. The water stratification was obvious in Oct., and TP concentration in the lower layers was high, while the stratification was broken after November, and the high TP in the bottom layer, gradually migrated to the upper layer providing nutrients for algae growth (Figure S3b,c).

3.4. Ecological Mechanism of Cyanobacteria Bloom Occurrence in Qionghai Lake

Cyanobacterial blooms occurred frequently in lakes in the middle and lower reaches of the Yangtze River and the Yunnan–Guizhou Plateau [31]. Cyanobacterial blooms in Taihu Lake were dominated by Microcystis and often broke out from April to Oct. [2,38]. Microcystis peaked in Jun., and Anabaena peaked in May and November in the cyanobacterial blooms of Chaohu Lake [39]. The cyanobacterial bloom-forming species in Dianchi Lake had the characteristics of succession from A. flos-aquae in spring to Microcystis in summer (Table S4). Cyanobacterial blooms in Erhai and Xingyun Lake usually erupted in summer and were predominated by Microcystis (Table S4). In Qilu and Yilong Lake, the cyanobacterial bloom-forming species was predominantly Cylindrospermopsis raciborskii, yet its appearance was observed in different seasons (Table S4).
In space, the factors triggering cyanobacteria blooms in Qionghai Lake resemble those in other lakes on the Yunnan–Guizhou Plateau [3]. Blooms of these lakes predominantly occur more often in the northern areas (Figure 2 and Figure 3), potentially due to the monsoon climate there [40]. Moreover, blooms were more pronounced in regions with intense human interference (Figure 2 and Figure 3). This was perhaps because frequent human activities introduced more pollutants and nutrients into the lake, fueling the onset of cyanobacteria blooms [3,7]. Additionally, the lake’s shape could be a crucial determinant for bloom occurrence (Figure 2 and Figure 3). For instance, blooms tended to emerge in narrow lake corners, plausibly because of weak hydrological connectivity that hindered pollutant dispersion and consequently led to water quality degradation [41].
However, unlike those lakes with blooms mainly in summer, Qionghai Lake had a cyanobacterial bloom in winter and was dominated by Anabaena (Figure 2 and Figure 3). Firstly, this might be influenced by global warming. In comparison with heavily polluted Dianchi Lake and Xingyun Lake, Qionghai Lake had a lower bloom frequency, yet its Chl-a concentration has been increasing annually [14]. The water temperature in Qionghai Lake rose by 2.4 °C from 2011 to 2020, potentially heightening the risk of Anabaena bloom [14]. Secondly, despite less rainfall in winter, human activities could still enable nutrients to enter the lake via surface runoff, furnishing a nutritional foundation for water blooms [34]. Finally, lower temperatures might impede the growth of other algae, thus allowing some cold-tolerant Anabaena to gain a competitive edge [42].
In summary, Anabaena blooms were serious, and water quality was poor in autumn and winter in Qionghai Lake, especially in the northwest waters. High nutrient concentrations, especially high TP, might be the main cause of Anabaena blooms in Qionghai Lake. And non-point pollution was the main source of nutrient load in Qionghai Lake [14], which should be effectively controlled and managed. Furthermore, to elucidate the mechanism underlying the winter bloom of Anabaena in Qionghai Lake, a deeper investigation into the physiological and molecular responses of Anabaena to low temperatures is warranted.

4. Conclusions

The Anabaena bloom in Qionghai Lake began to erupt in the northwest waters in November 2022 and then gradually spread to the eastern waters until it covered the entire lake in February 2023. There was no significant relationship between Anabaena bloom and zooplankton in Qionghai Lake. During the Anabaena bloom period, the mean TP and TN were 0.41–0.54 and 0.021–0.045 mg/L, which were positively correlated with Anabaena sp. density. While TP probably was the main cause of the Anabaena bloom in the Qionghai Lake, non-point pollution should be treated to control blooms.

Supplementary Materials

The following supporting information can be downloaded at: https://www.mdpi.com/article/10.3390/w17020169/s1, Figure S1. NMDS analysis of phytoplankton (a) and zooplankton (b) in Qionghai Lake. Figure S2. Variation of TP concentration in Qionghai Lake from August to December during 2019–2022. Figure S3. TP concentration in waters at different distances from S2 sites in November 2022 (a), TP concentration at different water depths of S2 (b) and S4 site in 2022 (c). Table S1. Species dominance of phytoplankton in Qionghai Lake during 2022–2023. Table S2. Species composition and cell density of dominant phytoplankton in Qionghai Lake during 2022–2023. Table S3. Species composition and cell density of dominant zooplankton in Qionghai Lake during 2022–2023. Table S4. Information of cyanobacteria bloom in Yunnan-Guizhou Plateau lakes [3,9,43,44,45,46,47].

Author Contributions

Conceptualization, Y.D. and B.Z.; Methodology, Y.D., Z.T., X.L. and B.Z.; Software, Y.D., Z.T., X.L. and D.X.; Validation, Y.D.; Formal analysis, Y.D. and Z.T.; Investigation, Y.D., Z.T., X.L. and D.X.; Resources, Z.T. and B.Z.; Data curation, Y.D., X.L., D.X. and B.Z.; Writing—original draft, Y.D., Z.T. and B.Z.; Writing—review & editing, Y.D., Z.T. and B.Z.; Visualization, Y.D., X.L. and D.X.; Supervision, Z.T. and B.Z.; Project administration, B.Z.; Funding acquisition, B.Z. All authors have read and agreed to the published version of the manuscript.

Funding

The research was financially supported by the National Key Research and Development Project (No. 2021YFC3201003).

Data Availability Statement

The original contributions presented in this study are included in the article/Supplementary Materials. Further inquiries can be directed to the corresponding authors.

Conflicts of Interest

The authors declare no conflict of interest.

References

  1. Amorim, C.A.; Moura, A.d.N. Ecological impacts of freshwater algal blooms on water quality, plankton biodiversity, structure, and ecosystem functioning. Sci. Total Environ. 2021, 758, 143605. [Google Scholar] [CrossRef] [PubMed]
  2. Hou, X.; Feng, L.; Dai, Y.; Hu, C.; Gibson, L.; Tang, J.; Lee, Z.; Wang, Y.; Cai, X.; Liu, J.; et al. Global mapping reveals increase in lacustrine algal blooms over the past decade. Nat. Geosci. 2022, 15, 130–134. [Google Scholar] [CrossRef]
  3. Peng, J.; Chen, J.; Liu, S.; Liu, T.; Cao, M.; Nanding, N.; Zhuang, L.; Bao, A.; De Maeyer, P. Dynamics of algal blooms in typical low-latitude plateau lakes: Spatiotemporal patterns and driving factors. Environ. Pollut. 2024, 345, 123453. [Google Scholar] [CrossRef] [PubMed]
  4. Qin, B.; Zhang, Y.; Zhu, G.; Gao, G. Eutrophication control of large shallow lakes in China. Sci. Total Environ. 2023, 881, 163494. [Google Scholar] [CrossRef]
  5. Antunes, J.T.; Leão, P.N.; Vasconcelos, V.M. Cylindrospermopsis raciborskii: Review of the distribution, phylogeography, and ecophysiology of a global invasive species. Front. Microbiol. 2015, 6, 473. [Google Scholar] [CrossRef]
  6. Huisman, J.; Codd, G.A.; Paerl, H.W.; Ibelings, B.W.; Verspagen, J.M.H.; Visser, P.M. Cyanobacterial blooms. Nat. Rev. Microbiol. 2018, 16, 471–483. [Google Scholar] [CrossRef]
  7. Ran, J.; Xiang, R.; He, J.; Zheng, B. Spatiotemporal variation and driving factors of water quality in Yunnan-Guizhou plateau lakes, China. J. Contam. Hydrol. 2023, 254, 104141. [Google Scholar] [CrossRef]
  8. Wang, J.-H.; Yang, C.; He, L.-Q.-S.; Dao, G.-H.; Du, J.-S.; Han, Y.-P.; Wu, G.-X.; Wu, Q.-Y.; Hu, H.-Y. Meteorological factors and water quality changes of Plateau Lake Dianchi in China (1990–2015) and their joint influences on cyanobacterial blooms. Sci. Total Environ. 2019, 665, 406–418. [Google Scholar] [CrossRef]
  9. Cao, J.; Hou, Z.; Li, Z.; Chu, Z.; Yang, P.; Zheng, B. Succession of phytoplankton functional groups and their driving factors in a subtropical plateau lake. Sci. Total Environ. 2018, 631–632, 1127–1137. [Google Scholar] [CrossRef]
  10. Yong, C.; Wang, Y.Q. Qionghai Lake, Sichuan, China: Environmental degradation and the need for multidimensional management. Mt. Res. Dev. 2003, 23, 65–72. [Google Scholar] [CrossRef]
  11. Liu, Y.; Guo, H.C.; Zou, R.; Wang, L.J. Neural network modeling for regional hazard assessment of debris flow in Lake Qionghai Watershed, China. Environ. Geol. 2006, 49, 968–976. [Google Scholar] [CrossRef]
  12. Wei, X.; Chen, N. Development of debris flows in Guanba River and its effect on sediment deposition in Qionghai Lake of Sichuan. Acta Geogr. Sin. 2018, 3, 81–91. [Google Scholar]
  13. Wu, S.; Tian, C.; Li, B.; Wang, J.; Wang, Z. Ecological environment health assessment of lake water ecosystem system based on simulated annealing-projection pursuit: A case study of plateau lake. Sustain. Cities Soc. 2022, 86, 104131. [Google Scholar] [CrossRef]
  14. Ran, J.; Xiang, R.; Li, J.; Xiao, K.; Zheng, B. Spatiotemporal variations in the water quality of Qionghai Lake, Yunnan-Guizhou Plateau, China. Water 2022, 14, 2451. [Google Scholar] [CrossRef]
  15. Wang, G.; Wang, Y.; Wei, Z.; He, W.; Zhang, T.; Ma, X. Geochemical records of Qionghai Lake sediments in southwestern China linked to late Quaternary climate changes. Palaeogeogr. Palaeoclimatol. Palaeoecol. 2020, 560, 109902. [Google Scholar] [CrossRef]
  16. Hu, H.J.; Wei, Y.X. The Freshwater Algae of China-Systematics, Taxonomy and Ecology; Science Press: Beijing, China, 2006. [Google Scholar]
  17. Han, M.S. Freshwater Plankton Atlas; Agricultural Publishing House: Beijing, China, 1980. [Google Scholar]
  18. Institute of Zoology Chinese Academy of Sciences. Fauna Sinica: Freshwater Copepoda; Science Press: Beijing, China, 1979. [Google Scholar]
  19. Jiang, X.Z.; Du, N.S. Fauna Sinica: Freshwater Cladocera; Science Press: Beijing, China, 1979. [Google Scholar]
  20. Xiang, R.; Liu, T.; Chu, Z.; Wang, X.; Zheng, B.; Jia, H. Effects of dissolved organic matter derived from two herbs on the growth, physiology, and physico-chemical characteristics of four bloom-forming algae species. J. Environ. Manag. 2023, 336, 117559. [Google Scholar] [CrossRef]
  21. GB 3838-2002; Environmental Quality Standards for Surface Water. MEP (Ministry of Environmental Protection P.R. China): Beijing, China, 2002.
  22. Secchi, P.A. Relazione delle esperienze fatte a bordo della pontificia pirocorvetta Imacolata Concezione per determinare la trasparenza del mare. Mem. PA Secchi. Il Nuovo C. G. Fis. Chim. E Stor. Nat. 1864, 20, 205–237. [Google Scholar]
  23. Zhang, S. Eutrophication of the Three Gorges Reservoir after its first filling. Trop. Sub-Trop. Reserv. Limnol. China Theory Pract. 2012, 91, 293–309. [Google Scholar]
  24. Peng, Y.; Fan, M.; Song, J.; Cui, T.; Li, R. Assessment of plant species diversity based on hyperspectral indices at a fine scale. Sci. Rep. 2018, 8, 4776. [Google Scholar] [CrossRef]
  25. Wei, Y.; Ding, D.; Gu, T.; Jiang, T.; Qu, K.; Sun, J.; Cui, Z. Different responses of phytoplankton and zooplankton communities to current changing coastal environments. Environ. Res. 2022, 215, 114426. [Google Scholar] [CrossRef]
  26. He, J.; Wu, X.; Zhang, Y.; Zheng, B.; Meng, D.; Zhou, H.; Lu, L.; Deng, W.; Shao, Z.; Qin, Y. Management of water quality targets based on river-lake water quality response relationships for lake basins—A case study of Dianchi Lake. Environ. Res. 2020, 186, 109479. [Google Scholar] [CrossRef]
  27. Gabarron, M.; Faz, A.; Acosta, J.A. Use of multivariable and redundancy analysis to assess the behavior of metals and arsenic in urban soil and road dust affected by metallic mining as a base for risk assessment. J. Environ. Manag. 2018, 206, 192–201. [Google Scholar] [CrossRef]
  28. Li, L.; Li, G.; Li, G. Winter and spring succession of the phytoplankton community in Dianchi Lake under the Influences of environment change. J. Hydroecol. 2020, 41, 57–68. [Google Scholar]
  29. Triest, L.; Stiers, I.; Van Onsem, S. Biomanipulation as a nature-based solution to reduce cyanobacterial blooms. Aquat. Ecol. 2016, 50, 461–483. [Google Scholar] [CrossRef]
  30. Xu, M.Q.; Cao, H.; Xie, P.; Deng, D.G.; Feng, W.S.; Xu, H. The temporal and spatial distribution, composition and abundance of Protozoa in Chaohu Lake, China: Relationship with eutrophication. Eur. J. Protistol. 2005, 41, 183–192. [Google Scholar] [CrossRef]
  31. Xu, H.; Qin, B.; Paerl, H.W.; Peng, K.; Zhang, Q.; Zhu, G.; Zhang, Y. Environmental controls of harmful cyanobacterial blooms in Chinese inland waters. Harmful Algae 2021, 110, 102127. [Google Scholar] [CrossRef]
  32. Sarkar, S.K. Marine Algal Bloom: Characteristics, Causes and Climate Change Impacts; Springer: Singapore, 2018; pp. 53–109. [Google Scholar]
  33. Thomann, R.V.; Mueller, J.A. Principles of Surface Water Quality Modeling and Control; Harper & Row Publishers: New York, NY, USA, 1987. [Google Scholar]
  34. Jia, Z.; Chang, X.; Duan, T.; Wang, X.; Wei, T.; Li, Y. Water quality responses to rainfall and surrounding land uses in urban lakes. J. Environ. Manag. 2021, 298, 113514. [Google Scholar] [CrossRef]
  35. Dai, X.; Zhou, Y.; Ma, W.; Zhou, L. Influence of spatial variation in land-use patterns and topography on water quality of the rivers inflowing to Fuxian Lake, a large deep lake in the plateau of southwestern China. Ecol. Eng. 2017, 99, 417–428. [Google Scholar] [CrossRef]
  36. Wei, W.; Gao, Y.; Huang, J.; Gao, J. Exploring the effect of basin land degradation on lake and reservoir water quality in China. J. Clean. Prod. 2020, 268, 122249. [Google Scholar] [CrossRef]
  37. Walsby, A.E. Gas Vesicles. Microbiol. Rev. 1994, 58, 94–144. [Google Scholar] [CrossRef]
  38. Yang, Z.; Zhang, M.; Shi, X.; Kong, F.; Ma, R.; Yu, Y. Nutrient reduction magnifies the impact of extreme weather on cyanobacterial bloom formation in large shallow Lake Taihu (China). Water Res. 2016, 103, 302–310. [Google Scholar] [CrossRef]
  39. Zhang, M.; Zhang, Y.; Yang, Z.; Wei, L.; Yang, W.; Chen, C.; Kong, F. Spatial and seasonal shifts in bloom-forming cyanobacteria in Lake Chaohu: Patterns and driving factors. Phycol. Res. 2016, 64, 44–55. [Google Scholar] [CrossRef]
  40. Zeng, Y.; Chang, F.; Wen, X.; Duan, L.; Zhang, Y.; Liu, Q.; Zhang, H. Seasonal variation in the water quality and eutrophication of Lake Xingyun in southwestern China. Water 2022, 14, 3677. [Google Scholar] [CrossRef]
  41. Mazur, M.L.C.; Smith, B.; Bird, B.; McMillan, S.; Pyron, M.; Hauswald, C. Hydrologic connectivity and land cover affect floodplain lake water quality, fish abundance, and fish diversity in floodplain lakes of the Wabash-White River basin. River Res. Appl. 2022, 38, 160–172. [Google Scholar] [CrossRef]
  42. Glibert, P.M. Harmful algae at the complex nexus of eutrophication and climate change. Harmful Algae 2020, 91, 101583. [Google Scholar] [CrossRef]
  43. Wu, Y.; Li, L.; Zheng, L.; Dai, G.; Ma, H.; Shan, K.; Wu, H.; Zhou, Q.; Song, L. Patterns of succession between bloom-forming cyanobacteria Aphanizomenon flos-aquae and Microcystis and related environmental factors in large, shallow Dianchi Lake, China. Hydrobiologia 2016, 765, 1–13. [Google Scholar] [CrossRef]
  44. Zhang, Y.; Zhang, H.; Liu, Q.; Duan, L.; Zhou, Q. Total nitrogen and community turnover determine phosphorus use efficiency of phytoplankton along nutrient gradients in plateau lakes. J. Environ. Sci. 2023, 124, 699–711. [Google Scholar] [CrossRef]
  45. Li, D.; Chang, F.; Wen, X.; Duan, L.; Zhang, H. Seasonal variations in water quality and algal blooming in hypereutrophic Lake Qilu of southwestern China. Water 2022, 14, 2611. [Google Scholar] [CrossRef]
  46. Wu, C.; Jiang, C.; Ju, M.; Pan, Z.; Li, Z.; Sun, L.; Geng, H. Simulation and control of the cyanobacterial bloom biomass in a typical plateau lake based on the logistic growth model: A case study of Xingyun Lake. Ecol. Inform. 2024, 82, 102779. [Google Scholar] [CrossRef]
  47. Jin, Y.; Ren, S.; Wu, Y.; Zhang, X.; Chen, Z.; Xie, B. Microbial community structures and bacteria-Cylindrospermopsis raciborskii interactions in Yilong Lake. FEMS Microbiol. Ecol. 2024, 100, fiae048. [Google Scholar] [CrossRef]
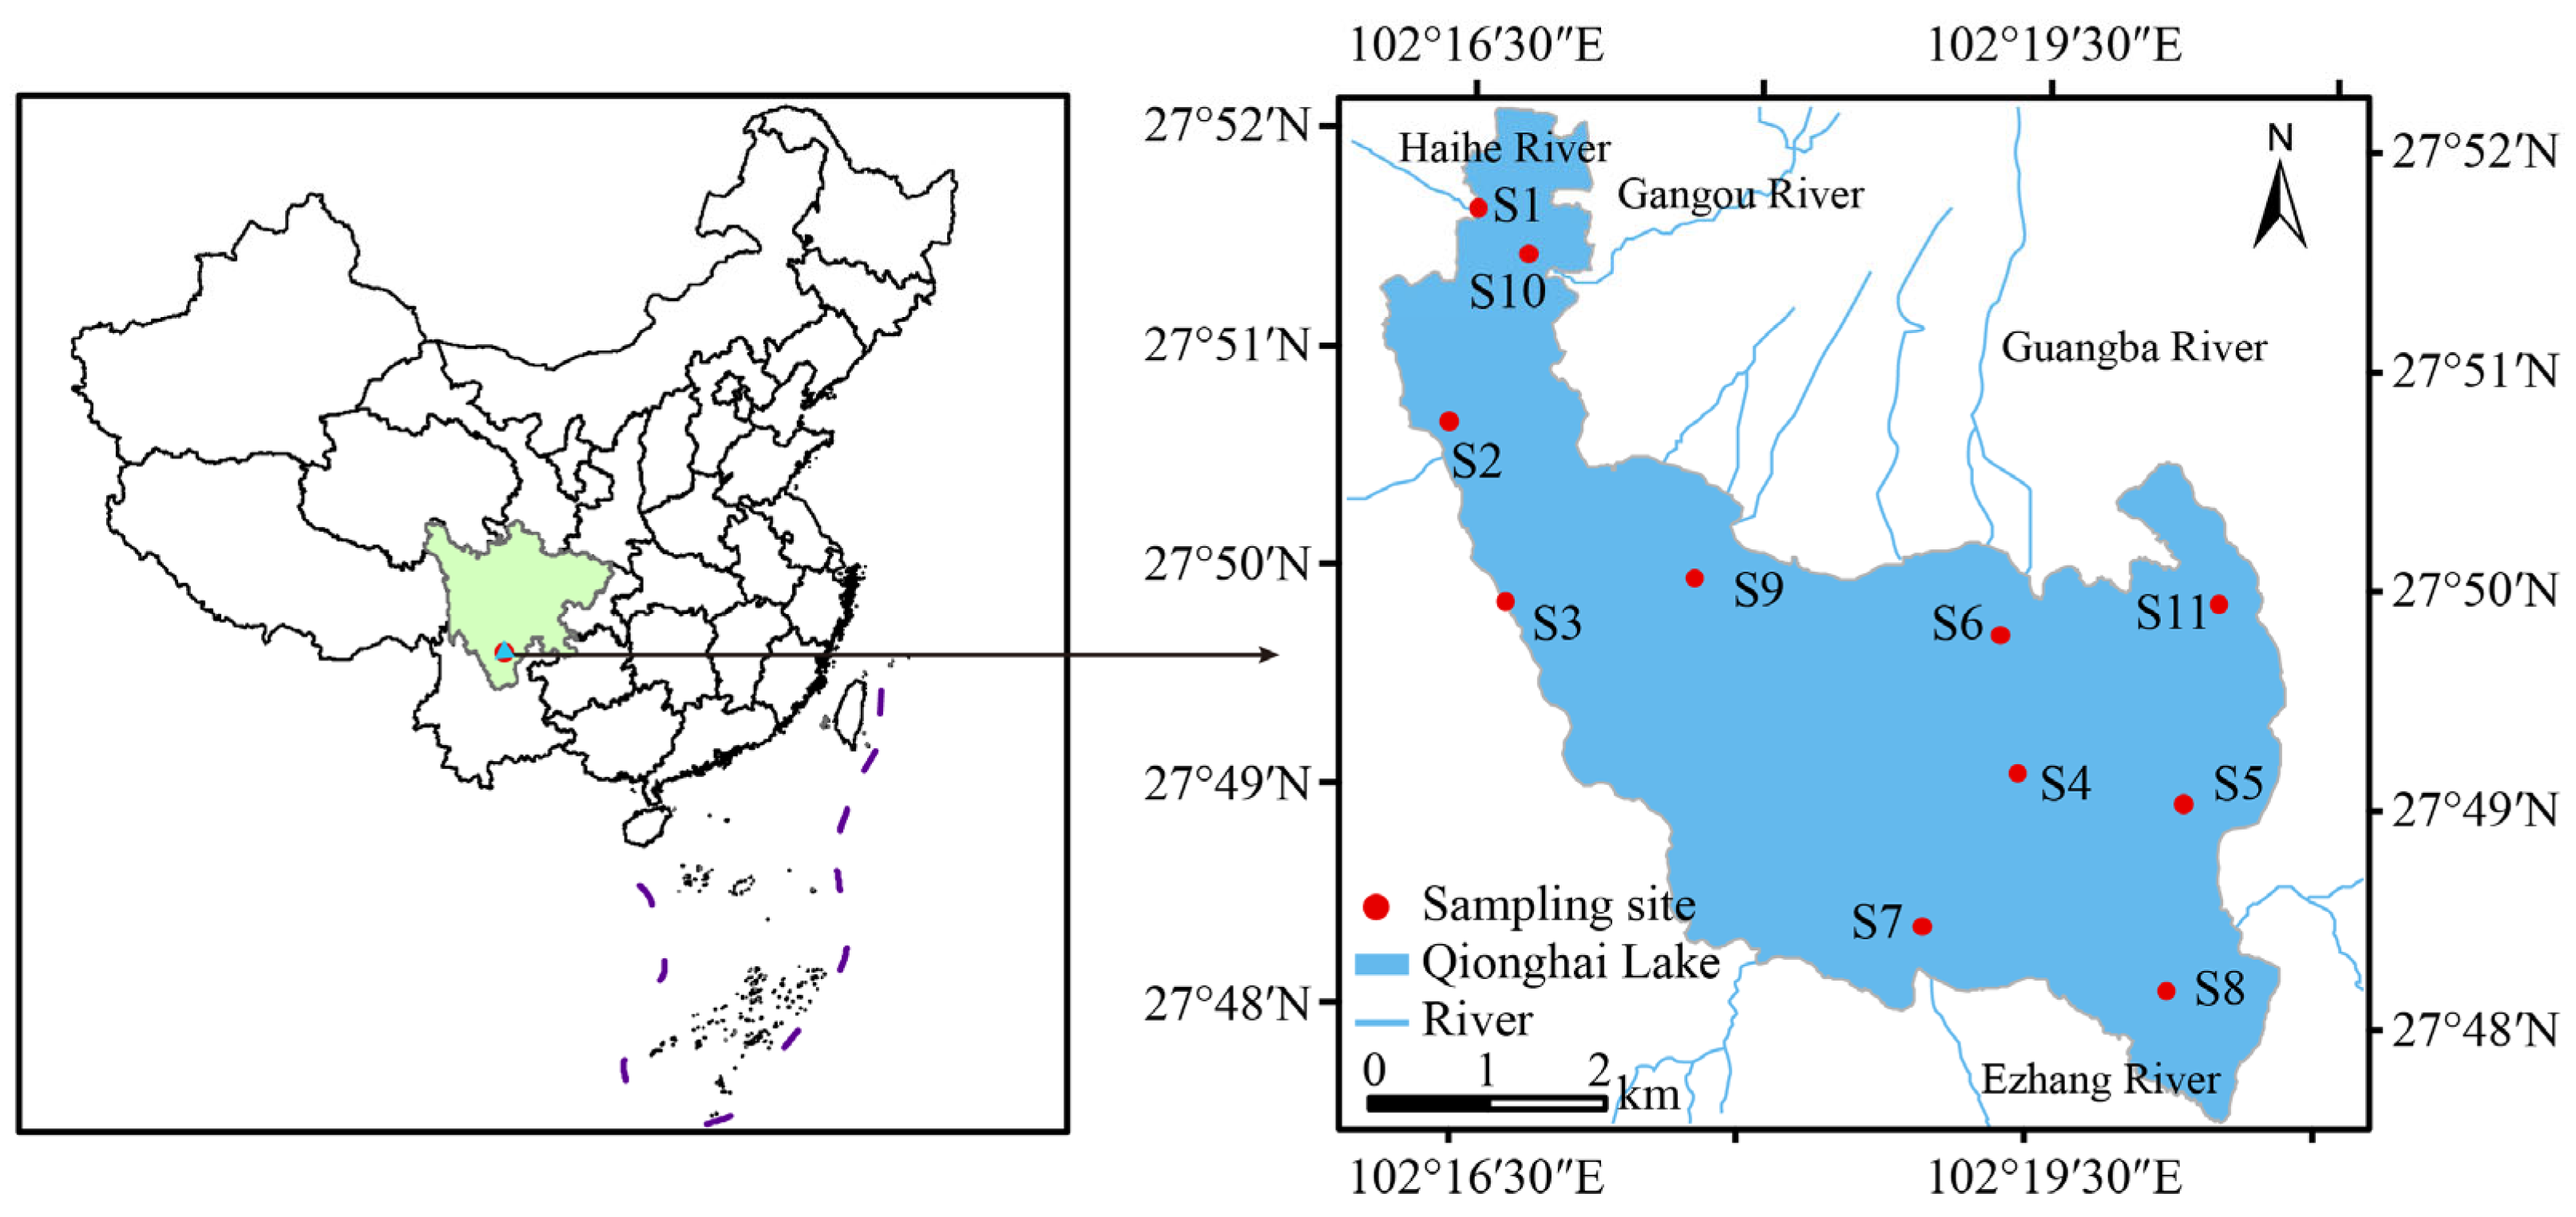
Figure 1. Sampling sites in the Qionghai lake.
Water 17 00169 g001
Figure 2. Variation of phytoplankton composition (a), cell density on spatial scale (b), species diversity index (c), and cell density on temporal scale (d) in Qionghai Lake.
Water 17 00169 g002
Figure 3. Temporal variation (a,c) and spatial variation between December 2022 and February 2023 (b,d) of Anabaena sp. density in Qionghai Lake.
Water 17 00169 g003
Figure 4. Variation in composition (a), species number (b), diversity index (c), temporally density (d), and spatial density (e) of zooplankton in Qionghai Lake.
Water 17 00169 g004
Figure 5. RDA analysis between biochemical indicators and plankton from May 2022 to April 2023 (a), and from November 2022 to February 2023 (b). Network ((c), only interactions with significant Spearman correlations rs > 0.6 and p < 0.05 were considered, the node size represents the importance of biochemical indicator or plankton, the line color indicates positive (blue) and negative (red) correlations, and the line width represents correlation strength.) and Spearman (d) correlation analysis among biochemical indicators, phytoplankton, and zooplankton in Qionghai Lake.
Water 17 00169 g005
Figure 6. Temporal variations of biochemical indicators in Qionghai Lake.
Water 17 00169 g006
Figure 7. Spatial variations of biochemical indicators in Qionghai Lake.
Water 17 00169 g007
Figure 8. Change in the hydrodynamic field under different wind directions (a,b) and meteorological indices (c) in Qionghai Lake in the past 30 years.
Water 17 00169 g008
Disclaimer/Publisher’s Note: The statements, opinions and data contained in all publications are solely those of the individual author(s) and contributor(s) and not of MDPI and/or the editor(s). MDPI and/or the editor(s) disclaim responsibility for any injury to people or property resulting from any ideas, methods, instructions or products referred to in the content.