
Graphitic Carbon Nitride/CeO2 Nanocomposite for Photocatalytic Degradation of Methyl Red

 , , ,
, , ,  and
and
Abstract
1. Introduction
2. Materials and Methods
2.1. Materials
2.2. Synthesis of Cerium Oxide Nanoparticles
2.3. Synthesis of Graphitic Carbon Nitride
2.4. Synthesis of Graphitic Carbon Nitride-Loaded CeO2 Nanocomposite
2.5. Graphitic Carbon Nitride-Loaded CeO2 Nanocomposite Characterizations
2.6. Photocatalytic Degradation of Methyl Red Dye
3. Results and Discussion
3.1. Characterization of CeO2/GCN Nanocomposite
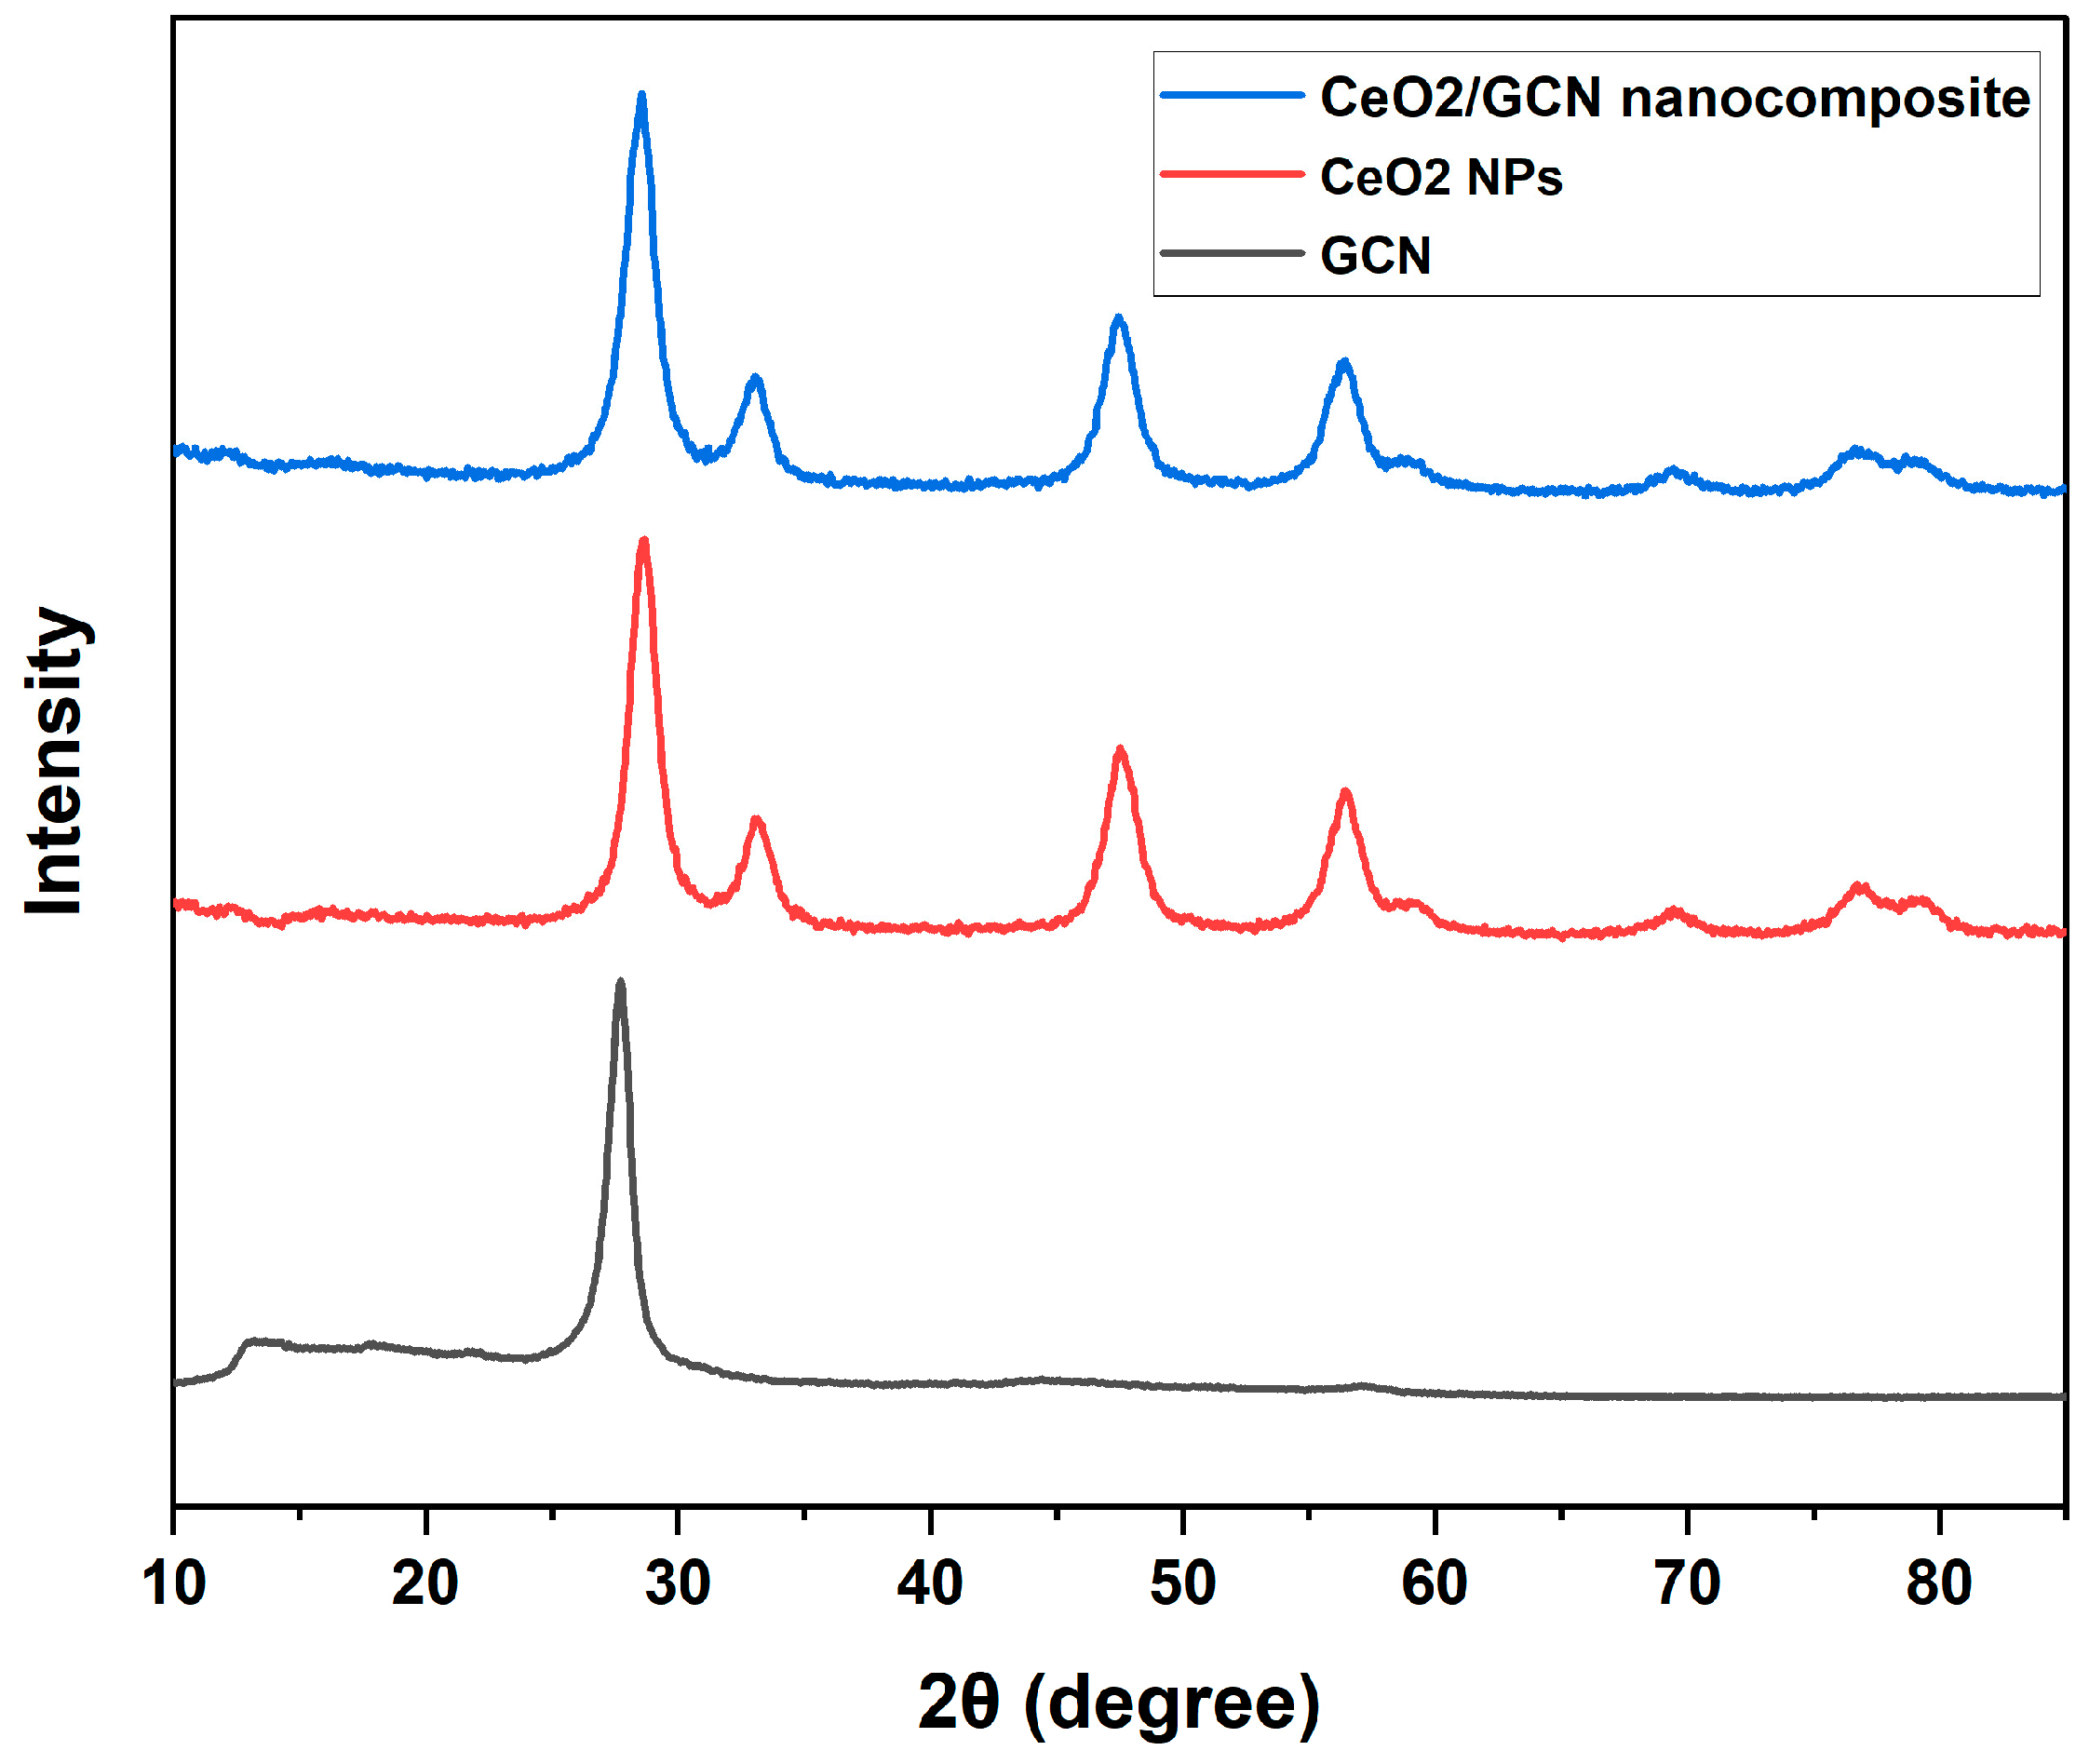
3.1.1. X-Ray Diffraction (XRD) Analysis
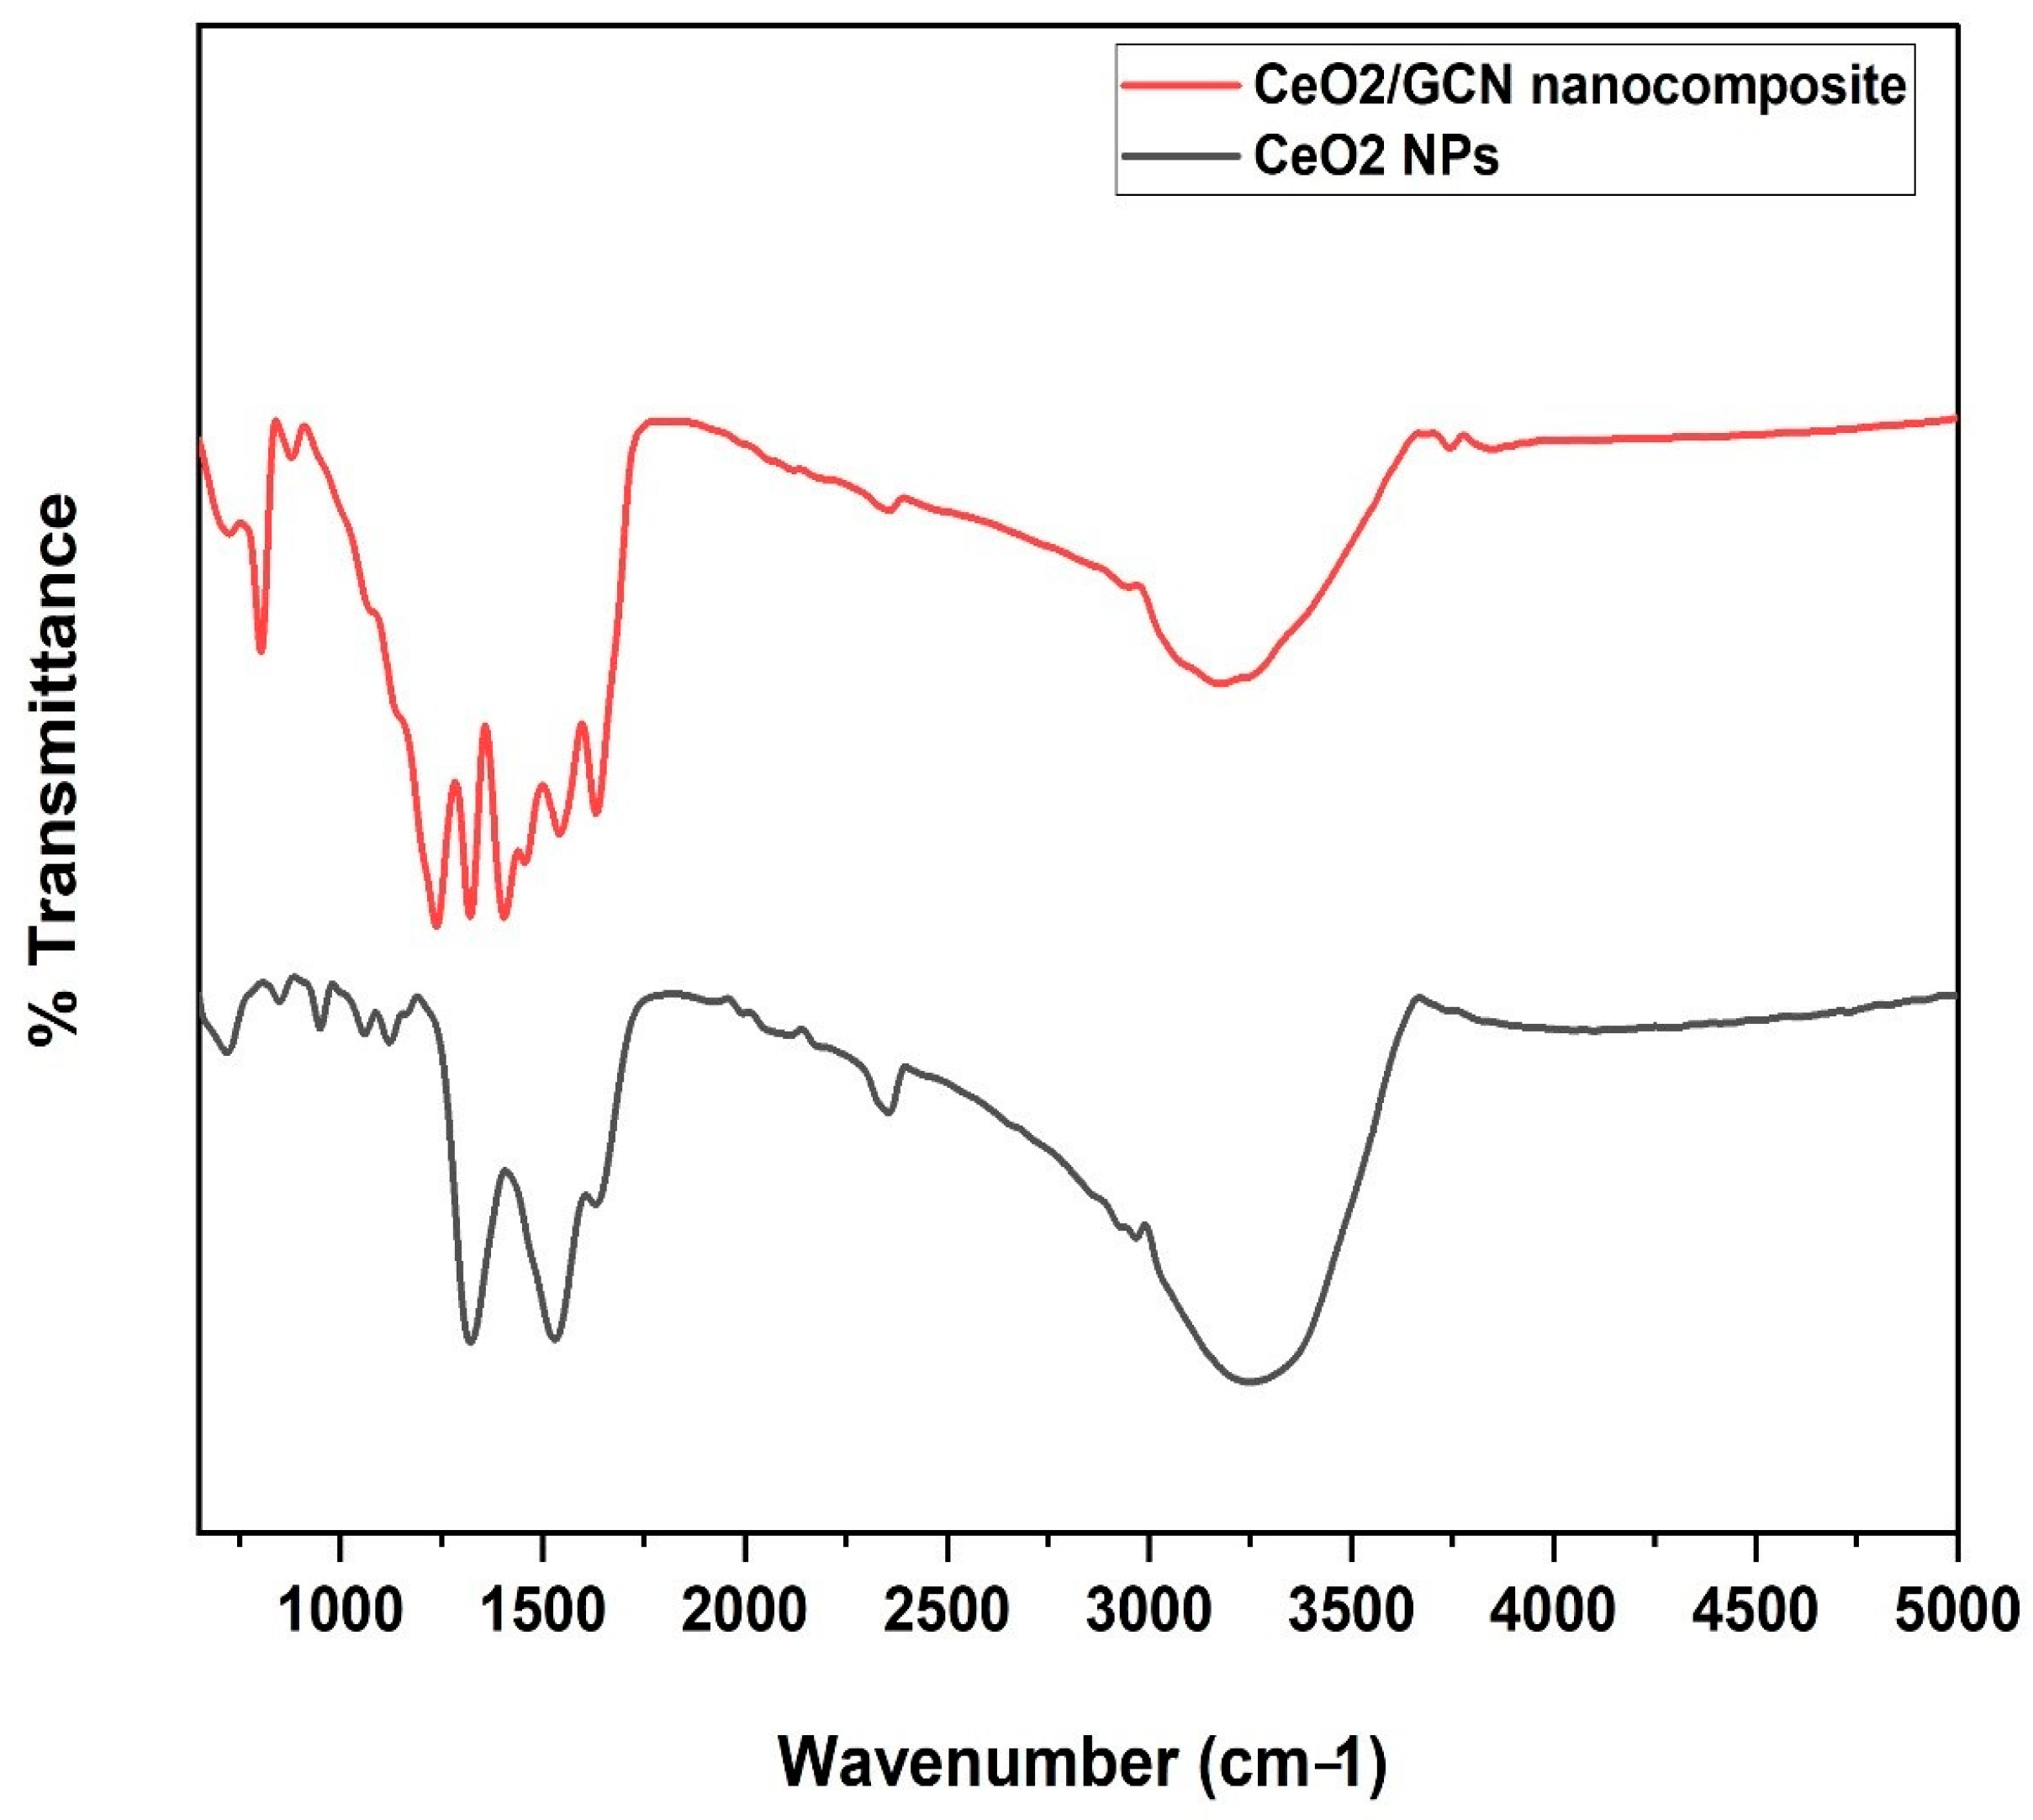
3.1.2. Fourier Transform Infrared (FTIR) Spectrometer
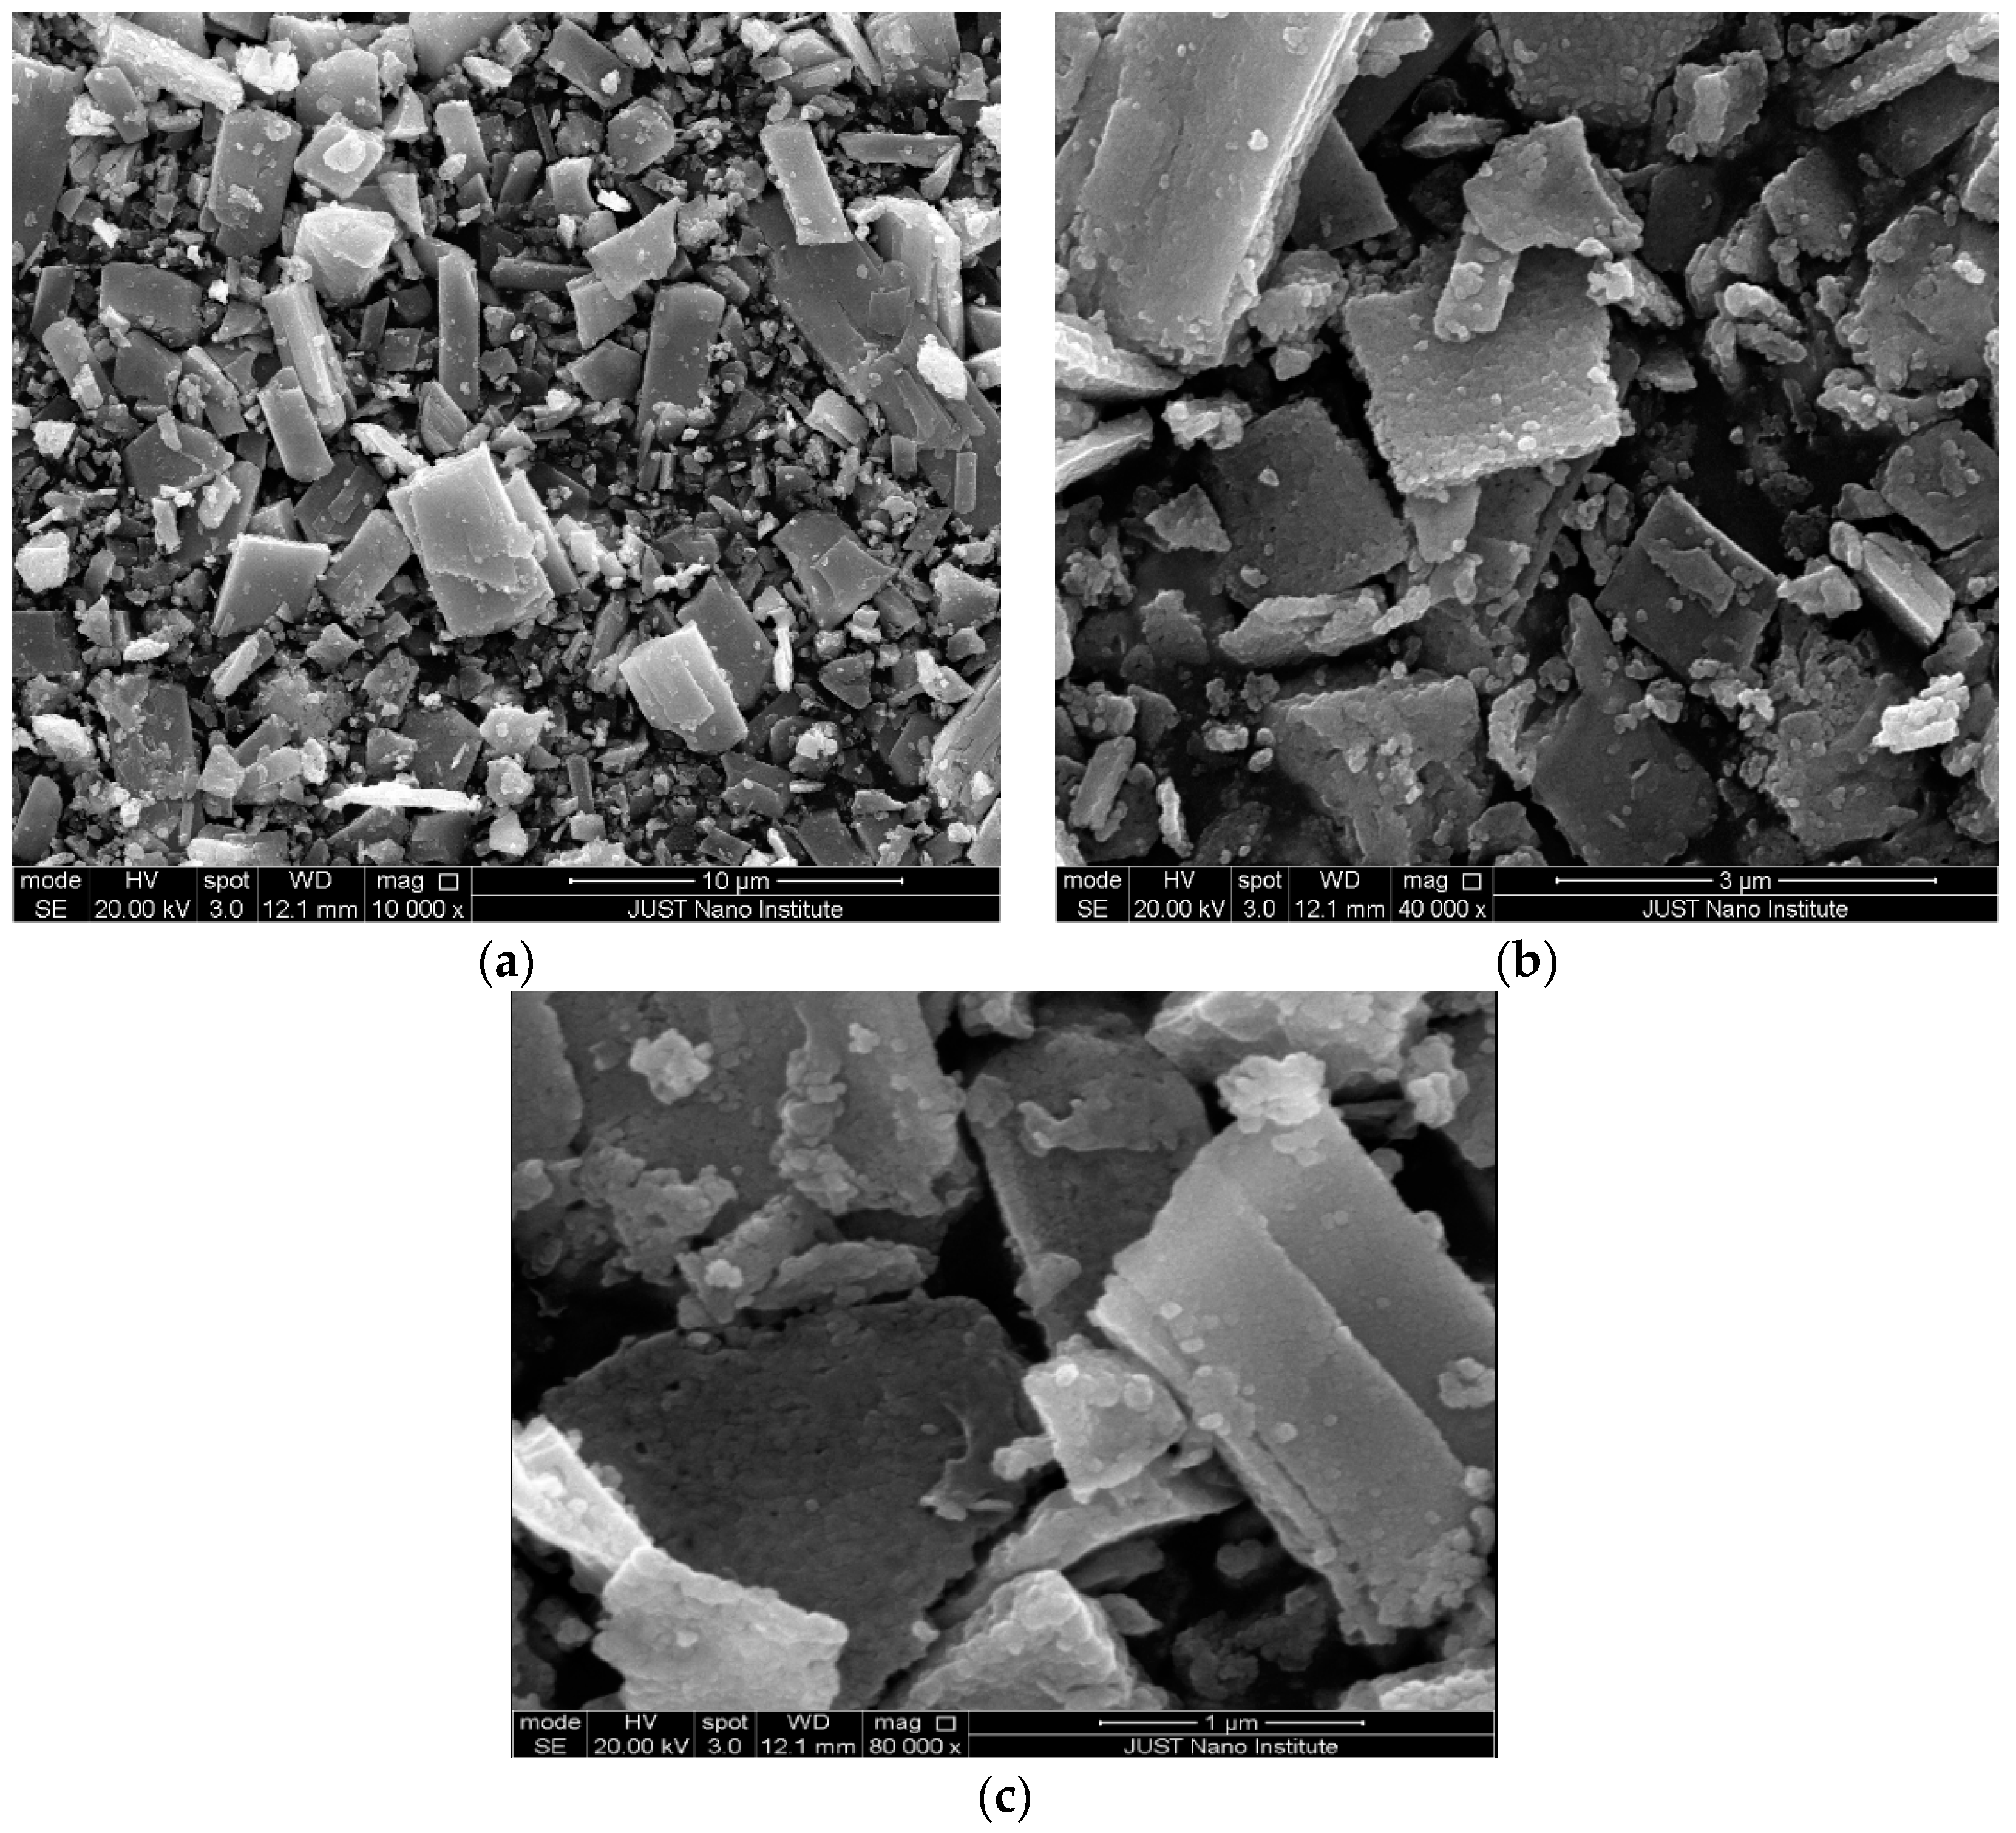
3.1.3. Scanning Electron Microscope (SEM)
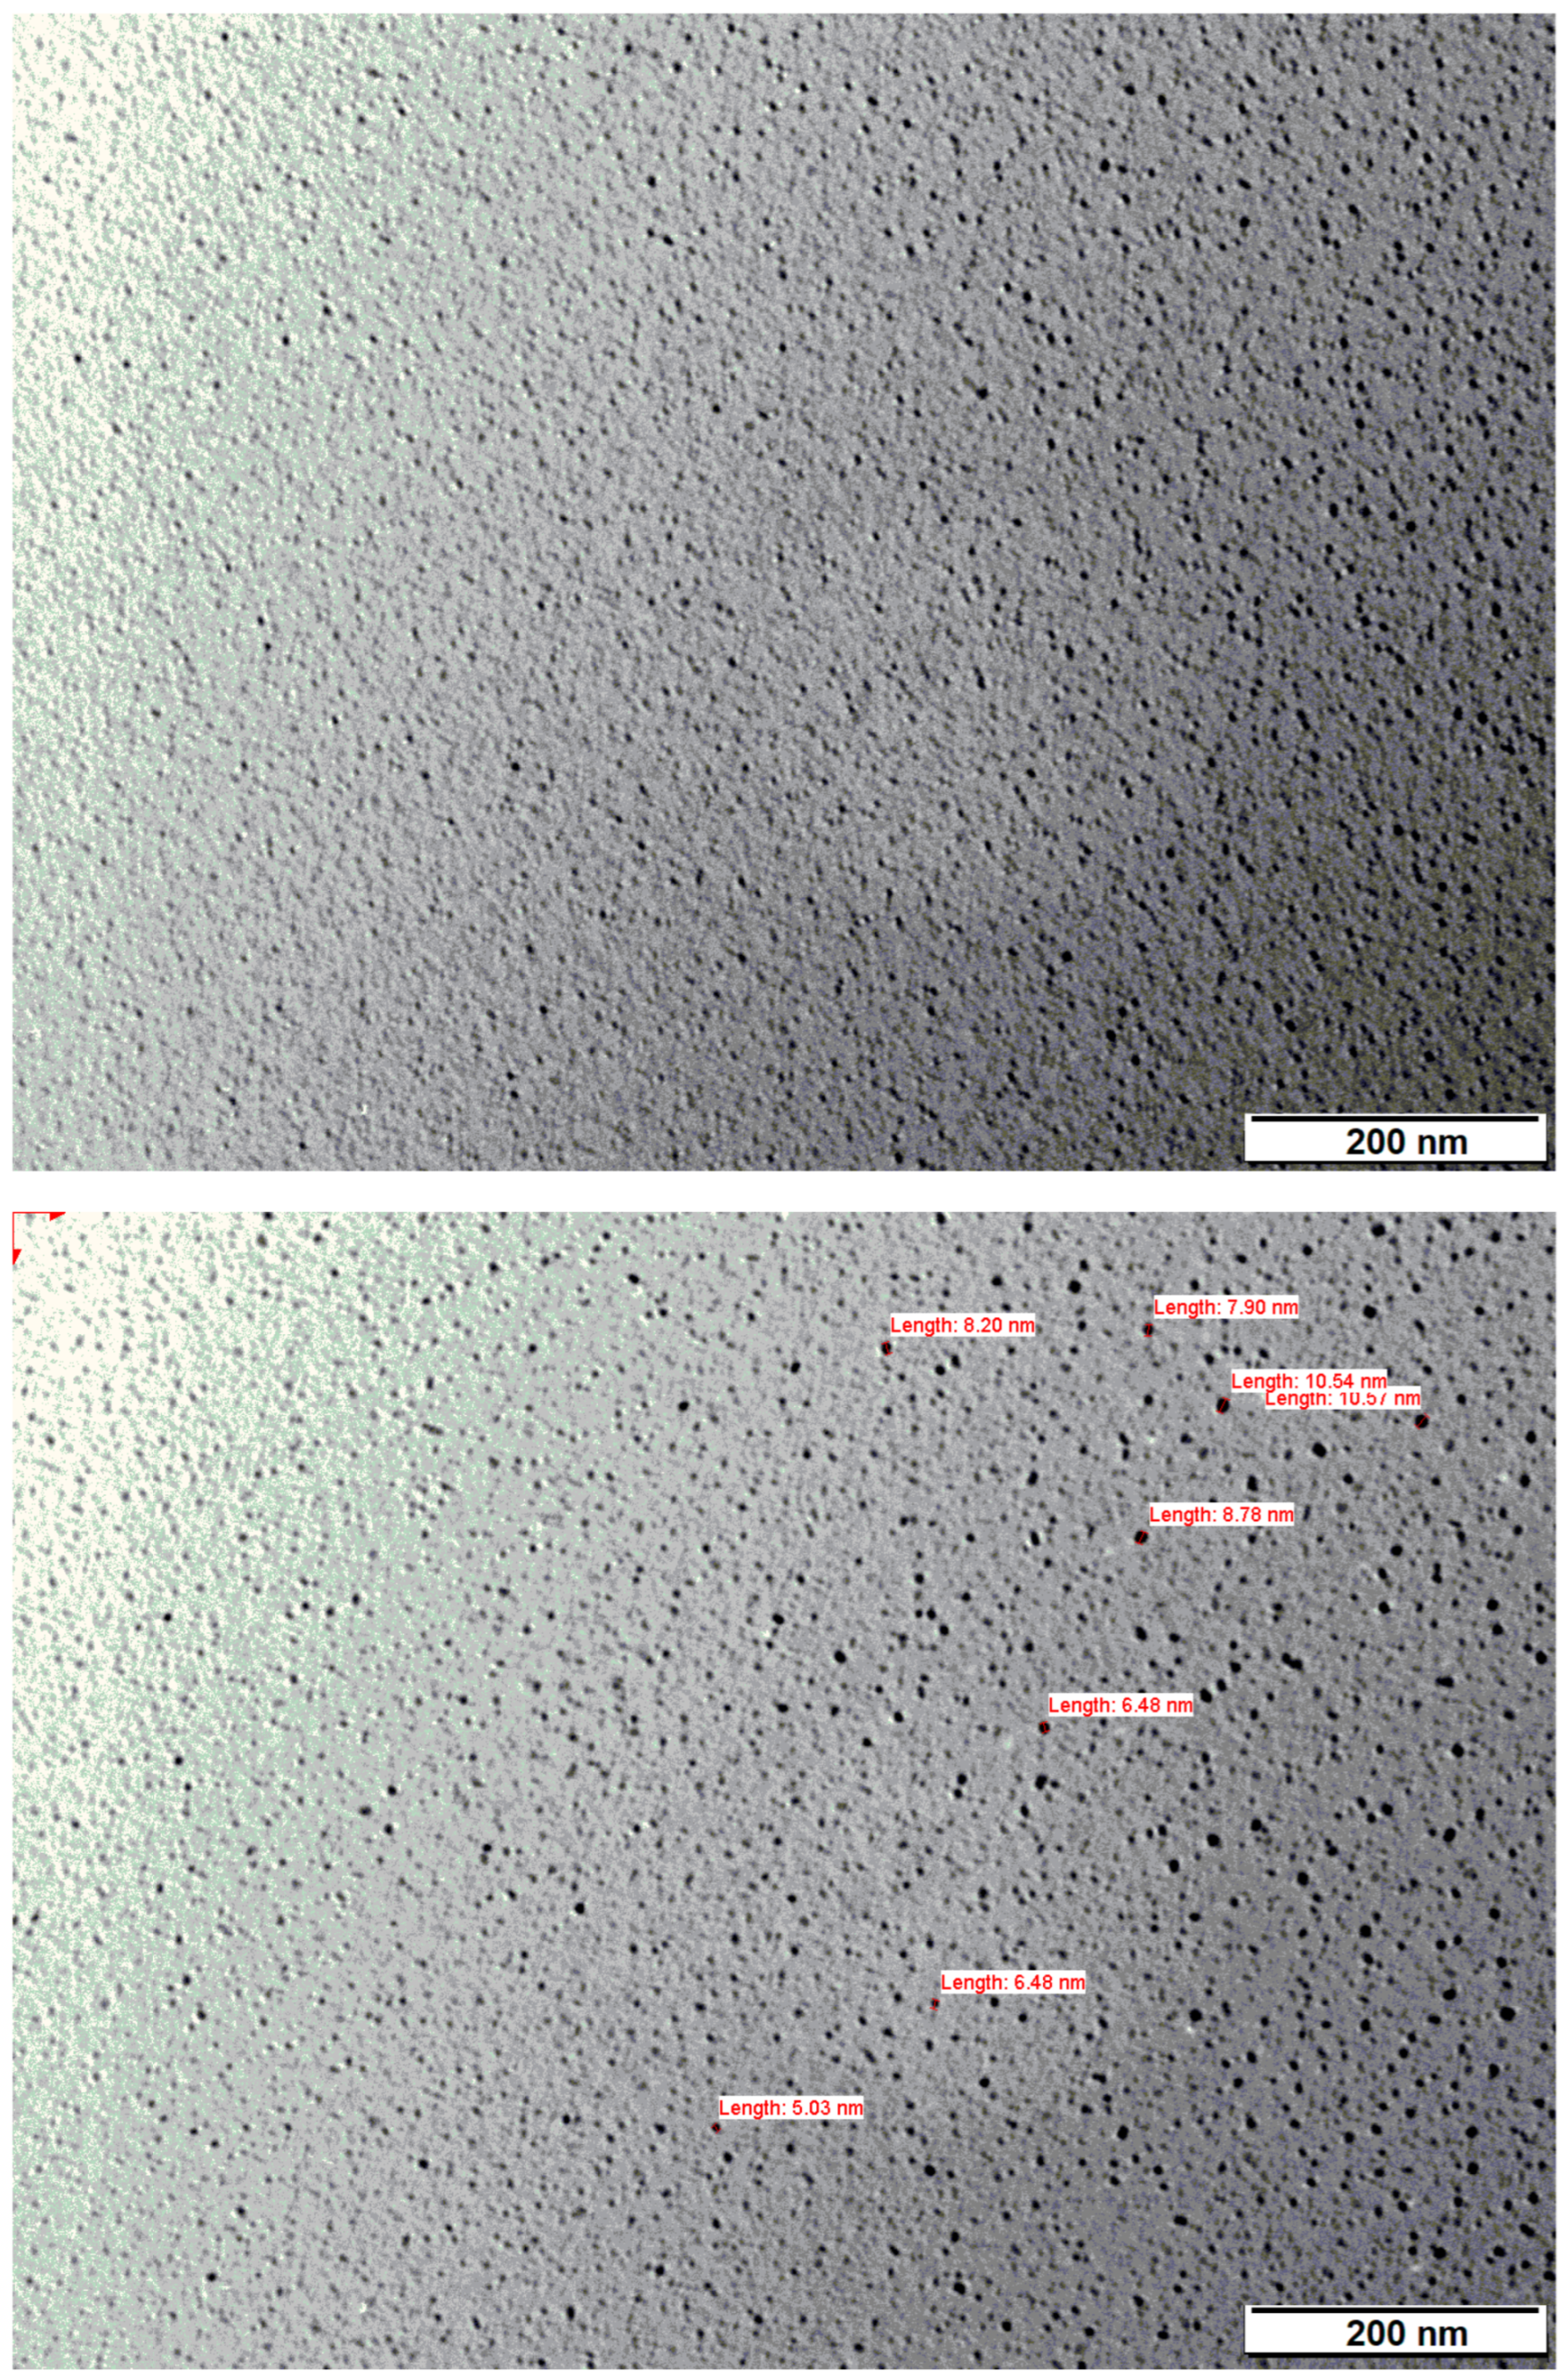
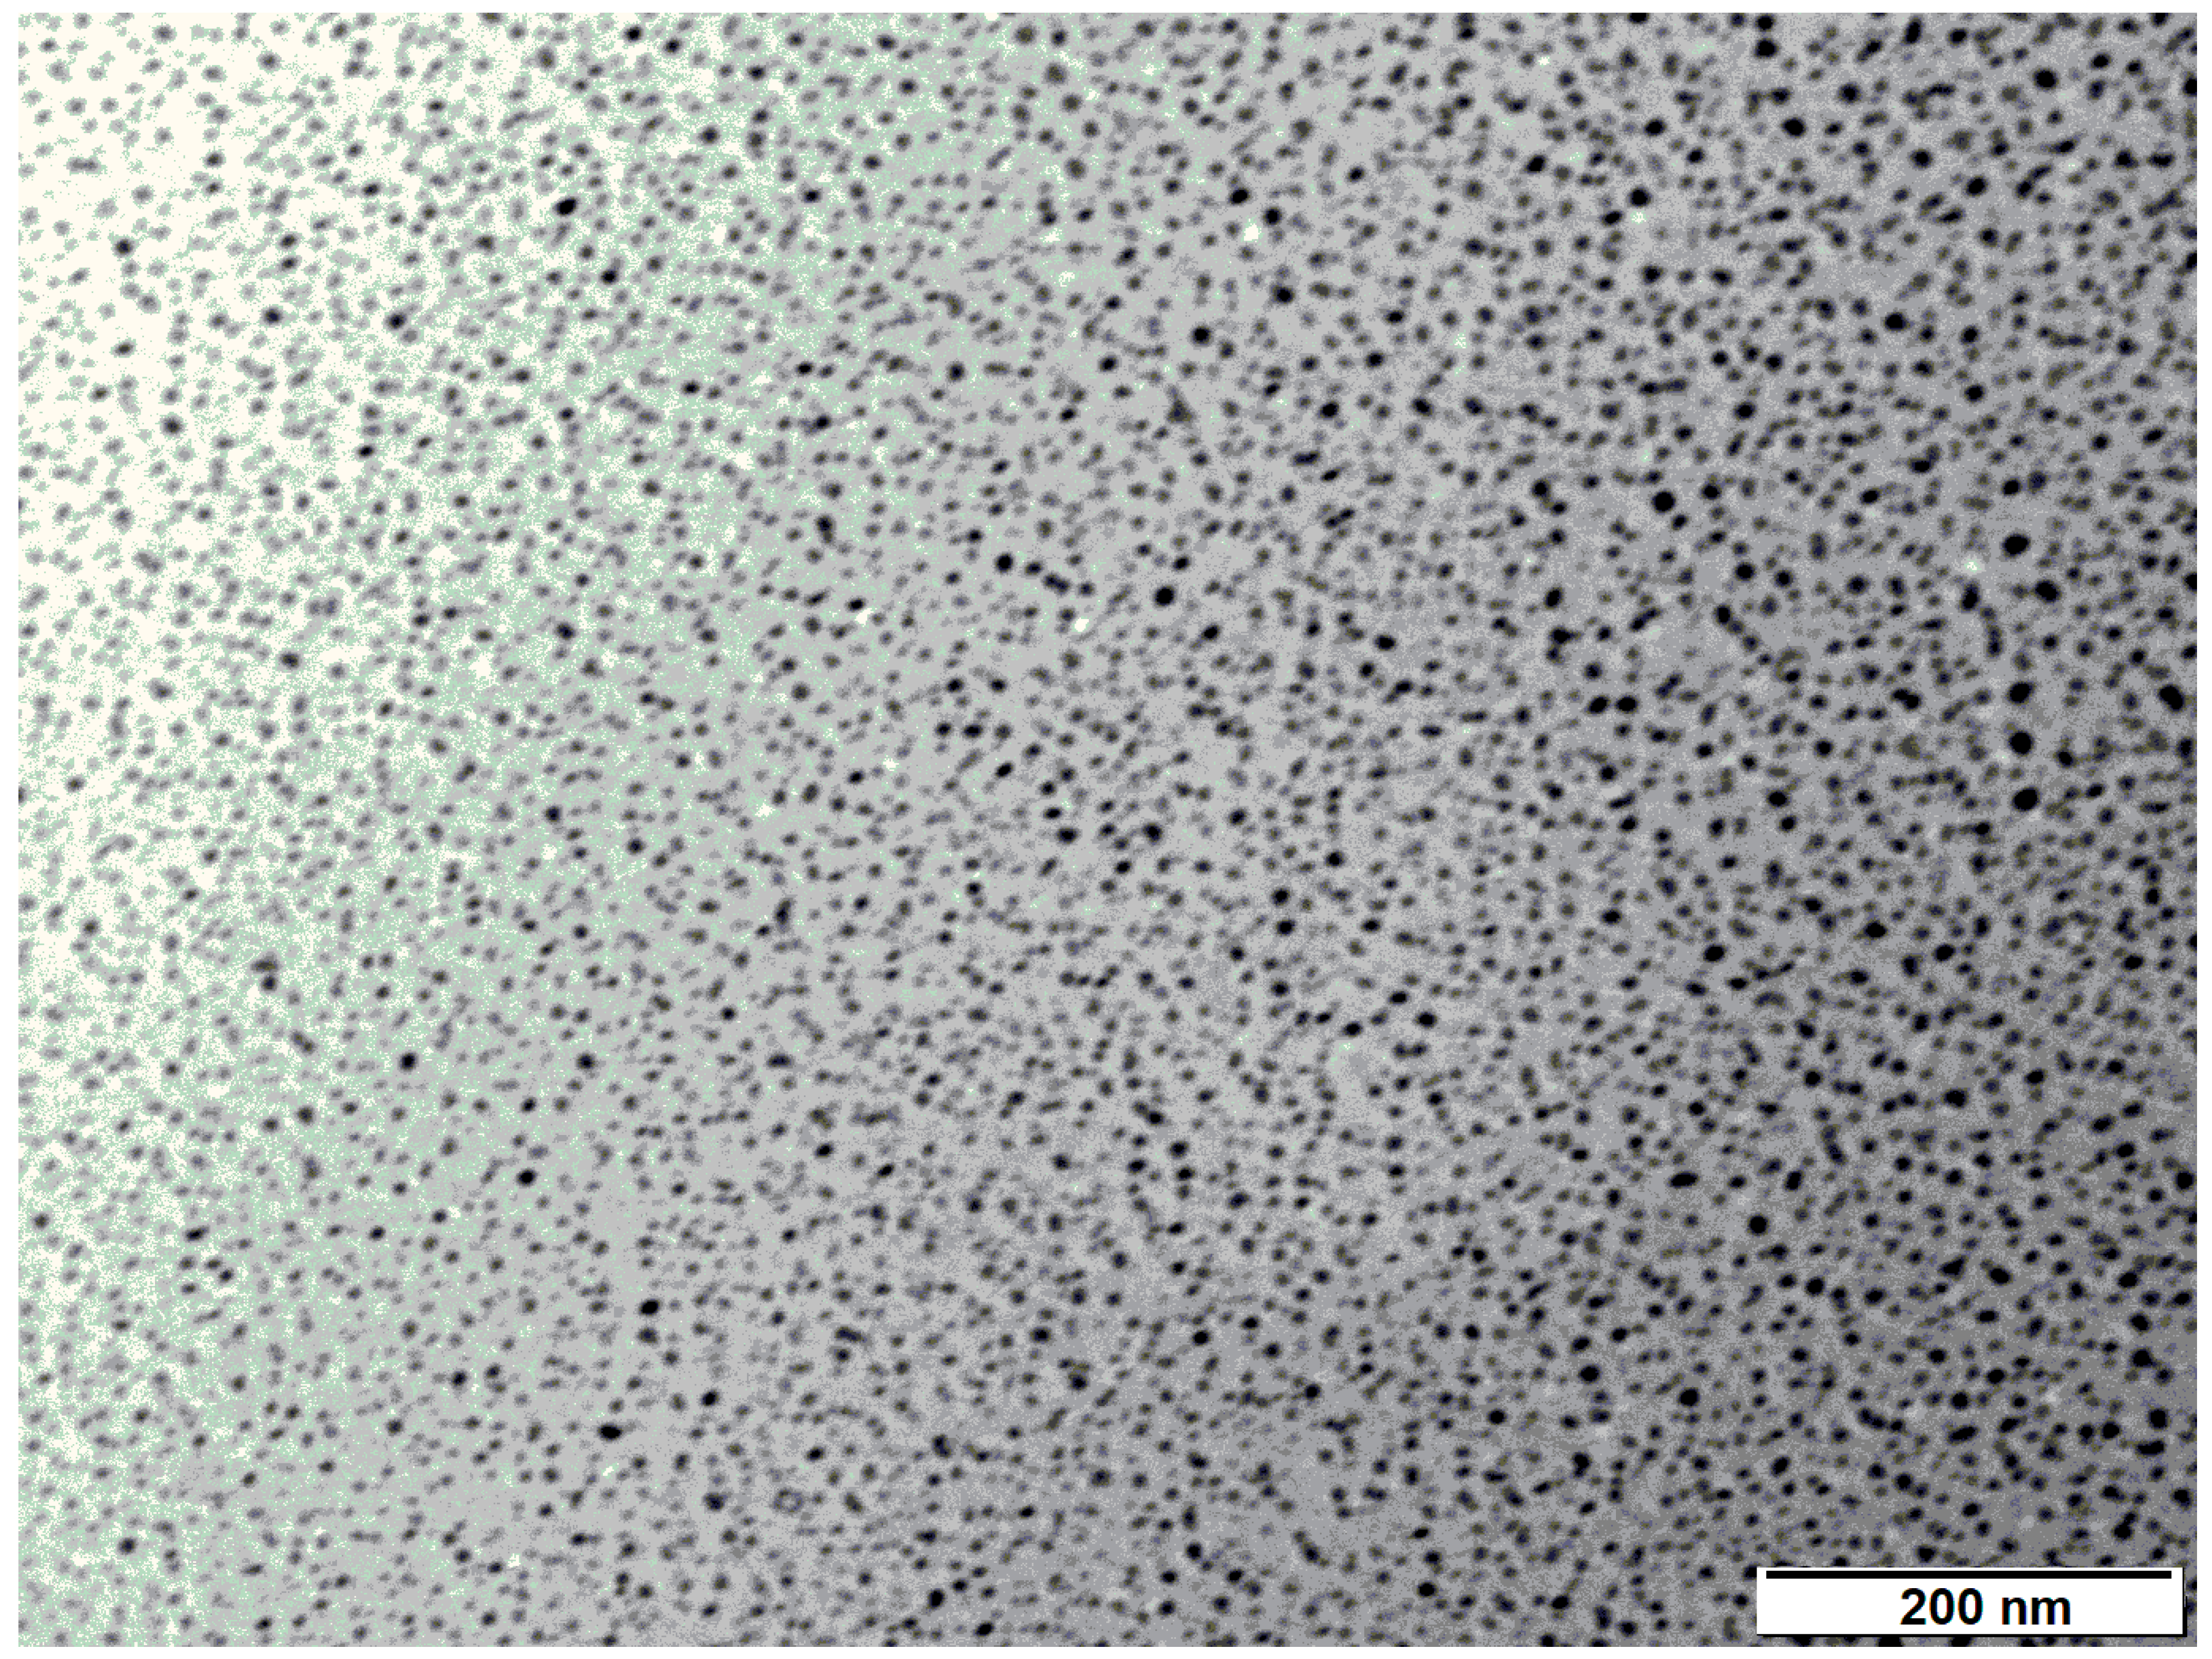
3.1.4. Transmission Electron Microscopy (TEM)
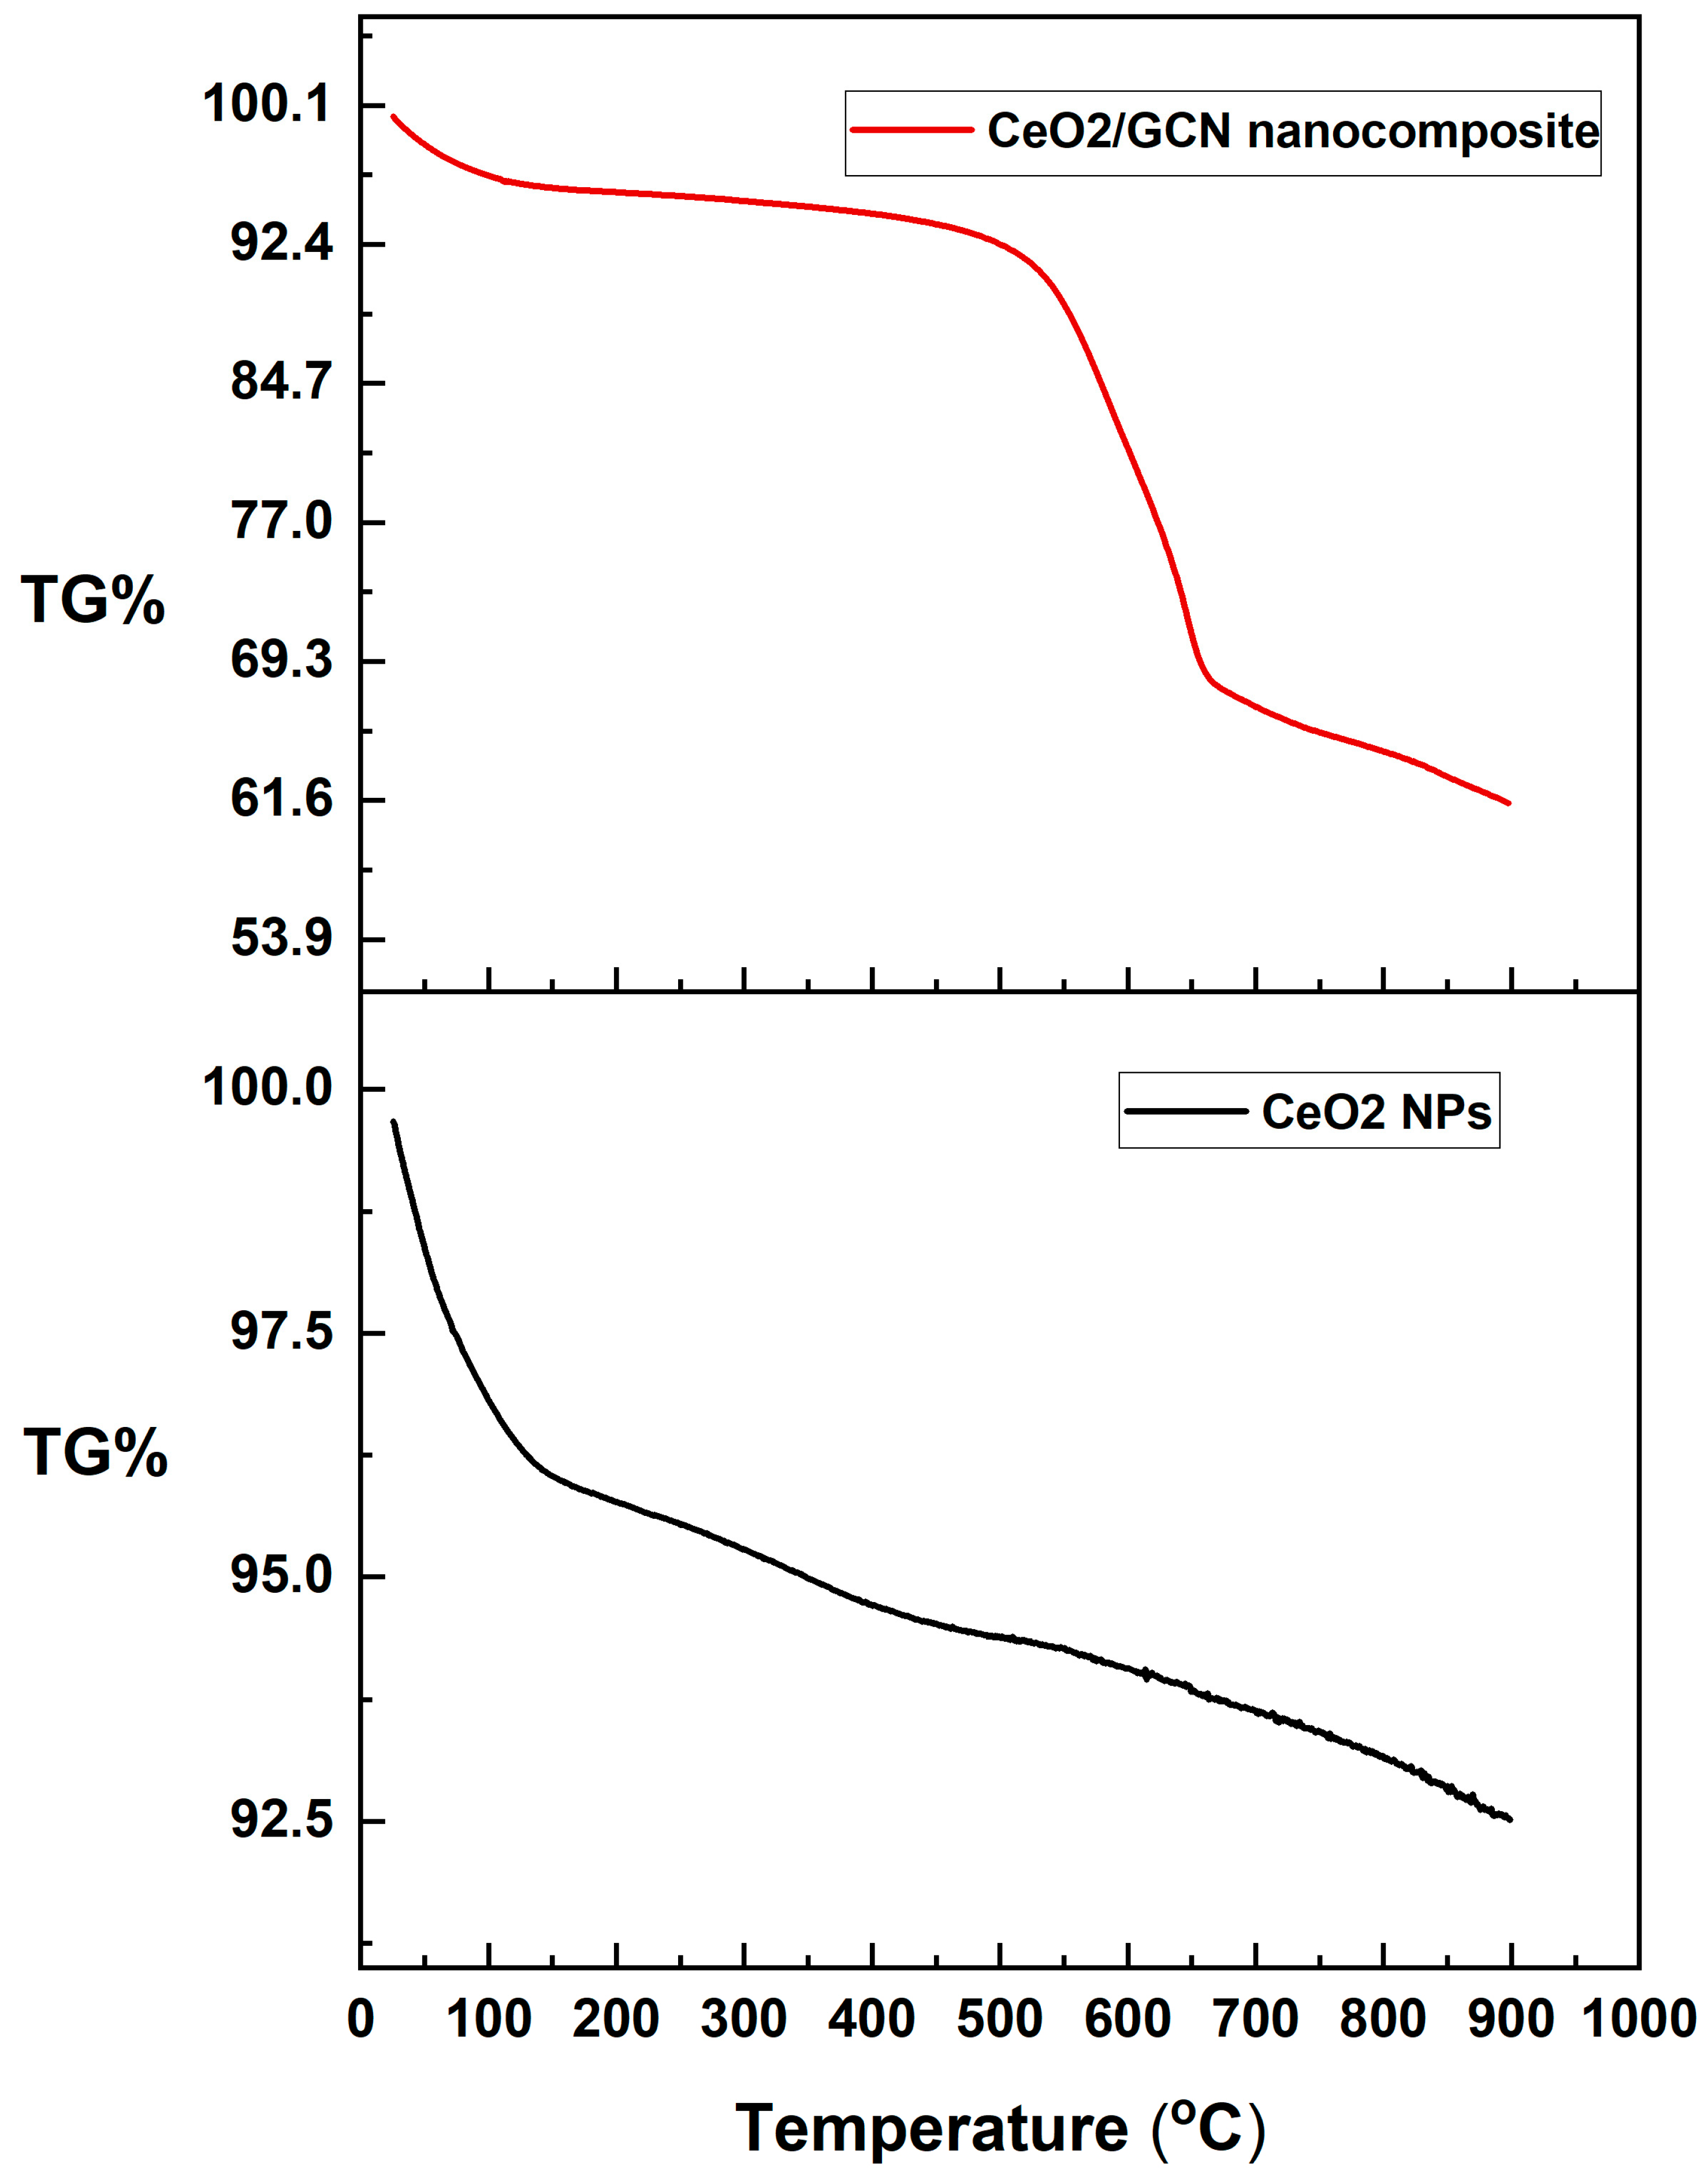
3.1.5. Thermogravimetric Analysis (TGA)
3.1.6. BET Surface Area Analysis
3.2. Photocatalytic Degradation Analysis
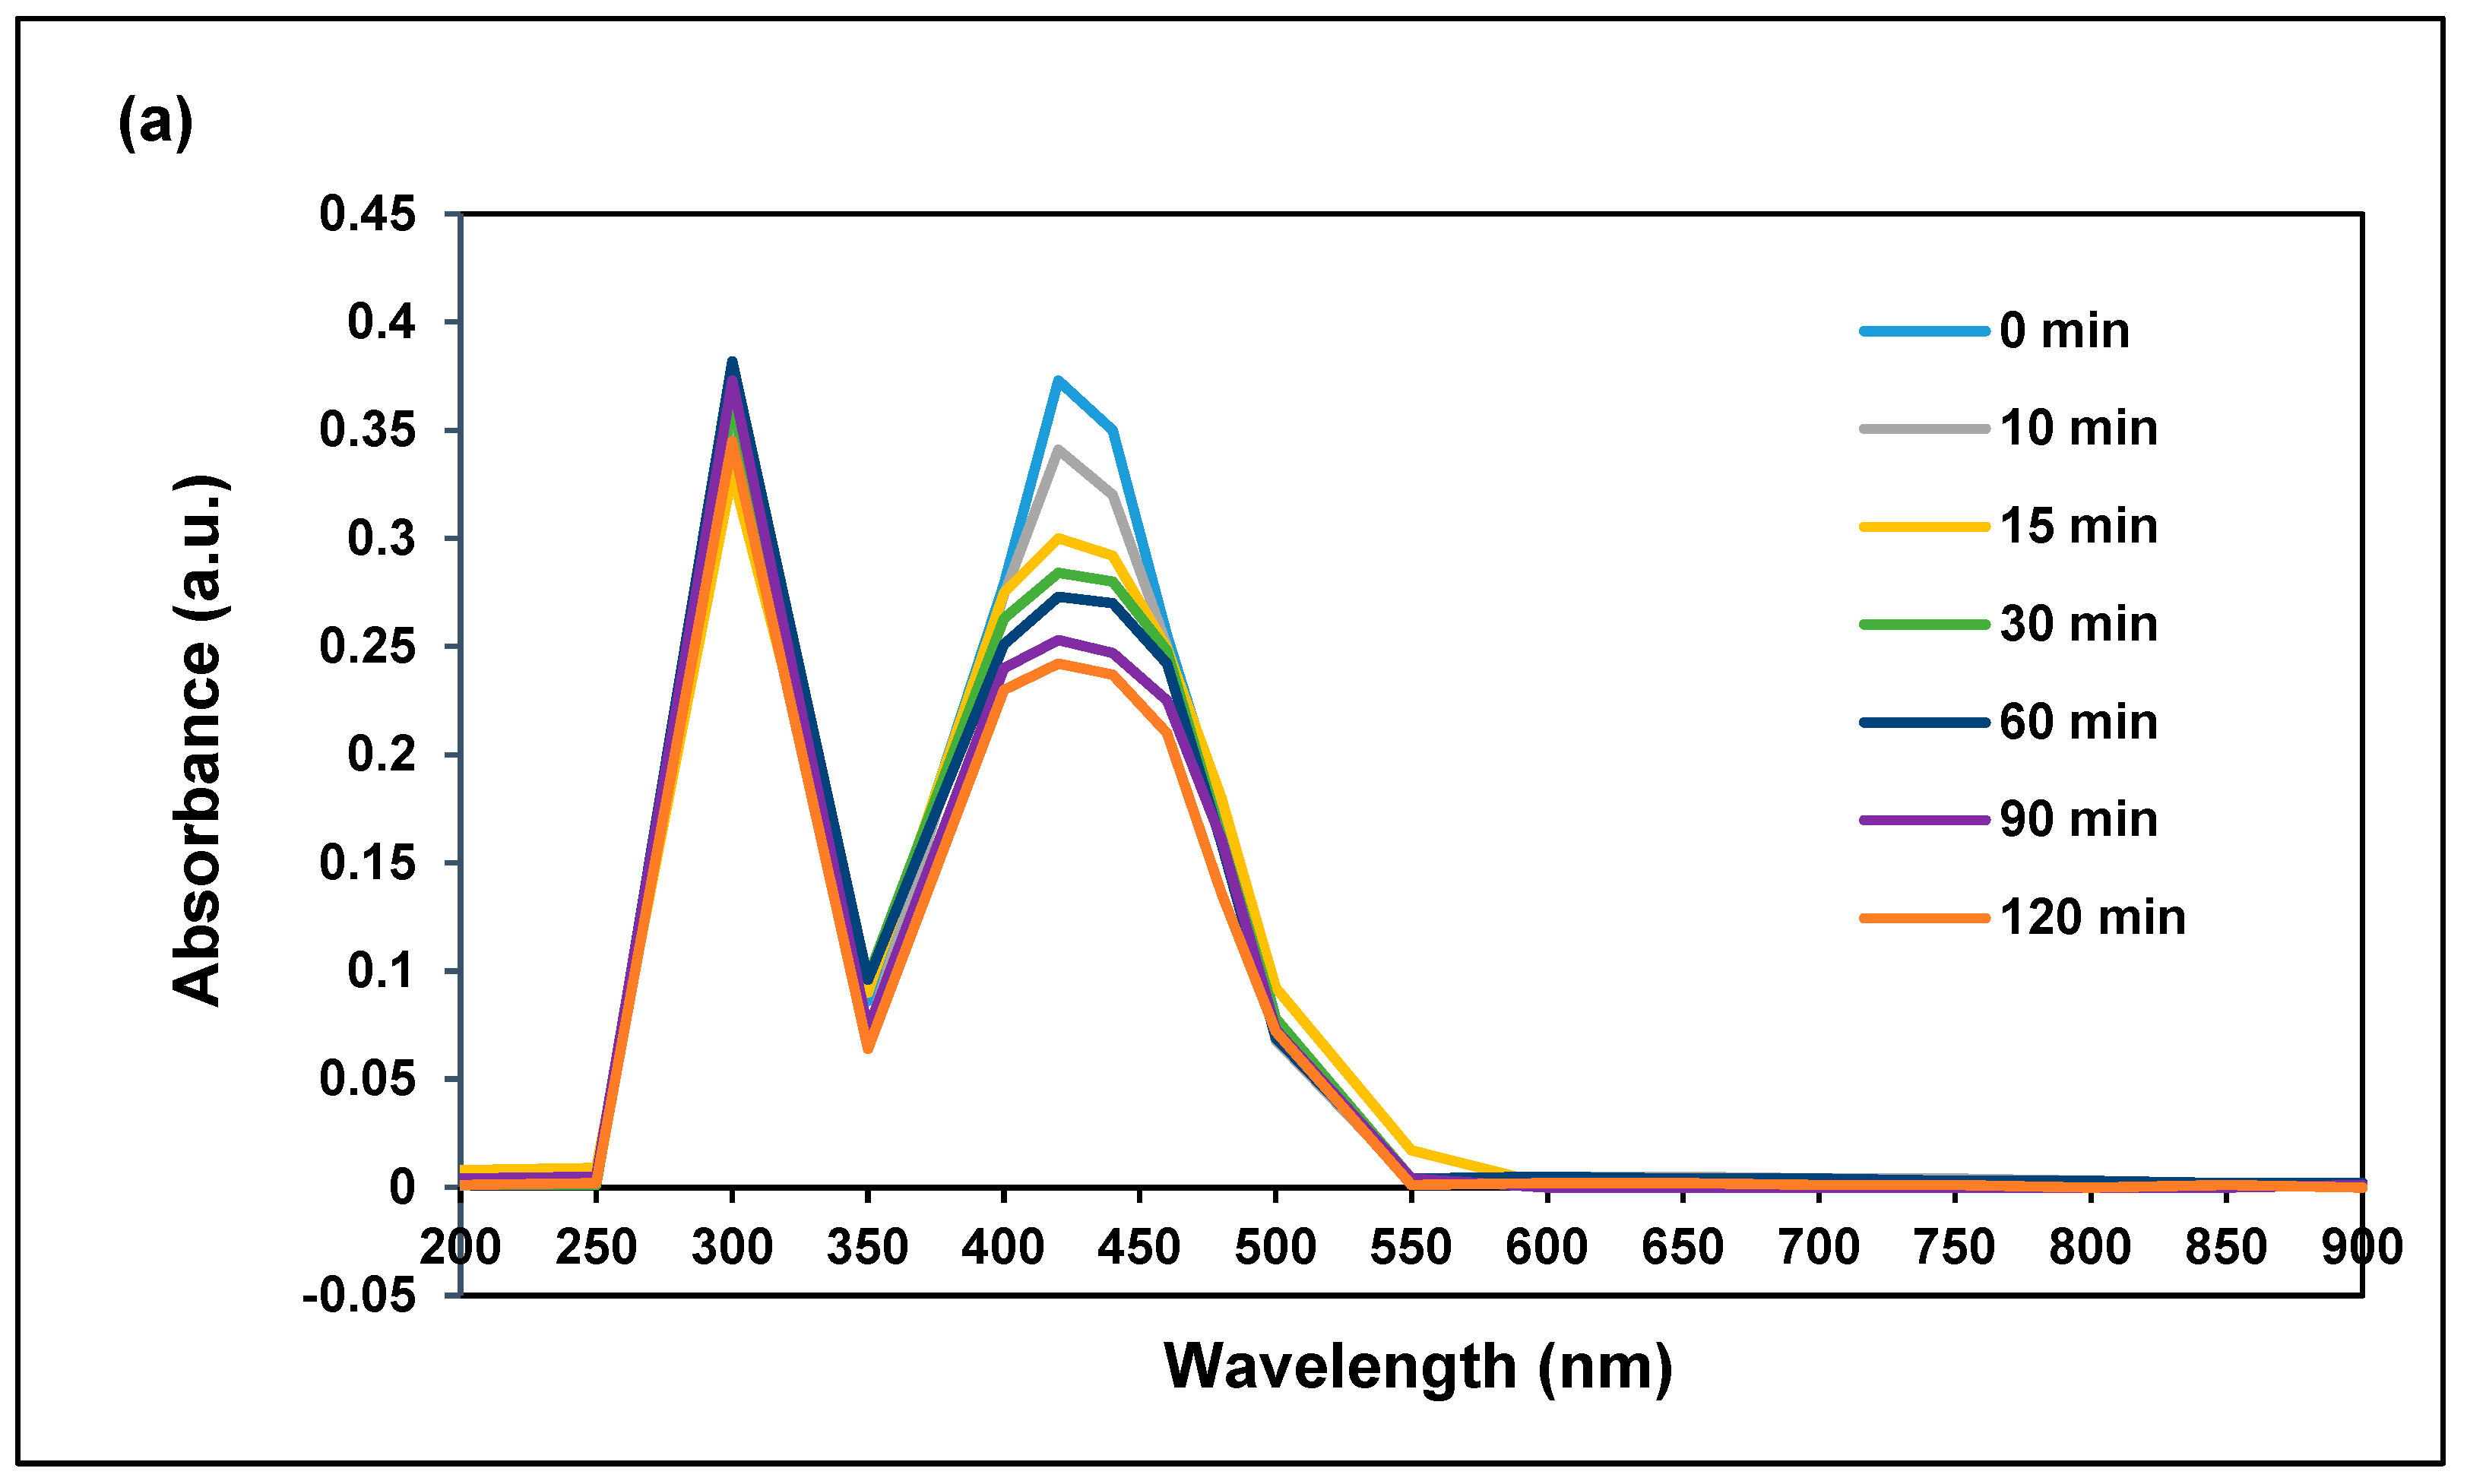
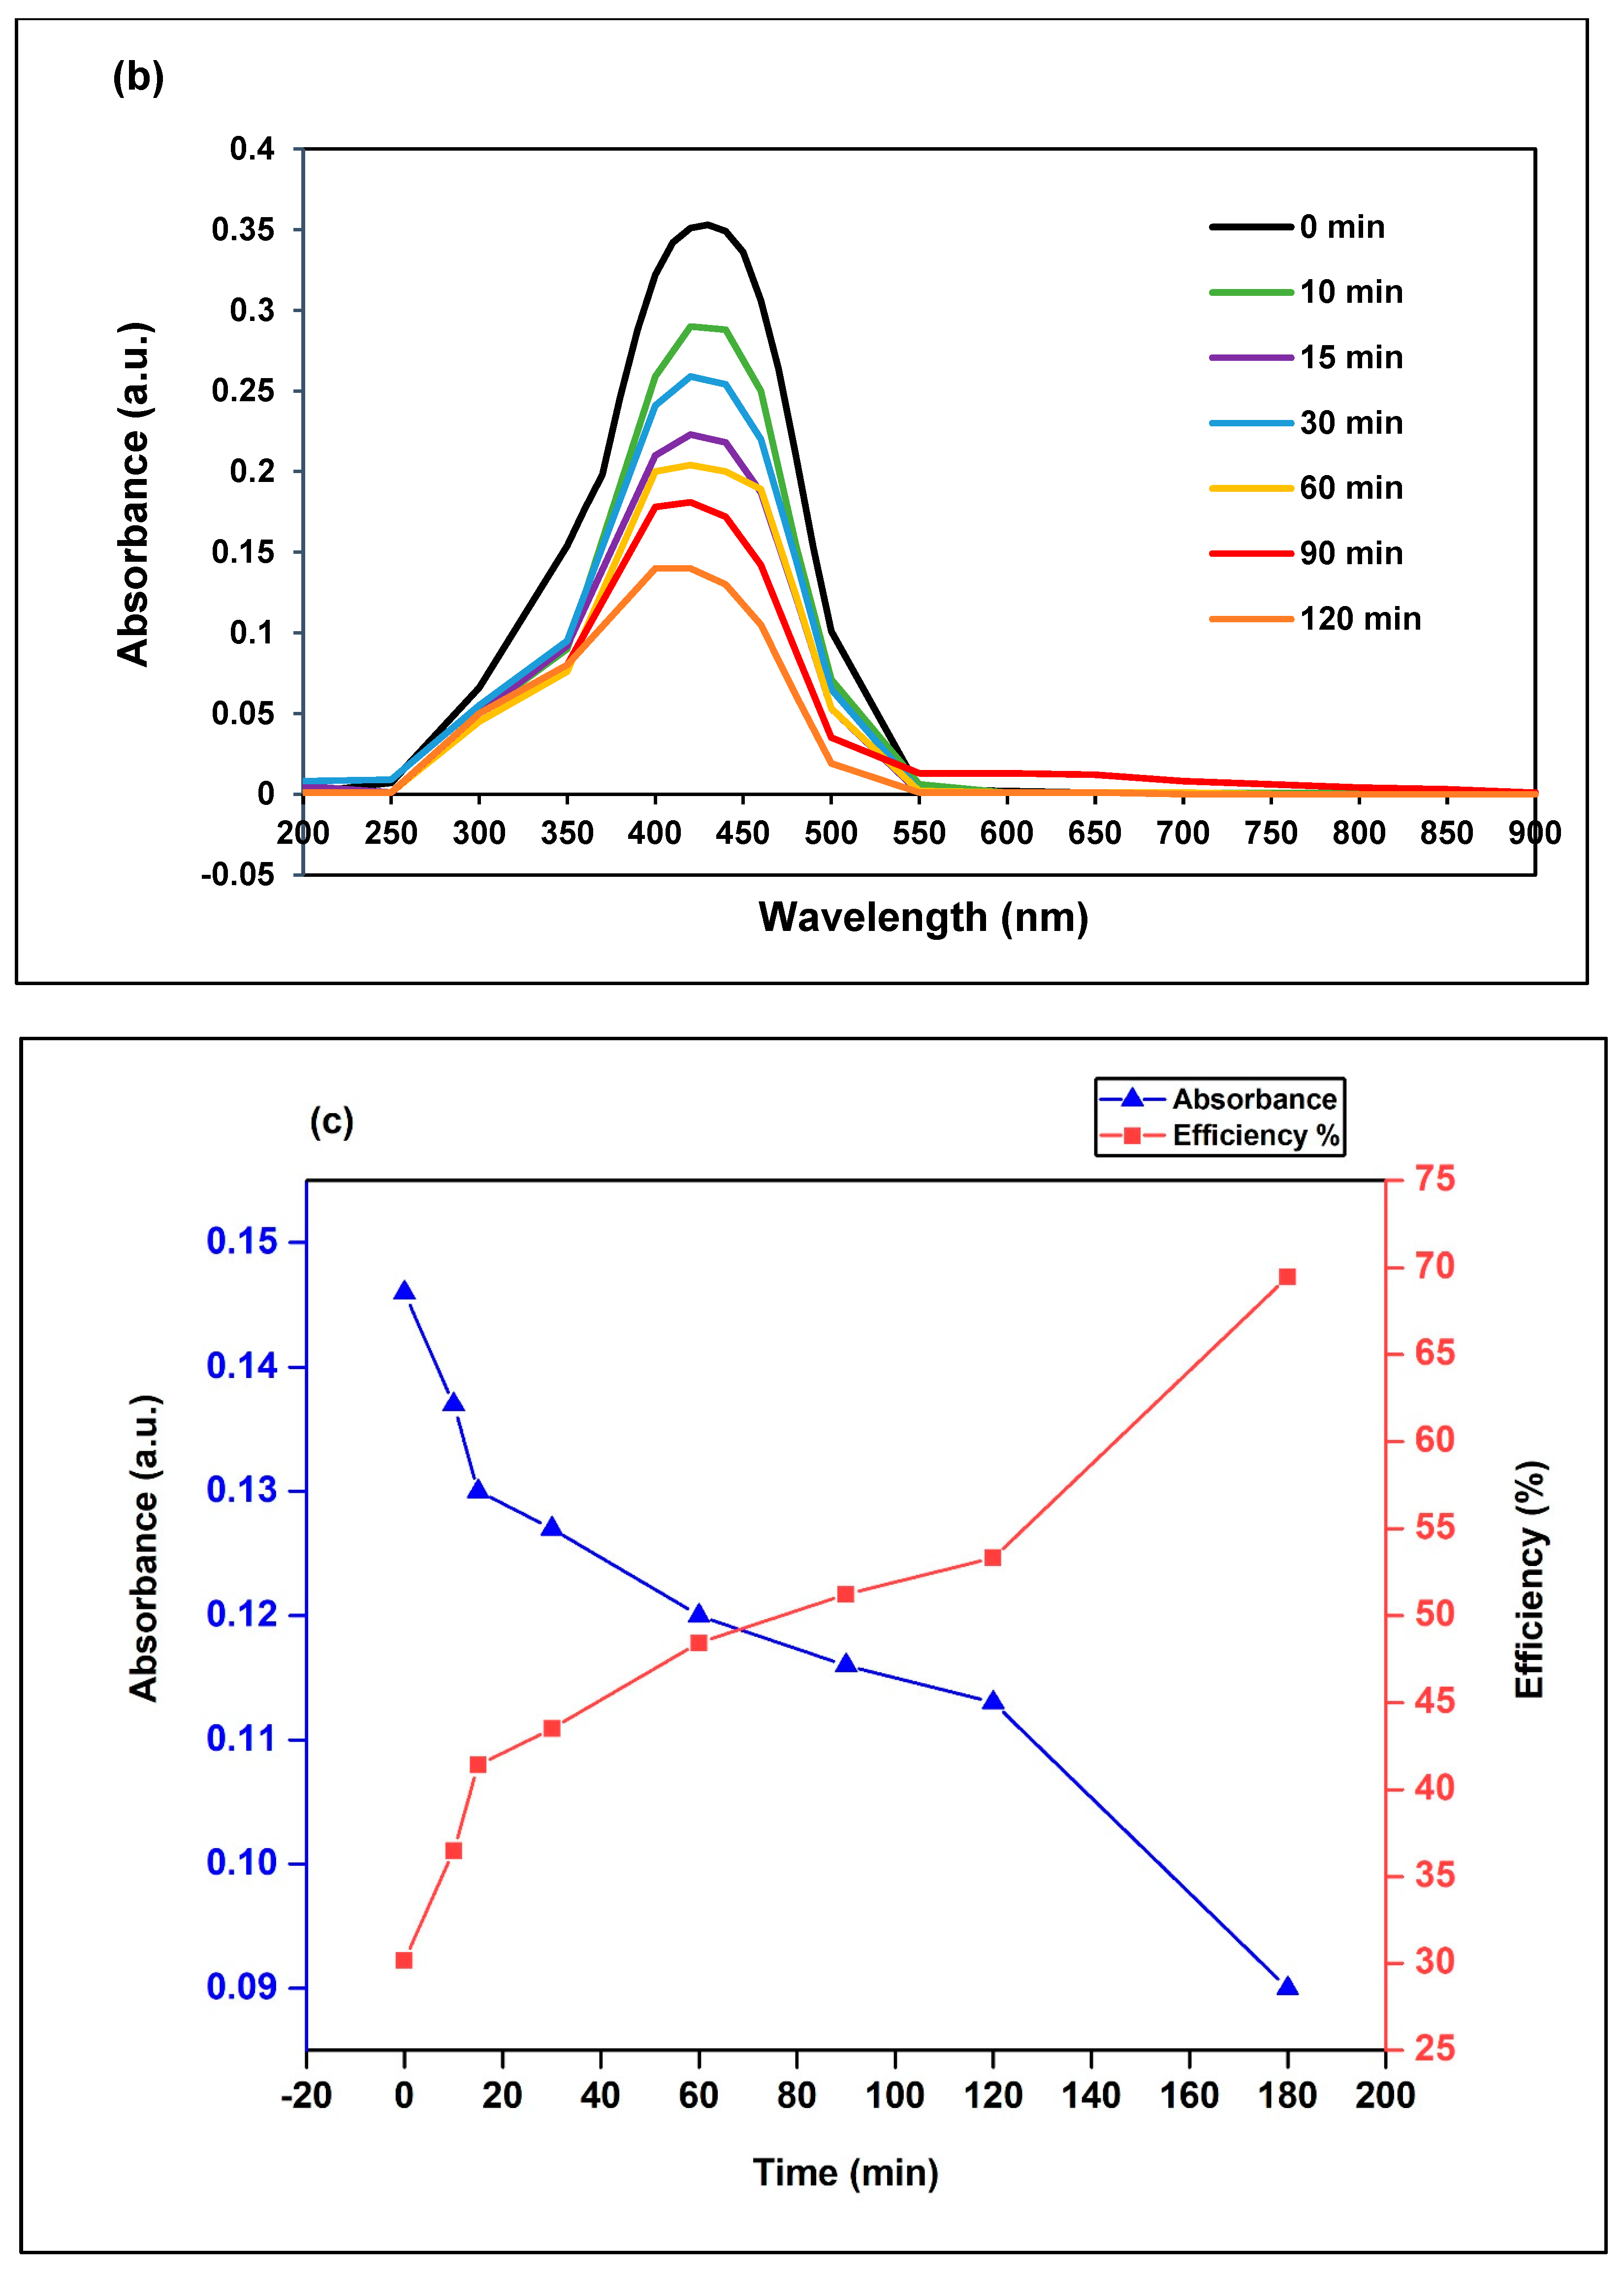
3.2.1. Effect of Irradiation Time
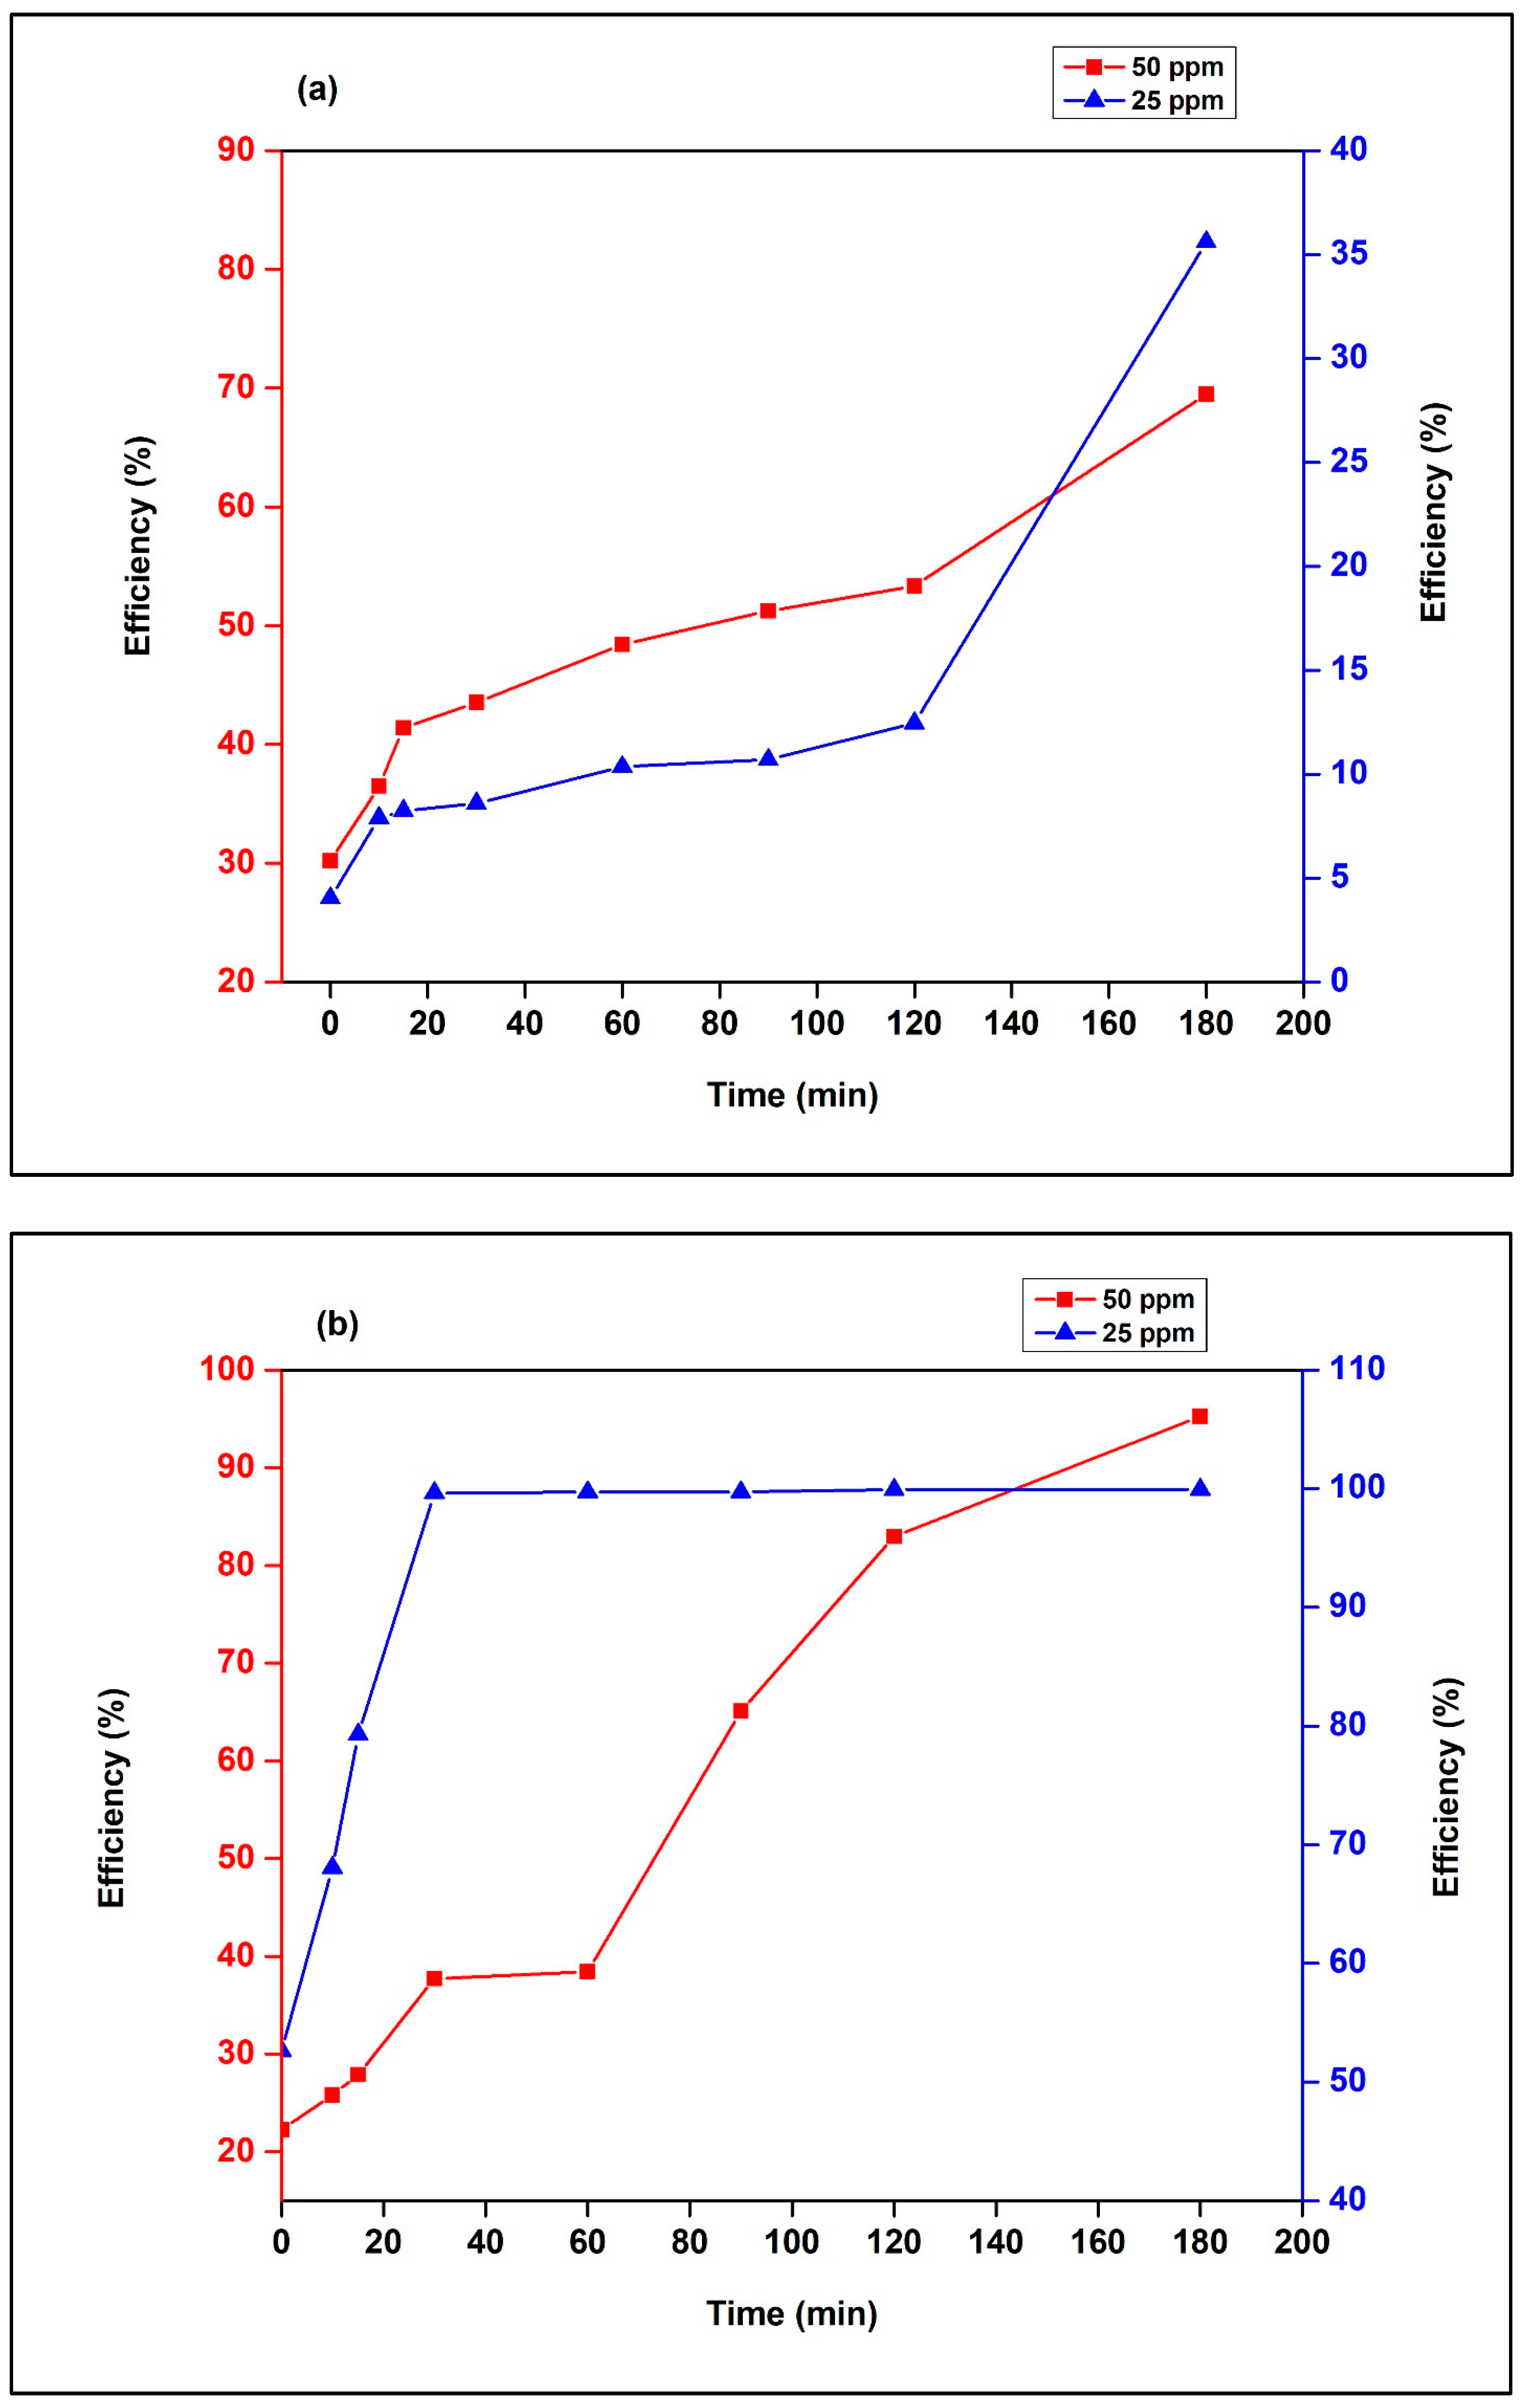
3.2.2. Effect of MR Dye Initial Concentration
4. Conclusions
Author Contributions
Funding
Data Availability Statement
Acknowledgments
Conflicts of Interest
References
- Ali, H. Biodegradation of synthetic dyes—A review. Water Air Soil. Pollut. 2010, 213, 251–273. [Google Scholar] [CrossRef]
- Ali, A.; Chowdhury, Z.; Devnath, R.; Ahmed, M.; Rahman, M.; Khalid, K.; Wahab, Y.; Badruddin, I.; Kamangar, S.; Hussien, M.; et al. Removal of azo dyes from aqueous effluent using bio-based activated carbons: Toxicity aspects and environmental impact. Separations 2023, 10, 506. [Google Scholar] [CrossRef]
- Kumar, S.; Sharma, P.; Kumar, A. Recent advances in azo dye removal from wastewater: A review. Environ. Sci. Pollut. Res. 2023, 30, 12345–12367. [Google Scholar]
- Chung, K. Azo dyes and human health: A review. J. Environ. Sci. Health C Environ. Carcinog. Ecotoxicol. Rev. 2016, 34, 233–261, Erratum in J. Environ. Sci. Health C. Environ. Carcinog. Ecotoxicol Rev. 2017, 35, 67. [Google Scholar] [CrossRef] [PubMed]
- Cerniglia, C.; Freeman, J.; Franklin, W.; Pack, L. Metabolism of azo dyes derived from benzidine, 3,3′-dimethylbenzidine, and 3,3′-dimethoxybenzidine to potentially carcinogenic aromatic amines by intestinal bacteria. Carcinogenesis 1982, 3, 1255–1260. [Google Scholar] [CrossRef] [PubMed]
- Vaiano, V.; De Marco, I. Removal of azo dyes from wastewater through heterogeneous photocatalysis and supercritical water oxidation. Separations 2023, 10, 230. [Google Scholar] [CrossRef]
- Alsukaibi, A. Various approaches for the detoxification of toxic dyes in wastewater. Processes 2022, 10, 1968. [Google Scholar] [CrossRef]
- Selvaraj, V.; Swarna, Karthika, T.; Mansiya, C.; Alagar, M. An overview on recently developed techniques, mechanisms and intermediates involved in the advanced azo dye degradation for industrial applications. J. Mol. Struct. 2021, 1224, 128805. [Google Scholar] [CrossRef]
- Al-Tohamy, R.; Ali, S.; Li, F.; Okasha, K.; Mahmoud, Y.A.-G.; Elsamahy, T.; Jiao, H.; Fu, Y.; Sun, J. A critical review on the treatment of dye-containing wastewater: Ecotoxicological and health concerns of textile dyes and possible remediation approaches for environmental safety. Ecotoxicol. Environ. Saf. 2022, 231, 113160. [Google Scholar] [CrossRef] [PubMed]
- Khan, A.; Ju, P.; Han, Z.; Ni, C. A comprehensive review on adsorptive removal of azo dyes using functional materials. AQUA-Water Infrastruct. Ecosyst. Soc. 2024, 73, 266–285. [Google Scholar] [CrossRef]
- Ashraf, S.; Rauf, M.; Alhadrami, S. Degradation of Methyl Red using Fenton’s reagent and the effect of various salts. Dye. Pigment. 2006, 69, 74–78. [Google Scholar] [CrossRef]
- Sharma, K.; Pandit, S.; Mathuriya, A.; Gupta, P.; Pant, K.; Jadhav, D. Microbial electrochemical treatment of Methyl Red dye degradation using co-culture method. Water 2023, 15, 56. [Google Scholar] [CrossRef]
- Chowdhury, A.P.; Anantharaju, K.S.; Keshavamurthy, K.; Rokhum, S.L. Recent advances in efficient photocatalytic degradation approaches for azo dyes. Hindawi J. Chem. 2023, 1, 9780955. [Google Scholar] [CrossRef]
- Kusmierek, E. A CeO2 Semiconductor as a Photocatalytic and Photoelectrocatalytic Material for the Remediation of Pollutants in Industrial Wastewater: A Review. Catalysts 2020, 10, 1435. [Google Scholar] [CrossRef]
- Du, Y.; Lu, D.; Liu, J.; Li, X.; Wu, C.; Wu, X.; An, X. Insight into the potential application of CuOx/CeO2 catalysts for NO removal by CO: A perspective from the morphology and crystal-plane of CeO2. New J. Chem. 2022, 46, 17313–17330. [Google Scholar] [CrossRef]
- Luo, N.; Fan, L.; Chen, Y.; Lan, W. Construction of Oxygen Vacancies of Zr-Doped CeO2 with Enhanced Dye Adsorption Performance. Crystals 2023, 13, 1641. [Google Scholar] [CrossRef]
- Watanabe, R.; Karasawa, F.; Yokoyama, C.; Oshima, K.; Kishida, M.; Hori, M.; Ono, Y.; Satokawa, S.; Verma, P.; Fukuhara, C. Highly Stable Fe/CeO2 Catalyst for the Reverse Water Gas Shift Reaction in the Presence of H2S. RSC Adv. 2023, 13, 11525–11529. [Google Scholar] [CrossRef]
- Dudek, M. Ceramic oxide electrolytes based on CeO2—Preparation, properties and possibility of application to electrochemical devices. J. Eur. Ceram. Soc. 2008, 28, 965–971. [Google Scholar] [CrossRef]
- Li, J.; Lu, Y.; Li, D.; Ma, L.; Qi, F.; Yu, L. Semiconductor Heterostructure Composite Materials of Fe2O3 and CeO2 for Low-Temperature Solid Oxide Fuel Cells. J. Mater. Sci. Mater. Electron. 2020, 31, 11825–11832. [Google Scholar] [CrossRef]
- Bi, Y.; Li, R.; Guo, F.; Zhu, C.; Pei, J. Photocatalytic purification of vehicle exhaust using CeO2–Bi2O3 loaded on white carbon and tourmaline. Environ. Sci. Pollut. Res. 2021, 28, 17724–17738. [Google Scholar] [CrossRef] [PubMed]
- Li, P.; Chen, X.; Li, Y.; Schwank, J.W. A review on oxygen storage capacity of CeO2-based materials: Influence factors, measurement techniques, and applications in reactions related to catalytic automotive emissions control. Catal. Today 2019, 327, 90–115. [Google Scholar] [CrossRef]
- Wang, X.; Wang, J.; Sun, Y.; Li, K.; Shang, T.; Wan, Y. Recent advances and perspectives of CeO2-based catalysts: Electronic properties and applications for energy storage and conversion. Front. Chem. 2022, 10, 1089708. [Google Scholar] [CrossRef] [PubMed]
- Li, Q.; Song, L.; Liang, Z.; Sun, M.; Wu, T.; Huang, B.; Luo, F.; Du, Y.; Yan, C. A Review on CeO2-Based Electrocatalyst and Photocatalyst in Energy Conversion. Adv. Energy Sustain. Res. 2021, 2, 2000063. [Google Scholar] [CrossRef]
- Zhu, C.; Wei, X.; Li, W.; Pu, Y.; Sun, J.; Tang, K.; Wan, H.; Ge, C.; Zou, W.; Dong, L. Crystal-plane effects of CeO2 {110} and CeO2 {100} on photocatalytic CO2 reduction: Synergistic interactions of oxygen defects and hydroxyl groups. ACS Sustain. Chem. Eng. 2020, 8, 14397–14406. [Google Scholar] [CrossRef]
- Zou, W.; Shao, Y.; Pu, Y.; Luo, Y.; Sun, J.; Ma, K.; Tang, C.; Gao, F.; Dong, L. Enhanced visible light photocatalytic hydrogen evolution via cubic CeO2 hybridized g-C3N4 composite. Appl. Catal. B Environ. 2017, 218, 51–59. [Google Scholar] [CrossRef]
- Radwan, M.; Aboutaleb, W.; El Naggar, A.; Medany, S.; Shehata, M. Synergetic Effect of Fe2O3 Doped-CeO2 Nanocomposites Prepared via Different Techniques on Photocatalytic Desulfurization of Heavy Gas Oil. Arab. J. Sci. Eng. 2023, 48, 15837–15850. [Google Scholar] [CrossRef]
- Ameen, S.; Akhtar, M.; Seo, H.-K.; Shin, H.-S. Solution processed CeO2/TiO2 nanocomposite as potent visible light photocatalyst for the degradation of bromophenol dye. Chem. Eng. J. 2014, 247, 193–198. [Google Scholar] [CrossRef]
- Wang, N.; Pan, Y.; Lu, T.; Li, X.; Wu, S.; Wu, J. A new ribbon-ignition method for fabricating p-CuO/n-CeO2 heterojunction with enhanced photocatalytic activity. Appl. Surf. Sci. 2017, 403, 699–706. [Google Scholar] [CrossRef]
- Liu, H.; Wang, M.; Wang, Y.; Liang, Y.; Cao, W.; Su, Y. Ionic liquid-templated synthesis of mesoporous CeO2-TiO2 nanoparticles and their enhanced photocatalytic activities under UV or visible light. J. Photochem. Photobiol. A 2011, 223, 157–164. [Google Scholar] [CrossRef]
- Issarapanacheewin, S.; Wetchakun, K.; Phanichphant, S.; Kangwansupamokon, W.; Wetchakun, N. A novel CeO2/Bi2WO6 composite with highly enhanced photocatalytic activity. Mater. Lett. 2015, 156, 28–31. [Google Scholar] [CrossRef]
- Khan, M.; Khan, M.; Cho, M. Ce3+-ion, surface oxygen vacancy, and visible light-induced photocatalytic dye degradation and photocapacitive performance of CeO2-graphene nanostructures. Sci. Rep. 2017, 7, 5928. [Google Scholar] [CrossRef] [PubMed]
- Huang, L.; Li, Y.; Xu, H.; Xu, Y.; Xia, J.; Wang, K.; Li, H.; Cheng, X. Synthesis and characterization of CeO2/g-C3N4 composites with enhanced visible-light photocatalytic activity. RSC Adv. 2013, 3, 22269–22279. [Google Scholar] [CrossRef]
- Huang, Z.; Li, L.; Li, Z.; Li, H.; Wu, J. Synthesis of novel kaolin-supported g-C3N4/CeO2 composites with enhanced photocatalytic removal of ciprofloxacin. Materials 2020, 13, 3811. [Google Scholar] [CrossRef]
- Ismael, M. A review on graphitic carbon nitride (g-C3N4) based nanocomposites: Synthesis, categories, and their application in photocatalysis. J. Alloys Compd. 2020, 846, 156446. [Google Scholar] [CrossRef]
- Zhou, C.; Shi, R.; Zhang, J.; Waterhouse GIN. Two-dimensional materials for photocatalytic and electrocatalytic hydrogen evolution. Nat. Rev. Mater. 2018, 3, 29–46. [Google Scholar]
- Pop, O.; Diaconeasa, Z.; Mesaros, A.; Vodnar, D.; Cuibus, L.; Ciontea, L.; Socaciu, C. FT-IR studies of cerium oxide nanoparticles and natural zeolite materials. Bull. UASVM Food Sci. Technol. 2015, 72, 50–55. [Google Scholar] [CrossRef] [PubMed]
- Tan, L.; Xu, J.; Zhang, X.; Hang, Z.; Jia, Y.; Wang, S. Synthesis of g-C3N4/CeO2 nanocomposites with improved catalytic activity on the thermal decomposition of ammonium perchlorate. Appl. Surf. Sci. 2015, 356, 447–453. [Google Scholar] [CrossRef]
- Iqbal, O.; Ali, H.; Li, N.; Al-Sulami, A.I.; Alshammari, K.; Abd-Rabboh, H.; Al-Hadeethi, Y.; Din, I.U.; Alharthi, A.I.; Altamimi, R. A review on the synthesis, properties, and characterizations of graphitic carbon nitride (g-C3N4) for energy conversion and storage applications. Mater. Today Phys. 2023, 34, 101080. [Google Scholar] [CrossRef]
- Chen, J.; Gu, P.; Guan, Y.; Su, H. Synthesis of g-C3N4 composite co-doped with CeO2 and sugar cane bagasse charcoal for the degradation of methylene blue under visible light. Colloids Surf. A Physicochem. Eng. Asp. 2022, 641, 128551. [Google Scholar] [CrossRef]
- Thommes, M.; Kaneko, K.; Neimark, A.; Olivier, J.; Rodriguez-Reinoso, F.; Rouquerol, J.; Sing, K. Physisorption of gases, with special reference to the evaluation of surface area and pore size distribution (IUPAC Technical Report). Pure Appl. Chem. 2015, 87, 1051–1069. [Google Scholar] [CrossRef]
- Zidane, Y.; Laouini, S.E.; Bouafia, A.; Meneceur, S.; Tedjani, M.L.; Alshareef, S.A.; Almukhlifi, H.A.; Al-Essa, K.; Al-Essa, E.M.; Rahman, M.M.; et al. Green synthesis of multifunctional MgO@AgO/Ag2O nanocomposite for photocatalytic degradation of methylene blue and toluidine blue. Front. Chem. 2022, 10, 1083596. [Google Scholar] [CrossRef] [PubMed]
- Jeevarathinam, M.; Asharani, I. Synthesis of CuO, ZnO nanoparticles, and CuO-ZnO nanocomposite for enhanced photocatalytic degradation of Rhodamine B: A comparative study. Sci. Rep. 2024, 14, 9718. [Google Scholar] [CrossRef]
- Legmairi, S.; Meneceur, S.; Bouafia, A.; Laouini, S.E.; Alshareef, S.; Al-Essa, K.; Almukhlifi, H.A.; Tedjani, M.L.; Menaa, F. Biofabrication of NiO and NiO-decorated Fe nanocomposite efficiency for removal of methylene blue from aqueous solution. Biomass Convers. Biorefinery 2023, 14, 18469–18479. [Google Scholar] [CrossRef]
- Khaled, B.; Salmi, C.; Kir, I.; Mohammed, H.; Laouini, S.; Bouafia, A.; Alharthi, F.; Abdullah, J.A.A.; Al-Essa, K. Enhanced elimination of dyes from aqueous solution and antioxidant activity using ascorbic acid-functionalized iron oxide nanocomposites. J. Clust Sci. 2024, 35, 3025–3044. [Google Scholar] [CrossRef]
- Elbasuney, S.; El-Khawaga, A.M.; Elsayed, M.A.; Correa-Duarte, M.A. Silver doped anatase nanocomposite: A novel photocatalyst with advanced activity under visible light for waste-water treatment. Discov. Appl. Sci. 2024, 6, 159. [Google Scholar] [CrossRef]


| BET Surface Area (m2g−1) | Langmuir Surface Area (m2g−1) | Single Point Surface Area at P/P° (m2g−1) | Total Pore Volume (cm3g−1) | Pore Size (nm) |
|---|---|---|---|---|
| 68.50 | 105.49 | 67.99 | 0.057 | 3.33 |
| Sample | Property | Value (eV) | Standard Deviation (eV) | Standard Error (eV) |
|---|---|---|---|---|
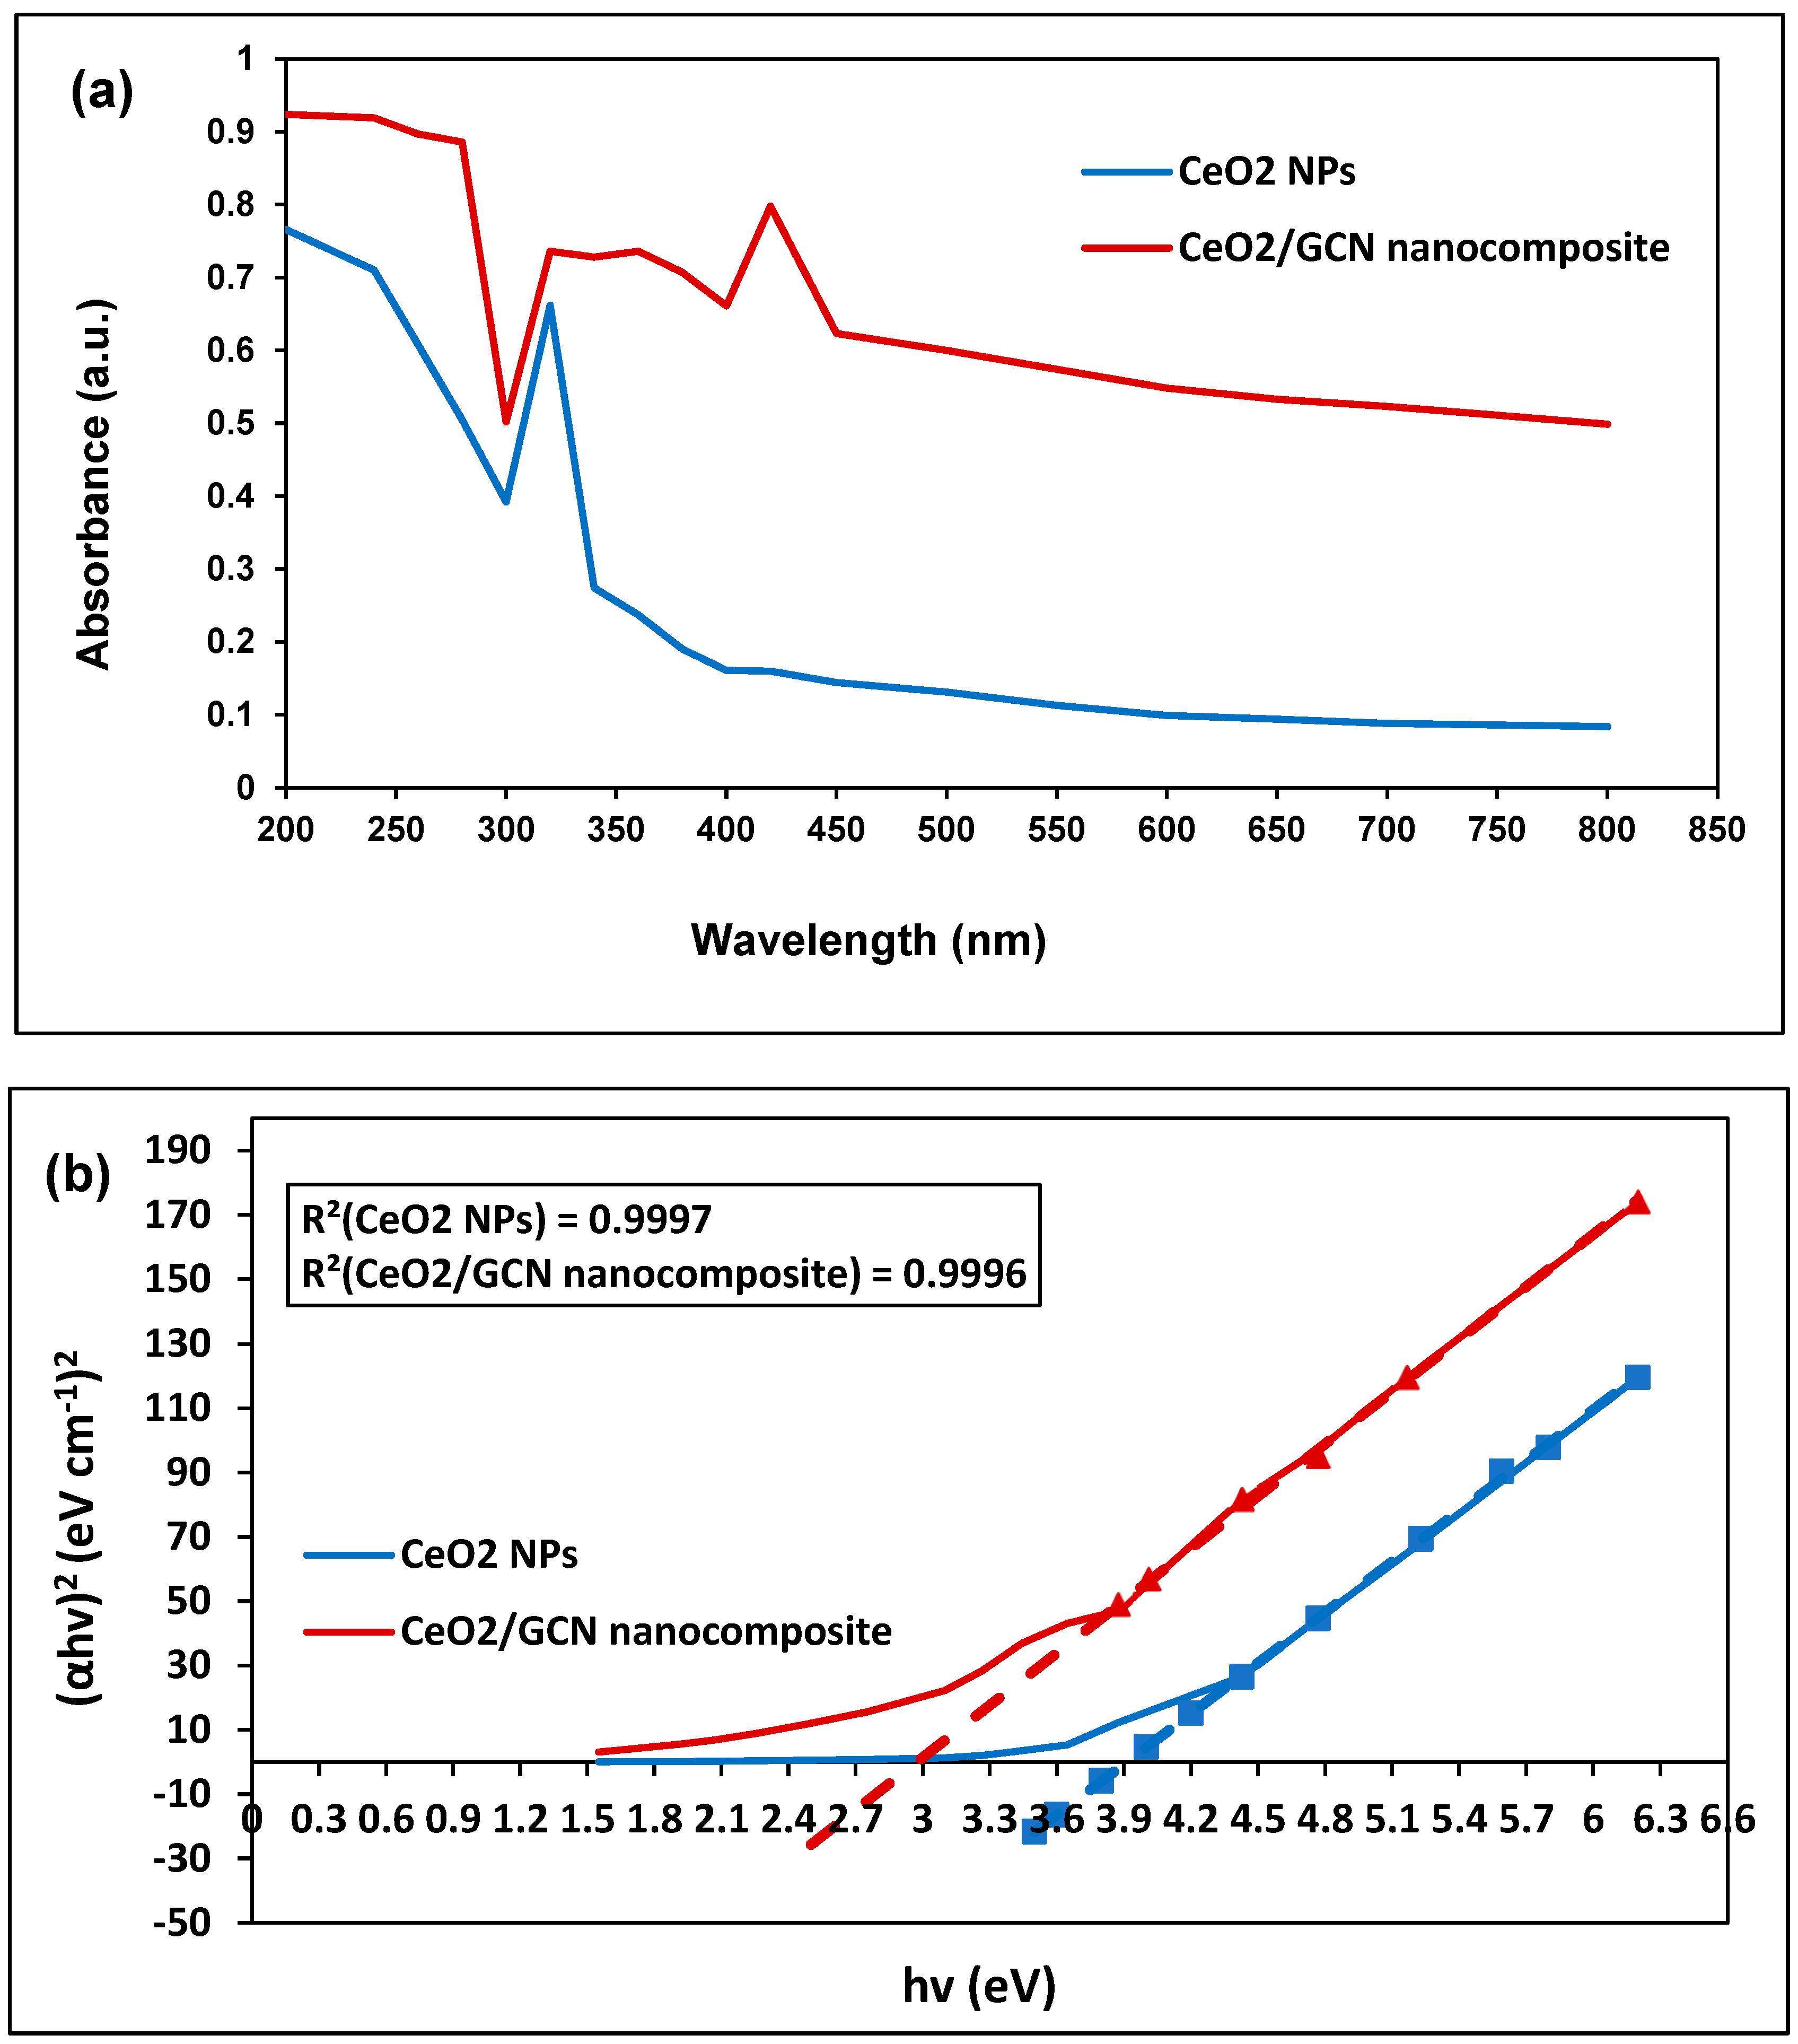
| CeO2 NPs | Direct optical band | 3.91 | 0.66 | 0.26 |
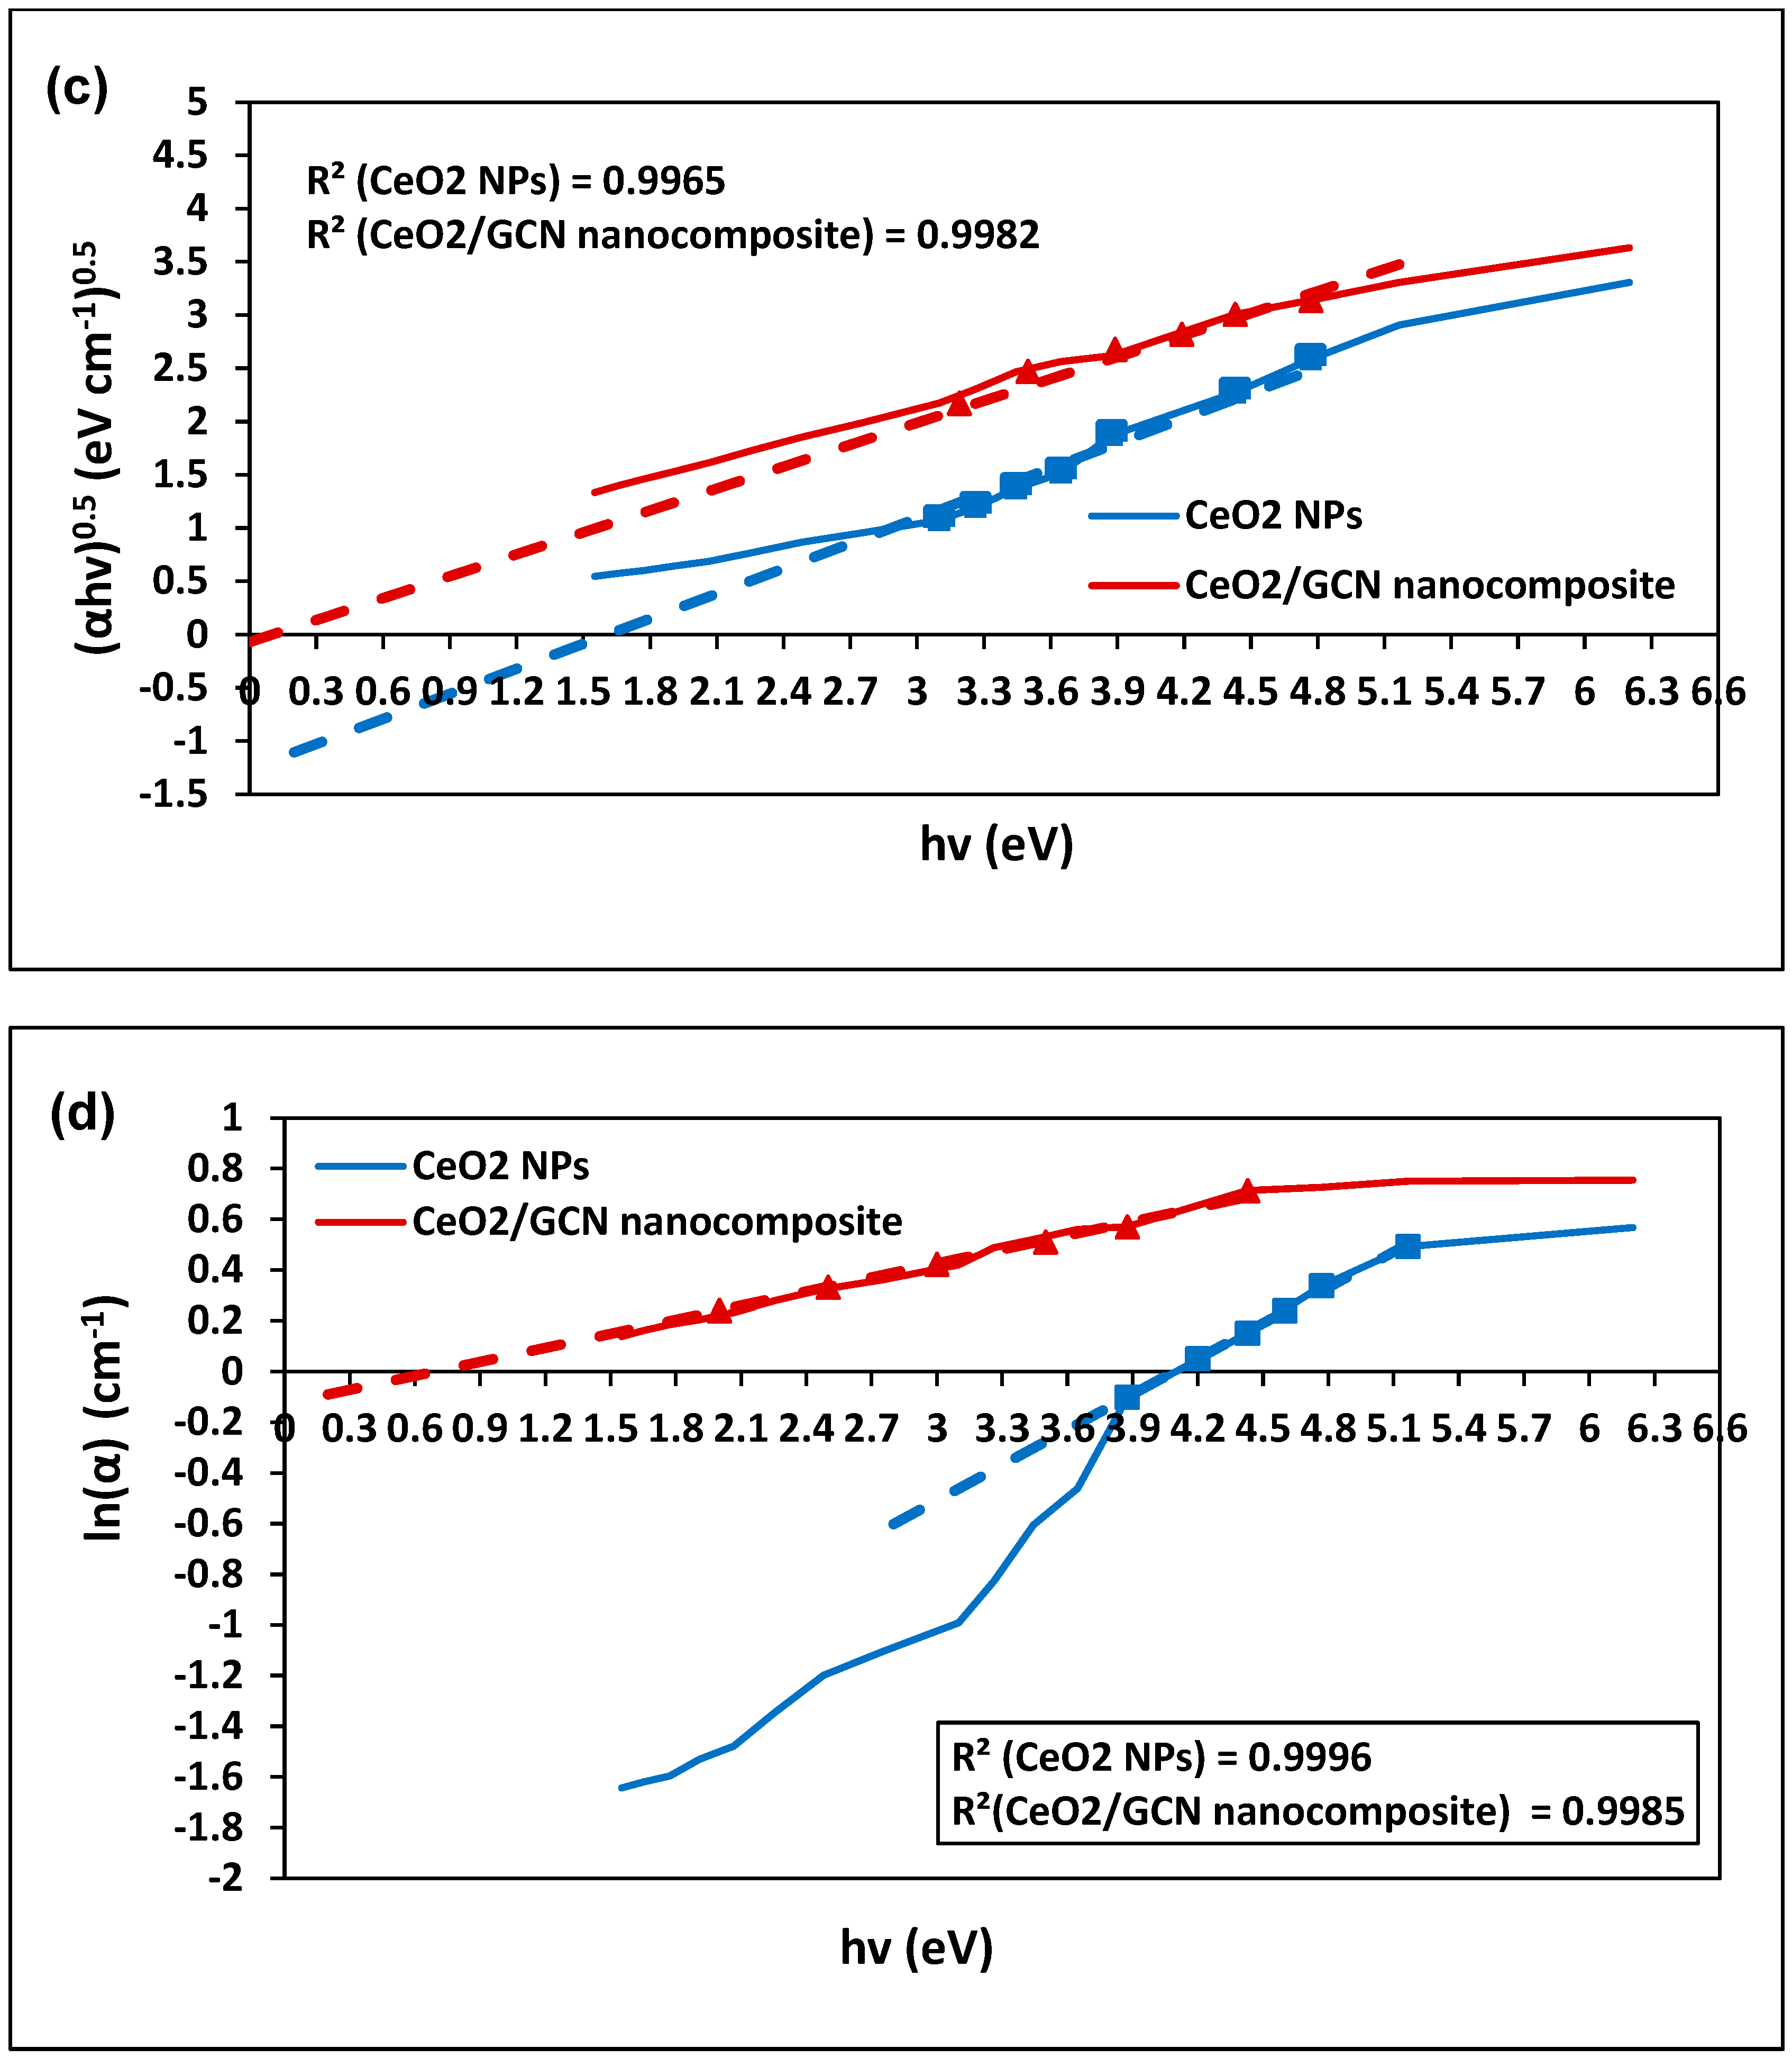
| Indirect optical band | 1.61 | 0.47 | 0.19 | |
| Urbach energy | 4.09 | 0.44 | 0.18 | |
| CeO2/GCN Nanocomposite | Direct optical band | 2.97 | 0.51 | 0.20 |
| Indirect optical band | 0.12 | 0.58 | 0.24 | |
| Urbach energy | 0.68 | 0.89 | 0.36 |
Disclaimer/Publisher’s Note: The statements, opinions and data contained in all publications are solely those of the individual author(s) and contributor(s) and not of MDPI and/or the editor(s). MDPI and/or the editor(s) disclaim responsibility for any injury to people or property resulting from any ideas, methods, instructions or products referred to in the content. |
© 2025 by the authors. Licensee MDPI, Basel, Switzerland. This article is an open access article distributed under the terms and conditions of the Creative Commons Attribution (CC BY) license (https://creativecommons.org/licenses/by/4.0/).
Share and Cite
Al-Essa, K.; Al-Essa, E.M.; Qarqaz, A.; Al-Issa, S.; Alshahateet, S.F.; Al-Fawares, O. Graphitic Carbon Nitride/CeO2 Nanocomposite for Photocatalytic Degradation of Methyl Red. Water 2025, 17, 158. https://doi.org/10.3390/w17020158
Al-Essa K, Al-Essa EM, Qarqaz A, Al-Issa S, Alshahateet SF, Al-Fawares O. Graphitic Carbon Nitride/CeO2 Nanocomposite for Photocatalytic Degradation of Methyl Red. Water. 2025; 17(2):158. https://doi.org/10.3390/w17020158
Chicago/Turabian StyleAl-Essa, Khansaa, Ethar M. Al-Essa, Alaa Qarqaz, Suhad Al-Issa, Solhe F. Alshahateet, and O’la Al-Fawares. 2025. "Graphitic Carbon Nitride/CeO2 Nanocomposite for Photocatalytic Degradation of Methyl Red" Water 17, no. 2: 158. https://doi.org/10.3390/w17020158
APA StyleAl-Essa, K., Al-Essa, E. M., Qarqaz, A., Al-Issa, S., Alshahateet, S. F., & Al-Fawares, O. (2025). Graphitic Carbon Nitride/CeO2 Nanocomposite for Photocatalytic Degradation of Methyl Red. Water, 17(2), 158. https://doi.org/10.3390/w17020158