Article

Mechanism and Measurement of Coordinated Development in the Mariculture Ecological–Economic–Social Complex System: A Case Study of China

by
Runsheng Pei
1,2,*,
Hongzhi Zhang
3,
Yongtong Mu
2,
Md. Hashmi Sakib
2,4,
Yingxue Zhang
2,
Xin Liu
1,
Xia Huang
1,
Aiqin Ge
1,
Runfeng Pei
1 and
Ruohan Wang
5
1
Qingdao Institute of Technology, Qingdao 266300, China
2
Key Laboratory of Mariculture (Ministry of Education), Fisheries College, Ocean University of China, Qingdao 266003, China
3
Shandong Foreign Trade Vocational College, Qingdao 266100, China
4
Bangladesh Fisheries Research Institute, Brackishwater Station, Paikgacha, Khulna 9280, Bangladesh
5
Philosophy Department, Sichuan University, Chengdu 610000, China
*
Author to whom correspondence should be addressed.
Water 2025, 17(19), 2878; https://doi.org/10.3390/w17192878
Submission received: 18 August 2025 / Revised: 30 September 2025 / Accepted: 30 September 2025 / Published: 2 October 2025
(This article belongs to the Section Water, Agriculture and Aquaculture)

Abstract

The coordinated development of a complex system refers to the harmonious and coherent evolution of its subsystems. From the perspective of the coordinated development of ecological–economic–social complex systems, this paper analyzes the coordinated development mechanism (CDM) of the mariculture ecological–economic–social (MEES) complex system, constructs a coordinated development evaluation indicator system for the MEES complex system, and adopts the comprehensive evaluation model and the coupling coordination degree (CCD) model to empirically analyze the coordinated development level of the MEES complex system in China from 2009 to 2020. The results show that the comprehensive development level of China’s MEES complex system has improved significantly during this period, with the comprehensive development index increasing from 0.25 in 2009 to 0.76 in 2020, transitioning from a poor to an excellent status. Simultaneously, the CCD of the system increased progressively, experiencing phases of near dissonance, barely coupling coordination, primary coordination, and intermediate coordination, before finally reaching a stage of good coordination. Based on these findings, we further discuss and propose countermeasures to promote the coordinated development of China’s MEES complex system.

1. Introduction

Mariculture, defined as the farming of marine organisms for food and other products, occurs either in natural marine environments or in artificial enclosures (e.g., land-based ponds and sea-based cages or raceways) [1]. As a critical approach to marine resource development [2], it delivers nutritional and economic benefits [3], while alleviating pressure on declining wild fisheries. By producing substantial food without occupying arable land, mariculture significantly contributes to sustainable development goals [4]. Since the 21st century, global mariculture has emerged as one of the fastest-growing food production sectors, counterbalancing declining marine capture fisheries [5,6,7]. China, leveraging its long coastline, extensive shallow waters, mudflats, and sheltered bays [8], now leads global mariculture production [9]. In 2022, China’s mariculture output reached 22.76 million metric tons, while its total aquaculture production amounted to 55.66 million metric tons, consolidating its leading position globally. During the same period, global mariculture production was approximately 48.90 million metric tons, and total aquaculture production worldwide reached 130.90 million metric tons [10]. China accounted for over 46% of global mariculture output and more than 42% of total aquaculture production, highlighting its indispensable role in ensuring global food security and a sustainable protein supply. However, the industry’s rapid expansion has exacerbated sustainability challenges. The extensive development model—prioritizing economic gains through natural resource consumption and ecological disruption—now critically constrains mariculture’s sustainable growth [11,12,13]. For instance, this model leads to massive discharges of uneaten feed and manure, triggering water eutrophication, algal blooms, and local ecosystem imbalances—forming a vicious cycle of “high yields → pollution → declining yields.” Simultaneously, it drives up resource consumption and carbon emissions, trapping the industry in a “triple dilemma” of increasing production, controlling pollution, and reducing emissions. Moreover, environmental degradation exacerbates farming risks and costs, squeezing profit margins, while excessive drug use further creates food safety hazards and market trust crises. Ultimately, this undermines the foundation for the industry’s long-term sustainable development across environmental, economic, and social dimensions.
The mariculture ecological–economic–social (MEES) complex system is a multifaceted system formed through mariculture activities. These activities, which employ technical means in natural or artificial waters to regulate marine organism growth for human consumption, intricately intertwine ecological, economic, and social dimensions into a cohesive whole. Specifically, the MEES system comprises three interacting subsystems: the mariculture ecological system, the mariculture economic system, and the mariculture social system, which co-evolve through mutual interaction and penetration [14].
Although direct literature on the coordinated development of the MEES complex system remains relatively limited, research in related fields—including wetland ecosystem management [15], coupling analysis of mariculture eco-economic system [16], and assessments of coordinated regional multi-system development [17]—has provided us with a solid theoretical foundation, mature research methodologies, and rich practical experience. Coordination within such a system reflects critical relationships between subsystems and their internal indicators [18]. Holling (2001) [19] emphasized recognizing the inherent complexity of an ecological–economic–social (EES) complex system and proposed frameworks for building resilient social–ecological–resource systems. Beria et al. (2018) [20] advanced ecosystem services theory to bridge stakeholders across upstream–downstream dynamics. Wang et al. (2024) [21] theorized mechanisms by which marine ecological restoration generates ecological, economic, and social benefits, while Li et al. (2025) [22] identified internal coordination and interaction effects within an economic–social–ecological complex system as pivotal to sustainable societal development.
With the deepening of research, methodologies such as the coupling coordination degree (CCD) model [23,24], input–output model [25,26], and system dynamics simulation model [27,28] are now widely adopted. For example, Sun (2020) [29] employed gray correlation analysis to explore synergistic drivers within the economic–social–environmental (ESE) complex system, revealing the environmental subsystem as the highest contributor, followed by economic and social subsystems. Wang et al. (2015) [30] proposed a multidisciplinary framework integrating ecological, social, and economic costs–benefits of fisheries in the South China Sea Pearl River Delta. Peng et al. (2021) [31] established an indicator system to assess coordination between fishery economic growth and environmental quality across 12 Chinese regions. Luo et al. (2021) [32] used the entropy method and CCD model to evaluate the CCD of the ESE complex system. Wu et al. (2025) [33] systematically quantified ecological efficiency in Weihai’s mariculture industry using a three-stage DEA model with undesirable outputs. Zhang et al. (2023) [34] developed a sustainability assessment framework for Qinghai Lake’s tourism system via CCD and obstacle degree models. Wang et al. (2024) [35] combined social–ecological resilience assessment with TOPSIS–entropy methods to analyze vulnerability in arid-area tourism, proposing a CCD-based synergy path for ecological–economic optimization. Qu et al. (2025) [36] simulated settlement–cropland coupling in the Three Gorges Reservoir using system dynamics, advocating spatial restructuring and resource efficiency for ecology–economy–society synergies.
However, most existing studies prioritize indicators related to environmental protection and economic development, with limited inclusion of social dimensions. Management capacity (e.g., number of fisheries law enforcement agencies, completed investment in industrial pollution control of solid waste) remains unaddressed in current frameworks. Similarly, technology promotion (e.g., number of aquatic technology extension organizations, funding for personnel of such organizations) is also not sufficiently covered. Furthermore, these studies lack an in-depth analysis of the coordinated development mechanism (CDM) within the MEES complex system.
To address these gaps, this paper analyzes the CDM of the MEES complex system and empirically evaluates the coordinated development level of China’s MEES complex system (2009–2020) using the comprehensive evaluation model and the CCD model. This approach not only compensates for the theoretical and methodological limitations in extant research but also demonstrates strong foresight and novelty by establishing a pioneering framework for MEES coordination analysis.

2. The CDM of the MEES Complex System

2.1. The Connotation of the MEES Complex System’s Coordinated Development

Coordination involves a benign interaction between two or more elements of a system, which can describe the sustainable development of the interaction [37]. There is a complex nonlinear coupling relationship between the elements or subsystems [38]. The coordinated development of the system refers to the harmonious and consistent development of its subsystems [39]. Based on the above understanding, this study believes that the coordinated development of the MEES complex system refers to the new equilibrium state, in which the benign coupling of structural functions of subsystems within the complex system tends to be more efficient, and a state in which the various elements within the complex system reach an orderly synergy through synergistic effects. The main manifestations are as follows: (1) coordinated development couples the mariculture ecological, economic, and social systems so they mutually promote one another; and (2) coordinated development combines key systemic qualities (synchronicity, comprehensiveness, wholeness) and interactive qualities (dynamism, complementarity, endogeneity). It reflects the interconnected, mutually reinforcing, and influential relationships between the mariculture ecological, economic, and social systems.
It is worth noting that individual subsystems, no matter how functional and complete they are, can hardly realize the coordinated development of the whole MEES complex system independently. Only by linking the mariculture ecological system, mariculture economic system and mariculture social system, in accordance with certain laws, forming a brand new complex system with a dissipative structure and self-organizing characteristics, and subjecting the subsystems and their constituent elements to the same principles and common goals, can we better bring into play the roles of the coupling mechanism and the coordinated development mechanism, produce the “1 + 1 > 2” effect, and ultimately realize the orderly, comprehensively coordinated, and sustainable development of the MEES complex system [40].

2.2. The Goal of the MEES Complex System’s Coordinated Development

2.2.1. Benefit Enhancement Goal

The survival and development of producers, consumers, and decomposers in the mariculture ecological system cannot be separated from a good mariculture ecological environment, and all of them have the pursuit of optimal ecological benefit as their main goal [41,42]. The productive populations, non-productive populations, mariculture enterprises, fisheries intermediary organizations, and governmental and non-governmental organizations and institutions in the mariculture economic system and the mariculture social system need to influence and interact with each other in order to obtain the best economic or social benefits. It can be seen that ecological, economic, and social benefits are indispensable components of the coordinated development goal of the MEES complex system, and only through the synergistic matching and mutual reinforcement between the various subsystems and their constituent elements to achieve a high degree of unity among the benefits of multiple parties can we ensure that the path of mariculture production is sustainable.

2.2.2. Synergy Optimization Goal

Synergy is the word used to describe what happens when two or more people or organizations come together to produce a result that is greater than that which they could achieve alone [43,44]. The synergy of the MEES complex system is multilevel, multidisciplinary, and multigroup, between sub-complex systems, between sub-subsystems, and between their constituent elements, under the general objective. However, during the actual operation of the MEES complex system, there are usually subgoals in different directions within the complex system, and there are certain contradictions and conflicts between the subgoals and the overall goal, between the subsystems and their constituent elements, between the different actors, and between the complex system and the external environment, which cannot be solved without the synergistic efforts of the various supervisory and regulating mechanisms. Synergy objectively reveals that the influencing factors of the coordinated development of the MEES complex system have complex characteristics such as diversity, nonlinear perturbation, uncertainty, artificial intervention, etc., which is an important guarantee for the synergistic order of the MEES complex system as a whole.

2.2.3. Sustainable Development Goal

The essence of the term sustainable is that which can be maintained over time [45]. In the context of complex systems, sustainable development can be thought of as the ability of complex systems to maintain or recover their original state over time. The Rio+20 outcome document, The Future We Want, refers to three dimensions of sustainable development: economic, social, and environmental [46]. As the fundamental goal of the coordinated development of the MEES complex system, the sustainable development goal includes ecological sustainable development, economic sustainable development, and social sustainable development, aiming at realizing the high-quality development of the economy and comprehensive progress of society of the present and future generations of mariculture waters. This development is intended to be carried out through the scientific and rational exploitation of the limited aquatic and vegetative resources, without destroying the ecological environment of the mariculture waters.

2.3. The Hierarchical Structure for the MEES Complex System’s Coordinated Development

2.3.1. Coordinated Development Within the Subsystems

(1)
Coordinated development within the mariculture ecological system
As a special marine ecological system with multiple functions, such as supplying humans with low-fat and high-protein nutritious aquatic products, as well as education, scientific research, and recreation, the mariculture ecological system is facing significant challenges in ecological environmental protection: prominent public welfare, strong externalities, large-scale inputs, and long profit cycles. In view of this, it is not enough to rely only on the protection of mariculture enterprises, fishermen, and other production bodies, and it is necessary to play a leading role in the government. Internal government coordination mainly refers to coordination between the central government and local governments, as well as between local governments. The key to the former lies in fiscal decentralization, while the latter requires a clear definition of responsibilities. At the same time, coordinated development within mariculture ecological system depends not only on collaboration at the government level, but also on the participation of a wide range of stakeholders, including marine aquaculture enterprises, aquaculture farmers, aquatic research institutions, fishing community residents, and the news media. Specifically, this manifests itself in the following ways: production entities that pursue maximum profit, such as those that use fishing drugs and bait without restraint, directly damaging the health of coastal ecosystems and requiring the government to implement necessary restrictions and interventions. If the ‘three wastes’ generated by the daily lives of fishing community residents are not properly disposed of, they will also damage the aquaculture environment. This requires the government to collaborate with scientific research institutions to improve the treatment rate of the ‘three wastes’ through technological advances, thereby reducing ecological damage.
(2)
Coordinated development within the mariculture economic system
The mariculture economic system is centered on economic benefits and pursues the maximization of returns with minimum inputs. The revenue of the main body of the system mainly consists of two parts: the economic revenue derived directly from aquaculture products and the revenue from government financial transfers. With regard to the revenue from aquaculture products, the core objective of the government, as a high-level administrator, is to ensure the sustainable development of ecological resources in aquaculture waters. However, mariculture enterprises and fishermen and other production and management bodies usually tend to maximize short-term economic benefits, which constitutes a pattern of confrontation and lack of unity with the long-term sustainable objectives of the government. In order to reconcile this contradiction, it is necessary to give full play to the role of fishery intermediary organizations as a bridge: on the one hand, to promote their active participation in the formulation of governmental fishery policies and regulations; on the other hand, to ensure that they effectively represent the interests of the main bodies of production, and to promote a balance between the interests of the various parties and the coordinated development of the system. In terms of transferring benefits, the key challenge is to establish a scientific and reasonable mechanism for distributing benefits. Funding for the protection and construction of mariculture areas relies mainly on financial allocations at all levels, supplemented by limited funding from non-governmental organizations. In the face of the contradiction between limited funds and the demands of multiple actors, a two-pronged strategy is needed: first, broaden funding channels and improve incentive mechanisms to encourage enterprises, fishermen and coastal residents to actively participate in inputs; and second, take industrial restructuring and upgrading as a starting point to guide the flow of funds to support the development of ecologically sound and environmentally friendly new modes of production, and to improve the efficiency of fund utilization.
(3)
Coordinated development within the mariculture social system
The core of the coordinated development within the mariculture social system still lies in the effective synergy among the subjects. The system consists of multiple actors, such as fishery community residents, fishery intermediary organizations, aquaculture research institutions, news media and the public. The coordinated development of the system depends on the close cooperation of all parties: aquatic research institutes can enhance the professionalism and education level of the community residents through skills training; the news media and fishery intermediary organizations can enhance the public’s awareness of environmental protection through the interpretation of policies and dissemination of environmental protection knowledge; and the government, as a supervisor and coordinator of the system, needs to regulate the behaviors of the other subjects and to coordinate the coordinated operation of the whole system.

2.3.2. Coordinated Development Between Subsystems

(1)
Coordinated development between mariculture ecological system and mariculture economic system
There is a two-way feedback mechanism between the mariculture ecological system and the mariculture economic system. The material cycle and energy transformation provided by the ecological system are the indispensable environmental basis and source of raw materials for the production activities of the economic system, so strengthening environmental governance and protecting and improving the ecological environment can create more space for economic development. At the same time, the growth and structural optimization of the total economy within the economic system provides financial security for the environmental protection in the ecological system. By introducing production factors into the ecological system for aquaculture production, it is possible to optimize environmental configuration and achieve artificial control of aquatic organism growth. However, it is important to note that economic activities such as fishing, mudflat conversion, land reclamation, and waste discharge can have a coercive effect on the mariculture ecosystem. Therefore, the development of the economic system must take full account of the structure, functions, and service characteristics of the ecological system and be strictly controlled within the threshold of the environmental carrying capacity. Exceeding this threshold will lead to imbalance and functional degradation of the ecological system, and its instability and incoherence will ultimately constrain the sustainable development of the economic system itself.
(2)
Coordinated development between mariculture ecological system and mariculture social system
The same two-way feedback relationship exists between the mariculture ecological system and the mariculture social system. On the one hand, the ecological system is the cornerstone of the development of the social system: the state of its resources provides the natural basis for the survival and development of the fishing population; its physical form, structure, characteristics, and laws of motion provide the core subjects and objects of research for scientific activities. On the other hand, the social system can enhance the awareness of marine environmental protection by upgrading the cognitive ability of human beings; through scientific and technological innovation, it can improve the quality of the environment, enrich the diversity of cultured organisms, and enhance the resistance of aquatic organisms to disease; and through the improvement of the relevant social systems, the protection of the ecosystem and compensation for damages can be effectively regulated to ensure its orderly operation. However, domestic sewage, garbage, and other waste discharges generated by the social system can cause damage to the ecological system, and this damage can eventually backfire on the sustainability of the social system itself.
(3)
Coordinated development between mariculture economic system and mariculture social system
The same bi-directional causal relationship exists between the mariculture economic system and the mariculture social system. On the one hand, the economic system not only provides jobs and food sources for the social system through production and business activities but also provides financial support for scientific research and education, technology promotion, cultural dissemination, and management practices through business profits. The cost analysis, profit model, factor distribution, and other problems faced by the economic system also constitute important objects of the scientific research activities of the social system. In addition, the level of economic development profoundly constrains social structures and organizational structures, with the economic base determining the social pattern. The social system, on the other hand, provides the key support for economic development: supplying labor through the reproduction of the population; regulating economic behavior through the legislative, judicial, and regulatory systems; increasing efficiency through technological innovations that enhance production capacity, seeding, and feed utilization; and supporting the process of commodity flows through the interaction of social organizations.
(4)
Coordinated development between mariculture ecological system, mariculture economic system and mariculture social system
The core of the coordinated development of the three subsystems lies in how to maximize the output of farmed seafood, the economic benefits, and the industry’s ability to serve mankind, while fully protecting the ecological environment. This requires us to follow the trinity principle, that the protection of the ecological environment is the basic prerequisite, the realization of economic benefits is the driving force, and the performance of the management and service functions of the social system is the key guarantee. By integrating the interactions among ecological, economic, and social elements, we can promote in-depth coupling and synergy among the mariculture economic system, the mariculture ecological system and the mariculture social systems, so as to enhance the overall efficiency of the complex system and ultimately promote the sustainable development of mariculture.

2.3.3. Coordinated Development of the MEES Complex System as a Whole

The overall coordinated development of the MEES complex system is manifested in the fact that the subjects, elements, and subsystems within the complex system interact, integrate, and synergize in depth to form the integrated effect of “1 + 1 > 2”, which jointly promotes the evolution of the complex system to a higher level of coordination and sustainability.

3. Data and Methodology

3.1. Data Sources

There are 14 provincial administrative regions along the coast of China, from north to south: Liaoning Province, Hebei Province, Tianjin Municipality, Shandong Province, Jiangsu Province, Shanghai Municipality, Zhejiang Province, Fujian Province, Taiwan Province, Guangdong Province, Hong Kong Special Administrative Region, Macao Special Administrative Region, Guangxi Zhuang Autonomous Region, and Hainan Province. Considering the continuity and comparability of the data, 10 coastal provinces other than Shanghai, Hong Kong, Macao, and Taiwan were selected for the study, as shown in Figure 1. Unless otherwise specified, all data used in this paper are derived from official data such as the China Marine Statistical Yearbook, China Fisheries Statistical Yearbook, China Marine Economic Statistical Bulletin, China Ocean Yearbook, etc. For the very few data exhibiting a clear temporal trend but with only a small number of missing years, we employed the mean method for imputation, and the time span is from 2009 to 2021.

3.2. Indicator System Constructed

Based on theoretical analysis and literature review, and adhering to the principles of data availability, continuity, and comparability, 46 indicators were selected from the mariculture ecological system, mariculture economic system, and mariculture social system to finally establish the coordinated development evaluation indicator system (CDEIS) for the MEES complex system, as shown in Table 1.
Among them, the mariculture ecological system reflects the ecological environment and resource operations and is the natural basis for the existence of the mariculture economic system and the mariculture social system, thus the factor level of the mariculture ecological system is categorized into resource condition, environmental pollution, and ecological disaster. The mariculture economic system reflects the economic operations related to mariculture activities and is the core of the MEES complex system, and the development of the mariculture economic system can be analyzed in terms of the input level, output level, and structural level. Realizing the progress of the mariculture social system is the ultimate goal of the MEES complex system. The mariculture social system is centered on human beings, and the fishermen’s life, management capacity, and technology promotion all have a direct impact on the operation of the social system and are therefore selected as indicators at the factor level.

3.3. Data Standardization and Indicator Empowerment

3.3.1. Data Standardization

In order to eliminate the difficulty of comparing the indicator outlines due to the difference in orders of magnitude, the indicators were processed by using the method of regularization of the extreme deviation, which was calculated using the following formulas:
d i j = X i j     m i n   ( X i j ) m a x   ( X i j )     m i n   ( X i j )           P o s i t i v e m a x   ( X i j )     X i j m a x   ( X i j )     m i n   ( X i j )           N e g a t i v e
where Xij is the original value of the ith indicator in the jth year, and dij denotes the standard value after the dimensionless processing of Xij. max (Xij) and min (Xij) are the maximum and minimum values of the ith indicator in 2009–2020, respectively.

3.3.2. Indicator Empowerment

There are many methods for determining the weights of indicators, mainly including the subjective weighting method, objective weighting method, and combination weighting method [47,48,49]. The entropy method is an objective weighting method proposed by American mathematician Shannon in 1948, the principle of which is to measure the effective amount of information of the known indicator data through the entropy value size and further calculate the weights [50,51]. In this paper, on the basis of data standardization, the entropy method is used to determine the weights of indicators, and the weights of each indicator within the CDEIS are calculated (Table 1), which effectively avoids the subjectivity of the subjective assignment method and ensures the objectivity of the study.

3.4. Research Methods

3.4.1. Comprehensive Development Index (CDI)

The CDI is a generalized index that is formed by combining the indicators after standardization and weighting process in order to evaluate the level of development. This index was used in this study with the aim of measuring the level of development of the MEES complex system with the following formula:
U i   =   i = 1 n W i   ×   d i j ,   i   =   1 ,   2 ,   3
  T   =   α U 1 + β U 2 +   γ U 3
where T denotes the CDI of the complex system. A higher CDI represents a higher comprehensive development level (CDL) of the complex system, and vice versa. U1, U2, and U3 are the development indexes of mariculture ecological system, mariculture economic system and mariculture social system, respectively. Wi is the weight coefficient of the indicator layer. dij denotes the standard value after the dimensionless treatment of Xij. α, β, and γ are the coefficients to be determined, and it is assumed here that α = β = γ = 1/3, taking into account that it is of equal importance in the coordinated development of the three systems. In addition, drawing upon existing research findings [14], k-means (k = 4) clustering analysis was performed on the computational data. Through iterative calculations, four cluster centers were identified (Table 2).

3.4.2. CCD Model

The coupling degree reflects the degree of interdependence and constraints between systems, and a high coupling degree implies that there are strong linkages between systems. However, such linkages may be characterized by competition for resources, redundancy of information, or increased management costs, but no effective collaboration mechanism has been formed. For this reason, this study introduces the CCD model to further examine the coordinated development level between systems. The specific formula is as follows:
  C   =   3   × U 1   ×   U 2   ×   U 3 ( U 1   +   U 2   +   U 3 ) 3 1 3
D   = C   ×   T
Among them, C is the coupling degree of the three systems; the value range is (0, 1). The more the value of C tends to 1, the greater the coupling degree of the three systems. The opposite is true as the value of C tends more towards 0. D is the CCD of the three systems; greater D values indicate that the coordinated development level of complex systems is higher. Drawing on the studies of Gao (2012) [52] and Wang et al. (2018) [53], a CCD classification for the MEES complex system was formulated, as shown in Table 3.

4. Results

4.1. The CDL of Complex System and Its Subsystems

4.1.1. The CDL of the MEES Complex System

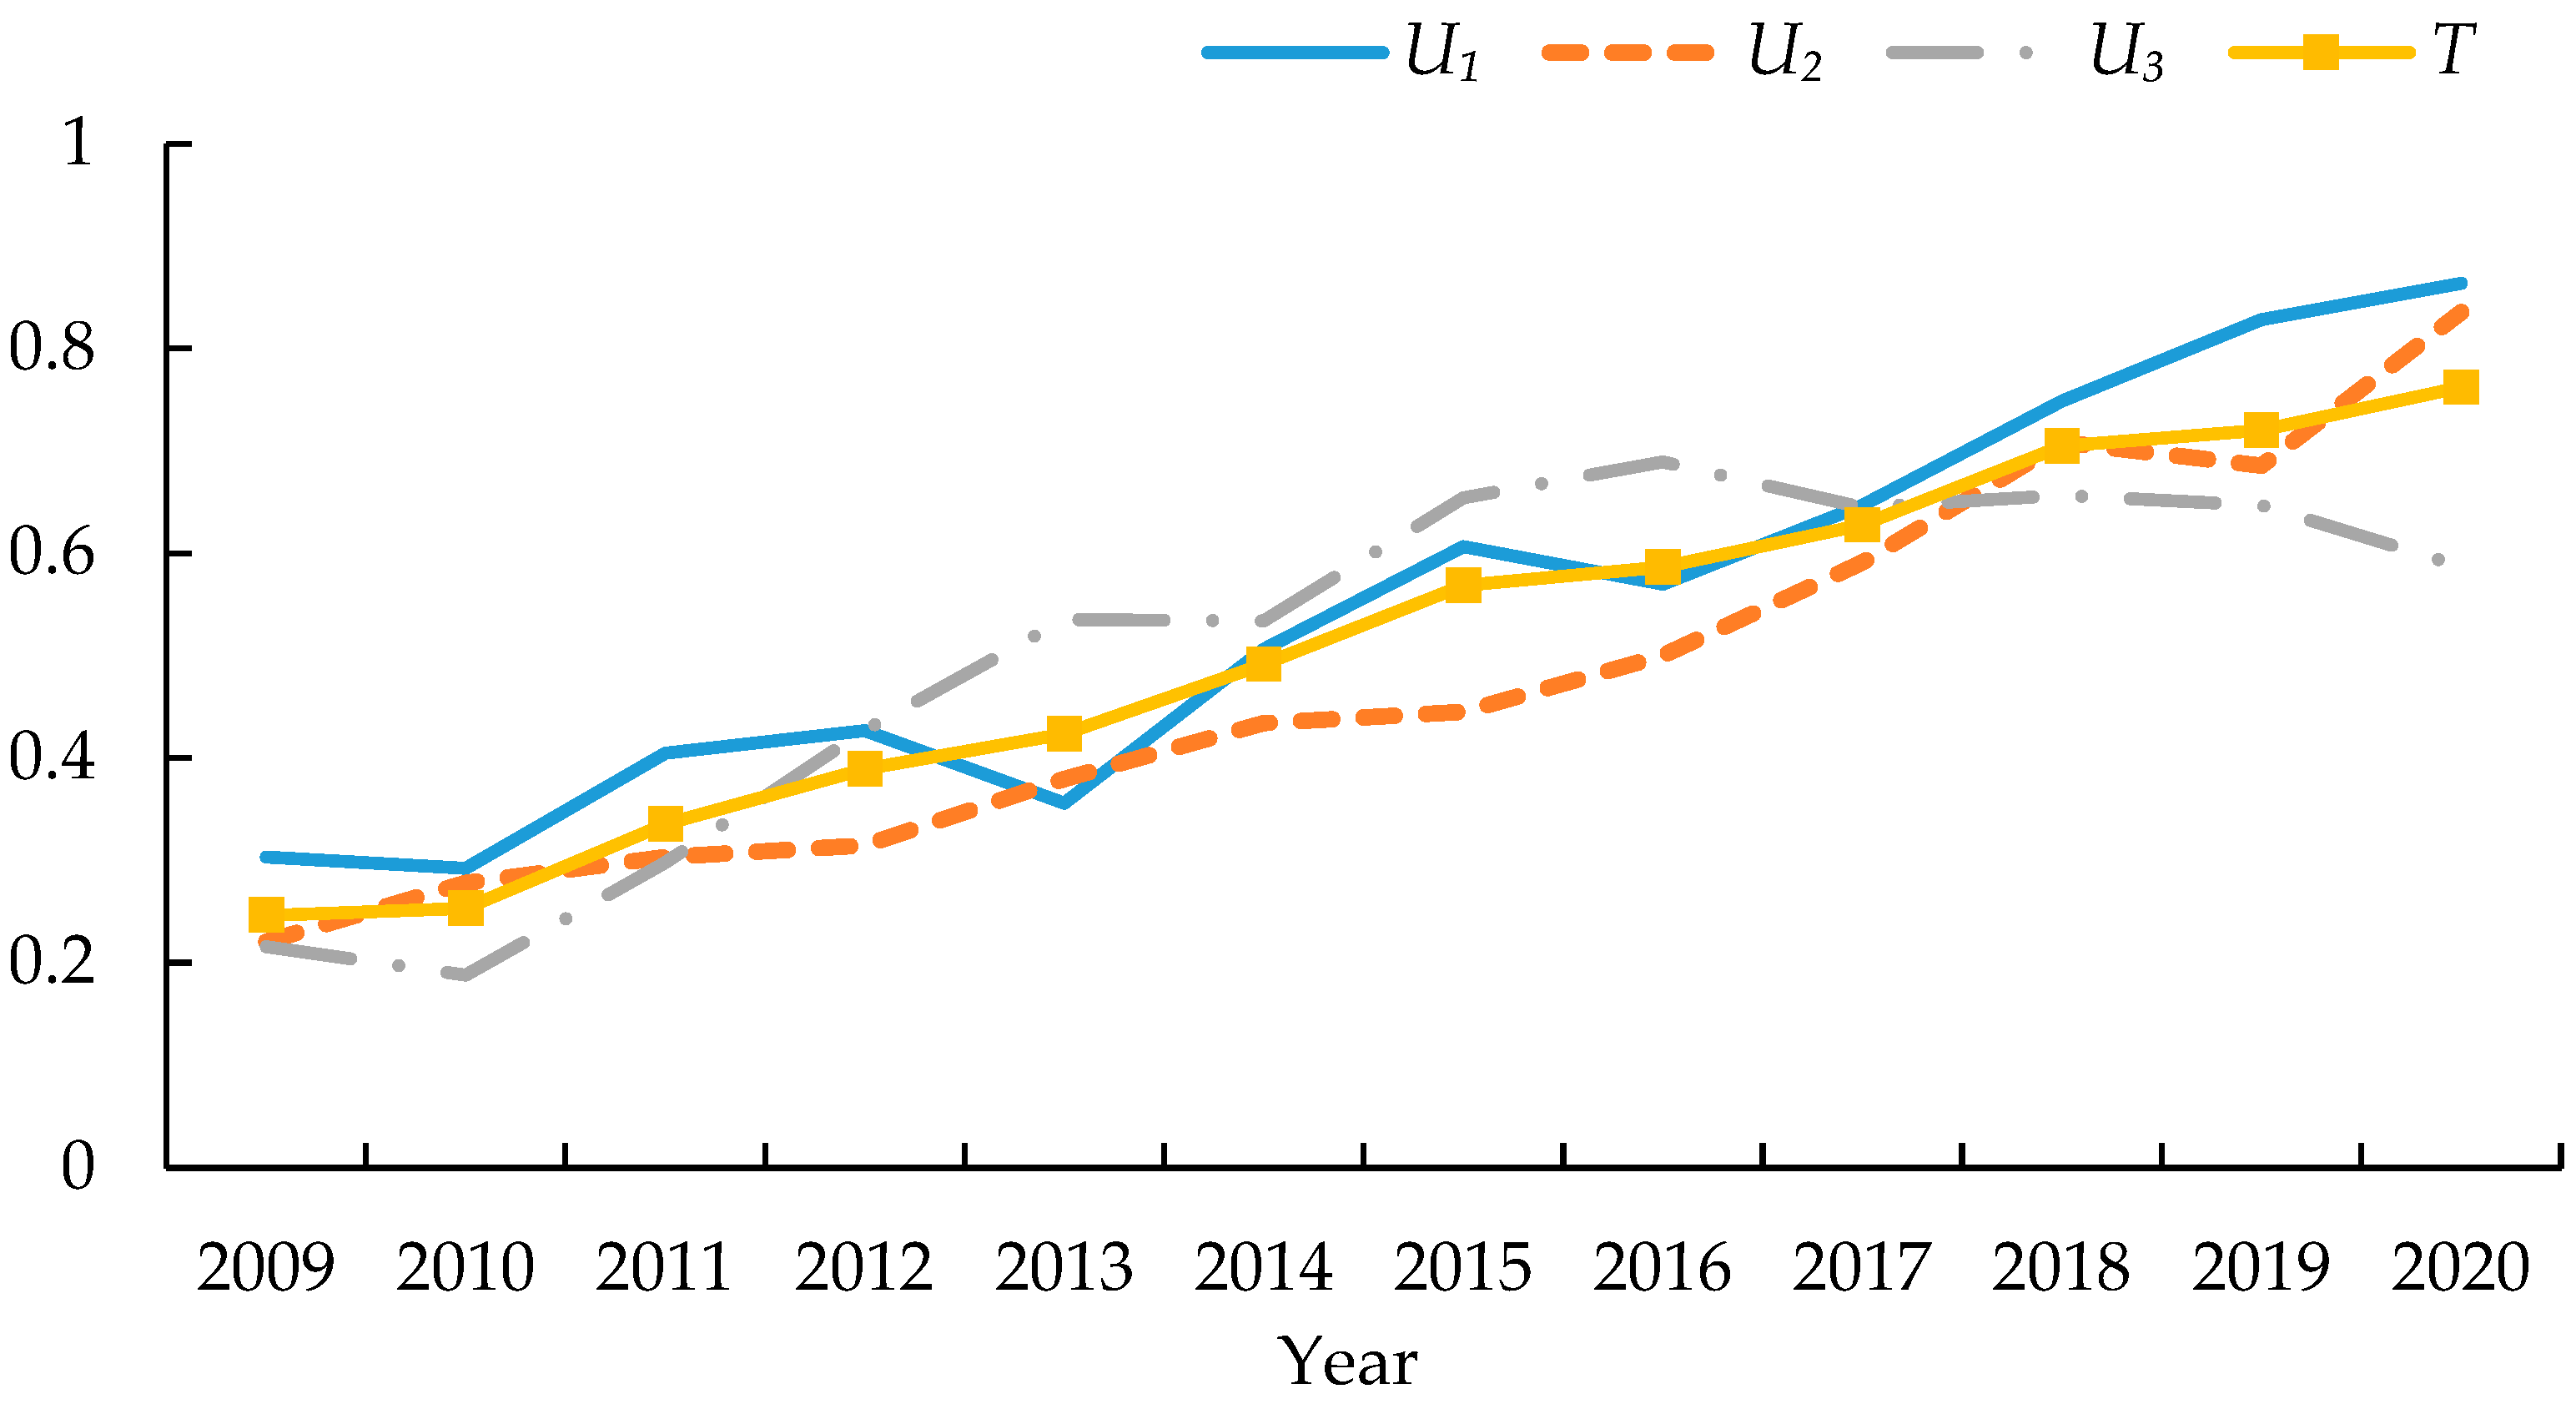
As shown in Figure 2, the CDL of the MEES complex system in China from 2009 to 2020 has shown a stepwise increase, with the CDI rising from 0.25 to 0.76, and the CDL of the complex system undergoing a qualitative change from “poor” to “excellent”. This evolutionary process can be divided into three typical stages. In the first stage (2009–2010), the CDI has stagnated in the low range of about 0.25 for a long time, reflecting that at the early stage of development, complex systems were constrained by weak technology, fragmented industrial chain, and lack of policies, and were in a state of sloppy development as a whole. In the second stage (2011–2014), the CDI jumped to the 0.34–0.49 “general” grade range, marking that the industry had entered a period of scale expansion, but land-based sources of pollution (such as the 2013 red tide disaster) and equipment and technology bottlenecks (such as wind and wave resistant nets) indicated that it was still in a state of rough development. Increasing land-based pollution (e.g., the red tide disaster in 2013) and equipment technology bottlenecks (e.g., less than 15% coverage of wind and wave-resistant nets) still constrained the development of complex systems. In the third stage (2015–2020), the CDI broke through 0.56 and climbed steadily to 0.76, bringing the CDL of the MEES complex system into the ‘excellent’ level. At this stage, the synergistic innovation of breeding equipment, intelligent management systems, and ecological mixed farming technology drove the simultaneous improvement of economic output and ecological benefits. It is worth noting that although the CDL of the complex system was increasing throughout the period, the development of the various subsystems is still characterized by a clear imbalance.

4.1.2. The Development Level of Mariculture Ecological System

Referring to the Environmental Protection Industry Standard of the People’s Republic of China [54] and combining it with the actual situation of China’s mariculture ecological environment, the grading benchmarks for the development index of China’s mariculture ecological system were determined (see Table 4).
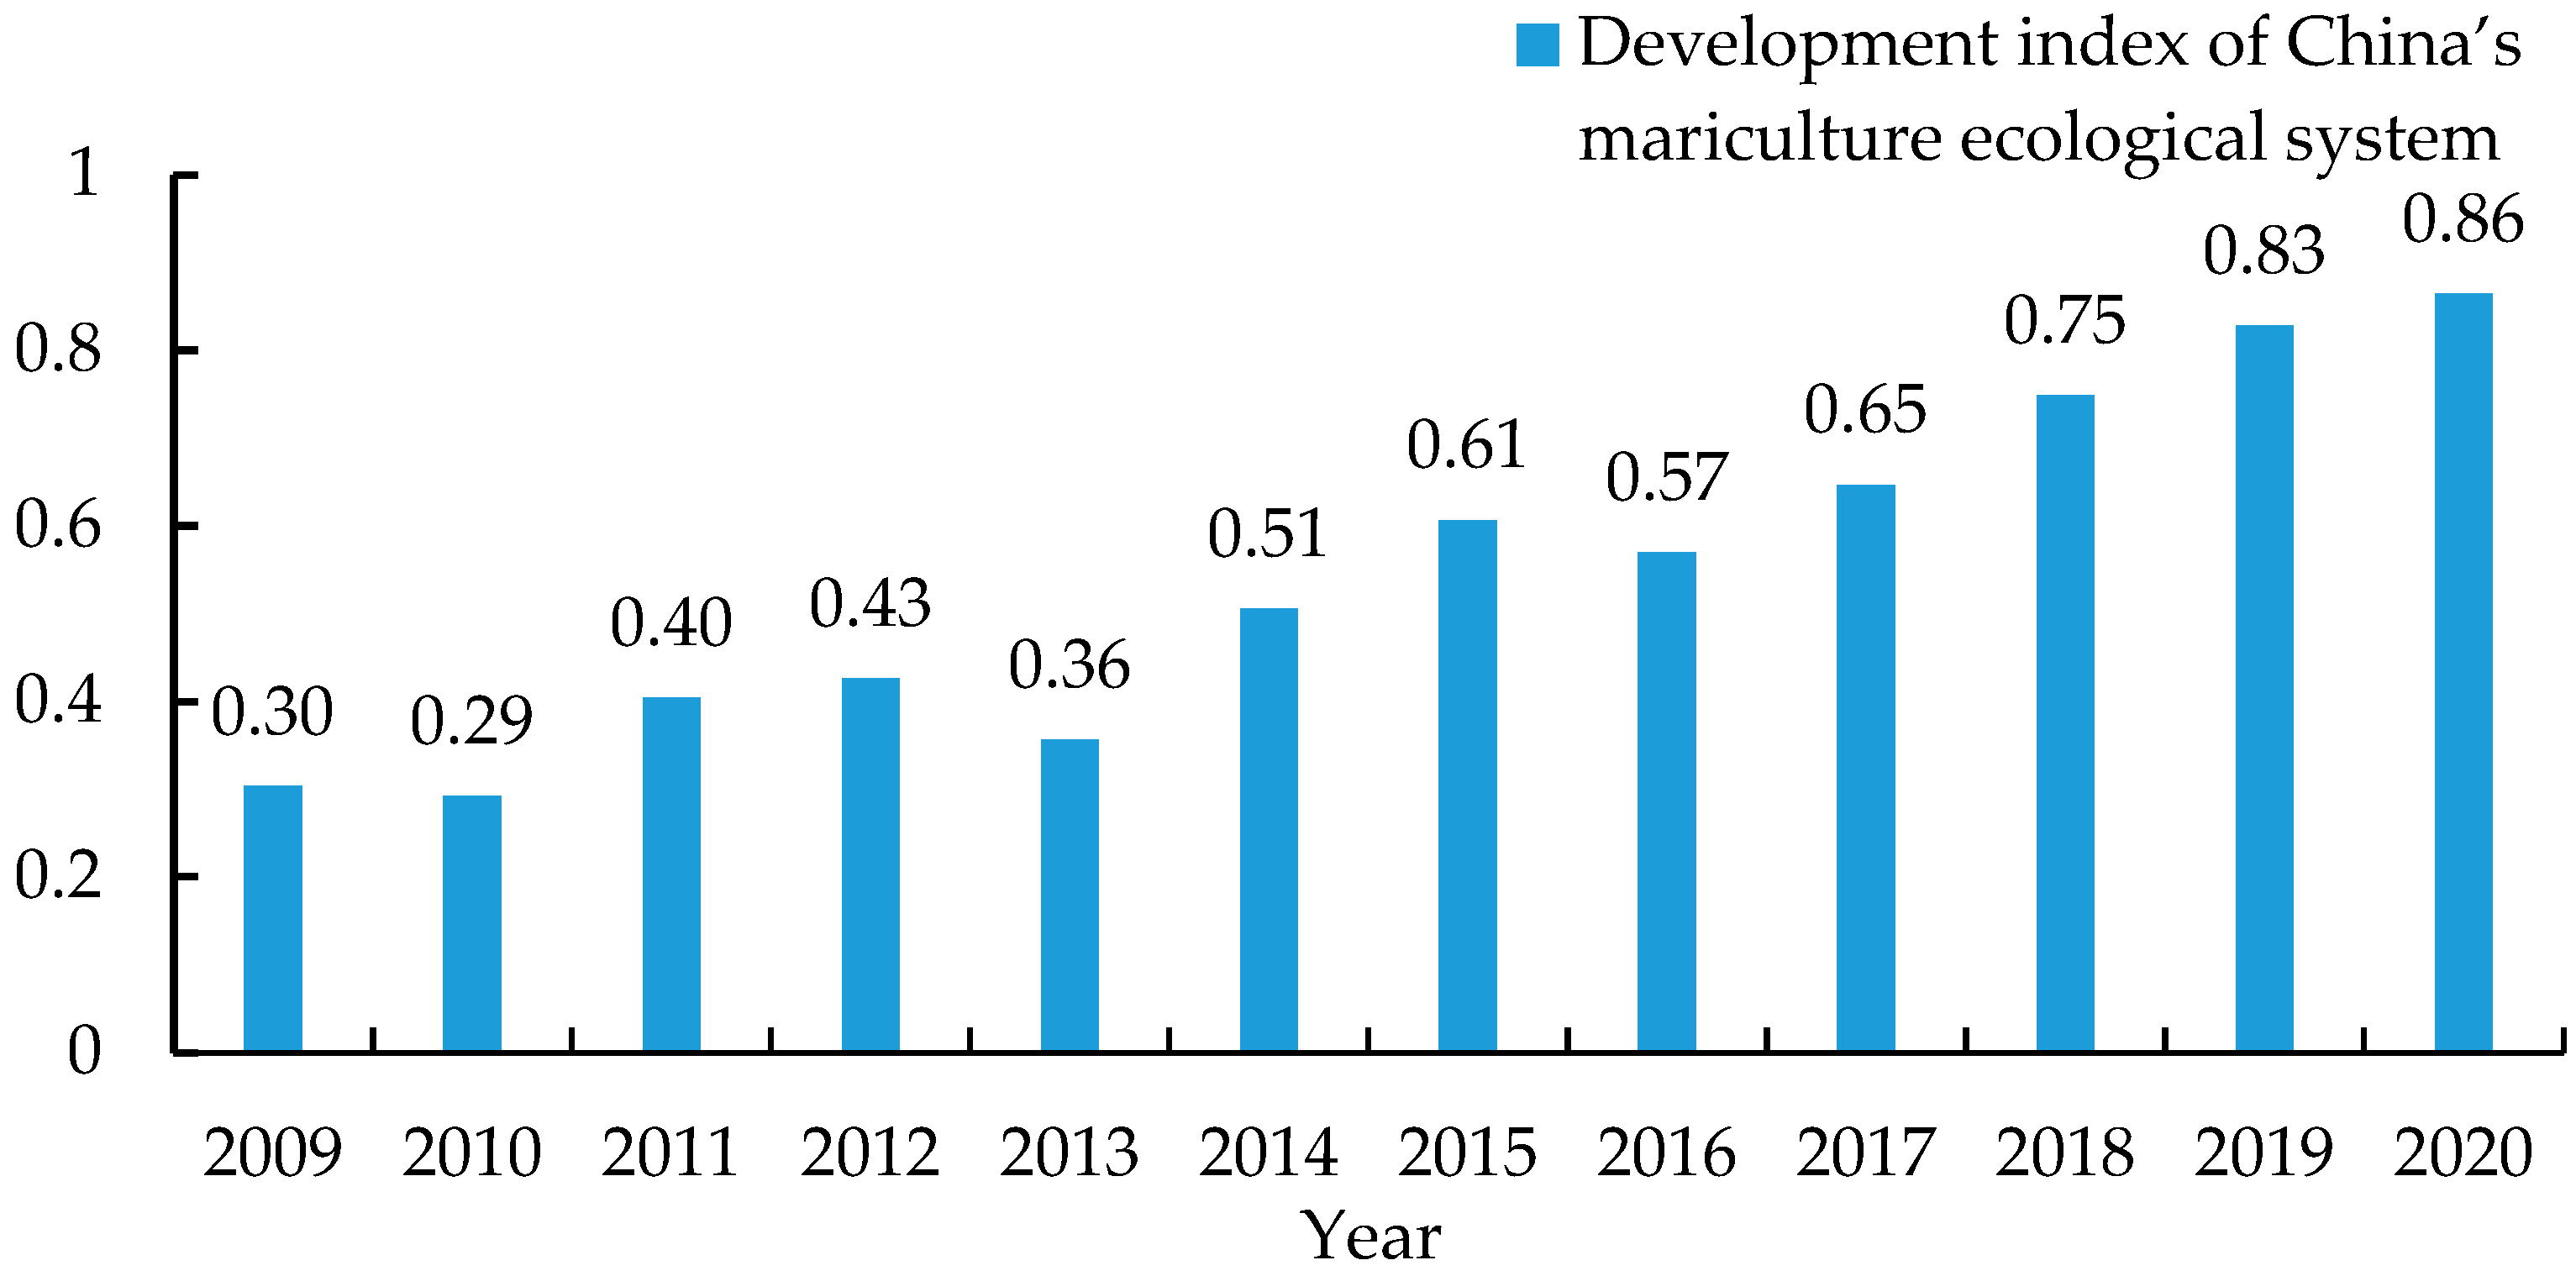
As shown in Figure 3, the development level of China’s mariculture ecological system showed a wave-like upward trend from 2009 to 2020. Specifically, from 2009 to 2012, the development index jumped from 0.30 to 0.43, with an average annual increase of 12.75%, which pushed the system from “low level” to “medium level”. In 2013, due to the double impact of a strong typhoon disaster and a sudden increase in the amount of pollutants entering the sea from land-based sources, the index dropped by 16.28 percentage points compared with 2012, highlighting the vulnerability of the mariculture ecological system. From 2014 to 2020, it entered a phase of resilient growth: despite a brief pullback in 2016 due to the red tide disaster, the rest of the years maintained a steady rise. In particular, driven by the promotion of deep-sea aquaculture technology (e.g., the popularization rate of smart nets) and ecological restoration policies, the development index exceeded 0.86 in 2020, and the quality rating jumped to “high level”, marking the synergistic enhancement of the industry’s risk-resistant ability and sustainable development ability.

4.1.3. The Development Level of the Mariculture Economic System

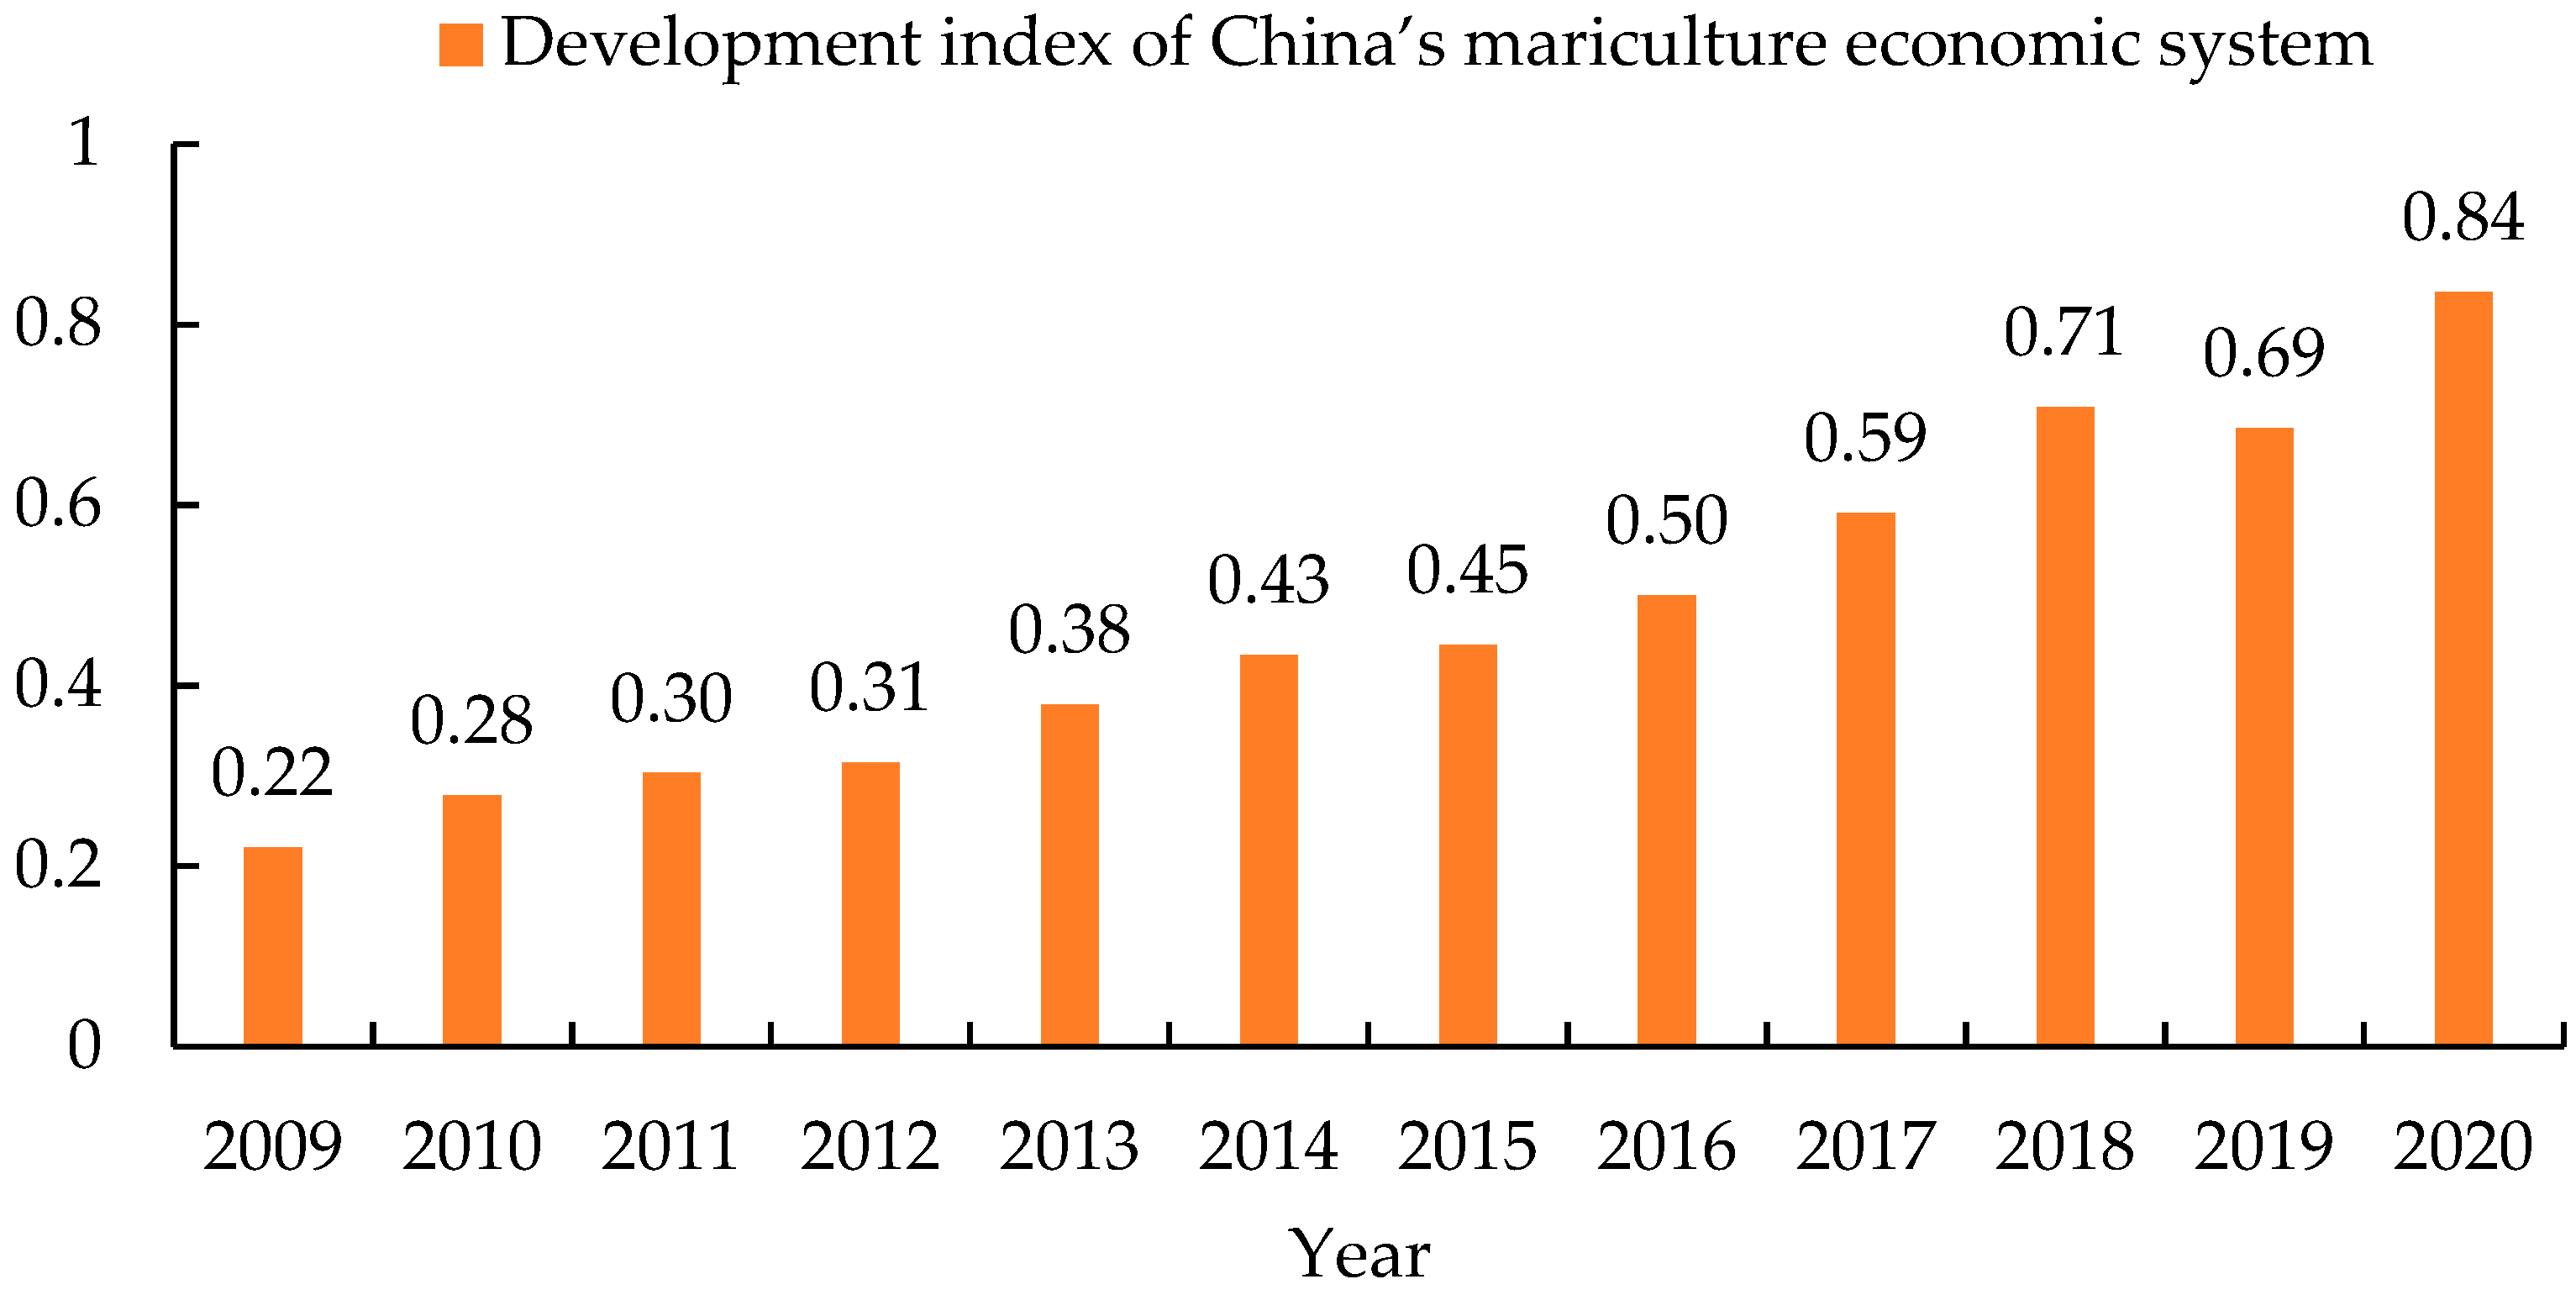
As shown in Figure 4, the overall development index of China’s mariculture economic system showed an exponential leap from 2009 to 2020, growing significantly from 0.22 to 0.84, with an average annual growth rate of 12.95%, highlighting the sustained and accelerated development of the industrial economy. It is worth noting that this growth trajectory was briefly retraced in 2019. The slight decline in the index that year was mainly attributed to the transmission of dual pressures: first, the number of marine motorized aquaculture fishing vessels plummeted by 4.8% (from 65,082 in 2018 to 61,938 in 2019), and the contraction of the radius of traditional fishing operations led to the phased pressures on offshore production capacity; second, the cost structure deteriorated significantly, with diesel fuel prices soaring by 22% year-on-year, superimposed on the demand for seedling replenishment after the typhoon disaster had pushed up the procurement cost, and the profit margin of breeding had been significantly compressed. Nevertheless, the industry’s resilience would still support its return to a high level in 2020, confirming the strong risk-resistant ability of the mariculture economic system under the technological upgrading and policy empowerment.

4.1.4. The Development Level of Mariculture Social System

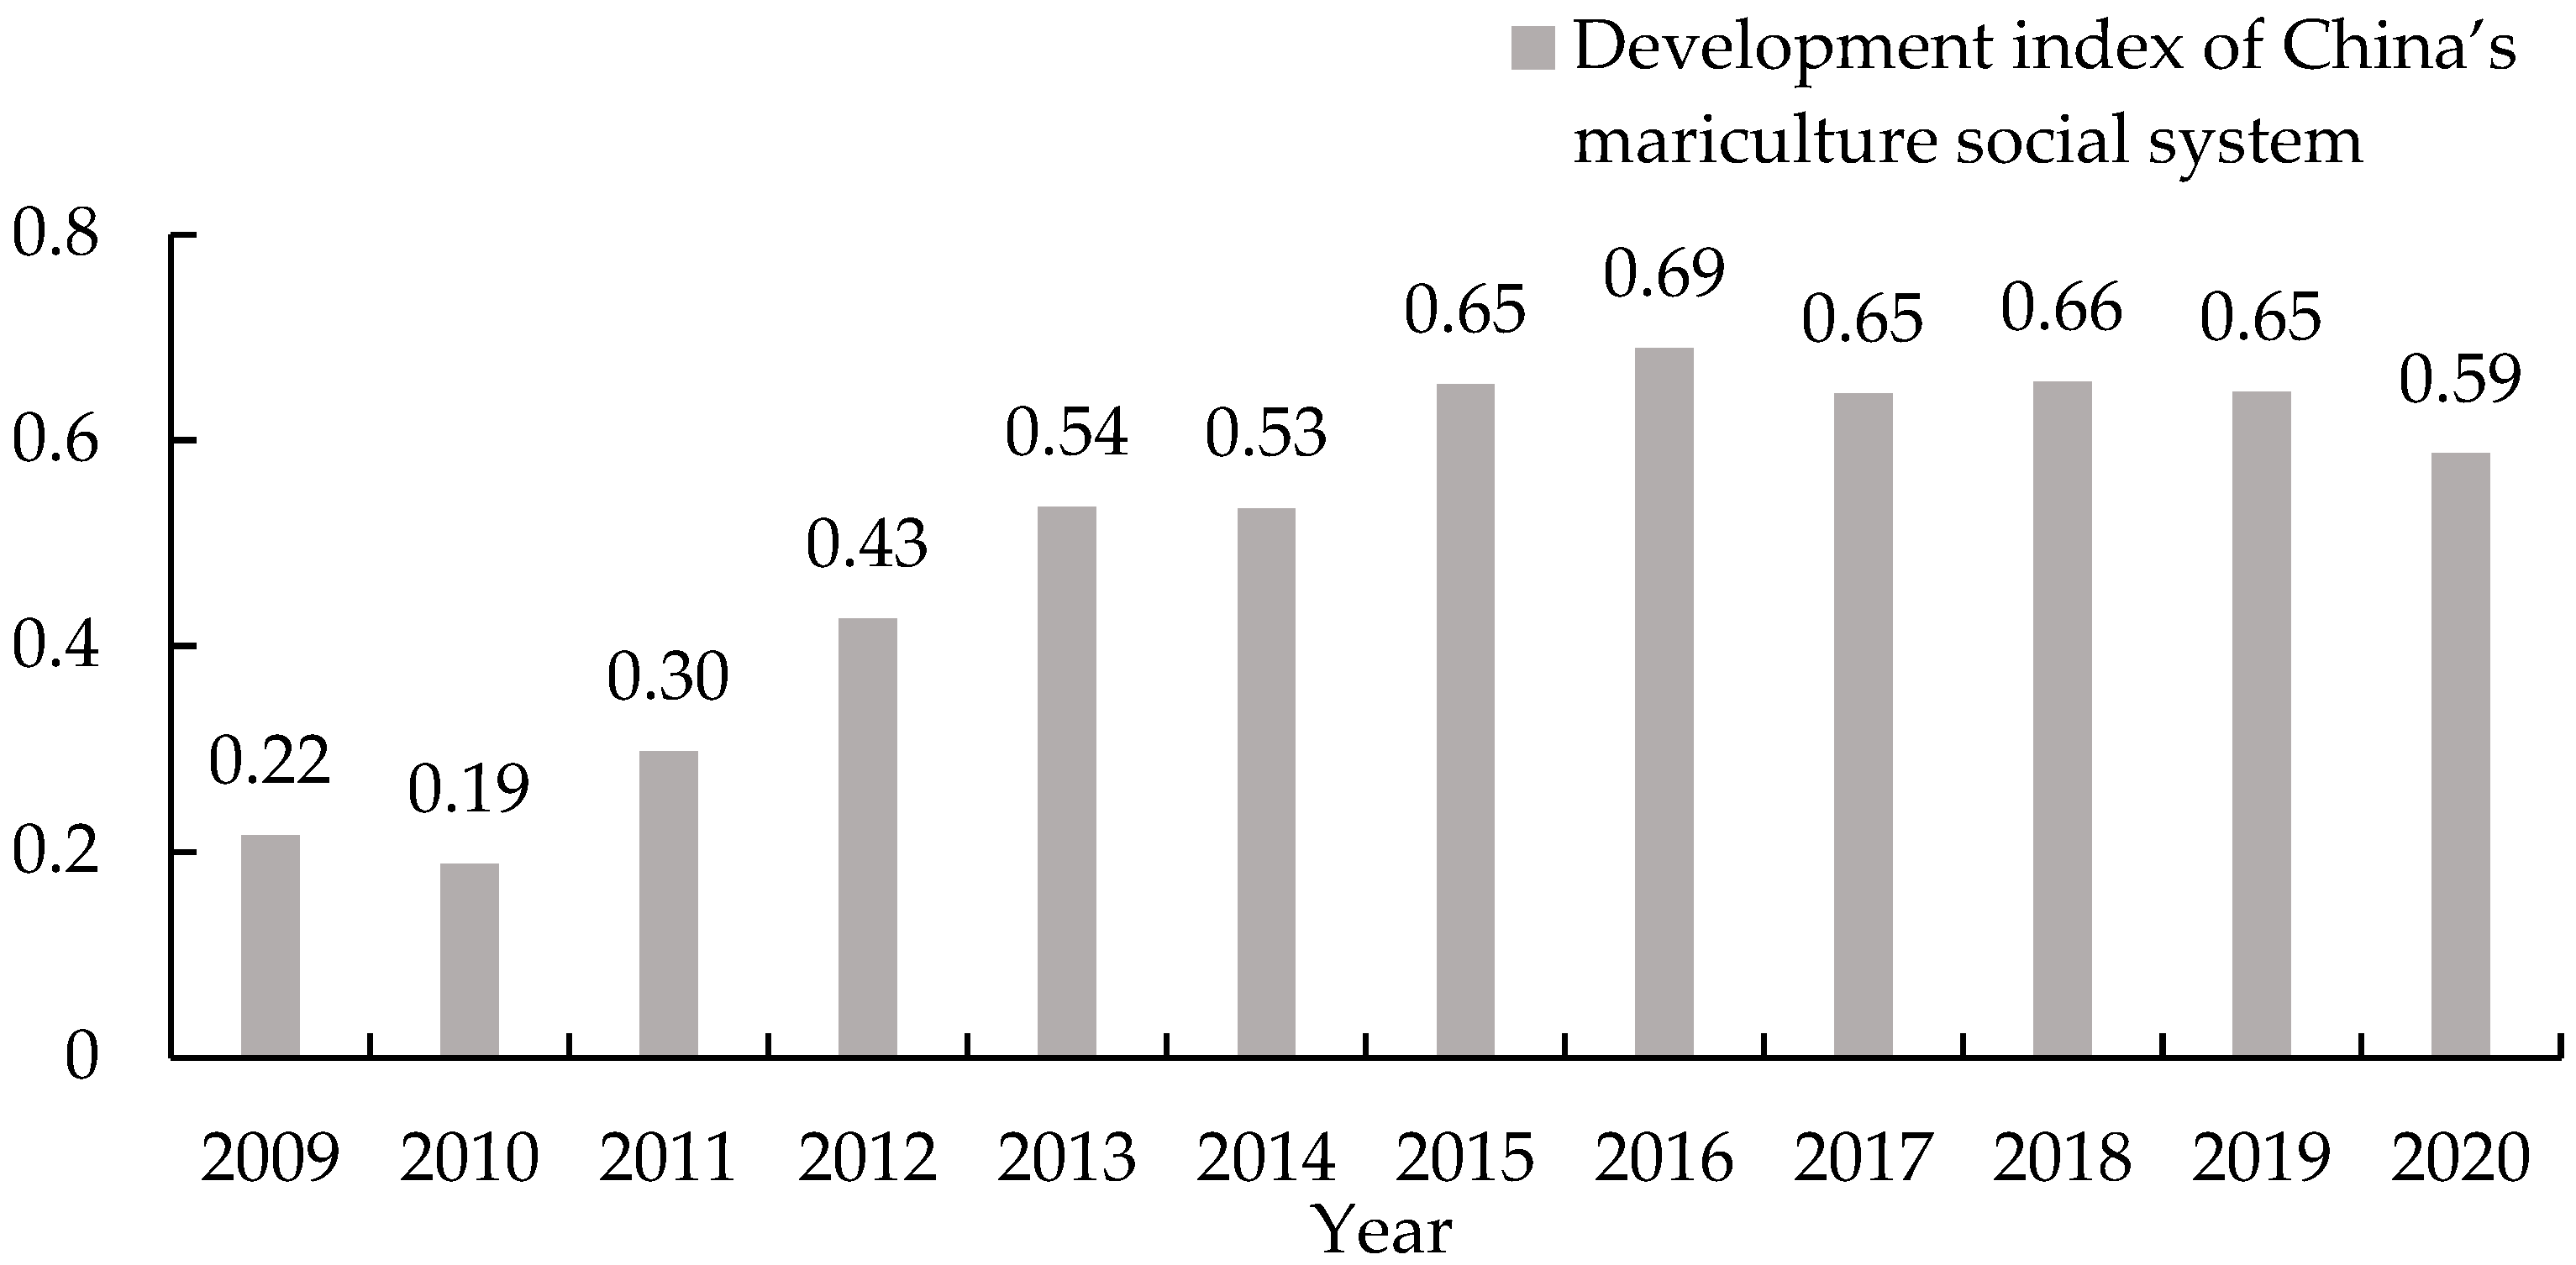
As shown in Figure 5, between 2009 and 2020, the development index of China’s mariculture social system as a whole presents a dynamic characteristic of “first up, then down”, which is roughly divided into two stages with significant differences. The first phase (2009–2016) witnessed a strong jump in the development index, with an increase of about 214%, reflecting the remarkable development and optimization of the system in the early stage. However, entering the second phase (2017–2020), the development index dynamics took a turn for the worse and began to show a mild but persistent decline. The reason for this is closely related to the shrinking investment in industrial pollution control (especially wastewater and exhaust gas control) in the coastal areas during the same period, as well as the reduction in the frequency of aquatic technology promotion and training for fishermen. As a result, the development index gradually declined from a high of 0.65 in 2017 to 0.59 at the end of the 2020 period, indicating the development challenges faced during a particular period of adjustment in the allocation of social resources.

4.2. The CCD of the MEES Complex System

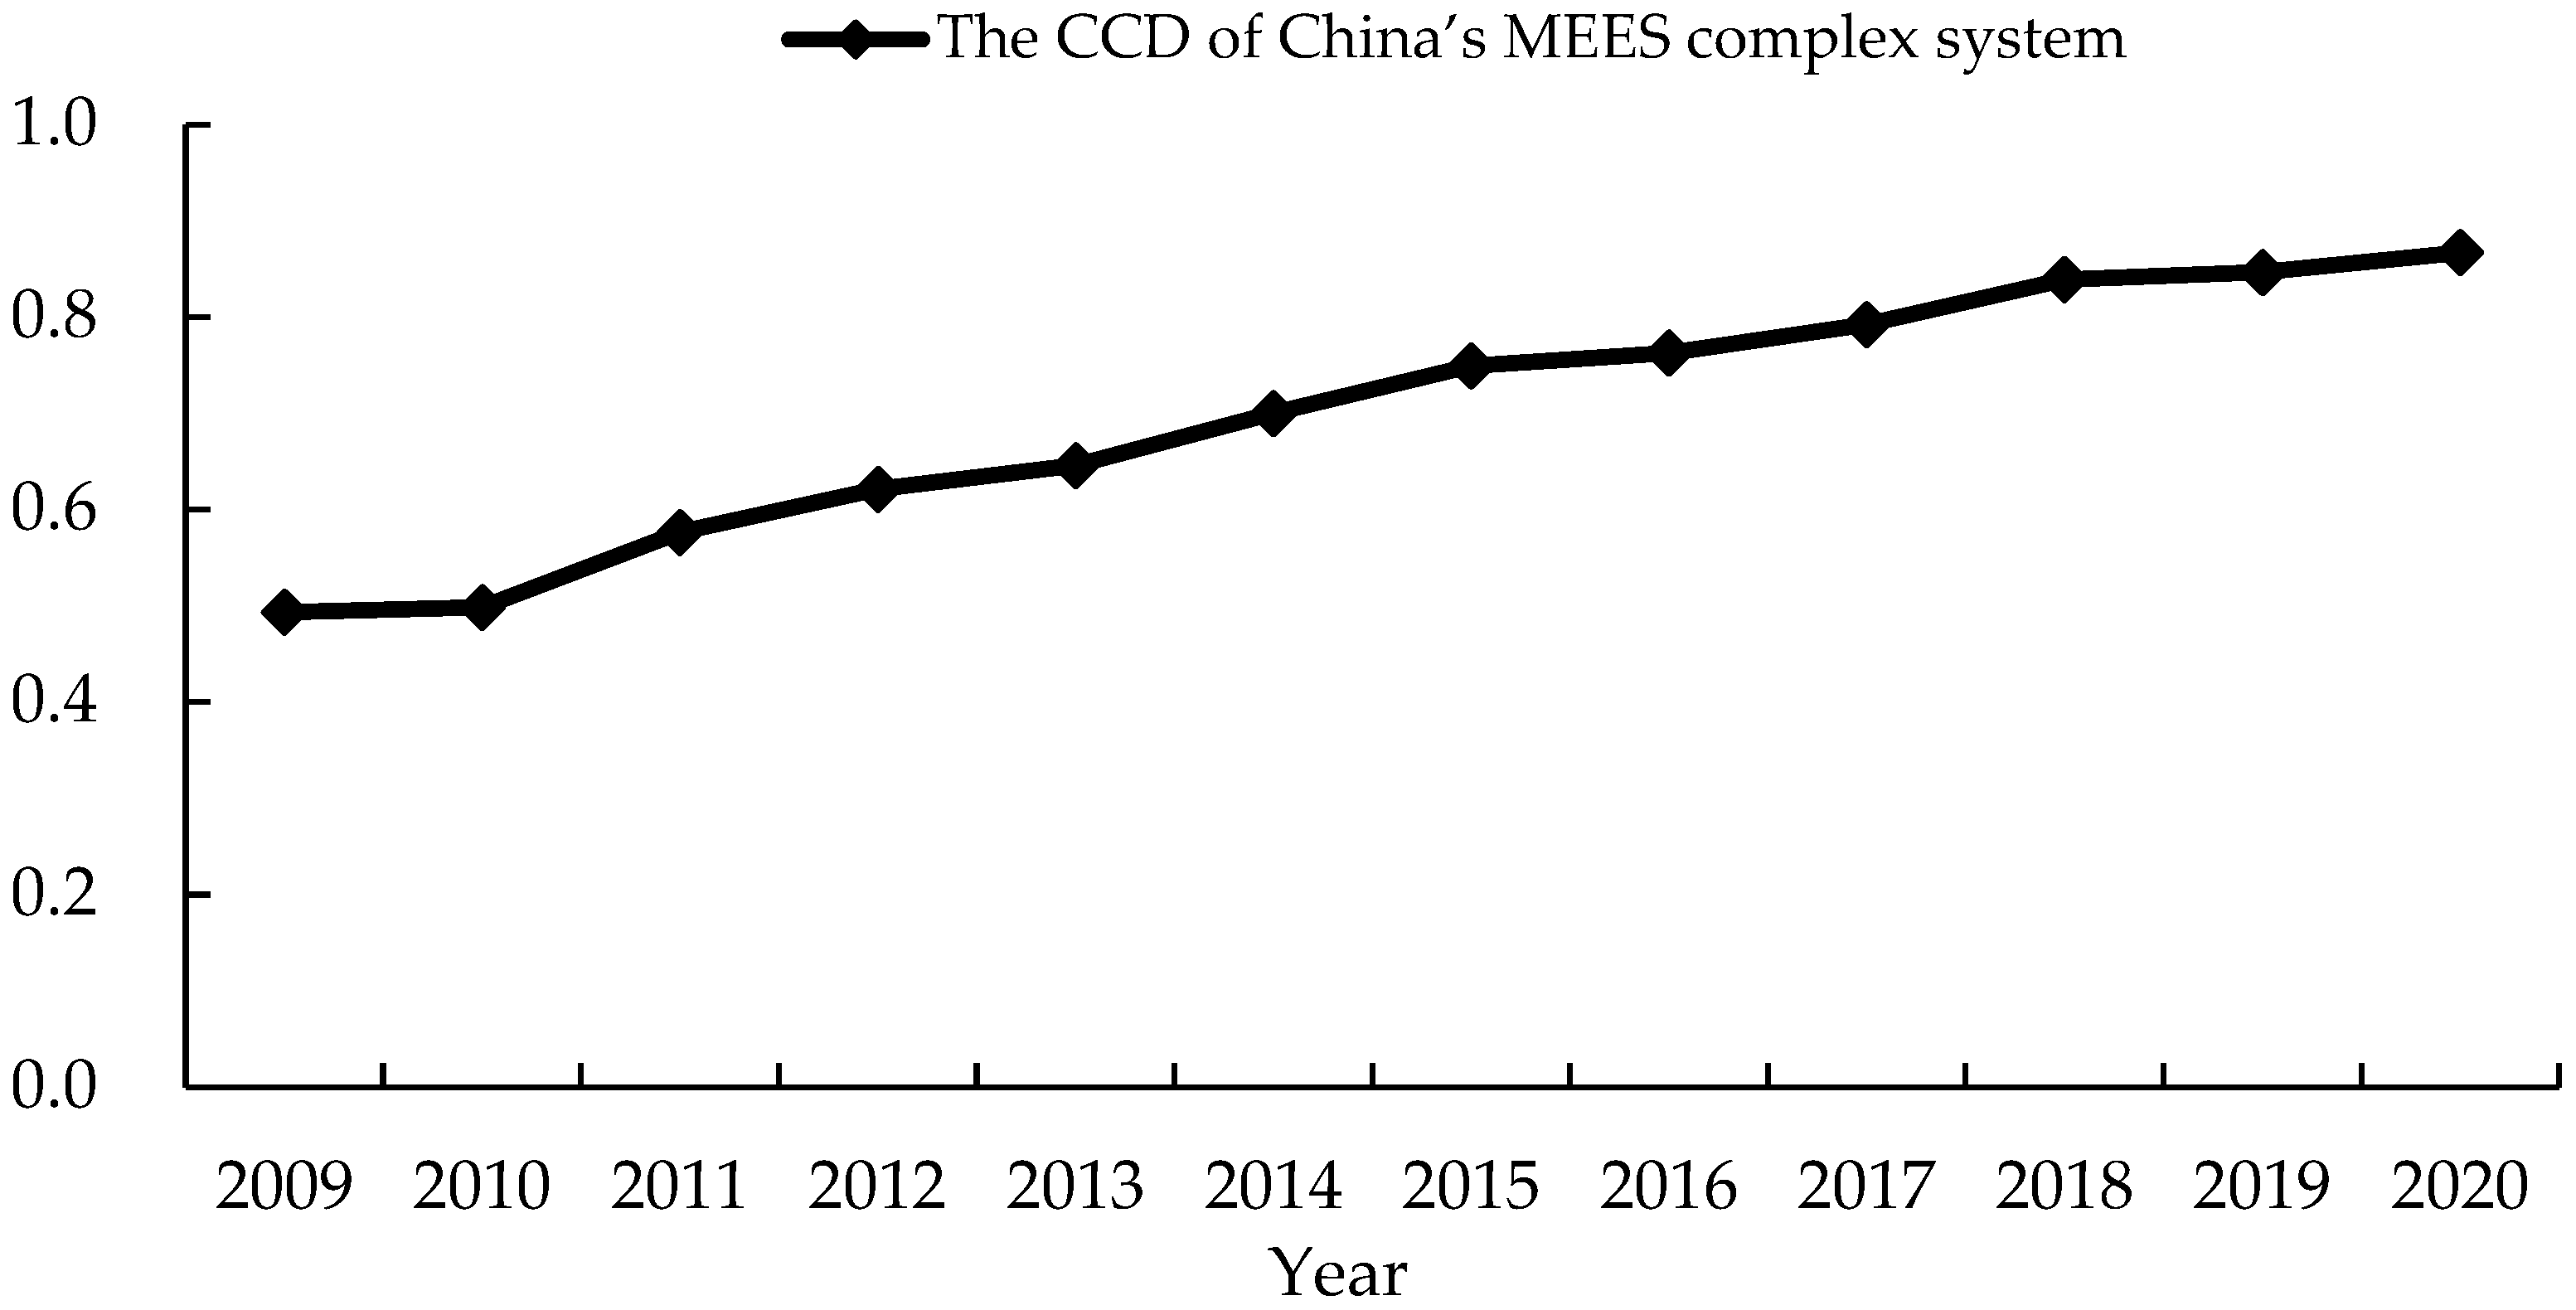
As can be seen from Figure 6 and Table 5, the CCD of China’s MEES complex system from 2009 to 2020 showed a stepwise strengthening trend, from 0.49 in 2009 to 0.87 in 2020, after a complete leap of “near-dissonance → barely coupling coordination → primary coordination → intermediate coordination → good coordination”. This evolutionary process is essentially the result of the dynamic game between the CDL (T-value) and the coupling degree (C-value) of the complex system: although the coupling degree (C-value) of the complex system in the study period is always higher than 0.9, indicating that the internal interaction of the complex system is highly close, the stage difference in the CDL (T-value) dominates the rhythm of the jump of the CCD (D-value). Specifically, in 2009–2014, the complex system is at a low level of equilibrium, with the T-value constrained by the vulnerability of the ecological system (e.g., increased land-based pollution) and the roughness of the economic system (e.g., low degree of industrial intensification), and the level of coordinated development is only at the level of “poor or general”, resulting in a long-lasting stagnation in the range from near-dissonance to primary coordination in terms of the CCD. In 2015–2020, the T-value breaks through the bottleneck and rises to the “good or excellent” level, driving the CCD (D-value) to intermediate coordination (2015–2017) and eventually to good coordination (2018–2020). This qualitative change stems from the triangular empowerment of technology–policy–capital: the progress of breeding equipment reduces ecological disturbance, the blue granary strategy optimizes resource allocation, and the injection of social capital accelerates industrial intensification, which synergistically promotes the system to break through the coordination trap of “high coupling–low development”.
It is noteworthy that despite significant interactions and dependencies within China’s MEES complex system throughout the period (high coupling), most years (2009–2017) failed to achieve mutually beneficial promotion and efficient coordination among subsystems (high coupling coordination). This is because CDI addresses the question of whether subsystems are tightly coupled, while CCD addresses whether subsystems are well coordinated. CDI (approaching 1) merely indicates strong interactions between subsystems, but this does not necessarily imply positive development—it may signal intense mutual constraints or conflicts. CCD, however, further quantifies the extent to which such interactions promote the overall coordinated development of complex systems toward higher levels. This state of “high coupling, low coordination” reflects deep-seated contradictions within the industry’s development. It stems from the combined effects of uneven development, structural imbalances, technological and management shortcomings, and imperfections in policy and market mechanisms.

5. Discussion

Since the official release of the Outline of the Twelfth Five-Year Plan for National Economic and Social Development of the People’s Republic of China in 2011 [55], the Chinese government has taken numerous measures to promote the green transformation of domestic industries, including mariculture industry [56]. In recent years, the Chinese government has accelerated the transformation and restructuring of the mariculture industry and promoted the transformation and upgrading of the fishery industry by taking the concept of green development as its leading role, aiming to improve quality and efficiency, reduce quantity and increase income, develop in a green manner and enrich fishermen, and orient itself towards healthy aquaculture, moderate fishing, protection of resources, and strengthening of the industry [57,58]. As a result, the level of development of the ecological, economic, and social systems of mariculture has increased by varying degrees during this period, leading to a sustained increase in the CDL and CCD of the MEES complex system in China.
Nevertheless, China’s mariculture industry is facing the double impact of high pressure of land-based pollution and the chain impact of marine disasters. In terms of land-based pollution, heavy metals (lead, cadmium) and polycyclic aromatic hydrocarbons from coastal industrialized areas are directly discharged into the sea through runoff, superimposed on the residual bait and excreta deposits generated by aquaculture itself, resulting in the formation of “industrial—aquaculture” composite pollution. The lack of regulation has exacerbated ecological degradation, and according to the China Marine Environmental Status Bulletin, 80% of the sea areas adjacent to outfalls in individual years (e.g., 2013) were unable to meet the environmental protection requirements of functional zones [59]. Marine disasters further amplify the systemic risk: storm surges caused by super-strong typhoons destroy offshore net pens, such as the 2018 “Mangosteen” typhoon, which caused direct economic losses of 2.457 billion yuan in a single event, and the frequent occurrence of red tides (with a cumulative area of 23.2 thousand square kilometers in 2021), which lead to the enrichment of shellfish toxins and the decline of biodiversity. Land-based pollution and marine disasters form a negative feedback loop—eutrophic waters exacerbate red tide outbreaks, while storm surges stir up pollutants and accelerate ecological degradation, ultimately highlighting the vulnerability of the mariculture ecological system.
In the field of the marine aquaculture economic system, the nature of the phased retracement of the development index in 2019 is a structural response under the double pressure of capacity–cost. At the level of capacity contraction, the number of marine motorized fishing vessels decreased by 4.8% (65,082 → 61,938 vessels) compared to 2018, which directly led to the contraction of the radius of bottom-planting augmentation operations, and shellfish aquaculture, which relies on fishing vessels to drop off fry, bore the brunt of the impact: abalone bottom-planting zones in Shandong consequently saw an 18% reduction in production, which refracted the traditional mode of production affected by the impact of policy adjustments; at the level of cost escalation, which manifested itself in the dual inflation of the prices of energy-bio-assets, diesel’s average price rose by 5% year-on-year (6384 → 6685 yuan/ton), which pushed up the proportion of logistics costs. This was exacerbated by the typhoon; after the disaster, a seedling replenishment demand surge was induced by seedling price fluctuations, and the two forces superimposed on the depth of compression of farming profit margins and ultimately triggered a short-lived fall in the development index of the mariculture ecological system.
In terms of the mariculture social system, the reduction in investment in industrial three-waste (waste water, waste gas, waste solid) management in coastal areas and the weakening of aquaculture technology promotion and training are forming a systematic impact, from the weakening of the carrying capacity of the environment and the technological intergenerational fault at two levels. Specifically, the lack of industrial pollution control has led to an increase in the direct discharge of heavy metals, polycyclic aromatic hydrocarbons, and other toxic pollutants into the sea, and the continuous deterioration of water quality in aquaculture areas, increasing the risk of near-shore eutrophication. The superposition of aquaculture discharges induces ecological disasters such as red tides; the break in the chain of technology promotion has resulted in fishermen’s groups being unable to master healthy aquaculture technology, forcing them to continue the high-pollution production mode, and the lack of scientific guidance on the use of medication has resulted in drug abuse and product safety risks, while the popularization of tailwater treatment technology has stagnated, forming a vicious cycle of “increased pollution → technology lagging behind → environmental deterioration”. These two core contradictions are intertwined with each other, ultimately leading to a slight downward trend in the development index of the mariculture social system since 2017.
The CDM of the MEES complex system revealed in this study—its core challenge (how to balance ecological conservation, economic development, and social welfare) and intrinsic mechanism (coupling relationships among subsystems)—is not unique to China but a common issue faced by many nations. As a vital pillar of global food security and blue economic growth, mariculture has fostered distinctive development models and practical experiences across different regions worldwide.
The U.S. mariculture exhibits characteristics of “high-tech and intensive operations,” with its core strengths lying in genetic breeding, land-based recirculating aquaculture systems, and product quality control [60]. European mariculture, exemplified by Norway’s salmon and trout farming, Mediterranean cage farming, and North Atlantic mixed shellfish–algae cultivation, has developed into an ecologically intensive model driven by stringent regulations [61]. As one of Asia’s most advanced nations in marine aquaculture technology, Japan possesses extensive experience in high-density cage farming and land-based recirculating aquaculture systems, with legislation in place to ensure the sustainability of aquaculture practices [62]. Southeast Asia’s marine aquaculture industry, dominated by shrimp and seaweed cultivation, leverages its warm climate, low-cost labor, and abundant aquatic resources to serve as a global hub for shrimp seedling and carrageenan raw material supply [63].
These experiences not only reflect regional variations in natural resource endowments and socioeconomic conditions but also demonstrate the diverse pathways through which technology empowers industrial transformation and upgrading. By synthesizing these international experiences, valuable insights and references can be provided for the sustainable development of global mariculture.

6. Conclusions

In terms of research methodology, while most existing studies focus on environmental protection and economic development, with some incorporating social factors, none include management capacity or technology promotion. Furthermore, the CDM of the MEES system remains insufficiently explored. To address these gaps, this paper analyzes the CDM of the MEES complex system, constructs a CDEIS for the MEES complex system, and adopts the comprehensive evaluation model and the CCD model to empirically analyze the coordinated development level of the MEES complex system in China from 2009 to 2020. This approach demonstrates strong foresight and novelty.
The results showed that the CDL of China’s MEES complex system has improved significantly during this period, with the CDI increasing from 0.25 in 2009 to 0.76 in 2020, marking a qualitative transition from “poor” to “excellent”. It is worth noting that, although the CDL of the complex system increased throughout this period, significant imbalances persisted among its subsystems. Specifically, the development level of the ecological system has shown a fluctuating upward trend, with the development index jumping from 0.30 to 0.86, pushing the system from a “low level” to a “high level”; the development index of the economic system has shown an exponential jump from 0.22 to 0.84, with an average annual growth rate of 12.95%, highlighting the sustained and accelerated development of the industrial economy; and the development index of the social system as a whole shows the dynamic characteristic of “rising first and then falling”, with the slight decline since 2017 showing the development challenges faced in the period of adjustment of the allocation of specific social resources.
The CCD of China’s MEES complex system showed a stepwise strengthening trend, from 0.49 in 2009 to 0.87 in 2020, experiencing phases of near dissonance, barely coupling coordination, primary coordination, and intermediate coordination, before finally reaching a stage of good coordination. This evolution resulted from the dynamic interplay between the CDL and the coupling degree: although the system coupling degree remained consistently above 0.9 during the study period, stage differences in CDL dominated the rhythm of CCD transitions.
Although this study ensured the objectivity of indicator weighting through the entropy weight method and employed k-means clustering to classify the CDL of the complex system, the dependence of the research conclusions on the selected specific methods has not been empirically tested. For instance, this study did not examine whether alternative clustering algorithms like hierarchical clustering or Gaussian mixture models would yield comparable classification results. Nor did it compare whether other multi-criteria decision-making (MCDM) approaches—such as AHP, DEMATEL, or TOPSIS—would produce consistent CCD results. Consequently, our findings should be interpreted within the framework of “method selection.” A key direction for future research is to conduct comprehensive robustness testing of this study’s core findings using multiple clustering techniques and MCDM approaches.
Future research comparing different clustering techniques can further enhance the robustness of classification results. At the same time, we encourage and recommend that subsequent studies attempt to integrate or compare multiple MCDM approaches to conduct more comprehensive sensitivity analyses. Through such multidimensional comparative validation, future research can not only cross-validate the findings of this study but also more deeply reveal the applicability and differences in various methods in addressing similar problems. This will provide richer, more reliable methodological support and a refined decision-making framework for evaluating the coupling coordination degree of the MEES complex system.
With the deepening of China’s ecological civilization construction and the comprehensive implementation of its “dual carbon” strategy (carbon peaking and carbon neutrality), green and low-carbon transformation of the MEES complex system has become imperative. We recommend that China spare no efforts in the following:
(1)
Deepening basic research to preliminarily explore the interaction mechanisms between aquaculture activities and marine ecosystems, providing scientific support for the precise regulation of aquaculture capacity and the optimization of environmental management;
(2)
Accelerating intelligent empowerment through internet of things, big data, and artificial intelligence technologies to establish a smart aquaculture management platform, enabling initial precision control over water quality monitoring, feeding regulation, and disease early warning;
(3)
In regions where conditions permit, small-scale pilot projects integrating aquaculture with tourism or science education may be considered as appropriate, to conduct preliminary assessments of their potential for enhancing economic value-added and ecological compatibility.
Through multidimensional coordination among technological innovation, industrial upgrading, and policy synergy, we aim to establish a paradigm for China’s MEES coordinated development.

Author Contributions

Conceptualization: R.P. (Runsheng Pei) and H.Z.; formal analysis: R.P. (Runsheng Pei); funding acquisition: R.P. (Runsheng Pei); methodology: R.P. (Runsheng Pei) and A.G.; project administration: X.L. and X.H.; supervision: R.P. (Runsheng Pei), Y.M. and H.Z.; writing—original draft: R.P. (Runsheng Pei); writing—review and editing: R.P. (Runsheng Pei), H.Z., M.H.S., Y.Z., A.G., R.P. (Runfeng Pei) and R.W. All authors have read and agreed to the published version of the manuscript.

Funding

This study is supported by the Doctoral Research Fund of Qingdao Institute of Technology (No. BS2025018).

Data Availability Statement

Data will be made available on request.

Acknowledgments

We thank the editors and the anonymous reviewers for their insightful comments and constructive suggestions.

Conflicts of Interest

The authors declare that they have no known competing financial interests or personal relationships that could have appeared to influence the work reported in this paper.

Abbreviations

The following abbreviations are used in this manuscript:
CCDCoupling coordination degree
CDEISCoordinated development evaluation indicator system
CDIComprehensive development index
CDLComprehensive development level
CDMCoordinated development mechanism
EESEcological–economic–social
ESEEconomic–social–environmental
MCDMMulti-criteria decision-making
MEESMariculture ecological–economic–social

References

  1. Steele, J.H.; Turekian, K.K.; Thorpe, S.A. Encyclopedia of Ocean Sciences, 2nd ed.; Academic Press: Oxford, UK, 2009; pp. 537–544. [Google Scholar]
  2. Jie, X.; Limin, H.; Wei, Y. Research on the ecologicalization efficiency of mariculture industry in China and its influencing factors. Mar. Policy 2022, 137, 104935. [Google Scholar] [CrossRef]
  3. Alleway, K.H.; Gillies, L.C.; Bishop, J.M.; Gentry, R.R.; Theuerkauf, S.J.; Jones, R. The Ecosystem Services of Marine Aquaculture: Valuing Benefits to People and Nature. BioScience 2019, 69, 59–68. [Google Scholar] [CrossRef]
  4. Liu, Y.; Wang, Z.; Yang, X.; Wang, S.; Liu, X.; Liu, B.; Zhang, J.; Meng, D.; Ding, K.; Gao, K.; et al. Changes in mariculture and offshore seawater quality in China during the past 20 years. Ecol. Indic. 2023, 157, 111220. [Google Scholar] [CrossRef]
  5. Meng, W.; Feagin, A.R. Mariculture is a double-edged sword in China. Estuar. Coast. Shelf Sci. 2019, 222, 147–150. [Google Scholar] [CrossRef]
  6. Fu, X.M.; Zhang, M.Q.; Liu, Y.; Shao, C.L.; Hu, Y.; Wang, X.Y.; Su, L.R.; Wang, N.; Wang, C.Y. Protective exploitation of marine bioresources in China. Ocean Coast. Manag. 2018, 163, 192–204. [Google Scholar] [CrossRef]
  7. Yu, J.K.; Han, Q.C. Food security of mariculture in China: Evolution, future potential and policy. Mar. Policy. 2020, 115, 103892. [Google Scholar] [CrossRef]
  8. Yu, J.K.; Wang, Y. Exploring stakeholder engagement in mariculture development: Challenges and prospects for China. Mar. Policy 2019, 103, 84–90. [Google Scholar] [CrossRef]
  9. Feng, Y.Y.; Hou, L.C.; Ping, N.X.; Ling, T.D.; Kyo, C.I. Development of mariculture and its impacts in Chinese coastal waters. Rev. Fish Biol. Fish. 2005, 14, 1–10. [Google Scholar] [CrossRef]
  10. FAO. The State of World Fisheries and Aquaculture 2024; Blue Transformation in action; FAO: Rome, Italy, 2024. [Google Scholar]
  11. Ren, W.H. What forces drive the rapid development of mariculture in China: Factor-driven or total factor productivity-driven? Aquac. Res. 2021, 52, 3966–3977. [Google Scholar] [CrossRef]
  12. Li, Q.; Kijima, A. Current Status and Problems of Mariculture in China. Aquac. Sci. 2002, 50, 129–132. (In Japanese) [Google Scholar] [CrossRef]
  13. Zhang, J.; Wu, W.; Li, Y.; Liu, Y.; Wang, X. Environmental effects of mariculture in China: An overall study of nitrogen and phosphorus loads. Acta Oceanol. Sinica 2022, 41, 4–11. [Google Scholar] [CrossRef]
  14. Qin, H.; Ye, C.C.; Zhang, Y. Research on the evaluation of the state of marine aquaculture ecological and economic system--Taking Shandong Province as an example. Econ. Issues 2017, 76, 100–105+113. (In Chinese) [Google Scholar] [CrossRef]
  15. Ding, Y.T. Evaluation of coupled ecological-economic-social system synergistic development of wetlands in the Minjiang estuary. China Fish. Econ. 2020, 38, 55–64. (In Chinese) [Google Scholar]
  16. Zhang, Y.; Ji, J.Y. Decomposition of coupled relationships and drivers of ecological and economic systems of mariculture in China. Agric. Technol. Econ. 2020, 4, 94–106. (In Chinese) [Google Scholar] [CrossRef]
  17. Zhang, W.; Zhang, X.; Zhang, M.; Li, W. How to Coordinate Economic, Logistics and Ecological Environment? Evidences from 30 Provinces and Cities in China. Sustainability 2020, 12, 1058. [Google Scholar] [CrossRef]
  18. Xie, M.; Wang, J.; Chen, K. Coordinated Development Analysis of the “Resources-Environment-Ecology-Economy-Society” Complex System in China. Sustainability 2016, 8, 582. [Google Scholar] [CrossRef]
  19. Holling, C.S. Understanding the complexity of economic, ecological, and social systems. Ecosystems 2001, 4, 390–405. [Google Scholar] [CrossRef]
  20. Beria, L.; Meine, V.N.; Sean, K.; Sara, N.; Peter, A.M. Synthesis and Lessons on Ecological, Economic, Social and Governance Propositions. In Co-Investment in Ecosystem Services: Global Lessons from Payment and Incentive Schemes; Beria, L., Meine, V.N., Sean, K., Sara, N., Peter, A.M., Eds.; World Agroforestry (ICRAF): Nairobi, Kenya, 2018; Chapter 38; pp. 511–538. [Google Scholar]
  21. Wang, N.; Li, J.M.; Zhou, Y.F. Mechanism of action of marine ecological restoration on ecological, economic, and social benefits—An empirical analysis based on a structural equation model. Ocean Coast. Manag. 2024, 248, 106950. [Google Scholar] [CrossRef]
  22. Li, Y.; Hao, H.; Sun, L.; Liu, M.; Wang, D. The Development of Economic–Social–Ecological Complex Systems in the Yellow River Basin, China. Sustainability 2025, 17, 511. [Google Scholar] [CrossRef]
  23. Gao, Y.; Bai, L.; Zhou, K.; Kou, Y.; Yuan, W.; Zhou, X.; Qiu, Z.; Zhao, D.; Lv, Z.; Wu, Q.; et al. Study on the Coupling Coordination Degree and Driving Mechanism of “Production-Living-Ecological” Space in Ecologically Fragile Areas: A Case Study of the Turpan–Hami Basin. Sustainability 2024, 16, 9054. [Google Scholar] [CrossRef]
  24. Dong, G.; Ge, Y.; Liu, J.; Kong, X.; Zhai, R. Evaluation of coupling relationship between urbanization and air quality based on improved coupling coordination degree model in Shandong Province, China. Ecol. Indic. 2023, 154, 110578. [Google Scholar] [CrossRef]
  25. Garza-Gil, D.M.; Surís-Regueiro, C.J.; Varela-Lafuente, M.M. Using input–output methods to assess the effects of fishing and aquaculture on a regional economy: The case of Galicia, Spain. Mar. Policy 2017, 85, 48–53. [Google Scholar] [CrossRef]
  26. Raffray, M.; Martin, J.; Jacob, C. Socioeconomic impacts of seafood sectors in the European Union through a multi-regional input output model. Sci. Total Environ. 2022, 850, 157989. [Google Scholar] [CrossRef]
  27. Li, M.; Niu, C.; Li, X.; Quan, L.; Li, W.; Liu, C.; Shi, C.; Soomro, S.-E.; Song, Q.; Hu, C. Modeling and Evaluating the Socio-Economic–Flood Safety–Ecological System of Landong Floodplain Using System Dynamics and the Weighted Coupling Coordination Degree Model. Water 2024, 16, 2366. [Google Scholar] [CrossRef]
  28. Wang, A.; Liang, S.; Wang, S. Coupling coordination development of water resources-economy-ecology system in Shanxi Province based on system dynamics. Sci. Rep. 2025, 15, 7370. [Google Scholar] [CrossRef]
  29. Sun, L. Driving Mechanism of the Coordinated Development of Regional Economy-Society-Environment System Based on Grey Incidence Analysis Model—A Case Study of Wanjiang Urban Belt. Mod. Econ. 2020, 11, 1226–1244. [Google Scholar] [CrossRef]
  30. Wang, Y.; Pan, H.; Li, S.; Failler, P. An integrated socio-economic and ecological framework for evaluating the societal costs and benefits of fishing activities in the Pearl River Delta. Open J. Mar. Sci. 2015, 5, 477–497. [Google Scholar] [CrossRef]
  31. Peng, D.; Mu, Y.; Zhu, Y. Evaluating the level of coordinated development of fisheries economic growth and environmental quality in selected Chinese regions. Environ. Impact Assess. Rev. 2021, 89, 106605. [Google Scholar] [CrossRef]
  32. Luo, D.; Liang, L.W.; Wang, Z.; Chen, L.; Zhang, F. Exploration of coupling effects in the Economy–Society–Environment system in urban areas: Case study of the Yangtze River Delta Urban Agglomeration. Ecol. Indic. 2021, 128, 107858. [Google Scholar] [CrossRef]
  33. Wu, Y.; Zhong, C.; Wu, Y. Ecological Efficiency Evaluation and Development Trend Prediction of Marine Aquaculture Industry: A Case Study of Weihai City, China. Sustainability 2025, 17, 968. [Google Scholar] [CrossRef]
  34. Zhang, X.; Zhong, L.; Yu, H.; Wang, L.E. Sustainability Assessment for the Protected Area Tourism System from the Perspective of Ecological-Economic-Social Coordinated Development. Forests 2023, 14, 890. [Google Scholar] [CrossRef]
  35. Wang, T.; Yang, Z.; Han, F.; Yu, J.; Ma, X.; Han, J. Assessment of tourism socio-ecological system resilience in arid areas: A case study of xinnjiang, China. Ecol. Indic. 2024, 159, 111748. [Google Scholar] [CrossRef]
  36. Qu, L.; Tu, Z.; Liu, J.; Li, Y. Coupling coordination evolution of the settlements-farming system and its optimization path: Keys to sustainable rural development in the Three Gorges Reservoir Area of China. Habitat Int. 2025, 163, 103456. [Google Scholar] [CrossRef]
  37. Fang, C.L.; Liu, H.M.; Li, G.D. International progress and evaluation on interactive coupling effects between urbanization and the eco-environment. J. Geogr. Sci. 2016, 26, 1081–1116. [Google Scholar] [CrossRef]
  38. Sun, Q.; Zhang, X.; Zhang, H.; Niu, H. Coordinated development of a coupled social economy and resource environment system: A case study in Henan Province, China. Environ. Dev. Sustain. 2018, 20, 1385–1404. [Google Scholar] [CrossRef]
  39. Yang, S.Q.; Yang, Z.L.; GAO, W.S. Influence of different harmony functions on the harmony degree of ecology-economy-society system—A case study from Ziyang District, Yiyang City, Hunan Province. China J. Eco-Agric. 2007, 15, 151–154. (In Chinese) [Google Scholar]
  40. Qin, H.; Zhang, Y.; Ye, C.C. Research on the concept and composition of mariculture ecological economic system. Mar. Sci. 2017, 41, 110–116. (In Chinese) [Google Scholar] [CrossRef]
  41. Eraslan, E.C. The Effects of Decomposers in Marine Ecosystems. Prof. Dr. Ahmet Aksoy 2023, 21. Available online: https://www.defineabc.com/scholar?q=THE+EFFECTS+OF+DECOMPOSERS+IN+MARINE+ECOSYSTEMS (accessed on 16 December 2024).
  42. Dong, S.L.; Gao, Q.F.; Li, L. Aquaculture Ecosystem. In Aquaculture Ecology; Springer Nature: Singapore, 2023; pp. 33–91. [Google Scholar] [CrossRef]
  43. Me, B. What is synergy. Pharmacol. Rev. 1989, 41, 93–141. [Google Scholar] [CrossRef]
  44. Geary, N. Understanding synergy. Am. J. Physiol.-Endocrinol. Metab. 2013, 304, E237–E253. [Google Scholar] [CrossRef]
  45. Heinberg, R.; Lerch, D. What is sustainability. Post Carbon Reader 2010, 11, 19. Available online: https://kh.aquaenergyexpo.com/wp-content/uploads/2024/01/What-is-Sustainability.pdf (accessed on 2 March 2025).
  46. Giovannoni, E.; Fabietti, G. What Is Sustainability? A Review of the Concept and Its Applications. In Integrated Reporting; Busco, C., Frigo, M., Riccaboni, A., Quattrone, P., Eds.; Springer: Cham, Switzerland, 2013. [Google Scholar] [CrossRef]
  47. Andrii, S. Evaluating the Performance of Subjective Weighting Methods for Multi-Criteria Decision-Making using a novel Weights Similarity Coefficient. Procedia Comput. Sci. 2023, 225, 4785–4794. [Google Scholar] [CrossRef]
  48. Aleksandra, B.; Jarosław, W. Crispyn—A Python library for determining criteria significance with objective weighting methods. SoftwareX 2022, 19, 101166. [Google Scholar] [CrossRef]
  49. Singh, T.; Singh, V.; Ranakoti, L.; Kumar, S. Optimization on tribological properties of natural fiber reinforced brake friction composite materials: Effect of objective and subjective weighting methods. Polym. Test. 2023, 117, 107873. [Google Scholar] [CrossRef]
  50. Mittal, K.K. Vardhan A. A methodology for part family formation in reconfigurable manufacturing systems using Shannon’s entropy method. Proc. Inst. Mech. Eng. Part E J. Process Mech. Eng. 2025, 239, 1281–1295. [Google Scholar] [CrossRef]
  51. Yi, C.X. Design of a Multi-Indicator Evaluation System for Art Students’ Learning Outcomes Driven by Neural Networks: Weight Optimization Using the Entropy Method. Int. J. High Speed Electron. Syst. 2025, 2540554. [Google Scholar] [CrossRef]
  52. Gao, L.H. Measurement and Optimization Mechanism of Coordinated Development of Marine Ecological and Economic Systems in China; Ocean University of China: Qingdao, China, 2012. [Google Scholar]
  53. Wang, J.; Ding, H.; Zheng, H. Research on coordinated development of urbanization in Shandong Province based on improved coupled coordination model. Sci. Technol. Prog. Countermeas. 2018, 35, 29–35. (In Chinese) [Google Scholar]
  54. State Environmental Protection Administration. Environmental Protection Industry Standard of the People’s Republic of China; China Environmental Science Press: Beijing, China, 2008. [Google Scholar]
  55. The State Council Information Office of the PRC. Outline of the Twelfth Five-Year Plan for National Economic and Social Development of the PRC. 2011. Available online: http://www.scio.gov.cn/ztk/xwfb/27/8/Document/884557/884557_1.htm. (accessed on 15 March 2025).
  56. Pei, R.; Zhang, H.; Liu, Z.; Yu, C.; Zhang, Y.; Mu, Y. Evaluating the green development level of marine molluscan shellfish aquaculture industry and analyzing obstacle factors that hinder its improvement: The case of China. Aquaculture 2025, 606, 742603. [Google Scholar] [CrossRef]
  57. Tong, Y.S.; Wan, J. China’s Supply-Side Reform: The Rationale and Implications. East Asian Policy 2016, 8, 11. [Google Scholar] [CrossRef]
  58. Yu, K.Z. Fighting the Fishery Transformation and Structural Adjustment “Six Hard Battles”. China Fishery News, 23 May 2016; A01. [Google Scholar]
  59. Ministry of Natural Resources of the People’s Republic of China. State Oceanic Administration Releases 2013 Bulletin on the State of China’s Marine Environment. 2013. Available online: https://www.mnr.gov.cn/dt/hy/201403/t20140326_2331958.html (accessed on 20 March 2025).
  60. NOAA. Aquaculture: Bringing American-Farmed Seafood to Your Plate. NOAA Fisheries Office of Aquaculture. 2023. Available online: https://www.noaa.gov/node/275 (accessed on 18 September 2025).
  61. Toomey, L.; Alfonso, S.; Carbonara, P.; Jahrl, I.; Mente, E.; Lampkin, N.; Lembo, G. Unlocking the Potential of Organic Aquaculture in the EU: A Review of Policy Support and Supporting and Constraining Factors. Rev. Aquac. 2025, 17, 68–88. [Google Scholar] [CrossRef]
  62. Kim, Y.O. Effects of Different Feeding Frequency on the Growth, Feed utilization and Body Composition of Juvenile Eel Anguilla japonica in Semi-RAS (Recirculating Aquaculture System). J. FISHRIES Mar. Sci. Educ. 2023, 35, 412–420. [Google Scholar] [CrossRef]
  63. Nauta, R.W.; Lansbergen, R.A.; Ariyati, R.W.; Widowati, L.L.; Rejeki, S.; Debrot, A.O. Co-Culture of Gracilariopsis longissima Seaweed and Penaeus monodon Shrimp for Environmental and Economic Resilience in Poor South-East Asian Coastal Aquaculture Communities. Sustainability 2025, 17, 3910. [Google Scholar] [CrossRef]
Figure 1. Ten provincial administrative regions along China’s coast. Based on review number GS (2024) 0650.
Water 17 02878 g001
Figure 2. Trends in the CDL of the MEES complex system and its subsystems, 2009–2020. Note: T is the CDI of the MEES complex system and U1, U2, and U3 are the development indexes of the mariculture ecological system, mariculture economic system and mariculture social system, respectively.
Water 17 02878 g002
Figure 3. Development index of China’s mariculture ecological system from 2009 to 2020.
Water 17 02878 g003
Figure 4. Development index of China’s mariculture economic system from 2009 to 2020.
Water 17 02878 g004
Figure 5. Development index of China’s mariculture social system from 2009 to 2020.
Water 17 02878 g005
Figure 6. The CCD of China’s MEES complex system from 2009 to 2020.
Water 17 02878 g006
Table 1. The CDEIS for the MEES complex system.
SubsystemsFactor LevelIndicatorType of IndicatorWeight
Mariculture ecological systemResource conditionArea of mariculture (hectares) Positive0.055
Number of state-level aquaculture farms (nos.) Positive0.079
Proportion of autotrophs and heterotrophs in mariculture (%)Positive0.123
Environmental pollutionPercentage of the area of near-shore sea with good water quality (%) Positive0.086
Total wastewater discharges from directly discharged sea pollution sources (tons) Negative0.052
Total chemical oxygen demand discharges from directly discharged sea pollution sources (tons) Negative0.046
Total petroleum discharges from directly discharged sea pollution sources (tons) Negative0.051
Total ammonia nitrogen discharges from directly discharged sea pollution sources (tons) Negative0.042
Total phosphorus discharges from directly discharged sea pollution sources (tons)Negative0.086
Ecological disasterSea level rise compared to normal (mm) Negative0.052
Storm surge processes causing disasters (times) Negative0.040
Number of red tide occurrences with a maximum area of more than 100 square kilometers (inclusive) (times) Negative0.084
Vessels damaged by wave disasters (ships) Negative0.044
Number of people killed (including missing) by marine disasters (people) Negative0.060
Fishery disasters in coastal areas—loss of quantity of aquatic products (tons) Negative0.062
Typhoon and flood disasters in coastal areas—affected aquaculture area (hectares)Negative0.036
Mariculture economic systemInput levelQuantity of seawater fish fry stocked (10,000 fish) Positive0.092
Year-end ownership of mariculture motorized fisheries (vessels) Positive0.047
Year-end total power of mariculture motorized fisheries (kW) Positive0.045
Year-end total tonnage of mariculture motorized fisheries (tonnage) Positive0.084
Inputs to operating fisheries (RMB/person)Positive0.043
Output levelMariculture production (million tons) Positive0.053
Mariculture output value (tens of billions of yuan) Positive0.051
Growth rate of mariculture output value (%) Positive0.047
Mariculture output value as a share of fishery output value (%) Positive0.051
Per capita mariculture production of mariculture for professional mariculturists (kg/person) Positive0.065
Per capita mariculture output value of mariculture for professional mariculturists (RMB 10,000,000/person) Positive0.052
Level of mariculture yields (kg/ha)Positive0.098
Structural levelShare of intensive mariculture practices (%) Positive0.088
Concentration of mariculture practices (%) Negative0.051
Concentration of mariculture species (%) Negative0.035
Share of mariculture production in marine products production (%)Positive0.097
Mariculture social systemFishermen’s lifePer capita net income of fishermen (RMB/person) Positive0.071
Share of mariculture professionals in marine fishery population (%) Positive0.057
Per capita possession of mariculture products (kg/person) Positive0.054
Engel’s coefficient for rural households (%)Negative0.086
Management capacityNumber of marine fisheries law enforcement vessels (ships) Positive0.074
Number of fisheries law enforcement agencies in coastal areas (units) Positive0.056
Number of operational agricultural meteorological observation stations in coastal areas (units) Positive0.104
Completed investment in industrial pollution control of wastewater in coastal areas (ten thousand yuan) Positive0.076
Completed investment in industrial pollution control of waste gas in coastal areas (ten thousand yuan) Positive0.077
Completed investment in industrial pollution control of solid waste in coastal areas (ten thousand yuan)Positive0.050
Technology promotionNumber of aquatic technology extension organizations in coastal areas (nos.) Positive0.037
Percentage of senior titles of actual personnel in aquatic technology extension in coastal areas (%) Positive0.105
Funding for personnel of aquatic technology extension organizations in coastal areas (RMB 10,000,000) Positive0.096
Number of technical training periods for fishermen in aquatic technology extension in coastal areas (nos.)Positive0.057
Note: Share of intensive mariculture practices is the sum of the production of ordinary net pens, deep-water net pens, and factory production as a proportion of the total mariculture production. Concentration of mariculture practices is the share of the sum of the production of the top three practices in terms of production in the total mariculture production. Concentration of mariculture species is the share of the sum of the production of the top three species in terms of production in the total mariculture production.
Table 2. Evaluation criteria for the CDL of the MEES complex system.
ClusterCentroidLevel Label
Cluster 10.250Poor
Cluster 20.382General
Cluster 30.561Good
Cluster 40.729Excellent
Table 3. The CCD classification for the MEES complex system.
The Value of DLevel of CoordinationInterval RangeType of Coordination
(0, 0.1)Extreme dissonance0 ≤ D < 0.4Dissonance
(0.1, 0.2)Severe dissonance
(0.2, 0.3)Moderate dissonance
(0.3, 0.4)Mild dissonance
(0.4, 0.5)Near-dissonance0.4 ≤ D < 0.6Excess
(0.5, 0.6)Barely coupling coordination
(0.6, 0.7)Primary coordination0.6 ≤ D ≤ 1Coordination
(0.7, 0.8)Intermediate coordination
(0.8, 0.9)Good coordination
(0.9, 1.0]Quality coordination
Note: D is the coupling coordination degree of the three systems.
Table 4. The grading benchmarks for the development index of China’s mariculture ecological system.
Score of Development IndexSystem CharacteristicsQuality Level
0 ≤ U1 < 0.4Deterioration of mariculture ecological environment, difficulties in restoration and reconstruction, backward economic and social developmentLow
0.4 ≤ U1 < 0.6Mariculture ecological environment is damaged to a certain extent, but it can be restored with better economic and social developmentMedium
0.6 ≤ U1 < 0.8Mariculture ecological damage to a lesser extent, resource depletion and environmental pollution are not obvious, with a medium–high level of economic and social developmentMedium–high
0.8 ≤ U1 ≤ 1Mariculture ecological environment has excellent service functions, sufficient resources, and no environmental pollution, with a high level of economic and social developmentHigh
Note: U1 is the development index value of the mariculture ecological system.
Table 5. The CCD of China’s MEES complex system and its coordinated development level.
Year200920102011201220132014201520162017201820192020
C0.9880.9820.9900.9900.9840.9960.9870.9910.9990.9990.9940.985
D0.4930.4980.5760.6210.6450.6990.7490.7620.7920.8390.8460.867
LevelNear-dissonanceNear-dissonanceBarely coupling coordinationPrimary coordinationPrimary coordinationPrimary coordinationIntermediate coordinationIntermediate coordinationIntermediate coordinationGood coordinationGood coordinationGood coordination
Note: C and D are the coupling degree and coupling coordination degree of the three systems, respectively.
Disclaimer/Publisher’s Note: The statements, opinions and data contained in all publications are solely those of the individual author(s) and contributor(s) and not of MDPI and/or the editor(s). MDPI and/or the editor(s) disclaim responsibility for any injury to people or property resulting from any ideas, methods, instructions or products referred to in the content.