Study on an Evaluation Model for Regional Water Resource Stress Based on Water Scarcity Footprint
Abstract
1. Introduction
2. Research Methods and Data Sources
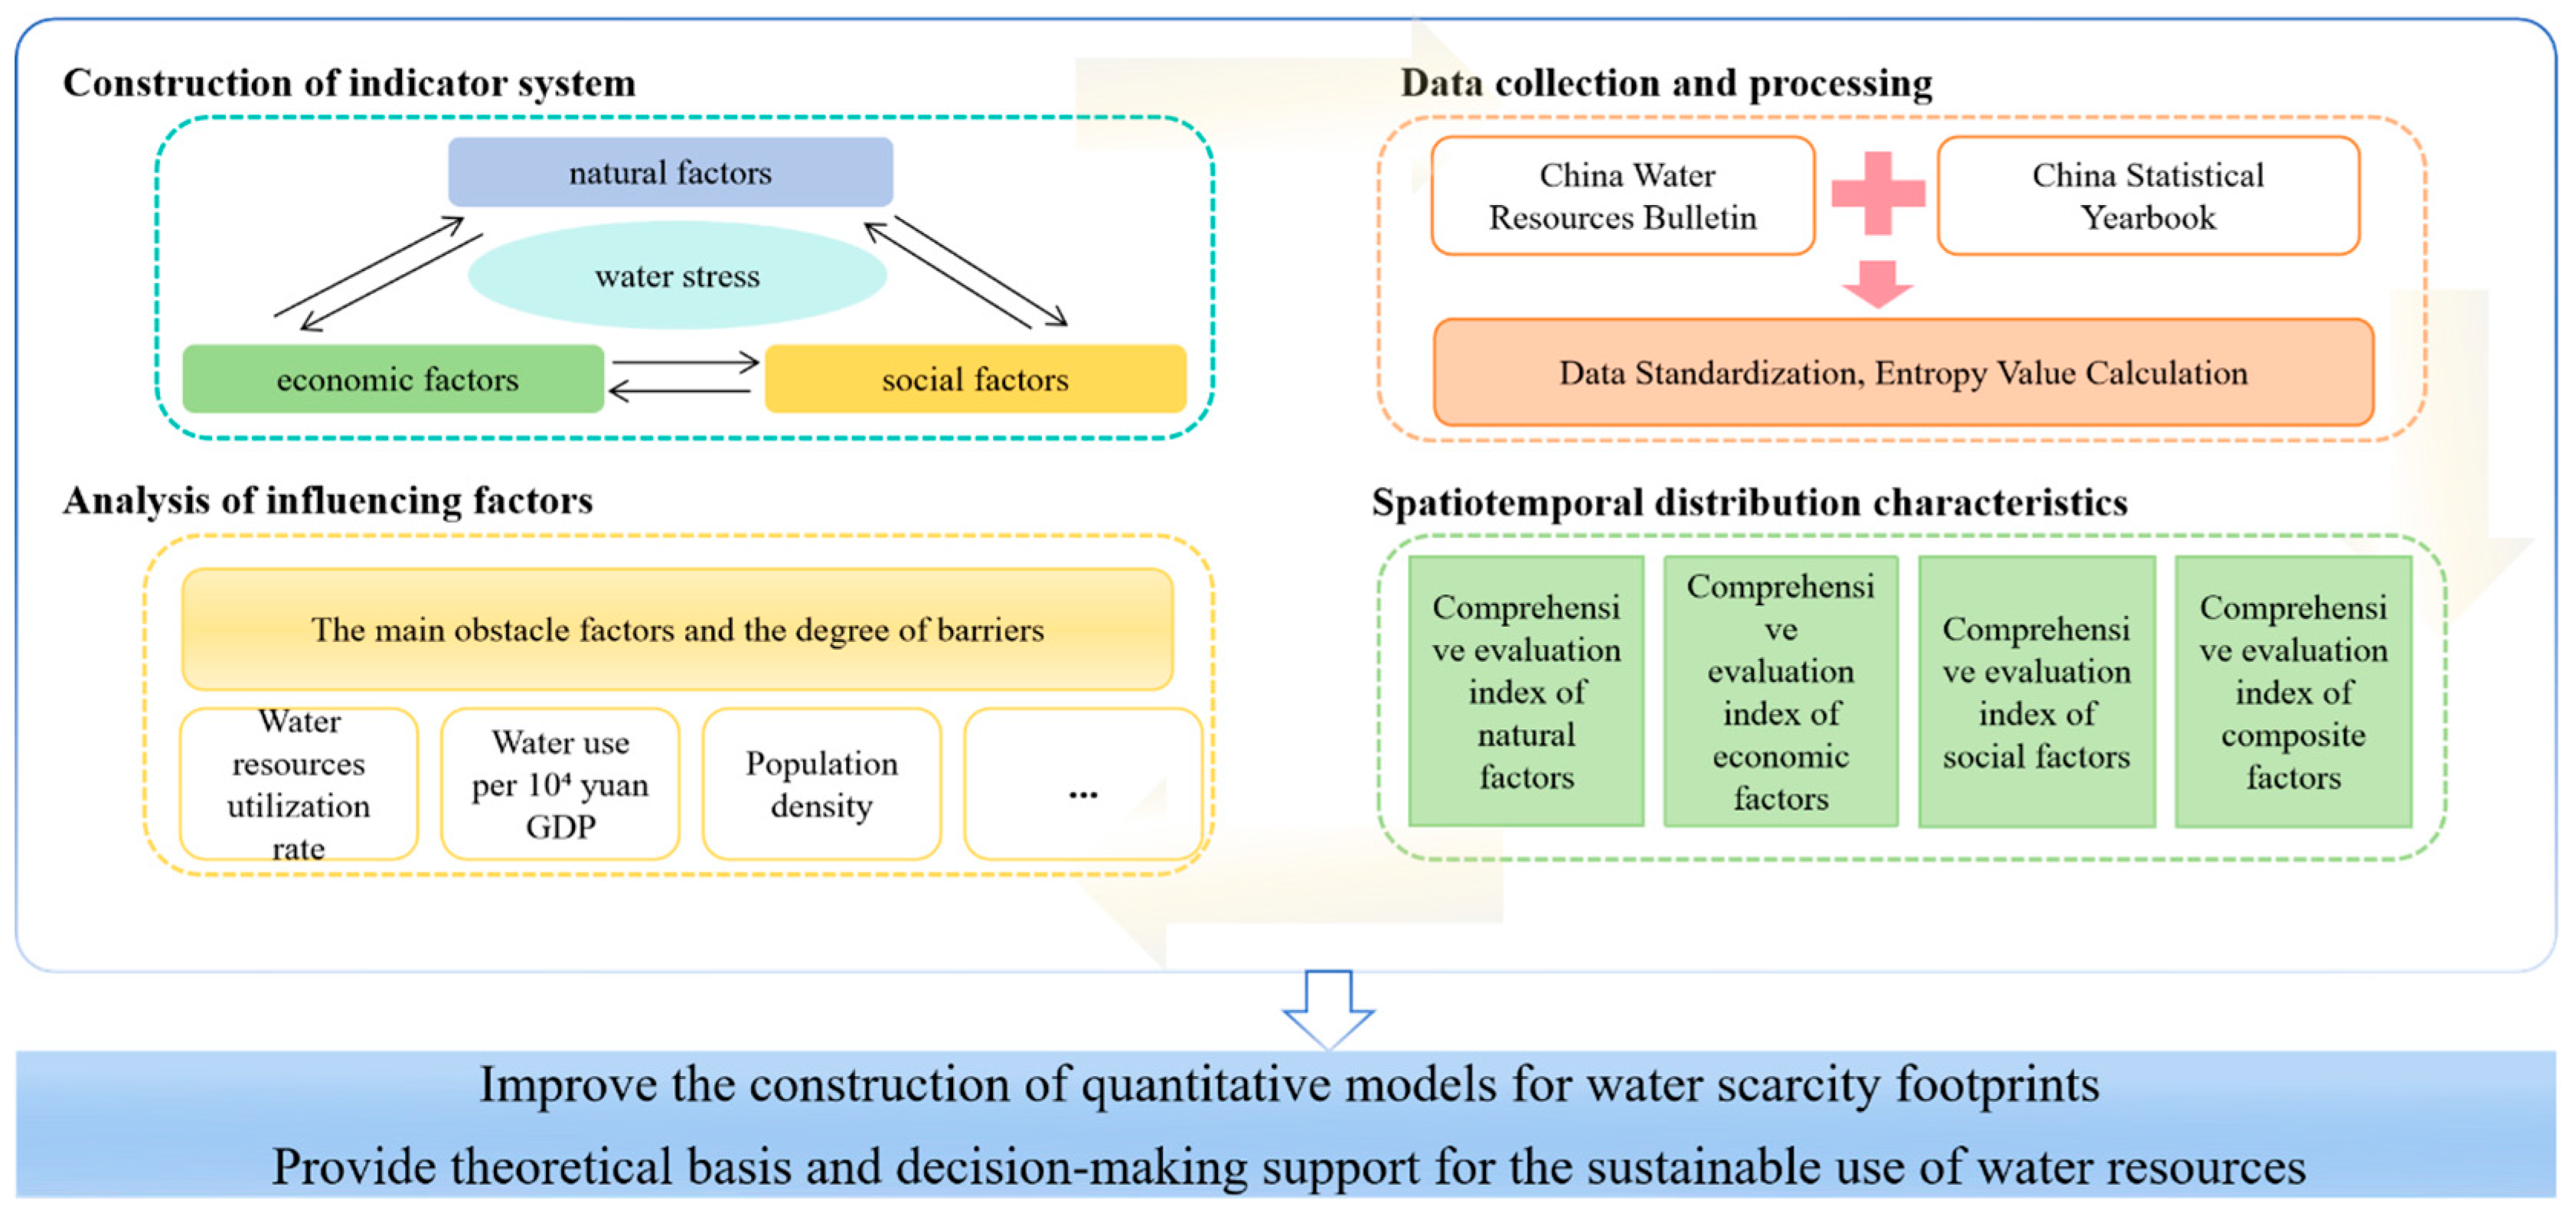
2.1. Construction of Evaluation Index System
2.2. Water Stress Evaluation Model
2.2.1. Entropy Weight Method
- (1)
- Data Standardization
- (2)
- Calculation of Numerical Proportion
- (3)
- Entropy Value Calculation
- (4)
- Coefficient of variation calculation
- (5)
- Entropy weight calculation
2.2.2. Integrated Water Resource Stress Index
2.2.3. Obstacle Analysis
2.2.4. Data Source
2.2.5. Model Validation
3. Results and Discussion
3.1. Spatiotemporal Analysis of Water Stress Index
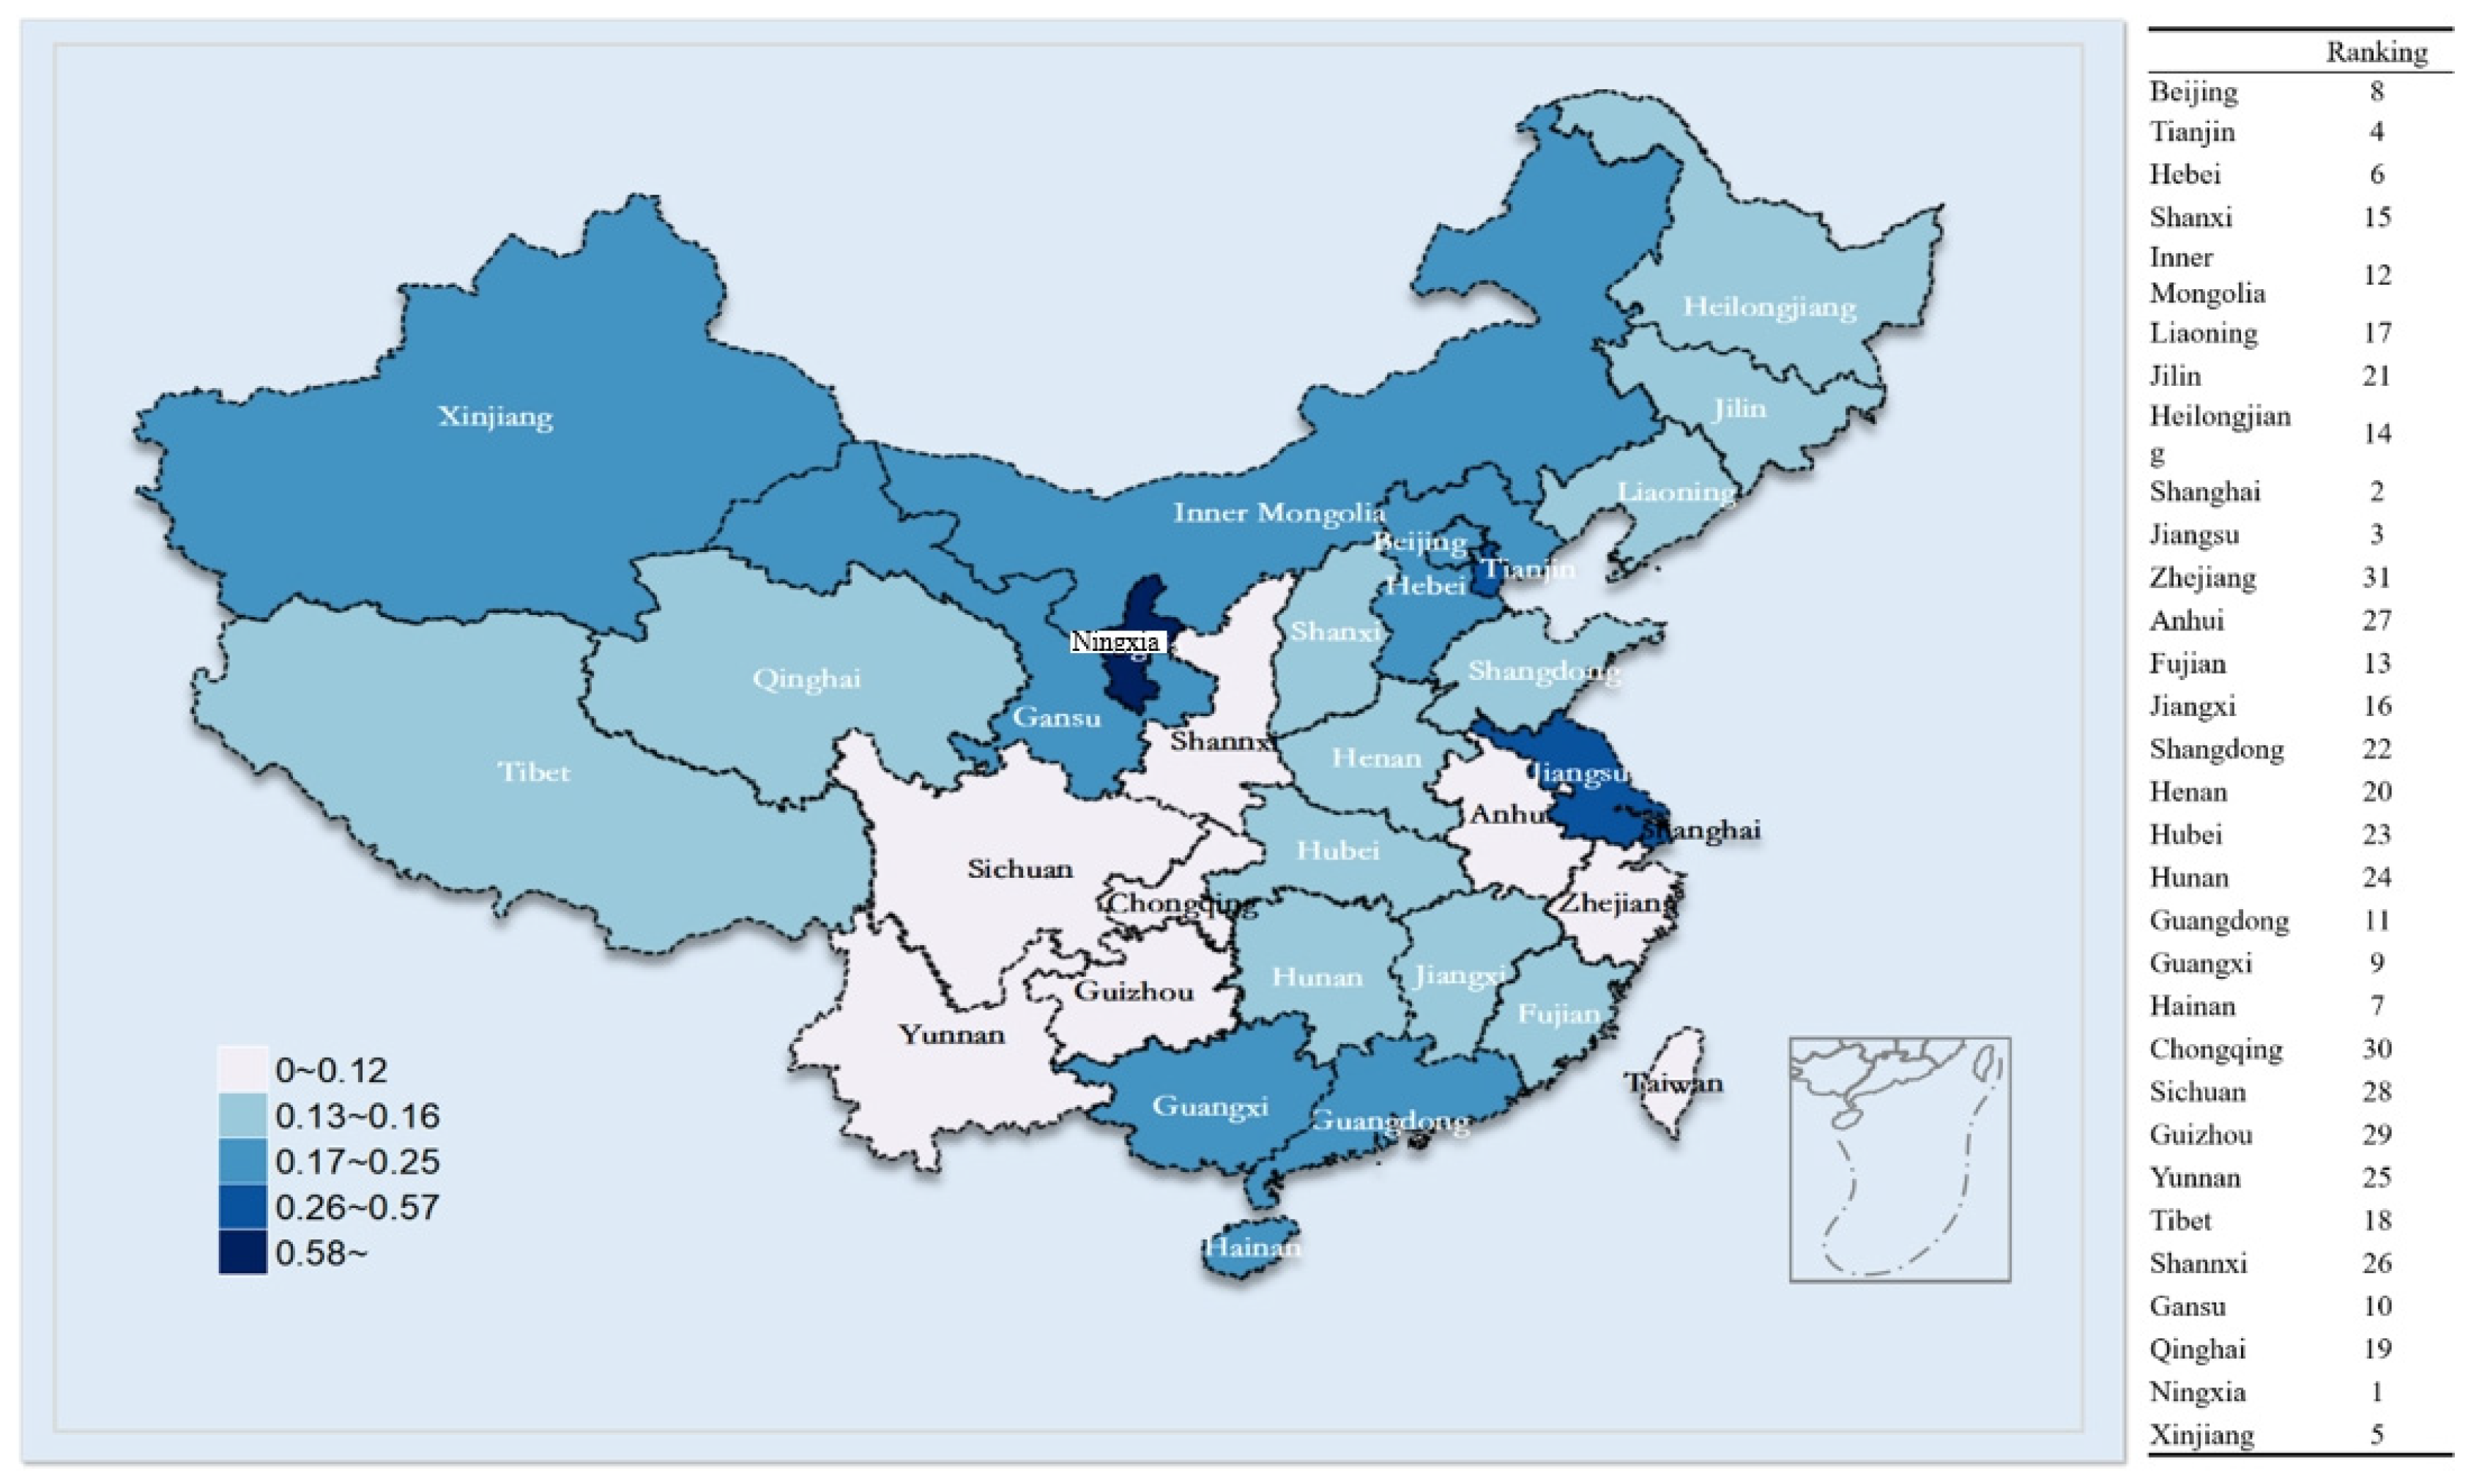
3.1.1. Comprehensive Evaluation Index of Natural Factors
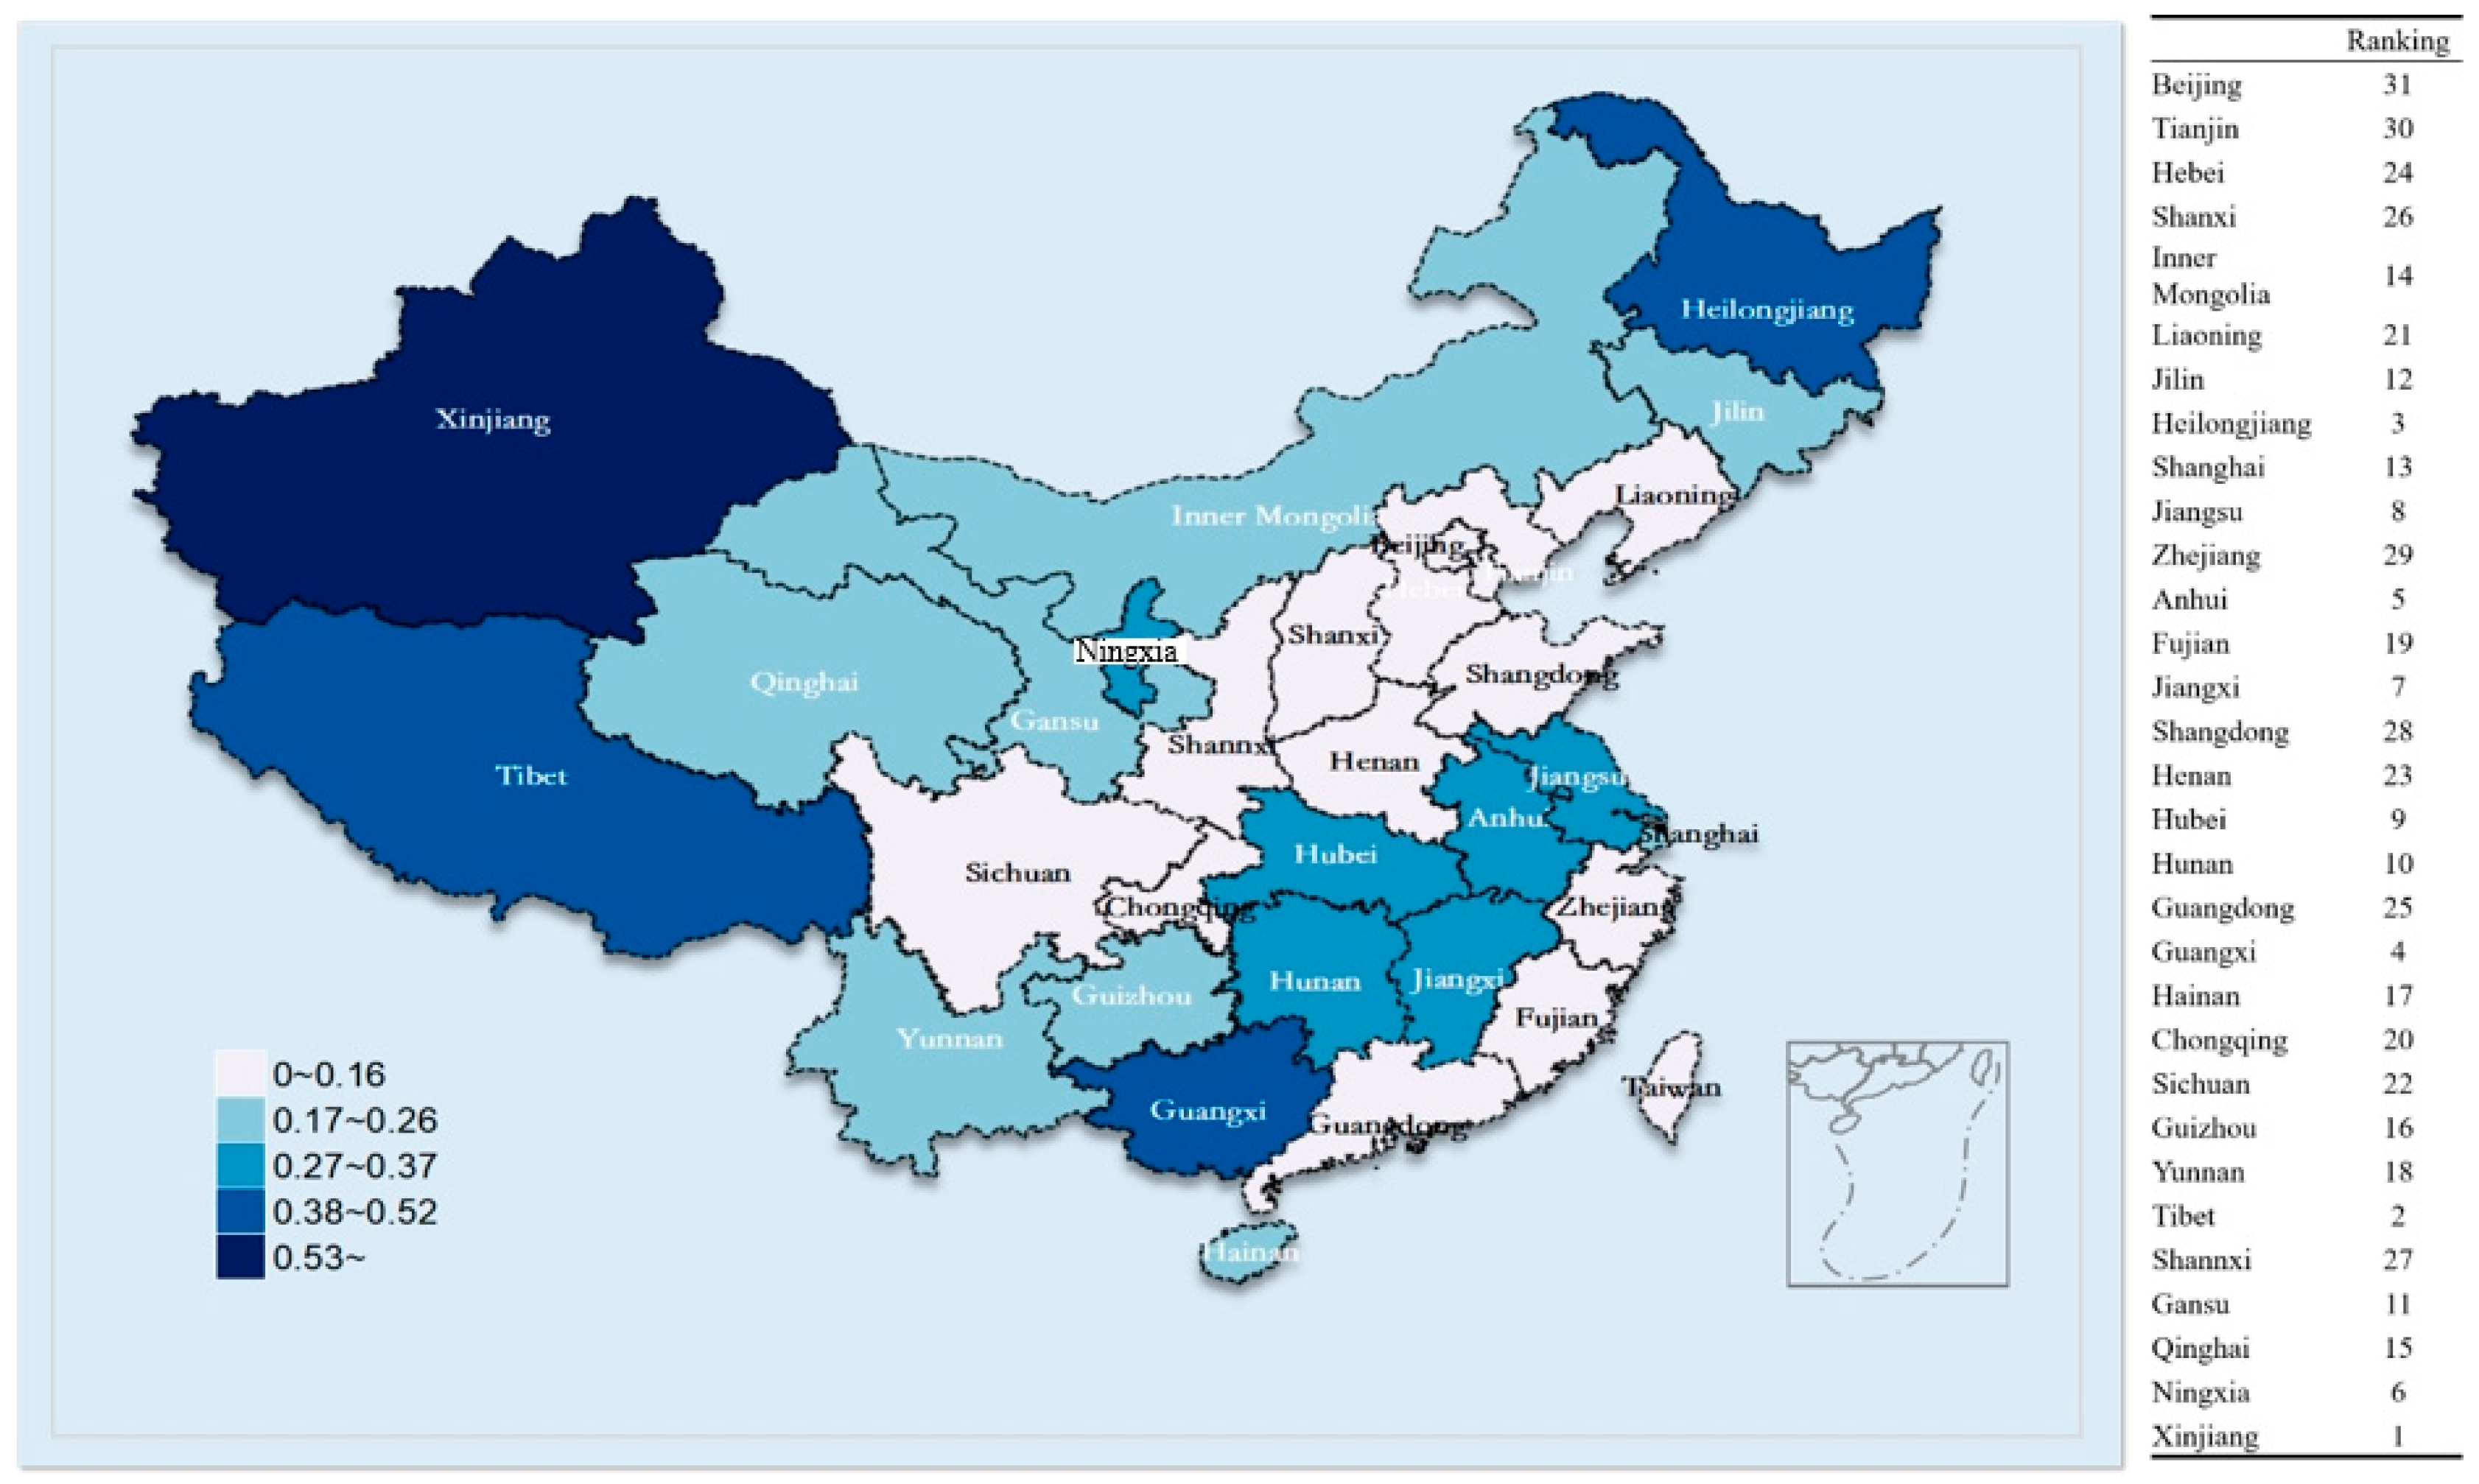
3.1.2. Comprehensive Evaluation Index of Economic Factors
3.1.3. Comprehensive Evaluation Index of Social Factors
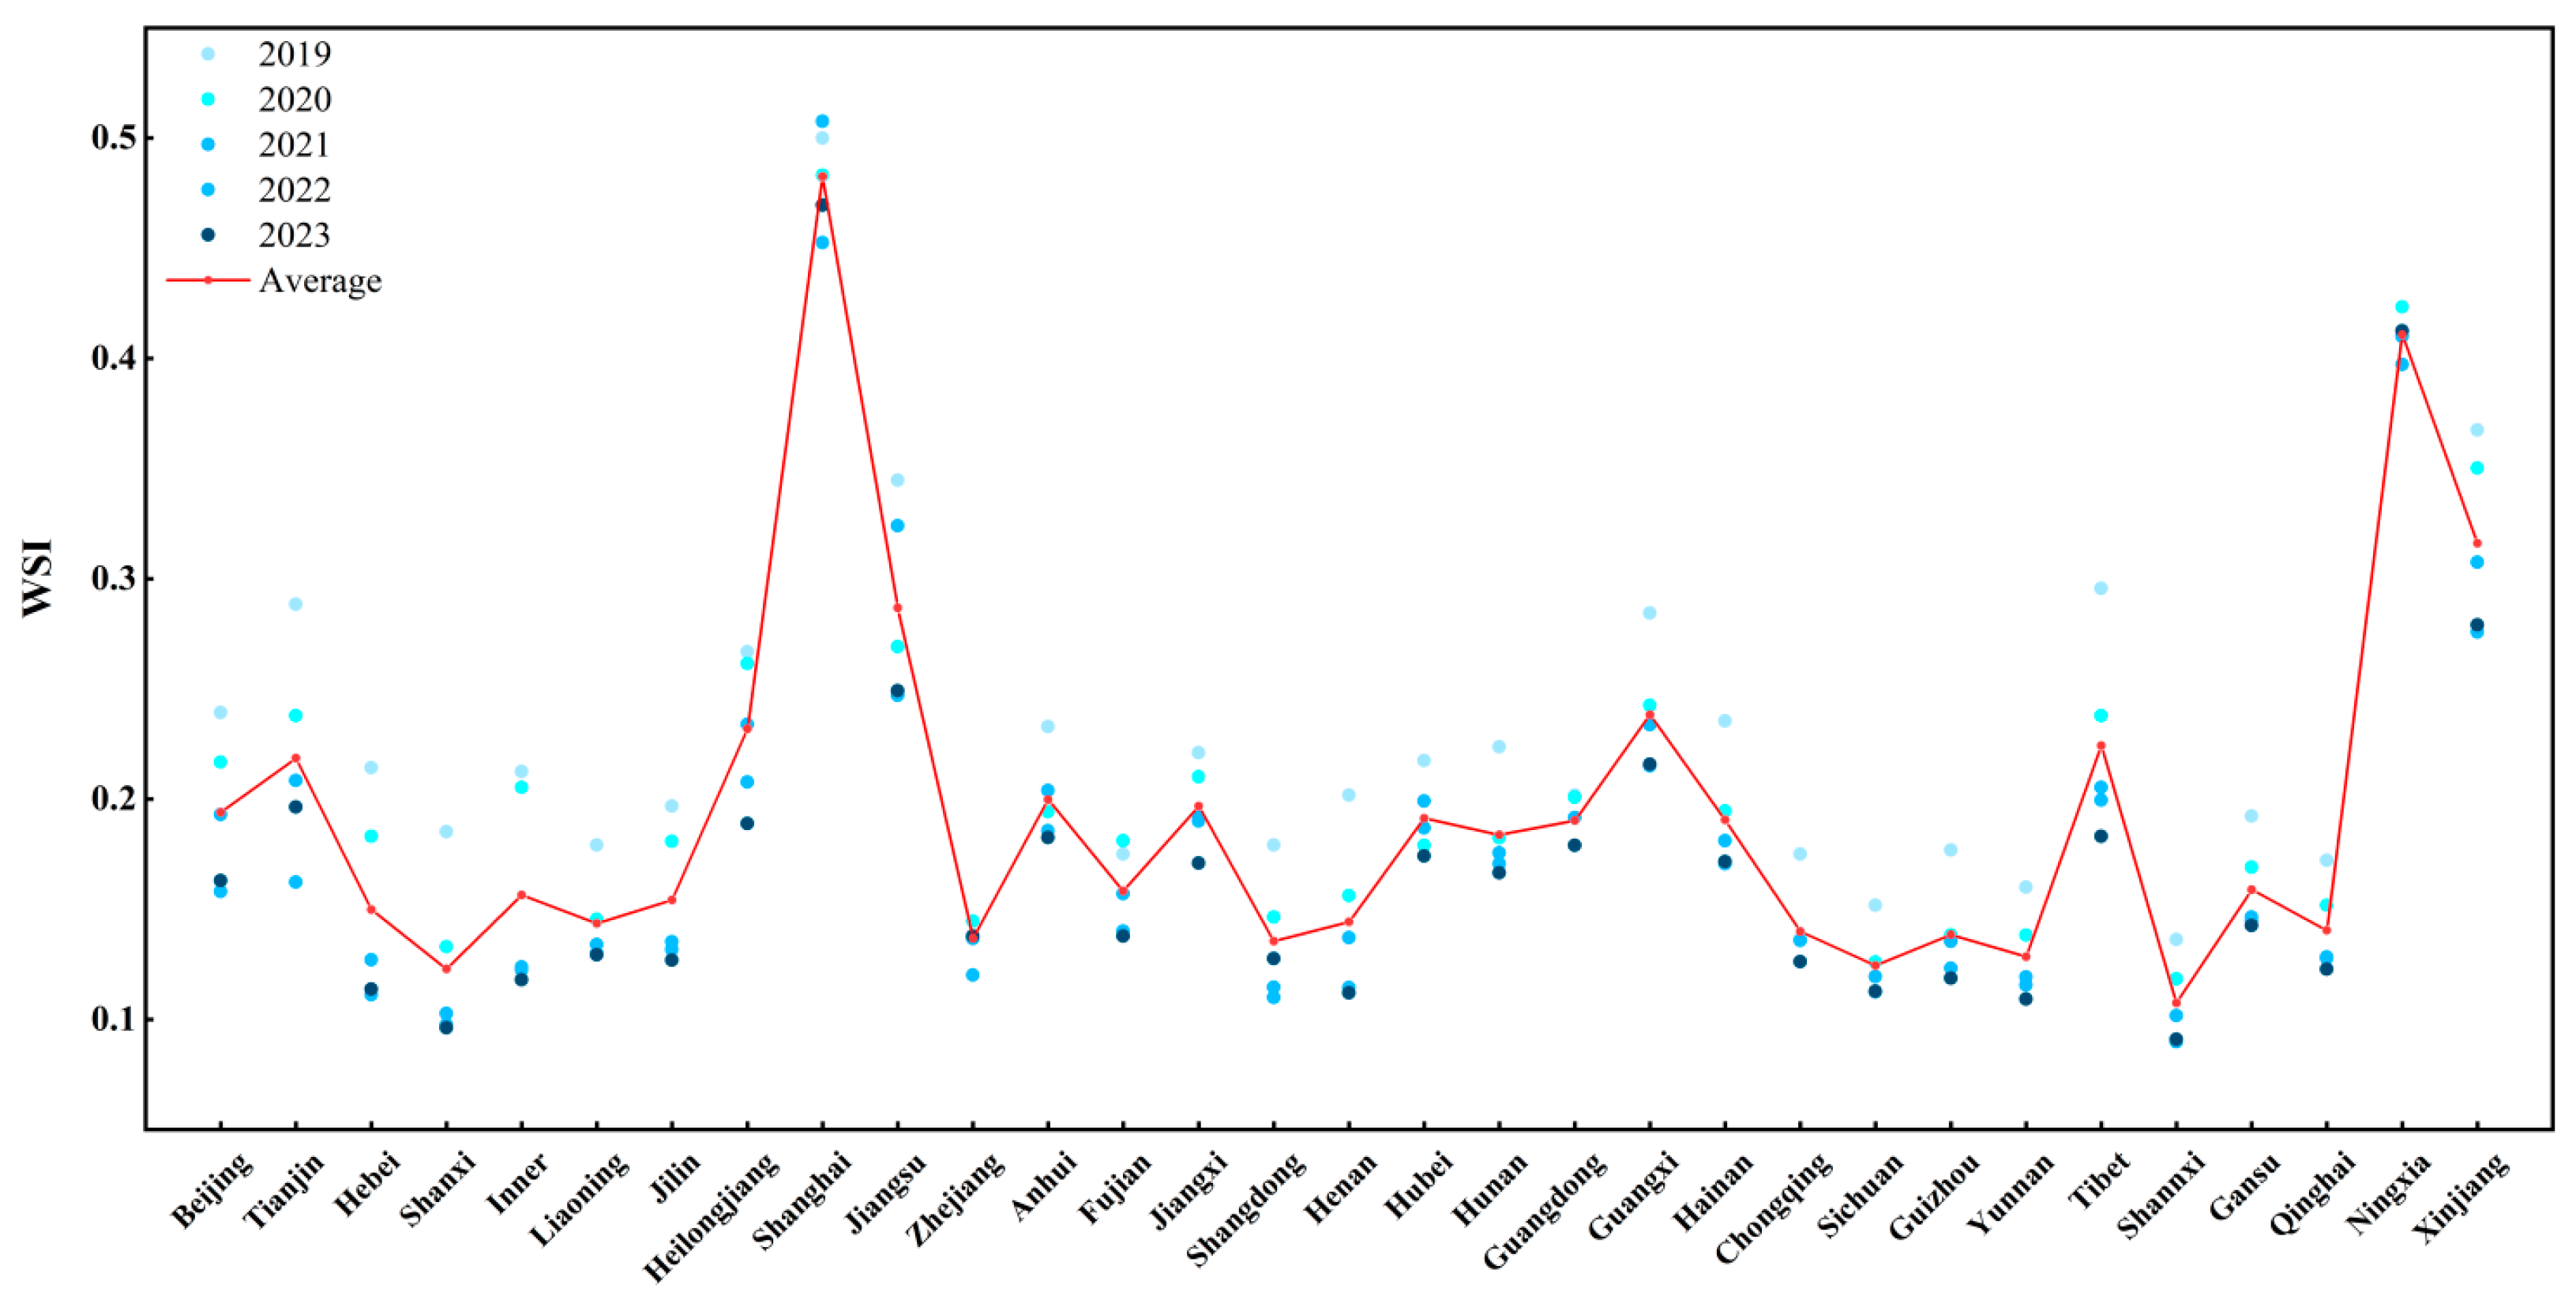
3.1.4. Comprehensive Evaluation Index of Composite Factors
3.2. Analysis of Influencing Factors of Water Stress Index
4. Conclusions
- (1)
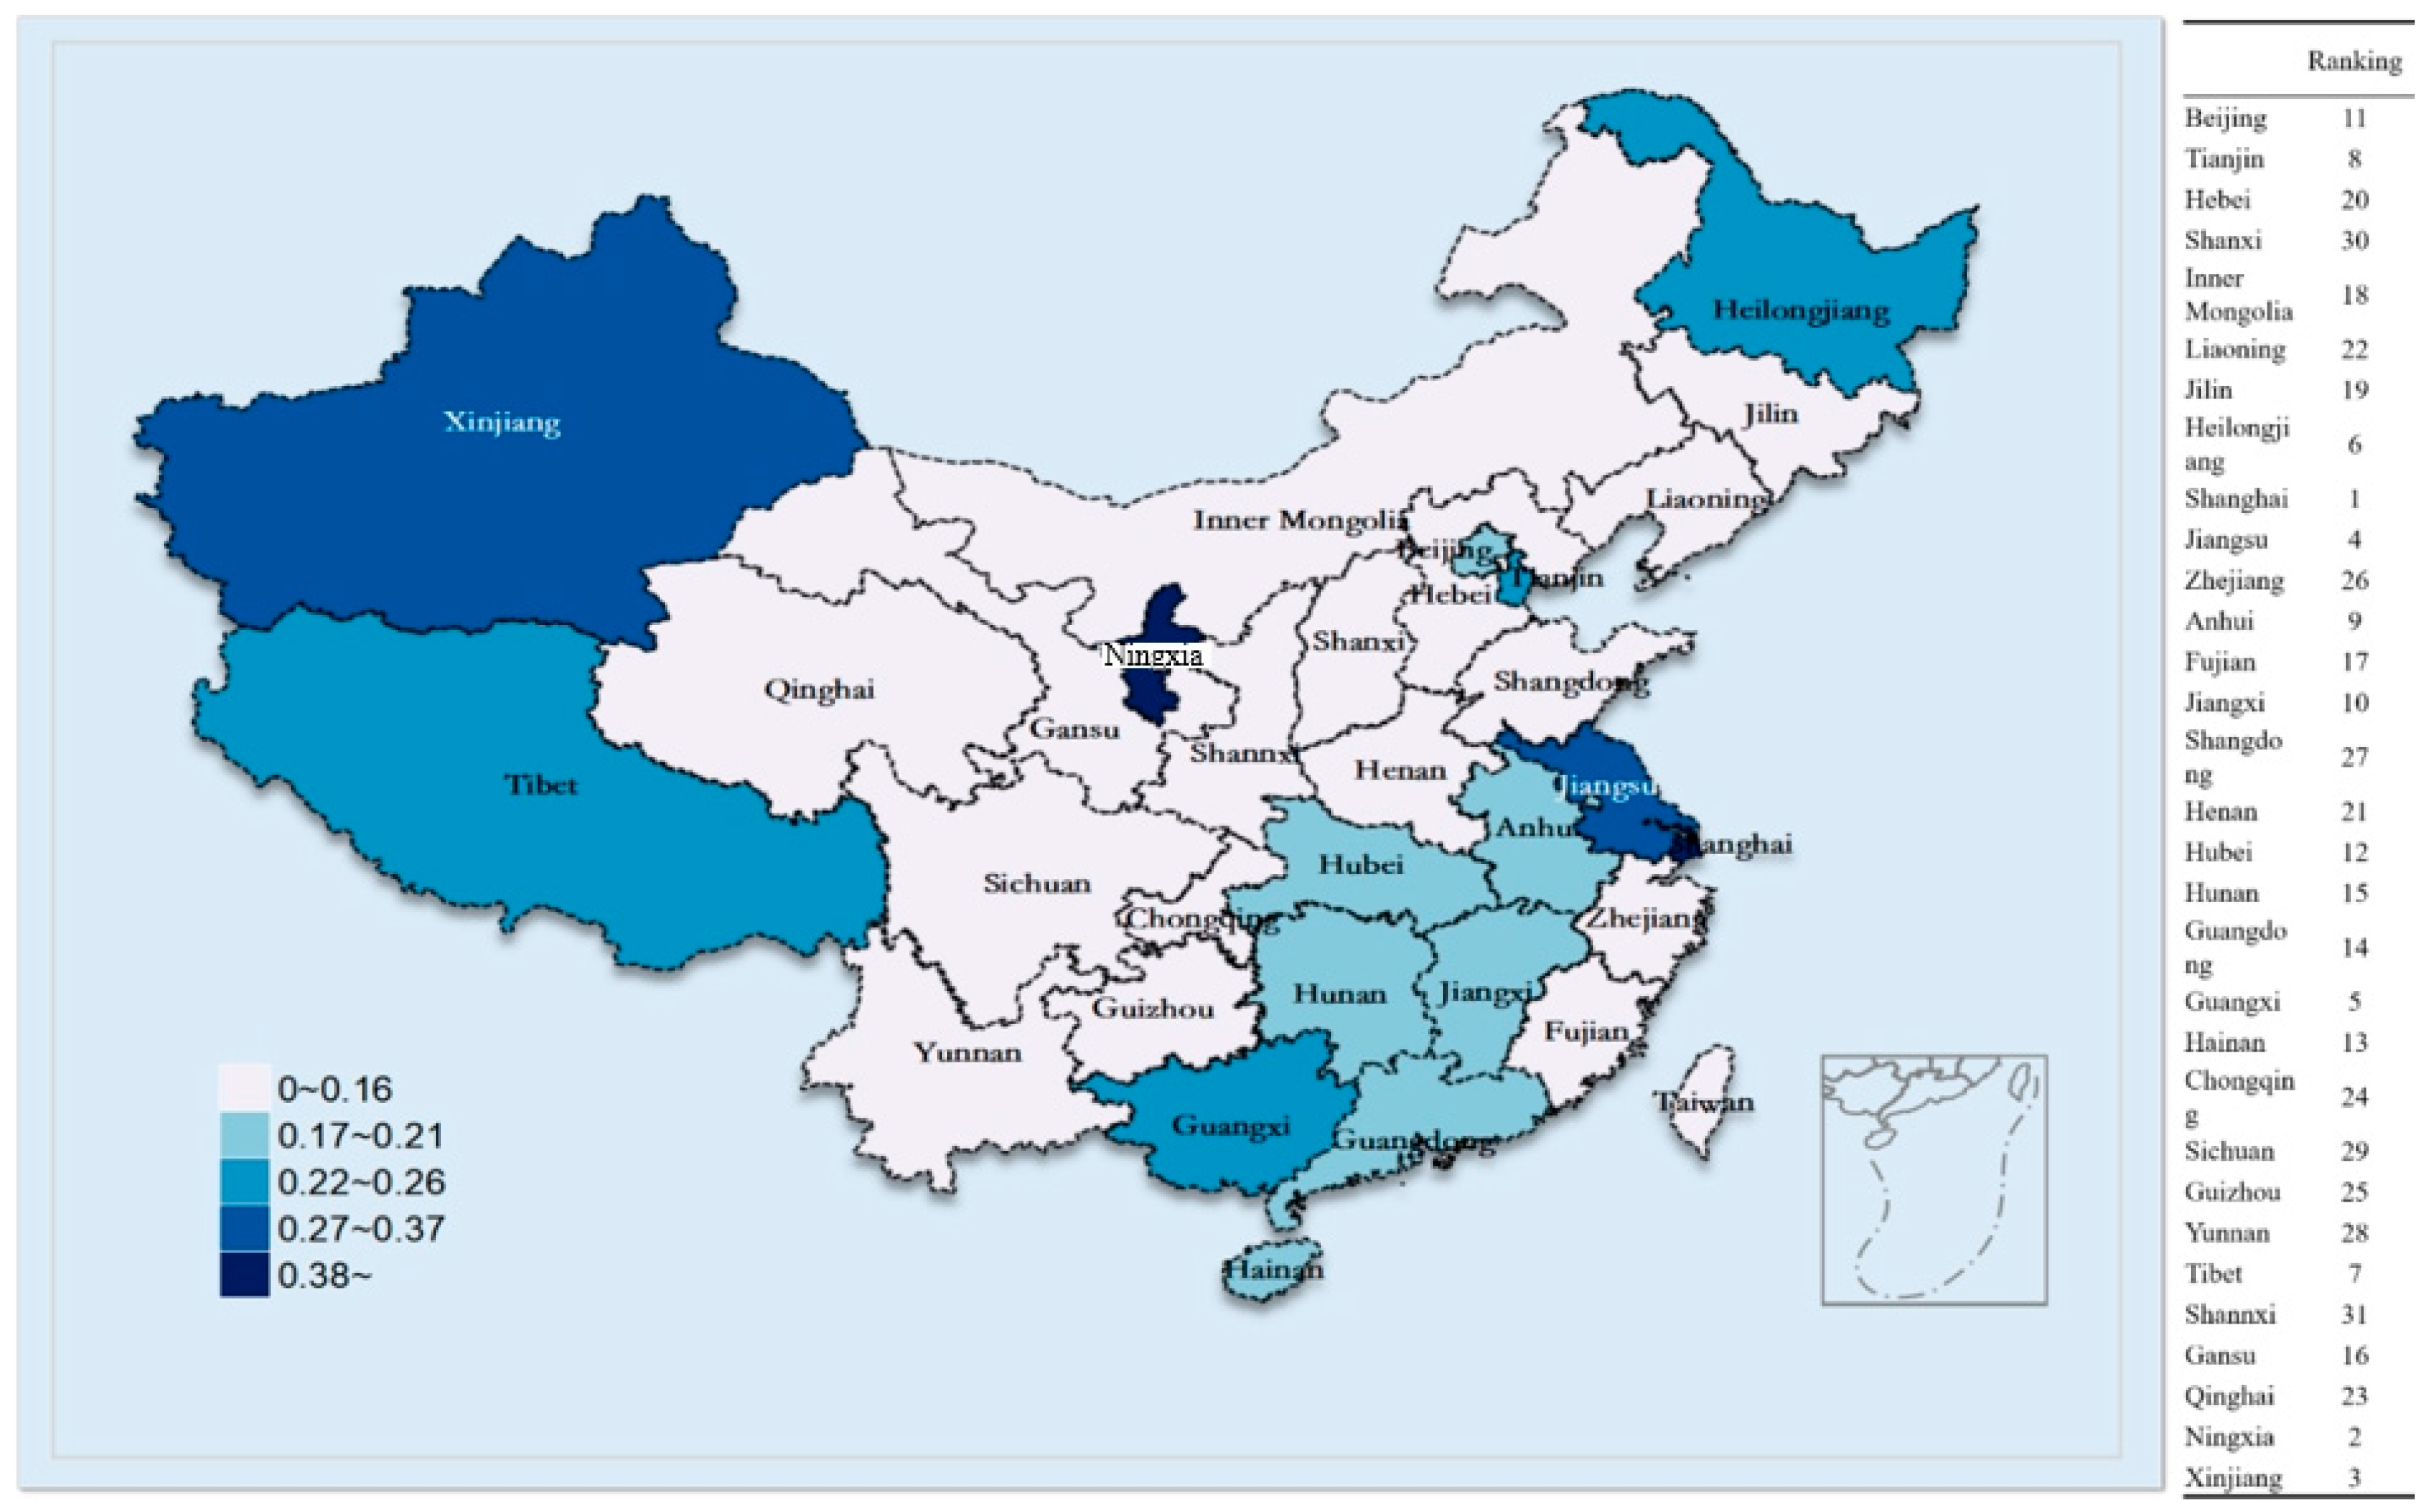
- The comprehensive water stress index shows that the water resource stress in Shanghai is the highest (most indicators are ahead of other regions), and the stress in Shaanxi is the lowest (most indicators are ranked behind). The water stress index of each region has shown a downward trend year over year in the past five years, indicating that China has achieved certain results in water resource management and utilization. However, the water resource stress in some areas is still high, and it is necessary to further strengthen the protection and management of regional water resources. For regions such as Shanghai, where water stress is greater, in addition to continuing to strengthen water-saving measures, it is also necessary to increase the research, development, and application of seawater desalination technology and increase the proportion of unconventional water sources. Meanwhile, it is necessary to strengthen the supervision of high-water-consuming enterprises, strictly control new high-water-consuming projects, and guide enterprises to change to water-saving production methods. For regions with relatively low stress, such as Shaanxi, it is necessary to continue to strengthen the protection of water resources to prevent the increase in water stress caused by factors such as economic development and population growth.
- (2)
- The main obstacle factors of water stress come from the three subsystems of nature, economy, and society, among which the development and utilization rate of water resources, the water consumption per 10,000 yuan of GDP, the water consumption of 10,000 yuan of industrial added value, and the population density are the main influencing factors common to all regions. These results indicate that natural conditions, economic development level, and population factors play an important role in the formation of water stress, and it is necessary to comprehensively consider these factors and formulate targeted water resources management and protection measures. In view of the main obstacle to the development and utilization of water resources, it is necessary to strengthen scientific planning and strict examination and approval of water resource development and utilization projects to avoid over-exploitation of water resources. For areas with high utilization rates of developed water, it is necessary to carry out post-development and utilization assessment of water resources and formulate corresponding water resource protection and restoration measures according to the assessment results. In view of the high water consumption per 10,000 yuan of GDP and the high water consumption of 10,000 yuan of industrial added value, it is necessary to establish an evaluation system for enterprise water use efficiency, carry out key supervision and rectification within a time limit for enterprises with low water use efficiency, and guide enterprises to adopt advanced water-saving technologies and production processes to improve water use efficiency. For areas with high population density, it is necessary to strengthen urban planning and population management, reasonably control the scale of cities and the rate of population growth, and at the same time strengthen publicity and education on water conservation, raise public awareness of water conservation, and reduce per capita water consumption.
Supplementary Materials
Author Contributions
Funding
Data Availability Statement
Conflicts of Interest
References
- Ministry of Water Resources of the People’s Republic of China. China Water Resources Bulletin; China Statistics Press: Beijing, China, 2024. [Google Scholar]
- Ministry of Water Resources of the People’s Republic of China. Results of Delineation of Groundwater Overexploitation Areas. Available online: http://mwr.gov.cn/zwgk/gknr/202501/t20250121_1726815.html (accessed on 3 August 2025).
- Yang, Y.; Yan, F.; Wu, H. The Improved Water Resource Stress Index (WRSI) Model in Humid Regions. Water 2024, 16, 1714. [Google Scholar] [CrossRef]
- Jia, X.; Klemeš, J.J.; Alwi, S.R.W.; Varbanov, P.S. Regional Water Resources Assessment using Water Scarcity Pinch Analysis. Resour. Conserv. Recycl. 2020, 157, 104749. [Google Scholar] [CrossRef]
- Huang, K.; Wang, Z.; Yang, S. Theory, accounting methods and application progress of water footprint. Prog. Water Conserv. Hydropower Sci. Technol. 2013, 23, 78–83. [Google Scholar]
- Arunrat, N.; Sereenonchai, S.; Chaowiwat, W.; Wang, C. Climate change impact on major crop yield and water footprint under CMIP6 climate projections in repeated drought and flood areas in Thailand. Sci. Total Environ. 2022, 807, 150741. [Google Scholar] [CrossRef] [PubMed]
- Hu, X. Water Footprint for the Hotel Industry as a Tool of Sustainable Water Management: A Case Study of Region X, China. In Proceedings of the 2021 2nd International Conference on Economics, Education and Social Research, Warsaw, Poland, 10–12 September 2021; Available online: https://webofproceedings.org/proceedings_series/article/artId/20451.html (accessed on 3 August 2025).
- Jovanovic, N.; Pereira, L.S.; Paredes, P.; Pôças, I.; Cantore, V.; Todorovic, M. A review of strategies, methods and technologies to reduce non-beneficial consumptive water use on farms considering the FAO56 methods. Agric. Water Manag. 2020, 239, 106267. [Google Scholar] [CrossRef]
- Liu, S.-b.; Sun, C.-z. Water footprint and space transfer at provincial level of China based on MRIO model. J. Nat. Resour. 2019, 34, 945–956. [Google Scholar] [CrossRef]
- Forin, S.; Mikosch, N.; Berger, M.; Finkbeiner, M. Organizational water footprint: A methodological guidance. Int. J. Life Cycle Assess. 2019, 25, 403–422. [Google Scholar] [CrossRef]
- Finogenova, N.; Dolganova, I.; Berger, M.; Núñez, M.; Blizniukova, D.; Müller-Frank, A.; Finkbeiner, M. Water footprint of German agricultural imports: Local impacts due to global trade flows in a fifteen-year perspective. Sci. Total Environ. 2019, 662, 521–529. [Google Scholar] [CrossRef]
- Bai, X.; Hu, M.; Zhu, C. ISO14046: Interpretation of the 2014 International Standard of Environmental Management Water Footprint Principles, Requirements and Guidelines. Stand. Sci. 2015, 9, 56–60. [Google Scholar] [CrossRef]
- Standardization Administration of the People’s Republic of China Beijing. Environmental Management: Water Footprint—Principles, Requirements and Guidelines. 2014. Available online: https://std.samr.gov.cn/gb/search/gbDetailed?id=71F772D817D7D3A7E05397BE0A0AB82A (accessed on 3 August 2025).
- ISO 14046:2014; Environmental Management—Water Footprint—Principles, Requirements and Guidelines. ISO: Geneva, Switzerland, 2014. Available online: https://www.iso.org/standard/43263.html (accessed on 3 August 2025).
- Standardization Administration of China. Guideline of Water Footprint Assessment and Reporting for Organization. 2017. Available online: https://openstd.samr.gov.cn/bzgk/std/newGbInfo?hcno=F2AE631AC15509D378E4633705E84CBE (accessed on 3 August 2025).
- China Iron and Steel Association. Water Footprint Assessment Requirement for Iron and Steel Industry. 2023. Available online: https://std.samr.gov.cn/gb/search/gbDetailed?id=027A6096AF62643EE06397BE0A0A0867 (accessed on 3 August 2025).
- Wang, Z. Calculation of the comprehensive index of water resources stress in the water-scarce areas of western Liaoning. Hydraul. Sci. Cold Reg. Eng. 2025, 8, 68–71. [Google Scholar]
- Wang, J.; Zhong, L.; Long, Y. Baseline Water Stress: China. 2016. Available online: https://wri.org.cn/sites/default/files/2022-01/baseline-water-stress-china-CN.pdf (accessed on 3 August 2025).
- Berger, M.; van der Ent, R.; Eisner, S.; Bach, V.; Finkbeiner, M. Water Accounting and Vulnerability Evaluation (WAVE): Considering Atmospheric Evaporation Recycling and the Risk of Freshwater Depletion in Water Footprinting. Environ. Sci. Technol. 2014, 48, 4521–4528. [Google Scholar] [CrossRef]
- Boulay, A.-M.; Bare, J.; Benini, L.; Berger, M.; Lathuillière, M.J.; Manzardo, A.; Margni, M.; Motoshita, M.; Núñez, M.; Pastor, A.V.; et al. The WULCA consensus characterization model for water scarcity footprints: Assessing impacts of water consumption based on available water remaining (AWARE). Int. J. Life Cycle Assess. 2017, 23, 368–378. [Google Scholar] [CrossRef]
- Kaewmai, R.; Grant, T.; Eady, S.; Mungkalasiri, J.; Musikavong, C. Improving regional water scarcity footprint characterization factors of an available water remaining (AWARE) method. Sci. Total Environ. 2019, 681, 444–455. [Google Scholar] [CrossRef]
- Ridoutt, B.G.; Pfister, S. A new water footprint calculation method integrating consumptive and degradative water use into a single stand-alone weighted indicator. Int. J. Life Cycle Assess. 2012, 18, 204–207. [Google Scholar] [CrossRef]
- Wang, X.; Liu, L.; Zhang, S.; Gao, C. Dynamic simulation and comprehensive evaluation of the water resources carrying capacity in Guangzhou city, China. Ecol. Indic. 2022, 135, 108528. [Google Scholar] [CrossRef]
- Zhang, H.; Ma, T.; Pan, Z.; Yang, L.; Wang, D.; Yu, G.; Li, H.; Zhang, K. Assessment and Diagnosis of the water resources carrying capacity in the Huaihe River basin of Anhui Province. Ecol. Indic. 2025, 176, 113596. [Google Scholar] [CrossRef]
- Yang, L.; Hao, Y.; Wang, B.; Li, X.; Gao, W. Evaluation of the water resources carrying capacity in Shaanxi Province based on DPSIRM–TOPSIS analysis. Ecol. Indic. 2025, 173, 113369. [Google Scholar] [CrossRef]
- Wang, Z.; Zhao, H.; Bao, X.; Wu, T. Multi-objective optimal allocation of water resources based on improved marine predator algorithm and entropy weighting method. Earth Sci. Inform. 2024, 17, 1483–1499. [Google Scholar] [CrossRef]
- Wang, Y.; Wan, F.; Peng, S.; Zheng, X.; Han, W.; Yan, D.; Wang, W.; Zhang, D. Resilience level assessment of regional water resources system based on multi-link. Ecol. Indic. 2024, 160, 111943. [Google Scholar] [CrossRef]
- Lv, B.; Liu, C.; Li, T.; Meng, F.; Fu, Q.; Ji, Y.; Hou, R. Evaluation of the water resource carrying capacity in Heilongjiang, eastern China, based on the improved TOPSIS model. Ecol. Indic. 2023, 150, 110208. [Google Scholar] [CrossRef]
- Xu, Z.; Chang, J.; Wang, Z.; Li, Z.; Liu, X.; Chen, Y.; Wei, Z.; Sun, J. Regional Urban Shrinkage Can Enhance Ecosystem Services—Evidence from China’s Rust Belt. Remote Sens. 2024, 16, 3040. [Google Scholar] [CrossRef]
- Xiang, W.; Yang, X.; Yan, X.; Wu, F.; Li, Y.; Zhang, Q.; Zhang, J.; Liu, Q. A new coupling evaluation method for human settlement-environment-energy systems: Enhancing residents’ happiness. Habitat Int. 2025, 164, 103502. [Google Scholar] [CrossRef]
- Li, X.L.; Wang, L.Z.; Li, H.H.; Zhao, Y.; Qin, C.H.; He, G.H.; Wang, H. Evaluation of industrial water-appropriate development in Beijing-Tianjin-Hebei region. South-to-North Water Transf. Water Sci. Technol. 2023, 21, 276–288. [Google Scholar] [CrossRef]
- Na, W.; Zhao, Z.C. The comprehensive evaluation method of low-carbon campus based on analytic hierarchy process and weights of entropy. Environ. Dev. Sustain. 2020, 23, 9308–9319. [Google Scholar] [CrossRef]
- Zhao, T.; Yu, L.; Jiang, X.; Yang, S.; Zhang, X.; Zhang, M.; Zhang, Y.; Yan, T.; Wu, H.; Xu, F. Construction of a public health practice teaching quality evaluation system based on the CIPP model using the Analytic Hierarchy Process (AHP) and entropy weight method. BMC Med. Educ. 2025, 25, 368. [Google Scholar] [CrossRef] [PubMed]
- Lv, C.; Hu, Y.; Ling, M.; Luo, A.; Yan, D. Comprehensive evaluation and obstacle factors of coordinated development of regional water–ecology–energy–food nexus. Environ. Dev. Sustain. 2023, 26, 20001–20025. [Google Scholar] [CrossRef]
- Wang, Y.L. Evaluation of provincial water resources carrying capacity in China: Based on the support-pressure coupling mechanism. Stat. Decis.-Mak. 2024, 40, 68–73. [Google Scholar] [CrossRef]
- Fang, D.; Song, C.; Li, C.; Lei, D.; Song, G.; Yuan, J.; Tong, C.; Cao, L. Water stress and driving factors based on interprovincial virtual water flow. Acta Geogr. 2025, 80, 712–733. [Google Scholar] [CrossRef]

| Model | WAVE | AWARE | ReCiPe | Multi-Dimensional Comprehensive Pressure Index of Water Resources |
|---|---|---|---|---|
| Source | Berger et al. [19] | Boulay et al. [20,21] | Ridoutt et al. [22] | This work |
| Considerations | The amount of water consumed due to evaporation rate is taken into account | Available water remaining | Consolidate consumable and degradable water into a single indicator | Physical scarcity + socio-economic adaptation |
| Spatial resolution | High (Basin/Country) | High (Basin/Country) | Medium (Country) | Medium (Country/Province) |
| Indicator dimensions | Single physical dimension | Single physical dimension | Two dimensions | Multiple dimensions |
| Advantages | High standardization, helpful interpretation of virtual water research | Scientific rigor, high resolution, clear physical significance | Covering the impact of water quantity and water quality in a single indicator | Comprehensive evaluation, identifies socio-economic vulnerability, supports differentiated policies |
| Disadvantages | The implementation is complex | The concept is slightly more complex and mainly reflects physical scarcity | Complex model, limited accuracy | High data demand, not yet standardized |
| Influencing Factor | Specific Indicator | Unit | Calculation Method | Significance | Attribute |
|---|---|---|---|---|---|
| Natural Factors | Total water resources per unit area (X1) | 104 m3/km2 | Total water resources/Regional area | Measures renewable freshwater availability | - |
| Irrigation water use per cultivated mu (X2) | m3 | Irrigation water use/Actually irrigated area | Reflects water-saving technology effectiveness | + | |
| Water resources utilization rate (X3) | % | (Total water supply/Total water resources) × 100% | Indicates water development intensity | + | |
| Economic Factors | Water use per 104 yuan GDP (X4) | m3/104 yuan | Total water use/GDP | Measures water use efficiency | + |
| Tertiary industry proportion (X5) | % | (Tertiary industry GDP/Total GDP) × 100% | Reflects economic structure optimization | - | |
| Industrial water use per 104 yuan value-added (X6) | m3/104 yuan | Industrial water use/Industrial value-added | Indicates industrial water efficiency | + | |
| Social Factors | Urbanization rate (X7) | % | (Urban population/Total population) × 100% | Measures urban development level | + |
| Population density (X8) | persons/km2 | Total population/Total area | Reflects population stress | + | |
| Per capita domestic water use (X9) | m3/day | Residential water use/Population | Indicates household water consumption intensity | + |
| Ranking | 1 | 2 | 3 | 4 | ||||
|---|---|---|---|---|---|---|---|---|
| Factor | Obstacle % | Factor | Obstacle % | Factor | Obstacle % | Factor | Obstacle % | |
| Beijing | X8 | 0.27 | X3 | 0.26 | X4 | 0.19 | X6 | 0.12 |
| Tianjin | X3 | 0.26 | X8 | 0.26 | X4 | 0.20 | X6 | 0.13 |
| Hebei | X3 | 0.27 | X8 | 0.26 | X4 | 0.20 | X6 | 0.13 |
| Shanxi | X3 | 0.27 | X8 | 0.26 | X4 | 0.20 | X6 | 0.13 |
| Inner Mongolia | X3 | 0.29 | X8 | 0.27 | X4 | 0.19 | X6 | 0.14 |
| Liaoning | X3 | 0.28 | X8 | 0.27 | X4 | 0.20 | X6 | 0.13 |
| Jilin | X3 | 0.28 | X8 | 0.27 | X4 | 0.20 | X6 | 0.13 |
| Heilongjiang | X3 | 0.28 | X8 | 0.27 | X4 | 0.18 | X6 | 0.14 |
| Shanghai | X9 | 0.32 | X3 | 0.27 | X4 | 0.23 | X6 | 0.08 |
| Jiangsu | X3 | 0.27 | X8 | 0.27 | X4 | 0.24 | X6 | 0.09 |
| Zhejiang | X8 | 0.27 | X3 | 0.27 | X4 | 0.20 | X6 | 0.12 |
| Anhui | X3 | 0.27 | X8 | 0.26 | X4 | 0.24 | X6 | 0.08 |
| Fujian | X3 | 0.29 | X8 | 0.28 | X4 | 0.21 | X6 | 0.12 |
| Jiangxi | X3 | 0.29 | X8 | 0.27 | X4 | 0.22 | X6 | 0.11 |
| Shangdong | X3 | 0.26 | X8 | 0.25 | X4 | 0.20 | X6 | 0.13 |
| Henan | X3 | 0.26 | X8 | 0.25 | X4 | 0.20 | X6 | 0.13 |
| Hubei | X8 | 0.27 | X3 | 0.27 | X4 | 0.23 | X6 | 0.10 |
| Hunan | X3 | 0.28 | X8 | 0.27 | X4 | 0.22 | X6 | 0.10 |
| Guangdong | X3 | 0.29 | X8 | 0.28 | X4 | 0.20 | X6 | 0.12 |
| Guangxi | X3 | 0.30 | X8 | 0.28 | X4 | 0.23 | X6 | 0.09 |
| Hainan | X3 | 0.30 | X8 | 0.28 | X4 | 0.20 | X6 | 0.12 |
| Chongqing | X8 | 0.28 | X3 | 0.27 | X4 | 0.21 | X6 | 0.11 |
| Sichuan | X3 | 0.28 | X8 | 0.27 | X4 | 0.20 | X6 | 0.13 |
| Guizhou | X3 | 0.28 | X8 | 0.26 | X4 | 0.21 | X6 | 0.11 |
| Yunnan | X3 | 0.28 | X8 | 0.26 | X4 | 0.20 | X6 | 0.12 |
| Tibet | X3 | 0.29 | X8 | 0.26 | X4 | 0.24 | X6 | 0.08 |
| Shannxi | X3 | 0.27 | X8 | 0.26 | X4 | 0.20 | X6 | 0.13 |
| Gansu | X3 | 0.29 | X8 | 0.26 | X4 | 0.19 | X6 | 0.13 |
| Qinghai | X3 | 0.29 | X8 | 0.26 | X4 | 0.20 | X6 | 0.13 |
| Ningxia | X8 | 0.26 | X4 | 0.18 | X2 | 0.17 | X3 | 0.16 |
| Xinjiang | X3 | 0.30 | X8 | 0.28 | X6 | 0.26 | X4 | 0.06 |
Disclaimer/Publisher’s Note: The statements, opinions and data contained in all publications are solely those of the individual author(s) and contributor(s) and not of MDPI and/or the editor(s). MDPI and/or the editor(s) disclaim responsibility for any injury to people or property resulting from any ideas, methods, instructions or products referred to in the content. |
© 2025 by the authors. Licensee MDPI, Basel, Switzerland. This article is an open access article distributed under the terms and conditions of the Creative Commons Attribution (CC BY) license (https://creativecommons.org/licenses/by/4.0/).
Share and Cite
Qiao, L.; Bai, X.; Bai, Y.; Liu, J.; Kong, L.; Zhang, L. Study on an Evaluation Model for Regional Water Resource Stress Based on Water Scarcity Footprint. Water 2025, 17, 2768. https://doi.org/10.3390/w17182768
Qiao L, Bai X, Bai Y, Liu J, Kong L, Zhang L. Study on an Evaluation Model for Regional Water Resource Stress Based on Water Scarcity Footprint. Water. 2025; 17(18):2768. https://doi.org/10.3390/w17182768
Chicago/Turabian StyleQiao, Lu, Xue Bai, Yan Bai, Jialin Liu, Lingsi Kong, and Lan Zhang. 2025. "Study on an Evaluation Model for Regional Water Resource Stress Based on Water Scarcity Footprint" Water 17, no. 18: 2768. https://doi.org/10.3390/w17182768
APA StyleQiao, L., Bai, X., Bai, Y., Liu, J., Kong, L., & Zhang, L. (2025). Study on an Evaluation Model for Regional Water Resource Stress Based on Water Scarcity Footprint. Water, 17(18), 2768. https://doi.org/10.3390/w17182768


