Article

Surface Water–Groundwater Interactions in a Sahelian Catchment: Exploring Hydrochemistry and Isotopes and Implications for Water Quality Management

1
Université Yembila Abdoulaye Toguyeni, Mining Engineering Department, BP 54, Fada N’Gourma P.O. Box 54, Burkina Faso
2
Université Joseph Ki-Zerbo, Laboratoire Géoscience et Environnement, Ouagadougou P.O. Box 7021, Burkina Faso
3
Université Catholique de Louvain, Earth and Life Institute, Croix du Sud 2, Box 2, 1348 Louvain-la-Neuve, Belgium
4
Université de Corse Pascal Paoli, CNRS UMR 6134 SPE, Equipe Hydrogéologie, Campus Grimaldi, BP52, 20250 Corte, France
5
International Atomic Energy Agency, Isotope Hydrology Section, Division of Physical and Chemical Sciences, Department of Nuclear Sciences and Applications, Wagramer Strasse 5, P.O. Box 100, 1400 Vienna, Austria
6
University of KwaZulu Natal, Centre for Water Resources Research, Private Bag X01, Scottsville, Pietemartizburg 3209, South Africa
*
Author to whom correspondence should be addressed.
Water 2025, 17(18), 2756; https://doi.org/10.3390/w17182756
Submission received: 13 August 2025 / Revised: 3 September 2025 / Accepted: 7 September 2025 / Published: 17 September 2025
(This article belongs to the Special Issue Soil and Groundwater Quality and Resources Assessment, 2nd Edition)

Abstract

The Sahel Transboundary Taoudéni Basin, covering about 20% of Burkina Faso, hosts vital aquifers critical for water security and development. Effective groundwater monitoring is essential for sustainable resource management. In the Kou sub-basin, groundwater quality assessment is increasingly important. This study integrates hydrochemistry, water stable isotopes (δ18O, δ2H), GIS, and multivariate statistics to understand subsurface geochemical processes. A total of 48 samples—43 groundwater and 5 surface water—were analyzed for 19 hydrochemical parameters and isotopes. In surface water, δ18O ranged from −5.96‰ to −5.09‰, and δ2H from −37.65‰ to −29.15‰. In groundwater, δ18O ranged from −5.93‰ to −4.39‰, and δ2H from −34.62‰ to −25.05‰. The spatial distribution of δ18O and δ2H was mapped using inverse distance weighted (IDW) interpolation in ArcGIS 10.8. A δ2H vs. δ18O plot showed groundwater values clustered near the Global Meteoric Water Line, indicating minimal evaporation during recharge. Groundwater chemistry was dominated by Ca2+ > Na+ > Mg2+ > K+ and HCO3 > NO3 > Cl > SO42−. Key hydrogeochemical processes include water–rock interaction (leaching, weathering, ion exchange) and anthropogenic pollution. Isotopic signatures reveal heterogeneous recharge sources and aquifer connectivity. These findings enhance the understanding of water sources and geochemical processes in the Kou basin, supporting informed groundwater resource management.

1. Introduction

Groundwater is a major component of available freshwater, and its use is increasing due to climate change, reduced surface runoff, and growing water shortages in river and lake catchments [1]. According to BGR and UNESCO [2], the interconnections between surface waters and groundwater and human interactions with them call for an integrated management approach. Surface Water (SW) and GroundWater (GW) should therefore be managed coherently and jointly to ensure water supply quality [3,4].
Recent studies have highlighted the role of lacustrine groundwater discharge (LGD) in regulating nutrient dynamics in lakes, with spatial variability controlled by water depth and connectivity to aquifers [5]. Such findings underscore that groundwater discharge can significantly influence water quality and ecological functioning, particularly in floodplain lakes, emphasizing the need to consider similar processes in river and groundwater management.
In the Sudano-Sahelian zone of West Africa, water demand has steadily increased since the 1970s, while rainfall has declined markedly over the same period [6,7]. This reduction in precipitation, largely attributed to climate change, has decreased surface runoff, potentially limiting the sustainability of current and future water resources [8]. Concurrently, demographic growth and associated land use changes have intensified pressure on natural resources, altering hydrological responses across the region [9,10]. The Upper Mouhoun–Sourou (Ms-S) complex, spanning Burkina Faso and Mali, exemplifies these dynamics: previous studies have quantified climate-driven trends in rainfall and runoff [8] and assessed the impacts of land use change on river flows and soil water retention [9,10]. Despite these advances, critical knowledge gaps remain, particularly regarding the integrated dynamics of surface water, groundwater, and socio-economic water demands in the Ms-S complex. Addressing these gaps is essential for sustainable water resource management under evolving climatic and environmental pressures.
Ref. [8] investigated the impacts of climate change on water resources in the Kou basin, predicting decreased rainfall, increased runoff, and reduced groundwater recharge, which may lead to soil leaching and reservoir sedimentation. At the same time, the Mouhoun-Sourou complex plays a crucial role for irrigation, pastoralism, industry, and mining, where surface water and groundwater are jointly exploited to meet diverse water needs. Despite these insights, environmental and climatic pressures continue to reduce spring flows and threaten local ecosystems, highlighting persistent gaps in understanding the interactions between water resources and socio-economic activities in this region.
Several studies, especially in hydrogeology, have aimed to characterize the aquifer dynamics and potential within the Ms-S complex, which roughly corresponds to the southeastern margin of the Taoudeni sedimentary basin [11,12,13,14,15,16]. According to Derouane and IAEA [17], this southeastern border can be described as a “unique multilayered aquifer,” with ancient groundwater and minimal modern recharge. The Taoudeni basin itself is a transboundary system, also known as the Upper Mouhoun basin (previously called the Black Volta Basin), extending across Burkina Faso into Ghana.
Hydrochemical and isotopic data play a valuable role in both the quantitative and qualitative analysis of water resources, providing essential insights for developing sustainable water management strategies. Additionally, hydrogeochemical investigations reveal that trace element concentrations in rivers and groundwater are strongly influenced by rock–water interactions, geothermal inputs, and other natural enrichment mechanisms [18]. These studies highlight the need to disentangle anthropogenic versus natural sources of contaminants when assessing groundwater vulnerability and water quality in semi-arid and endorheic basins. Recently, numerous researchers have utilized geochemical and isotopic methods to investigate water mineral quality, aquifer interactions, as well as the processes of recharge and evaporation affecting water bodies [11,14,19,20,21,22,23,24,25]. Kumari et al. [26] highlight that among the physical tracers available, the stable isotopes of oxygen (δ18O) and hydrogen (δ2H) in water molecules are widely used to analyze hydrological and hydrogeological processes. Coplen et al. [27] note that the ratio of heavy to light stable isotopes (18O/16O and 2H/1H) provides a powerful tool for addressing practical challenges in environmental isotope geochemistry, with applications spanning hydrology, climatology, and biogeochemistry. As water moves through different stages of the hydrological cycle, isotope fractionation occurs, leading to distinct isotopic signatures in each phase [26]. Research by [28,29,30,31] has shown that these isotopes behave conservatively during mixing, making them valuable for studying groundwater–surface water interactions, the relative contributions to surface flow, recharge patterns, and estimating water residence times within catchments. When combined with additional parameters such as chloride concentration, electrical conductivity, and temperature, stable isotopes (δ18O and δ2H) serve as important indicators of hydrogeochemical processes in a region [28,31,32,33]. This study focuses on the Kou basin, located at the southwestern boundary of the transboundary Taoudéni sedimentary basin in Burkina Faso, to enhance understanding of the region. The sandstone formations within the Kou basin contain important aquifers that supply drinking water to Bobo-Dioulasso and surrounding communities [34]. In recent decades, these groundwater resources have faced growing anthropogenic pressures, including increased extraction rates and higher levels of pollutant inputs into aquatic systems. To aid resource managers in overseeing and managing these challenges, multivariate hydrochemical analyses combined with stable isotope data (δ18O and δ2H) integrated within a GIS framework have been utilized to map the spatial patterns of pollution and water use.
Groundwater in the Kou basin is increasingly threatened by anthropogenic pressures, climate variability, and land use changes. However, limited research has examined how surface water–groundwater interactions and aquifer connectivity shape water quality at different depths. Among these processes, lacustrine groundwater discharge (LGD) plays a critical role, not only regulating nutrient fluxes but also mediating the transport and enrichment of potentially toxic elements (PTEs), with implications for human health and microbial dynamics in aquatic systems [35]. Understanding these interactions is therefore essential for assessing both the ecological and socio-economic risks associated with groundwater use, particularly in regions subject to intensive agriculture, industrial expansion, or mining activities.
To address these gaps, this study aims to identify and characterize the interactions between surface water and groundwater, assess the hydrochemical and isotopic signatures of water sources, and evaluate how environmental changes affect groundwater quality. By linking these processes, the study seeks to provide critical insights into the vulnerability of groundwater resources and support the development of sustainable, integrated water management strategies in the basin.

2. Materials and Methods

2.1. Study Area

2.1.1. General Information

The study area is the Kou River basin, part of the National Mouhoun basin in Burkina Faso (Figure 1). The surface area of this small watershed of 1800 km2 represents 0.66% of the country and holds the second largest city of Burkina Faso (Bobo-Dioulasso), a former public irrigated rice perimeter and several expanding informal agricultural zones. The basin is located between Longitudes 4°08′ W and 4°36′ W and Latitudes 10°55′ N and 11°32′ N. The Kou watershed is situated in the Sudanian climatic zone. The climate is characterized by the alternation of two seasons, namely a rainy season (4 to 5 months) that extends from June to October, and a dry season (7 to 8 months) that extends from October to May. The alternation of these seasons is conditioned by the annual movement of the Intertropical Convergence Zone (ITCZ). The alternation of wet and dry seasons is driven by the annual migration of the Intertropical Convergence Zone (ITCZ). Average yearly rainfall in the region ranges from 900 to 1100 mm, while potential evapotranspiration averages around 2000 mm per year [36]. Specifically, Tirogo et al. 16] reported that between 1961 and 2014, the Bobo Dioulasso station recorded an average annual rainfall of approximately 1025 mm. Rainfall decreases from south to north, with isohyets generally spanning between 900 mm and 1100 mm. Monthly temperatures typically vary from 25 °C to 31 °C. Annual rainfall variations are influenced by prevailing climatic conditions [14]. During years with higher precipitation, the isotopic composition of local rainfall tends to show more negative values, which is attributed to cooler temperatures and increased humidity that reduce evaporation [37]. Moreover, the isotopic characteristics of rainfall are closely connected to its atmospheric source. In the Sahel region, rainfall primarily originates from either the Guinean monsoon or easterly disturbances associated with the African Easterly Jet and Tropical Easterly Jet [38]. The dominance of these weather systems during the rainy season directly impacts both the amount of rainfall and its isotopic signature [39].
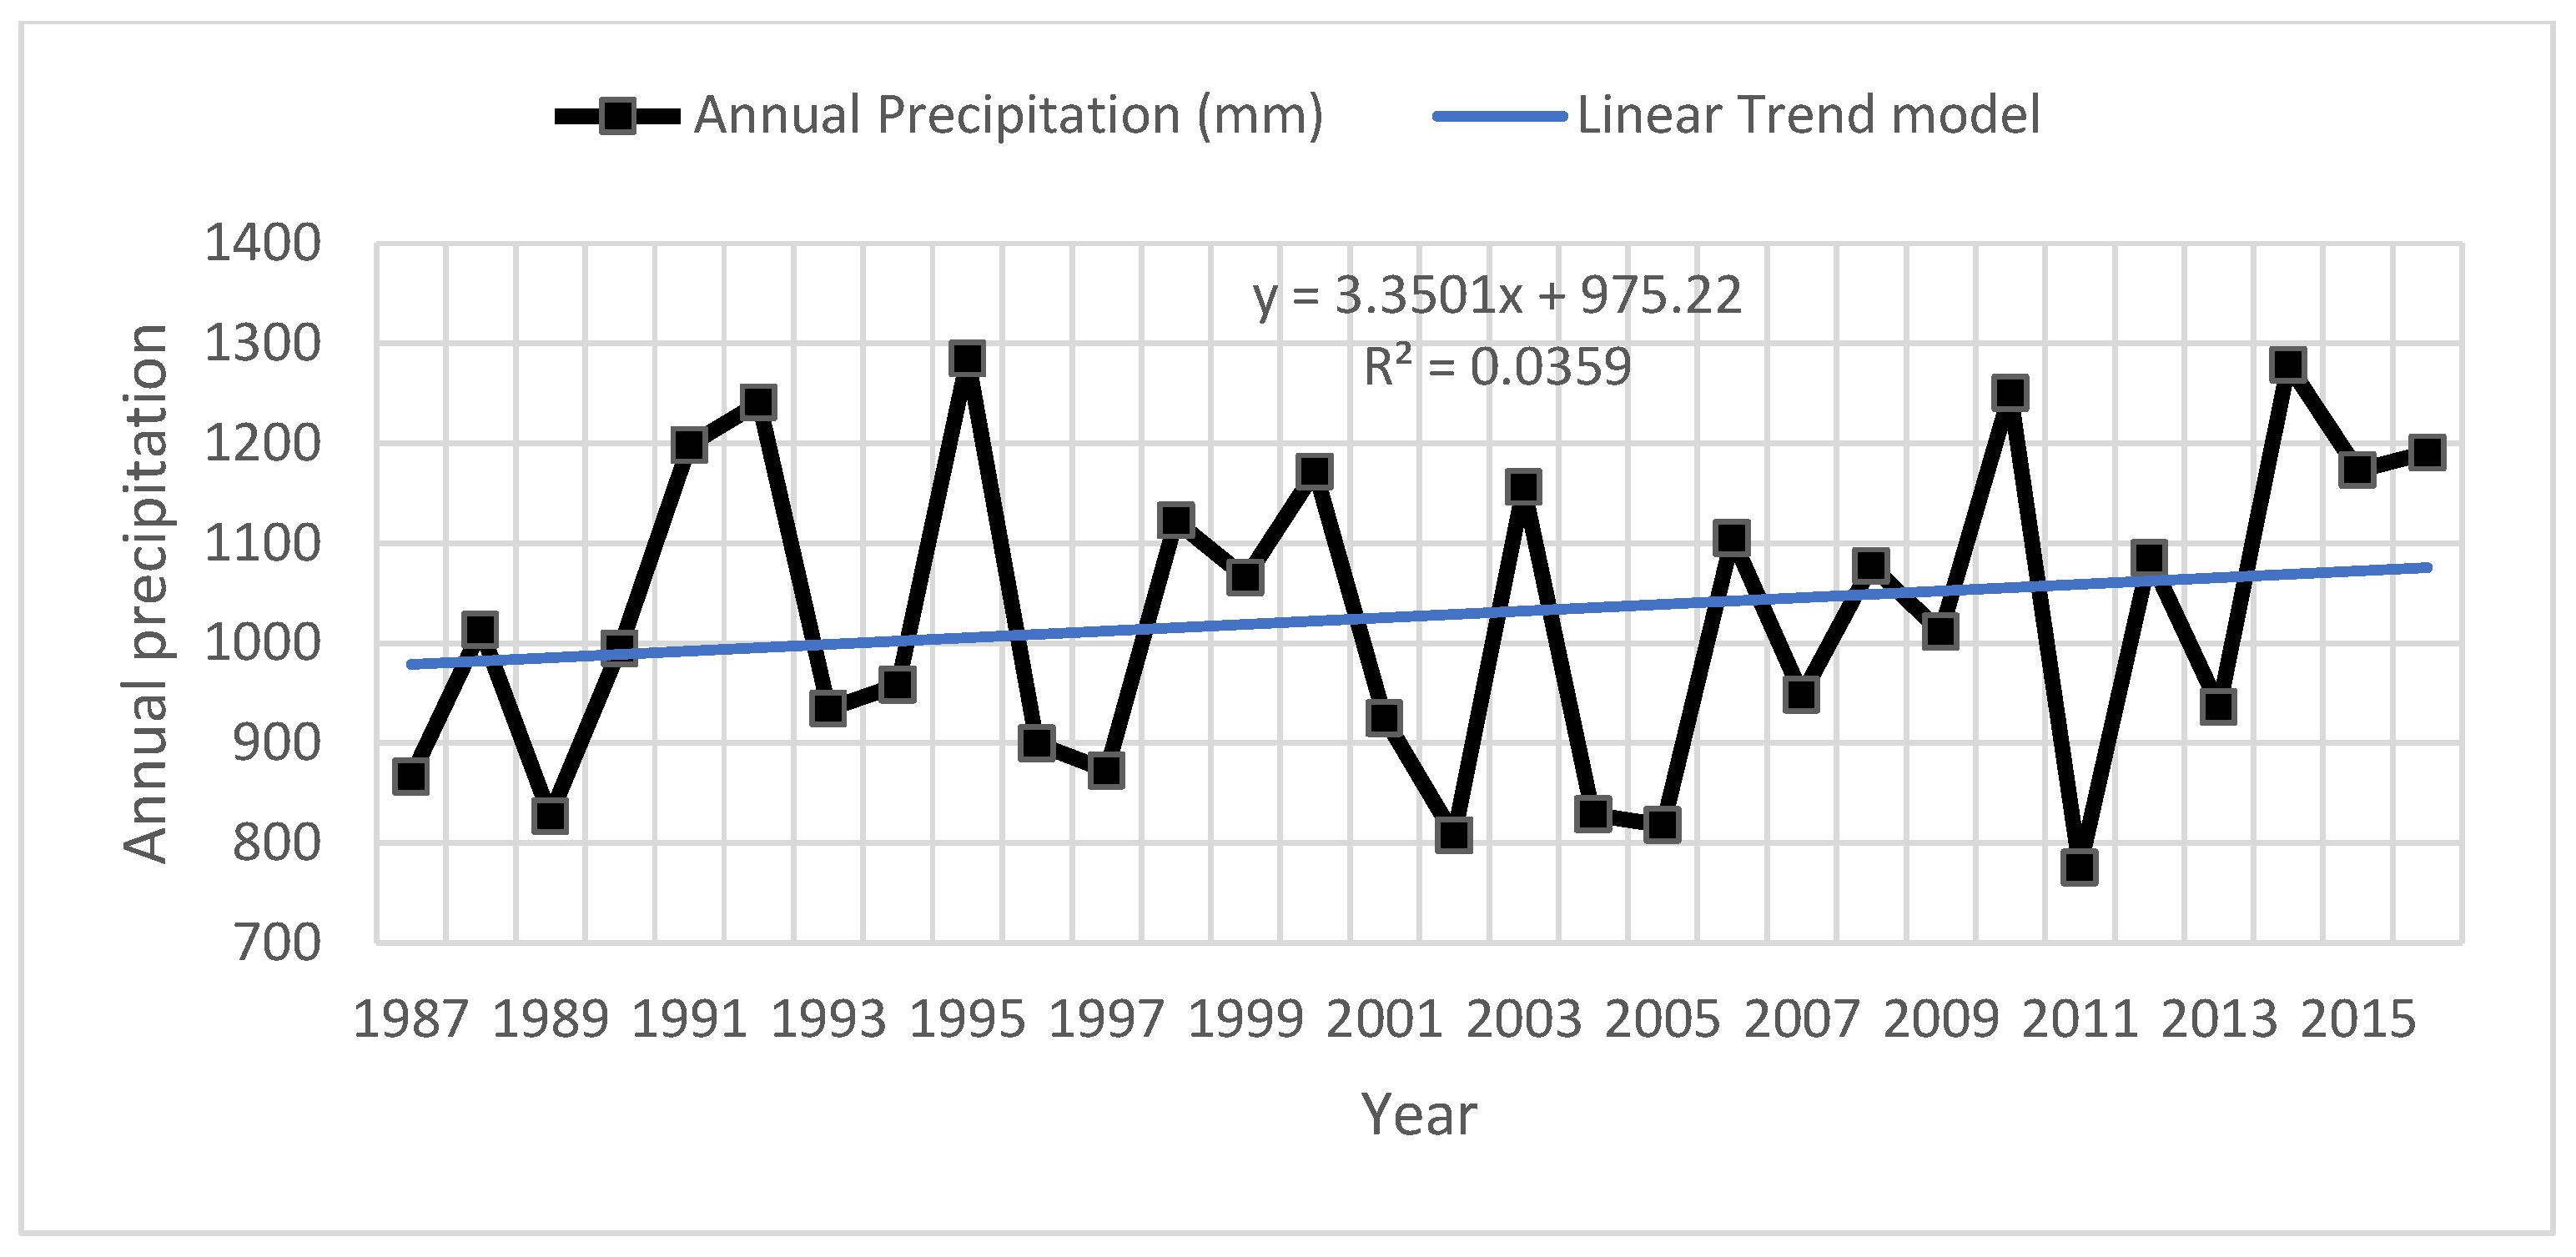
Precipitation measurements for the Kou Basin in this research were obtained from the Bobo-Dioulasso synoptic station, spanning the period 1987–2016 (see Figure 2). The soils within the Kou catchment are predominantly ferruginous and ferralitic, with depths ranging from 0.1 to 1.2 m [40]. These soil types are chiefly found in the alluvial plains of the Kou watershed, where they support most of the current hydro-agricultural infrastructures [41].

2.1.2. Geological and Hydrogeological Setting

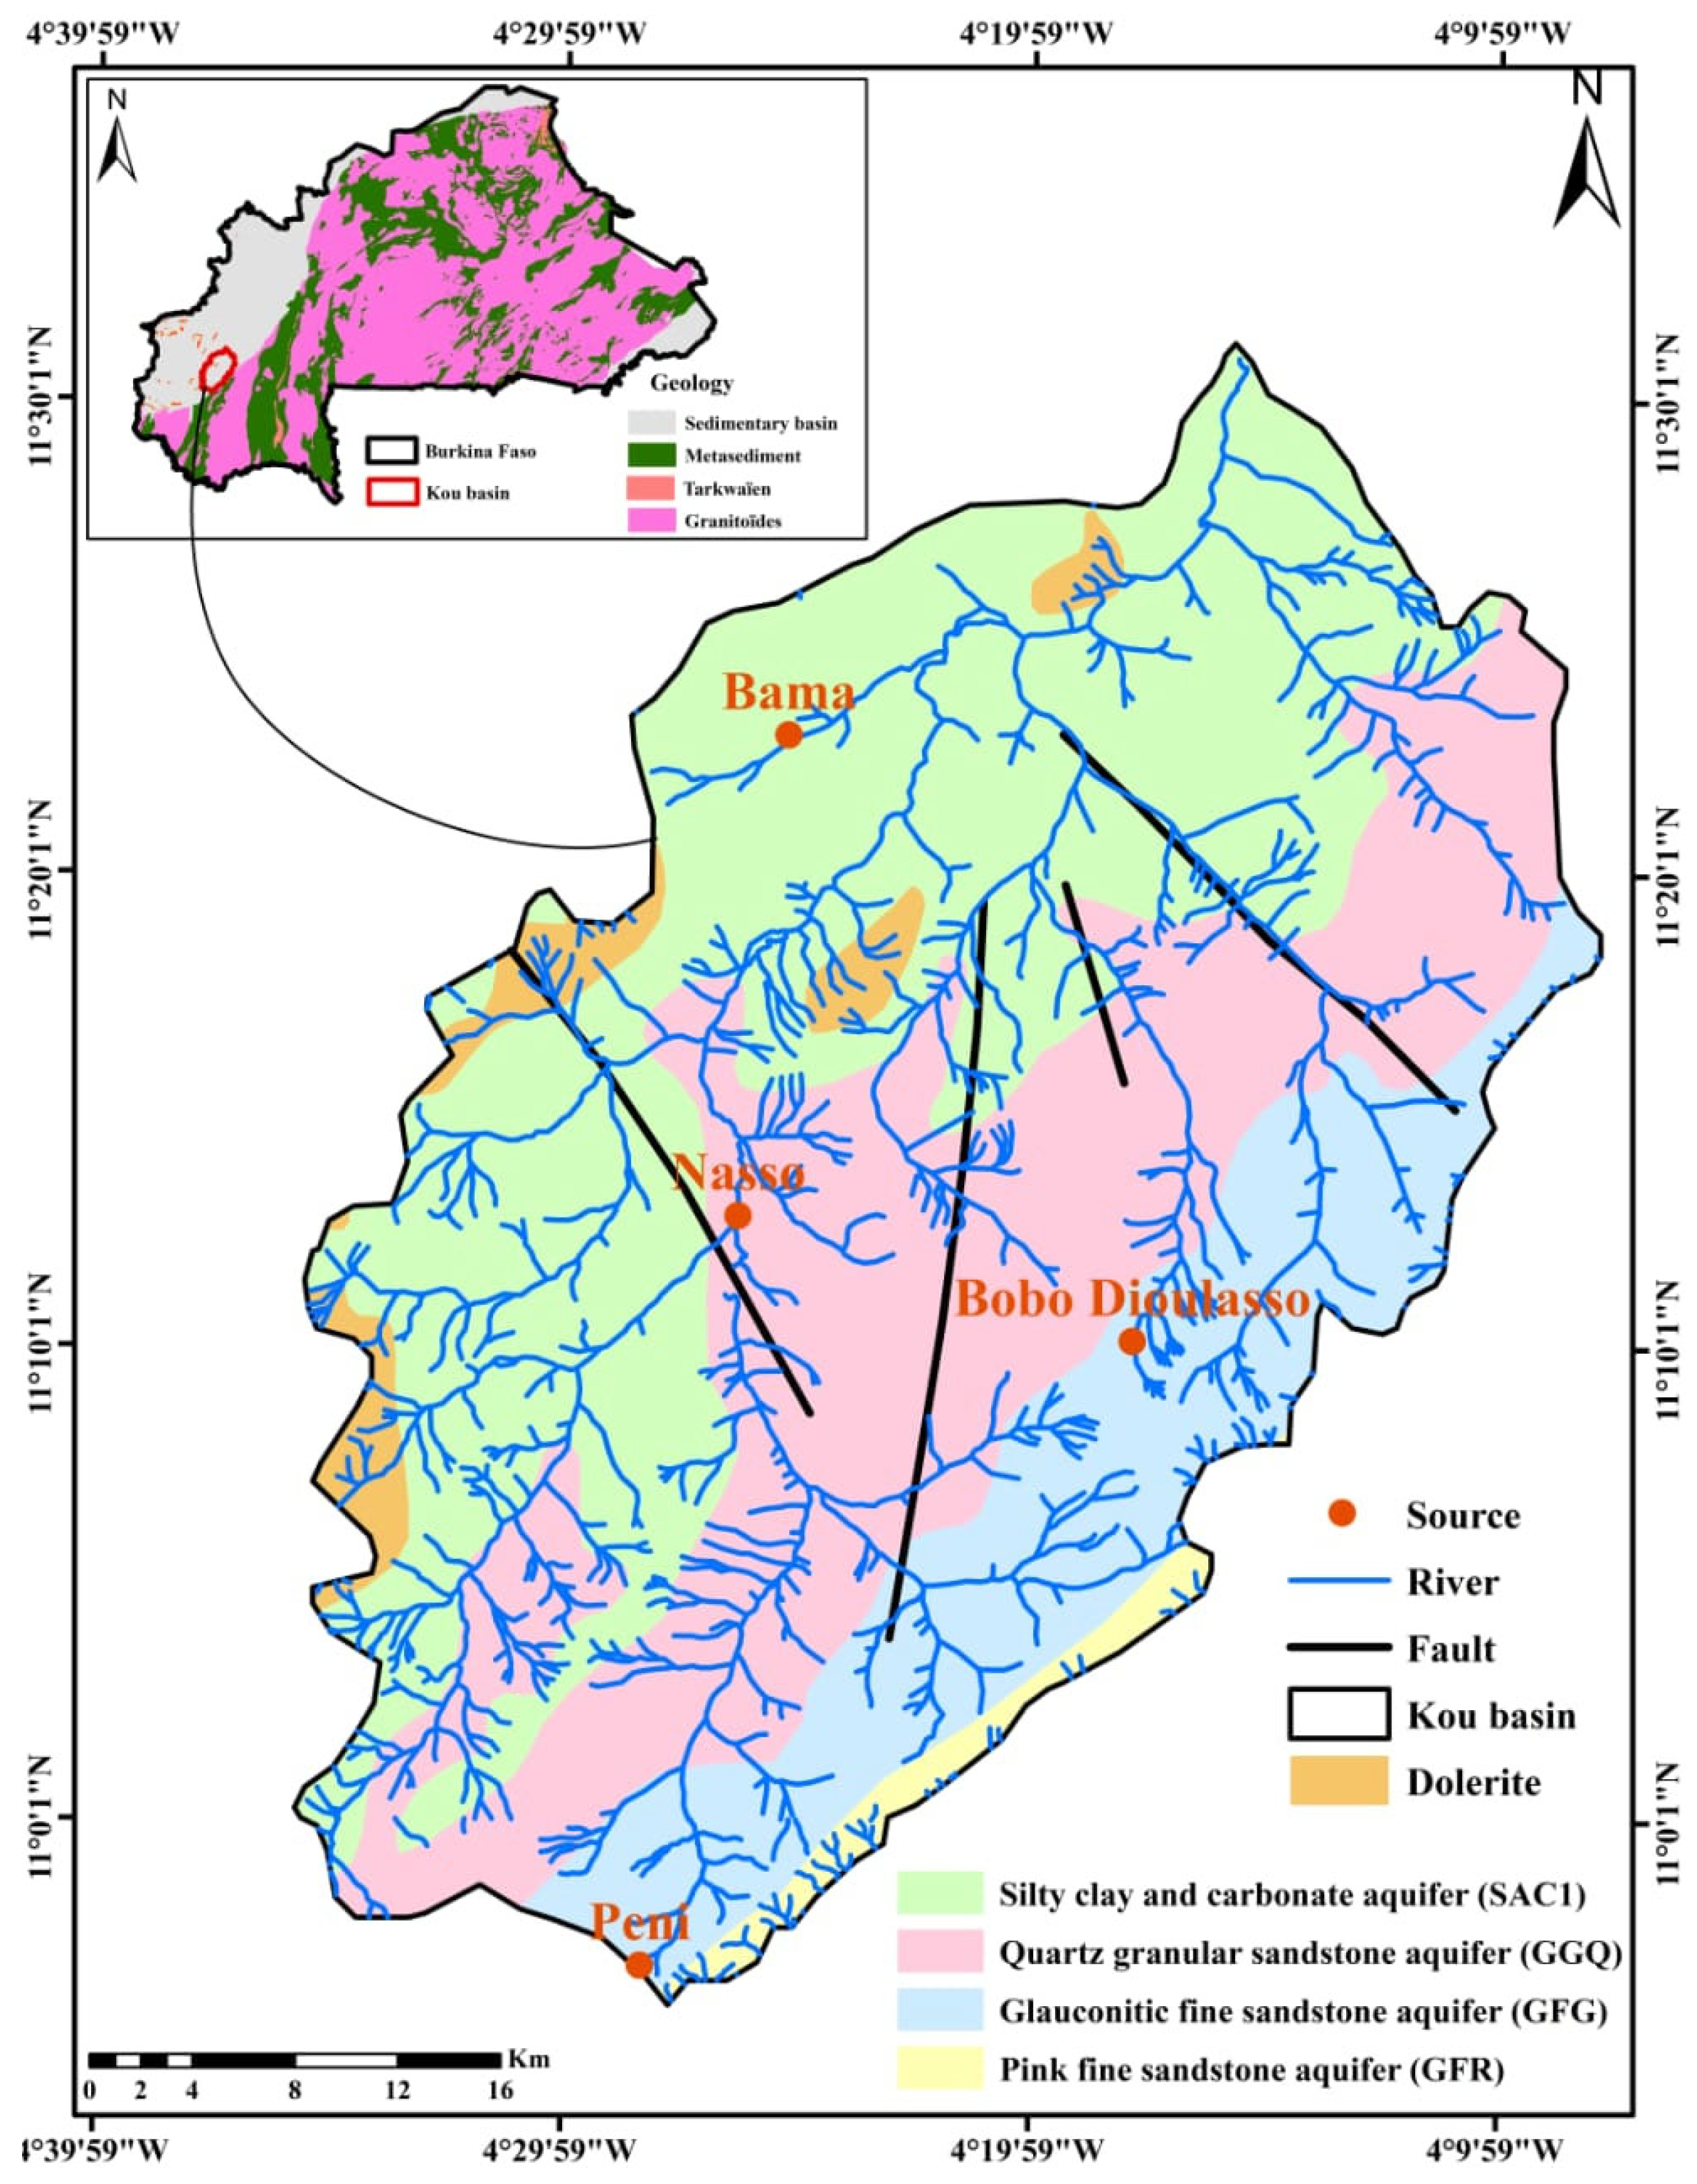
The geology of the study area primarily consists of a combination of sandstones, shales, and carbonate rocks. Determining the thickness of these lithological formations in the Kou region is challenging, as highlighted by [34]. Ouedraogo [42] identified five distinct geological formations: the Kawara-Sindou sandstone (GKS) with thicknesses between 90 and 350 m; glauconitic fine sandstone (GFG) ranging from 100 to 500 m; quartz-grained sandstone (GGQ) with thicknesses of 300 to 600 m; a formation of siltstones, argillites, and carbonates (SAC1) approximately 300 m thick; and pink fine sandstone (GFR) with a thickness near 100 m (see Figure 3). According to Bronner et al. [43], sediment thickness north of Bobo-Dioulasso may reach up to 2000 m. The basin is also traversed by extensive post-tectonic dolerite dykes, which appear on the surface as chains of hills or isolated hills, oriented from south–southwest to north–northeast. These geological units are highly fractured and segmented by approximately parallel faults with vertical displacements, trending southeast to northwest.
These five geological formations represent the main aquifer systems in the region. Their properties and hydrogeological behavior have been examined in several investigations [11,17,44,45,46].
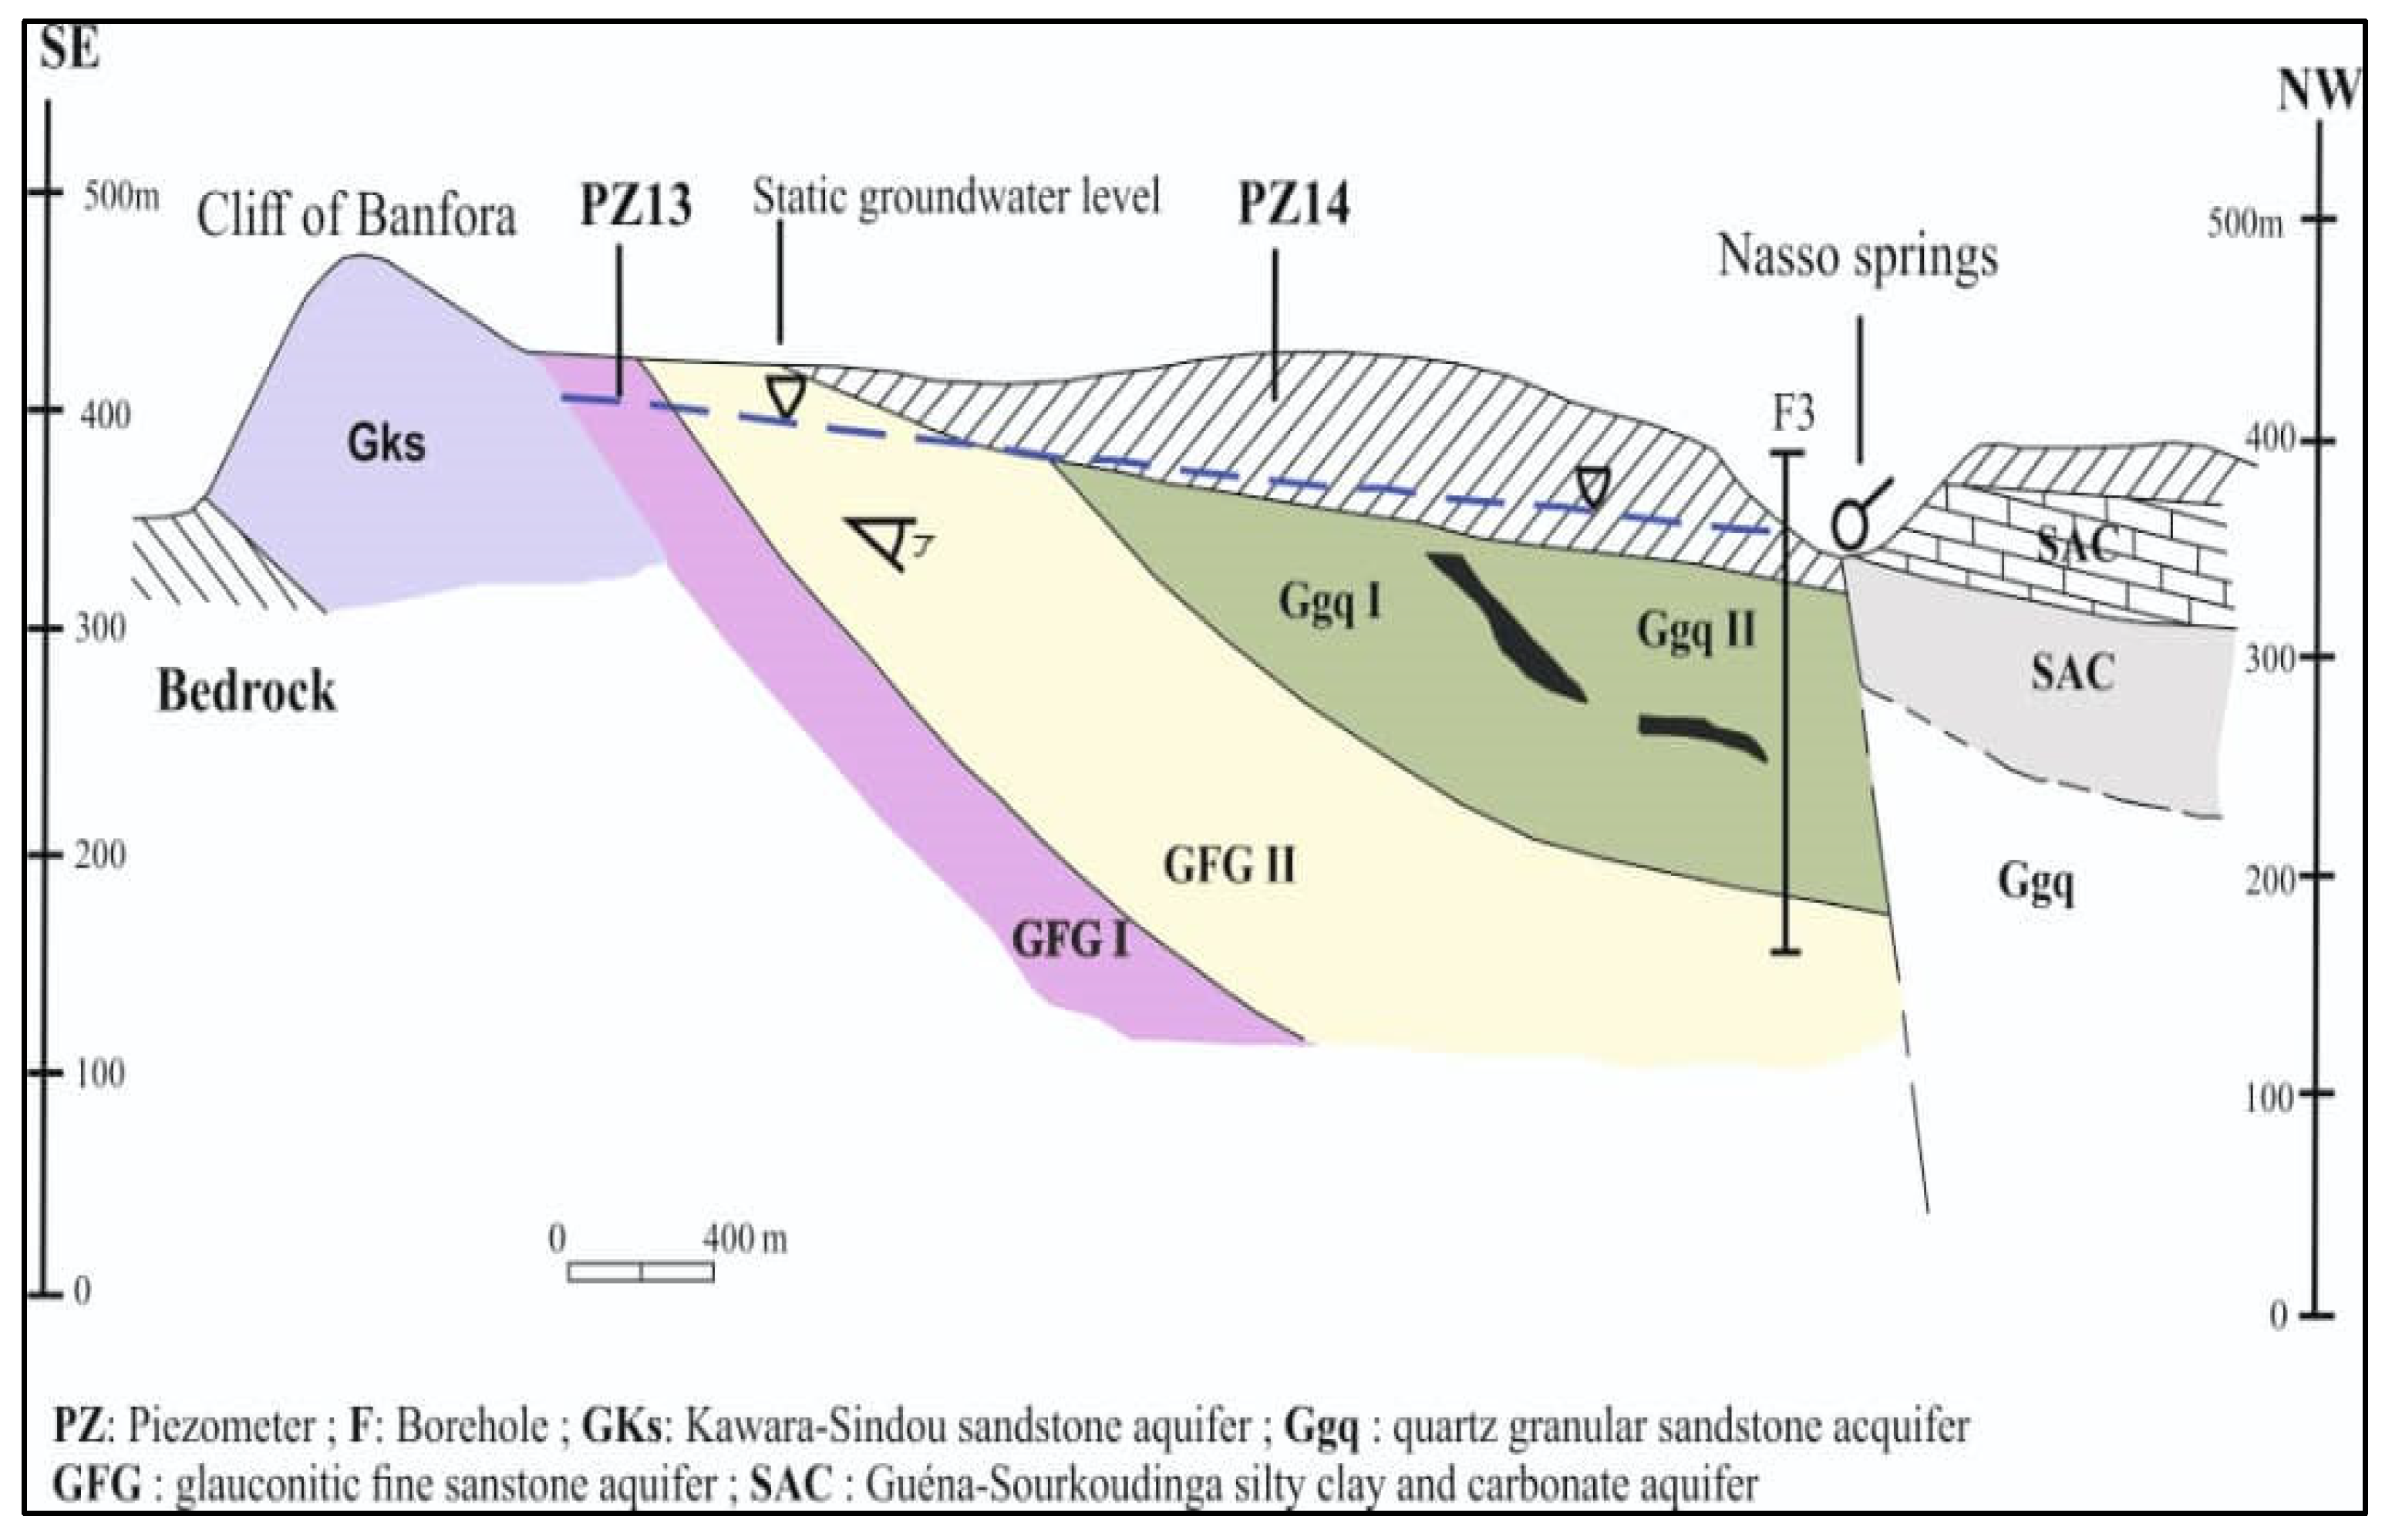
Lorenzini [46] describes the Kou basin as being composed of alternating permeable and less permeable geological deposits, which support the formation of multiple aquifer layers. The abundance of faults in the area enhances groundwater flow and establishes important hydraulic links between these aquifers [45]. Additionally, the aquifer system is locally confined due to the presence of clay layers interspersed between the primary aquifer units [16]. In more than two-thirds of the area, the sedimentary aquifer is, nonetheless, unconfined [47]. According to this author, this multilayer aquifer system shelters a substantial water reserve given its sandstone structure and fractures. Tirogo et al. [16] affirm that the thickness of the unsaturated zone varies between 0 and 20 m, but in a few places, it can reach 60 m. In the downstream section of the Kou catchment, within the alluvial plain, the water table lies very close to the surface, typically less than 3 m deep. Within the Kou basin, all piezometers are drilled into the upper aquifer layers, at depths shallower than 200 m [16]. Earlier research often focused on treating the aquifer as a single layer within a multilayer system [11,48], a perspective supported by isotopic analysis conducted in the area [14]. Faults are recognized as playing a significant role in groundwater recharge and in the emergence of water at springs [14,45]. In summary, the study area lies on the southeastern margin of the Taoudeni sedimentary basin, featuring a monoclinal geological structure with a gentle dip of approximately 2° toward the northwest (see Figure 4).
Table 1 provides a summary of the main hydrogeological characteristics of different aquifer levels. The hydrogeological setting in the regional basin of sedimentary deposits of the STBA (Southeastern Taoudeni Basin Aquifer) was extensively documented by [47].

2.1.3. Hydrology and Anthropogenic Pressure

The Kou basin is rich in water resources, including numerous springs, a perennial river, and an accessible shallow aquifer [49]. These reserves, among the most significant in West Africa [16], hold substantial socio-economic importance for Burkina Faso, particularly for Bobo-Dioulasso and surrounding areas. The basin provides drinking water, irrigation for cultivated areas, industrial supply, and ecological functions [36]. Major perennial sources, such as Guinguette (6000 m3/h), ONEA1 (850 m3/h), and ONEA2 (550 m3/h), are critical for meeting the water demand of Bobo-Dioulasso, which now hosts over 900,000 inhabitants [50,51].
Despite this abundance, growing irrigation needs driven by population growth and inefficient practices are depleting both surface and groundwater [52]. Five major irrigated zones lie along the Kou River, where surface water supplies nearly 65% of irrigation demand, exceeding groundwater use [53]. Agricultural expansion and demographic pressure have contributed to a reduction in river low flows, from 2.3 m3/s in 1960 to 1.6 m3/s by 2008 [44,46,54]. Although perennial flow is sustained by groundwater recharge from springs near Nasso [55], overexploitation threatens long-term water availability.
These pressures have also generated conflicts over resource allocation. The basin contains nearly 2000 hectares of hydro-agricultural infrastructure, including private gardens and a 1200-hectare rice irrigation scheme. As the water demand of Bobo-Dioulasso intensifies, concerns over water quality have become more pressing. Dione [56] showed that industrialization, combined with inadequate sanitation, leads to untreated discharges of domestic and industrial wastewater. In parallel, the intensive use of fertilizers and pesticides further contributes to water degradation.
Subsequent studies reinforced these findings. Bieupoudé [57] identified vulnerable areas such as the alluvial plains upstream of the Nasso source and downstream of Bobo-Dioulasso, while Ko [58] highlighted industrial effluents as a key source of pollution containing heavy metals, organic matter, and toxic chemicals. Together with agricultural runoff, pesticides, and municipal waste, these discharges constitute major threats to both surface and groundwater in the basin. Overall, human activities have a clear and cumulative impact on water quality, underscoring the urgent need for improved resource management and pollution control measures.

2.2. Sampling Method and Isotope Analysis

2.2.1. Sampling Procedures

Water samples were collected from surface water (n = 5) and groundwater (n = 43) in September 2022 during the wet season. Sampling coordinates (latitude, longitude, and altitude) were recorded using a GPS (WGS-84 datum). Physicochemical parameters—including temperature, pH, electrical conductivity, turbidity, dissolved oxygen, and total dissolved solids—were measured in situ after purging the boreholes using a Multi 3430-WTWTM device. Electrodes were rinsed with distilled water prior to each measurement. These parameters help distinguish between different aquifers and identify zones of preferential water supply or potential contamination (Dakouré, 2003; Ben, 2011 [11,59]). Alkalinity was determined in the field by volumetric titration, using a digital titrator HACH (Hach Company, Loveland, CO, USA).
Samples for hydrochemical analysis were collected following IAEA guidelines (IAEA, 2007) [60]. Water was transferred into 125 mL polyethylene bottles, filtered in the field through 0.45 µm syringe filters for cation and anion analysis, and acidified with a few drops of concentrated ultra-pure nitric acid (HNO3) to preserve cations. All bottles were carefully labeled, stored in coolers during transport, and kept refrigerated until delivery via DHL to the laboratory in France. These procedures ensure sample integrity and reproducibility, consistent with standard protocols for stable isotope and hydrochemical investigations.

2.2.2. Analytical Techniques

Hydrochemical and stable isotope analyses of water samples were performed at the Hydrogeology Department (CNRS UMR 6134 SPE), University of Corsica, France. The concentration of dissolved major ions was determined using a Dionex ICS 1100 chromatograph. Ion balances ranged from –11% to +13%, within the 5% charge balance threshold recommended for quality assurance (Freeze & Cherry, 1979) [61]. These values are consistent with geological variability, as noted by Favreau (2000) [62], who highlighted the influence of bedrock types and weathering on acceptable ion balance limits in West African basins.
For δ2H and δ18O, samples were analyzed using a LGR IWA-45EP isotope analyzer, with values reported relative to VSMOW (Vienna Standard Mean Ocean Water) and precision better than 1‰ for δ2H and 0.1‰ for δ18O (Penna et al., 2010) [63]. Isotopic data were interpreted against the Local Meteoric Water Line (LMWL) derived from Bobo-Dioulasso precipitation data and the Global Meteoric Water Line (δ2H = 8δ18O + 10; [64]. Deuterium excess (d-excess = δ2H − 8 × δ18O) was used to assess evaporation and secondary processes (Kumari et al., 2021; Dansgaard, 1964) [26,65].
Hydrochemical facies were represented using a Piper diagram generated with DIA-GRAMMES software (Roland Simler, version 31-10-2014, Université d’Avignon) [66], enabling classification of the main water types within the study area.

2.2.3. Spatial Analysis

Spatial distributions of δ2H, δ18O, and d-excess in groundwater were mapped using the Inverse Distance Weighted (IDW) interpolation method in ArcGIS 10.8. IDW estimates values at unsampled locations based on neighboring measurements, with closer points exerting greater influence. This method allowed the identification of spatial patterns and trends in isotopic composition across the Kou Basin.

3. Results and Discussion

3.1. Groundwater Depth and Direction of Flows

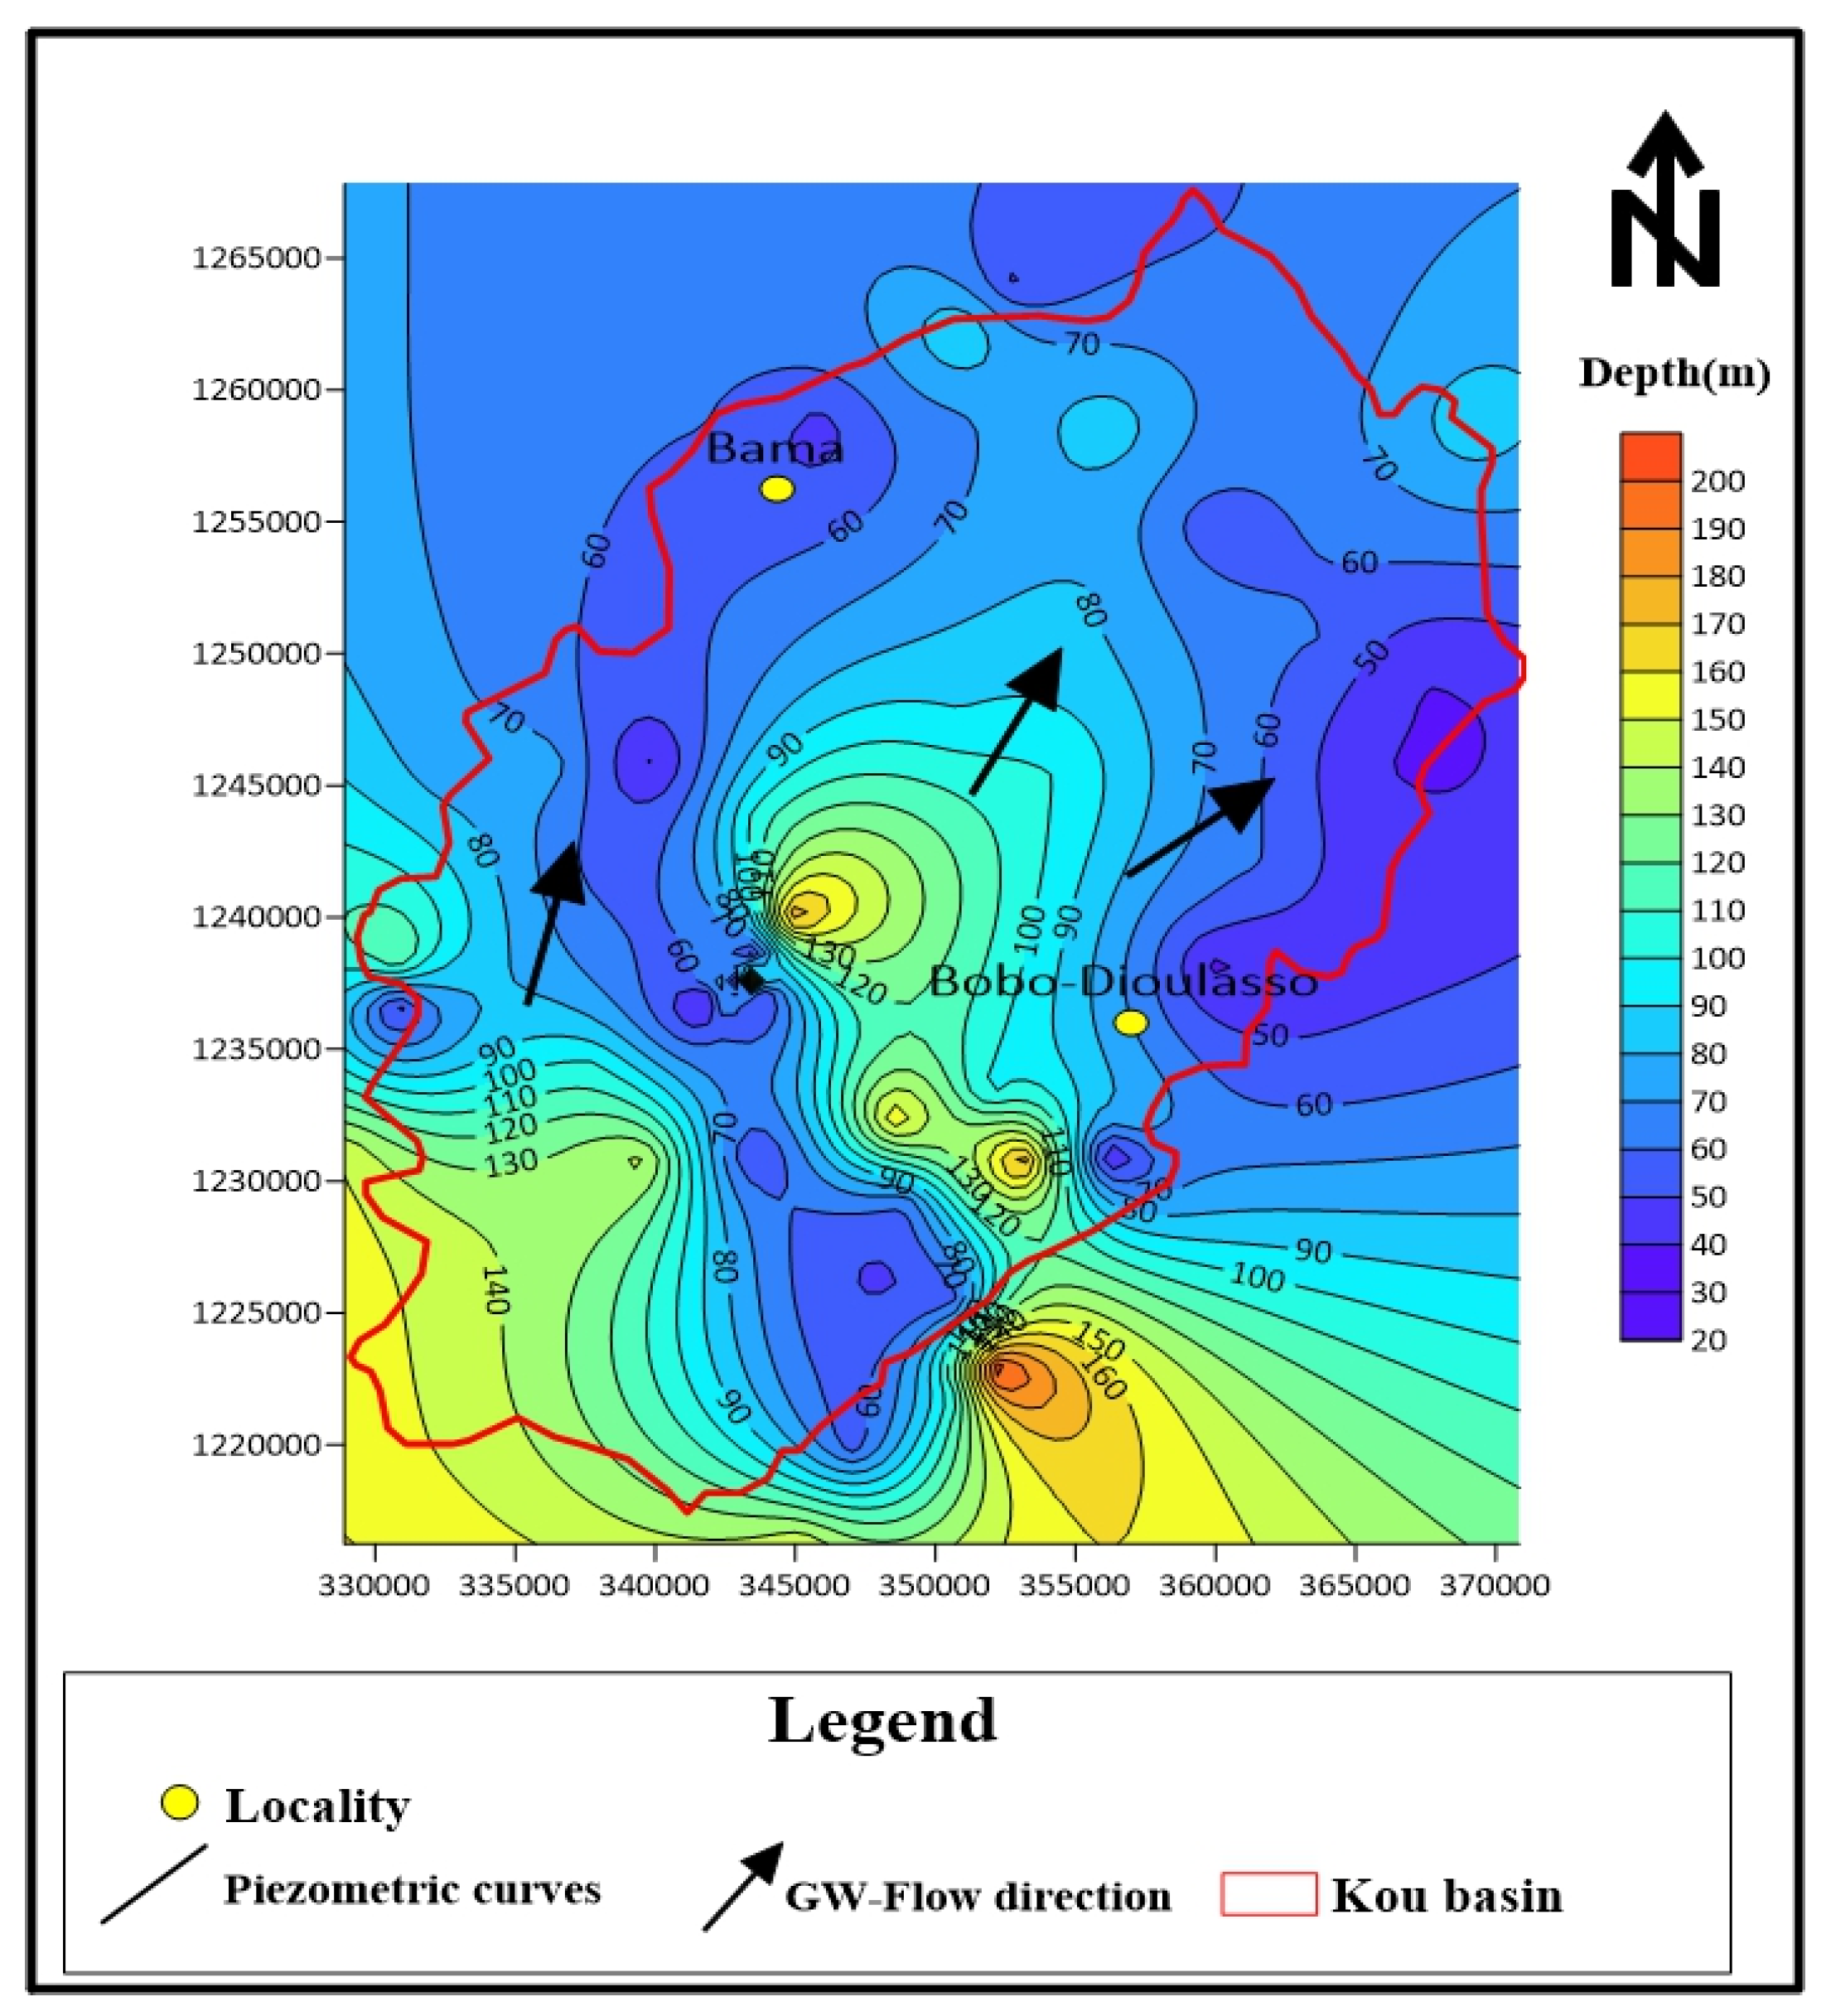
The groundwater flow direction has been determined based on depth to groundwater observations collected from different boreholes and wells collected in the Kou basin area. Golden Surfer version 28 was used to translate the XYZ data into a clear surface and contour map, supporting a better understanding of the overall flow direction across the study area. Groundwater in the Kou basin varies ranges from 20 to 200 m (see Figure 5). The map shows that major groundwater flow direction is from south to north of the basin. Tirogo et al. [16] affirm that the Kou catchment is located upstream of a large sedimentary basin, and the groundwater flow is from southwest to northeast (SW–NE) between 499 m and 286 m.a.s.l., with a gradient of 3‰.

3.2. Hydrochemical Characteristics

3.2.1. Descriptive Statistics

This study focuses on freshwater resources, specifically groundwater (boreholes and wells) and surface water within the Kou basin. Descriptive statistics of the measured parameters are summarized in Table 1. Groundwater samples (GW) exhibit pH values ranging from 3.2 to 7.5, while surface water samples (SW) range from 5.4 to 7.1. Electrical conductivity (EC) in GW varies between 8 and 1080 µS/cm, compared to a narrower range of 55.2–83.6 µS/cm in SW. Total dissolved solids (TDS) in GW range from 8 to 1080 mg/L, with an average of 178.74 mg/L, while in SW values extend from 55 to 1616 mg/L. In situ turbidity (Turb) and dissolved oxygen (DO) in GW vary from 0.01 to 126.1 NTU and 3.24 to 6.6 mg/L, with averages of 6.7 NTU and 4.8 mg/L, respectively. For SW, Turb ranges from 2.1 to 843.9 NTU (average 217.4 NTU), while DO values range from 2.6 to 6.88 mg/L (average 5.3 mg/L).
Furthermore, by analyzing results illustrated in Table 2, the relationship between the average concentrations of GW anions was sorted as HCO3 > NO3 > Cl > SO42−. The concentration of HCO3 range from 0.0 mg/L to 309.4 mg/L, with an average concentration of 66.8 mg/L. We observe that the NO3 level ranges between 0.1 mg/L to 222.9 mg/L, with an average concentration of 19.1 mg/L. The concentration of Cl ranges from 0.1 mg/L to 113.0 mg/L, with an average concentration of 6.8 mg/L. The concentration of SO42− ranges from 0.1 mg/L to 11.0 mg/L, with an average concentration of 1.2 mg/L. For the cations, the relationship of the average concentrations in groundwater was Ca2+ > Na+ > Mg2+ > K+. Ca2+ and Na+ are dominant, and their concentrations range from 0.1 mg/L to 65.5 mg/L and 0.8 mg/L to 87.7 mg/L, respectively, with average values of 12.8 mg/L and 8.5 mg/L. For other chemical elements, such as F, Li+, Br, and NO2, the values obtained during the analysis are below the permissible limits set by the World Health Organization [67] drinking water standards.
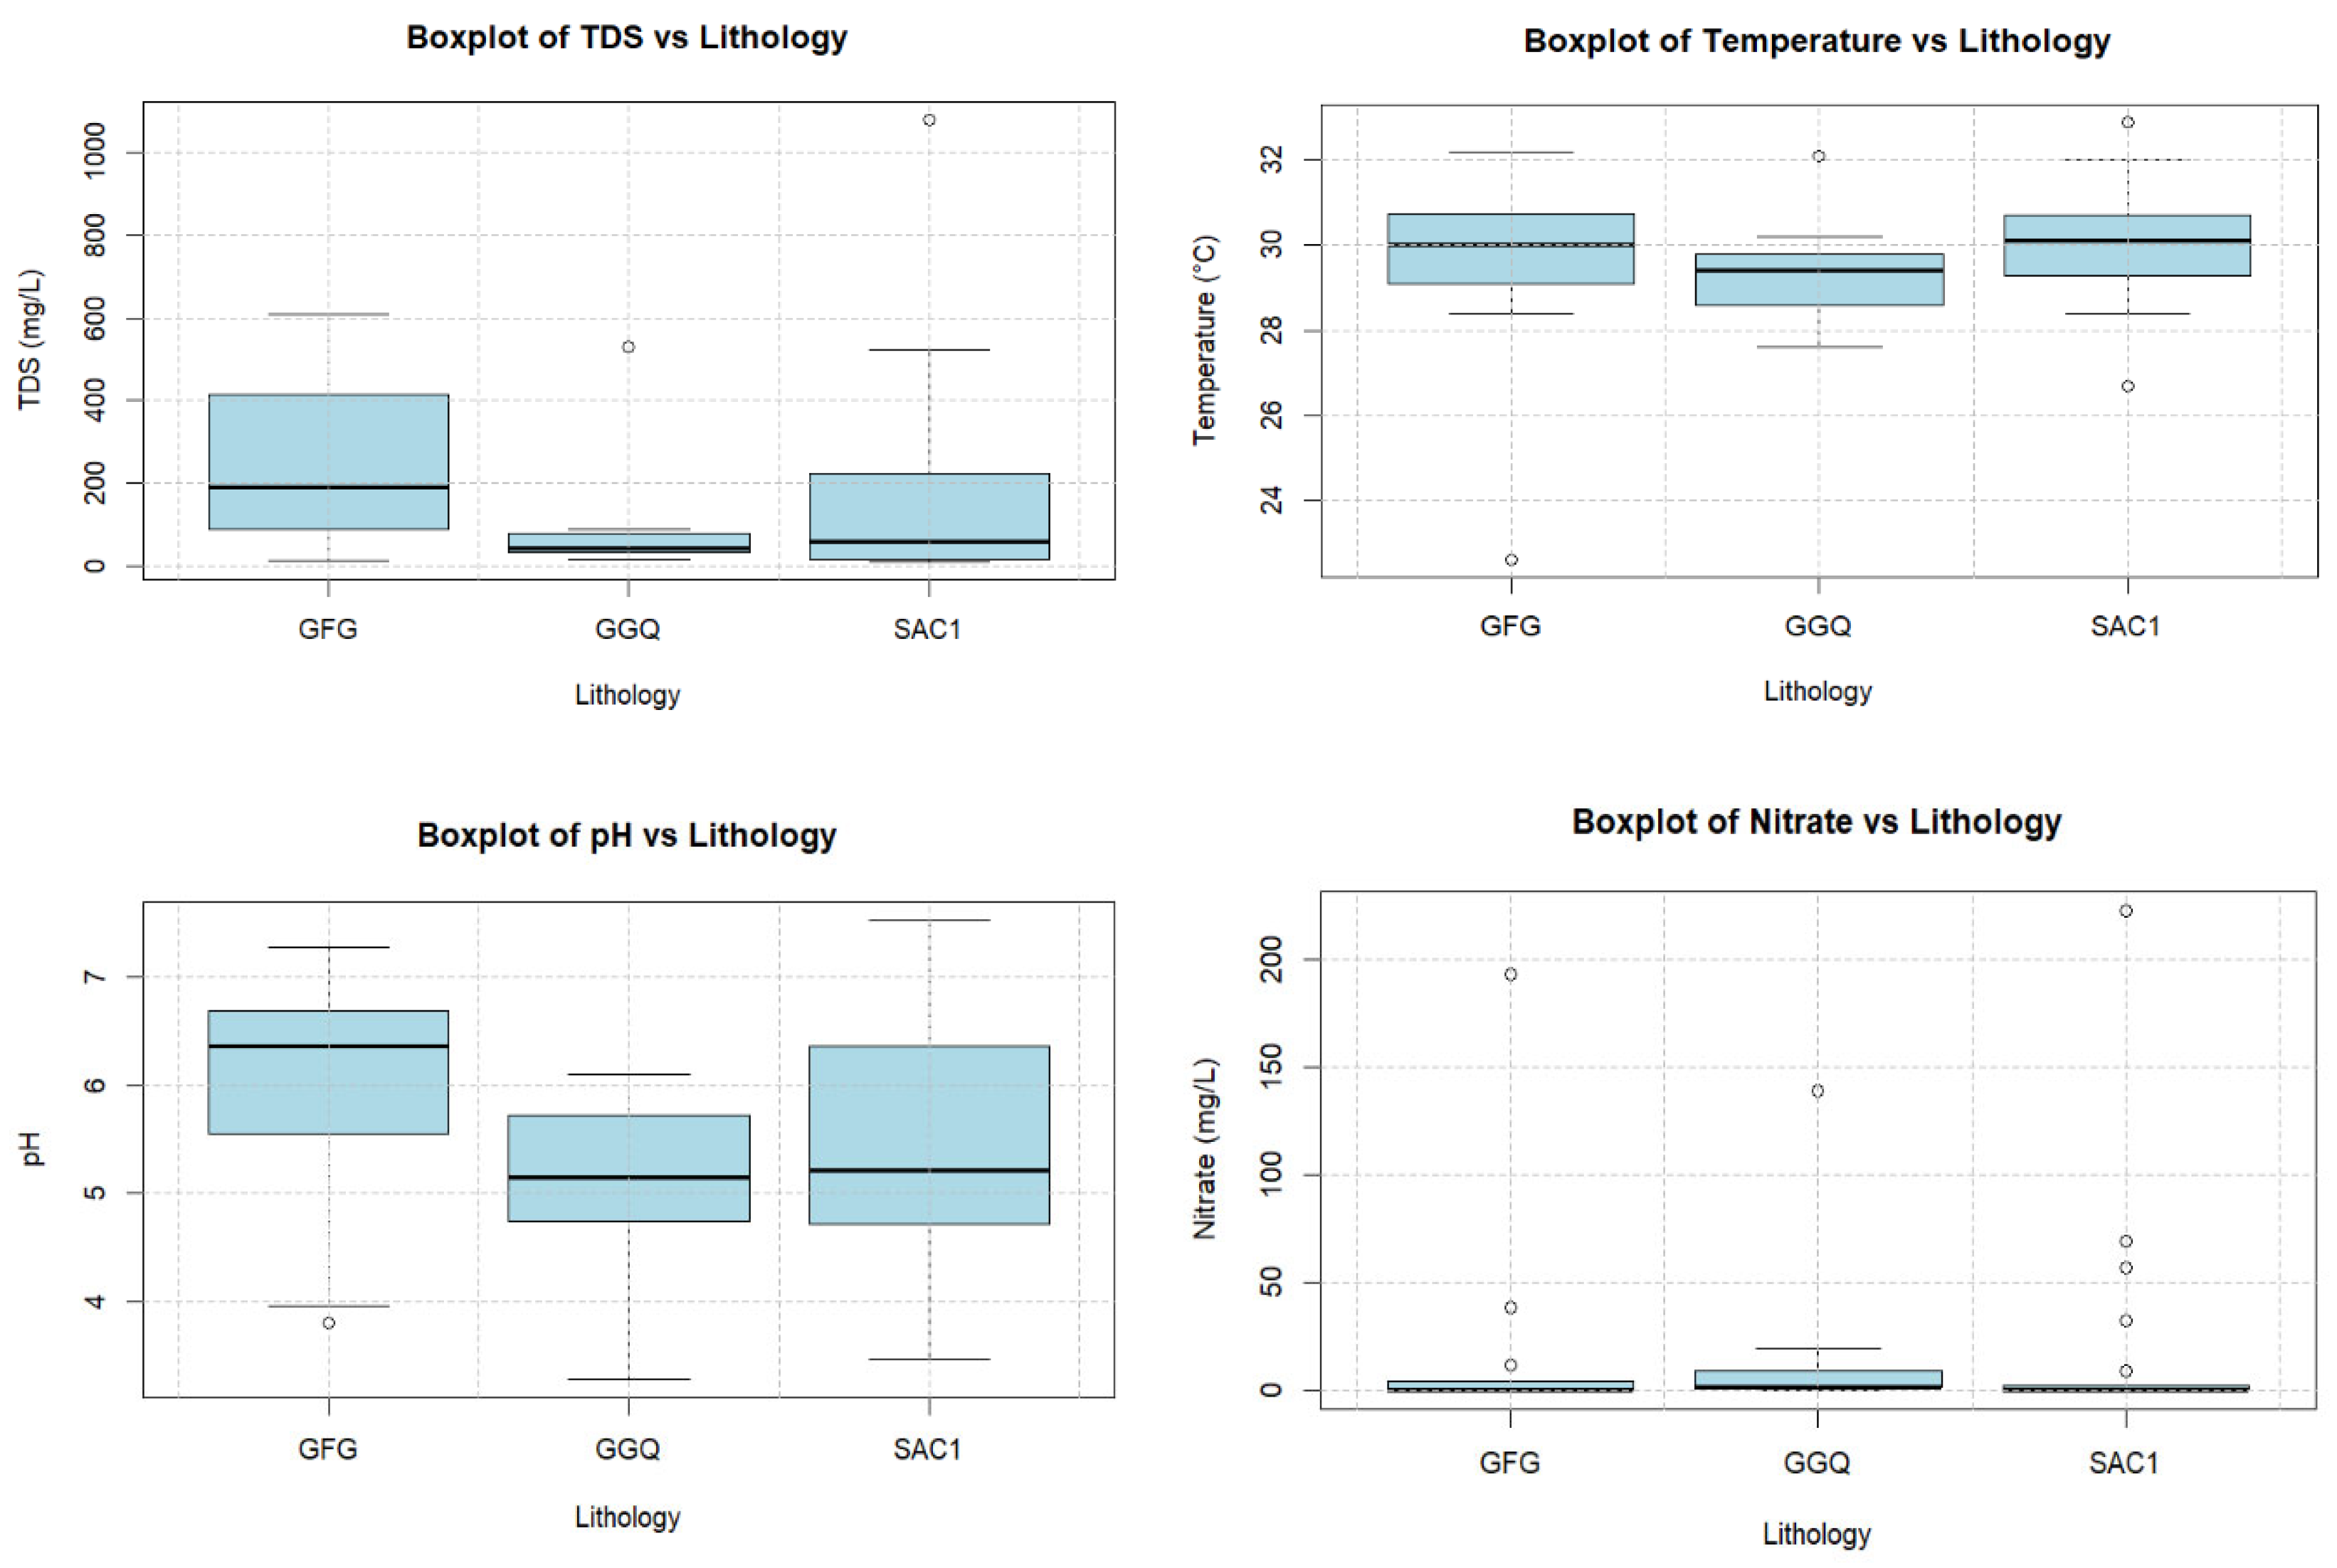
Figure 6 displays boxplots illustrating four physical–chemical characteristics (TDS, pH, T and NO3) concerning various lithologies of aquifers in the Kou basin. High concentrations of NO3 are observed in GGQ aquifer lithology in the basin. Huneau et al. [14] affirm that in the GFG, nitrate levels can reach concentrations up to 25 mg/L. These concentrations typically indicate poor conditions in the vicinity of the borehole rather than general contamination at the aquifer level. Additionally, the pH, TDS, and temperature in this particular aquifer (GGQ) are lower compared to the other two formations (GFQ and SAC1).
According to Huneau et al. [14], in their study, most samples originating from carbonated lithologies exhibited circumneutral pH values (SAC1, GFG), whereas waters from the most siliceous levels showed a clear tendency toward more acidic pH (GGQ).
Huneau et al. [14] reported that groundwater in the GGQ region generally exhibits the lowest temperatures, typically between 28 and 30 °C, a range that likely indicates its deep source.
In the study area covered by the RAF/7/011 project from IAEA in [68], they observed that pH values generally fell within the normal range of 5 to 7.5 for all formations. However, certain points exhibited acidic pH levels (<4.5), particularly in the sandstone and lemon facies formations. Following Huneau et al. [14], the pH values of most samples from carbonates were close to neutral. Conversely, the pH of water at the most siliceous levels tended to be more acidic.

3.2.2. Correlation Matrix Analysis

Pearson’s correlation analysis carried out in the Kou basin highlights the relationships between various water quality parameters. Table 3 presents the correlation matrix for all hydrochemical variables measured in groundwater samples. The results reveal both positive and negative correlations. Given the sample size of n = 43, correlation coefficients (R) are considered statistically significant at the 1% level when they exceed 0.39. Several important hydrochemical correlations (R > 0.39), indicated in Table 3, stand out.
A moderate positive correlation is observed between calcium (Ca2+) and sulfate (SO42−) ions (R = 0.54). Kouanda [8] previously emphasized the predominance of Ca2+ over SO42− in the area, attributing it primarily to the dissolution of evaporite minerals such as gypsum and anhydrite as a secondary process. Additionally, Kouanda pointed out that other geochemical reactions contribute significantly to the Ca2+ concentrations in the region’s aquifers. The main source of calcium, according to this author, is the dissolution of carbonate minerals including dolomite, calcite, and aragonite. These findings are consistent with our observations and align with the dominance of calcic-magnesium bicarbonate (Ca-Mg-HCO3) facies, particularly in the Infra-Cambrian basin portion of Burkina Faso. Similar conclusions have been drawn from studies such as [33], who investigated coastal aquifers in India and linked positive Ca2+–SO42− correlations to anhydrite and gypsum dissolution.
A strong correlation between chloride (Cl) and nitrate (NO3) ions (R = 0.86) points to possible influences from fertilizer leaching and irrigation return flows, which may pose long-term risks for groundwater quality. Serge et al. [69] and Kouanda [8] have both noted that such strong Cl–NO3 correlations often indicate an anthropogenic source of chlorides. This pattern also applies to potassium (K+), which exhibits a positive correlation with nitrate (R = 0.61). Given the agricultural nature of the study area particularly in rural zones such as the commune of Bama, where heavy use of fertilizers like urea and NPK is common [70,71] these correlations help explain the development of chloride facies observed in the groundwater (see Figure 7).
Other elements, such as Ca2+ and Mg2+ (R = 0.71), Mg2+ and HCO3 (R = 0.89), and Mg2+ and HCO3 (R = 0.75), exhibit a good and acceptable positive correlation. According to Kouanda [8], these ions share a common origin with minerals Ca2+, Mg2+, and HCO3, resulting from the dissolution of carbonate minerals, primarily dolomite (CaMg (CO3)2).
The correlation indicates an acceptable relationship between SO42− and Cl (R = 0.58) and between SO42− and Na+ (R = 0.58). The presence of chloride and sulfate in groundwater samples in Sahelian Region indicated the existence of an advanced stage of water-rock interaction through the dissolution of sulfate minerals (gypsum and anhydrite) [72].

3.2.3. Groundwater Types Classification Based on the Lithology

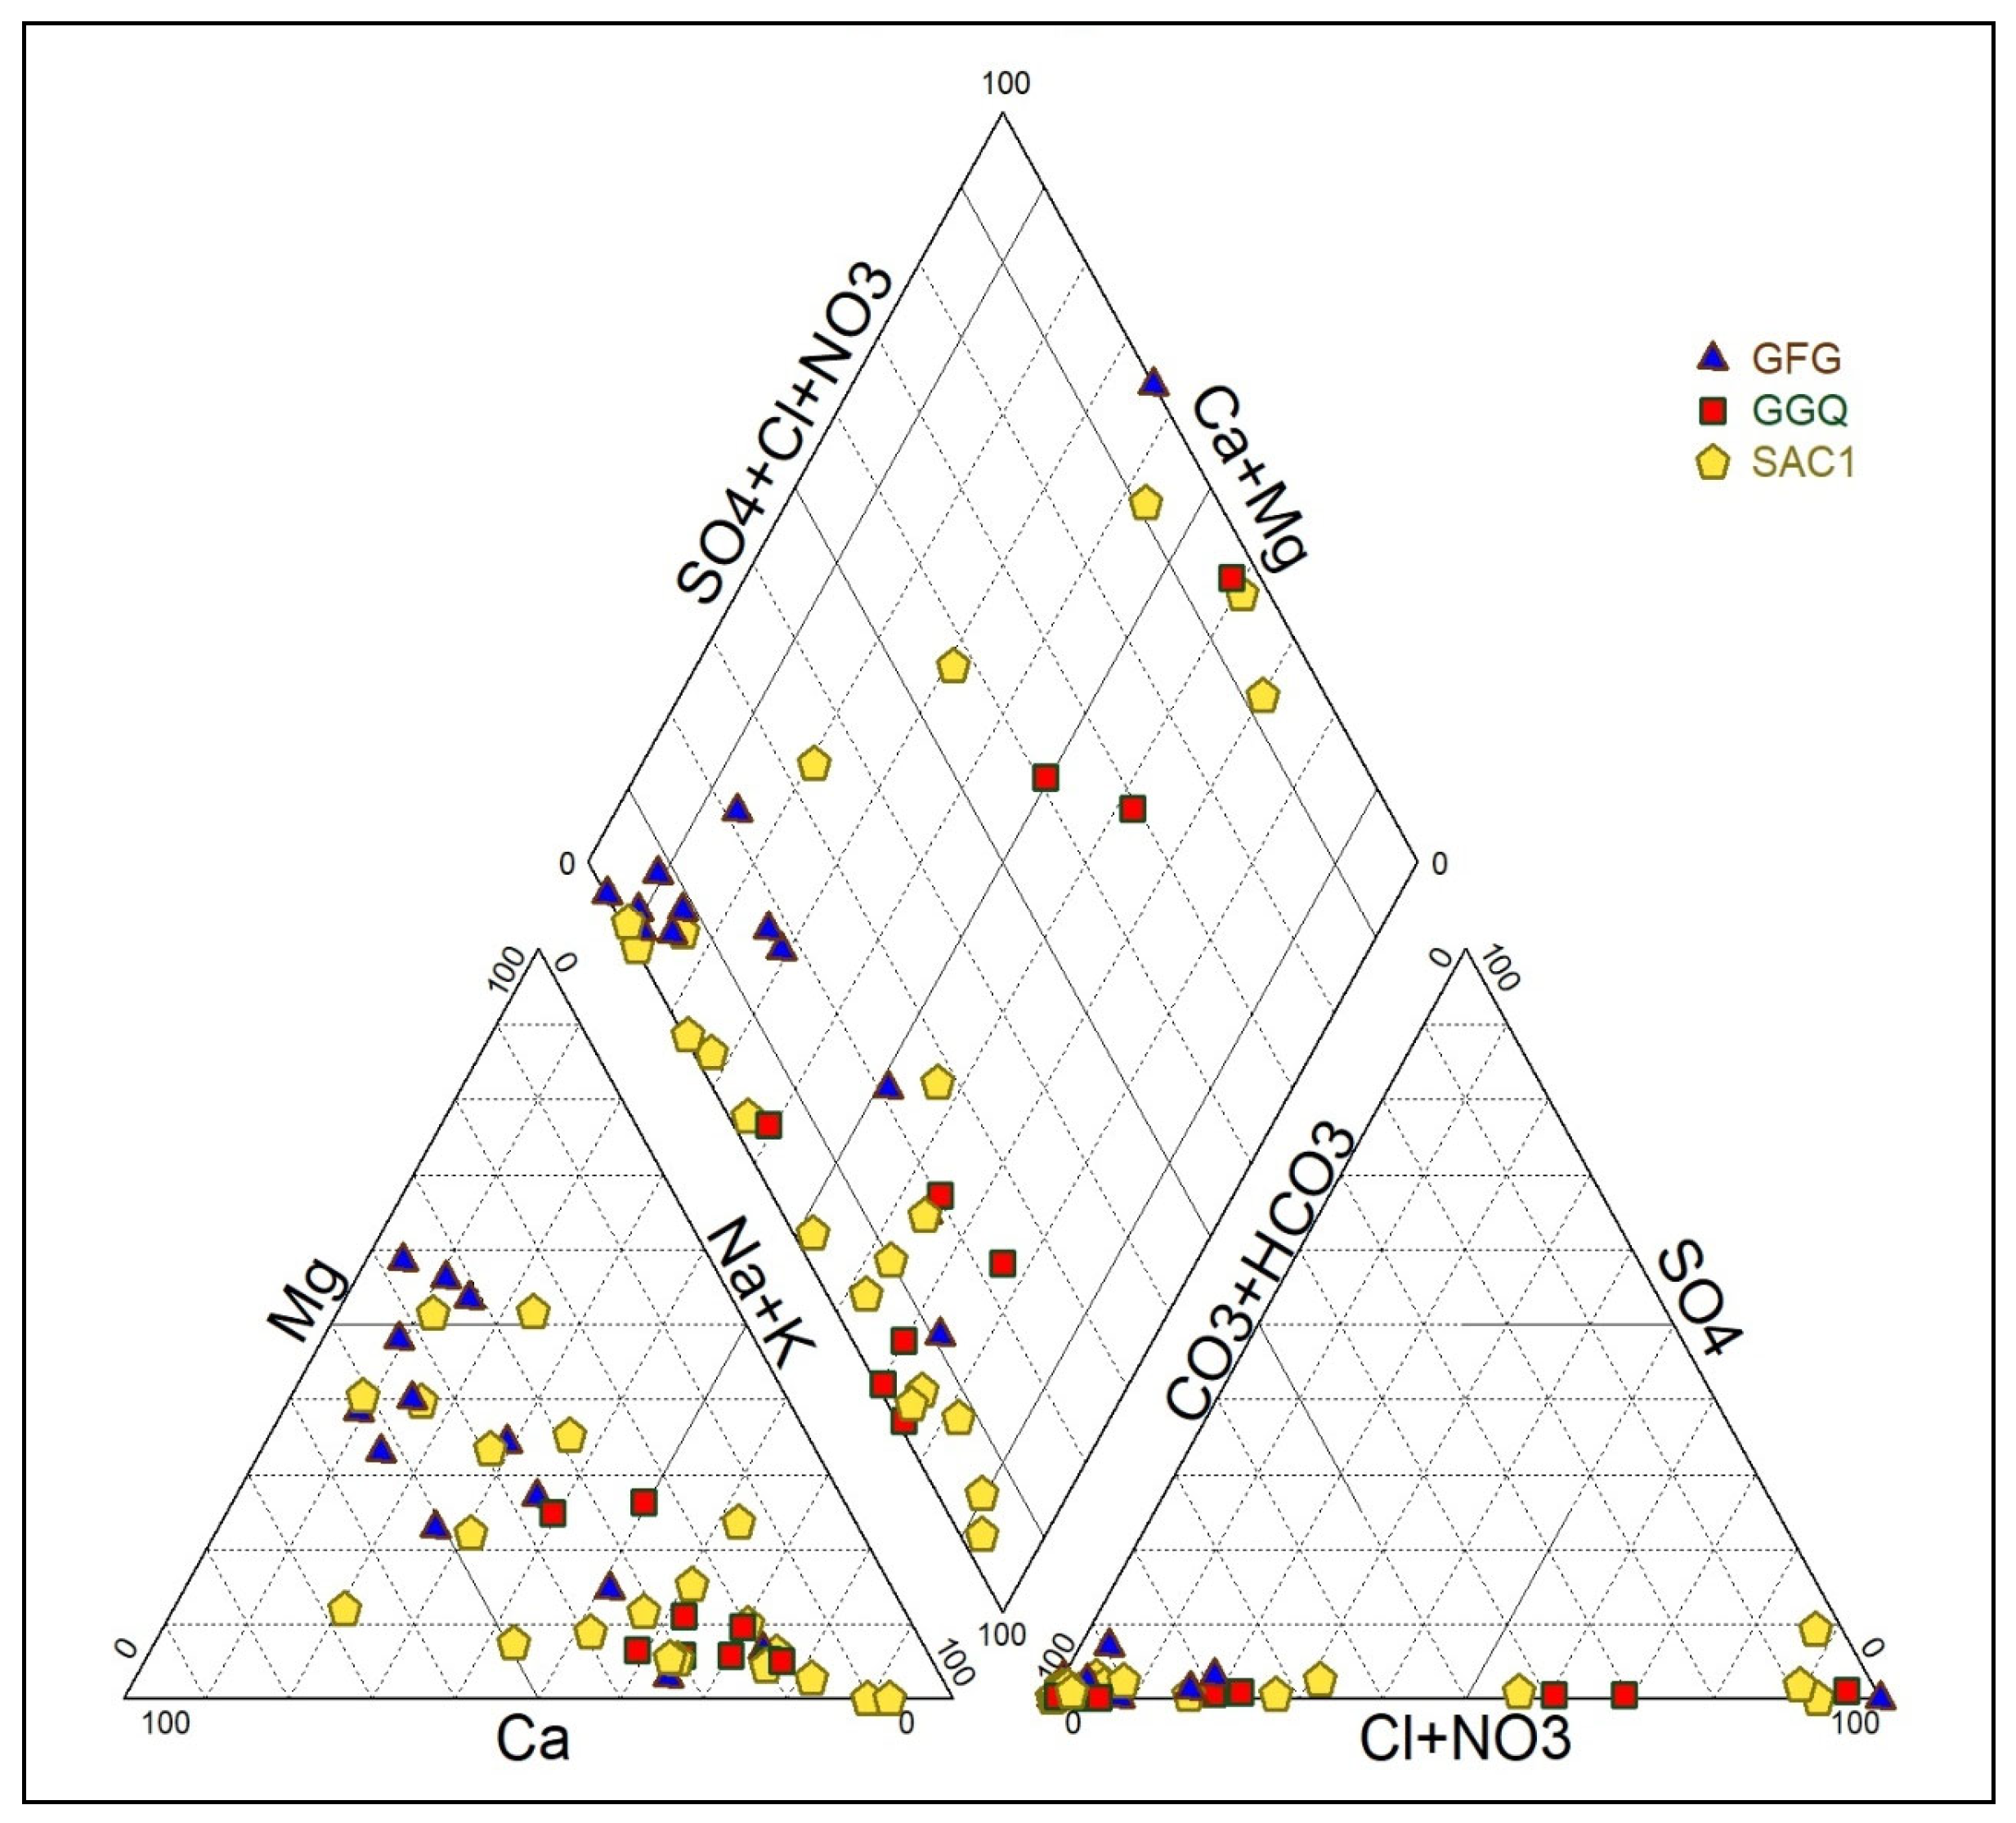
Figure 7’s Piper diagram displays the diversity of groundwater types corresponding to different litho-stratigraphic units within the study area. Two dominant water types emerge from the plot: Ca-HCO3 and Na-HCO3. A previous regional investigation by [14] also identified these water types, noting a transition from Ca–Mg–HCO3 to Na–K–HCO3 compositions. According to Huneau and Travi [73], such water signatures likely reflect intensified interactions between groundwater and clay minerals, driven by processes such as isomorphic substitution, cation exchange, and silicate weathering. Moreover, Huneau et al. [14] suggested that these transformations relate to groundwater residence time within the aquifer, serving as an indirect measure of the extent of water–rock interactions.
In the present study, the appearance of a secondary water type characterized by HCO3–Cl–NO3–SO4 composition points to anthropogenic impacts on groundwater quality, as also noted by [14]. They further explained that elevated levels of nitrate, sulfate, and chloride contribute to the progression from the original Ca–Mg–HCO3 facies toward a Ca–Mg–SO4–Cl–NO3 water type. Additionally, our results are consistent with those obtained by [8] regarding the sedimentary aquifer of the Taoudeni Basin in Burkina Faso.

3.3. Isotopic Characterization of Surface Water and Groundwater

3.3.1. Isotope Signature
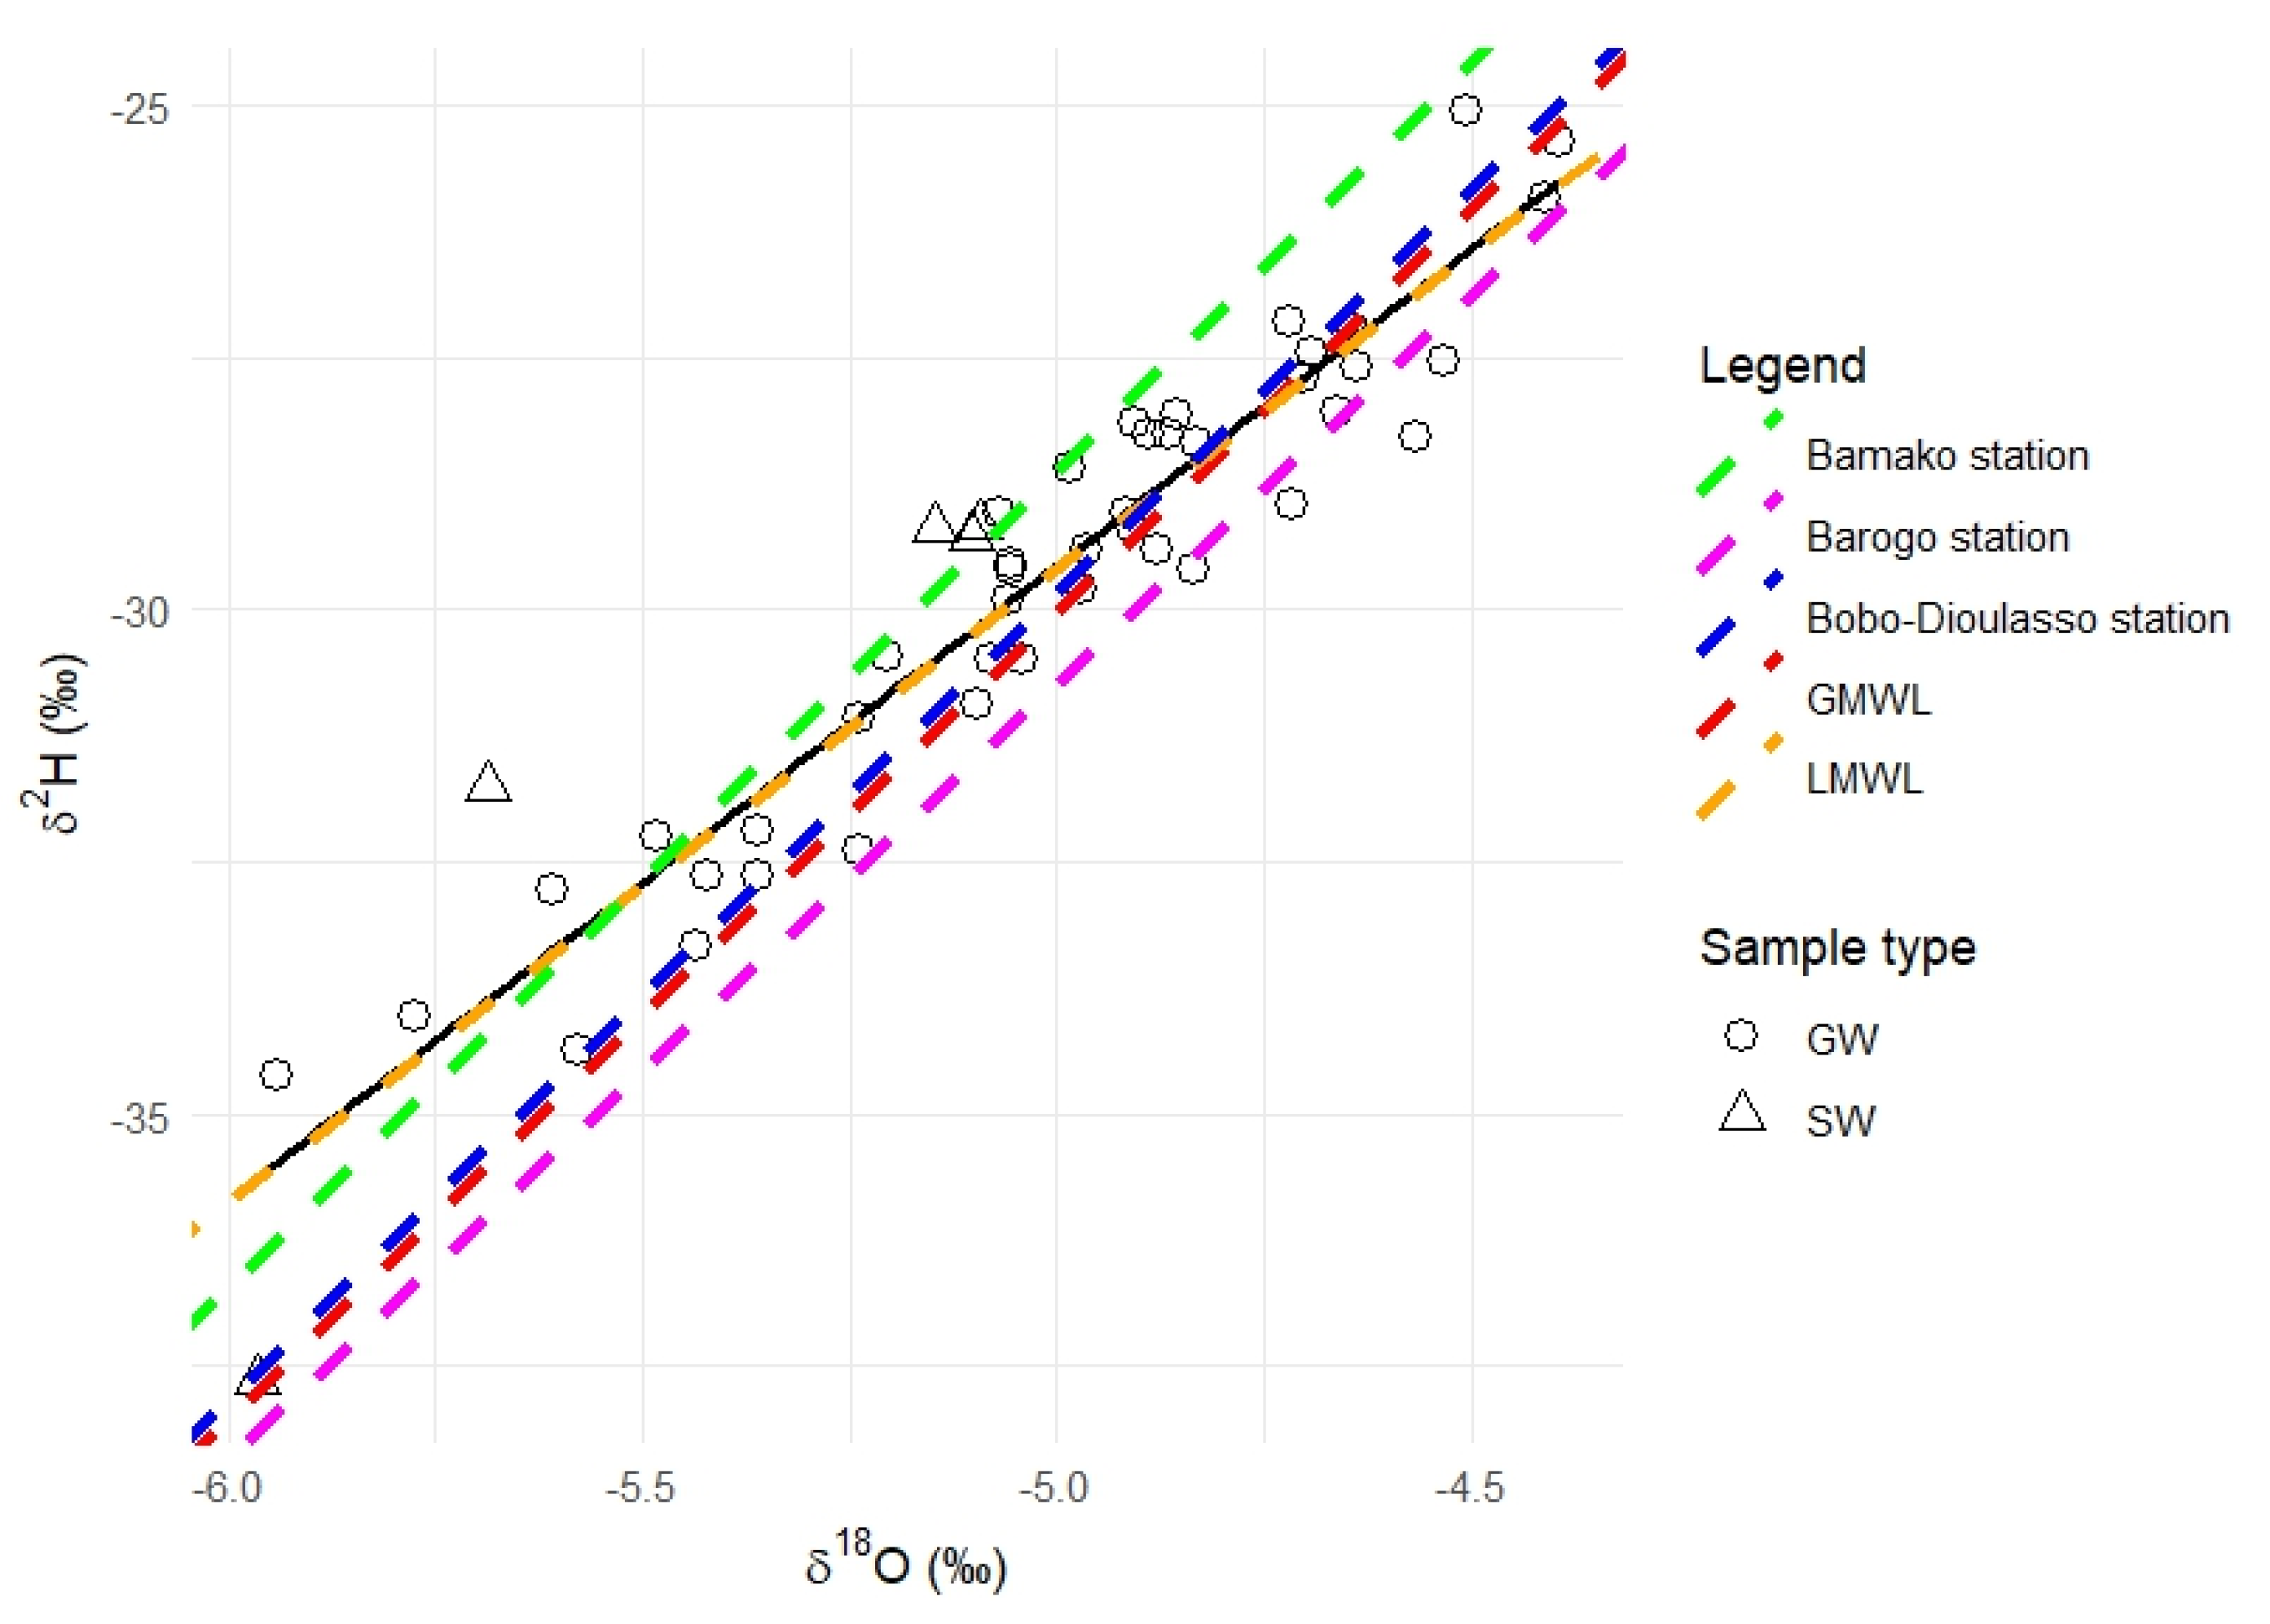
Table 4 presents the isotopic composition data for groundwater (GW) and surface water (SW) in the Kou basin. Analysis of stable isotope values in groundwater shows δ18O ranging from −5.93‰ to −4.39‰, with an average value of −5.00‰, while δ2H varies between −34.62‰ and −25.05‰, averaging −29.65‰. The average d-excess in groundwater is 10.35‰. For surface water, δ18O values range from −5.96‰ to −5.09‰, with a mean of −5.93‰, and δ2H spans from −37.65‰ to −29.15‰, averaging −31.4‰. The mean d-excess in surface water is 11.5‰. Additional statistical summaries for δ2H and δ18O across different water sample types are provided in Table 1. Variations in isotopic composition indicate different hydrological processes influencing the water sources [74].
As noted by Serge et al. [69], shallow groundwater chemistry is often largely influenced by anthropogenic factors [75,76]. The aquifers’ characteristics allow surface contaminants to infiltrate through permeable zones, with one key process involving residence time that facilitates chemical interactions between groundwater and surrounding rock formations [75,77,78]. Another process appears linked to biological activity, where plant metabolism and organic matter decomposition release carbon dioxide. When dissolved in water, this CO2 generates bicarbonate ions [69]. Dakoure [11] similarly emphasized this mechanism within the sedimentary aquifers of Western Burkina Faso.
Carbon-14 dating conducted by [14] in the Taoudeni sedimentary basin points to ongoing recharge of the system over long-time scales, despite climatic fluctuations in the Sahel region that have impacted infiltration and recharge dynamics. Additionally, Trabelsi et al. [72] suggest that the depleted stable isotope signatures found in geochemically evolved groundwater of the Sahel are indicative of fossil waters recharged during cooler and more humid periods predating the Last Glacial Maximum (LGM).
In a study from South Africa, Mahlangu et al. [79] identified processes influencing isotopic variations including rainfall recharge, evaporation from shallow groundwater and surface waters, and mixing between these water bodies. The IAEA [68] report further indicates that current recharge is minimal or absent across most of the aquifer, with recent replenishment detected only at limited, localized sites.
The isotopic values obtained here are consistent with other regional research. For instance, Trabelsi et al. [72] recorded δ18O values from −5.2‰ to −2.2‰ and δ2H values from −37.7‰ to −18.8‰ throughout the aquifers [79]. Similarly, Huneau et al. [14] documented δ18O between −7.2‰ and −3.1‰ and δ2H ranging from −48.8‰ to −20.3‰ in the same area.
For interpreting stable isotope data, we derived the local meteoric water line (LMWL) for the Bobo-Dioulasso station using precipitation records from 1987 to 2016 provided by the DEIE (Direction d’Études et d’Information sur l’Eau) in Burkina Faso, as expressed in Equation (1):
δ2H = 1.84 + 6.28δ18O
Figure 8 depicts the correlation between the δ18O and δ2H stable isotope values of the water samples, alongside the Global Meteoric Water Line (GMWL) established by [64], and the linear equations derived from three earlier studies carried out in this region:
(i)
Bobo-Dioulasso station: δ2H = 8δ18O + 10.2 [14];
(ii)
Bamako station: δ2H = 8.1δ18O + 11.9 [37];
(iii)
Barogo station: δ2H = 7.7δ18O + 7.8 [80].
Figure 8. δ2H versus δ18O for water samples from the Kou Basin. The Global Meteoric Water Line (GMWL [64]), Local Meteoric Water Line (LMWL, this study), and reference lines from Barogo [80], Bobo-Dioulasso [14], and Bamako [37] are shown for comparison.
Water 17 02756 g008
The bivariate plot in Figure 8 shows that the majority of water samples align closely with the regression line (black line in Figure 8) established by [14] for this region. The computed coefficient of determination is R2 = 0.89, indicating a strong linear relationship. The slope of the regression line, 6.28, is lower than that of both the Global Meteoric Water Line (GMWL) proposed by [64] and the Local Meteoric Water Line (LMWL) defined for Bobo-Dioulasso by [14]. The lower slope observed in Equation (iii) may reflect the effect of evaporation on raindrops prior to their infiltration into the aquifer system in the study area. In their investigation of the Taoudeni aquifer system in the Sahel, Trabelsi et al. [72] reported a local meteoric water line (LMWL) with a slope of 6.68, noting that values below 8 are indicative of isotopic fractionation and enrichment in heavier isotopes due to evaporation processes. Similarly, Taupin et al. [81] highlighted that in the Sahelian climate of West Africa, factors such as limited rainfall, elevated temperatures, and low humidity particularly at the beginning and end of the rainy season foster isotopic enrichment through evaporative effects.
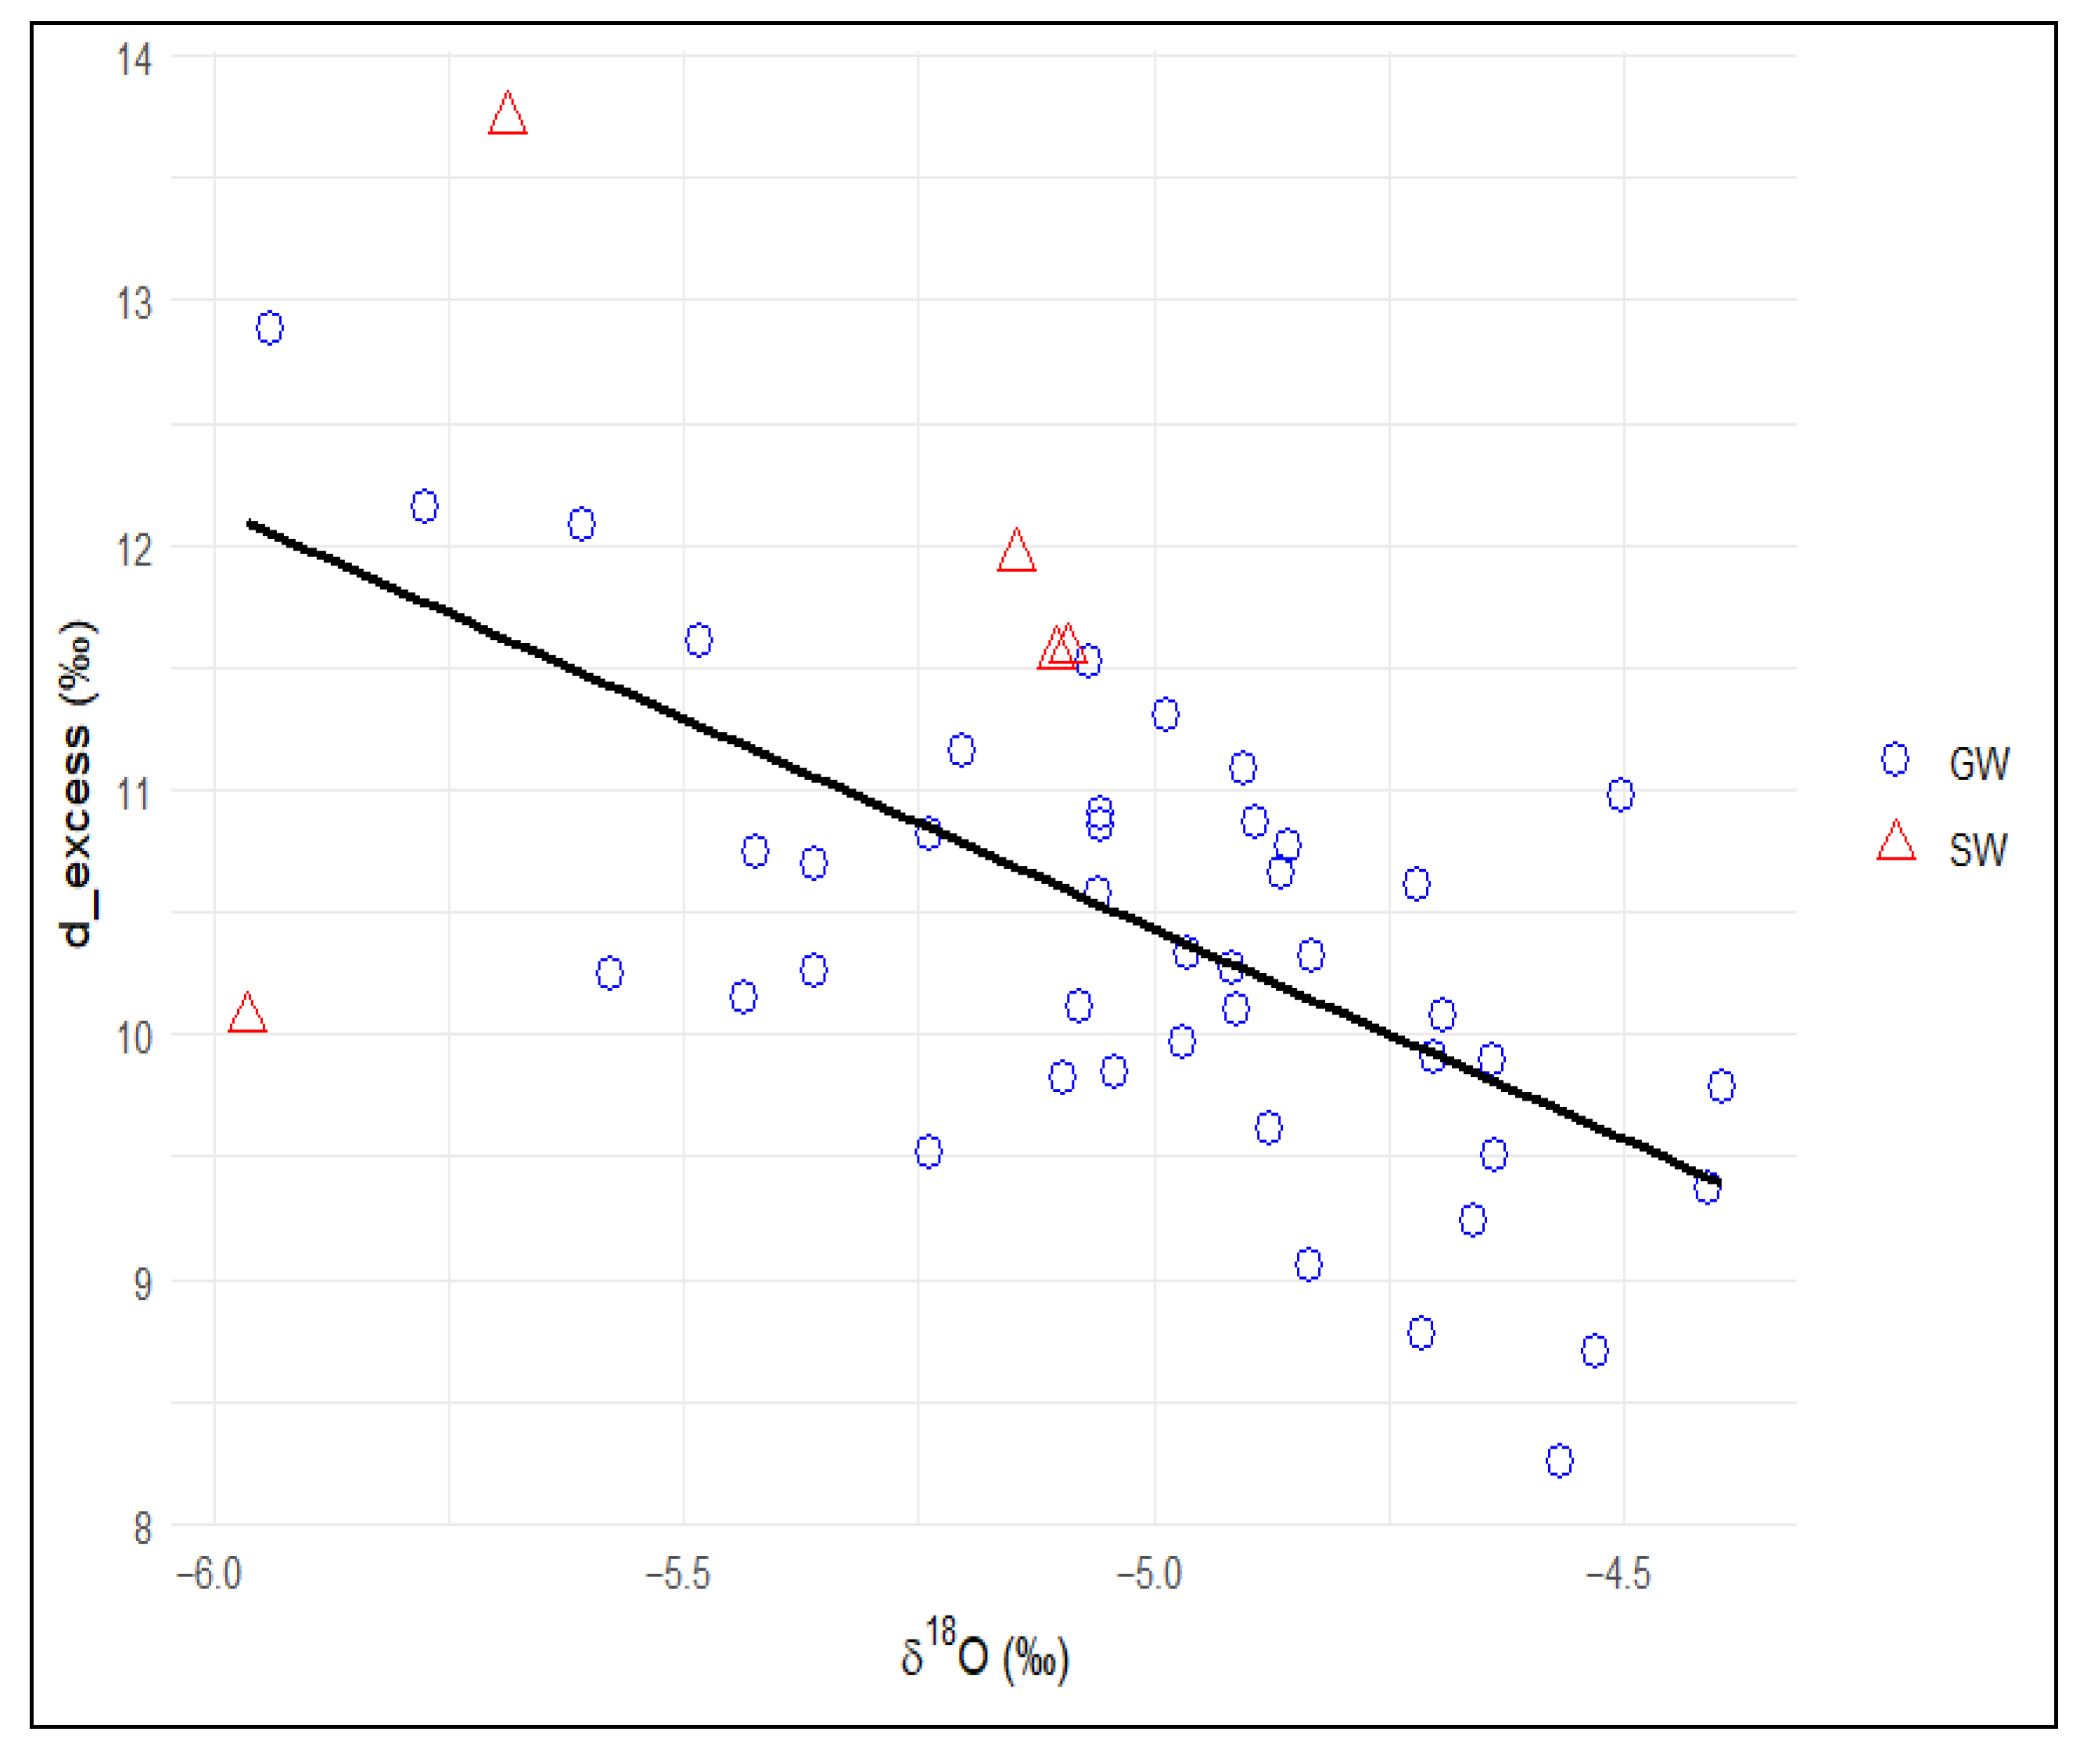
In this regional context, Huneau et al. [14] observed that groundwater isotope signatures typically fall within the range of both the regional and global meteoric water lines, suggesting minimal evaporative alteration during recharge. Supporting this idea, Song et al. [82] propose that limited isotopic variability in groundwater, compared to that of precipitation, may be explained by the selective infiltration of rainwater a phenomenon also documented in other semi-arid settings, such as the Lake Chad Basin [83]. The deuterium excess (d-excess) in our study area varies from 8.3‰ to 12.9‰, with an average of 10.4‰. Figure 9 presents the relationship between d-excess and δ18O values, with regression lines illustrating the linear trends. As noted by Mamand and Mawlood [84], typical global atmospheric water vapor exhibits a d-excess value of around 10‰ under relative humidity conditions near 85%. In the context of this study, d-excess values falling below this threshold suggest that evaporative processes may have influenced groundwater recharge. This interpretation is consistent with findings by [82] and is further supported by several studies conducted across the Sahel region [83,85,86].
In their 2017 study in Sahelian regions, the IAEA’s RAF/7/011 project estimated that 70% of water samples from crystalline formations exhibit a d-excess value exceeding 8‰, suggesting a mild evaporation process. Additionally, in the regional Sahelian conditions reported by RAF/7/011, groundwater from the ICP (folded Infracambrian) and the CTQ (Terminal Quaternary Continental) in Burkina Faso appears to be less affected by evaporation compared to Mali, possibly due to deeper wells.
In our study, 90% of groundwater samples (40 out of 43) display a d-excess greater than 8‰, with 28 out of 43 samples showing a d-excess higher than 10‰. This indicates that other factors or processes may influence the isotopic composition of groundwater samples.
It is important to emphasize, as noted by [14], that the Sahel region has undergone several climatic fluctuations, which have significantly influenced groundwater infiltration and recharge dynamics [87].

3.3.2. Spatial Pattern of δ2H and δ18O in Groundwater

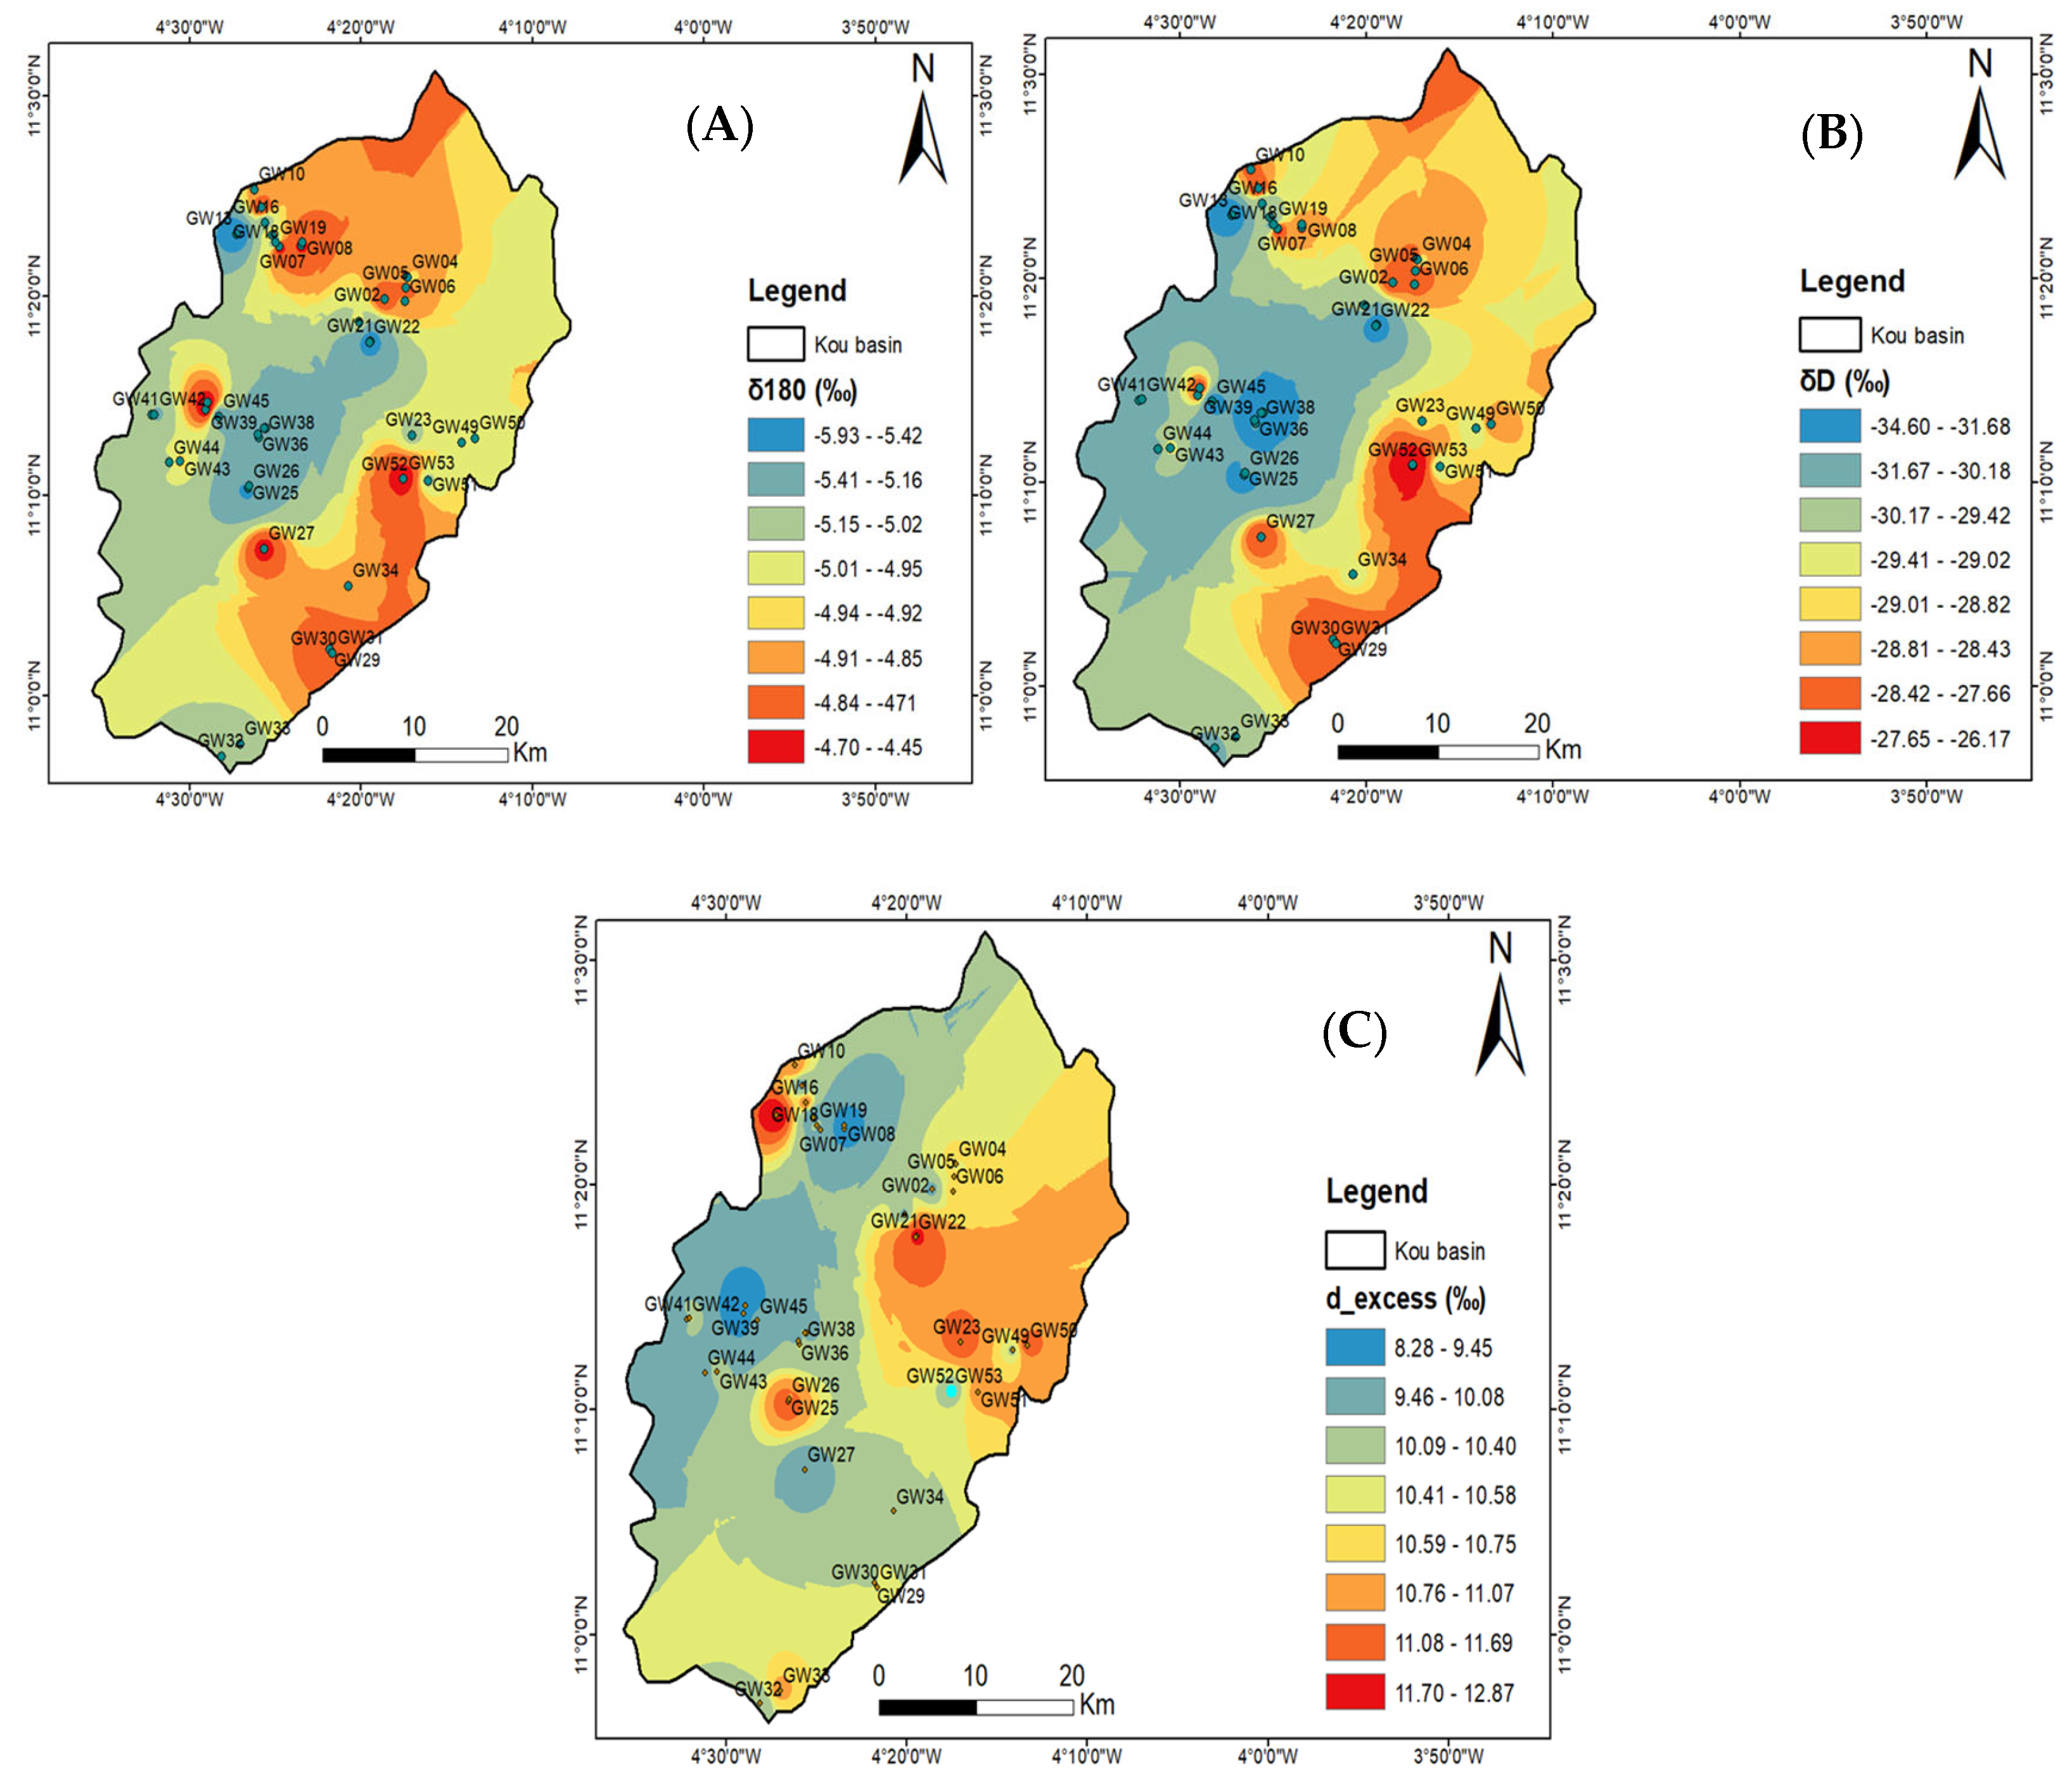
The isotopic values of δ2H, δ18O, and d-excess in groundwater were used as geospatial inputs to generate distribution maps across the Kou basin. As illustrated in Figure 10A, the spatial distribution of δ18O shows higher concentrations ranging from −5.01‰ to −4.45‰, predominantly in the southeastern and northern parts of the basin. Notably, steep isotopic gradients are observed over short distances between sampling points such as GW27 and GW25; GW52/GW53 and GW23; GW42 and GW45; as well as GW21/GW22 and GW02. These abrupt variations suggest the possible presence of impermeable geological barriers or structural discontinuities influencing groundwater flow. Sampling points GW25 and GW27 are associated with the GFG aquifer at a depth of 80 m and the SAC1 aquifer at 66 m, respectively, as presented in Table 1. A notable difference in isotopic composition over a short distance between these points may reflect a hydrogeological barrier. A comparable situation was reported by [33] in their study in India, where combined hydrochemical and isotopic analyses (δ18O and δ2H) revealed sharp gradients between nearby sampling locations. This was interpreted as evidence of a low-permeability boundary that limits horizontal groundwater flow. Furthermore, isotopically depleted groundwater samples were considered indicative of recharge directly from rainfall. While conducting field measurements, we observed that GW52 is situated in a family courtyard, surrounded by numerous septic tanks close to the borehole. Additionally, for GW53, we noted the presence of septic tanks in the courtyard, approximately 15 m from the well. GW42 is another well. During the campaign, an observation revealed the presence of animal waste and human droppings in the surrounding environment around the well. In these wells, the δ18O values are elevated, as indicated by the red color in Figure 10A. According to IAEA [68], the wells in the studied area are estimated to be shallow, ranging between 25 and 40 m. However, the study reveals significant variability in well depths within the two formations of GFG and SAC1, measuring 80 and 90 m, respectively.
Similar patterns were identified in the spatial distribution of deuterium (δ2H) values across the Kou basin, as illustrated in Figure 10B. Mamand and Mawlood [84] point out that variations in groundwater temperature, linked to different aquifer systems, can influence the distribution of stable isotopes. Elevated groundwater temperatures are often associated with subsurface processes such as water–rock interactions, which may alter the isotopic composition.
As shown in Figure 10C, for groundwater at the Kou basin, the deuterium excess ranged between 8.28‰ and 12.87‰.

3.3.3. Identification of Groundwater Mineralisation

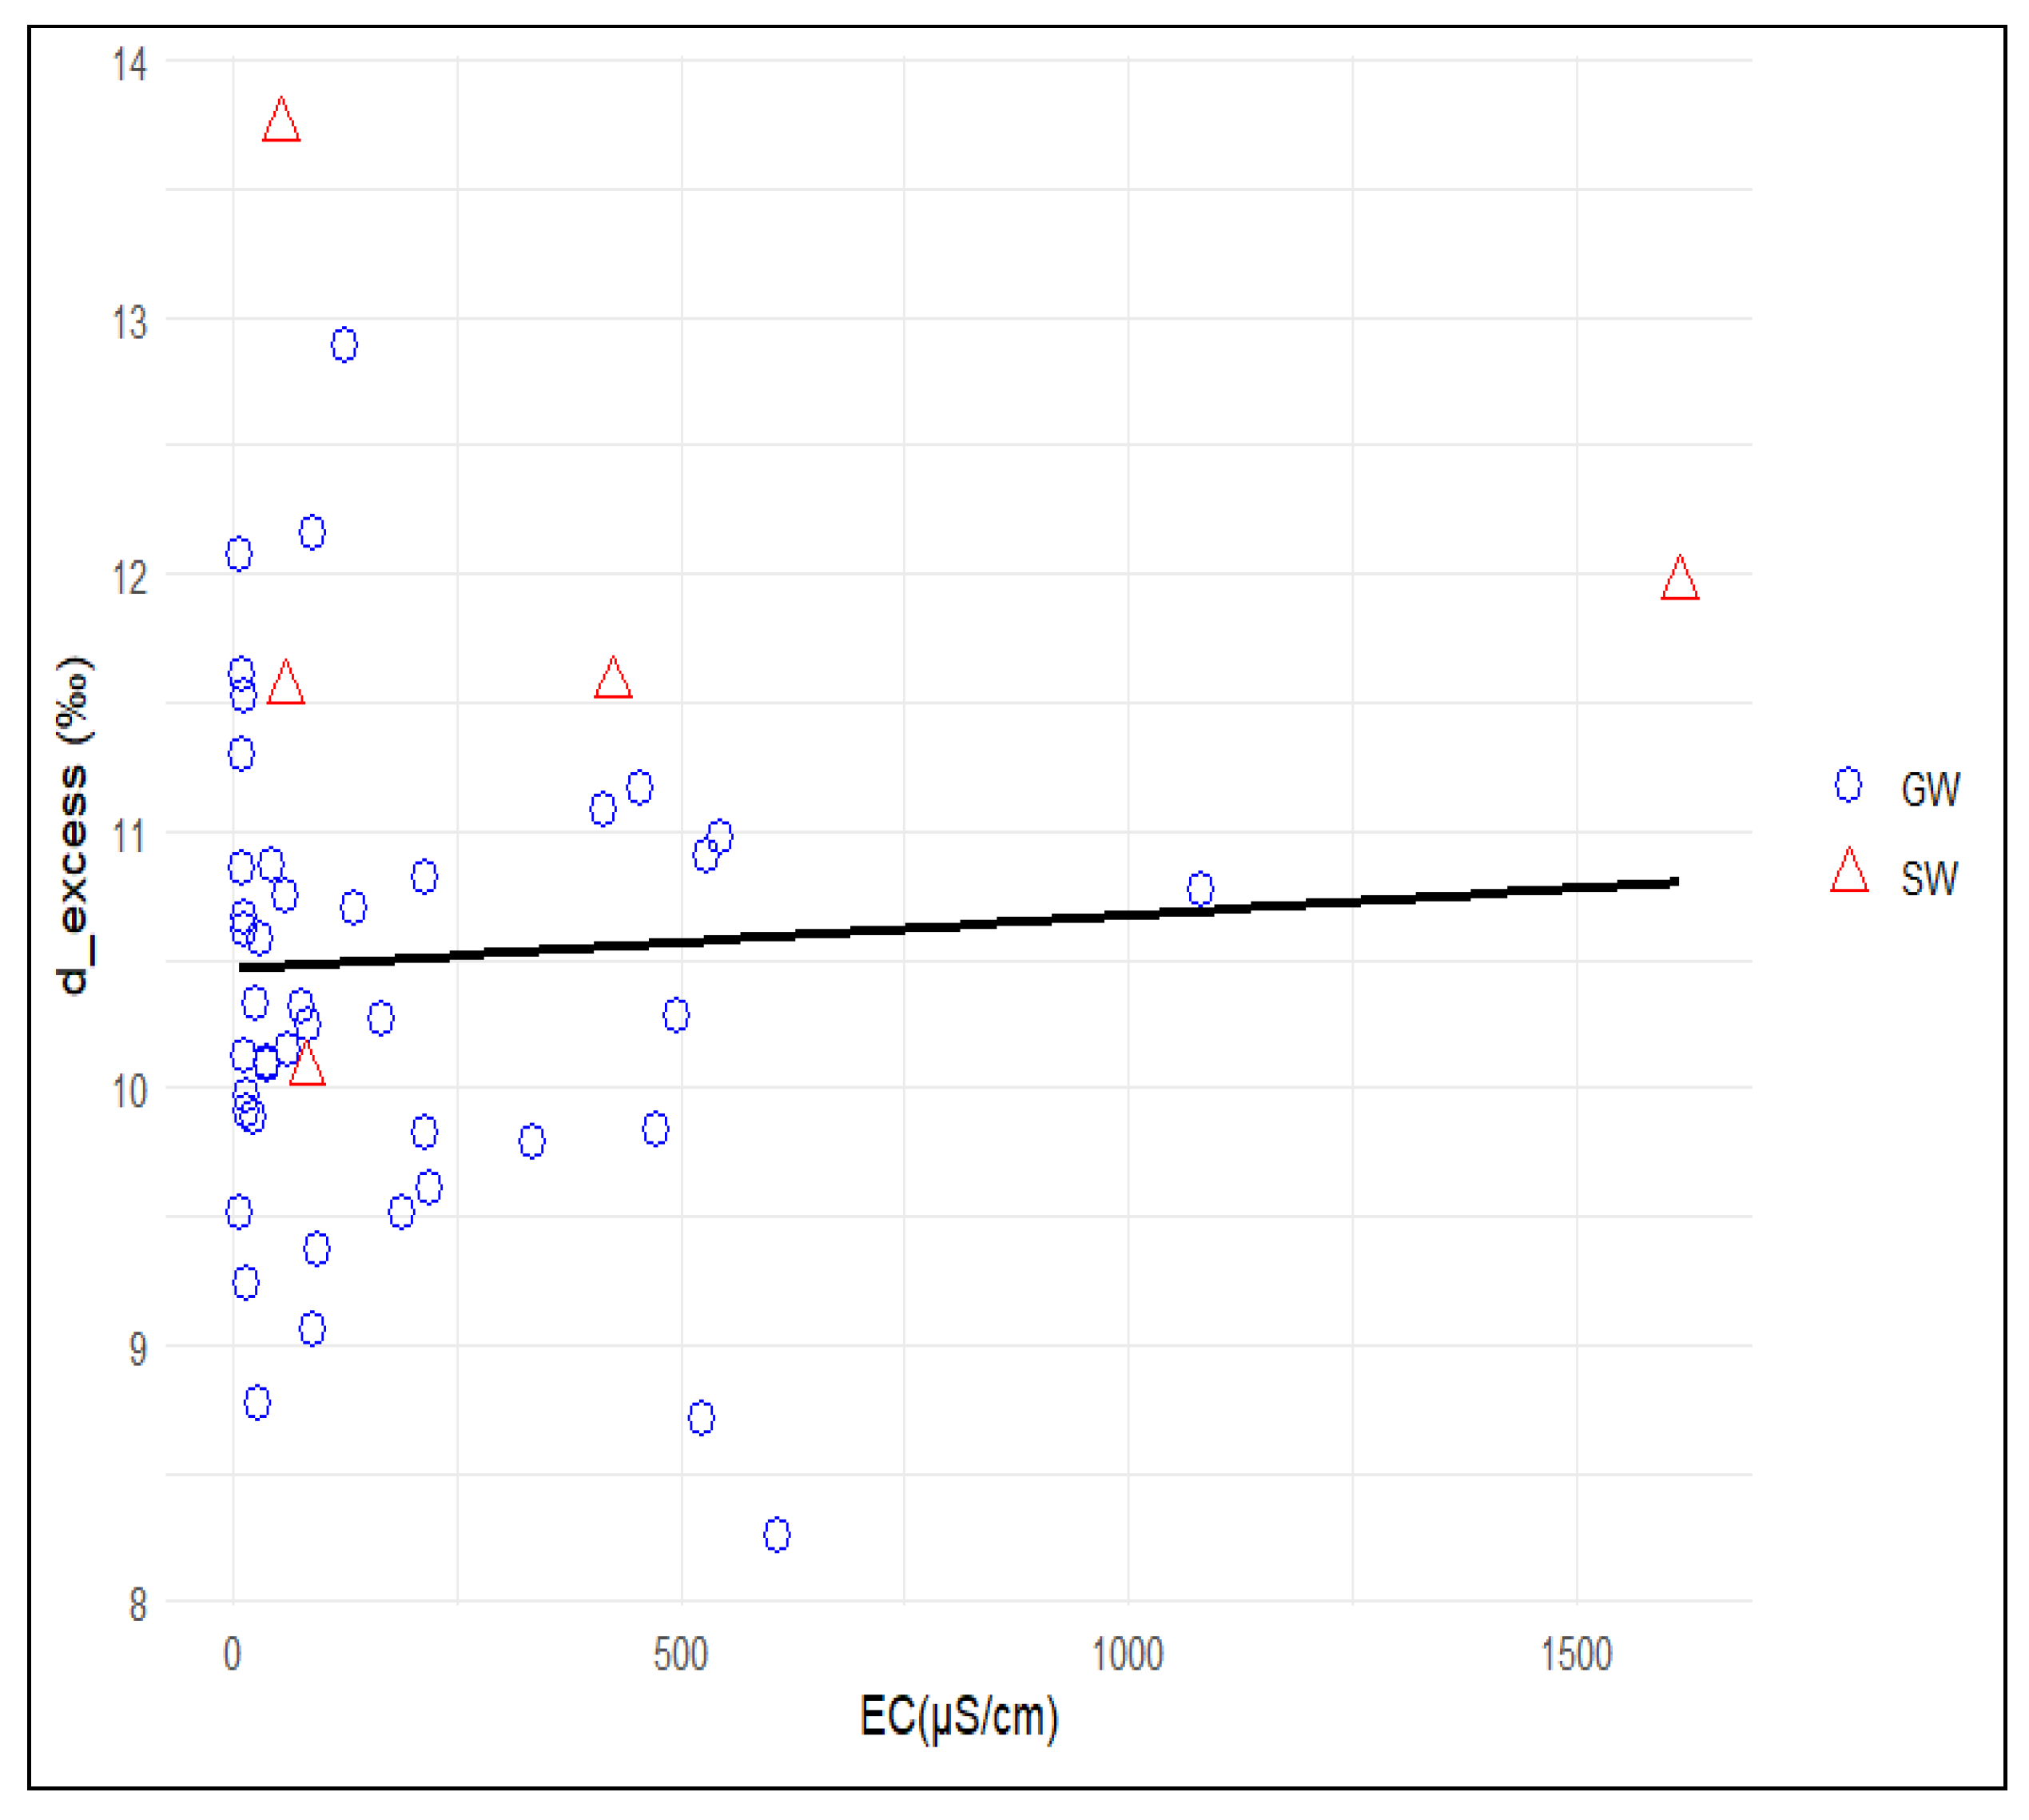
Figure 11 presents the relationship between d-excess and electrical conductivity (EC), with regression lines illustrating the linear trends. According to Liu et al. [88], evaporation in groundwater or surface water typically leads to a reduction in d-excess values while EC increases. In this study, a slight upward trend and a weak positive correlation (R = 0.06) were observed between these two parameters. Based on the interpretation of [88], the observed relationship suggests that evaporation plays a key role in influencing the isotopic and chemical characteristics of both groundwater and surface water. Kouanda [8] further emphasizes that, while natural processes primarily govern the mineralization within the Upper Mouhoun-Sourou Complex, anthropogenic pollution is also present. Isotopic analyses using tritium and stable isotopes point to significant recent recharge, alongside the coexistence of older groundwater and mixtures of modern and ancient waters.
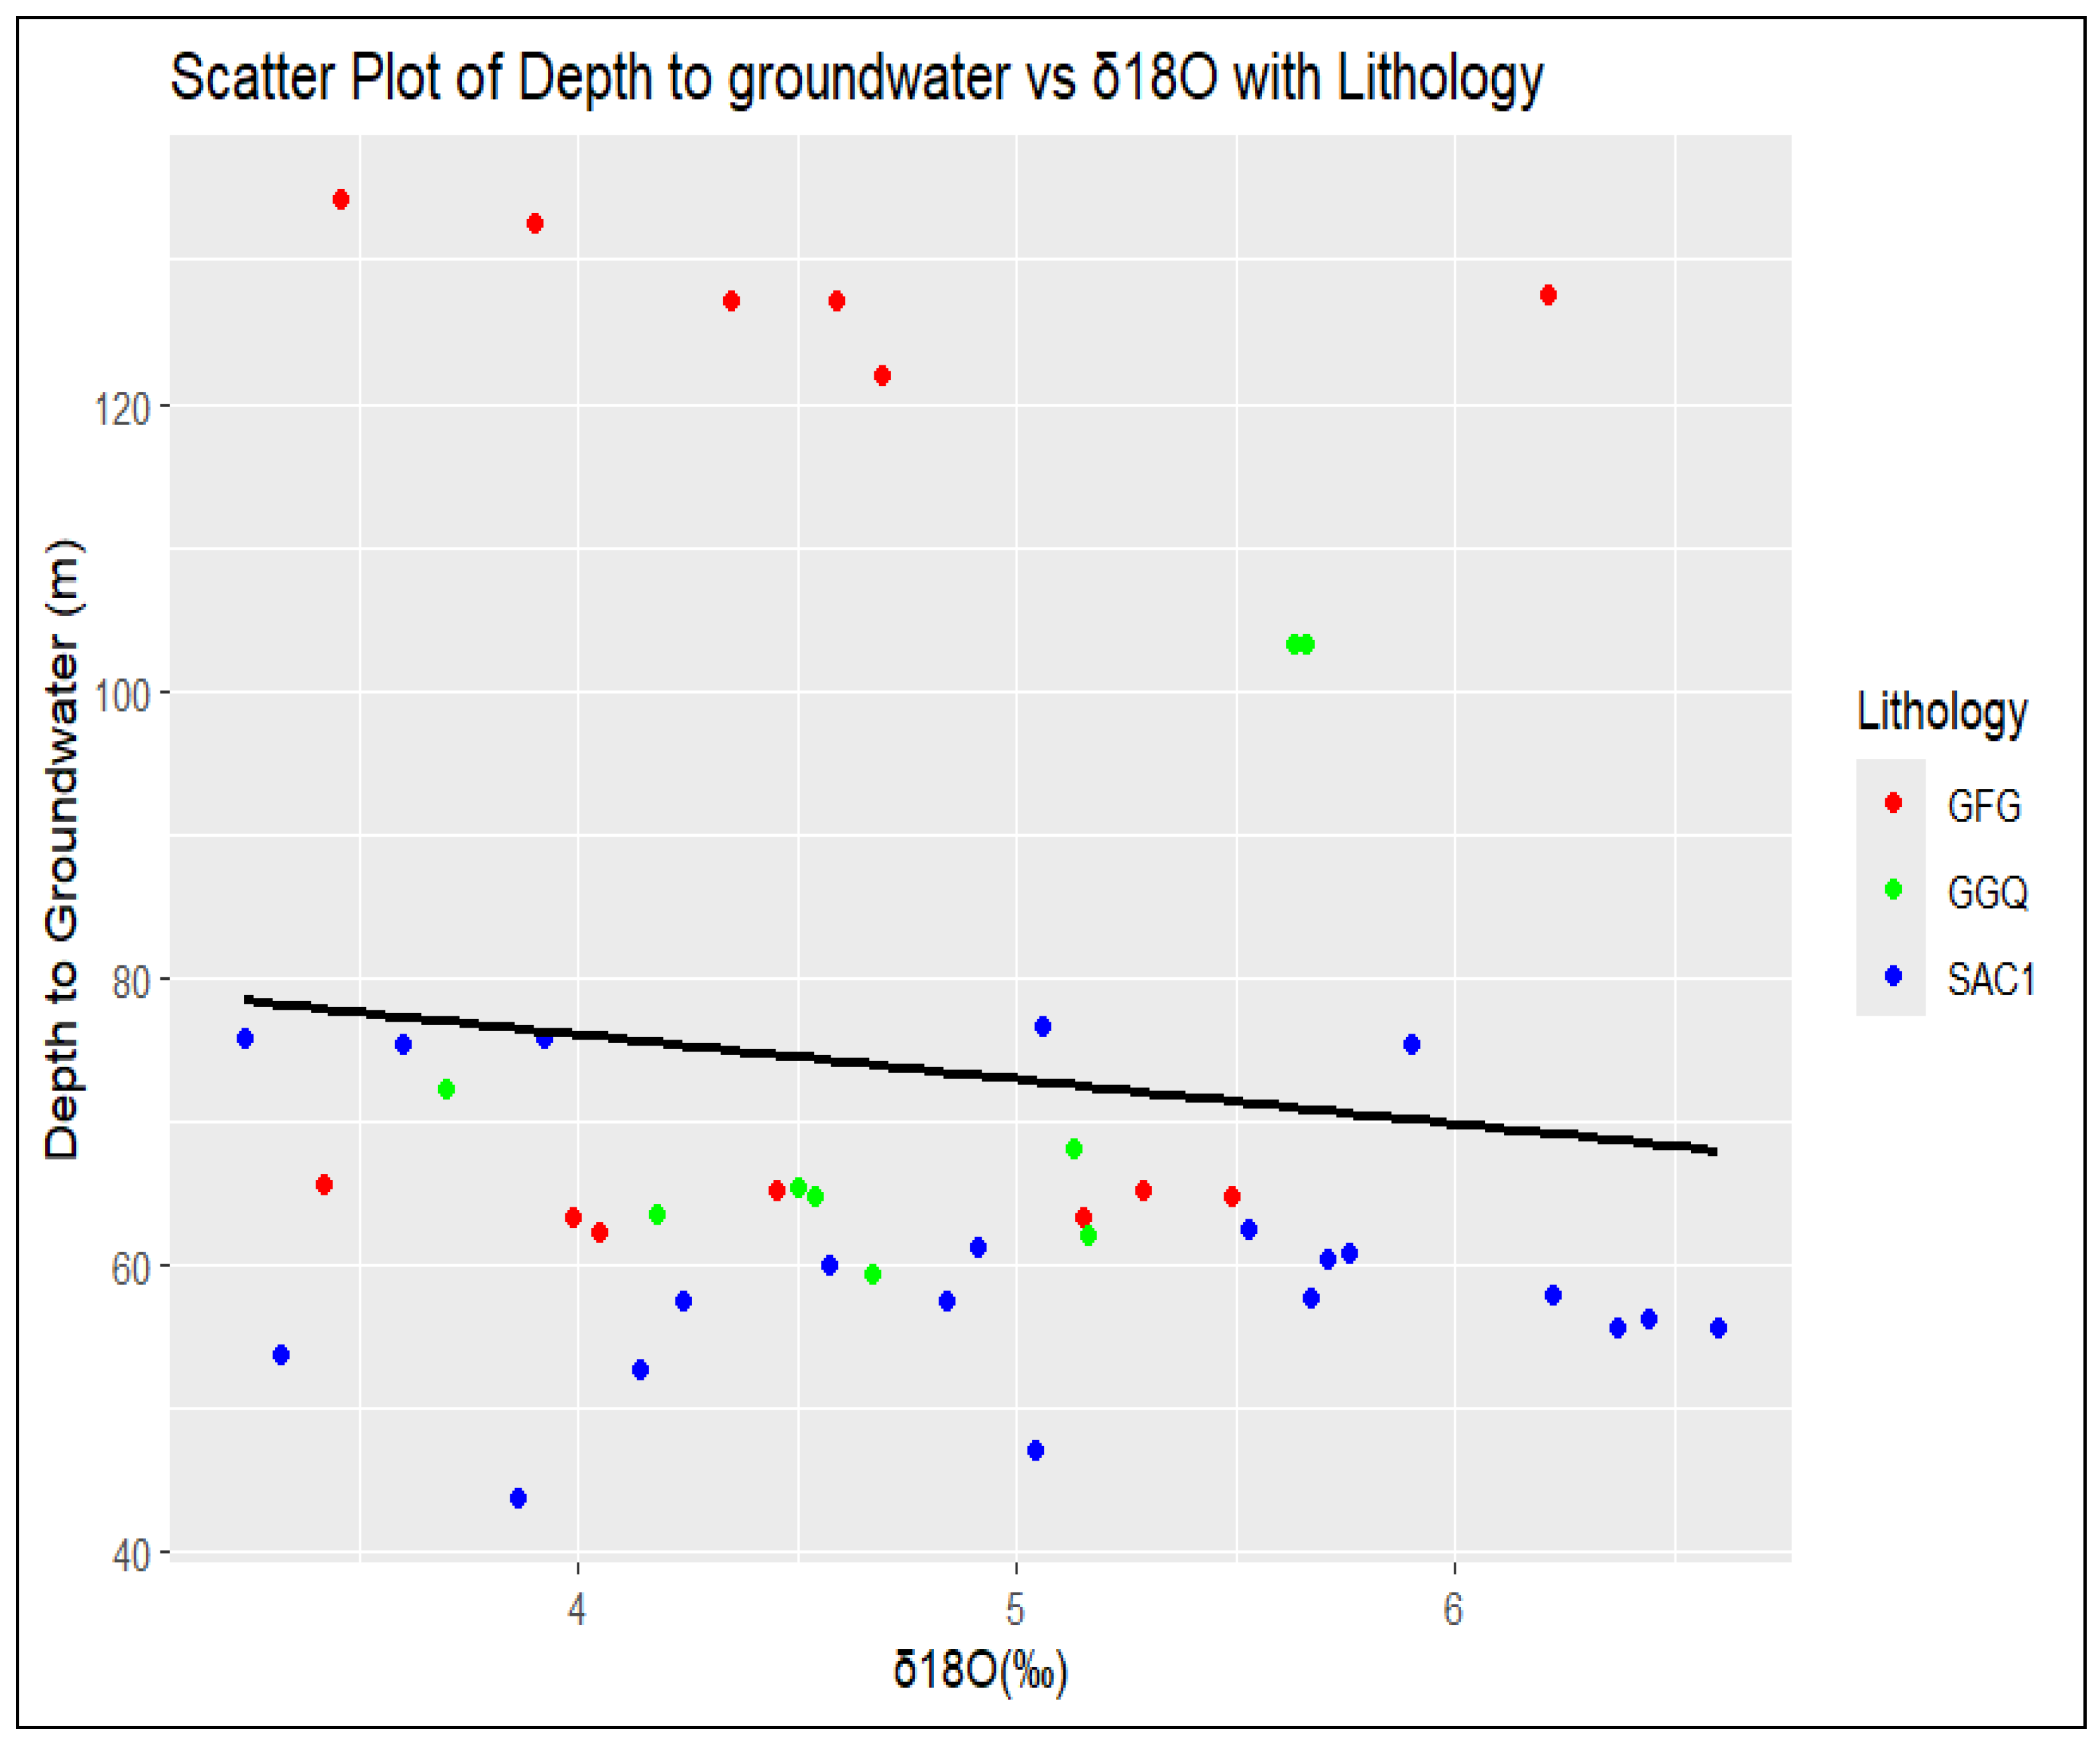
Figure 12 shows the variation of δ18O with depth to groundwater, with regression lines indicating trends and revealing the mixing of groundwater from different aquifer levels (shallow to deep).Although earlier hydrogeochemical and isotopic studies support the interpretation of the STBA as a largely unified and homogeneous multilayered aquifer system, Huneau et al. [14] observed that variations in lithostratigraphic levels correspond to differing hydrodynamic properties, such as permeability, which suggest significant hydraulic connectivity between these layers. Therefore, based on the analysis of groundwater lithology in relation to depth, we conclude that the aquifer formations within the Kou basin are hydraulically interconnected.
According to the IAEA report published [68], there are several shallow wells ranging between 25 and 40 m in the area. The well depths exhibit significant variability in the two formations of GFG and SAC1, measuring 80 m and 90 m, respectively.

3.4. Implication of SW-GW Interactions and Prospects of Water Management

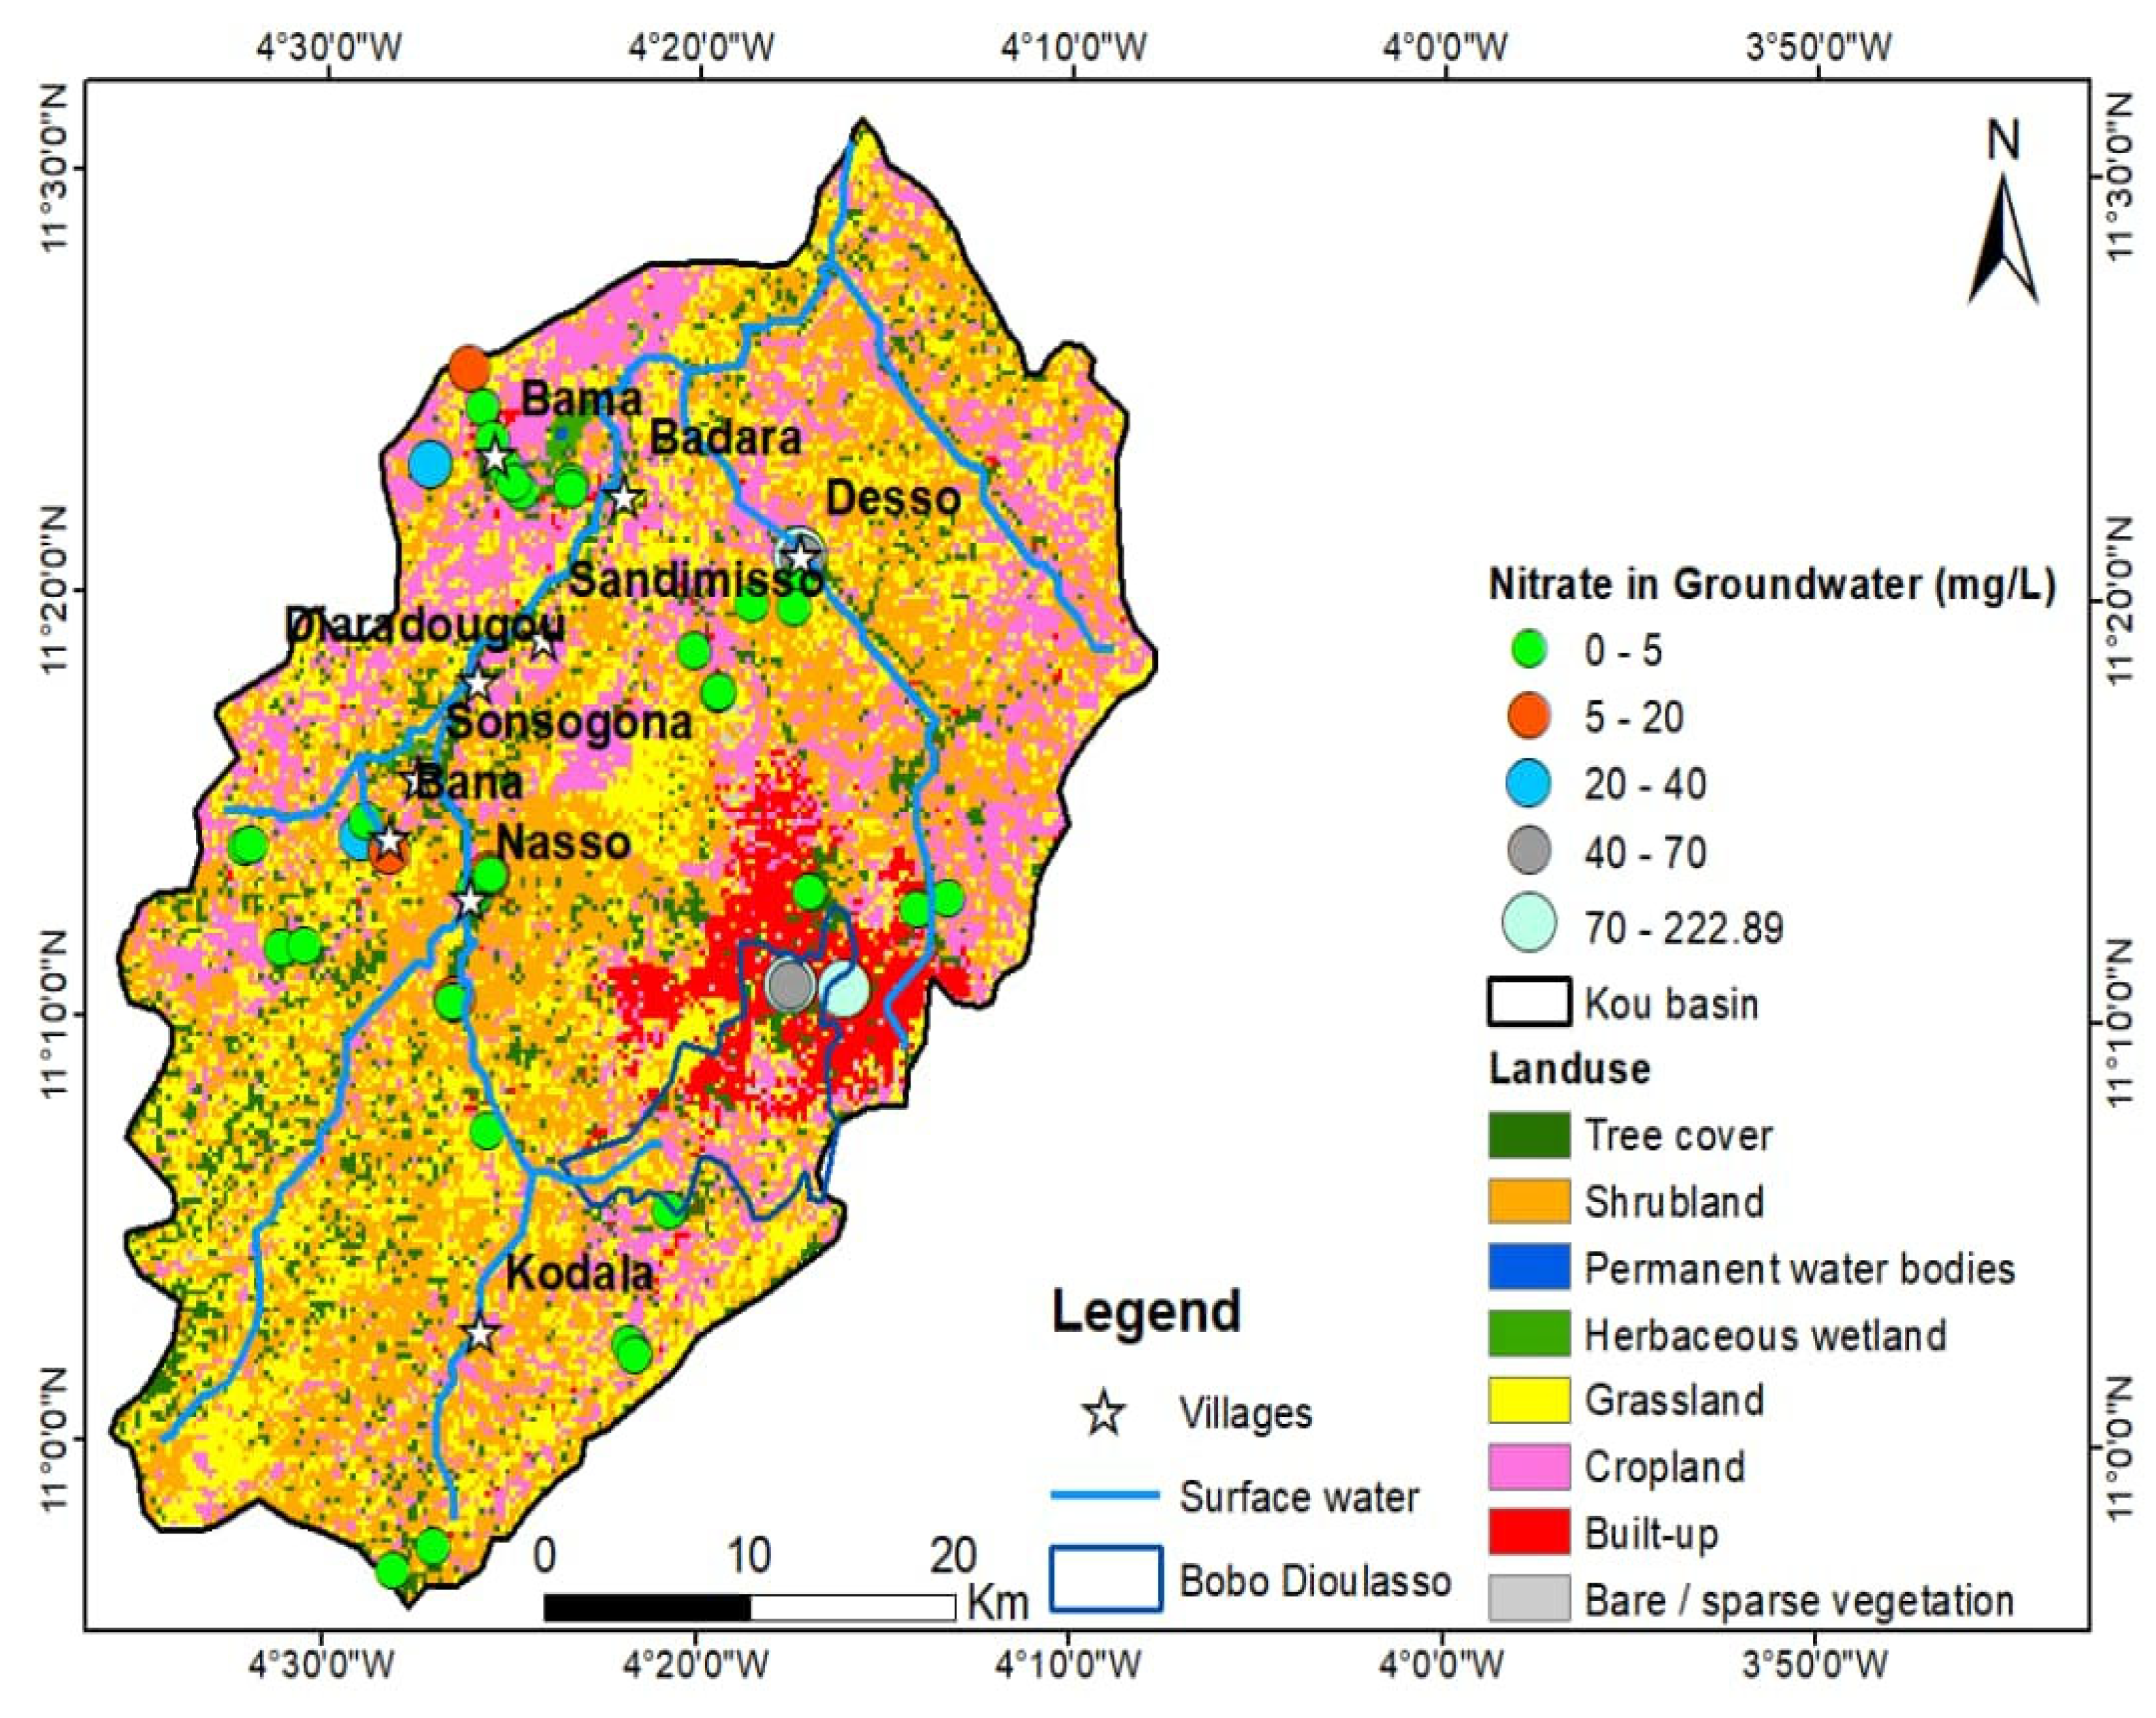
Groundwater resources in the Kou basin, which serve domestic, industrial, and agricultural purposes, are vulnerable to contamination by nitrates that can accumulate over time. The impact of human activities on both surface water and groundwater is a crucial factor in managing water quality. In this study, nitrate concentration was selected as an indicator of anthropogenic pollution because agricultural practices and urban development are the primary sources of nitrate contamination in groundwater. Descriptive statistics reveal that nitrate levels often exceed the WHO’s recommended limit for drinking water. Under natural conditions, nitrate concentrations are usually below 5 mg/L, as nitrate acts as a relatively stable tracer in the environment [89]. Elevated nitrate concentrations in some samples suggest significant influences from farming and industrial activities, particularly in urban and agricultural zones (Rawat et al., 2022; Lawniczak et al., 2016 [90,91]). High nitrate intake poses serious health risks, including methemoglobinemia a condition characterized by impaired oxygen transport in the blood and symptoms such as rapid heartbeat, weakness, dizziness, and fatigue [92]. The spatial distribution map of nitrate concentrations, overlaid with land use data (Figure 13), shows that 11.6% of groundwater samples surpass the WHO’s permissible limit of 50 mg/L for NO3. The highest nitrate levels were detected at well sites GW51 (138.89 mg/L), GW52 (222.89 mg/L), and GW53 (69.06 mg/L), while among boreholes, GW39 exhibited the highest concentration at 38.79 mg/L. These results are consistent with findings by [93], who highlighted multiple anthropogenic sources of groundwater contamination near water extraction points such as wells and drillings. Contributing factors include waste from wildlife and humans, leaking latrines, solid waste disposal, and wastewater discharge. Rosillon et al. [93] further reported extremely elevated nitrate concentrations in the region, sometimes exceeding 500 mg/L, with a maximum value reaching 860 mg/L.
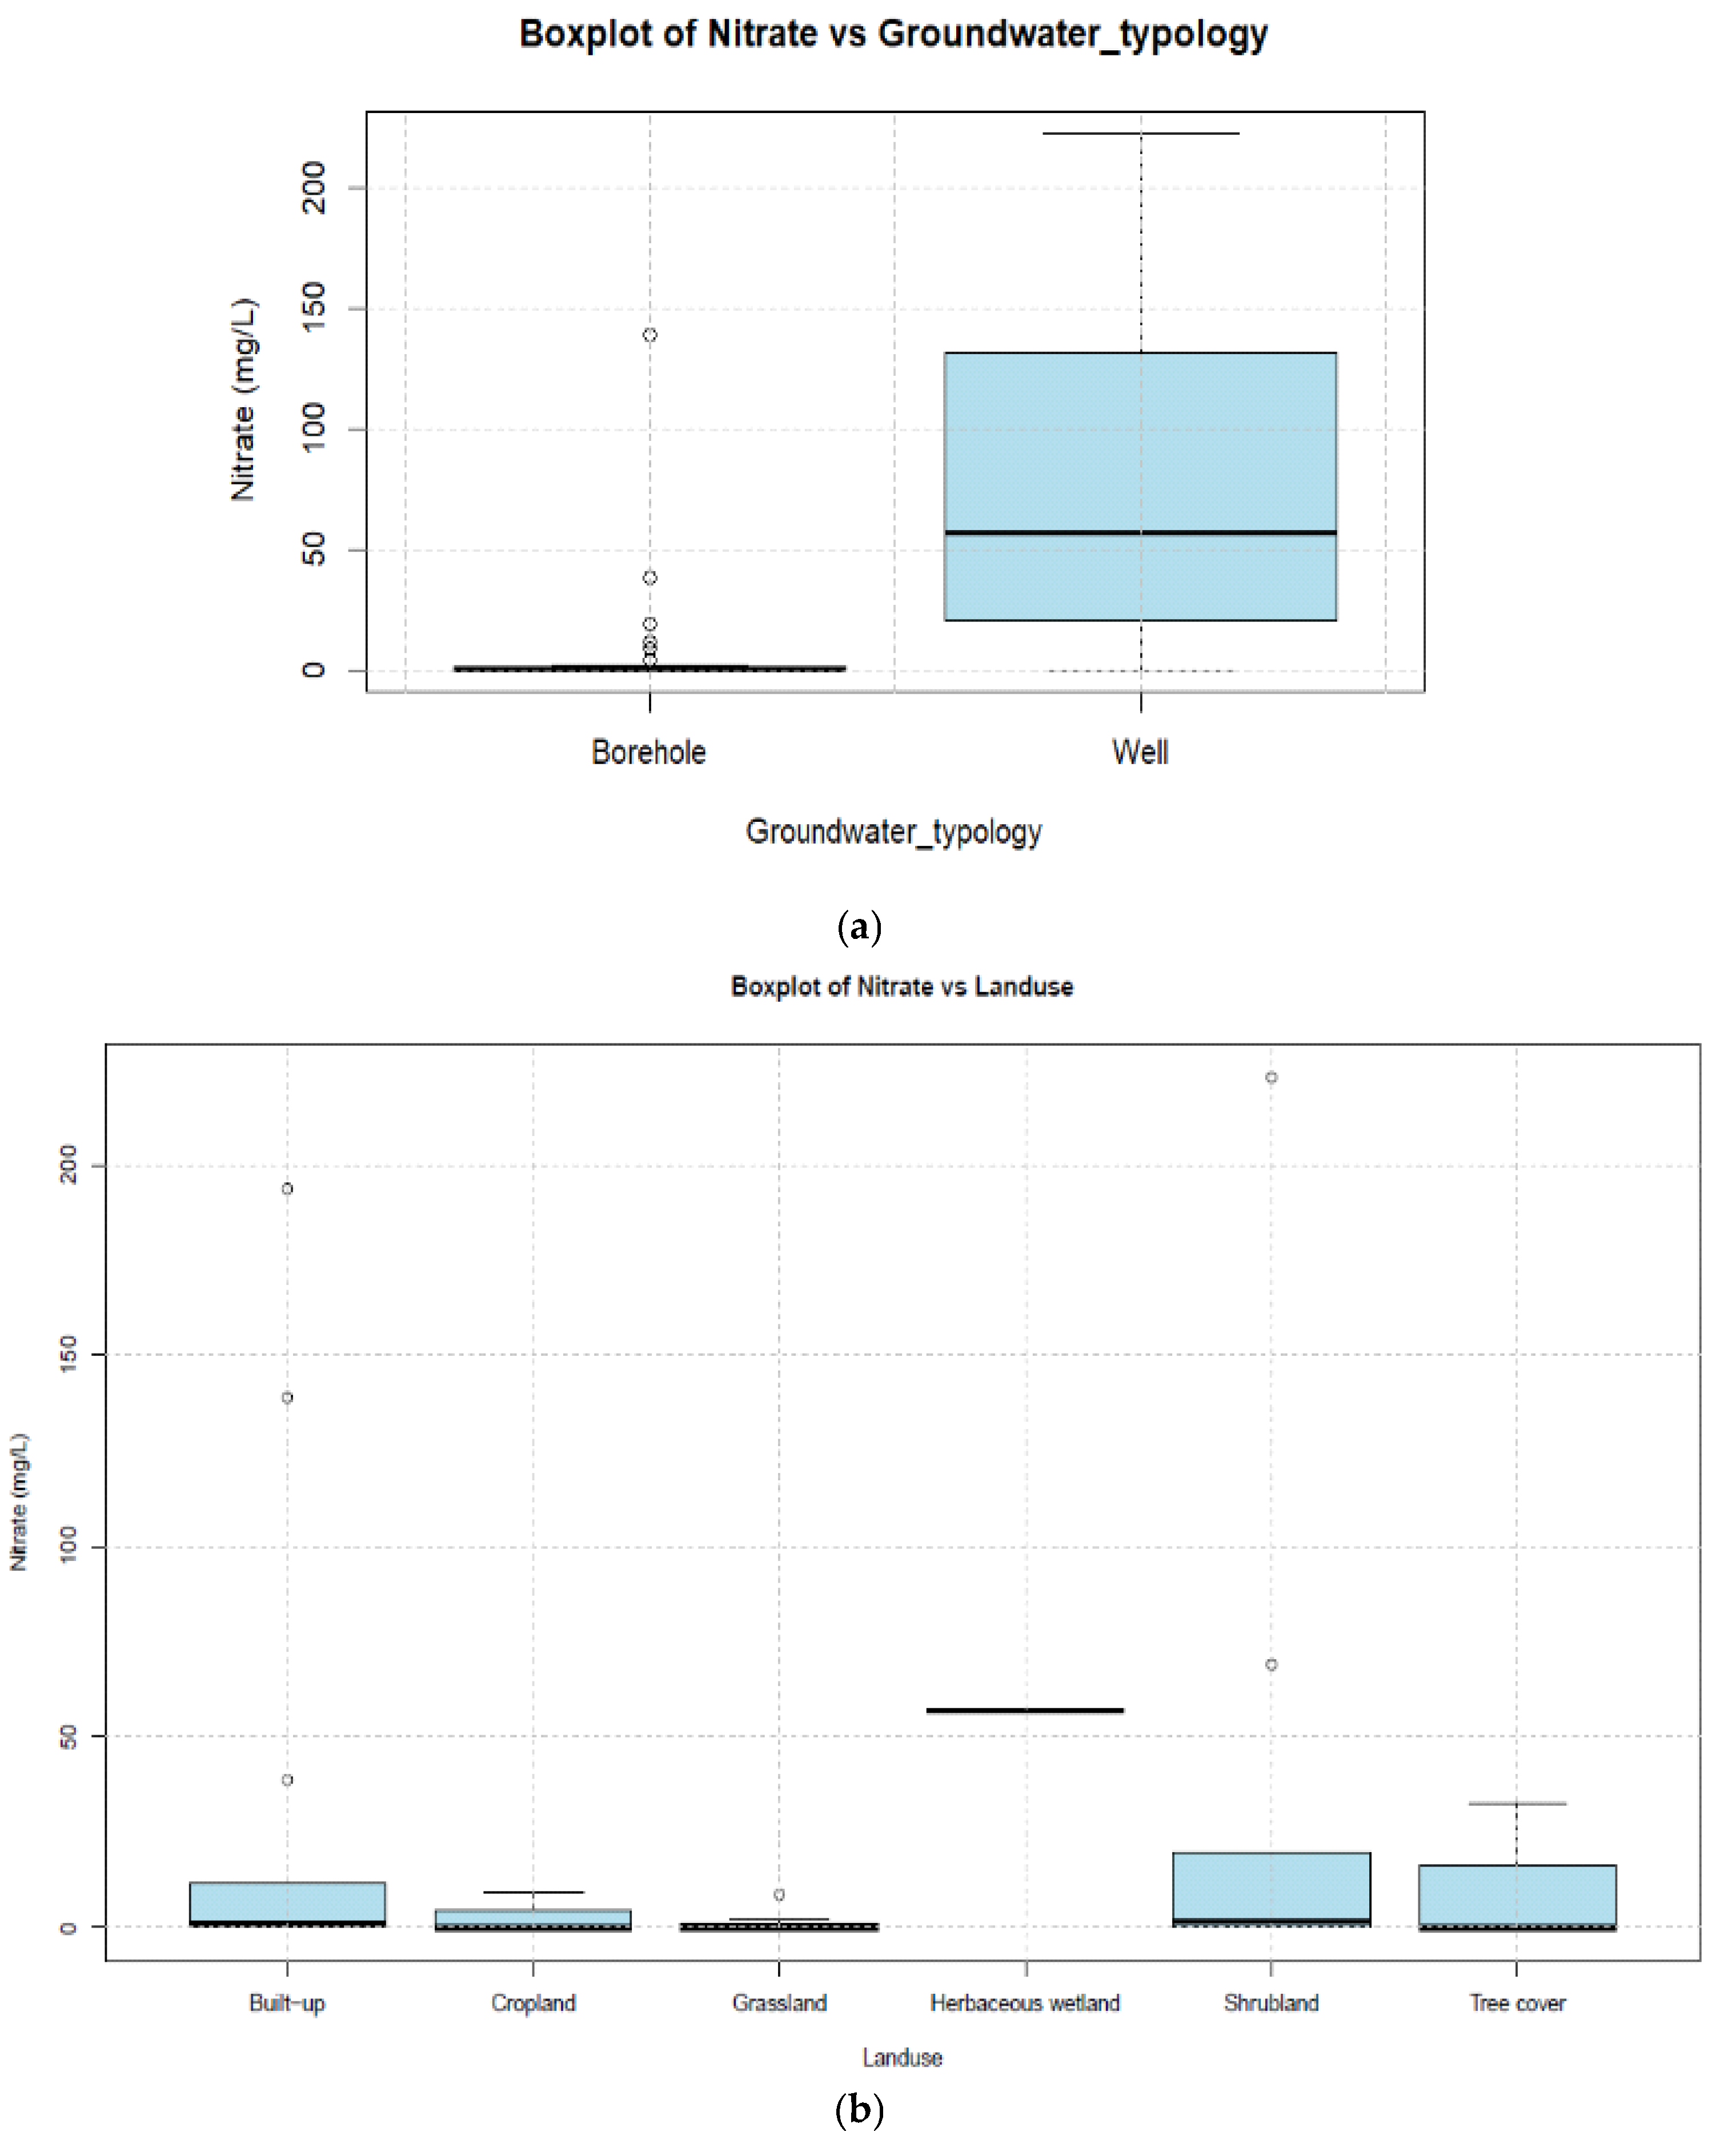
The distribution variation in the boxplot of nitrate over land use and groundwater sample typology is depicted in Figure 14a and Figure 14b, respectively. NO3 concentrations are notably higher in well samples compared to boreholes, as illustrated in Figure 14b.
In a previous investigation of groundwater in the southeastern part of the Taoudeni sedimentary basin, Huneau et al. [14] observed that human activities significantly impact groundwater characteristics under Sahelian climatic conditions. Contamination tends to be localized near wells or boreholes, often due to insufficient protection measures around these water extraction points. It is common to find livestock watering areas and latrines situated close to boreholes, which contributes to elevated levels of nitrate and sulfate sometimes reaching concentrations as high as 160 mg/L and 300 mg/L, respectively. These elevated values are frequently linked to inadequate well casing and the infiltration of surface water contaminated by manure and wastewater. Since many boreholes sampled are village sources primarily used for drinking water, they are particularly vulnerable to such contamination. Huneau et al. [14] emphasized that pollution is generally confined near pumping sites where protective zones are lacking. Furthermore, the IAEA report [67] highlighted strong correlations among chloride, nitrate, sodium, and potassium concentrations, pointing to anthropogenic origins. Nitrate concentrations in the study area show significant variability, with some locations like SAC1 exhibiting maxima up to 860 mg/L, where nitrates dominate as the primary anion. This contrasts with Huneau et al. [14], whose data reported maximum nitrate levels of 160 mg/L in their sampled boreholes.

4. Conclusions

This study set out to address three fundamental questions: (i) how surface water and groundwater interact within the Kou basin, (ii) which hydrochemical processes govern water quality, and (iii) how anthropogenic activities influence these dynamics.
The Kou basin is a vital source of both groundwater and surface water for Bobo-Dioulasso, the second-largest city in Burkina Faso. Its favorable geological characteristics make the Kou aquifer the primary resource for human development and agriculture, aligning with Sustainable Development Goal 6 (SDG6). This study provides a detailed baseline of groundwater physico-chemical properties and aquifer dynamics, offering concrete data to support informed water management and planning in the basin.
Hydrochemical analysis identified three main water types, Ca-HCO3, Na-K-HCO3, and Ca-Mg-HCO3, reflecting the geological diversity of the region. Mineralization processes are driven primarily by the dissolution of carbonate and evaporite minerals, while elevated concentrations of nitrates, potassium, and chlorides highlight localized anthropogenic pollution. Stable isotope analysis (δ2H, δ18O, and d-excess) revealed consistent spatial structures, isotopic offsets between groundwater samples, and clear evidence of aquifer interconnectivity. Shallow groundwater was additionally influenced by evaporation, highlighting heterogeneity in aquifer processes.
These results demonstrate pronounced interactions between surface water and groundwater and confirm the significant impact of human activities on water quality, particularly through nitrate contamination. While interpretation of isotopic data is limited by available rainfall measurements, the findings provide a robust framework for understanding aquifer connectivity, recharge processes, and contamination pathways.
In conclusion, this study confirms hydraulic connectivity between aquifer layers and contributions from surface water to groundwater recharge, while also identifying areas affected by water quality degradation. These findings directly address the study’s research questions and provide practical guidance for integrated water management. Continuous monitoring of water quality, isotopic signatures, and hydrological variables at key locations is recommended to further reduce uncertainties and ensure the sustainable use of freshwater resources in the Kou basin.

Author Contributions

Conceptualization, I.O., M.V. and S.K.; Data curation, I.O.; Formal analysis, I.O., F.H. and S.K.; Investigation, I.O. and F.H.; Methodology, I.O., M.V., F.H., Y.V. and Y.K.; Resources, I.O. and Y.V.; Software, Y.V.; Supervision, M.V.; Validation, M.V., F.H., Y.V. and Y.K.; Writing—original draft, I.O.; Writing—review and editing, M.V., F.H., Y.V., S.K. and Y.K. All authors have read and agreed to the published version of the manuscript.

Funding

This study received support from the Coordinated Research Project (CRP) of the International Atomic Energy Agency (IAEA), under grant number EVT2404676. The isotopic analyses were funded by the IAEA in cooperation with the Laboratory of Environmental Sciences (UMR 6134 SPE) at the University of Corsica, France, for the analysis of δ18O and δ2H isotopes as well as chemical parameters.

Data Availability Statement

The original contributions presented in this study are included in the article. Further inquiries can be directed to the corresponding author.

Acknowledgments

This study was conducted as part of the IAEA Coordinated Research Project (CRP) F32010 entitled “Improving Understanding of Nitrate Sources in Connected River and Groundwater Systems Through Linking Nitrate Isotopes and Contaminants of Emerging Concern.” The project involved several countries participating in the CRP F32010. In Burkina Faso, the project was led by the University of Fada N’Gourma (Université Yembila Abdoulaye Toguyeni). We extend our sincere thanks to the General Directorate of Water Resources of Burkina Faso (Direction Générale des Ressources en Eau) through Jamel Nebie and Cheick Ouattara for their technical support during data collection.

Conflicts of Interest

The authors declare no conflicts of interest.

References

  1. IPCC (Intergovernmental Panel on Climate Change). Climate Change 2022: Impacts, Adaptation and Vulnerability. In Contribution of Working Group II to the Sixth Assessment Report of the Intergovernmental Panel on Climate Change; Pörtner, H.-O., Roberts, D.C., Tignor, M., Poloczanska, E.S., Mintenbeck, K., Alegría, A., Craig, M., Langsdorf, S., Löschke, S., Möller, V., et al., Eds.; Cambridge University Press: Cambridge, UK, 2022; p. 3056. [Google Scholar] [CrossRef]
  2. Federal Institute for Geosciences and Natural Resources (BGR); United Nations Educational, Scientific and Cultural Organization—International Hydrological Programme (UNESCO-IHP). River and Groundwater Basins of the World. 2012. Available online: www.whymap.org (accessed on 28 January 2024).
  3. Guo, X.; Zuo, R.; Wang, J.; Meng, L.; Teng, Y.; Shi, R.; Gao, X.; Ding, F. Hydrogeochemical Evolution of Interaction between Surface Water and Groundwater Affected by Exploitation. Groundwater 2018, 57, 430–442. [Google Scholar] [CrossRef]
  4. Zhang, B.; Song, X.; Zhang, Y.; Ma, Y.; Tang, C.; Yang, L.; Wang, Z.L. The interaction between surface water and groundwater and its effect on water quality in the Second Songhua River basin, northeast China. J. Earth Syst. Sci. 2016, 125, 1495–1507. [Google Scholar] [CrossRef]
  5. Xu, J.; Du, Y.; Sun, X.; Tian, H.; Zhu, S.; Gan, Y.; Wang, Y. Spatial variability of nutrient fluxes associated with lacustrine groundwater discharge in a typical oxbow lake, Central China. Water Res. 2025, 281, 123701. [Google Scholar] [CrossRef] [PubMed]
  6. Paturel, J.E.; Servat, E.; Kouame, B.; Boyer, J.F. Manifestation de la sécheresse en Afrique de l’Ouest non sahélienne. Cas de la Côte d’Ivoire, du Togo et du Bénin. Sécheresse 1995, 6, 95–102. [Google Scholar]
  7. Amoussou, E.; Camberlin, P.; Mahé, G. Impact de la variabilité climatique et du barrage Nangbéto sur l’hydrologie du système Mono-Couffo (Ouest Afrique). Hydrol. Sci. J. 2012, 57, 805–817. [Google Scholar] [CrossRef]
  8. Kouanda, B. Modélisation Intégrée du Complexe Mouhoun Supérieur-Sourou Dans le Contexte des Changements Climatiques. Thèse en Sciences et Technologies de l’Eau, de l’Energie et de l’Environnement. 2019. 2iE, p. 250. Available online: http://documentation.2ie-edu.org/cdi2ie/opac_css/index.php?lvl=notice_display&id=30165 (accessed on 23 February 2024).
  9. Mahe, G.; Paturel, J.-E.; Servat, E.; Conway, D.; Dezetter, A. The impact of land use change on soil water holding capacity and river flow modelling in the Nakambe River, Burkina-Faso. J. Hydrol. 2005, 300, 33–43. [Google Scholar] [CrossRef]
  10. Mahe, G.; Lienou, G.; Descroix, L.; Bamba, F.; Paturel, J.E.; Laraque, A.; Meddi, M.; Habaieb, H.; Adeaga, O.; Dieulin, C.; et al. The rivers of Africa: Witness of climate change and human impact on the environment. Hydrol. Process. 2013, 27, 2105–2114. [Google Scholar] [CrossRef]
  11. Dakouré, D. Etude Hydrogéologique et Géochimique de la Bordure Sud-Est du Bassin Sédimentaire de Taoudéni (Burkina Faso-Mali)—Essai de Modélisation. Ph.D. Thesis, Université Paris VI, Paris, France, 2003; p. 266. [Google Scholar]
  12. Derouane, J. Modélisation Hydrogéologique du Bassin Sédimentaire; Programme de Valorisation des Ressources en Eau de l’Ouest (VREO); Direction Générale des Ressources en Eau. Ministère de l’Agriculture, de l’Hydraulique et des Ressources Halieutiques: Ouagadougou, Burkina Faso, 2008; p. 101. [Google Scholar]
  13. Koussoube, Y. Hydrogéologie des Séries Sédimentaires de la Dépression Piézométrique du Gondo (Bassin du Sourou): Burkina Faso/Mali. Ph.D. Thesis, Université Pierre et Marie Curie—Paris VI, Paris, France, 2010. [Google Scholar]
  14. Huneau, F.; Dakoure, D.; Celle-Jeanton, H.; Vitvar, T.; Ito, M.; Traore, S.; Compaore, N.F.; Jirakova, H.; Le Coustumer, P. Flow pattern and residence time of groundwater within the south-eastern Taoudeni sedimentary basin (Burkina Faso, Mali). J. Hydrol. 2011, 409, 423–439. [Google Scholar] [CrossRef]
  15. Sauret, E. Etude des Potentialités Hydrogéologiques d’une Plaine Alluviale en Relation Avec Les Eaux Souterraines et de Surface Dans Un Contexte d’agriculture Irriguée (Burkina Faso). 2013. Available online: https://www.proquest.com/openview/b301b26b22e695d0e2c6678bace0a611/1.pdf?pq-origsite=gscholar&cbl=2026366&diss=y (accessed on 14 February 2024).
  16. Tirogo, J.; Jost, A.; Biaou, A.; Valdes-Lao, D.; Koussoubé, Y.; Ribstein, P. Climate variability and groundwater response: A case study in Burkina Faso (West Africa). Water 2016, 8, 171. [Google Scholar] [CrossRef]
  17. Derouane, J.; Dakouré, D. Etude Hydrogéologique et Modélisation Mathématique du Système Aquifère du Bassin Sédimentaire de Taoudeni au Burkina Faso; Colloque International—Gestion des Grands Aquifères: Dijon, France, 2006; p. 21. Available online: https://www.researchgate.net/publication/228467900_Etude_hydrogeologique_et_modelisation_mathematique_du_systeme_aquifere_du_bassin_sedimentaire_de_Taoudeni_au_Burkina_Faso (accessed on 14 February 2024).
  18. Wang, J.; Xiao, Y.; Zhang, Y.; Hu, W.; Qi, Z.; You, X.; Gu, X.; Chen, H.; Han, J.; Zhang, Y.; et al. Hydrogeochemical sources and enrichment mechanisms of trace elements in river water of a typical endorheic headwater region on Tibetan Plateau. Appl. Water Sci. 2025, 15, 226. [Google Scholar] [CrossRef]
  19. O’Connor, M.; Zabik, M.; Cady, C.; Cousens, B.; Chiarenzelli, J. Multi-Element Analysis and Geochemical Spatial Trends of Groundwater in Rural Northern New York. Water 2010, 2, 217–238. [Google Scholar] [CrossRef]
  20. Doveri, M.; Mussi, M. Water Isotopes as Environmental Tracers for Conceptual Understanding of Groundwater Flow: An Application for Fractured Aquifer Systems in the “Scansano-Magliano in Toscana” Area (Southern Tuscany, Italy). Water 2014, 6, 2255–2277. [Google Scholar] [CrossRef]
  21. Zhang, Y.; Xu, M.; Li, X.; Qi, J.; Zhang, Q.; Guo, J.; Yu, L.; Zhao, R. Hydrochemical characteristics and multivariate statistical analysis of natural water system: A case study in Kangding County, Southwestern China. Water 2018, 10, 80. [Google Scholar] [CrossRef]
  22. Wu, Q.; Wang, G.; Zhang, W.; Cui, H.; Zhang, W. Estimation of groundwater recharge using tracers and numerical modeling in the North China Plain. Water 2016, 8, 353. [Google Scholar] [CrossRef]
  23. Yuan, J.; Xu, F.; Deng, G.; Tang, Y.; Li, P. Hydrogeochemistry of shallow groundwater in a karst aquifer system of Bijie City, Guizhou Province. Water 2017, 9, 625. [Google Scholar] [CrossRef]
  24. Peters, E.; Visser, A.; Esser, B.K.; Moran, J.E. Tracers Reveal Recharge Elevations, Groundwater Flow Paths and Travel Times on Mount Shasta, California. Water 2018, 10, 97. [Google Scholar] [CrossRef]
  25. Sako, A.; Yaro, J.M.; Bamba, O. Impacts of hydrogeochemical processes and anthropogenic activities on groundwater quality in the Upper Precambrian sedimentary aquifer of northwestern Burkina Faso. Appl. Water Sci. 2018, 8, 88. [Google Scholar] [CrossRef]
  26. Kumari, R.; Kumar, S.; Rao, M.S.; Mukherjee, S.; Sen, R. Isotopic Signature in Integration with Hydrochemistry to Infer the Groundwater Quality in Alluvial Aquifer, Jhajjar District, Haryana, NCR, India. 2021. Available online: https://assets-eu.researchsquare.com/files/rs-599293/v1/4633c7a3-6023-4072-bf23-60a821dbb046.pdf (accessed on 17 September 2024). [CrossRef]
  27. Coplen, T.B.; Herczeg, A.L.; Barnes, C. Isotope engineering—Using stable isotopes of the water molecule to solve practical problems. In Environmental Tracers in Subsurface Hydrology; Cook, P.G., Herczeg, A.L., Eds.; Springer: Boston, MA, USA, 2000; pp. 79–110. [Google Scholar] [CrossRef]
  28. Datta, P.S.; Bhattacharya, S.K.; Tyagi, S.K. 18O studies on recharge of phreatic aquifers and groundwater flowpaths of mixing in Delhi area. J. Hydrol. 1996, 176, 25–36. [Google Scholar] [CrossRef]
  29. Gupta, S.K.; Deshpande, R.D. Groundwater isotopic investigations in India: What has been learned? Curr. Sci. 2005, 89, 825–835. [Google Scholar]
  30. Jeelani, G.H.; Bhat, N.A.; Shivanna, K. Use of δ18O tracer to identify stream and spring origins of a mountainous catchment: A case study from Liddar watershed, Western Himalaya, India. J. Hydrol. 2010, 393, 257–264. [Google Scholar] [CrossRef]
  31. Maurya, A.S.; Shah, M.; Deshpande, R.D.; Bhardwaj, R.M.; Prasad, A.; Gupta, S.K. Hydrograph separation and precipitation source identification using stable water isotopes and conductivity: River Ganga at Himalayan foothills. Hydrol. Process. 2011, 25, 1521–1530. [Google Scholar] [CrossRef]
  32. Rina, K.; Singh, C.K.; Datta, P.S.; Singh, N.; Mukherjee, S. Geochemical modelling, ionic ratio and GIS based mapping of groundwater salinity and assessment of governing processes in Northern Gujarat, India. Environ. Earth Sci. 2013, 69, 2377–2391. [Google Scholar] [CrossRef]
  33. Maurya, P.; Kumari, R.; Mukherjee, S. Hydrochemistry in integration with stable isotopes (δ18O and δD) to assess seawater intrusion in coastal aquifers of Kachchh district, Gujarat, India. J. Geochem. Explor. 2019, 196, 42–56. [Google Scholar] [CrossRef]
  34. Breme, M. Caractérisation Physique du Bassin du Kou. Mémoire Master II, 2IE. 70 pp + Annexes. 2014. Available online: http://documentation.2ie-edu.org/cdi2ie/opac_css/doc_num.php?explnum_id=4066 (accessed on 23 January 2024).
  35. Qu, S.; Wang, J.; Zhang, K.; Fan, M.; Zhao, Y.; Yang, X.; Wang, Z.; Gomes, H.I.; Gomes, R.L.; Duan, L.; et al. Fate and Risks of Potentially Toxic Elements Associated with Lacustrine Groundwater Discharge: Quantification, Modeling, and Biogeochemistry. Environ. Int. 2025, 202, 109707. [Google Scholar] [CrossRef] [PubMed]
  36. Traoré, F.; Cornet, Y.; Denis, A.; Wellens, J.; Tychon, B. Monitoring the evolution of irrigated areas with Landsat images using backward and forward change detection analysis in the Kou watershed, Burkina Faso. Geocarto Int. 2013, 28, 733–752. [Google Scholar] [CrossRef]
  37. Gourcy, L.; Aranyossy, J.F.; Olivry, J.C.; Zuppi, G.M. Space and time variations in the isotopic composition (d2H–d18O) of Niger inland delta water (Mali). C. R. L’acad. Sci. Earth Planet. Sci. 2000, 331, 701–707. [Google Scholar] [CrossRef]
  38. Frappart, F.; Hiernaux, P.; Guichard, F.; Mougin, E.; Kergoat, L.; Arjounin, M.; Lavenu, F.; Koité, M.; Paturel, J.E.; Lebel, T. Rainfall regime across the Sahel band in the Gourma region, Mali. J. Hydrol. 2009, 375, 128–142. [Google Scholar] [CrossRef]
  39. Taupin, J.D.; Gaultier, G.; Favreau, G.; Leduc, C.; Marlin, C. Isotopic variability of Sahelian rainfall at different time steps in Niamey (Niger, 1992–1999): Climatic implications. C. R. Geosci. 2002, 334, 43–50. [Google Scholar] [CrossRef]
  40. Wellens, J.; Compaoré, N.F. Renforcement de la Capacité de Gestion des Ressources en eau dans l’Agriculture Moyennant des Outils de Suivi-Évaluation–GEeau; Rapport Annuel N1 (Décembre 2001–Novembre 2002); Direction Régionale de l’Agriculture, de l’Hydraulique et des Ressources Halieutiques des Hauts Bassins: Bobo-Dioulasso, Burkina Faso, 2003. [Google Scholar]
  41. Ogou, C. Etude des Potentialités Aquifères de la Plaine Alluviale du Kou Entre Nasso et Diaradougou; Institut International D’ingénierie de L’eau et de L’environnement: Ouagadougou, Burkina Faso, 2008. [Google Scholar]
  42. Ouedraogo, C. Synthèse Géologique de la Région Ouest du Burkina Faso; Programme VREO, SOFRECO-SAWES: Bobo-Dioulasso, Burkina Faso, 2006. [Google Scholar]
  43. Bronner, G.; Roussel, J.; Trompette, R.A.; Clauer, N. Genesis and geodynamic evolution of the Taoudeni cratonic basin (Upper Precambrian and Paleozoic), Western Africa. Dyn. Plate Inter. 1980, 1, 81–90. [Google Scholar] [CrossRef]
  44. Sogreah Ingénierie. Notice Explicative de la Carte Hydrogéologique 1:50000 de la Région de Bobo-Dioulasso; Etude des Ressources de la Zone Sédimentaire de la Région de Bobo-Dioulasso; Ministère de l’Agriculture de l’Hydraulique et des Ressources Halieutiques—Direction des Etudes et de la Planification—Direction Régionale de l’Eau des Hauts-Bassins: Bobo-Dioulasso, Burkina Faso, 1993; p. 25. [Google Scholar]
  45. Sogreah Ingenierie. Etude des Ressources en Eaux Souterraines de la Zone Sédimentaire de la Région de Bobo-Dioulasso; Ministère de l’Agriculture de l’Hydraulique et des Ressources Halieutiques—Direction des Etudes et de la Planification—Direction Régionale de l’Eau des Hauts-Bassins: Bobo-Dioulasso, Burkina Faso, 1994. [Google Scholar]
  46. Lorenzini, G. Etude du Bassin D’alimentation des Sources de Nasso—Etat des Lieux des Ressources en Eaux Souterraines du Bassin du Kou, Département ArGEnCo; Université de Liège: Liège, Belgique, 2007; p. 119. [Google Scholar]
  47. Gombert, P. Synthèse sur la Géologie et l’Hydrogéologie de la Série Sédimentaire du Sud-Ouest du Burkina Faso; Programme RESO, IWACO-BURGEAP: Bobo-Dioulasso, Burkina Faso, 1998. [Google Scholar]
  48. Sauret, E. Contribution à la Compréhension du Fonctionnement Hydrogeologique du Système Aquifère dans le Bassin du Kou (Burkina Faso) [Specialised Master, ULiège—Université de Liège]. ORBi-University of Liège. 2008. Available online: https://orbi.uliege.be/handle/2268/153604 (accessed on 14 February 2024).
  49. Wellens, J.; Traoré, F.; Diallo, M.; Tychon, B. A framework for the use of decision-support tools at various spatial scales for the management of irrigated agriculture in West-Africa. Agric. Sci. 2013, 4, 9–15. [Google Scholar] [CrossRef]
  50. Traoré, F. Optimisation de L’utilisation des Ressources en Eau du Bassin du Kou pour des Usages Agricoles. Ph.D. Thesis, Université de Liège, Liège, Belgium, 2012. p. 195. Available online: https://orbi.uliege.be/handle/2268/132698 (accessed on 14 February 2024).
  51. RGPH. Cinquième Recensement Général de la Population et de l’Habitation du Burkina Faso. 2022. p. 136. Available online: https://www.insd.bf/sites/default/files/2023-08/INSD_Rapport_SYNTHESE%20DES%20RESULTATS%20DEFINITIFS_1.pdf (accessed on 19 August 2024).
  52. Wellens, J. A framework for Using Decision-Support Tools at Various Spatial Scales for the Management of Irrigated Agriculture in Semi-Arid West-Africa. Ph.D. Thesis, Université de Liège, Liège, Belgium, 2014. Available online: https://orbi.uliege.be/handle/2268/163546 (accessed on 14 February 2024).
  53. Wellens, J.; Sawadogo, I.; Diallo, M.; Dakouré, D.; Compaoré, N.F.; Traoré, F.; Tychon, B. Recensement Exhaustif des Activités Hydro-Agricoles du Bassin du Kou; GEeau: Bobo-Dioulasso, Burkina Faso, 2007. [Google Scholar]
  54. Traoré, S.; Gombert, P. Variations des Débits Interannuels de la Source de la Guinguette; Rapport Interne; Direction Régionale de l’Hydraulique des Hauts-Bassins: Bobo-Dioulasso, Burkina Faso, 1997; p. 10. [Google Scholar]
  55. Palm, P.M. Hydrological Investigation for Climate Change Investigation in the Kou Basin Burkina Faso: A Minor Field Study. TRITA LWR Degree Project 11:2. ISSN 1651-064X.. 2011. Available online: https://www.diva-portal.org/smash/record.jsf?pid=diva2%3A529737 (accessed on 23 January 2024).
  56. Dione, M. Gestion Intégrée des Ressources en Eau de la Vallée du Kou: Profil de Pollution des Eaux de Surface en Rapport Avec les Usages. Master’s Thesis, 2iE-Institut International d’Ingénierie de l’Eau et de l’Environnemen, Ouagadougou, Burkina Faso, 2005. p. 118. Available online: http://documentation.2ie-edu.org/cdi2ie/opac_css/doc_num.php?explnum_id=1008 (accessed on 23 January 2024).
  57. Bieupoude, G.P. Mapping Groundwater Intrinsic Vulnerability Using a New Physically Based Modeling in Kou Basin Bobo-Dioulasso/Burkina Faso; Mémoire de Master en Hydraulique-Environnement et Infrastructure: Ouagadougou, Burkina Faso, 2008. [Google Scholar]
  58. Ko, A. Influence des Rejets Industriels sur la Pollution des Eaux à Bobo Dioulasso (Burkina Faso). Master’s Thesis, Université Polytechnique de Bobo-Dioulasso, Dindéresso, Burkina Faso, 2008. p. 78. Available online: https://beep.ird.fr/collect/upb/index/assoc/IDR-2008-KOH-INF/IDR-2008-KOH-INF.pdf (accessed on 23 January 2024).
  59. Ben Moussa, A. Etude Hydrogéologique, Hydrochimique et Isotopique du Système Aquifère de Hammamet Nabeul, Cap Bon, Tunisie Nord Orientale. Ph.D. Thesis, Université de Sfax École Nationale d’Ingénieurs de Sfax, Sfax, Tunisia, 2011. p. 147. Available online: https://gnssn.iaea.org/main/NCP/Tunisia/LRAE/Documents/Student%20Programmes/Th%C3%A8se%20Ben%20Moussa%20Amor.pdf (accessed on 14 February 2024).
  60. IAEA (International Atomic Energy Agency). Introduction to Water Sampling and Analysis for Isotope Hydrology; Non-Serial Publications; IAEA: Vienna, Austria, 2007. [Google Scholar]
  61. Freeze, R.A.; Cherry, J.A. Groundwater; Prentice Hall: Englewood Cliffs, NJ, USA, 1979; p. 604. [Google Scholar]
  62. Favreau, G. Caractérisation et Modélisation d’une Nappe Phréatique en Hausse au Sahel: Dynamique et Géochimie de la Dépression Piézométrique Naturelle du Kori de Dantiandou (Sud-Ouest du Niger); Université Paris-Sud 11: Orsay, France; IRD: Montpellier, France, 2000; 348p. [Google Scholar]
  63. Penna, D.; Stenni, B.; Šanda, M.; Wrede, S.; Bogaard, T.A.; Gobbi, A.; Borga, M.; Fischer, B.M.C.; Bonazza, M.; Cháróvá, Z. On the reproducibility and repeatability of laser absorption spectroscopy measurements for δ2H and δ18O isotopic analysis. Hydrol. Earth Syst. Sci. 2010, 14, 1551–1566. [Google Scholar] [CrossRef]
  64. Craig, H. Isotopic variations in meteoric waters. Science 1961, 133, 1702–1703. [Google Scholar] [CrossRef]
  65. Dansgaard, W. Stable Isotope in Precipitation. Tellus 1964, 16, 436–468. [Google Scholar] [CrossRef]
  66. Simler, R. DIAGRAMMES Software (Version 31-10-2014). Université d’Avignon. Available online: https://terre-et-eau.univ-avignon.fr/equipements-de-terrain-et-de-laboratoire/logiciels (accessed on 31 October 2024).
  67. WHO(World Health Organization). WHO—Guidelines on Drinking Water Quality, 4th ed.; World Health Organization: Geneva, Switzerland, 2017. [Google Scholar]
  68. IAEA (International Atomic Energy Agency). (RAF/7/011) Gestion Intégrée et Durable des Systèmes Aquifères et des Bassins Partagés de la Région du Sahel, Bassin de Taoudéni; l’AIEA: Vienna, Austria, 2017; p. 136. Available online: https://www.iaea.org/sites/default/files/18/02/raf7011_taoudeni_basin_fr.pdf (accessed on 19 January 2024).
  69. Serge Gaëtan, S.É.; Marie Michelle, C.H.; Ouindinboudé Jacques, K.; Poulouma Louis, Y.; Idriss, S. Hydrogeochemistry of Shallow Groundwater and Suitability to Irrigation: The Case of the Karfiguéla Paddy Field in Burkina Faso. Water 2022, 14, 2574. [Google Scholar] [CrossRef]
  70. Sheick, S. Water Nutrient Use Efficiency the Vertical Leaching Losses in Urban Vegetable Cropping Systems in Bobo–Dioulasso (Burkina Faso). Ph.D. Thesis, Université Catholique de Louvain, Louvain-la-Neuve, Belgium, 2012. p. 193. Available online: http://hdl.handle.net/2078.1/110879 (accessed on 14 February 2024).
  71. Ouédraogo, R.A.; Kambiré, F.C.; Kestemont, M.P.; Bielders, C.L. Caractériser la diversité des exploitations maraîchères de la région de Bobo-Dioulasso au Burkina Faso pour faciliter leur transition agroécologique. Cah. Agric. 2019, 28, 20. [Google Scholar] [CrossRef]
  72. Trabelsi, R.; Zouari, K.; Araguás Araguás, L.J.; Moulla, A.S.; Sidibe, A.M.; Bacar, T. Assessment of geochemical processes in the shared groundwater resources of the Taoudeni aquifer system (Sahel region, Africa). Hydrogeol. J. 2024, 32, 167–188. [Google Scholar] [CrossRef]
  73. Huneau, F.; Travi, Y. The Miocene Aquifer of Valreas, France. In Natural Groundwater Quality; Edmunds, W.M., Shand, P., Eds.; Blackwell Publishing: London, UK, 2008; pp. 287–305. [Google Scholar] [CrossRef]
  74. Yang, K.; Han, G.; Song, C.; Zhang, P. Stable HO isotopic composition and water quality assessment of surface water and groundwater: A case study in the Dabie Mountains, central China. Int. J. Environ. Res. Public Health 2019, 16, 4076. [Google Scholar] [CrossRef]
  75. Sako, A.; Sawadogo, S.; Nimi, M.; Ouédraogo, M. Hydrogeochemical and Pollution Characterization of a Shallow Glauconitic Sandstone Aquifer in a Peri-Urban Setting of Bobo-Dioulasso, Southwestern Burkina Faso. Environ. Earth Sci. 2020, 79, 296. [Google Scholar] [CrossRef]
  76. Xu, P.; Feng, W.; Qian, H.; Zhang, Q. Hydrogeochemical Characterization and Irrigation Quality Assessment of Shallow Groundwater in the Central-Western Guanzhong Basin, China. Int. J. Environ. Res. Public Health 2019, 16, 1492. [Google Scholar] [CrossRef]
  77. Li, P.; Wu, J.; Qian, H.; Zhang, Y.; Yang, N.; Jing, L.; Yu, P. Hydrogeochemical Characterization of Groundwater in and around a Wastewater Irrigated Forest in the Southeastern Edge of the Tengger Desert, Northwest China. Expo. Health 2016, 8, 331–348. [Google Scholar] [CrossRef]
  78. Subramani, T.; Rajmohan, N.; Elango, L. Groundwater Geochemistry and Identification of Hydrogeochemical Processes in a Hard Rock Region, Southern India. Environ. Monit. Assess 2010, 162, 123–137. [Google Scholar] [CrossRef] [PubMed]
  79. Mahlangu, S.; Lorentz, S.; Diamond, R.; Dippenaar, M. Surface water-groundwater interaction using tritium and stable water isotopes: A case study of Middelburg, South Africa. J. Afr. Earth Sci. 2020, 171, 103886. [Google Scholar] [CrossRef]
  80. Mathieu, R.; Bariac, T.; Fouillac, C.; Guillot, B.; Mariotti, A. Variations en isotopes stables dans les précipitations en 1988 et 1989 au Burkina Faso: Apports de la météorologie régionale. Veill. Clim. Satellitaire 1993, 45, 47–64. [Google Scholar]
  81. Taupin, J.D.; Gallaire, R.; Arnaud, Y. Analyses isotopiques et chimiques des précipitations sahéliennes de la région de Niamey au Niger: Implications climatologiques. IAHS Publ.-Ser. Proc. Rep.-Intern. Assoc. Hydrol. Sci. 1997, 244, 151–164. [Google Scholar]
  82. Song, F.; Nlend, B.; Boum-Nkot, S.N.; Huneau, F.; Ndondo, G.N.; Garel, E.; Leydier, T.; Celle, H.; Djieugoue, B.; Ntamak-Nida, M.-J.; et al. Groundwater Resources of the Transboundary Quaternary Aquifer of the Lake Chad Basin: Towards a Better Management via Isotope Hydrology. Resources 2023, 12, 138. [Google Scholar] [CrossRef]
  83. Goni, I.B.; Taylor, R.G.; Favreau, G.; Shamsudduha, M.; Nazoumou, Y.; Nhatcha, B.N. Groundwater recharge from heavy rainfall in the southwestern Lake Chad Basin: Evidence from isotopic observations. Hydrol. Sci. J. 2021, 66, 1359–1371. [Google Scholar] [CrossRef]
  84. Mamand, B.S.; Mawlood, D.K. Identifying sources of groundwater and recharge zone using stable environmental isotopes in the Erbil basin-northern Iraq. Kuwait J. Sci. 2024, 51, 100128. [Google Scholar] [CrossRef]
  85. Mahamat Nour, A.; Vallet-Coulomb, C.; Gonçalves, J.; Sylvestre, F.; Deschamps, P. Rainfall-Discharge Relationship and Water Balance over the Past 60 Years within the Chari-Logone Sub-Basins, Lake Chad Basin. J. Hydrol. Reg. Stud. 2021, 35, 100824. [Google Scholar] [CrossRef]
  86. Mahamat-Nour, A.; Huneau, F.; Mahamat, A.; Mahamat Saleh, H.; Ngo Boum-Nkot, S.; Nlend, B.; Djebebe-Ndjiguim, C.-L.; Foto, E.; Sanoussi, R.; Araguas-Araguas, L.; et al. Shallow Quaternary groundwater in the Lake Chad basin is resilient to climate change but requires sustainable management strategy: Results of isotopic investigation. Sci. Total Environ. 2022, 851, 158152. [Google Scholar] [CrossRef]
  87. Beyerle, U.; Rueedi, J.; Leuenberger, M.; Aeschbach-Hertig, W.; Peeters, F.; Kipfer, R.; Dodo, A. Evidence for periods of wetter and cooler climate in the Sahel between 6 and 40 kyr BP derived from groundwater. Geophys. Res. Lett. 2003, 30, 1173. [Google Scholar] [CrossRef]
  88. Liu, F.; Wang, S.; Wang, L.; Shi, L.; Song, X.; Yeh, T.C.J.; Zhen, P. Coupling hydrochemistry and stable isotopes to identify the major factors affecting groundwater geochemical evolution in the Heilongdong Spring Basin, North China. J. Geochem. Explor. 2019, 205, 106352. [Google Scholar] [CrossRef]
  89. Böhlke, J.K. Groundwater recharge and agricultural contamination. Hydrogeol. J. 2002, 10, 153–179. [Google Scholar] [CrossRef]
  90. Rawat, M.; Sen, R.; Onyekwelu, I.; Wiederstein, T.; Sharda, V. Modeling of Groundwater Nitrate Contamination Due to Agricultural Activities—A Systematic Review. Water 2022, 14, 4008. [Google Scholar] [CrossRef]
  91. Lawniczak, A.E.; Sokołowska, K.; Dębska, B. Impact of Agriculture and Land Use on Nitrate Contamination of Groundwater and Surface Water in a Protected Area. Environ. Monit. Assess. 2016, 188, 172. [Google Scholar] [CrossRef]
  92. Islam, A.R.M.T.; Pal, S.C.; Chowdhuri, I.; Salam, R.; Islam, M.S.; Rahman, M.M.; Zahid, A.; Idris, A.M. Application of novel framework approach for prediction of nitrate concentration susceptibility in coastal multi-aquifers, Bangladesh. Sci. Total Environ. 2021, 801, 149811. [Google Scholar] [CrossRef] [PubMed]
  93. Rosillon, F.; Savadogo, B.; Kabore, A.; Bado-Sama, H.; Dianou, D. Attempts to Answer on the Origin of the High Nitrates Concentrations in Groundwaters of the Sourou Valley in Burkina Faso. J. Water Resour. Prot. 2012, 4, 663–673. [Google Scholar] [CrossRef]
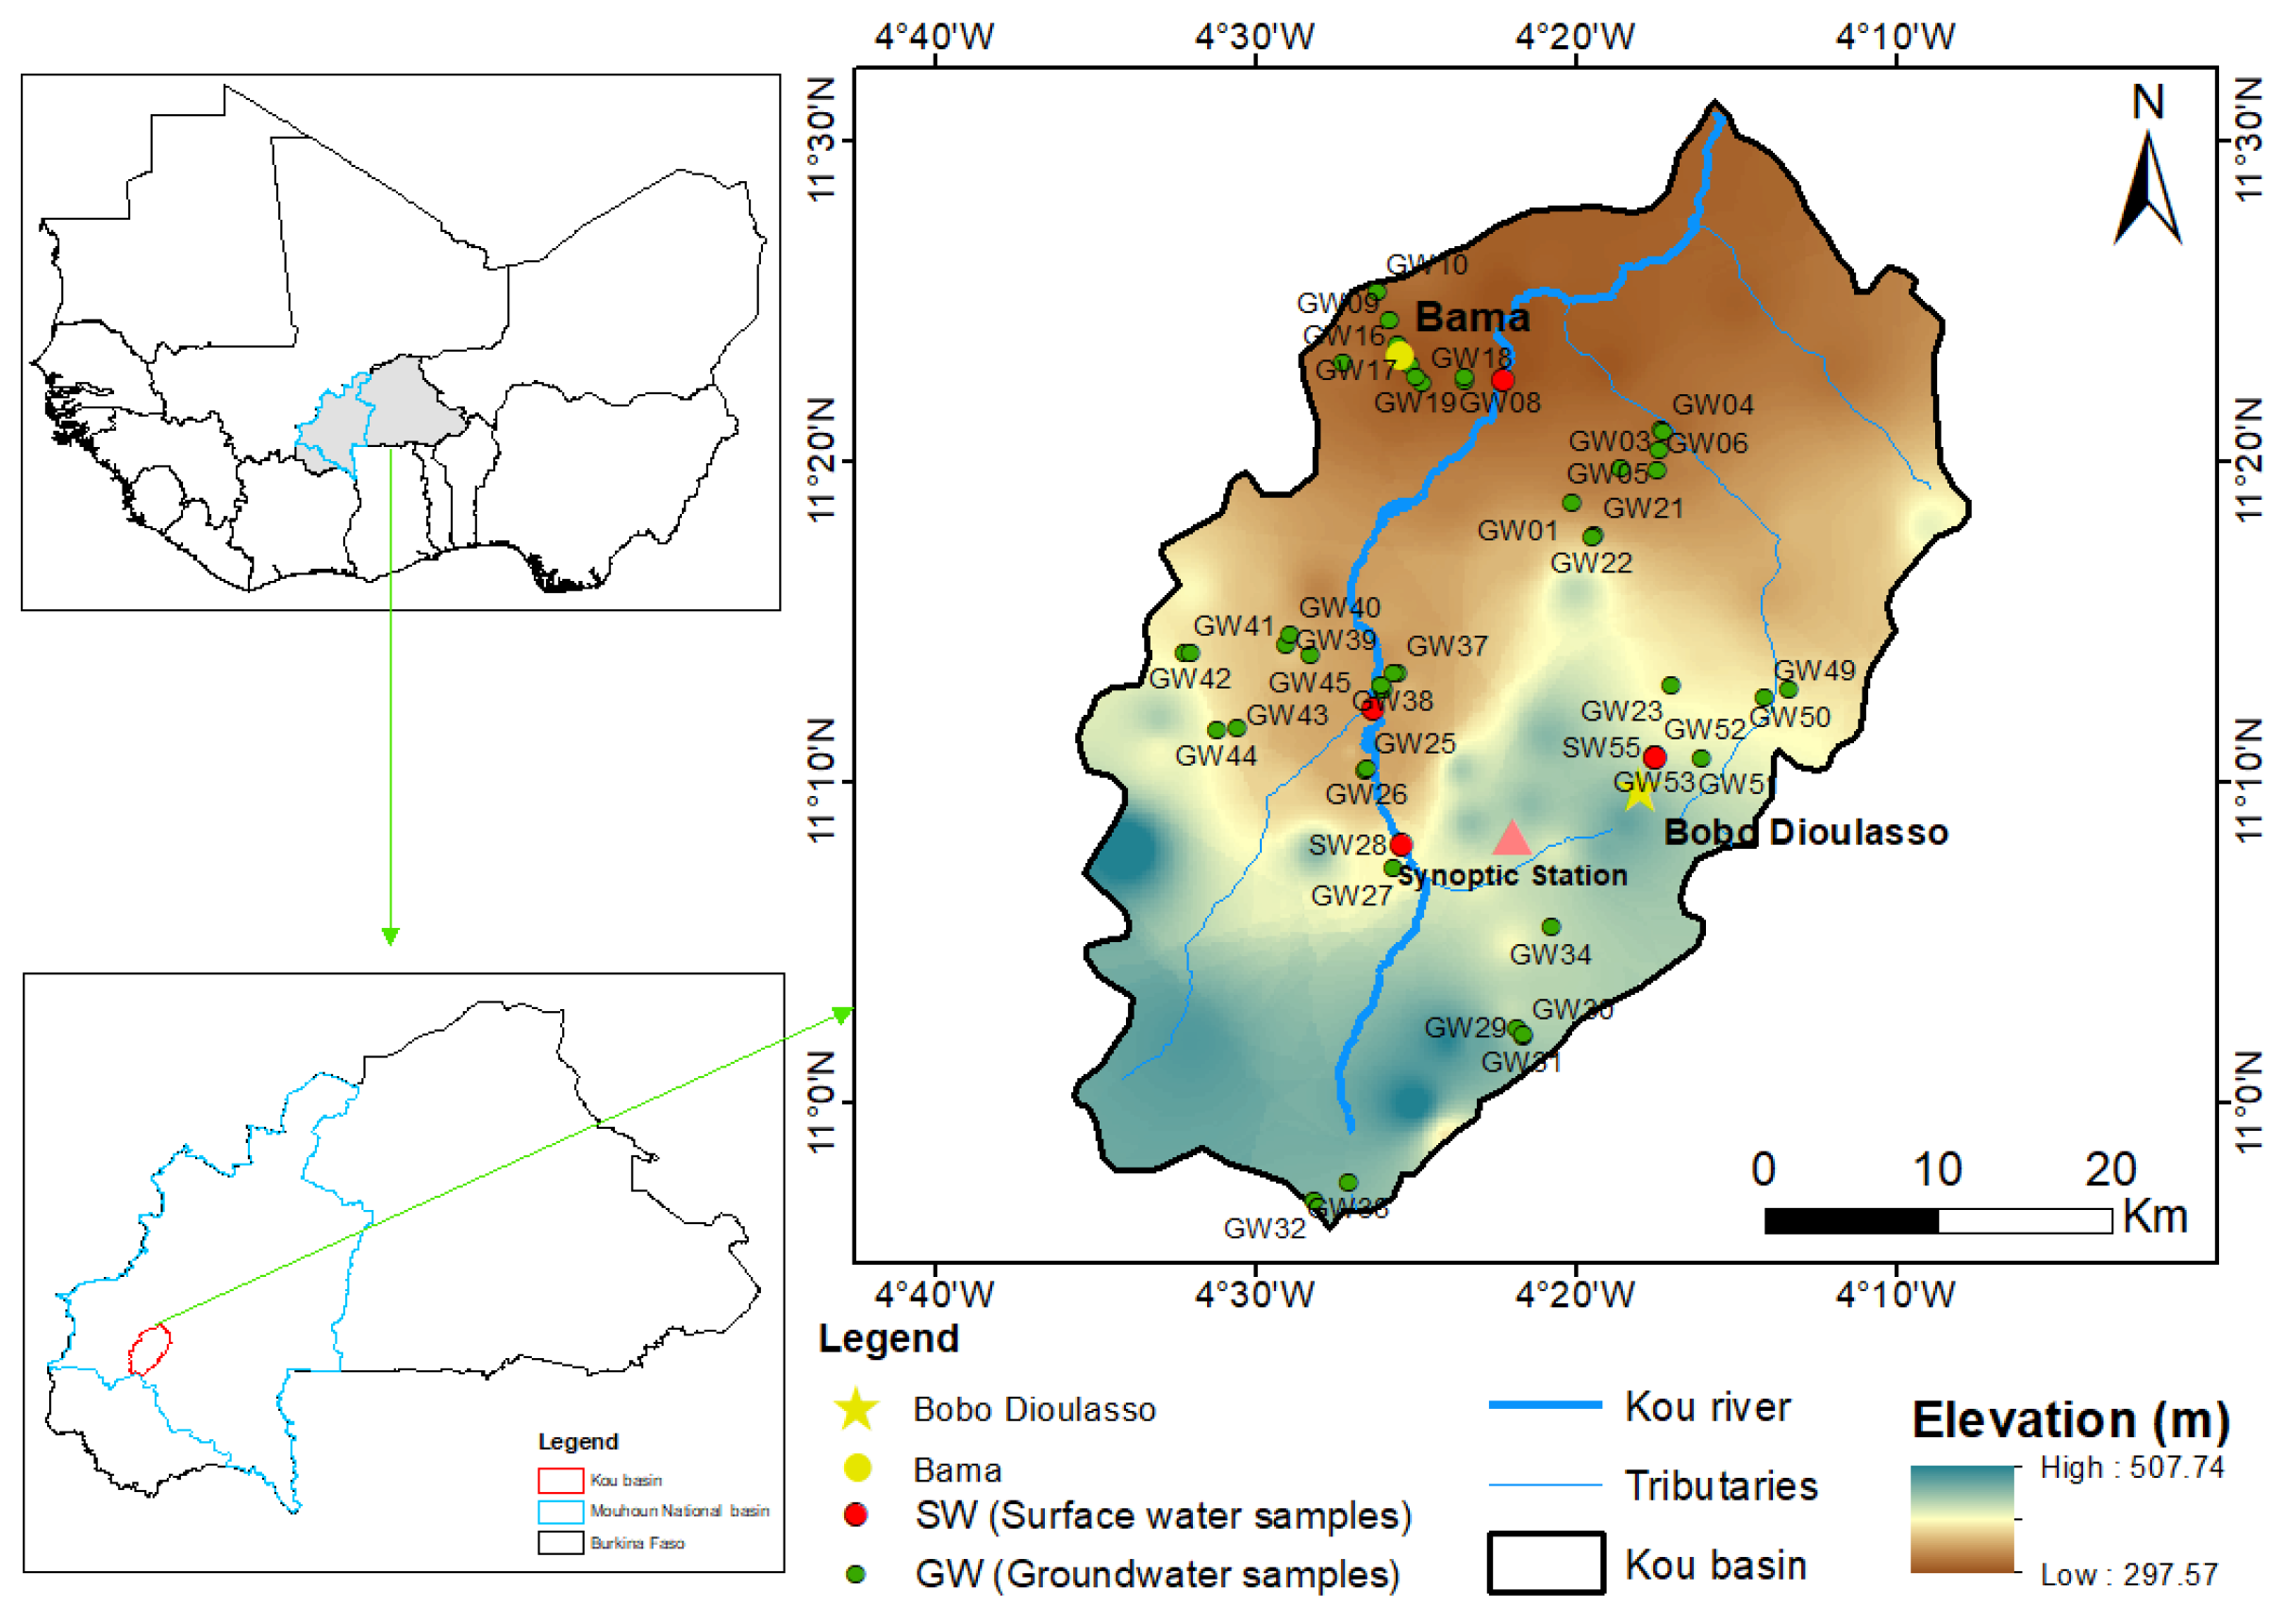
Figure 1. A topographic map showing the distribution of the water sampling. The pink triangle indicates the location of the regional weather station.
Water 17 02756 g001
Figure 2. Annual precipitation from 1981–2016.
Water 17 02756 g002
Figure 3. Geologic map in Kou basin.
Water 17 02756 g003
Figure 4. Synthetic geological section of the Bobo-Dioulasso area (Source). Hydrogeological units are referred to by their abbreviated names (see text in Section 2.1.3).
Water 17 02756 g004
Figure 5. Contour map of the groundwater depth in the study area.
Water 17 02756 g005
Figure 6. Box plots displaying the four physical–chemical parameters of groundwater from Kou basin according to main lithostratigraphy contexts (GFG: Fine glauconitic sandstones; GGQ: Sandstones with quartz granules; SAC1: Siltstones–claystones–carbonates).
Water 17 02756 g006
Figure 7. Piper diagram illustrates the groundwater types in relation to main lithology of aquifers.
Water 17 02756 g007
Figure 9. d-excess and δ18O isotope bivariate plot.
Water 17 02756 g009
Figure 10. Spatial variation (A) δ18O, (B) δ2H and (C) d-excess in the groundwater in Kou basin.
Water 17 02756 g010
Figure 11. Relation between d-excess and EC values for groundwater and surface water.
Water 17 02756 g011
Figure 12. Comparison of δ18O variation with depth to groundwater in relation to the main lithological formations.
Water 17 02756 g012
Figure 13. Land-use type and spatial distribution of NO3 concentration in the study.
Water 17 02756 g013
Figure 14. (a) Box plots displaying nitrate parameters according to the main Land contexts and groundwater typology. (b) Box plots displaying nitrate parameters according to the main Land contexts and groundwater typology.
Water 17 02756 g014
Table 1. Main hydrogeological characteristics of the SBTA (after [47] cited by [14]).
Unita Number of Boreholeb Depth (m)Mean Yield (m3/h)Mean Specific Yield (m3/h/m)T (10−4 m2/s)K (10−6 m/s)
GI21755.10.60.50.2
GKS69485.10.42.71.2
GFG166809.10.52.80.5
GGQ2716213.01.08.53.0
SAC11796613.41.44.92.2
GFR58626.81.31.71.7
Notes: a The number of boreholes refers to the listing made Gombert [47] over the territory of Burkina Faso only. b Average depth of the boreholes.
Table 2. Descriptive statistics of hydrochemical parameters and isotope composition in water.
Temp (°C)pH (-)EC
(μS/cm)
Turb
(NTU)
DOTDSHCO3FClNO2BrNO3SO42−Li+Na+NH4+K+Mg2+Ca2+δ18O
(‰)
δ2H (‰)d-Excess (‰)
Groundwater (n = 43)
Mean29.85.6178.36.74.8178.366.80.16.80.10.319.11.20.08.50.53.96.012.8−29.7−5.010.4
CV×1005.720.6130.5299.619.1130.5147.175.5283.516.217.4258.3208.469.4192.2309.0112.5148.2140.3−8.0−7.29.0
SD1.71.1232.819.90.9232.898.30.119.30.00.049.32.40.016.41.44.48.917.92.40.40.9
Minimum22.63.288.00.013.248.00.00.10.10.10.30.10.10.00.80.10.10.00.1−34.6−5.98.3
Maximum32.97.531080.0126.16.61080.0309.40.3113.00.10.5222.911.00.081.76.718.333.465.5−25.1−4.412.9
Surface water (n = 5)
Mean30.26.4447.8217.45.3447.883.30.137.20.10.315.516.00.035.20.29.23.814.9−31.4−5.411.8
CV×10010.910.6149.9164.738.9149.977.139.5158.70.00.0165.3173.50.0175.6107.886.048.5108.2−11.7−7.511.2
SD3.30.7671.2358.12.0671.264.20.059.10.00.025.727.80.061.80.27.91.916.13.70.41.3
Minimum285.555.22.12.655.028.40.10.60.10.30.00.10.01.60.12.61.65.2−37.7−6.010.1
Maximum367.11616.0843.96.91616.0162.10.1137.60.10.359.264.70.0144.10.518.95.843.1−29.2−5.113.7
WHO
Standards
-6.5–8.5100055–710003500.7–1.72500.20.1502001200412150200---
Table 3. Correlation matrix between physico-chemical parameters in groundwater.
TemppHECTurbDOTDSHCO3FClNO2BrNO3SO42−Li+Na+NH4+K+Mg2+Ca2+
Temp1
pH−0.161.00
EC0.060.351.00
Turb0.090.06−0.081.00
DO0.10−0.39−0.540.171.00
TDS0.060.351.00−0.08−0.541.00
HCO30.040.700.57−0.06−0.370.571.00
F0.240.050.28−0.04−0.090.280.261.00
Cl−0.01−0.010.75−0.05−0.380.75−0.05−0.021.00
NO20.29−0.12−0.12−0.030.14−0.12−0.11−0.07−0.061
Br−0.11−0.070.10−0.03−0.150.10−0.10−0.070.24−0.031.00
NO30.09−0.200.71−0.04−0.330.71−0.150.250.86−0.060.161.00
SO42−−0.160.250.59−0.12−0.460.590.29−0.060.58−0.080.640.381.00
Li+0.200.100.200.010.120.200.290.71−0.05−0.04−0.040.08−0.091.00
Na+0.110.190.70−0.08−0.360.700.270.120.69−0.080.110.590.58−0.051.00
NH4+−0.12−0.010.51−0.05−0.310.51−0.09−0.070.78−0.050.680.560.70−0.020.381.00
K+−0.150.140.53−0.10−0.340.530.030.230.53−0.130.260.610.310.120.250.571.00
Mg2+0.060.570.62−0.04−0.360.620.890.390.01−0.10−0.050.040.210.430.070.000.211.00
Ca2+0.080.470.92−0.08−0.540.920.750.230.54−0.12−0.040.470.540.180.570.300.310.741
Note: underline in the table footer: correlations (R > 0.39).
Table 4. Stable isotope compositions of GW-SW in the study area.
Sample Nameδ2H (‰)δ18O (‰)d-Excess (‰)
SW20−37.65−5.9610.06
GW13−34.62−5.9312.88
GW25−34.04−5.7712.15
SW28−31.75−5.6813.74
GW21−32.78−5.6012.07
GW38−34.37−5.5710.24
GW22−32.24−5.4811.61
GW45−33.34−5.4310.14
GW19−32.63−5.4210.74
GW04−32.62−5.3610.26
GW42−32.19−5.3610.69
GW35−31.09−5.2310.82
GW36−32.39−5.239.51
GW16−30.46−5.2011.16
SW54−29.20−5.1411.96
SW24−29.27−5.1011.55
GW37−30.94−5.099.82
SW55−29.15−5.0911.57
GW32−30.50−5.0710.11
GW23−29.03−5.0611.52
GW26−29.90−5.0510.57
GW51−29.54−5.0510.90
GW33−29.59−5.0510.84
GW44−30.48−5.049.84
GW50−28.58−4.9811.30
GW01−29.79−4.979.96
GW49−29.39−4.9610.32
GW43−29.05−4.9110.27
GW34−29.18−4.9110.10
GW10−28.15−4.9011.08
GW31−28.25−4.8910.86
GW41−29.40−4.879.61
GW06−28.26−4.8610.66
GW52−28.07−4.8510.76
GW17−29.60−4.839.06
GW29−28.34−4.8310.31
GW05−27.15−4.7210.60
GW08−28.95−4.718.77
GW02−27.70−4.709.91
GW30−27.44−4.6910.08
GW07−28.05−4.669.23
GW09−27.23−4.649.88
GW27−27.58−4.639.50
GW39−28.28−4.568.25
GW40−27.54−4.538.70
GW03−25.05−4.5010.97
GW18−25.92−4.419.37
GW53−25.36−4.399.78
Disclaimer/Publisher’s Note: The statements, opinions and data contained in all publications are solely those of the individual author(s) and contributor(s) and not of MDPI and/or the editor(s). MDPI and/or the editor(s) disclaim responsibility for any injury to people or property resulting from any ideas, methods, instructions or products referred to in the content.