Article

Resilient Strategies for Disaster Prevention and Ecological Restoration of River and Lake Benggang and Bank Erosion

College of Hydraulic & Environmental Engineering, China Three Gorges University, Yichang 443005, China
*
Author to whom correspondence should be addressed.
Water 2025, 17(18), 2744; https://doi.org/10.3390/w17182744
Submission received: 7 April 2025 / Revised: 3 September 2025 / Accepted: 10 September 2025 / Published: 17 September 2025
(This article belongs to the Special Issue Protection and Restoration of Lake and Water Reservoir)

Abstract

The research on river and lake resilience management, ecological restoration, and disaster reduction technologies aims to comprehensively improve the health, stability, and sustainability of aquatic ecosystems. It seeks to reduce the natural disaster risk, promote the sustainable use of water resources, protect biodiversity, strengthen water ecological environment supervision, and advance the widespread practice of the green development concept. This study integrates remote sensing, geographic information system (GIS), and biological slope protection technologies, supported by investigation and geomorphological surveys, to achieve real-time monitoring and data analysis of river and lake ecosystems. Additionally, the application of innovative ecological restoration materials and technologies significantly improves restoration outcomes and operational efficiency. The construction of multi-level wetlands, combined with active community participation, further enhances ecological resilience and stability. Experimental results show that the river and lake resilience management structure increases the strength of slope protection by more than 1.5 times and improves the overall stability by more than 25%. These findings underscore the critical role of integrated ecological and engineering approaches in achieving sustainable development of river and lake ecosystems while effectively reducing the risks of natural disasters.

1. Introduction

The combined pressures of global climate change and rapid urbanization have significantly intensified the vulnerability of river and lake ecosystems [1,2]. These aquatic systems, which serve as critical components of regional water cycles and biodiversity reservoirs, are increasingly disrupted by extreme hydrological events such as floods, droughts, and bank collapses [3]. Of particular concern is Benggang, a distinctive and severe type of soil erosion predominantly occurring in the red-soil hilly regions of southern China [4]. Characterized by its steep, fragmented gully formations and intense sediment yields, Benggang erosion poses serious threats to riverbank stability, sediment transport regimes, and downstream aquatic habitats [5]. To address these challenges, there is an urgent need to implement resilient disaster prevention strategies and advanced ecological restoration techniques.
In addition, long-standing human interventions have led to significant degradation of water quality and declines in aquatic biodiversity [6]. Biodiversity is a cornerstone of ecosystem resilience, and its decline compromises the ability of ecosystems to adapt to changing conditions [7]. Therefore, the adoption of advanced ecological engineering solutions is crucial for restoring ecological integrity and water quality [8].
In this context, comprehensive monitoring and assessment systems must be established to track ecological health, diagnose emerging risks, and ensure that restoration efforts meet targeted goals. Embedding these strategies within the broader framework of green development fosters a sustainable coexistence between human society and natural ecosystems. The integration of resilient disaster mitigation, ecological restoration, and sustainability principles aligns with national and international objectives for ecological civilization and sustainable water resource management.
River and lake ecosystems are important providers of ecological functions and services [9,10]. However, these systems are increasingly stressed by climate variability, anthropogenic pressures, and geomorphological degradation [11,12]. Previous studies have explored various aspects of these systems, including the network-level perspective on lake biodiversity under global change [13], the microbial roles in pollution degradation in lake and river ecosystems [14], the metabolic and carbon biogeochemical processes of river ecosystems [15], and water quality assessment under anthropogenic stress [16,17]. However, these studies often lacked practical restoration strategies and long-term monitoring frameworks. Collectively, these studies provide valuable data and methodological frameworks but seldom incorporate resilient disaster prevention or ecological restoration strategies [18,19,20,21]. Moreover, unique erosion processes, such as Benggang, are not explicitly addressed in the international literature, despite their significant ecological and hydrological impacts. Recent engineering efforts, including bioengineering methods [22], vegetation–concrete integration [23], and geosynthetic slope stabilization [24,25,26], have improved erosion resistance but still lack integration with real-time monitoring and adaptive disaster prevention strategies. Despite these advances, gaps remain in integrating these technologies with real-time monitoring systems, disaster risk modeling, and adaptive management frameworks. In summary, while prior work offers foundational knowledge on ecosystem dynamics and restoration methods, few studies holistically address the combined challenges of disaster prevention and ecological restoration in the context of erosion-prone river–lake systems. This paper aims to fill that gap by proposing integrated, resilient strategies tailored to the complex geomorphological and ecological settings of southern China’s Benggang landscapes.
This paper aims to explore and propose comprehensive strategies for resilient disaster prevention and ecological restoration in river and lake systems affected by Benggang and bank erosion. The focus is on strengthening system-wide ecological integrity and functional resilience through multi-scale, ecosystem-based management practices. The work contributes to the field by integrating hydrological engineering with ecological design to achieve long-term sustainability and disaster risk reduction.

2. Methods

2.1. Study Design and Framework Overview

This study adopts an integrated, multi-tiered methodology for enhancing the ecological resilience of rivers and lakes, evaluating natural disaster risks, and promoting sustainable water resource management. The research is structured into five methodological components: (1) ecological resilience assessment, (2) natural disaster risk evaluation, (3) ecosystem health and restoration, (4) sustainable resource utilization, and (5) biodiversity monitoring and improvement. All procedures employ quantitative modeling, spatial analysis via geographic information system (GIS), and standardized ecological indices to ensure rigorous evaluation and replicability.

2.2. Ecological Resilience Assessment

Ecological resilience refers to the ability of an ecosystem to recover quickly and maintain a stable state in the face of external disturbances such as natural disasters and environmental changes [27,28]. Figure 1 outlines a comprehensive strategy for improving the resilience and ecological functionality of river and lake systems.
The process begins with a hydrologic investigation and geomorphological survey of the river channel. GIS tools were used to construct flow regime and sediment transport maps [29,30]. Based on this, hydraulic performance was evaluated using the discharge equation:
Q = S A · v
where
Q is the river discharge (m3/s), SA is the cross-sectional area of the river (m2), and
v is the flow velocity (m/s).
Real-time hydrological tracking was achieved through water level gauges placed at critical nodes. A basin-scale scheduling model adjusted reservoir releases to ensure ecological flow continuity and flood resilience. For slope protection, native vegetation was planted to enhance root–soil binding. Vegetation coverage rate C is calculated as follows:
C = N T × 100 %
where
N is the number of vegetation units planted,
T is the total plantable area (m2). Biological slope-protection technologies utilize ecological bags and geotextiles to integrate root systems into slope structure [31,32]. The scouring resistance efficiency E is expressed as follows:
E = ( v f v i ) D
where
vf is the flow velocity on the slope surface,
vi is the initial flow velocity before entering the structure,
D is the characteristic dimension of the protective medium.
On the basis of the original wetland, multi-level wetland structures are constructed to improve filtration and biodiversity. The hydrological optimization model for flow path W is given by the following:
W = i = 1 n ( A i · H i )
where
Ai is the cross-sectional area at level i,
Hi is the vertical height between wetland layers.

2.3. Disaster Risk Evaluation

To evaluate natural disaster risks, spatial and hydrological analyses were performed using GIS and the HEC-HMS (Hydrologic Engineering Center’s Hydrologic Modeling System) models [33,34]. This model enables the prediction of flood discharges and water level fluctuations across different meteorological scenarios, offering a scientific basis for emergency planning and infrastructure design. The impact of soil type, moisture, and vegetation coverage on soil stability is evaluated, as shown in the following formula:
τ = c + γ · t a n ( φ )
where
τ is the shear strength of the soil,
c is soil cohesion (kPa),
γ is the effective normal stress (kPa), and
φ is the internal friction angle (degrees).
Risk hotspots were evaluated through the risk matrix, and the frequency and intensity of disasters are analyzed in combination with historical data [35,36]. The composite risk value R was computed as follows:
R = Z p · Q I
R represents the overall risk value,
Zp is the probability of disaster occurrence, and
Q is the estimated potential impact.
Wetland restoration projects are implemented as a nature-based solution for flood attenuation and water purification. In the watershed, large-scale afforestation activities are undertaken to increase forest coverage. Additionally, soil and water conservation facilities, such as terraces and ditches, are set up on the slopes to reduce surface runoff and improve the soil’s water retention capacity (Figure 2).

2.4. River and Lake Ecosystems Restoration

Water quality indicators, including chemical oxygen demand (COD), ammonia nitrogen, and total phosphorus [37,38], were monitored to diagnose pollution severity. Artificial wetlands adjacent to degraded water bodies harness the natural purification capacity of wetland ecosystems.
To rehabilitate aquatic life, suitable native fish and aquatic plants are reintroduced. Artificial breeding technology is used to improve the seedling survival rate and adaptability. The population increase rate (IR) was evaluated as follows:
I R = N t N o N o × 100 %
where
IR is the population increase rate,
Nt is the population size at time, and
No is the initial population size.
Habitat heterogeneity was improved by submerged woody debris, boulders, and artificial reef-like structures promote shelter. Community vegetation restoration methods are utilized to enhance the self-regulation capacity of the ecosystem through the establishment of vegetation communities. Restoration effectiveness was measured using an ecological health index ( E H I ). This composite index incorporates water quality, biodiversity, and vegetation coverage, and is expressed as follows [39]:
E H I = w 1 · δ + w 2 · + w 3 · C
where
δ is the water quality score,
∂ is the biodiversity index,
C is the vegetation coverage ratio, and
w1, w2, w3 are the respective weights assigned to each factor.

2.5. Sustainable Water Resources Utilization

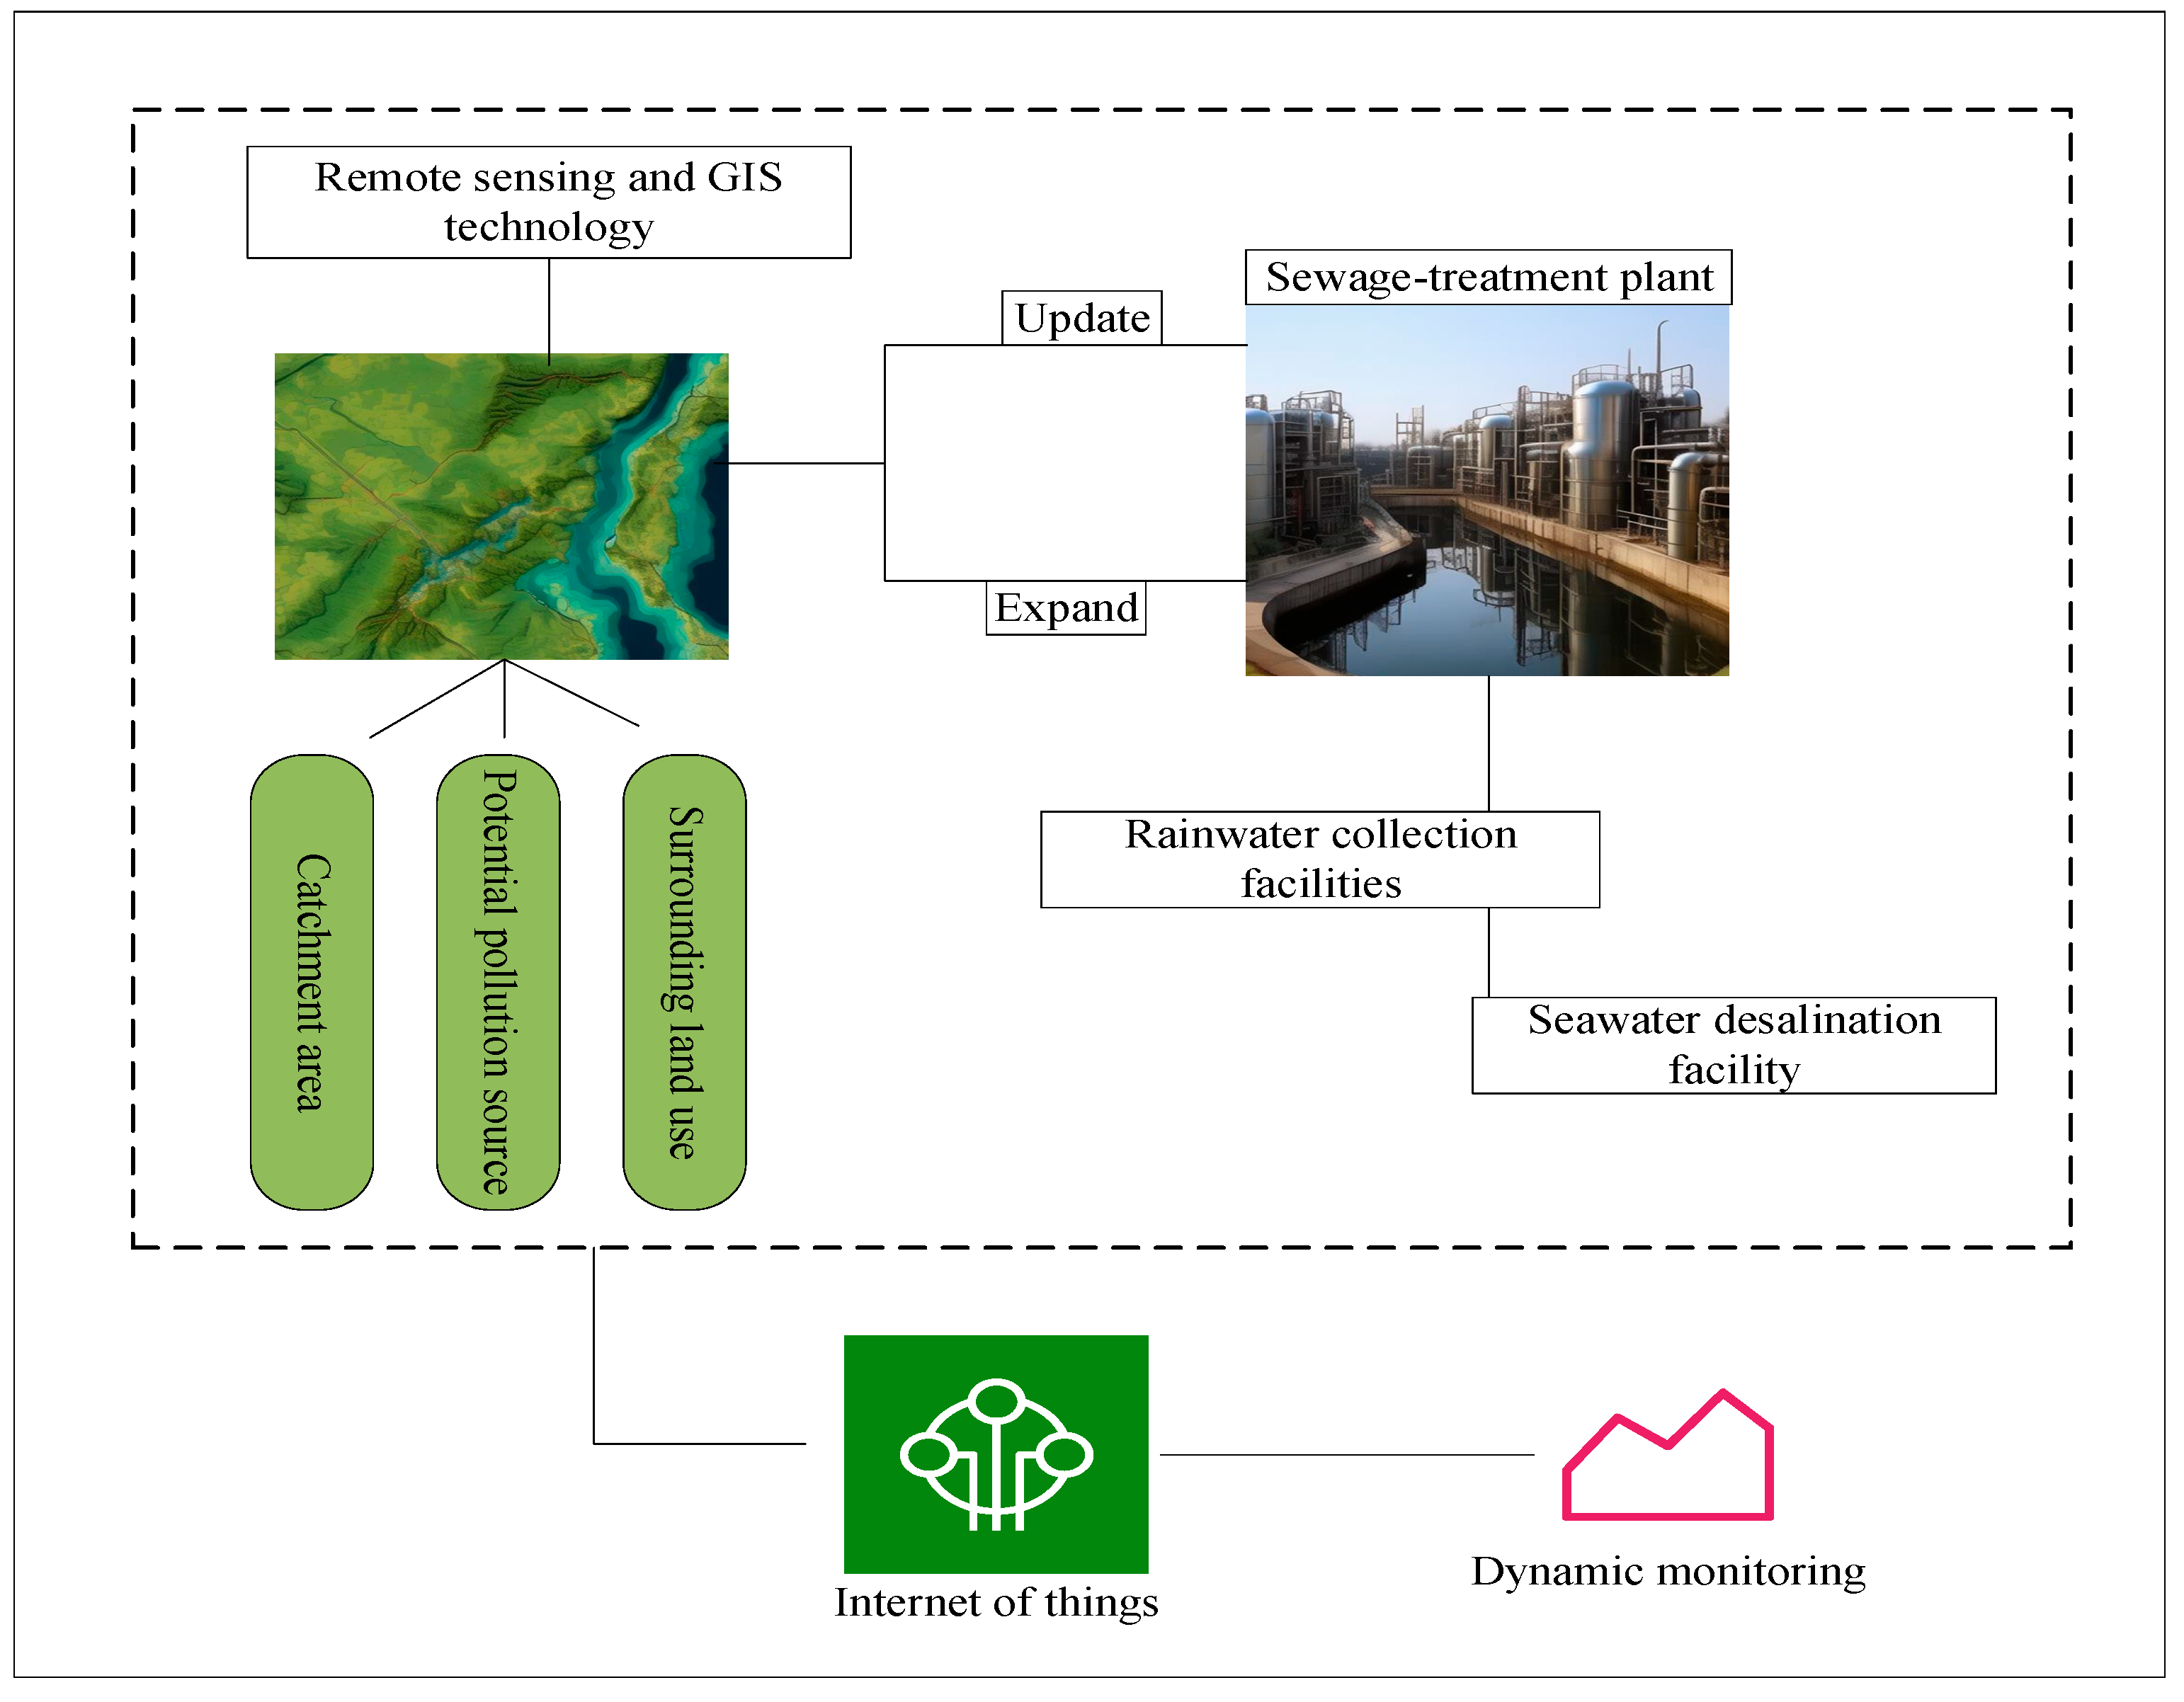
The framework for promoting sustainable use of water resources is shown in Figure 3. Remote sensing and GIS technologies [40,41] are utilized to assess catchment boundaries, land use patterns, and potential pollution sources surrounding key water bodies. The demarcation of the protected area is based on the following formula:
J = ( x 1 x 2 ) 2 + ( y 1 y 2 ) 2
where
(x1, y1) are the coordinates of the water source,
(x2, y2) are the coordinates of a pollution source, and
J is the Euclidean distance between the two points.
The sewage-treatment plants are modernized with advanced technologies such as membrane bioreactors [42,43] and biological filters, achieving post-treatment COD concentrations below 50 mg/L. Rainwater collection facilities are built in urban and rural areas, with a targeted collection efficiency target of 30% [44,45]. An Internet of Things (IoT)-based monitoring system tracks real-time changes in water availability, quality, and usage. The data analysis formula is as follows:
μ = 1 N i = 1 N x i σ = 1 N i = 1 N ( x i μ ) 2
where
μ is the mean value of water resource availability,
σ is the standard deviation (fluctuation),
xi is the water data at each observation point, and
N is the total number of observations.

2.6. Biodiversity Evaluation and Habitat Restoration

Ecological hotspots were identified through spatial analysis. The vegetation structure is designed to be multi-leveled, and the Shannon’s diversity index H is used to assess the diversity of different plant species [46]:
H = i = 1 S p i ln p i
where
H′ is the Shannon Index,
S is the total number of plant species, and
pi is the proportion of the ith species.
Wetland systems incorporated sedimentation tanks and vegetative belts to intercept runoff pollutants. The extensive root systems stabilize sediments, absorb nutrients, and enhance microbial degradation of contaminants. For severely polluted water bodies, activated carbon and microbial preparations are introduced to accelerate pollutant adsorption and biodegradation. The method of gradual restoration is adopted, and planting is implemented in stages. Quadrat surveys are routinely conducted to evaluate vegetation coverage and diversity indicators to ensure that the vegetation restoration effect meets expectations.

3. Results

3.1. Slope Protection Strength and Overall Stability

Two adjacent areas are selected on a typical river bank slope. Area A is the experimental area, where river and lake resilience management structures were implemented. Area B is the control area, where the existing conditions were preserved without intervention. The slope protection structure was designed to form a semi-enclosed and vegetation-integrated cover, enhancing surface resistance to erosion, increasing shear strength, and promoting long-term slope stability.
After implementation, the slope protection strength test is carried out once a month and continuously monitored for 12 months using a portable soil shear tester. For both Area A and Area B, five fixed sampling points are set on the slopes, and the depth of 10 cm below the slope surface was tested. Five shear tests were carried out at each sampling point, and the average shear strength values at each time were calculated and used as the slope protection strength index.
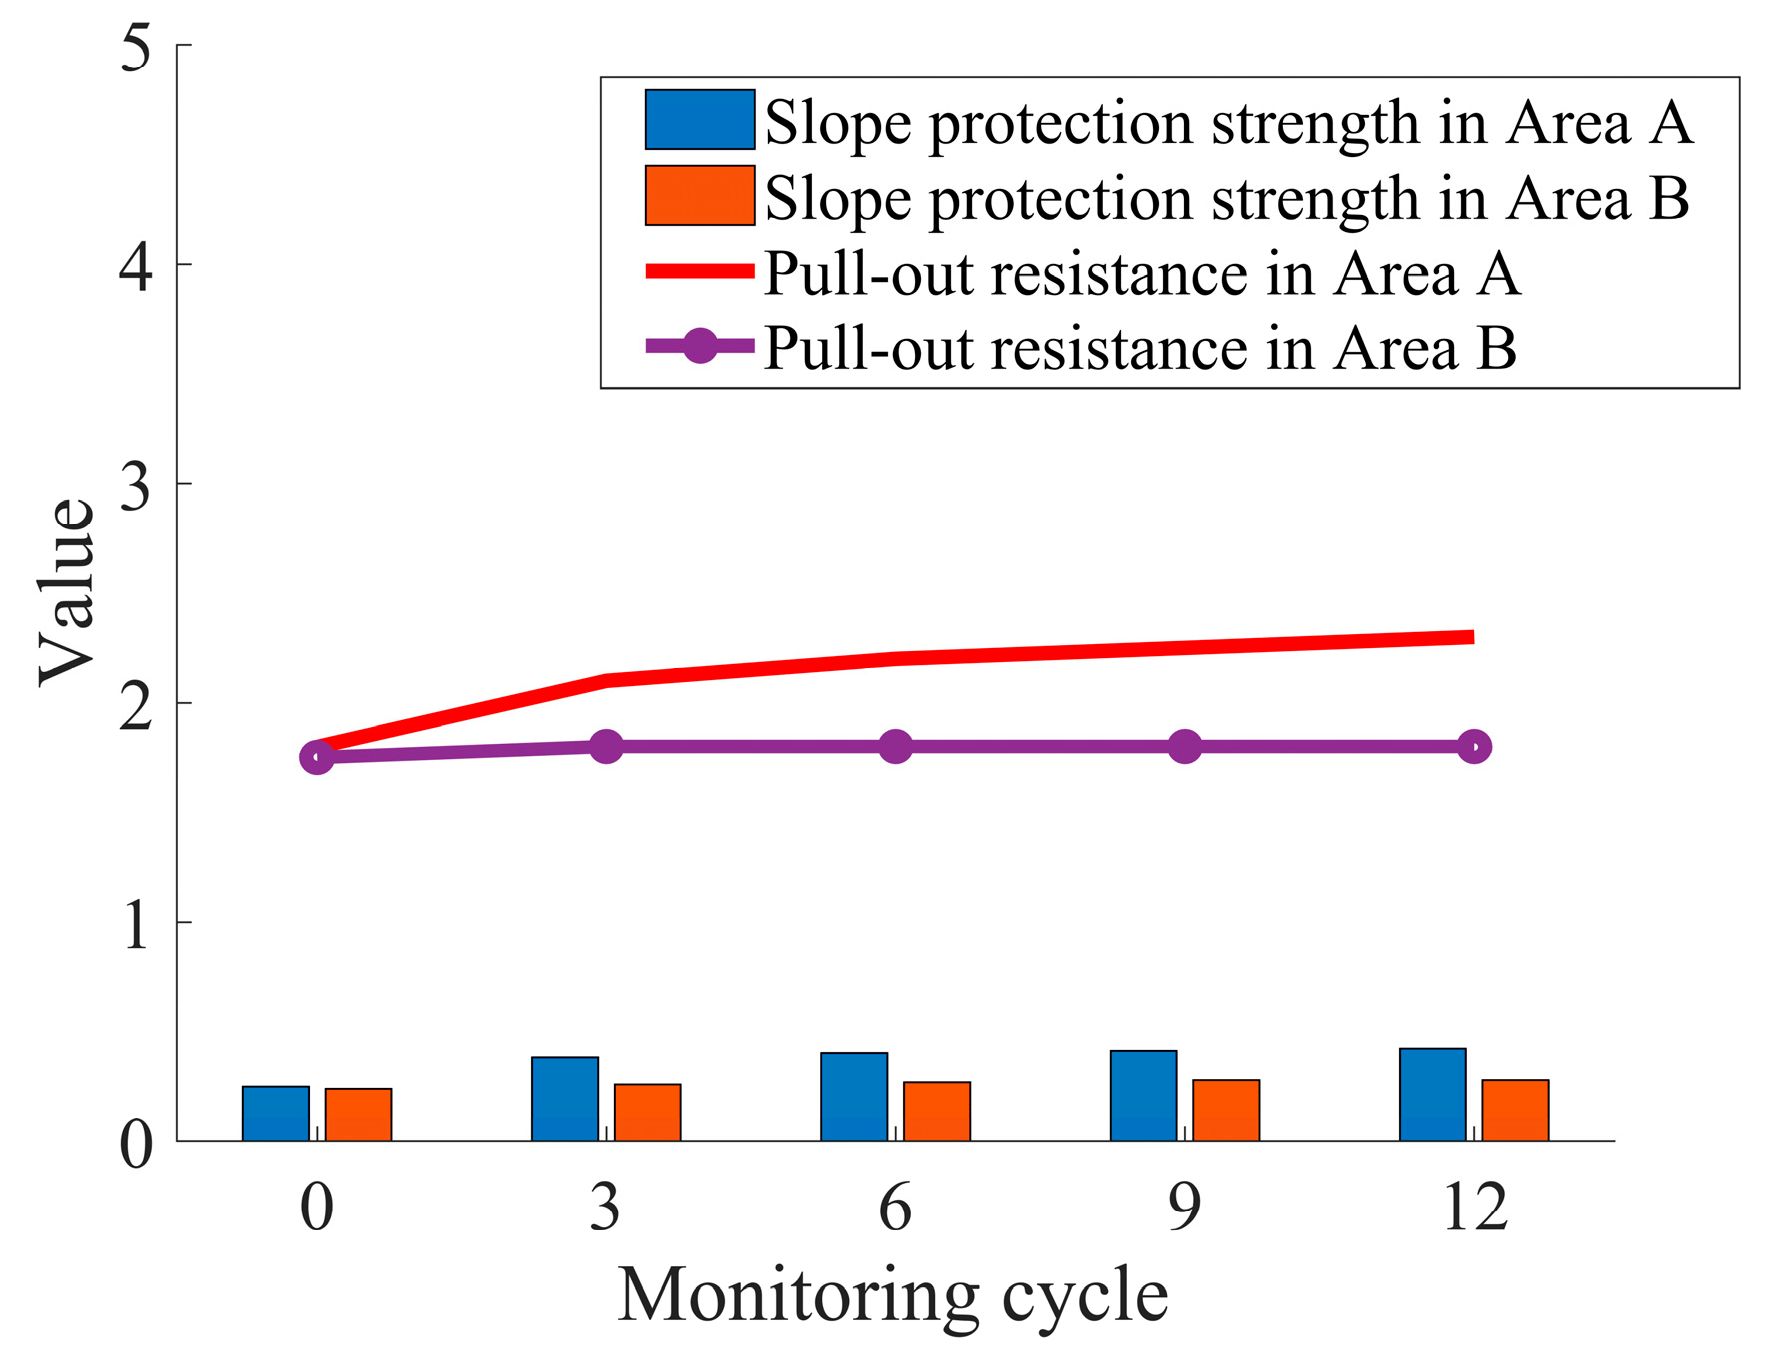
At the 3rd, 6th, 9th, and 12th months post-management, the slope pull-out stability tests were conducted to assess the resistance of the slope to hydraulic disturbances. Pull-out devices are installed at each sampling point. Gradual loading was applied until slope displacement occurred. The critical pull-out force was recorded at each point. The mean pull-out resistance from the five points was used to represent the overall slope stability index. Figure 4 shows the significant performance differences between Area A and Area B over the one-year monitoring period.
At month 0 (before management), both areas exhibited similar baseline values for shear strength and pull-out resistance. The slope protection strength in Area A increases to 0.42 MPa, which is more than 1.5 times over baseline. The overall stability (pull-out resistance force) increases by more than 25%. In Area B, both indicators remained relatively unchanged, confirming the absence of natural improvement in untreated slopes.

3.2. Anti-Erosion and Anti-Scouring Capabilities

The experiment focused on the anti-erosion performance of an ecological restoration substrate, a composite material designed to enhance surface stability and resistance to hydraulic forces. The substrate used in Area A consisted of a plant root reinforcement soil composite, combining local wetland soils characteristic of typical river and lake environments and natural plant seeds with root-binding capacity and local ecological adaptability. The selected substrate in Area A is mixed in proportion and laid at a thickness of 5 cm over the soil surface of the test platform. The substrate was watered and maintained for 7 days to promote initial consolidation and germination. It was naturally soaked for 48 h to allow the substrate–soil interface to stabilize, simulating pre-rainfall conditions in natural settings. A controlled artificial rainfall device was used to replicate heavy rain conditions with an intensity of 80 mm/h, a duration for 30 min, and a simulated surface water flow rate at 1.5 m/s. The runoff was directed across the experimental platform surface, mimicking intense precipitation-induced erosion and scouring typically observed during storm events. After the rainfall simulation, the mass loss of the sample surface was measured to evaluate erosion. The erosion modulus was then calculated to quantify the material’s resistance to detachment and transport. In parallel, Area B, which lacked the ecological restoration substrate, was subjected to the same experimental conditions.
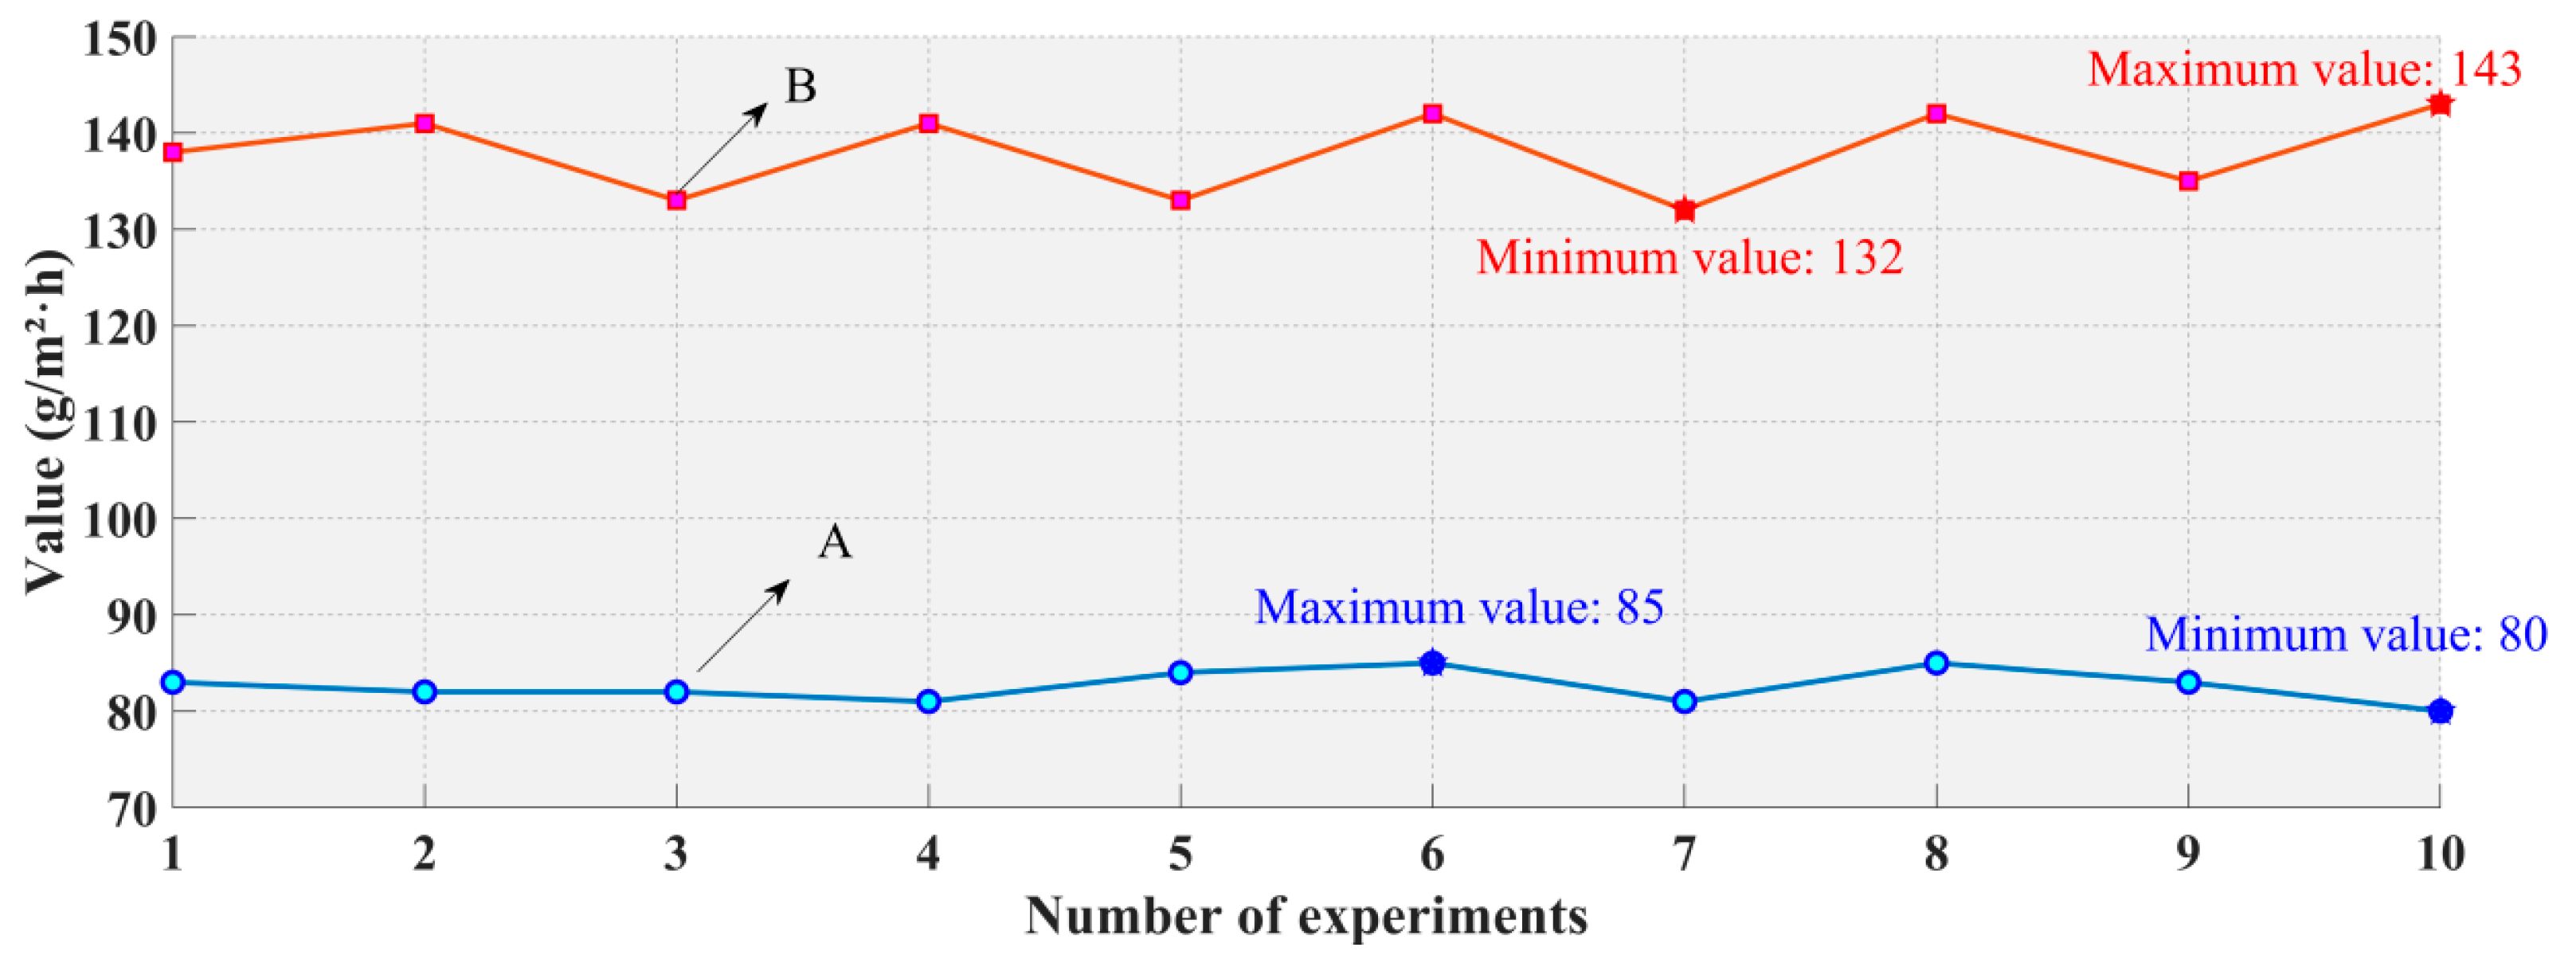
Ten repeated trials were conducted in both areas to ensure statistical reliability. The erosion modulus values from all trials were averaged, and the comparative results are presented in Figure 5. Figure 5 illustrates the erosion modulus of the ecological restoration substrate in the river and lake resilience management structure system method under simulated heavy rainfall conditions (80 mm/h for 30 min). The results show that the erosion modulus in Area A remains below 100 g/m2·h, indicating excellent anti-erosion and anti-scouring performance.
The mass loss and surface scouring performance in Area A and Area B in these 10 experiments are shown in Table 1. In Table 1, during the heavy rain, the substrate in Area A did not show obvious soil loss or cracks on its surface, and the surface structure remained stable. In contrast, the surface in Area B shows obvious shedding and soil loss, resulting in a significant reduction in the surface deposition of the substrate.

3.3. Frost Resistance Durability Assessment

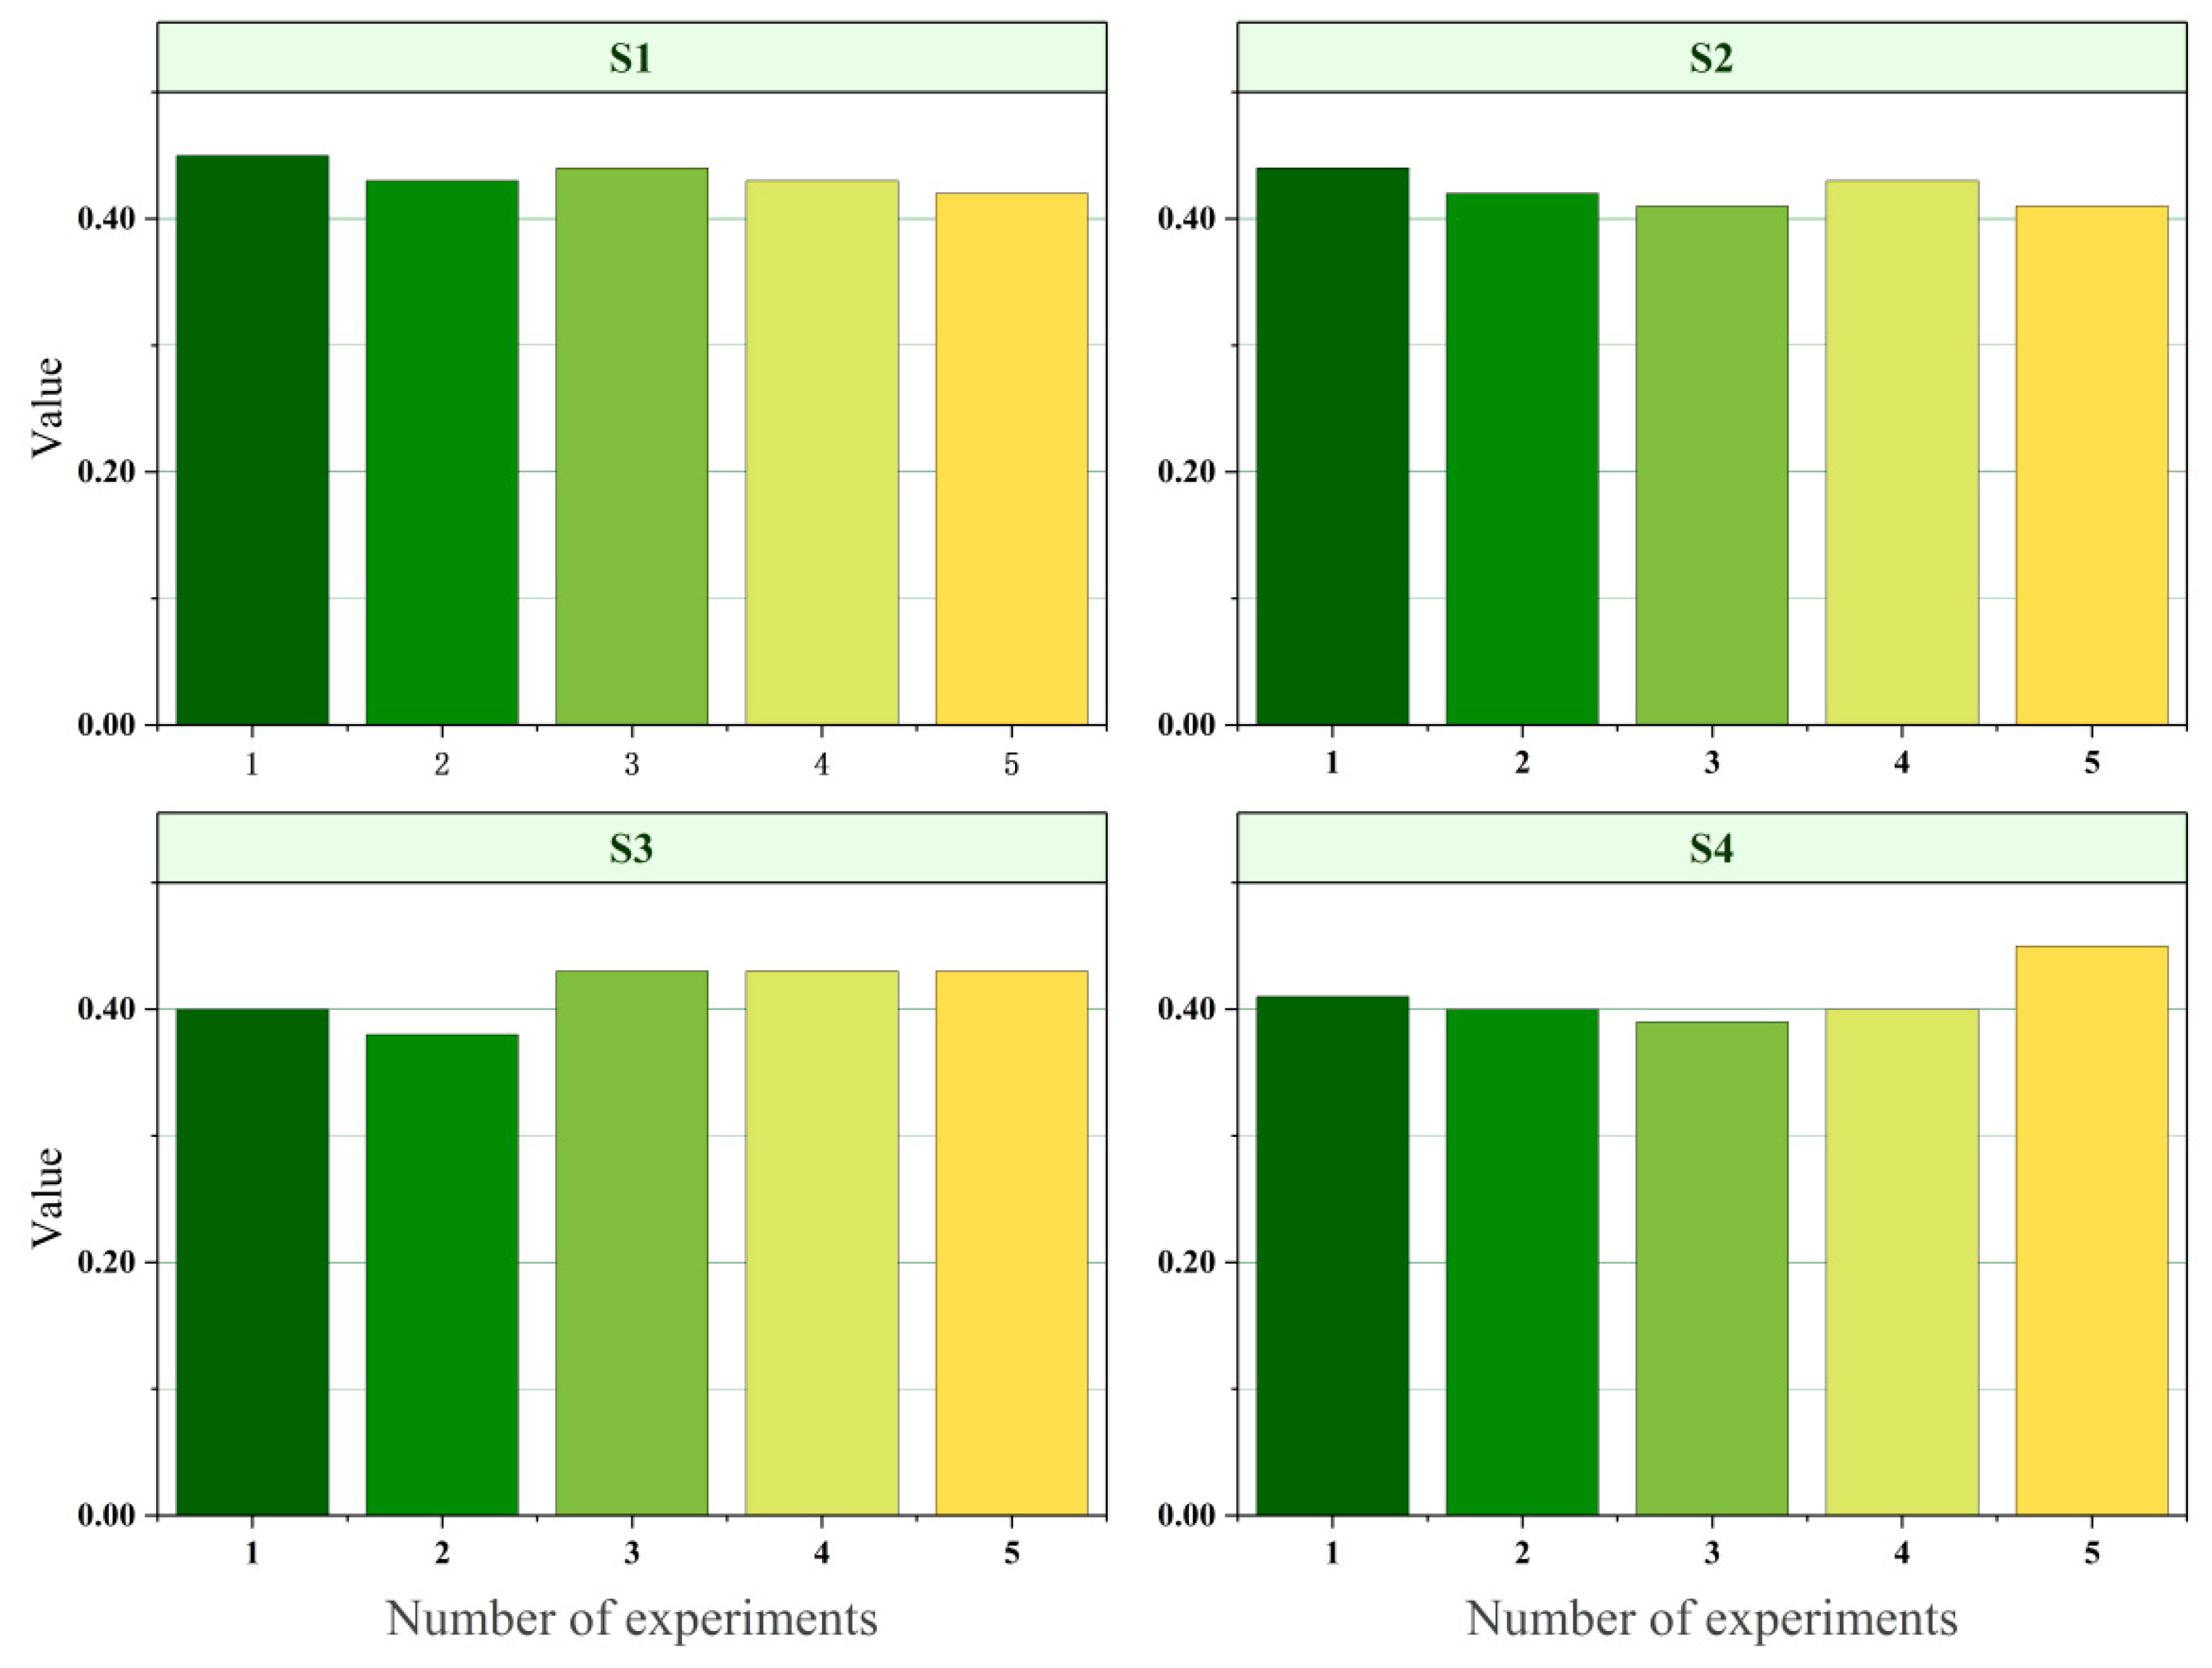
To evaluate the frost resistance durability of the ecological restoration substrate used in river and lake resilience management systems, a freeze–thaw cycling experiment was conducted on ten cylindrical samples (15 cm diameter, 10 cm height, and 5 cm thickness). After being watered and cured for 7 days, the samples were placed in a programmable environmental chamber where they underwent five freeze–thaw cycles, each consisting of a 12 h freezing phase (0 °C to −10 °C) followed by a 12 h thawing phase (rising to 20 °C). The total of freezing and thawing is one cycle, and it is repeated five times. After each cycle, four samples are randomly selected for the compressive strength test. The compressive strength data of each sample are recorded, as shown in Figure 6.
Figure 6, S1, S2, S3, and S4 refer to the selected sample numbers. The compressive strength values of S1 range from 0.42 MPa to 0.45 MPa, and S2 are mainly concentrated between 0.41 MPa and 0.44 MPa, both showing stable performance. S3 exhibited more fluctuation, with values from 0.38 to 0.43 MPa, and S4 reached its peak of 0.45 MPa after the final cycle.
The average value and standard deviation of each group of samples are calculated based on the data in Figure 6 to evaluate the frost resistance durability, as shown in Table 2.
Statistical analysis indicated that all samples retained average compressive strength above 0.38 MPa, demonstrating consistent material behavior. The small standard deviation indicates that the frost resistance performance of the samples is consistent and highly stable.

3.4. Fertility Sustainability

Natural water fronts are restored around water bodies to prevent soil erosion and provide habitats for aquatic organisms. Native riverbank plants are planted to improve the stability and the vegetation coverage. Target vegetation coverage of water fronts is set at ≥70% to reduce soil erosion. To evaluate the biological activity and fertility potential of the river and lake resilience management substrate (T1) and traditional soil substrate (T2), representative sampling was conducted from experimental sites, collecting 10 samples from each group. The samples were air-dried, sieved to remove coarse particles, and standardized for uniformity.
Each substrate was then inoculated into an appropriate microbiological culture medium, following standard protocols, with three replicates per group (totaling six culture bottles). The cultures were incubated at 25 °C and 70% humidity for seven days. Post-incubation, microbial abundance was quantified using a microbial counter, and the average colony-forming units (CFU) per gram were calculated.
As shown in Table 3, the T1 substrate demonstrated significantly higher microbial activity, with an average of 1610 CFU/g—more than 15 times greater than the T2 group’s 96.3 CFU/g. This substantial difference is attributed to the T1 substrate’s nutrient-rich composition and optimized physical–chemical conditions under the habitat substrate activation method, which fosters microbial growth and ecological conditions.
In Table 4, the t-test results confirmed the difference between the two groups (p < 0.001), indicating the effectiveness of the ecological restoration substrate in improving fertility sustainability.

4. Discussion

Disaster prevention and mitigation planning involves a systematic and proactive approach to minimize the adverse impact of natural disasters on human society, infrastructure, and ecological systems. For river and lake basins that are susceptible to flooding, debris flows, and slope instability, effective risk reduction strategies require an integration of spatial analysis, hydrological modeling, ecological engineering, and land use optimization. Using GIS tools, spatial analyses are performed to generate basin characteristic maps, including topography, hydrology, vegetation coverage, and land use. Vegetation plays a vital role in mitigating erosion by strengthening the interaction between the biosphere and the soil surface, thereby enhancing slope resistance to hydraulic and gravitational forces [47]. The slope pull-out stability tests conducted in this study demonstrated significant improvements in both shear strength and overall slope stability following the implementation of resilience management structures. Over the 12-month monitoring period, the experimental area showed marked increases in shear strength and pull-out resistance compared to the untreated control area. These results underscore the effectiveness of integrating structural reinforcement with ecological elements, such as vegetation, in enhancing the mechanical properties of slope surfaces and reducing erosion risk. Previous studies have also emphasized that combining vegetation with supportive land-preparation techniques yields greater benefits in erosion control than vegetation alone [48]. Such integrated strategies represent a promising direction for future improvements in preventing Benggang development and bank erosion in vulnerable riparian zones.
The evaluation of anti-erosion and anti-scouring performance under simulated heavy rainfall further validates the protective function of the ecological restoration substrate. The resilience management structures, comprising a plant root-reinforced soil composite, exhibited excellent erosion resistance compared to the untreated substrate [49]. This aligns with findings from Wang et al. [50], who reported that microbial extracellular polymeric substances at the root–soil interface significantly enhance soil shear strength by promoting microstructural reorganization. The use of locally sourced wetland soils combined with native plant seeds capable of root binding not only improves soil cohesion but also enhances the ecological adaptability and sustainability of the substrate over time.
The freeze–thaw durability assessment offers critical insights into the long-term performance of the restoration substrate in cold regions. Frost resistance is essential for the stability of bank protection systems in environments subject to seasonal temperature fluctuations [51,52,53]. The repeated freeze–thaw cycles simulated natural expansion–contraction processes, which commonly cause cracking and degradation in traditional protection materials. The tested substrate maintained stable compressive strength throughout the cycles, indicating high frost durability and long-term structural integrity. This resistance enhances the reliability of the management system in ensuring year-round protection of river and lake banks.
The fertility sustainability assessment further supports the superiority of the ecological restoration substrate. As an essential indicator of soil fertility, microbial activity in the experimental substrate was significantly higher than in the traditional soil. As microbial communities drive nutrient cycling, organic matter decomposition, and soil structural development [54,55], their abundance reflects the substrate’s capacity to support a self-sustaining and resilient ecosystem. The statistically significant increase in microbial CFU in the experimental group demonstrates the substrate’s effectiveness in fostering a biologically active environment, which not only promotes vegetation establishment but also contributes to long-term slope stabilization and erosion resistance.

5. Conclusions

This study demonstrates that the integrated river and lake resilience management and ecological restoration technologies presented herein are highly adaptable and scalable across diverse aquatic environments, regardless of their type or size. By aligning interventions with local natural, cultural, and social conditions, the proposed approach supports tailored, site-specific management solutions. The implementation of hydrologic investigations, geomorphological survey, river course structure optimization, biological slope protection, multi-level wetland construction, habitat protection area establishment, and ecological monitoring collectively enhances the ecological resilience and structural stability of river and lake ecosystems. The results confirm that the application of the resilience management structure system significantly increases the strength of slope protection, improves overall stability, and contributes to water quality and biodiversity. However, the study also acknowledges certain limitations, particularly the absence of long-term monitoring data and the limited assessment of system response under extreme climate conditions. Future research should focus on the development of an extended monitoring system, and the integration of climate-adaptive restoration technologies. Such efforts will be essential to ensure the continued effectiveness and sustainability of river and lake restoration practices in the face of ongoing environmental change.

Author Contributions

Methodology, H.Q.; Investigation, H.Q.; Resources, Y.Y.; Writing—original draft, H.Q.; Writing—review & editing, H.Q. and Y.Y.; Supervision, Y.Y.; Funding acquisition, Y.Y. All authors have read and agreed to the published version of the manuscript.

Funding

This article is supported by Thermal State and thermal Evolution of Cenozoic lithosphere and its constraints on Crustal Deformation in Xisha Area, South China Sea (NSFC Project Number: 42276074).

Data Availability Statement

The raw data supporting the conclusions of this article will be made available by the authors on request.

Conflicts of Interest

There are no potential competing interests in our paper. And all authors have seen the manuscript and approved of its submission to your journal. We confirm that the content of the manuscript has not been published or submitted for publication elsewhere.

References

  1. Chen, Y.; Duo, L.; Zhao, D.; Zeng, Y.; Guo, X. The response of ecosystem vulnerability to climate change and human activities in the Poyang Lake city group, China. Environ. Res. 2023, 233, 116473. [Google Scholar] [CrossRef] [PubMed]
  2. Miller, J.D.; Hutchins, M. The impacts of urbanisation and climate change on urban flooding and urban water quality: A review of the evidence concerning the United Kingdom. J. Hydrol. Reg. Stud. 2017, 12, 345–362. [Google Scholar] [CrossRef]
  3. Talbot, C.J.; Bennett, E.M.; Cassell, K.; Hanes, D.M.; Minor, E.C.; Paerl, H.; Raymond, P.A.; Vargas, R.; Vidon, P.G.; Wollheim, W.; et al. The impact of flooding on aquatic ecosystem services. Biogeochemistry 2018, 141, 439–461. [Google Scholar] [CrossRef]
  4. Wei, Y.; Liu, Z.; Wu, X.; Zhang, Y.; Cui, T.; Cai, C.; Guo, Z.; Wang, J.; Cheng, D. Can Benggang be regarded as gully erosion? Catena 2021, 207, 105648. [Google Scholar] [CrossRef]
  5. Yan, X.; Geng, S.; Jiang, H.; Sun, Z.; Wang, N.; Zhang, S.; Yang, L.; Wen, M. Redefining Benggang management: A novel integration of soil erosion and disaster risk assessments. Land 2024, 13, 613. [Google Scholar] [CrossRef]
  6. Cepic, M.; Bechtold, U.; Wilfing, H. Modelling human influences on biodiversity at a global scale—A human ecology perspective. Ecol. Model. 2022, 465, 109854. [Google Scholar] [CrossRef]
  7. Laurila-Pant, M.; Lehikoinen, A.; Uusitalo, L.; Venesjärvi, R. How to value biodiversity in environmental management? Ecol. Indic. 2015, 55, 1–11. [Google Scholar] [CrossRef]
  8. Wang, X.; Wang, J.; Wang, B.; Burkhard, B.; Che, L.; Dai, C.; Zheng, L. The nature-based ecological engineering paradigm: Symbiosis, coupling, and coordination. Engineering 2022, 19, 14–21. [Google Scholar] [CrossRef]
  9. Sabater, S.; Freixa, A.; Jiménez, L.; López-Doval, J.; Pace, G.; Pascoal, C.; Perujo, N.; Craven, D.; González-Trujillo, J.D. Extreme weather events threaten biodiversity and functions of river ecosystems: Evidence from a meta-analysis. Biol. Rev. 2023, 98, 450–461. [Google Scholar] [CrossRef] [PubMed]
  10. Herrera, E.C.; Nadaoka, K. Temporal dynamics and drivers of lake ecosystem metabolism using high resolution observations in a shallow, tropical, eutrophic lake (Laguna Lake, Philippines). J. Great Lakes Res. 2021, 47, 997–1020. [Google Scholar] [CrossRef]
  11. Vigneron, A.; Cruaud, P.; Langlois, V.; Lovejoy, C.; Culley, A.I.; Vincent, W.F. Ultra-small and abundant: Candidate phyla radiation bacteria are potential catalysts of carbon transformation in a thermokarst lake ecosystem. Limnol. Oceanogr. Lett. 2020, 5, 212–220. [Google Scholar] [CrossRef]
  12. Wang, M.; Du, Z.; Duan, Z.; Yan, C.; Gao, W.; Liu, C. Estimating the eco-environmental water demand of a river and lake coupled ecosystem: A case study of Lake Dianchi Basin. Acta Ecol. Sin. 2021, 41, 1341–1348. [Google Scholar] [CrossRef]
  13. Heino, J.; Alahuhta, J.; Bini, L.M.; Cai, Y.; Heiskanen, A.S.; Hellsten, S.; Kortelainen, P.; Kotamäki, N.; Tolonen, K.T.; Vihervaara, P.; et al. Lakes in the era of global change: Moving beyond single-lake thinking in maintaining biodiversity and ecosystem services. Biol. Rev. 2021, 96, 89–106. [Google Scholar] [CrossRef]
  14. Yan, Z.; Song, N.; Wang, C.; Jiang, H. Functional potential and assembly of microbes from sediments in a lake bay and adjoining river ecosystem for polycyclic aromatic hydrocarbon biodegradation. Environ. Microbiol. 2021, 23, 628–640. [Google Scholar] [CrossRef] [PubMed]
  15. Battin, T.J.; Lauerwald, R.; Bernhardt, E.S.; Bertuzzo, E.; Gener, L.G.; Hall, R.O., Jr.; Hotchkiss, E.R.; Maavara, T.; Pavelsky, T.M.; Ran, L.; et al. River ecosystem metabolism and carbon biogeochemistry in a changing world. Nature 2023, 613, 449–459. [Google Scholar] [CrossRef] [PubMed]
  16. Culp, J.M.; Droppo, I.G.; di Cenzo, P.D.; Alexander, A.C.; Baird, D.J.; Beltaos, S.; Bickerton, G.; Bonsal, B.; Brua, R.B.; Chambers, P.A.; et al. Ecological effects and causal synthesis of oil sands activity impacts on river ecosystems: Water synthesis review. Environ. Rev. 2021, 29, 315–327. [Google Scholar] [CrossRef]
  17. Petsch, D.K.; Cionek, V.M.; Thomaz, S.M.; Dos Santos, N.C.L. Ecosystem services provided by river-floodplain ecosystems. Hydrobiologia 2023, 850, 2563–2584. [Google Scholar] [CrossRef]
  18. Li, L. Application of water environment ecological management in river and lake engineering. Eng. Constr. Manag. 2024, 2, 100–102. [Google Scholar]
  19. Wang, J. Current situation of rural river courses and application of ecological slope protection technology. Rural. Sci. Technol. 2021, 12, 114–115. [Google Scholar]
  20. Chen, G. Research on construction Technology of river ecological slope Protection. Heilongjiang Hydraul. Sci. Technol. 2021, 49, 167–169. [Google Scholar]
  21. Dang, H.; Yang, D.; Yang, J. Application of frame girder ecological revetment in slope protection of urban river regulation project. Yunnan Water Power 2021, 37, 167–169. [Google Scholar]
  22. Zhu, Y. Application of ecological slope protection technology in river course management project. Water Conserv. Constr. Manag. 2021, 41, 60–65. [Google Scholar]
  23. Liu, L.; Song, Y.; Zhong, B.; Fang, S.; Xu, W.; Wang, Y.; Li, M. Research progress on ecological restoration technology of vegetation concrete. J. Environ. Eng. Technol. 2022, 12, 916–927. [Google Scholar]
  24. Xu, X.; Wu, W.L. A brief discussion on the application of ecological slope protection technology in water conservancy projects. Technol. Appl. Water Conserv. Electr. Power 2022, 4, 166–168. [Google Scholar]
  25. Jiang, Y. Research on the application of ecological slope protection technology in river regulation. Leather Manuf. Environ. Technol. 2021, 2, 94–96. [Google Scholar]
  26. Zhou, S.; Geng, N.; Lin, X.; Yu, W.; Fei, S.; Tong, R. Research progress of river ecological slope protection. Intell. City 2021, 7, 118–119. [Google Scholar]
  27. Hayes, S.; Desha, C.; Burke, M.; Gibbs, M.; Chester, M. Leveraging socio-ecological resilience theory to build climate resilience in transport infrastructure. Transp. Rev. 2019, 39, 677–699. [Google Scholar] [CrossRef]
  28. Maltby, J.; Day, L.; Hall, S.; Chivers, S. The measurement and role of ecological resilience systems theory across domain-specific outcomes: The domain-specific resilient systems scales. Assessment 2019, 26, 1444–1461. [Google Scholar] [CrossRef] [PubMed]
  29. Resmi, S.R.; Patel, P.L.; Timbadiya, P.V. Morphological study of Upper Tapi river using remote sensing and GIS techniques. ISH J. Hydraul. Eng. 2019, 25, 260–268. [Google Scholar] [CrossRef]
  30. Al-Hurban, A.; Al-Ruwaih, F.; Al-Dughairi, A. Quantitative geomorphological and hydromorphometric analysis of drainage basins of as sabriyah (Kuwait) using GIS techniques. J. Geogr. Inf. Syst. 2021, 13, 166–193. [Google Scholar] [CrossRef]
  31. Zhang, L.; Zhang, X.; Wang, H. Key points of application of river ecological slope protection construction technology in water conservancy projects. Mod. Constr. Eng. Technol. 2024, 1, 58–60. [Google Scholar]
  32. Leng, W.C. Brief analysis on the application of ecological slope protection technology in river management. Technol. Appl. Water Conserv. Electr. Power 2022, 4, 25–27. [Google Scholar]
  33. Sahu, M.K.; Shwetha, H.R.; Dwarakish, G.S. State-of-the-art hydrological models and application of the HEC-HMS model: A review. Model. Earth Syst. Environ. 2023, 9, 3029–3051. [Google Scholar] [CrossRef]
  34. Sahu, S.; Pyasi, S.K.; Galkate, R.V. A review on the HEC-HMS rainfall-runoff simulation model. Int. J. Agric. Sci. Res. 2020, 10, 183–190. [Google Scholar]
  35. Lengyel, D.M.; Mazzuchi, T.A.; Vesely, W.E. Establishing risk matrix standard criteria for use in the continuous risk management process. J. Space Saf. Eng. 2023, 10, 276–283. [Google Scholar] [CrossRef]
  36. Qazi, A.; Dikmen, I. From risk matrices to risk networks in construction projects. IEEE Trans. Eng. Manag. 2019, 68, 1449–1460. [Google Scholar] [CrossRef]
  37. Puvanendran, V.; Mortensen, A.; Johansen, L.; Kettunen, A.; Hansen, Ø.J.; Henriksen, E.; Heide, M. Development of cod farming in Norway: Past and current biological and market status and future prospects and directions. Rev. Aquac. 2022, 14, 308–342. [Google Scholar]
  38. Lee, J.; Lee, S.; Yu, S.; Rhew, D. Relationships between water quality parameters in rivers and lakes: BOD5, COD, NBOPs, and TOC. Environ. Monit. Assess. 2016, 188, 252. [Google Scholar] [CrossRef]
  39. Jia, X.; Liu, C.; Ji, X.; Xue, F. Data collection and edge calculation of green vegetation index based on ecological health. Chin. J. Dis. Control Prev. 2022, 26, 1167–1173. [Google Scholar]
  40. Orimoloye, I.R.; Ololade, O.O. Spatial evaluation of land-use dynamics in gold mining area using remote sensing and GIS technology. Int. J. Environ. Sci. Technol. 2020, 17, 4465–4480. [Google Scholar] [CrossRef]
  41. Paul, P.K.; Aithal, P.S.; Bhuimali, A.; Tiwary, K.S.; Saavedra, R.; Aremu, B. Geo information systems & remote sensing: Applications in environmental systems & management. Int. J. Manag. Technol. Soc. Sci. (IJMTS) 2020, 5, 11–18. [Google Scholar]
  42. Akca, M.S.; Bostancı, O.; Aydin, A.K.; Koyuncu, I.; Altinbas, M. BioH2 production from food waste by anaerobic membrane bioreactor. Int. J. Hydrogen Energy 2021, 46, 27941–27955. [Google Scholar] [CrossRef]
  43. Arif, A.U.A.; Sorour, M.T.; Aly, S.A. Cost analysis of activated sludge and membrane bioreactor WWTPs using CapdetWorks simulation program: Case study of Tikrit WWTP (middle Iraq). Alex. Eng. J. 2020, 59, 4659–4667. [Google Scholar] [CrossRef]
  44. Omayio, D.; Mzungu, E.; Kakamega, K. Modification of Shannon-Wiener diversity index towards quantitative estimation of environmental wellness and biodiversity levels under a non-comparative Scenario. J. Environ. Earth Sci. 2019, 9, 46–57. [Google Scholar]
  45. Wang, Z.; Feng, D.; Chen, Y.; He, D.; Elimelech, M. Comparison of energy consumption of osmotically assisted reverse osmosis and low-salt-rejection reverse osmosis for brine management. Environ. Sci. Technol. 2021, 55, 10714–10723. [Google Scholar] [CrossRef]
  46. Yao, Y.; Zhang, W.; Du, Y.; Li, M.; Wang, L.; Zhang, X. Toward enhancing the chlorine resistance of reverse osmosis membranes: An effective strategy via an end-capping technology. Environ. Sci. Technol. 2019, 53, 1296–1304. [Google Scholar] [CrossRef] [PubMed]
  47. Starke, J.; Ehlers, T.A.; Schaller, M. Latitudinal effect of vegetation on erosion rates identified along western South America. Science 2020, 367, 1358–1361. [Google Scholar] [CrossRef] [PubMed]
  48. Yu, Y.; Wei, W.; Chen, L.; Feng, T.; Daryanto, S. Quantifying the effects of precipitation, vegetation, and land preparation techniques on runoff and soil erosion in a loess watershed of China. Sci. Total Environ. 2019, 652, 755–764. [Google Scholar] [CrossRef] [PubMed]
  49. Wang, L.; Li, J.; Zhang, S.; Huang, Y.; Ouyang, Z.; Mai, Z. Biological soil crust elicits microbial community and extracellular polymeric substances restructuring to reduce the soil erosion on tropical island, South China Sea. Mar. Environ. Res. 2024, 197, 106449. [Google Scholar] [CrossRef]
  50. He, J.; Liu, R.; Liu, F.; Wu, M.; Wen, Q. Freeze-thaw resistance mechanisms of rubber-cement soil: Insights from a macro- and micro-level perspective. Environ. Technol. 2025, 46, 4394–4406. [Google Scholar] [CrossRef]
  51. Yang, J.; Jia, D.; Zhai, B.; Chen, X.; Wang, J. Bank erosion under the impacts of fluvial erosion, frost heaving/freeze-thaw process of rivers in seasonal frozen regions. Heliyon 2024, 10, e37448. [Google Scholar] [CrossRef] [PubMed]
  52. Yang, Z.; Zhang, K.; Li, X.; Ren, S.; Li, P. The effects of long-term freezing-thawing on the strength properties and the chemical stability of compound solidified/stabilized lead-contaminated soil. Environ. Sci. Pollut. Res. Int. 2023, 30, 38185–38201. [Google Scholar] [CrossRef]
  53. Lann, T.; Bao, H.; Lan, H.; Zheng, H.; Yan, C.; Peng, J. Hydro-mechanical effects of vegetation on slope stability: A review. Sci. Total Environ. 2024, 926, 171691. [Google Scholar] [CrossRef]
  54. Cai, M.; Chen, H.; Tan, H.; Chen, J.; He, S.; Long, M. Temporal dynamics of nutrient release from mulching of legume roots and shoots litter driven by microbial community during decomposition in organic orchards. BMC Plant Biol. 2025, 25, 374. [Google Scholar] [CrossRef] [PubMed]
  55. Costantini, E.A.; Castaldini, M.; Diago, M.P.; Giffard, B.; Lagomarsino, A.; Schroers, H.-J.; Priori, S.; Valboa, G.; Agnelli, A.E.; Akça, E.; et al. Effects of soil erosion on agro-ecosystem services and soil functions: A multidisciplinary study in nineteen organically farmed European and Turkish vineyards. J. Environ. Manag. 2018, 223, 614–624. [Google Scholar] [CrossRef] [PubMed]
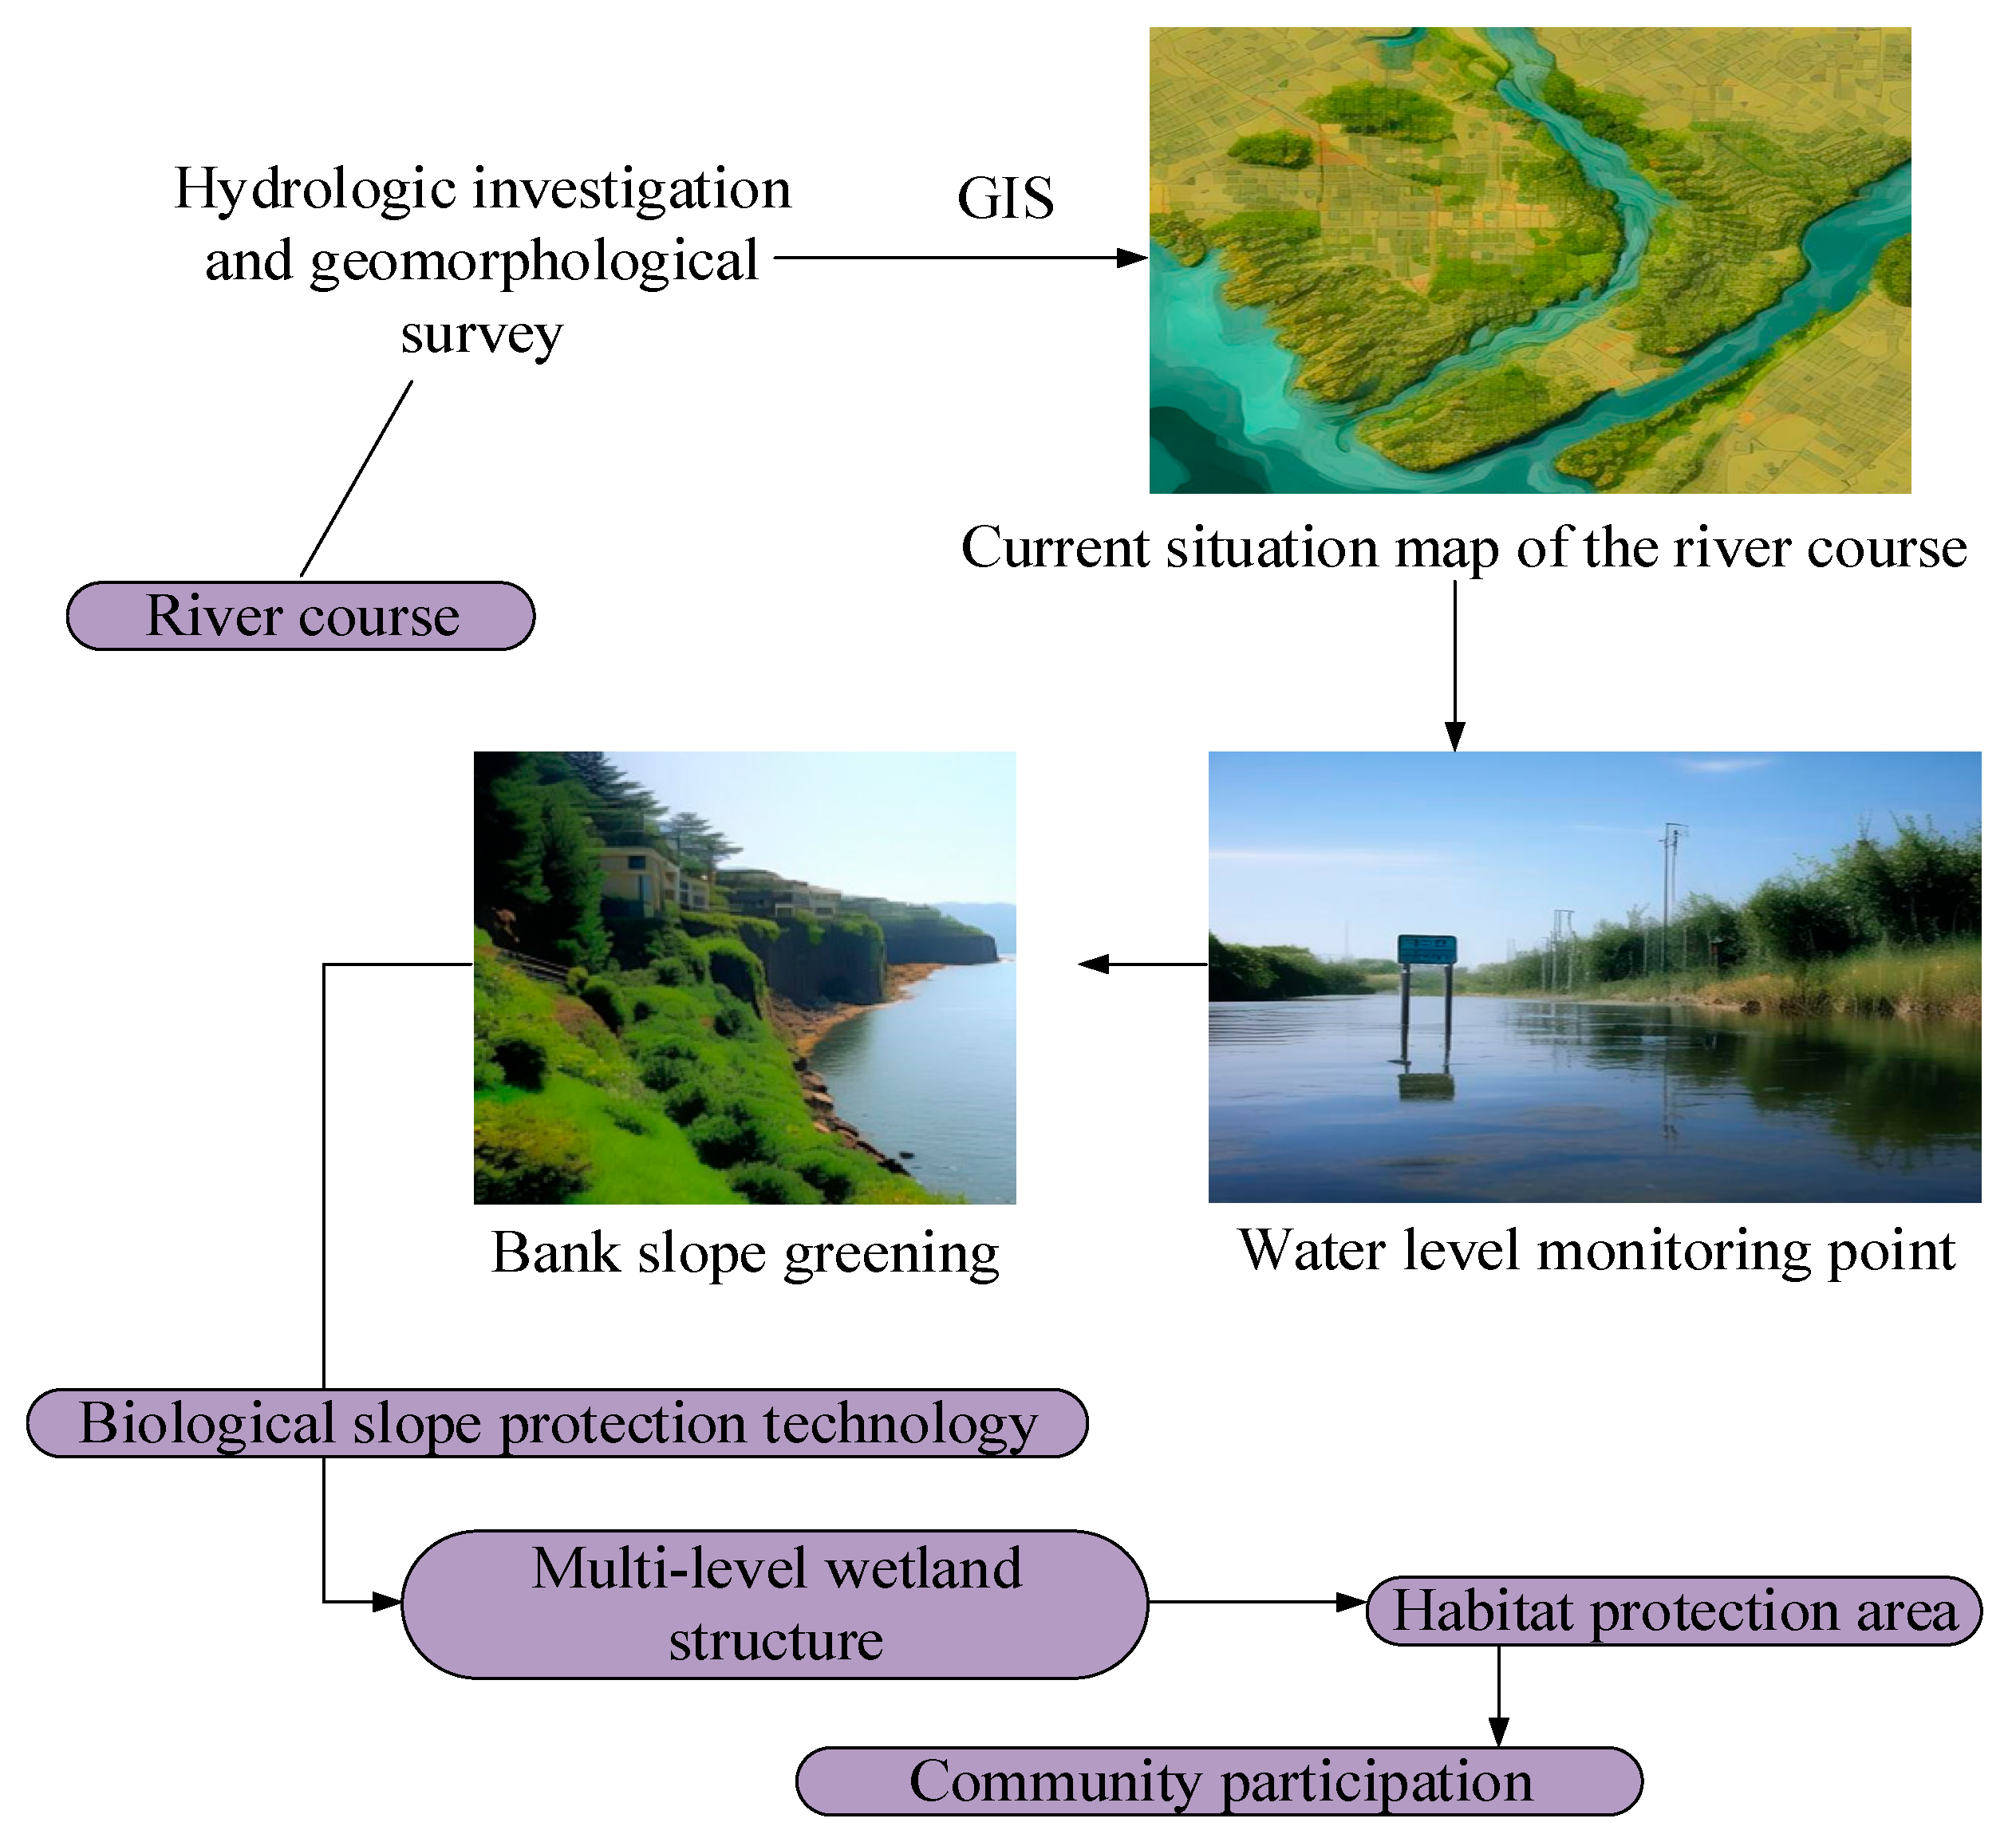
Figure 1. Specific operations to evaluate ecology resilience of rivers.
Water 17 02744 g001
Figure 2. Evaluation of risks of natural disasters.
Water 17 02744 g002
Figure 3. Framework for sustainable use of water resources.
Water 17 02744 g003
Figure 4. Slope protection strength (unit: MPa) and pull-out resistance force (unit: kN/m2) in different areas.
Water 17 02744 g004
Figure 5. Erosion modulus in different areas.
Water 17 02744 g005
Figure 6. Compressive strength data of each sample (unit: MPa). S1, S2, S3, and S4 refer to the selected sample numbers. 1–5 refer the number of experiments.
Water 17 02744 g006
Table 1. Mass loss and surface scouring performance.
Number of ExperimentsErosion ModulusMass Loss Surface Scouring Performance
ABAB AB
1831381.5%15% No cracks, loss, stableSevere surface detachment and soil erosion
2821411%17% No cracks, loss, stableSevere surface detachment and soil erosion
3821331%12% No cracks, loss, stableObvious soil erosion and detachment on the surface
4811410.5%17% No cracks, loss, stableSevere surface detachment and soil erosion
5841332%12% No cracks, loss, stableObvious soil erosion and detachment on the surface
6851423%18% Surface micro cracks, slight lossSevere surface detachment and soil erosion
7811320.5%10% No cracks, loss, stableObvious soil erosion and detachment on the surface
8851423%18% Surface micro cracks, slight lossSevere surface detachment and soil erosion
9831351.5%13% No cracks, loss, stableObvious soil erosion and detachment on the surface
1080143020% No cracks, loss, stableSevere surface detachment and soil erosion
Table 2. Average and standard deviation of compressive strength of samples (unit: MPa).
Sample Number12345Average ValueStandard Deviation
S10.450.430.440.430.420.430.01
S20.440.420.410.430.410.420.01
S30.40.380.430.430.430.410.02
S40.410.40.390.40.450.410.02
Table 3. Mean microbial load and standard deviation of each group (unit: CFU/g).
Sample NumberT1T2
11600100
2155090
3150095
4158085
51620110
61650105
7170092
8167098
91640100
10159088
Average value161096.3
Table 4. t-test results of statistical data of T1 and T2.
T1T2
t value27.45
df (degree of freedom)18
p-value<0.001
Disclaimer/Publisher’s Note: The statements, opinions and data contained in all publications are solely those of the individual author(s) and contributor(s) and not of MDPI and/or the editor(s). MDPI and/or the editor(s) disclaim responsibility for any injury to people or property resulting from any ideas, methods, instructions or products referred to in the content.