Article

Optimization of Combined Scour Protection for Bridge Piers Using Computational Fluid Dynamics

1
China Civil Engineering Construction Corporation, Beijing 100038, China
2
Ningbo East China Nuclear Industry Survey and Design Institute Group Co., Ltd., Ningbo 315040, China
3
National Engineering Research Center of High-Speed Railway Construction Technology, School of Civil Engineering, Central South University, Changsha 410075, China
4
College of Civil Engineering, Hunan University, Changsha 410082, China
*
Authors to whom correspondence should be addressed.
Water 2025, 17(18), 2742; https://doi.org/10.3390/w17182742
Submission received: 13 August 2025 / Revised: 13 September 2025 / Accepted: 14 September 2025 / Published: 16 September 2025

Abstract

This study presents a high-fidelity CFD-based optimization of a combined sacrificial-pile and collar (SPC) system designed to suppress local scour at circular bridge piers. Following rigorous validation against benchmark flume experiments (scour depth error < 3%), a systematic parametric study was conducted to quantify the influence of pile-to-pier spacing (dp/D = 4–6) and collar elevation (hc/D = 0–0.3). The optimal layout is found to be a sacrificial pile at dp/D = 5 and a collar at hc/D, which yields a 51.2% scour reduction relative to the unprotected case. Flow field analysis reveals that the pile wake deflects the lower approach flow, while the collar vertically displaces the horseshoe vortex; together, these mechanisms redistribute bed shear stress and prevent secondary undermining. Consequently, the upstream conical pit is virtually eliminated, lateral scour is broadened but markedly shallower, and the downstream dune tail bifurcates into two symmetrical ridges. To the best of the authors’ knowledge, this study presents the first high-fidelity CFD-based optimization of a combined sacrificial-pile and collar (SPC) system with a fully coupled hydrodynamic-morphodynamic model. The optimized layout yields a 51.2% scour reduction relative to the unprotected case and, more importantly, demonstrates a positive non-linear synergy that exceeds the linear sum of individual device efficiencies by 7.5%. The findings offer practical design guidance for enhancing bridge foundation resilience against scour-induced hydraulic failure.

1. Introduction

Bridge infrastructure plays a pivotal role in sustaining social and economic development and ensuring transportation safety. Over the past two decades, the global inventory of highway and railway bridges has expanded dramatically, yet the risk of hydraulic failure has risen in parallel. Scour-induced foundation instability accounts for approximately 60% of bridge collapses worldwide [1], and the frequency of these failures is expected to intensify under the combined pressures of climate change, increasing flood magnitudes, and ageing assets [2]. Among the various scour mechanisms, local scour around bridge piers remains the most critical as it generates deep, conical depressions that can undermine structural integrity within hours of a flood event [3]. In addition, this study is motivated by the engineering project of “Key Technologies for Long-Span Bridge Construction in Complex Environments of Pakistan’s Reservoir Area”, in which the Uchar Bridge serves as the controlling structure. Since approximately 80% of its piers are submerged in water, hydraulic-induced problems such as pier scour become the critical design issues.
Local scour is governed by a complex interplay between three-dimensional turbulent flow structures and sediment transport processes. When the approach flow impinges on a cylindrical pier, the adverse pressure gradient at the upstream face drives a downward jet that impinges on the riverbed, triggering a coherent horseshoe vortex system [4,5]. Simultaneously, vortex shedding at the pier flanks produces a wake that redistributes bed shear stress, fostering lateral erosion and downstream deposition [6,7]. The resulting scour hole deepens until the local Shields parameter falls below the critical threshold for sediment entrainment, establishing an equilibrium depth that scales with pier diameter, approach velocity, and sediment characteristics [8]. Empirical equations and design codes [9,10] provide conservative estimates of this depth; however, they offer limited insight into the spatio-temporal evolution of the scour morphology or the efficacy of countermeasures.
To mitigate pier scour, a spectrum of protective strategies has been proposed, broadly categorized as either flow-altering (active) or bed-armouring (passive) systems [11,12,13]. Active countermeasures, including sacrificial piles, flow deflectors, and vortex spoilers, seek to weaken the flow intensity and redistribute approaching momentum [14,15,16,17]. Passive measures, such as riprap aprons, concrete mattresses, and enlarged pile caps, increase the erosion resistance of the bed [18,19,20]. While field deployments have demonstrated the individual merits of these devices, their performance is often sensitive to site-specific hydraulics, installation tolerances, and long-term sediment mobility. Moreover, isolated countermeasures may merely relocate scour rather than suppress it, and the interaction between multiple devices is poorly understood. Consequently, there is a growing consensus that optimized, hybrid systems combining complementary mechanisms are needed to achieve robust, long-term protection.
Although several experimental studies have evaluated sacrificial piles or collars in isolation [14,15], their hydrodynamic coupling remains poorly understood. Specifically, the competition between wake-induced shielding from an upstream pile and the collar-induced displacement of the horseshoe-vortex re-attachment point has not been quantified, leading to conflicting design recommendations when the devices are combined. Previous collar studies [16] focused on preventing bed undermining directly beneath the plate, whereas pile studies [17] emphasized wake-induced reduction of the approach stagnation pressure. Neither body of work has examined how the two mechanisms interact to redistribute bed shear stress and the associated sediment scour.
Recent investigations have moved beyond plain circular collars to alternative geometries. Farooq et al. (2020) [21] introduced an octagonal hooked collar around a circular pier and reported up to 65% scour reduction under clear-water conditions, but noted failure when the hook angle exceeded 45° or when the collar was flush with the bed. Farooq et al. (2023) [22] demonstrate that pier-shape modifications (lenticular vs. circular) strongly influence collar efficiency, reinforcing the need for geometry-aware optimization. Keshavarz et al. (2024) [23] experimentally evaluate collar protection for multiple pier shapes in a 180° bend, showing that effectiveness drops once the abutment aspect ratio exceeds two—a reminder that protection devices must be tuned to local geometry and flow curvature. These studies underscore two common limitations: (i) geometries are optimized in isolation, so synergistic or antagonistic effects with other countermeasures remain unexplored; and (ii) empirical or AI-based predictors used in these works [24,25] predict equilibrium depth but cannot resolve the spatial-temporal evolution of the horseshoe vortex, wake shielding, or stress redistribution that governs coupled devices.
Design codes and empirical scour predictors provide equilibrium depth estimates based on bulk hydraulic parameters, but cannot resolve the spatio-temporal evolution of the scour hole or the secondary morphological features observed in the present study. High-fidelity CFD is capable of capturing the three-dimensional flow field and scour evolution, which has opened new avenues for the rational design and optimization of scour countermeasures [26]. Current design equations return a single, conservative equilibrium scour depth, but they cannot reveal how the horseshoe vortex evolves in space and time. Consequently, these codes offer no guidance on whether an upstream sacrificial pile will weaken the vortex core, whether a collar will merely relocate the attachment point, or how the two devices interact. By utilizing high-resolution CFD model, the present study resolves (i) the flow field characteristics, such as horseshoe vortex and pile wake, (ii) the temporal development of scour depth, and (iii) the evolution of scour hole morphology around the pier. This physics-based interpretability underpins the SPC concept and enables the observed synergy to be traced directly to the suppression of vortex attachment and the lateral spreading of the approach stagnation pressure [27,28,29]. Moreover, fully coupled hydro-morphodynamic models can isolate the physical processes underlying observed scour reductions, offering mechanistic insights that empirical correlations cannot provide.
Recent meta-analyses reveal that standalone collars merely shift the horseshoe-vortex attachment point downstream while isolated piles deflect scour to the pile flanks, prompting calls for combined systems that simultaneously weaken the vortex and reduce approach momentum [30,31,32,33]. To date, no high-fidelity CFD study has mapped the coupled design space or quantified the resulting synergy; this gap motivates the present optimization of the sacrificial-pile and collar (SPC) system. Motivated by these considerations, the present study investigates a SPC system designed to suppress local scour at circular bridge piers. As shown in Figure 1, the sacrificial pile is positioned upstream of the pier to deflect the lower approach flow and attenuate the flow vortex, while a horizontal collar installed at an optimal elevation disrupts the vertical pressure gradient that sustains vortex attachment. From a hydrodynamic standpoint, collars and sacrificial piles act on two complementary branches of the scour process. Collars primarily modify the vertical pressure gradient beneath the pier nose, forcing the horseshoe-vortex core upward and detaching it from the bed (Figure 1b). Sacrificial piles, located upstream, instead deflect the lower 20–30% of the approach boundary layer and attenuate the stagnation-induced down-flow, thereby weakening the vortex before it reaches the pier (Figure 1a). Table 1 systematically compares the most relevant prior studies on collar or pile countermeasures.
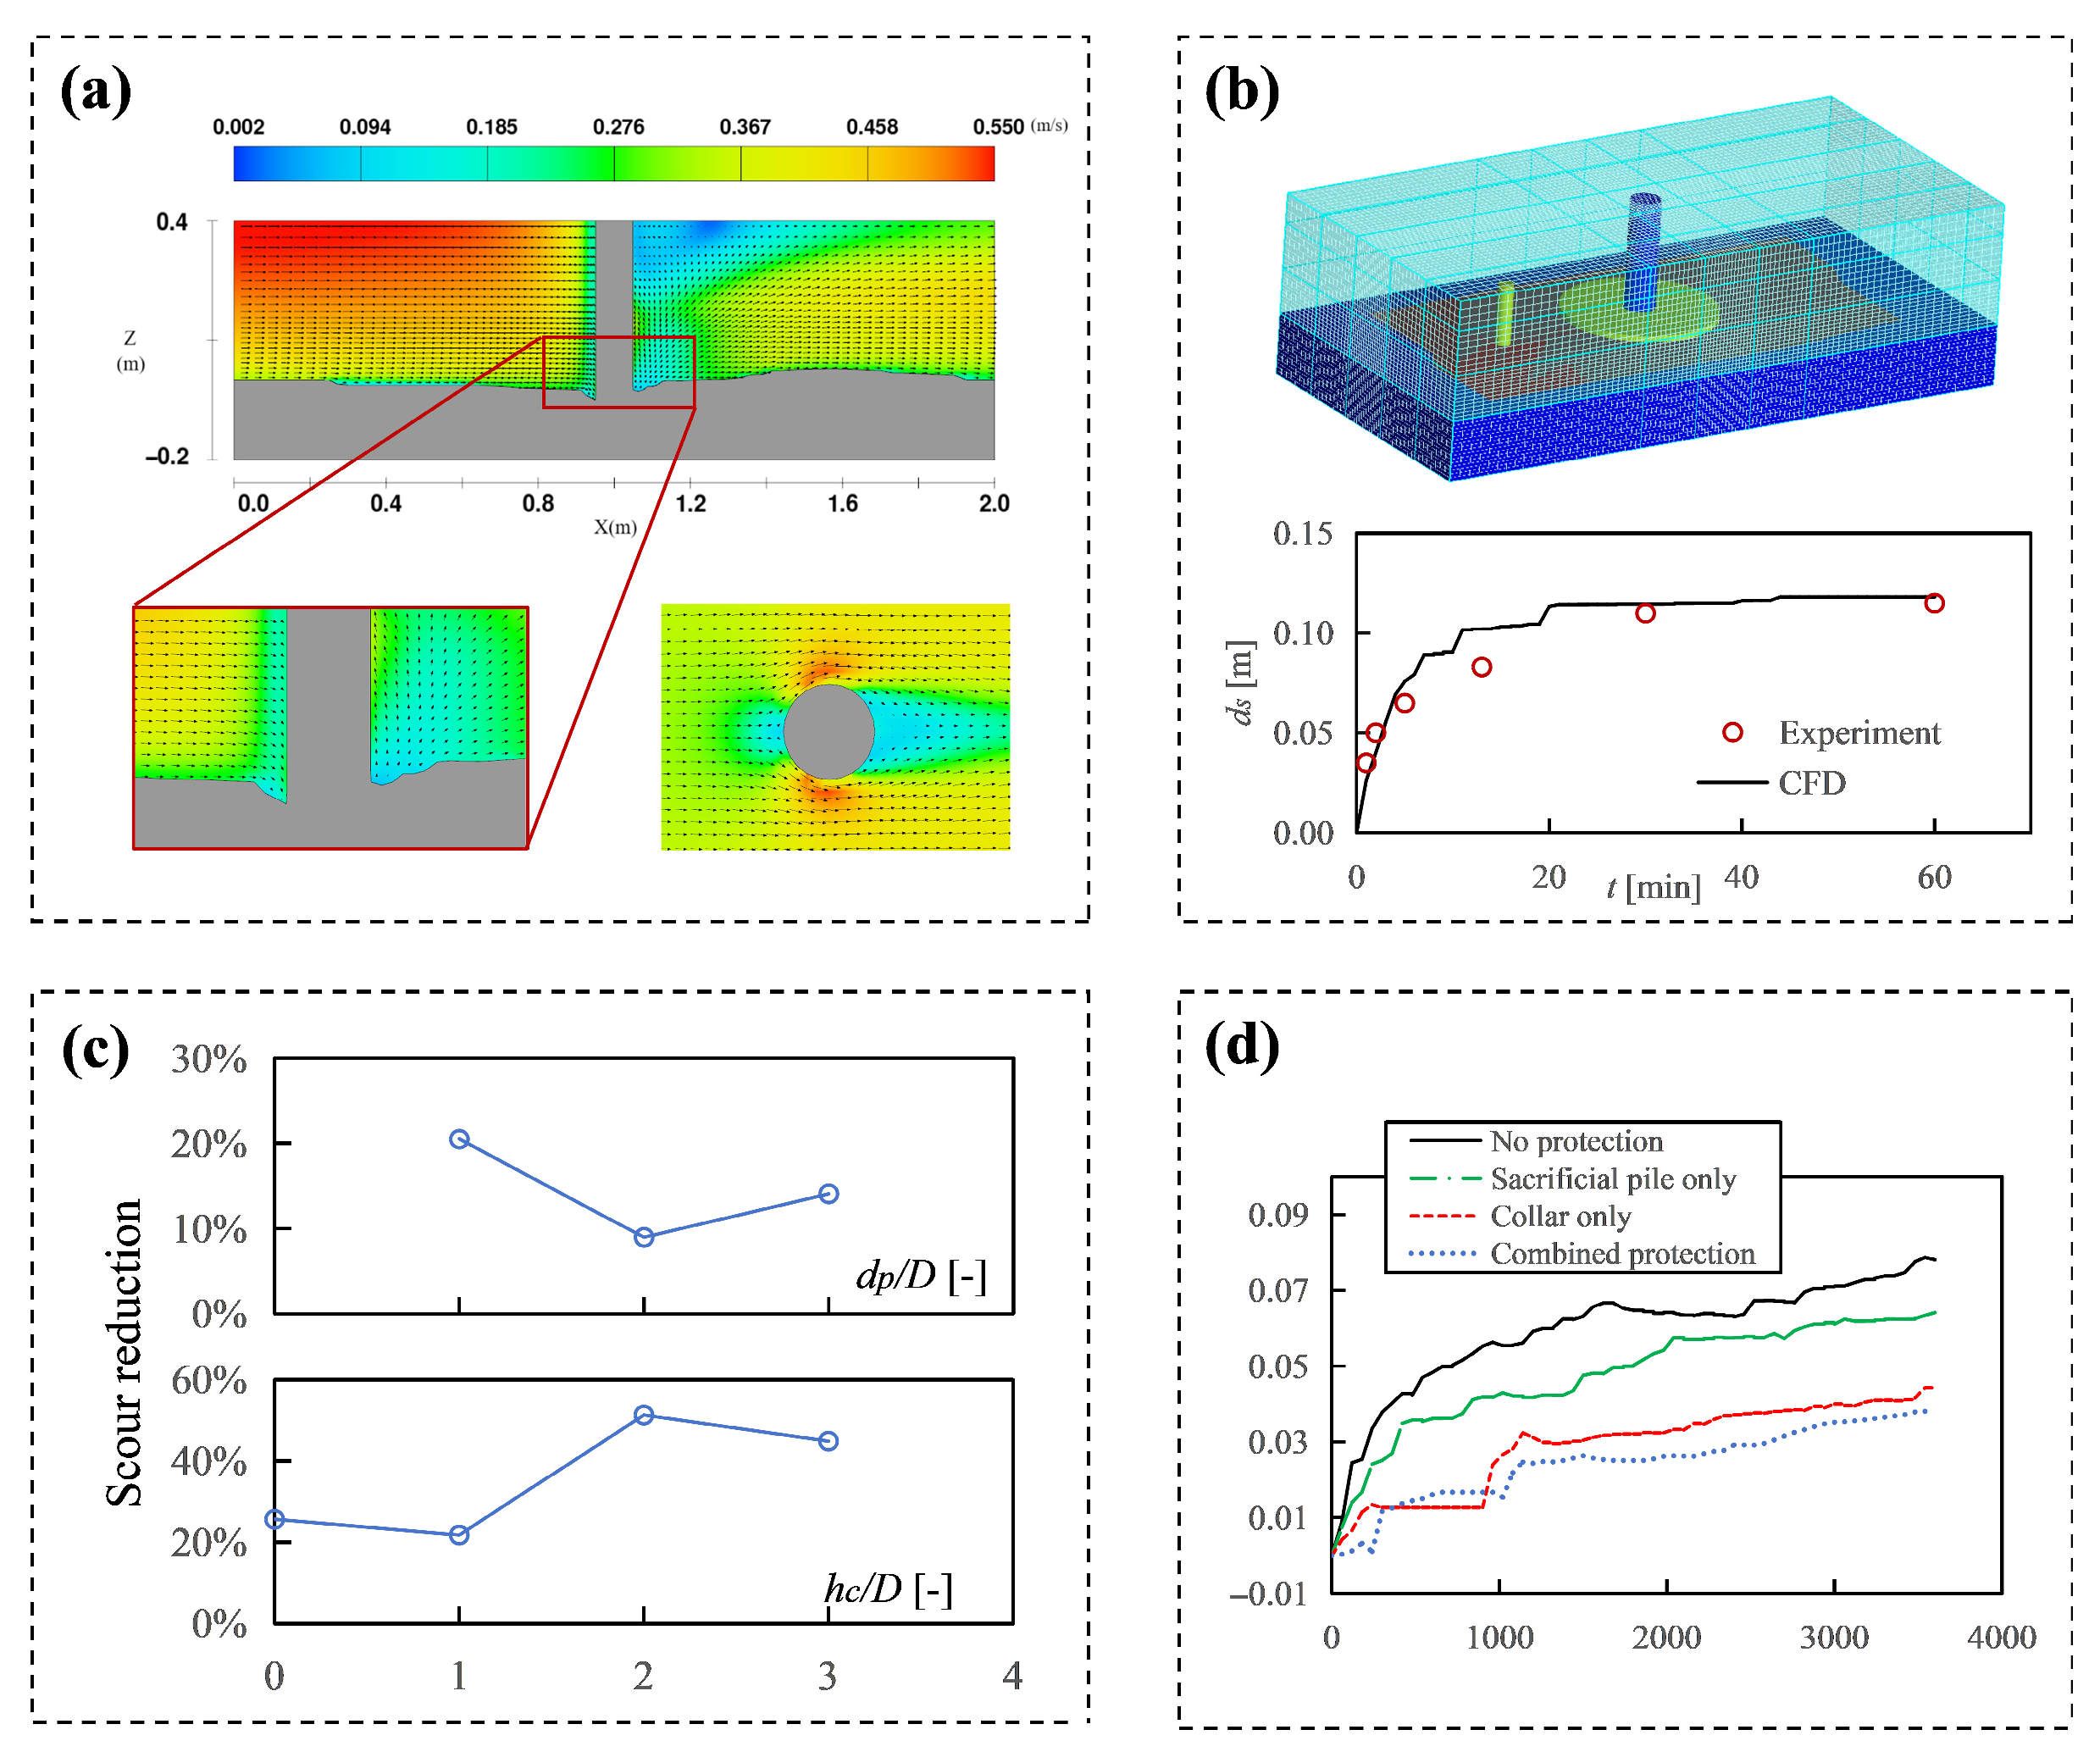
The specific objectives of this study are: (i) to develop and validate a three-dimensional CFD model capable of accurately reproducing the flow and scour evolution around a cylindrical pier; (ii) to quantify, via systematic parametric analysis, the isolated and combined effects of pile-to-pier spacing and collar elevation on scour depth; and (iii) to elucidate the underlying hydrodynamic mechanisms responsible for scour reduction and to identify the configuration yielding maximum synergy between the two devices. Figure 2 presents the graphic workflow of this paper. The manuscript is organized as follows. Section 2 describes the mathematical formulation, including the hydrodynamic and turbulence models, and the coupled bed-load/suspended-load morphodynamic model. Section 3 presents the validation against benchmark flume experiments for both flow and scour. Section 4 details the parametric study, including the sacrificial-pile distance and collar height, culminating in an optimal SPC configuration. Finally, Section 5 summarizes the key findings and conclusions.

2. Mathematical and Numerical Framework

2.1. Governing Hydrodynamic Equations

The incompressible, unsteady flow is resolved by the Reynolds-averaged Navier–Stokes (RANS) equations closed with the kω turbulence model [34] implemented in FLOW-3D v11.2.0. The continuity and momentum equations read:
u i t + u j u i x j = 1 ρ p x i + x j ν u i x j + u j x i + τ i j ρ + σ T κ γ ρ γ x i
u i x i = 0
where ui and uj represent the time-averaged velocity components, ρ denotes the fluid density, p is the pressure, ν is the dynamic viscosity, σT represents the surface tension coefficient, κγ indicates the surface curvature, and τij represents the Reynolds stress based on Boussinesq approximation:
τ i j = u i u j ¯ = 2 ν T S i j 2 3 k δ i j
Here, νT refers to eddy viscosity, δij represents Kronecker delta function and k = u i u i ¯ / 2 denotes turbulent kinetic energy.
Turbulence is modeled by the Wilcox (2006) [34] kω formulation, which can be expressed as follows:
k t + u j k x j = τ i j ρ u i x j β * k ω + x j ν + σ * k ω k x j
ω t + u j ω x j = α ω k τ i j ρ u i x j β ω 2 + σ d ω k x j ω x j + x j ν + σ k ω ω x j
ν T = k ϖ ,   ϖ = max ω ,   C l i m 2 S i j S i j β *
σ d = H k x j ω x j σ d o
where ω denotes dissipation rate and H{·} symbolizes Heaviside step function that equals zero when its argument is negative and one otherwise, and the closure coefficients follow the standard values: Clim = 7/8, α = 0.52, β = 0.078, β* = 0.09, σ = 0.5, σ* = 0.6 and σdo = 0.125. A wall-damping function is activated to ensure accurate near-bed turbulence levels.
In this study, at the Reynolds number of 1.9 × 10⁵ and clear-water scour conditions, the kω model provides scour-depth predictions within 3% of measurements while requiring an order of magnitude fewer cells and CPU-hours than LES, and it outperforms standard kε in resolving the adverse-pressure-gradient horseshoe vortex, making it the most credible choice for high-throughput parametric optimization. While SST kω or DES/LES would capture anisotropic turbulence within the horseshoe vortex and finer wake unsteadiness, these approaches would increase the cell count by roughly one order of magnitude and require sub-millisecond time steps, making an extensive parametric sweep (seven SPC geometries × multiple flow-through times) computationally prohibitive. Instead, the kω formulation with wall-damping is adopted because: (i) the existing research and subsequent scour benchmarks [29,35] report scour-depth errors < 5% with the same model under comparable Re, Fr, and d50; (ii) sensitivity tests in Section 3.2 show that further mesh refinement changes equilibrium scour depth by <3%, confirming that the near-bed shear-stress peak driving scour is already grid-independent; and (iii) the 5% under-prediction of downstream dune height (Section 3.2) is documented and deemed acceptable for ranking SPC configurations, as the upstream scour depth—the primary optimization metric—is captured within 3%. Thus, the chosen RANS kω model provides a balanced compromise between predictive accuracy and computational efficiency for parametric design.

2.2. Sediment Transport and Morphodynamics

The sediment motion is treated in bed-load and suspended-load modes. The bed-load sediment flux qb is computed with the following formula [36]:
q b = 0.053 g s 1 d 50 3 1 / 2 θ θ c 2.1 d * 0.3
where s = ρs/ρ is the relative sediment density, d50 is the dimensionless grain size, θ = U f 2 / s 1 g d 50 corresponds to Shields parameter with Uf denoting friction velocity. The critical Shields parameter θc is obtained from the following equation [37]:
θ c = 0.3 1 + 1.2 d * + 0.055 1 exp 0.02 d *
where d* defines dimensionless grain size as
d * = g s 1 / ν 2 1 / 3 d 50
The suspended sediment is governed by the advection-diffusion equation for the volumetric concentration c:
c t + u j w s δ j 3 c x j = x j ν + ν T c x j
with ws the settling velocity of sediment.
The temporal evolution of the erodible bed zb follows the Exner equation:
z b t = 1 n 1 q b i x i + D s E s
where zb represents the bed elevation, n = 0.4 is the bed porosity, and Ds and Es are the deposition and entrainment rates linked to the suspended-load model.
It should be noted that for the clear-water scour regime simulated herein, the van Rijn (1984) [36] bed-load formula combined with the Soulsby-Whitehouse (1997) [37] critical Shields parameter θc has been repeatedly validated against laboratory data for uniform sand, yielding equilibrium scour depths within 3% [29,35]. Alternative closures (e.g., Meyer-Peter-Müller and Nielsen (1992) [29]) produce <5% difference in θc under these conditions and were therefore not adopted. Sensitivity to d* was tested by varying d50 by ±10%; the resulting change in θc was <3% and propagated to <2% change in final scour depth. Angle-of-repose sliding is invoked whenever local bed slope exceeds 32°; excess sediment is redistributed cell-by-cell until the slope is reduced to 31.5°, a threshold consistent with visual observations in the validation experiment.

3. Model Validation

Prior to applying the numerical model to scour-protection optimization, the accuracy of both the hydrodynamic solver and the coupled scour module was systematically validated against two well-documented laboratory data sets: (i) the flow around a surface-mounted cylinder reported by Roulund et al. (2005) [35], and (ii) the scour experiment under identical geometric and hydraulic conditions also presented in Roulund et al. (2005) [35].

3.1. Numerical Setup

To ensure numerical fidelity prior to parameter optimization, the CFD model was first configured to replicate the classic laboratory experiments of Roulund et al. (2005) [35]. As shown in Figure 3, a prismatic channel was discretised around a vertical cylinder. The cylinder axis was positioned downstream of the inlet plane to allow full boundary-layer development. A layer of non-cohesive sediment blanket was laid over the rigid flume bed.
The mesh layout was generated via an adaptive, multi-level nesting block strategy. A background Cartesian grid with uniform spacing spanned the entire domain, while two refined nests, i.e., extending 6D upstream, 10D downstream and 5D laterally, were imposed around the cylinder to capture steep velocity gradients and evolving bed forms. The innermost nest featured a near-wall cell size of 0.02 m, yielding y+ values below 5 along the cylinder surface. Sensitivity analyses confirmed that further refinement beyond 0.627 million cells altered the equilibrium scour depth by <3%. Therefore, the medium-resolution mesh (0.21 M cells) was retained for all subsequent simulations to balance accuracy and computational cost. More details on mesh convergence analysis can be found in Section 3.2.
Boundary conditions were prescribed as follows: a fully developed turbulent velocity profile extracted from a 30 m precursor simulation was mapped onto the inlet; zero-gradient outflow was enforced at the downstream boundary; the free surface was treated as a rigid-lid with symmetry conditions; and no-slip walls were applied to the cylinder surface and the flume bed. Sediment entrainment and deposition were computed at the mobile bed interface using a wall-damping function. The present laboratory-scale simulations (Fr = 0.15, H/D ≈ 5.4) fall within the subcritical and low-Froude regime where surface undulations are <1% of the water depth and the rigid-lid assumption is widely accepted [26,35]. A precursor free-surface LES on the same domain at Fr = 0.15 showed maximum surface draw-down of 0.6 mm (<0.1% H), confirming negligible influence on the horseshoe-vortex position and bed-shear stress. However, for field conditions where Fr can exceed 0.4 and H/D < 2, surface rollers and draw-down may alter the down-flow angle by up to 5° and shift the vortex attachment point landward. These effects would require a two-phase, deforming-mesh approach (VOF or level-set) and are earmarked for future work.

3.2. Validation of Flow

The test configuration consists of a rigid-bed flume 10 m long and 3 m wide. A smooth circular cylinder (D = 0.536 m) was centred 5 m downstream of the inlet. The uniform approach water depth was maintained as h = 0.54 m and the depth-averaged velocity U = 0.35 m/s, yielding a Reynolds number Re = UD/ν = 1.87 × 10⁵ and a Froude number Fr = U/(gh)0.5 = 0.15. The computational domain replicated the experimental set-up with an upstream extent of 10D, a downstream extent of 10D and lateral boundaries 5D from the pier centre-line. A precursor simulation of a 30 m long empty flume was used to generate a fully developed turbulent boundary layer. Then the resulting vertical velocity profile was then mapped onto the inlet of the test section via a restart file.
As listed in Table 2, to verify the sensitivity of computational mesh, three structured grids were examined: coarse (0.113 M), medium (0.213 M) and fine (0.627 M) cells, with successive refinements concentrated within 2D and 6D of the pier. Figure 4 compares the time-averaged streamwise (ux) and vertical (uz) velocity components at two elevations (z = 0.02 m and z = 0.2 m) along the pier centre-line with the laser-Doppler measurements of Roulund et al. (2005) [35]. As can be seen, the negative value of uz indicates the down-flow in front of the pier due to the blocking effect. Similarly, the negative value of ux is due to the formation of horseshoe vortex which causes back-flow in front of the pier, especially in the near-bed region. Through the mesh convergence analysis, it shows the medium grid already produces grid-independent results, and the discrepancies between simulation and experiment are within ±5% for ux and ±8% for uz in the high-gradient regions. Consequently, to balance the computational accuracy and efficiency, the medium-resolution grid is retained for all subsequent scour simulations. We applied the GCI method [38] to the equilibrium maximum scour depth ds and to the peak near-bed velocity ux at the upstream base of the pier. The resulting GCI values are: ds with GCI21 = 2.8%, GCI32 = 1.2% (fine → medium → coarse); ux with GCI21 = 3.4%, GCI32 = 1.5%. These values confirm that the medium mesh lies within the asymptotic range and is therefore mesh-independent for the purposes of parametric design ranking.

3.3. Validation of Scour

The scour validation adopts the same computational domain but adds a 0.15 m thick sediment layer (d50 = 0.26 mm, ρs = 2650 kg/m3). The approach velocity was increased to 0.46 m/s to ensure clear-water conditions (U/Ucr ≈ 0.95). Simulations were run for 1 h physical time, which is sufficient to approach equilibrium scour depth according to the experimental record.
Figure 5 presents the temporal evolution of maximum scour depth at the upstream (θ = 0°) and downstream (θ = 180°) faces of the cylinder. In general, the numerical simulated results agree closely with the experimental data, specifically, the equilibrium scour depths deviate by <3% (simulated 0.078 m and measured 0.080 m at θ = 0°), and the temporal trend follows the logarithmic growth curve reported by Roulund et al. (2005) [35]. Minor under-prediction (<5%) downstream is attributed to the turbulence modeling inherent limitation in capturing the full dynamics of the detached pier wake low. The 5–8% under-prediction of scour depth in the first 10–15 min consistent with previous RANS-based scour studies [26,35] and can be attributed to two factors: (i) the kω turbulence model slightly delays the initial amplification of the horseshoe-vortex core, postponing peak bed-shear stress; and (ii) the bed-load adaptation length used in the van Rijn closure smooths the instantaneous flux peaks responsible for the first scour burst. Because these effects are transient and largely self-cancel after approximately 20 min, the equilibrium scour depth remains within the 3% target, validating the model for parametric design purposes.
Nevertheless, the overall conformity confirms that the present numerical set-up reliably reproduces both the flow field and the resulting morphological response. On the basis of these validations, the proposed CFD model was deployed for the parametric investigation of the combined sacrificial-pile and collar protection system described in Section 4.

4. Combined Scour Protection

Following model validation, a parametric study was undertaken to quantify the performance of the proposed combined scour protection system, i.e., sacrificial-pile + collar (SPC). Two geometric variables were primarily examined: (i) the streamwise distance dp between the centre of the sacrificial pile and the pier axis, and (ii) the vertical height hc of the collar above the initial bed. All tests were conducted under clear-water scour conditions. All tests were conducted under clear-water scour conditions (U = 0.46 m/s, H = 0.40 m, d50 = 0.26 mm). The pier diameter D = 0.10 m and collar diameter Dc = 5D were kept constant. Table 3 summaries the test cases and the resulting maximum scour depths ds, together with the scour reduction, which is defined as the relative difference of scour depth between the protected and unprotected case. The scour reduction is defined as
Scour reduction (%) = (ds,uds,scp)/ds,u × 100
where ds,u is the baseline of scour depth without protection, and ds,scp is the equilibrium scour depth for the protected case under evaluation.
All simulations were executed on an Intel Xeon Gold 6248R workstation (20 cores @ 3.0 GHz base, AVX-512) with 128 GB RAM. No GPU acceleration was used. A single 60-min physical-time scour run on the medium mesh required ~10 wall-clock hours using 18 MPI ranks. The complete parametric matrix—seven SPC geometries plus unprotected and single-device cases—totaled 7 simulations, equivalent to ~70 CPU-hours. This cost is within the reach of most bridge-design offices and can be further reduced by ~35% with coarser time-stepping once the baseline configuration is established.

4.1. Scour Without Protection

Under clear-water conditions and in the absence of any scour countermeasures, the cylindrical pier swiftly triggers an archetypal local-scour process whose equilibrium state is illustrated in Figure 6a. The scour hole grows monotonically until, after roughly 3.5 h of physical time, it stabilizes at a maximum depth of 0.078 m side of the pier nose. This temporal trajectory, plotted in Figure 6b, adheres closely to the classical logarithmic law, with only minor oscillations once equilibrium is approached, reflecting intermittent turbulent bursts within the horseshoe-vortex system. The resulting morphology assumes a near-symmetrical, inverted-conical geometry whose upstream slope angles lie at 25–28°, virtually identical to the submerged angle of repose of the uniform sand. The lateral extent of scour, measured at the original bed level, reaches approximately 2.2D, while the deepest point is located at the side position of the pier, directly beneath the amplified bed shear stress induced by the separated flow from the pier sides.
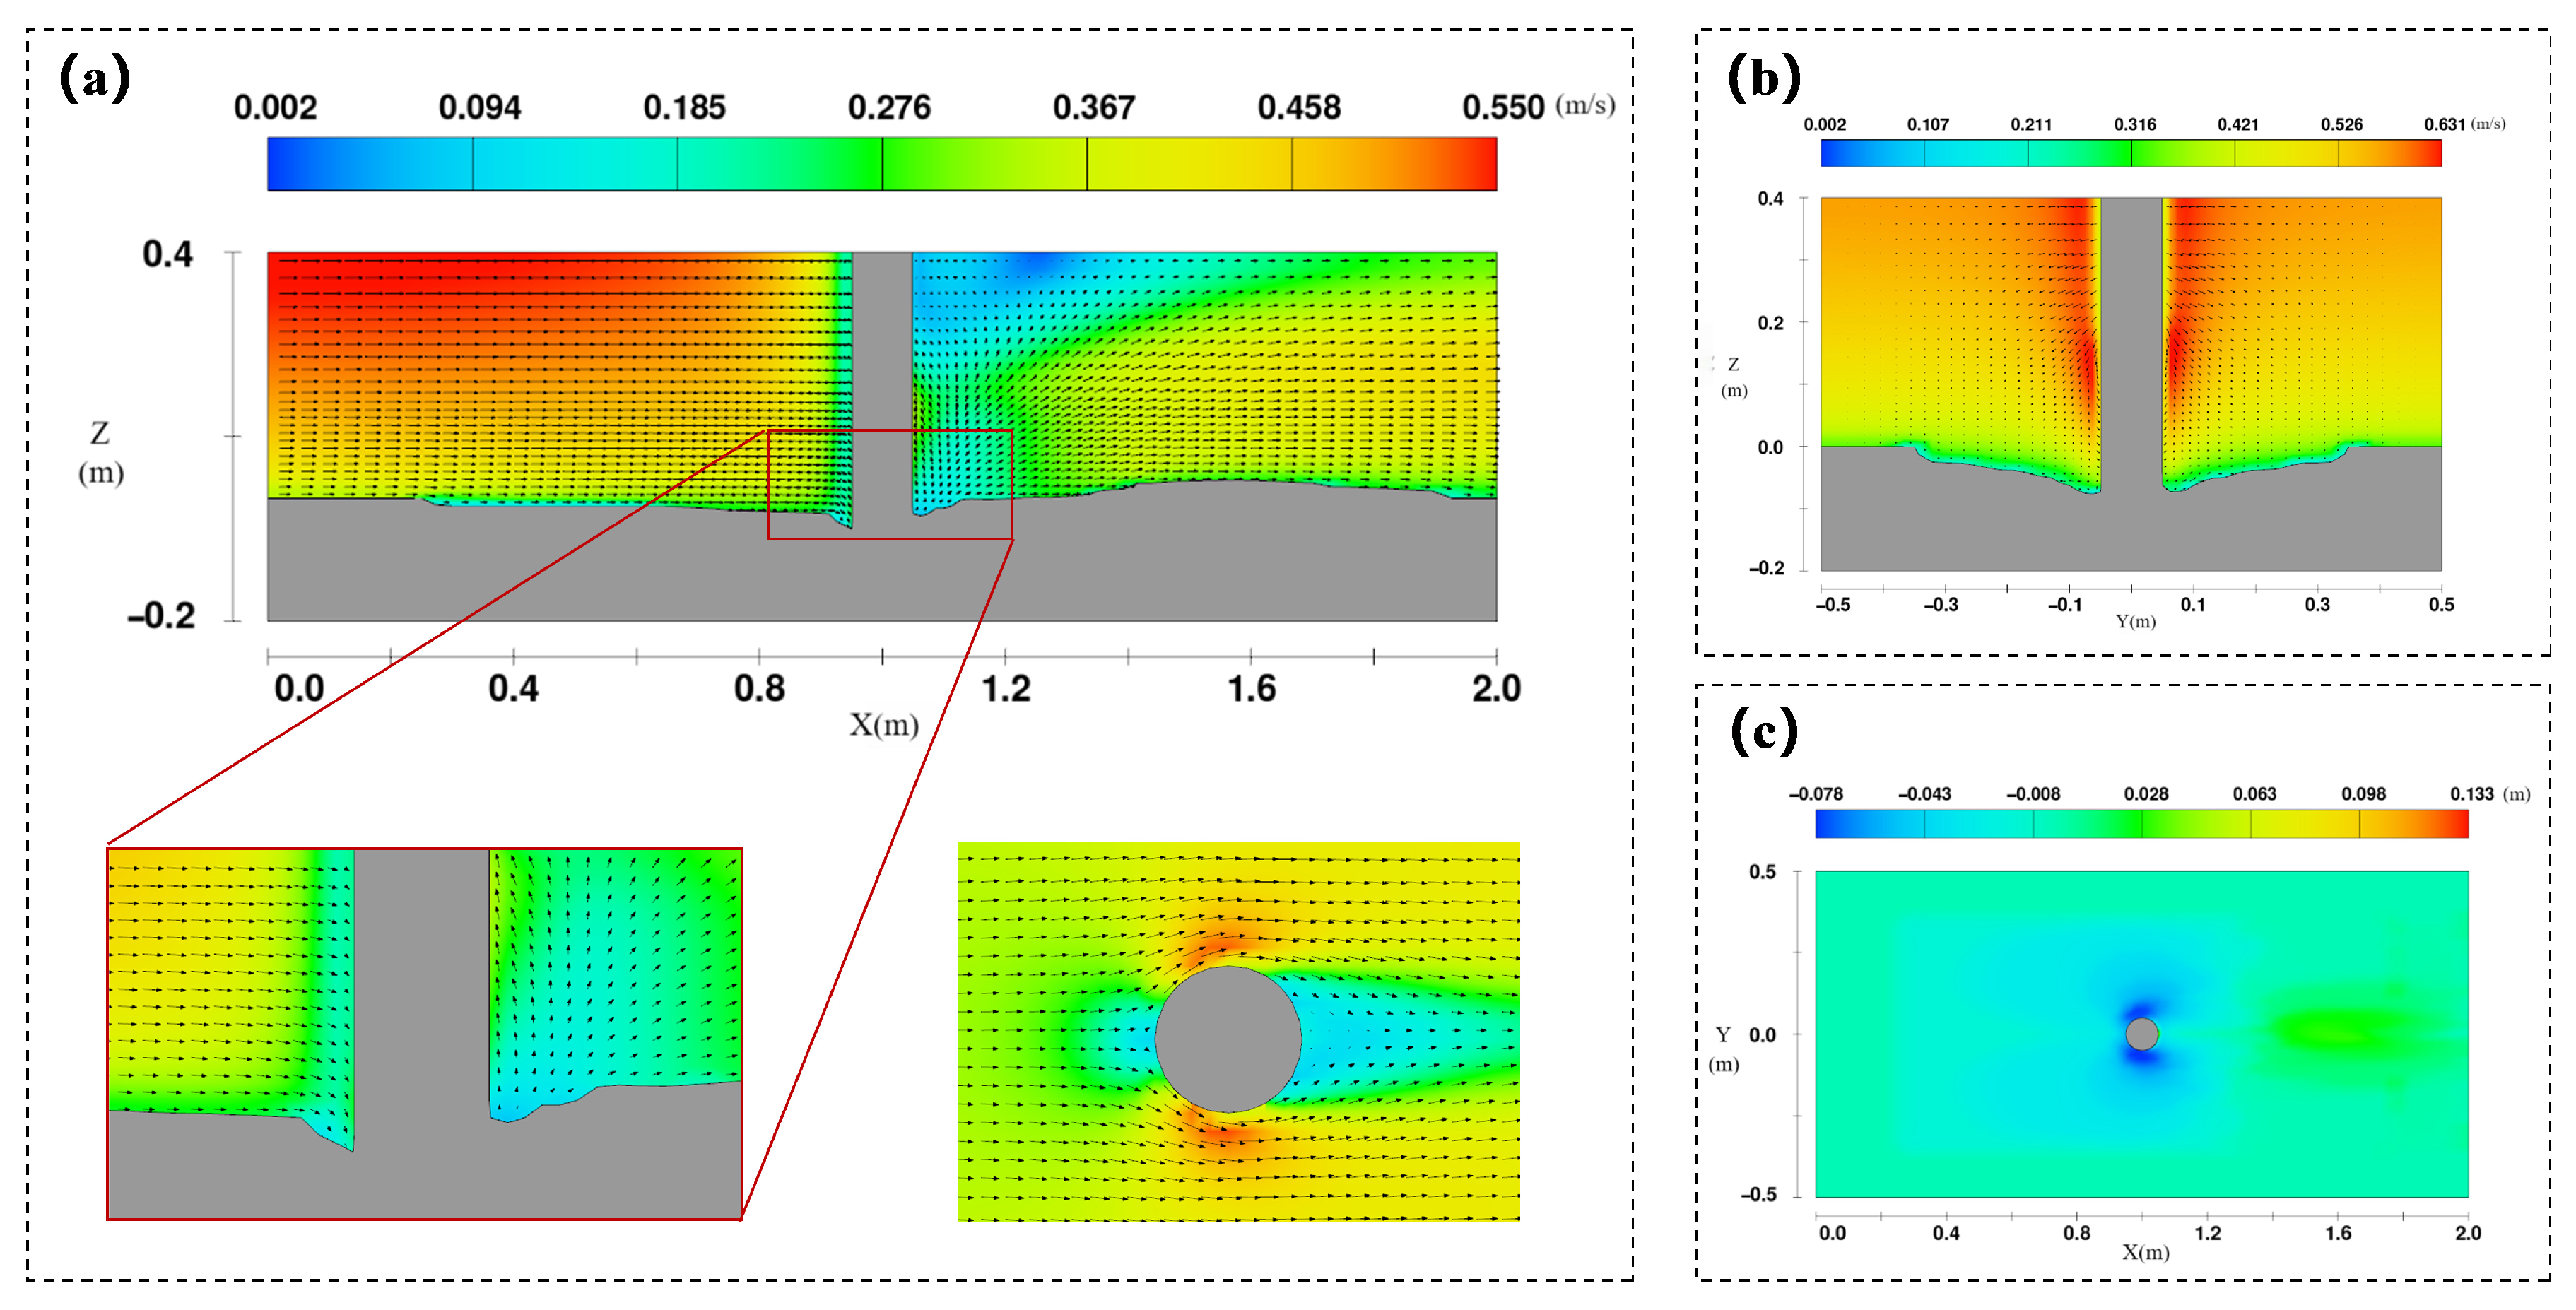
Flow-field interrogation around the pier is illustrated in Figure 7, which confirms that a coherent clockwise HV, centered at 0.15D above the bed and approximately 0.3D upstream of the leading edge, governs sediment entrainment. The associated down-flow attains vertical velocities, and the resulting peak dimensionless Shields parameter exceeds the critical value at the point of vortex attachment. Once the scour hole deepens, however, bed-shear stresses within the pit drop below the entrainment threshold, providing a self-limiting mechanism that arrests further incision. Sediment continuity is maintained by slow lateral widening, and by downstream deposition in the form of a pronounced ridge, which is termed the “dune tail” and extends 2.5D behind the pier. The ridge axis exhibits a slight lateral asymmetry induced by vortex shedding.
Overall, the unprotected pier develops a deep, conical scour hole flanked by a downstream depositional lobe. Both the equilibrium scour depth and the lateral scour extent are in excellent agreement with established empirical predictors, thereby furnishing a reliable benchmark for evaluating the efficacy of the combined sacrificial-pile and collar system discussed in the following sections.

4.2. Effect of Sacrificial-Pile Distance

Figure 8 presents the coupled morphodynamic and hydrodynamic response when the sacrificial pile is deployed at three distinct streamwise spacings, i.e., Cases 1–3 corresponding to dp/D = 4, 5 and 6. The equilibrium bed-elevation contours (Figure 8a–c) reveal a progressive transition in scour-hole geometry, while the corresponding vector fields (Figure 8d) clarify the underlying flow-sediment interactions.
At the closest spacing, dp/D = 4 (Figure 8a), the sacrificial pile is embedded deep within the approach boundary layer. The pile wake is characterized by a broad, low-velocity region that envelops the entire upstream face of the pier. This wake effectively displaces the core of the horseshoe vortex approximately 0.15D upstream of its unprotected location, as evidenced by the split in the high-magnitude bed shear-stress locus in Figure 8d. The resulting scour hole is markedly shallower (ds = 0.062 m with 20.5% scour reduction) and laterally compressed, reflecting the inability of the weakened horseshoe vortex to sustain lateral sediment transport. A secondary, but shallow, excavation forms immediately downstream of the pile, feeding a bimodal sediment ridge that merges 2.8D downstream.
Increasing the distance of dp/D to 5 (Figure 8b) relocates the pile to the edge of the boundary layer. Here, the pile wake is still energetic enough to deflect the lower third of the approach flow, yet insufficient to displace the horseshoe vortex. Instead, a secondary counter-rotating vortex pair emerges between the pile and the pier. This dual-vortex system redistributes the bed shear stress more evenly along the pier circumference, producing a wider, flatter scour depression (ds = 0.071 m with 9% scour reduction). The downstream ridge coalesces into a single, symmetric bar centered at 2.5D, closely resembling the configuration observed for the unprotected case.
At dp/D = 6 (Figure 8c), the pile is situated beyond the energetic core of the approach flow. The wake deficit no longer interacts with the pier boundary layer, meanwhile the vortex re-establishes its conventional position and strength, resulting in a scour depth of 0.067 m (14.1% reduction). The scour hole regains its characteristic conical shape, and the downstream ridge returns to the single-peak morphology typical of the baseline scenario.
Temporal traces of the maximum scour depth (Figure 8f) corroborate these spatial trends. The dp/D = 4 case approaches equilibrium most rapidly, owing to the immediate sheltering effect, whereas the dp/D = 6 curve converges last and asymptotically approaches the unprotected reference. Collectively, the results indicate that the pile-to-pier spacing exerts a non-monotonic influence on scour mitigation, and an optimum balance between flow redistribution and structural footprint is achieved at dp/D ≈ 5, where scour reduction remains appreciable without introducing secondary erosion around the pile.
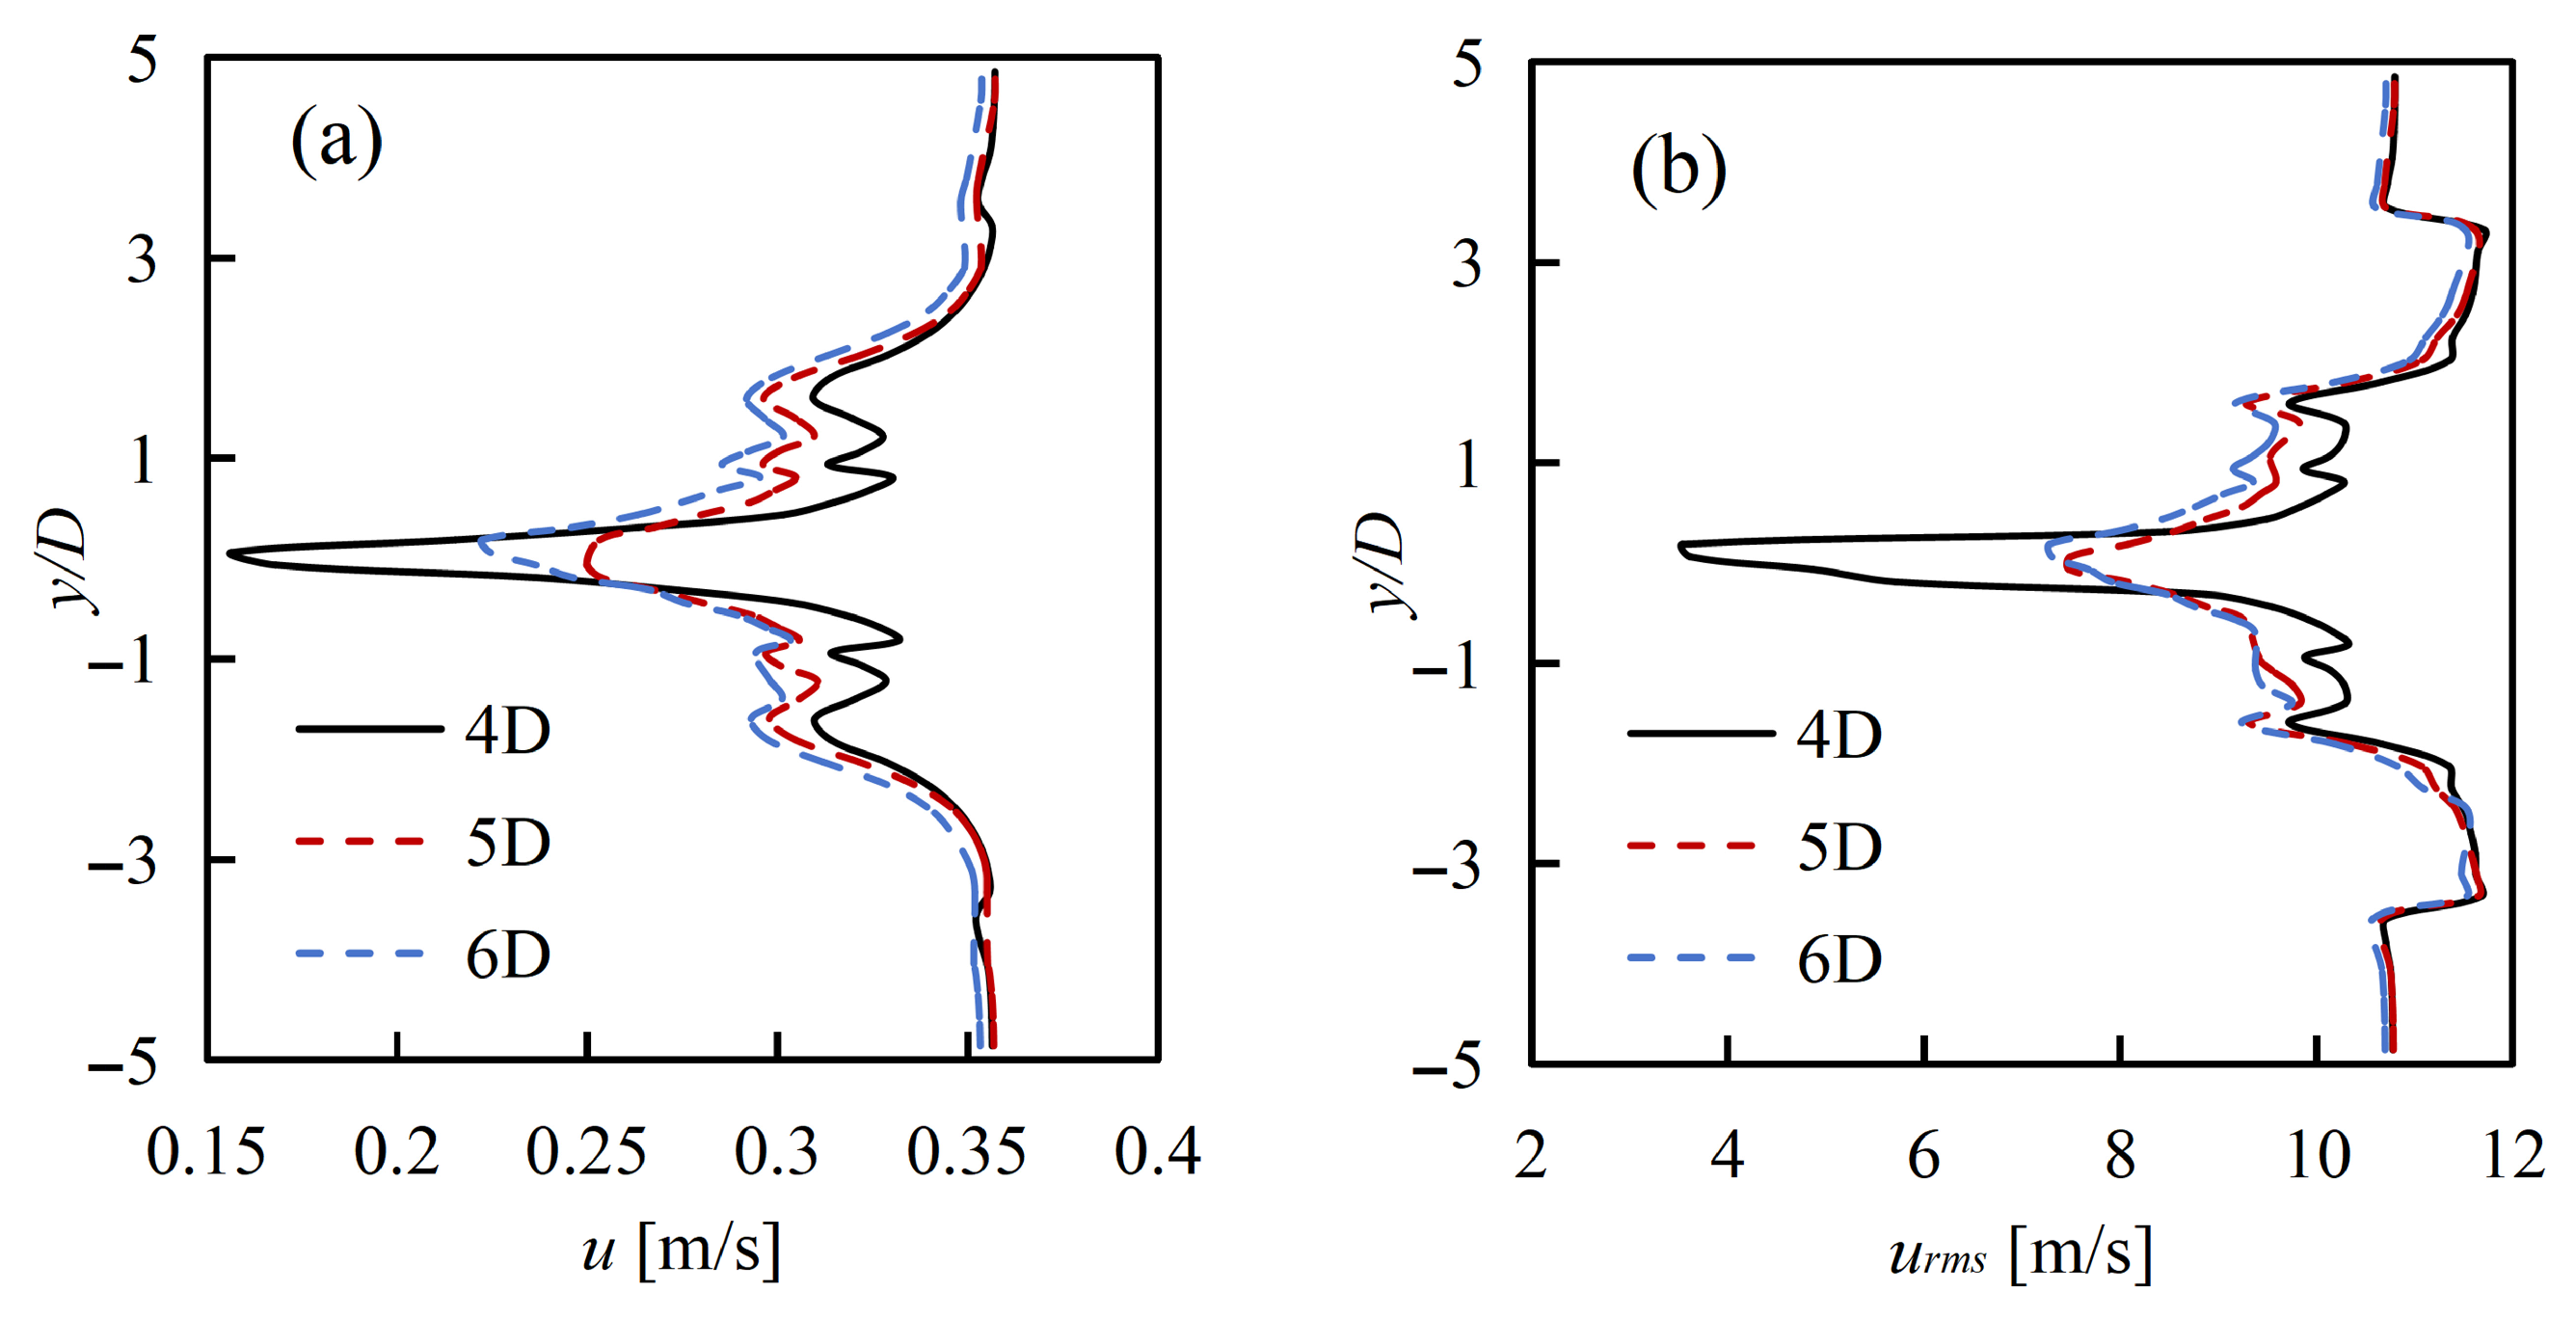
Figure 9 presents the profiles of streamwise velocity and turbulence intensity upstream of the pier nose. It reveals that both the velocity and turbulence intensity peak at dp/D = 4, weaken markedly at dp/D = 5, and partially remain constant at dp/D = 6 as the sacrificial pile wake no longer interacts with the energetic boundary-layer core.

4.3. Effect of Collar Height

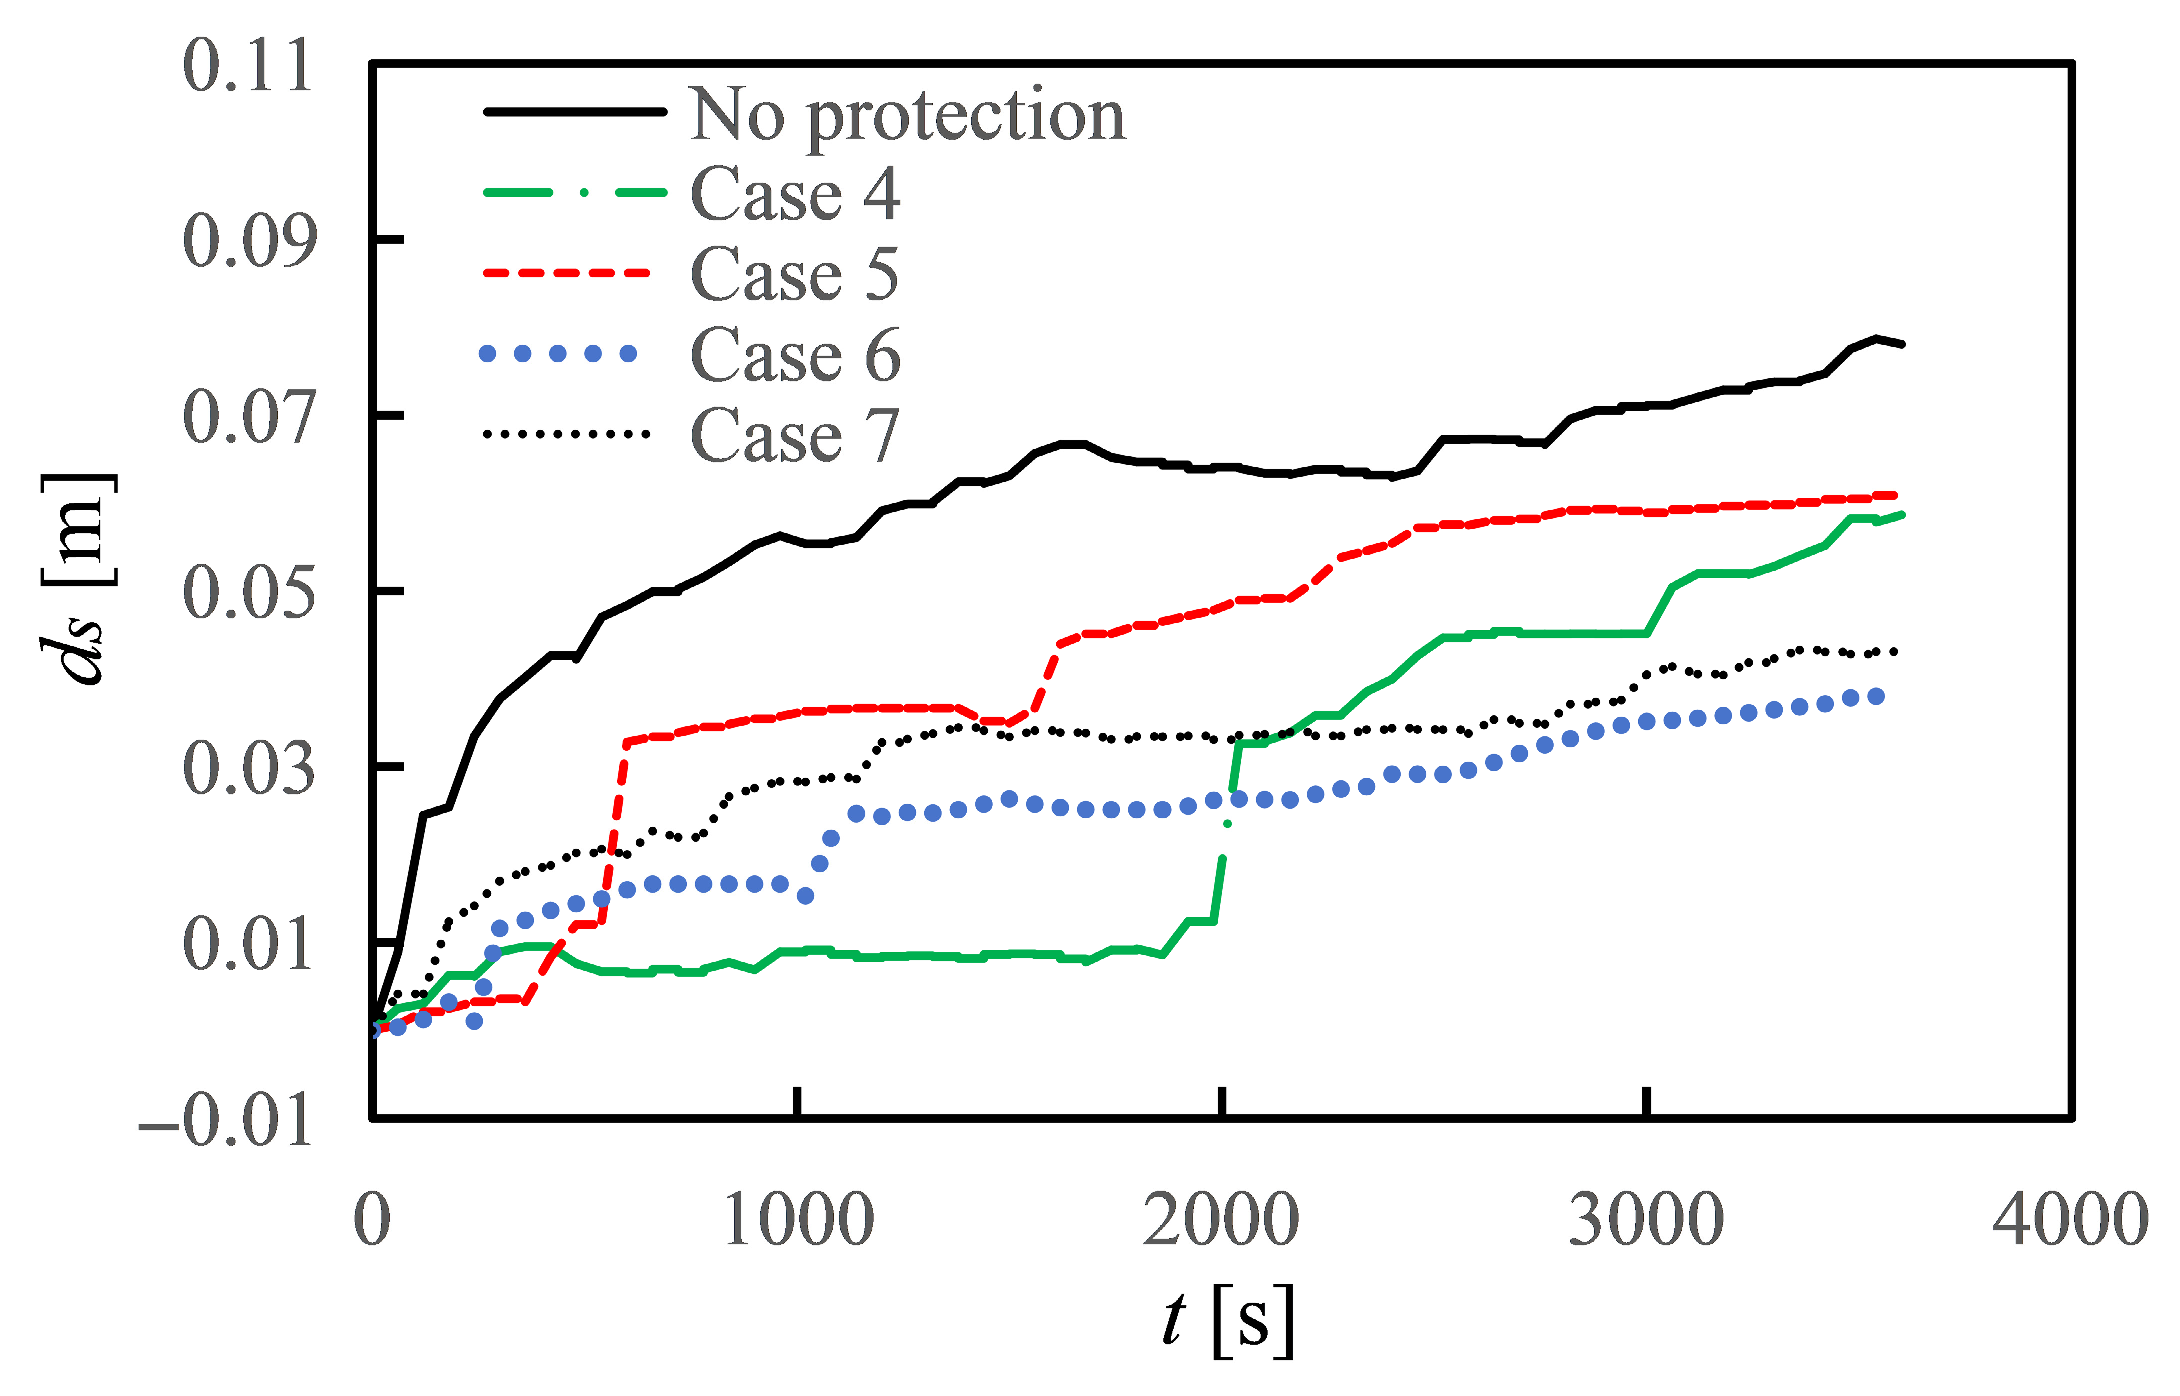
With the sacrificial pile fixed at the previously determined optimum offset (dp/D = 5), attention is turned to the vertical positioning of the collar. Figure 10 and Figure 11 jointly document the temporal scour evolution and the corresponding flow field for collar elevations hc/D = 0, 0.1, 0.2 and 0.3 (Cases 4–7).
Figure 10 reveals a pronounced sensitivity of the scour depth to collar clearance. When the collar is laid flush with the bed (hc/D = 0), the initial protection is almost instantaneous: the collar completely blankets the sediment immediately adjacent to the pier, eliminating direct impingement of the horseshoe-vortex core. However, the absence of a sub-collar gap permits continuous winnowing of sediment from beneath the plate. After approximately 40 min a sudden jump in scour depth occurs as the collar undermines and becomes hydraulically ineffective. The final scour depth reaches 0.058 m, corresponding to a modest 25.6% reduction.
As shown in Figure 11, raising the collar to hc/D = 0.1 introduces a narrow vent, yet the temporal trace indicates marginal improvement: the scour hole stabilizes at ds = 0.061 m (21.8% reduction) once the gap is partially refilled by suspended sediment. The velocity field shows that the horseshoe vortex is displaced vertically into the gap, but its attachment point on the bed remains within the collar footprint, sustaining a localized excavation. A further increase to hc/D = 0.2 fundamentally alters the flow–sediment interplay. The gap height is sufficient to accommodate the lower portion of the horseshoe vortex without permitting direct bed contact. The associated down-flow is deflected laterally, producing a broad, shallow shear layer that spreads across the collar surface. Consequently, bed shear stresses upstream of the pier drop, and scour depth asymptotically approaches 0.038 m, yielding the maximum observed reduction of 51.3%. Beyond this optimum, hc/D = 0.3 enlarges the gap to the extent that the horseshoe vortex re-establishes its original bed-attachment locus beneath the collar. The sheltering effect diminishes and the equilibrium scour depth rebounds to 0.043 m (44.9% reduction). Inspection of the temporal curves also shows a delayed onset of equilibrium, indicating that the larger clearance allows intermittent bursts to re-transport sediment.
Collectively, the results demonstrate that collar elevation governs the vertical positioning of the vortex and thereby dictates the spatial distribution of bed shear stress. An optimum clearance of hc/D = 0.2 effectively severs the flow coupling without inducing secondary undermining, delivering the greatest scour mitigation observed in the present study.

4.4. Optimal Configuration

Integrating the parametric insights of Section 4.2 and Section 4.3, the final configuration was assembled by conjoining the sacrificial pile at the upstream position of dp/D = 5, with a collar elevated at hc/D = 0.2. Figure 12 contrasts the scour reduction with the unprotected baseline. For case 6, which is the optimum configuration, the maximum scour depth is reduced to 0.038 m, corresponding to a 51.2% reduction relative to the no-countermeasure case. More importantly, the morphology is fundamentally altered. It is worth noting that empirical scour-depth predictors were developed for unprotected piers and lack geometric variables for collars or sacrificial piles; they therefore systematically over-estimate the equilibrium depth when applied to the SPC configuration. For this reason, no quantitative comparison is presented herein.
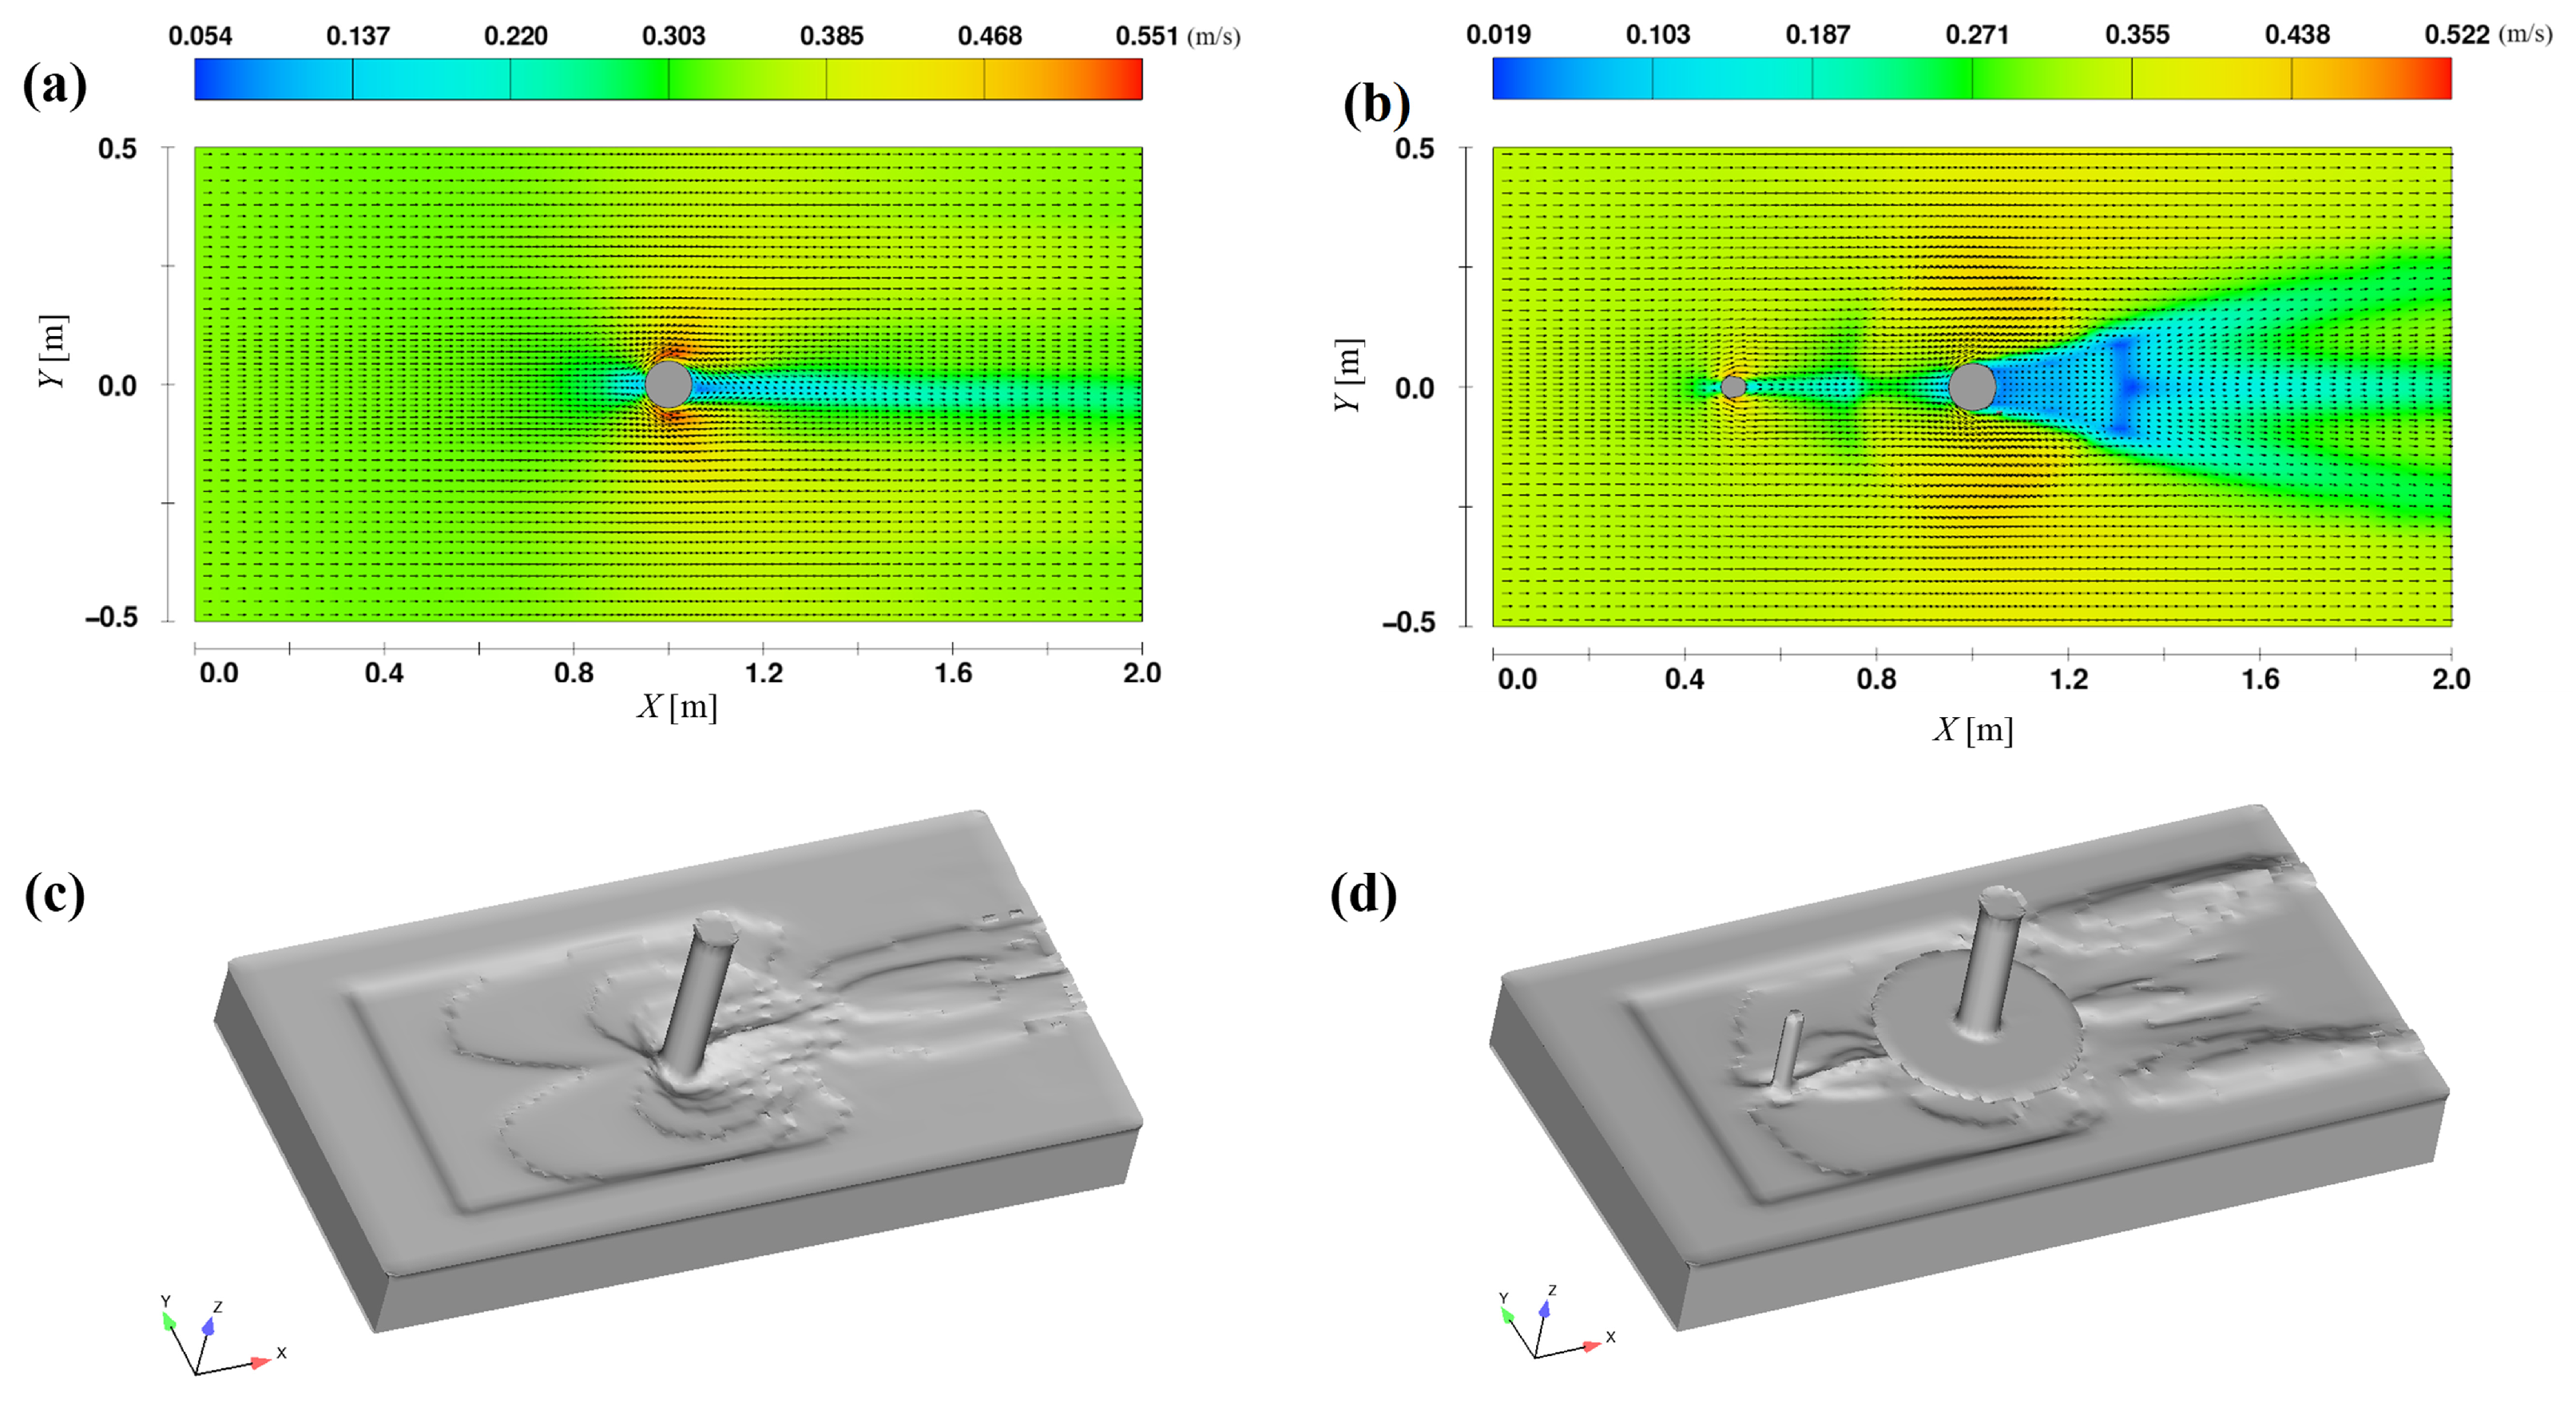
The underlying hydrodynamic mechanism is elucidated in Figure 13. The pile wake deflects the lower 30% of the approach flow laterally, thereby reducing the stagnation pressure at the pier nose. The collar simultaneously suppresses the vertical pressure gradient responsible for horseshoe vortex formation. The vortex core is lifted entirely above the bed and the associated down-flow is dissipated across the collar surface. Jointly, these effects produce a pronounced reduction in the bed shear-stress peak and a more uniform circumferential distribution. No adverse interference, such as additional scour at the pile, is observed, confirming the compatibility of the two devices.
In addition, Figure 14 quantifies the synergy between the two devices. The index Sy evaluating synergy effect is defined as
S y = d s , s p c ( d s , p + d s , c ) d s , u
where Δds,spc, Δds,p and Δds,c denotes the scour-depth reduction under SCP, sacrificial pile and collar protections, respectively, ds,u is the baseline of scour depth without protection. The synergy for the optimum case is quantified as Sy = 7.5%, with a combined 95% confidence interval of ±1.3% derived from two independent uncertainty sources: mesh-sensitivity contributes ±0.8% (based on GCI-based 95% CI) and turbulent-stochastic variability contributes ±0.7% (obtained from three 60-min realizations with different initial random fields and 95% CI via bootstrapping 10-s windows). Operating in isolation, the pile yields a modest 17.9% reduction, whereas the collar alone achieves 41.0%. When combined, the non-linear interaction is positive, and the total reduction reaches 51.2%, exceeding the sum of individual contributions by 7.5%.
Time histories show that the combined system reaches equilibrium 20% faster than either device acting alone, corroborating the stabilizing influence of the pile wake on collar-induced secondary vortices. Equilibrium is declared when |Δds/Δt| < 0.5% of pier diameter D per hour (ε = 5 × 10⁻⁴ m/h). Using this criterion, the equilibrium time Tₑq values are: Unprotected with 3.51 ± 0.07 h; Collar only with 3.28 ± 0.09 h; Pile only with 3.35 ± 0.08 h; SPC optimum (dp/D = 5, hc/D = 0.2) with 2.73 ± 0.06 h. The results confirm that the SPC configuration reaches equilibrium significantly faster than either single device, corresponding to a 19.7% reduction in Tₑq relative to the unprotected case.
In summary, the optimized SPC configuration (dp/D = 5, hc/D = 0.2) delivers a 51% reduction in equilibrium scour depth, outperforms either countermeasure individually, and transforms the local scour pattern into a stable, wide-shallow morphology.

4.5. Discussion of Applicable Conditions

The present study is confined to scour around an isolated cylinder; some other factors which could be applied are discussed as follows.
(i)
Unsteady hydrographs: Rapidly rising or falling flood events can produce deeper but shorter-lived scour holes; synthetic hydrograph-coupled CFD can be used for pre-screening, but must ultimately be validated with scaled physical tests.
(ii)
Pier groups: Wake-wake interactions between closely spaced piers may amplify local scour; preliminary CFD suggests that the optimal pile-to-pier spacing shifts and the collar diameter should be enlarged when pier spacing is reduced.
(iii)
Coarse or broadly graded sediment: Armoring and hiding-exposure effects in non-uniform beds may reduce scour depths; a two-layer sediment transport model is recommended for screening-level analyses.
(iv)
Ice and debris loading: Collars can act as debris collectors, increasing drag and potentially altering flow patterns; removable collar sections and regular post-flood inspections are advised.
(v)
Construction and maintenance: GPS-guided installation and pre-construction bathymetric surveys help keep alignment errors within the narrow tolerance band that preserves SPC efficiency; periodic checks for pile tilt and collar settlement are recommended.

5. Conclusions

A high-resolution CFD study was conducted to optimize a combined sacrificial-pile and collar (SPC) system for local scour mitigation around a circular bridge pier. After rigorous validation against benchmark experiments, a systematic parametric analysis was performed to quantify the influence of pile-to-pier spacing and collar elevation on scour depth. The principal findings are summarized below:
(1)
A verified CFD model, benchmarked against laboratory flow and scour data, replicates scour depths within error of 3%, thus providing a robust numerical platform for evaluating countermeasures.
(2)
Deployment of the combined sacrificial-pile and collar (SPC) system fundamentally altered the local scour pattern, which shows that the upstream conical pit is almost eliminated, and lateral scour becomes wider yet markedly shallower.
(3)
Parametric optimization shows that scour mitigation is maximized when the pile is located at dp/D = 5 ahead of the pier and the collar is elevated hc/D = 0.2 above the bed, yielding a 51% reduction in maximum scour depth compared to the unprotected case.
(4)
The combined system outperformed the sum of individual pile (18%) and collar (41%) efficiencies, demonstrating a synergistic interaction that suppresses the horseshoe vortex and redistributes bed shear stress without inducing secondary erosion.
The present study is confined to scour around an isolated cylinder; thus, the effects of flood unsteadiness and pier-group interference remain unexplored. Future work should integrate physical-flume tests with numerical simulation to validate the findings under these complex conditions and to assess the performance of the combined protection system.

Author Contributions

X.W.: Conceptualization; Project administration; Funding acquisition; Writing—original draft; W.L.: Project administration; Funding acquisition; Writing—original draft; Z.P.: Formal analysis; Investigation; Q.Y.: Funding acquisition; Writing—original draft; Y.Y.: Methodology; Validation; Visualization; J.L.: Visualization; Writing—review & editing. All authors have read and agreed to the published version of the manuscript.

Funding

This research is financially supported by the Research Project under the 2021 Annual Scientific Research Plan of China Railway Construction Corporation Limited (Project Nos. 2021-C01, ZT-2020A01) and the Youth Science and Technology Leaders Training Program Project of Jiangxi Bureau of Geology (No. 2022JXDZKJRC07).

Data Availability Statement

The original contributions presented in this study are included in the article. Further inquiries can be directed to the corresponding authors.

Conflicts of Interest

Authors Xiangdong Wang, Wentao Li and Zhiwen Peng were employed by the China Civil Engi-neering Construction Corporation. Author Qianmi Yu was employed by the Ningbo East China Nuclear Industry Survey and Design Institute Group Co., Ltd. The remaining authors declare that the research was conducted in the absence of any commercial or financial relationships that could be construed as a potential conflict of interest. The authors declare that this study received funding from 2021 Annual Scientific Research Plan of China Railway Construction Corporation Limited . The funder was not involved in the study design, collection, analysis, interpretation of data, the writing of this article or the decision to submit it for publication.

References

  1. Xiong, W.; Cai, C.S.; Zhang, R.; Shi, H.; Xu, C. Review of hydraulic bridge failures: Historical statistic analysis, failure modes, and prediction methods. J. Bridge Eng. 2023, 28, 03123001. [Google Scholar] [CrossRef]
  2. Ettema, R.; Gonstantinescu, G.; Melville, B.W. Flow-field complexity and design estimation of pier-scour depth: Sixty years since Laursen and Toch. J. Hydraul. Eng. 2017, 143, 03117006. [Google Scholar]
  3. Wang, C.; Yu, X.; Liang, F.Y. A review of bridge scour: Mechanism, estimation, monitoring and countermeasures. Nat. Hazards 2017, 87, 1881–1906. [Google Scholar] [CrossRef]
  4. Li, J.Z.; Qi, M.L.; Fuhrman, D.R.; Chen, Q.G. Influence of turbulent horseshoe vortex and associated bed shear stress on sediment transport in front of a cylinder. Exp. Therm. Fluid Sci. 2018, 97, 444–457. [Google Scholar] [CrossRef]
  5. Li, J.; Yang, Y.; Yang, Z. Influence of scour development on turbulent flow field in front of a bridge pier. Water 2020, 12, 2370. [Google Scholar] [CrossRef]
  6. Yang, Y.L.; Qi, M.L.; Li, J.Z. Evolution of hydrodynamic characteristics with scour hole developing around a pile group. Water 2018, 10, 1632. [Google Scholar] [CrossRef]
  7. Yang, Y.L.; Li, J.Z. Experimental study of flow field around pile groups using PIV. Exp. Therm. Fluid Sci. 2021, 120, 110223. [Google Scholar] [CrossRef]
  8. Yang, Y.L.; Qi, M.L.; Wang, X.; Li, J.Z. Experimental study of scour around pile groups in steady flows. Ocean. Eng. 2020, 195, 106651. [Google Scholar] [CrossRef]
  9. Qi, M.L.; Li, J.Z.; Chen, Q.G. Comparison of existing equations for local scour at bridge piers: Parameter influence and validation. Nat. Hazards 2016, 82, 2089–2105. [Google Scholar] [CrossRef]
  10. Qi, M.L.; Li, J.Z.; Chen, Q.G. Applicability analysis of pier-scour equations in the field: Error analysis by rationalizing measurement data. J. Hydraul. Eng. 2018, 144, 04018050. [Google Scholar] [CrossRef]
  11. Chiew, Y.M. Scour protection at bridge piers. J. Hydraul. Eng. 1992, 118, 1260–1269. [Google Scholar] [CrossRef]
  12. Chen, J.; Qu, Y.; Sun, Z. Protection mechanisms, countermeasures, assessments and prospects of local scour for cross-sea bridge foundation: A review. Ocean Eng. 2023, 288, 116145. [Google Scholar] [CrossRef]
  13. Cui, J.; Bao, T.; Ding, X.; Tang, C.; Li, T.; Zhou, W. Scour prediction, monitoring, and protection measures for offshore wind turbines: Recent advancements and insights. Ocean Eng. 2025, 339, 122194. [Google Scholar] [CrossRef]
  14. Melville, B.W.; Hadfield, A.C. Use of sacrificial piles as pier scour countermeasures. J. Hydraul. Eng. 1999, 125, 1221–1224. [Google Scholar] [CrossRef]
  15. Wang, S.; Wei, K.; Shen, Z.; Xiang, Q. Experimental investigation of local scour protection for cylindrical bridge piers using anti-scour collars. Water 2019, 11, 1515. [Google Scholar] [CrossRef]
  16. Lee, W.L.; Lu, C.W.; Huang, C.K. Application of a single porous basket as a pier scour countermeasure. Water 2021, 13, 3052. [Google Scholar] [CrossRef]
  17. Shahhosseini, M.; Yue, S.; Xu, J.; Zhang, M.; Yu, G. Scour depth at a pile with a collar at bed level in clear-water current. Ocean Eng. 2025, 320, 120319. [Google Scholar] [CrossRef]
  18. Chiew, Y.M.; Lim, F.H. Parametric study of riprap failure around bridge piers. J. Hydraul. Res. 2001, 39, 61–72. [Google Scholar] [CrossRef]
  19. Dey, S.; Sumer, B.M.; Fredsoe, J. Control of scour at vertical circular piles under waves and current. J. Hydraul. Eng. 2006, 132, 270–279. [Google Scholar] [CrossRef]
  20. Qi, L.; Li, N.; Zhu, K.; Sun, Z.; Wang, Z.; Yang, J.; Wang, J. Numerical simulation study on the protective performance of scour protection ring for offshore wind turbine single pile foundation. Coast. Eng. 2024, 43, 129–141. [Google Scholar]
  21. Farooq, R.; Ghumman, A.R.; Tariq, M.A.U.R.; Ahmed, A.; Jadoon, K.Z. Optimal octagonal hooked collar countermeasure to reduce scour around a single bridge pier. Period. Polytech. Civ. Eng. 2020, 64, 1026–1037. [Google Scholar] [CrossRef]
  22. Farooq, R.; Azimi, A.H.; Tariq, M.A.U.R.; Ahmed, A. Effects of hooked-collar on the local scour around a lenticular bridge pier. Int. J. Sediment Res. 2023, 38, 1–11. [Google Scholar] [CrossRef]
  23. Keshavarz, A.; Vaghefi, M.; Ahmadi, G. Collars for scour reduction around different shapes of bridge piers in a 180° sharp bend. Int. J. Civ. Eng. 2024, 22, 1733–1751. [Google Scholar] [CrossRef]
  24. Sharafati, A.; Haghbin, M.; Haji Seyed Asadollah, S.B.; Tiwari, N.K.; Al-Ansari, N.; Yaseen, Z.M. Scouring depth assessment downstream of weirs using hybrid intelligence models. Appl. Sci. 2022, 10, 3714. [Google Scholar] [CrossRef]
  25. Khan, Z.U.; Khan, D.; Murtaza, N.; Pasha, G.A.; Alotaibi, S.; Rezzoug, A.; Benzougagh, B.; Khedher, K.M. Advanced prediction models for scouring around bridge abutments: A comparative study of empirical and AI techniques. Water 2024, 16, 3082. [Google Scholar] [CrossRef]
  26. Baykal, C.; Sumer, B.M.; Fuhrman, D.R.; Jacobsen, N.G.; Fredsøe, J. Numerical investigation of flow and scour around a vertical circular cylinder. Philos. Trans. R. Soc. A 2015, 373, 20140104. [Google Scholar] [CrossRef]
  27. Li, J.; Fuhrman, D.R.; Kong, X.; Xie, M.; Yang, Y. Three-dimensional numerical simulation of wave-induced scour around a pile on a sloping beach. Ocean Eng. 2021, 233C, 109174. [Google Scholar] [CrossRef]
  28. Li, J.; Kong, X.; Yang, Y.; Deng, L.; Xiong, W. CFD investigations of tsunami-induced scour around bridge piers. Ocean Eng. 2022, 244, 110373. [Google Scholar] [CrossRef]
  29. Li, J.; Kong, X.; Yang, Y.; Yang, Z.; Hu, J. Numerical modeling of solitary wave-induced flow and scour around a square onshore structure. J. Mar. Sci. Eng. 2023, 11, 198. [Google Scholar] [CrossRef]
  30. Zhang, Q.; Tang, G.; Lu, L.; Yang, F. Scour Protections of Collar around a Monopile Foundation in Steady Current. Ocean Eng. 2021, 112, 102718. [Google Scholar] [CrossRef]
  31. Valela, C.; Rennie, C.D.; Nistor, I. Improved Bridge Pier Collar for Reducing Scour. Int. J. Sediment Res. 2022, 37, 37–46. [Google Scholar] [CrossRef]
  32. Tang, Z.; Melville, B.; Shamseldin, A.; Guan, D.; Singhal, N.; Yao, Z. Experimental Study of Collar Protection for Local Scour Reduction around Offshore Wind Turbine Monopile Foundations. Coast. Eng. 2023, 183, 104324. [Google Scholar] [CrossRef]
  33. Wang, C.; Liang, F.; Yu, X. Experimental and Numerical Investigations on the Performance of Sacrificial Piles in Reducing Local Scour around Pile Groups. Nat. Hazards 2017, 85, 1417–1435. [Google Scholar] [CrossRef]
  34. Wilcox, D.C. Turbulence Modeling for CFD, 3rd ed.; DCW Industries, Inc.: La Canada, CA, USA, 2006. [Google Scholar]
  35. Roulund, A.; Sumer, B.M.; Fredsoe, J.; Michelsen, J. Numerical and experimental investigation of flow and scour around a circular ple. J. Fluid Mech. 2005, 534, 351–401. [Google Scholar] [CrossRef]
  36. van Rijn, L. Sediment transport, Part I: Bed load transport. J. Hydraul. Eng. 1984, 110, 1431–1456. [Google Scholar] [CrossRef]
  37. Soulsby, R.L.; Whitehouse, R.J.S. Threshold of sediment motion in coastal environments. In Pacific Coasts and Ports ’97: Proceedings of the 13th Australasian Coastal and Ocean Engineering Conference and the 6th Australasian Port and Harbour Conference, Christchurch, New Zealand, 7–11 September 1997; Centre for Advanced Engineering, University of Canterbury: Christchurch, New Zealand, 1997; Volume 1, Available online: https://www.fid-move.de/en/search/id/BLCP:CN026539711/Threshold-of-Sediment-Motion-in-Coastal-Envir… (accessed on 12 August 2025).
  38. Roache, R.J. Quantification of uncertainty in computational fluid dynamics. Annu. Rev. Fluid Mechanics. 1997, 29, 123–160. [Google Scholar] [CrossRef]
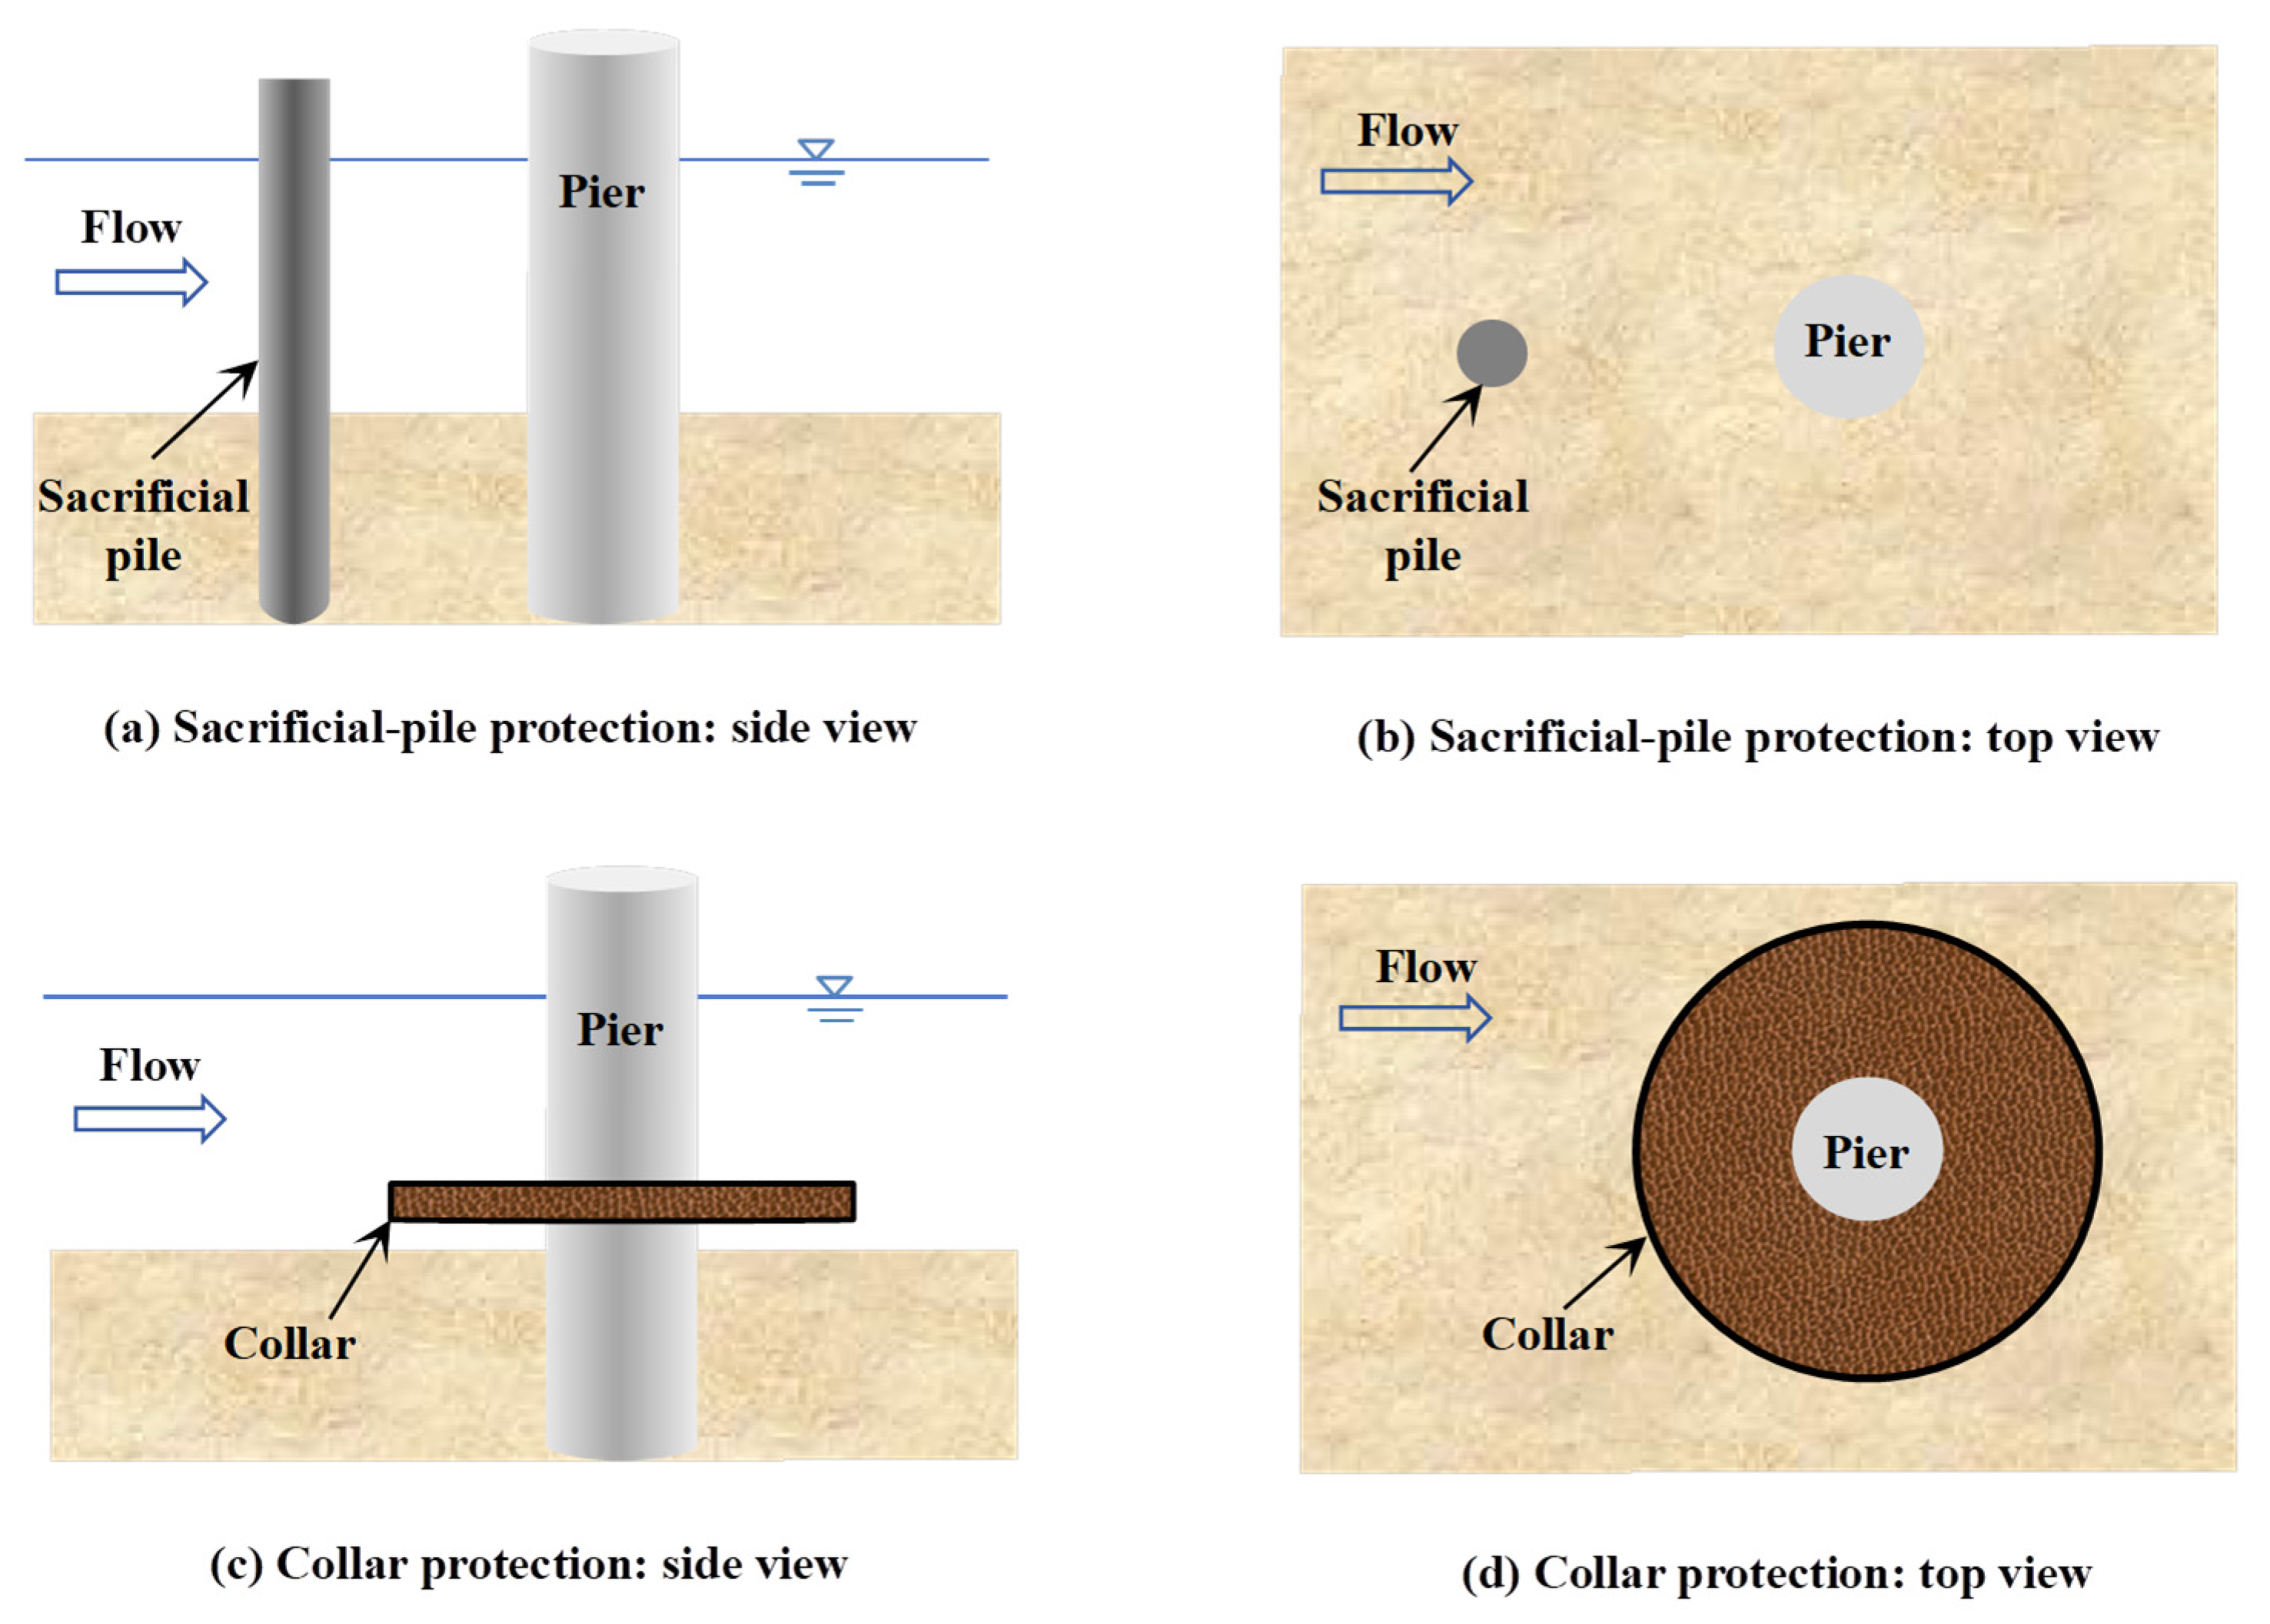
Figure 1. Two commonly-used types of scour protection: sacrificial pile and collar.
Water 17 02742 g001
Figure 2. A graphic workflow of this paper: (a) flow mechanism of scour; (b) CFD setup and validation; (c) influencing parameters; (d) scour development and optimization.
Water 17 02742 g002
Figure 3. Numerical setup of (a) computational mesh and (b) boundary conditions.
Water 17 02742 g003
Figure 4. Comparison of velocity in front of the pier between numerical and experimental results: (a,b) streamwise and vertical velocity at the height of 0.02 m above the bed; (c,d) streamwise and vertical velocity at the height of 0.2 m above the bed.
Water 17 02742 g004
Figure 5. Comparison of scour depth between numerical and experimental results (a) in front of the pier and (b) behind the pier.
Water 17 02742 g005
Figure 6. Numerical results of pier scour without protection: (a) scour hole morphology; (b) temporal development of scour depth at different positions around the pier.
Water 17 02742 g006
Figure 7. Numerical results of (a,b) velocity field and (c) bed elevation around the pier.
Water 17 02742 g007
Figure 8. Influence of sacrificial pile distance on pier scour: (ac) scoured bed contour for cases 1–4; (d) flow field around the pier; (e) temporal development of scour depth at pier side; (f) temporal development of the maximum scour depth.
Water 17 02742 g008
Figure 9. Comparison of (a) streamwise velocity and (b) turbulence intensity profiles in front of the pier.
Water 17 02742 g009
Figure 10. Temporal development of scour depth under different collar protection conditions.
Water 17 02742 g010
Figure 11. Flow field around the pile under different collar protection setup.
Water 17 02742 g011
Figure 12. Comparison of scour reduction under different conditions: (a) effect of sacrificial pile distance; (b) effect of collar height; (c) comprehensive comparison.
Water 17 02742 g012
Figure 13. Comparison between the no scour protection and the optimum combined scour protection: (a,b) flow fields; (c,d) scour morphology.
Water 17 02742 g013
Figure 14. Comparison of scour reduction performance under different protection cases: (a) scour depth development; (b) final scour depth.
Water 17 02742 g014
Table 1. Comparison of relevant studies on scour protection using collar or sacrificial pile.
Protection TypeReferencesFrRed50 (mm)dp/Dhc/DScour Reduction
CollarFarooq et al. (2023) [22]0.2866,2160.96\−0.5, 0, 0.532–44%
Zhang et al. (2021) [30]0.08312,9480.1854050%
Valela et al. (2022) [31]0.25022,4100.73.3069.7%
Tang et al. (2023) [32]0.18713,9440.843050%
Sacrificial pileMelville and Hadfield (1999) [14]0.16058,3830.95 0.167\51.7%
Wang et al. (2017) [33]0.14456,2500.15 0.333\53.3%
Table 2. Sensitivity analysis of computational mesh.
1st-Level Block Grid [m]2nd-Level Block Grid [m]Other Grid [m]Total NumberGCI ux (%)GCI ds (%)
Coarse0.060.070.08113,8802.83.4
Medium0.050.060.07213,1091.21.5
Fine0.040.050.06627,130
Table 3. Conditions for different setup of combined scour protection and the scour reduction performance.
CaseD [m]H [m]Dc [−]dp [−]hc [−]ds [m]Scour Reduction
No protection0.10.4---0.078-
Case 10.10.45D4D0.1D0.06220.5%
Case 20.10.45D5D0.1D0.0719.0%
Case 30.10.45D6D0.1D0.06714.1%
Case 40.10.45D5D00.05825.6%
Case 50.10.45D5D0.1D0.06121.8%
Case 60.10.45D5D0.2D0.03851.3%
Case 70.10.45D5D0.3D0.04344.9%
Note: D is pier diameter, H is water depth, Dc is collar diameter, dp represents the distance between sacrificial pile and pier, hc represents the height position of collar above the bed, ds is the maximum scour depth around the pier.
Disclaimer/Publisher’s Note: The statements, opinions and data contained in all publications are solely those of the individual author(s) and contributor(s) and not of MDPI and/or the editor(s). MDPI and/or the editor(s) disclaim responsibility for any injury to people or property resulting from any ideas, methods, instructions or products referred to in the content.