Article

Projection of Hydrological Drought in Chinese River Basins Under Climate Change Scenarios and Analysis of the Contribution of Internal Climate Variability

1
Powerchina Zhongnan Engineering Corporation Limited, Changsha 410014, China
2
River and Lake Protection and Construction Safety Center, Changjiang Water Resources Commission, Wuhan 430010, China
3
School of Civil and Hydraulic Engineering, Huazhong University of Science and Technology, Wuhan 430074, China
*
Author to whom correspondence should be addressed.
Water 2025, 17(18), 2736; https://doi.org/10.3390/w17182736
Submission received: 20 August 2025 / Revised: 8 September 2025 / Accepted: 10 September 2025 / Published: 16 September 2025
(This article belongs to the Section Hydrology)

Abstract

This study focuses on 120 representative river basins across China, utilizing CMIP6 multi-model climate data and CESM2-LE large ensemble climate data to develop a bias-correction framework for climate models that integrates statistical methods, with the aim of enhancing the spatiotemporal accuracy of climate model outputs. Building on this framework, the study simulates the evolution of hydrological drought characteristics in Chinese river basins during 2071–2100 under the SSP370 scenario and quantifies the relative contributions of internal climate variability (ICV), anthropogenic climate change (ACC), and inter-model uncertainty (IMU) to hydrological drought projections. Results reveal a pronounced south–north divergence in future drought risk. Southern China—especially the middle–lower Yangtze and Pearl River basins—exhibits a >10% increase in drought frequency, with event totals exceeding 30 per 30 years, yet individual droughts remain short and moderate in intensity. Conversely, northern basins—particularly the Songliao and Liao River systems—display pronounced lengthening and intensification of droughts, with mean duration surpassing 12 months and severity indices rising above 38, translating to 20~40% increases relative to the 1985~2014 baseline. Nationwide, ICV emerges as the dominant driver of projected changes: signal-to-noise ratios for frequency, intensity, and duration fall below unity across more than 70% of basins, indicating that unforced variability overshadows the anthropogenic trend. ACC signals only exceed ICV in southeastern coastal regions and parts of the Pearl River basin for intensity and duration. Inter-model spread rivals or exceeds ICV uncertainty in these same humid subtropical basins, underscoring the sensitivity of projections to model structure.

1. Introduction

The Intergovernmental Panel on Climate Change (IPCC) stated in its Sixth Assessment Report that human activities are the primary driver of the ongoing global warming. Compared to the period 1850–1900, the global average surface temperature increased by 1.09 °C (0.95–1.20 °C) during 2011–2020 [1]. The World Meteorological Organization (WMO) has also confirmed that the years 2015–2019 were the warmest five-year period since the Industrial Revolution, with the global average temperature rising by 1.1 °C relative to pre-industrial levels [2]. Projections suggest that global temperatures will continue to rise significantly in the coming decades [3,4,5].
Global warming has a direct impact on the hydrological cycle, primarily manifested in the enhanced capacity of the atmosphere to hold water vapor as well as accelerated vapor transport and intensified hydrological processes [6,7,8]. Against this backdrop, both temperature and precipitation in China have exhibited significant trends. Between 1951 and 2020, the national mean annual temperature increased at a rate of 0.26 °C per decade, while precipitation changes showed pronounced regional disparities [9]. These climatic shifts have led to a temporal and spatial redistribution of water resources, thereby contributing to a marked increase in the frequency and intensity of extreme climate events such as heavy precipitation, droughts, and floods [10,11,12,13].
Existing studies have shown that the climate system is influenced not only by anthropogenic forcings but also by natural internal variability, which plays a significant role [14,15]. The natural climate system exhibits strong nonlinear characteristics and involves complex feedback processes across multiple temporal scales. Among these, internally generated variability—particularly those driven by atmosphere–ocean coupling—may dominate climate dynamics over the coming decades [14]. However, most current research tends to overlook the distinction between internal variability and anthropogenic influences, often attributing climate change solely and simplistically to human activities [16,17]. Therefore, accurately identifying and quantifying the relative contributions of internal climate variability (ICV) and anthropogenic climate change (ACC) to the evolution of hydrological drought is essential for future water resource planning and evidence-based policy-making.
Climate change is generally composed of two main components: changes in the mean state of the climate system and changes in the variability of climate variables. On multi-decadal timescales, anthropogenic climate change (ACC) refers to the climate system’s response to increased greenhouse gas concentrations, whereas internal climate variability (ICV) arises from the unforced, chaotic fluctuations inherent to the climate system itself. These two mechanisms are fundamental drivers of climate change, jointly influencing both the long-term climate mean and its interannual to decadal variability. Studies have shown that both ACC and ICV can affect the long-term mean and variability of the climate system to varying degrees. For example, when anthropogenic forcing exceeds the adaptive capacity of the system, it may lead to permanent changes in the multi-year mean state [18]. Dai [19] further pointed out that the evolution of future droughts is closely related to ICV, particularly its association with large-scale climate models such as the El Niño–Southern Oscillation (ENSO). Orlowsky et al. [20] argued that in the coming decades, as the signal of ACC has yet to fully emerge, the evolution of global droughts may still be predominantly governed by ICV.
Despite the undeniable influence of internal climate variability (ICV) on the climate system, most existing studies still tend to emphasize the role of anthropogenic climate change (ACC), with relatively limited systematic evaluation of ICV [21]. Naumann et al. [22], through analysis using seven global climate models (GCMs), highlighted the dominant role of ACC in the increasing frequency of droughts. Kiem et al. [23] noted that Australia is likely to face more frequent and severe droughts due to the combined effects of reduced precipitation and enhanced potential evapotranspiration. Similarly, the study by Mondal and Mujumdar [24] indicated that ACC-driven droughts in the 21st century may lead to structural shifts in drought return periods at the basin scale. It is important to note that ICV is not only a key process influencing future climate but also a major source of uncertainty in current climate impact assessments. Neglecting the role of ICV may result in significant biases in the prediction of extreme climate events. Therefore, incorporating ICV into the analytical framework of future drought trends is essential for improving the accuracy and reliability of climate impact assessments.
In recent years, ensemble-based studies have been widely applied in climate simulations and extreme event projections. Fischer et al. [25], using ensemble simulations from the Community Earth System Model (CESM), revealed the critical role of internal climate variability (ICV) in the variability of extreme precipitation and temperature events, emphasizing that ICV’s contribution cannot be ignored at regional scales. Zheng et al. [26] employed CESM Large Ensemble (CESM-LE) simulations to analyze the evolution of sea surface temperature (SST) amplitude in the 21st century and quantified uncertainties associated with ICV. Similarly, Martel et al. [27] systematically assessed the contribution of ICV to annual and seasonal extreme precipitation using two large ensemble model datasets. Their study found that ICV dominates the uncertainty in extreme precipitation projections across several regions and may obscure the detection of anthropogenic climate change (ACC) signals. Gu et al. [28] utilized large ensemble simulations from CESM1 and CSIRO to comprehensively evaluate the combined impacts of ICV and ACC on future meteorological droughts in China. Their results indicated that although ACC is the primary driving force, ICV also plays a substantial role in influencing drought frequency, duration, and intensity. In some regions, the uncertainty contribution of ICV to drought changes even exceeds that of external forcings. The study further found that in southern China, the signal-to-noise ratio (SNR) for drought frequency changes is generally below 1, underscoring the critical role of ICV in drought impact assessments. Therefore, to accurately predict extreme hydrological events under climate change, it is essential to fully account for the uncertainty introduced by ICV.
In summary, current research on internal climate variability (ICV) has primarily focused on meteorological variables and associated meteorological drought events, with substantial progress made particularly in areas such as precipitation frequency, extreme precipitation, and temperature variability. However, the underlying mechanisms through which ICV influences hydrological responses at the river basin scale remain insufficiently explored. Moreover, the evolution and uncertainty assessment of hydrological droughts dominated by ICV have not yet been comprehensively addressed. Therefore, this study incorporates ICV into a quantitative analysis of hydrological droughts at the basin scale. This approach holds significant theoretical value and practical implications for advancing the scientific management of water resources under the context of climate change. The scientific objectives and innovations of this study are as follows: To address the issue that most existing bias correction methods adopt univariate-based static correction, which struggles to capture the dynamic correlations between multiple variables and often suffers from insufficient simulation accuracy, especially under non-stationary climate backgrounds or extreme events, this study innovatively proposes a climate model bias correction method integrating Quantile Delta Mapping (QDM). To address the problem that current studies mainly focus on the impact of internal climate variability (ICV) at the meteorological variable level and lack the systematic integration of ICV into the uncertainty quantification analysis of hydrological drought changes, this study combines the CESM2 multi-member ensemble and CMIP6 multi-model ensemble. Based on the signal-to-noise ratio (SNR) and Fraction of Sources of Uncertainty Difference (FOSD) indicators, this study evaluates the relative contributions of ICV compared to anthropogenic climate change (ACC) and climate model structural uncertainty (IMU) and clarifies the relative contributions of uncertainty sources to hydrological drought changes in different river basins. Finally, this study helps to better understand the role and importance of internal climate variability in hydrological drought changes.

2. Data and Study Area

2.1. Study Area

To systematically investigate the impact of internal climate variability (ICV) on the evolution of hydrological droughts in China, this study selected 120 representative hydrological control stations across major river basins nationwide (Figure 1). The selection of control stations was based on a combination of the existing literature and data availability, with priority given to regions minimally affected by human activities and with complete records of runoff and meteorological observations. This approach ensures that the observed hydrological responses reflect natural processes as accurately as possible. Spatially, the selected basins span multiple major climate zones, including subtropical monsoon, temperate monsoon, and plateau climates. The basin areas range from 400 to 139,244 km2, covering both small- and medium-sized basins characterized by seasonal fluctuations, as well as large basins with systematic hydrological responses. This provides a robust and representative foundation for the subsequent analysis.

2.2. Research Data

2.2.1. Observational Data

Meteorological data were obtained from the China Meteorological Data Sharing Service System, which provides gridded datasets at a spatial resolution of 0.5° × 0.5°. The dataset includes daily observations of precipitation, maximum temperature, minimum temperature, and mean temperature for the period 1961–2016. Runoff data were provided by watershed authorities and local hydrological bureaus, covering daily streamflow records from 120 hydrological control stations for the period 1961–2014. All station data underwent quality control checks for completeness. Each site had a continuous observation period of no less than 20 years during the baseline climate period (1985–2014), with missing data rates strictly limited to below 5%. The selected stations are well distributed across the nine major river basin hydrological regions, as well as across different climate zones and geomorphological units.

2.2.2. Climate Model Data

To construct a framework for future hydrological drought projections, this study employed a multi-model ensemble consisting of 11 global climate models (GCMs) from the Coupled Model Intercomparison Project Phase 6 (CMIP6) (Table 1). These models were developed by research institutions from several countries, including China, the United States, and France, and provide monthly outputs of precipitation and temperature. Given the data length requirements of the standardized runoff index (SRI), the period 1985–2014 was designated as the historical baseline for bias correction of climate model outputs and for hydrological model parameter calibration, while the period 2071–2100 was selected to represent the future scenario. For consistency with observational data resolution, precipitation and temperature outputs from each climate model were spatially interpolated to a 0.5° × 0.5° grid using bilinear interpolation.
The scientific rationale behind the selection of climate scenarios plays a critical role in determining the reliability of hydrological drought assessments. The conventional high-emissions scenario SSP5-8.5 has been increasingly questioned due to its reliance on extreme carbon emission assumptions—such as continued fossil fuel expansion and the absence of policy interventions—which limits its ability to represent the combined effects of aerosol emissions and land use change on the hydrological cycle [29].
In contrast, SSP3-7.0 (SSP370), characterized as a “medium-to-high emissions scenario with high policy heterogeneity,” incorporates compound forcings including high aerosol emissions and large-scale deforestation. This provides a distinct boundary condition for investigating the interactions between anthropogenic forcing and internal climate variability (ICV). Shiogama et al. [29] found that, under the SSP370 scenario, projected precipitation increases in Asia are suppressed by up to 53% in the CMIP6 multi-model ensemble. The mechanism involves enhanced negative shortwave radiative anomalies at the top of the atmosphere (−2.1 W/m2) due to aerosols, which weaken monsoonal moisture transport. Simultaneously, reduced forest cover increases surface albedo and decreases evapotranspiration, amplifying uncertainties in land–atmosphere feedback.
This dual forcing mechanism—driven by aerosols and land use change—not only enhances spatial heterogeneity in the hydrological cycle but also improves the detectability of anthropogenic signals. Consequently, it offers a robust foundation for distinguishing the relative contributions of internal climate variability (ICV) and anthropogenic climate change (ACC).
Based on these considerations, this study selects the SSP370 scenario as the primary analytical framework. Using a multi-model ensemble, we project hydrological droughts at the basin scale and quantitatively assess the role of ICV in drought evolution, thereby providing a scientifically grounded basis for drought prediction under future climate scenarios.

3. Methods

3.1. Bias Correction

Due to the considerable biases inherent in the outputs of climate models, the application of bias correction is often essential for reliable future drought assessments. In this study, the Quantile Delta Mapping (QDM) method was employed to perform bias correction on precipitation and temperature data from both CESM2-LE and CMIP6 models.
Quantile Delta Mapping (QDM) is an improved bias correction technique based on quantile mapping, primarily used for addressing the non-stationary bias in climate model projections. Compared with the traditional quantile mapping (QM) approach, QDM not only accounts for the differences in quantiles between observed and simulated data during the historical period but also incorporates a delta factor to preserve the relative change signals under future climate scenarios. This allows QDM to better adapt to the non-stationary characteristics of climate change and ensures that the corrected simulations more accurately reflect actual conditions.
The fundamental principle of QDM is to adjust the distribution of simulated data using the quantiles of observational data so that the distributional characteristics of the simulations match those of the observations as closely as possible. The specific bias correction procedure for precipitation and temperature involves the following steps:
  • Computation of CDF and Non-Exceedance Probability for Model Outputs
For the model-projected data xm,p(t), its cumulative distribution function (CDF) is first calculated, and for each time step t, the corresponding non-exceedance probability tm,p(t) is obtained:
t m , p ( t ) = F m , p x m , p ( t )
where Fm,p is the historical CDF of the simulated projection data and xm,p(t) is the simulated value for event t.
2.
Calculation of Relative (Precipitation) or Absolute (Temperature) Changes between Historical and Future Quantiles
For each time step t, the relative change (for precipitation) or absolute change (for temperature) Dm(t) between historical quantiles and future simulated quantiles is computed:
D m ( t ) = x m , p prec ( t ) F m , h 1 t m , p ( t ) x m , p temp ( t ) + F m , h 1 t m , p ( t )
where x m , p prec denotes the inverse CDF, x m , p temp ( t ) refers to future simulations, and F m , h 1 to historical simulations.
3.
Bias Correction Using Historical Observations
Using the historical observational CDF, the simulated historical data xo,h(t) are bias-corrected as follows:
x ^ o : m , h : p ( t ) = F o , h 1 t m , p ( t )
where F o , h 1 is the inverse CDF of the historical observations.
(1)
Incorporation of Future Change Signals
Finally, the bias-corrected historical values are combined with the relative or absolute change factors Dm(t) to obtain the bias-corrected future projections:
x ^ m , p ( t ) = x ^ o : m , h : p prec ( t ) D m ( t ) x ^ o : m , h : p temp ( t ) + D m ( t )
Among the available quantile-based bias-correction algorithms, the cumulative distribution function transformation (CDF-t) method is the most widely used alternative to QDM. CDF-t likewise matches the cumulative distribution of simulated data to that of the observations, but it implicitly assumes that the shape of the observed distribution remains valid for the future period, i.e., it transfers the entire future CDF toward the historically observed CDF without preserving the relative change signal embedded in the raw model projection. Such “stationarity of distributional form” can artificially suppress or exaggerate future trends in extremes once the climate change signal is strong or nonlinear (e.g., precipitation intensification or upper-tail warming). QDM, by contrast, applies the quantile mapping delta only to the historical bias-corrected values, thereby conserving the raw model’s projected change at every quantile. This property is particularly important for drought studies that focus on tail behavior (very dry or very wet months), where any distortion of the future trend may propagate into large errors in runoff and subsequently in drought frequency, duration, or severity indices. In addition, previous intercomparison work in China consistently shows that QDM yields lower RMSE and higher correlation for both mean and extreme precipitation compared with CDF-t, while maintaining spatial coherence across multi-model ensembles. For these reasons, QDM was preferred in the present analysis.

3.2. Bias Correction Identification of Hydrological Drought Events

The standardized runoff index (SRI), derived from runoff time series, provides a more direct representation of water resource variability within hydrological processes. Compared to meteorological indices such as the Standardized Precipitation Index (SPI), SRI is more targeted for hydrological drought studies. Owing to its computational simplicity and adaptability across different regions and temporal scales, SRI has been widely applied in drought assessments under climate change scenarios.
In this study, the SRI is adopted as the drought metric to more effectively capture the hydrological response of runoff variations under different climate scenarios. Specifically, the 3-month SRI is selected as the hydrological drought indicator. This index utilizes a gamma distribution to describe the probabilistic characteristics of monthly runoff, which typically exhibits a skewed distribution. The runoff values are normalized to a standard normal distribution, resulting in the standardized runoff index. The calculation of SRI generally involves the following steps:
For monthly runoff values x, the probability density function (PDF) of the gamma distribution is defined as
f x = 0 x x α 1 β α Γ α e x β d x
where α is the shape parameter and β is the scale parameter (α, β > 0). These parameters are estimated using the maximum likelihood estimation (MLE) method. Once the parameters are determined, the cumulative probability distribution of the runoff time series is computed as follows:
F ( x ) = 0 x f ( x ) d x
Based on this, the standardized runoff index (SRI) is finally obtained through inverse standard normal transformation of the cumulative probability:
S R I x = Φ 1 F x
In this study, hydrological drought events were identified using the run theory approach. For a given study period (either the historical baseline or future scenario), a hydrological drought event is defined as beginning when the standardized runoff index (SRI) falls below a predefined threshold and defined as ending when the index rises above that threshold again (see Figure 2).Within this framework, drought duration refers to the length of time the event persists, while drought severity is quantified as the cumulative sum of the SRI values below the threshold throughout the duration of the event.
The 3-month accumulation window was chosen after comparing the ability of 1-, 3-, 6- and 12-month SRI versions to reproduce documented drought impacts in China. A 1-month SRI reacts too quickly to short-lived runoff fluctuations and produces many short, low-impact events that are irrelevant for water resource management. Conversely, 6- or 12-month indices integrate seasonal or annual anomalies, masking the onset and termination of droughts that are critical for reservoir operation and irrigation scheduling. Previous national-scale studies further demonstrate that SRI-3 yields the highest correlation with observed stream flow deficits, crop yield reductions, and reservoir inflow anomalies across the majority of the 120 basins analyzed here. Therefore, SRI-3 provides an optimal trade-off between sensitivity and robustness for detecting hydrological drought events in both historical and future climate simulations.

3.3. Estimation of ACC, ICV and Inter-Model Uncertainty

To assess the uncertainties in future drought projections, this study combines the Multi-Model Single-Member Ensemble (MME) with the Large-Member Ensemble (LME) to estimate the contributions of anthropogenic climate change (ACC), internal climate variability (ICV), and inter-model uncertainty (IMU). To ensure the methodological traceability and academic rigor of the formulas presented in the methodology section, the sources of each definition are specified as follows: The calculations of ICV, ACC, and IMU follow the methodological framework of Gu et al. [28]. Specifically, ICV is defined as the standard deviation of variations among large ensemble members, as shown in the formula by Gu et al. [28], and this definition is derived from the study by Wang et al. [30]. ACC is calculated as the multi-model ensemble mean, as described in the studies by Gu, Sui, and Nguyen et al. [28,31,32]. IMU is defined as the standard deviation of variations among individual models, as reported in the studies by Gu, Hawkins, and Hawkins et al. [28,33,34].
The estimation of ACC, ICV, and IMU followed established approaches in previous studies. For each grid cell, the 30-year mean change in drought metrics (future minus baseline) was computed for each ensemble member of CESM1 and CSIRO, and the ICV was defined as the standard deviation across members:
ICV = 1 a i = 1 a M i M ¯ 2
where a is the number of members, Mi is the change for the ith member, and M ¯ is the ensemble mean change. The ACC was defined as the mean change across the 29 CMIP5 GCMs:
ACC = 1 b b i = 1 N i
where b is the number of models and Ni is the change for the ith model. The IMU was calculated as the standard deviation of changes among the 29 GCMs:
IMU = 1 b i = 1 b N i A C C 2

4. Results

4.1. Analysis of the Spatial Distribution of Simulation Errors

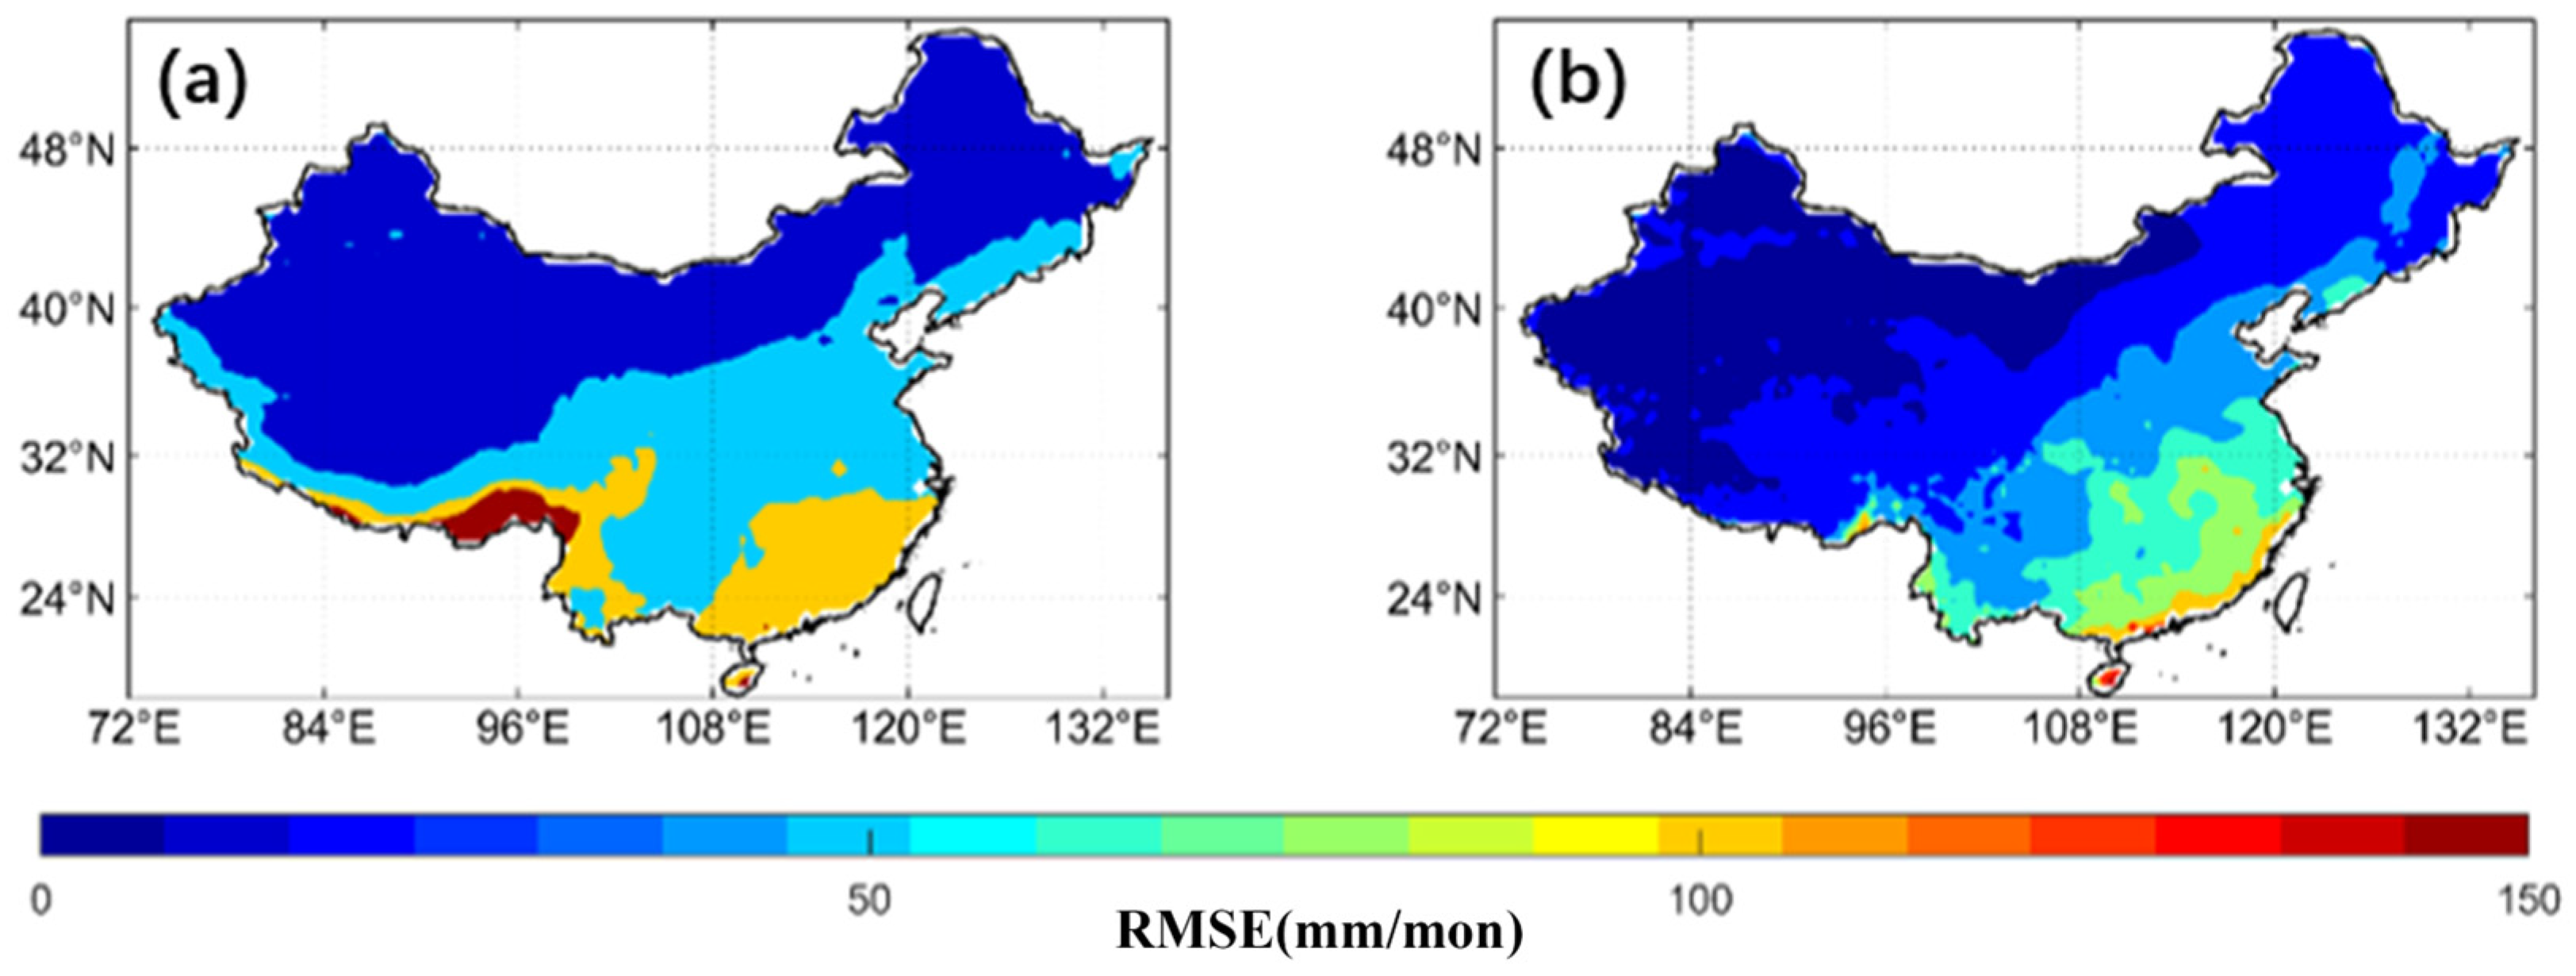
To systematically evaluate the adaptability and effectiveness of the bias correction method across multiple climate models, this study selected 11 global climate models (GCMs) from CMIP6, together with the multi-member ensemble mean simulation from CESM2-LE (CESM2), for a total of 12 climate models. For each model, an independent QDM correction model was constructed and applied. The root mean square error (RMSE) of each model was then calculated for both the pre-correction and post-correction datasets. These results were averaged to obtain the simulation error distribution under the multi-model ensemble (MME). All figures and analyses presented in the following sections are based on the mean values of the bias-corrected results.
Figure 3 illustrates the spatial distribution characteristics of monthly precipitation RMSE in the MME simulations before correction and after QDM correction. As shown in Figure 3a, the raw model data exhibit pronounced spatial differences in simulation error across China, particularly with higher RMSE values in the southwestern region, the southeastern coastal areas, and southern China. Notably, a prominent high-error core area emerges along the southeastern margin of the Tibetan Plateau, where RMSE values exceed 150 mm/mon, indicating the presence of systematic biases in precipitation simulations for this region.
After QDM correction (Figure 3b), simulation errors in most regions decreased substantially, with the most pronounced improvement observed in southern China. In southeastern China, the mean RMSE was reduced by approximately 31.2%. In particular, along the southeastern coastal belt, the RMSE decreased from about 112 ± 15 mm/mon in the raw simulations to 62 ± 9 mm/mon, indicating that the QDM method performs well in correcting the systematic bias of precipitation simulations.
Similar to precipitation, Figure 4 presents the spatial distribution of monthly temperature RMSE for the multi-model ensemble before and after QDM correction. As shown in Figure 4a, the raw climate models exhibit distinct clusters of large errors in Northern and Western China, especially in Northwestern China and the Northern Tibetan Plateau, where RMSE values generally exceed 4 °C and locally reach 6–8 °C, indicating substantial overestimation. In contrast, RMSE values in North China and the southern regions are relatively smaller, but still generally above 2 °C, suggesting that the raw models exhibit considerable temperature biases nationwide, with particularly large errors in high-altitude and topographically complex areas.
After QDM correction (Figure 4b), RMSE values decreased significantly across most regions, with the national mean RMSE dropping from approximately 3.8 °C to 2.1 °C. The reductions were particularly marked in Northwestern China and the Northern Tibetan Plateau, where local RMSE decreases exceeded 3 °C. Nevertheless, residual errors of 2.5–3.5 °C remain in parts of the Northeast Plain, North China, and Eastern Xinjiang, indicating that the statistical correction method still has limited adaptability in regions with highly complex spatial error structures.
Overall, QDM correction substantially reduced the spatial biases in climate model simulations, thereby improving model accuracy—especially in areas with complex error structures and pronounced topographic relief. This enhancement provides higher-accuracy input data for subsequent climate-driven hydrological simulations.

4.2. Hydrological Drought Forecasting in Future Periods

4.2.1. Analysis of Hydrological Drought Frequency in Future Periods

Under the SSP3-7.0 emission scenario, using results from 11 CMIP6 climate models and the multi-member ensemble simulations of CESM2-LE, the frequency of hydrological droughts in 120 typical river basins across China for the period 2071–2100 was projected and comparatively analyzed (see Figure 5). Overall, the climate models exhibit a high degree of consistency in the spatial distribution patterns of drought frequency, with all models predicting that Southern China will experience relatively frequent hydrological drought events in the future, whereas Northern China is projected to have lower drought frequencies. However, at the local scale, certain spatial discrepancies remain among the different models, reflecting the uncertainties in climate models regarding precipitation simulation and drought responses.
From the common features of the spatial distribution of drought frequency, most models (e.g., ACCESS-CM2, ACCESS-ESM1-5, MRI-ESM2-0, CanESM5, CMCC-CM2-SR5, and BCC-CSM2-MR) predict that river basins in Southern China (such as the middle and lower reaches of the Yangtze River, the Pearl River basin, and various rivers along the southeastern coast) will frequently experience drought events over the 30-year future period. In some basins, drought frequency is projected to exceed 25 events, indicating a potential intensification of water resource supply–demand conflicts in this region. In contrast, in Northern and Northwestern China, including the upper reaches of the Yellow River, the Haihe River basin, and inland rivers of Xinjiang, multi-model projections generally indicate drought frequencies below 10 events, suggesting relatively low hydrological drought risk in these areas.
Regional-scale predictions vary among models. For example, CanESM5 and CMCC-CM2-SR5 project higher drought frequencies in southwestern China (e.g., the Yunnan–Guizhou Plateau), indicating a potential increase in hydrological drought risk in this region. BCC-CSM2-MR, NorESM2-MM, and FGOALS-g3, however, concentrate high-frequency drought areas in the Pearl River basin and southeastern coastal regions. Moreover, GFDL-ESM4 and IPSL-CM6A-LR predict more uniform yet generally higher drought intensity across southern basins, reflecting greater sensitivity to future changes in precipitation and enhanced evapotranspiration.
Based on the CMIP6 multi-model ensemble mean (Figure 6a,c) and the CESM2-LE multi-member ensemble mean (Figure 6b,d), a comparative analysis was conducted on the frequency and relative changes in hydrological droughts in 120 study basins across China for the period 2071–2100. The results indicate that both ensemble approaches show consistent spatial patterns of drought frequency, highlighting a significant increase in drought occurrence in the humid southern regions, while northern and northwestern areas remain at relatively low levels. Nevertheless, discrepancies exist in specific numerical values and regional response characteristics, reflecting the sensitivity of predictions to climate model structure and ensemble methodology.
From the CMIP6 multi-model ensemble mean (Figure 6a), future southern basins in China, particularly the middle and lower reaches of the Yangtze River, the Pearl River basin, and southeastern coastal regions, are projected to experience substantially increased drought frequency, generally exceeding 25 events. In contrast, northern and northwestern inland areas, such as the upper Yellow River, Xinjiang, and the Tibetan Plateau, mostly exhibit drought frequencies of below 10 events, indicating a pronounced north–south contrast. Relative change analysis (Figure 6c) further shows that the largest increases in drought frequency are concentrated in Southwestern China (e.g., Yunnan and Guizhou), with relative growth exceeding 10%, whereas the North China Plain and parts of the northwest show slight decreases in drought frequency, with reductions of approximately 5–10%.
In comparison, the CESM2-LE multi-member ensemble mean (Figure 6b) also exhibits a north–south contrast in drought frequency, but high-frequency drought areas are more widespread and concentrated, with particularly pronounced values in the middle and lower Yangtze River and southern coastal regions. The relative change map (Figure 6d) indicates that this ensemble also projects general increases in southern drought frequency, with relative changes exceeding 10% in the middle and lower Yangtze River and the Pearl River basin. However, the projected increases in southwestern China are notably lower than those indicated by the CMIP6 multi-model ensemble.
Overall, the relative change amplitude in drought frequency is lower in CESM2-LE than in the CMIP6 multi-model ensemble. This is because the CESM2-LE ensemble, based on 100 members, effectively incorporates internal climate variability, thereby smoothing the fluctuations in extreme drought events to some extent. In contrast, the multi-model average of 11 CMIP6 models primarily reflects the influence of anthropogenic climate change on future drought conditions. The differences between the two approaches reveal the relative contributions of internal climate variability and anthropogenic climate change to the evolution of future hydrological droughts, highlighting the complementary value of assessing drought changes from different dimensions.
In summary, the CMIP6 multi-model ensemble consistently projects that Southern China, particularly the middle and lower Yangtze River and the Pearl River basin, will face higher-frequency hydrological droughts in the future, whereas drought frequency in Northwestern and Northern China will remain stable or slightly decrease. Although both ensemble types show consistent trends, differences persist in numerical values and local-scale spatial responses, reflecting the uncertainties introduced by different climate models.
The CMIP6 ensemble projects stronger drought-frequency increases than CESM2-LE over the Yangtze–Pearl region. Decomposing the 30-year mean change shows that the inter-model standard deviation among 11 CMIP6 models (0.9–1.2 events) is almost twice the intra-model spread of the 100 CESM2-LE members (0.4–0.6 events), while the two sources are comparable in northwestern basins (~0.3 events each). This indicates that disparate convection schemes, cloud-aerosol treatments, and land–surface parameterizations—not internal variability—are the primary drivers of the larger CMIP6 signal in humid Southern China, underscoring the need to combine multi-model and large ensemble approaches for robust drought projections.

4.2.2. Analysis of Hydrological Drought Intensity in Future Periods

Figure 7 presents the projected hydrological drought intensity in 120 study basins across China for the period 2071–2100 under the SSP3-7.0 emission scenario, based on 11 CMIP6 climate models and the CESM2-LE multi-member ensemble. Overall, most climate models predict relatively low drought intensity levels across China’s basins in the future. Majority of the regions exhibit intensity values ranging from 2 to 14, with localized increases observed only in parts of northeastern and northwestern basins. In these localized areas, maximum intensity can exceed 30, indicating a clear regional enhancement trend.
Specifically, models including ACCESS-CM2, ACCESS-ESM1-5, MRI-ESM2-0, CMCC-CM2-SR5, NorESM2-MM, GFDL-ESM4, IPSL-CM6A-LR, INM-CM5-0, and CESM2-LE generally predict low future drought intensity in most study basins, concentrated within the 2–8 range. Southern humid regions, such as the middle and lower reaches of the Yangtze River, the Pearl River basin, and southeastern coastal areas, are characterized by low intensity and minimal spatial variability, indicating mild and relatively stable drought events. However, in the Songliao River basin and adjacent regions in Northeastern China, several climate models project notably higher localized drought intensity. In particular, CanESM5 and FGOALS-g3 predict the highest intensities in this region, with localized values exceeding 32 and some basins reaching 38–44, suggesting the potential for severe hydrological drought events in the future that warrant close attention. The BCC-CSM2-MR model also predicts elevated intensity in Northeastern China, with values mainly between 20 and 26, though the spatial distribution is more limited, concentrated in the Central and Northern Songliao River basin and selected sub-basins of the Liao River.
A comparative analysis across models indicates that southern basins generally maintain low drought intensity; even if drought frequency increases, the severity of individual drought events remains within manageable levels. In contrast, northeastern regions show an increasing trend in drought intensity, which is particularly pronounced under specific climate models.
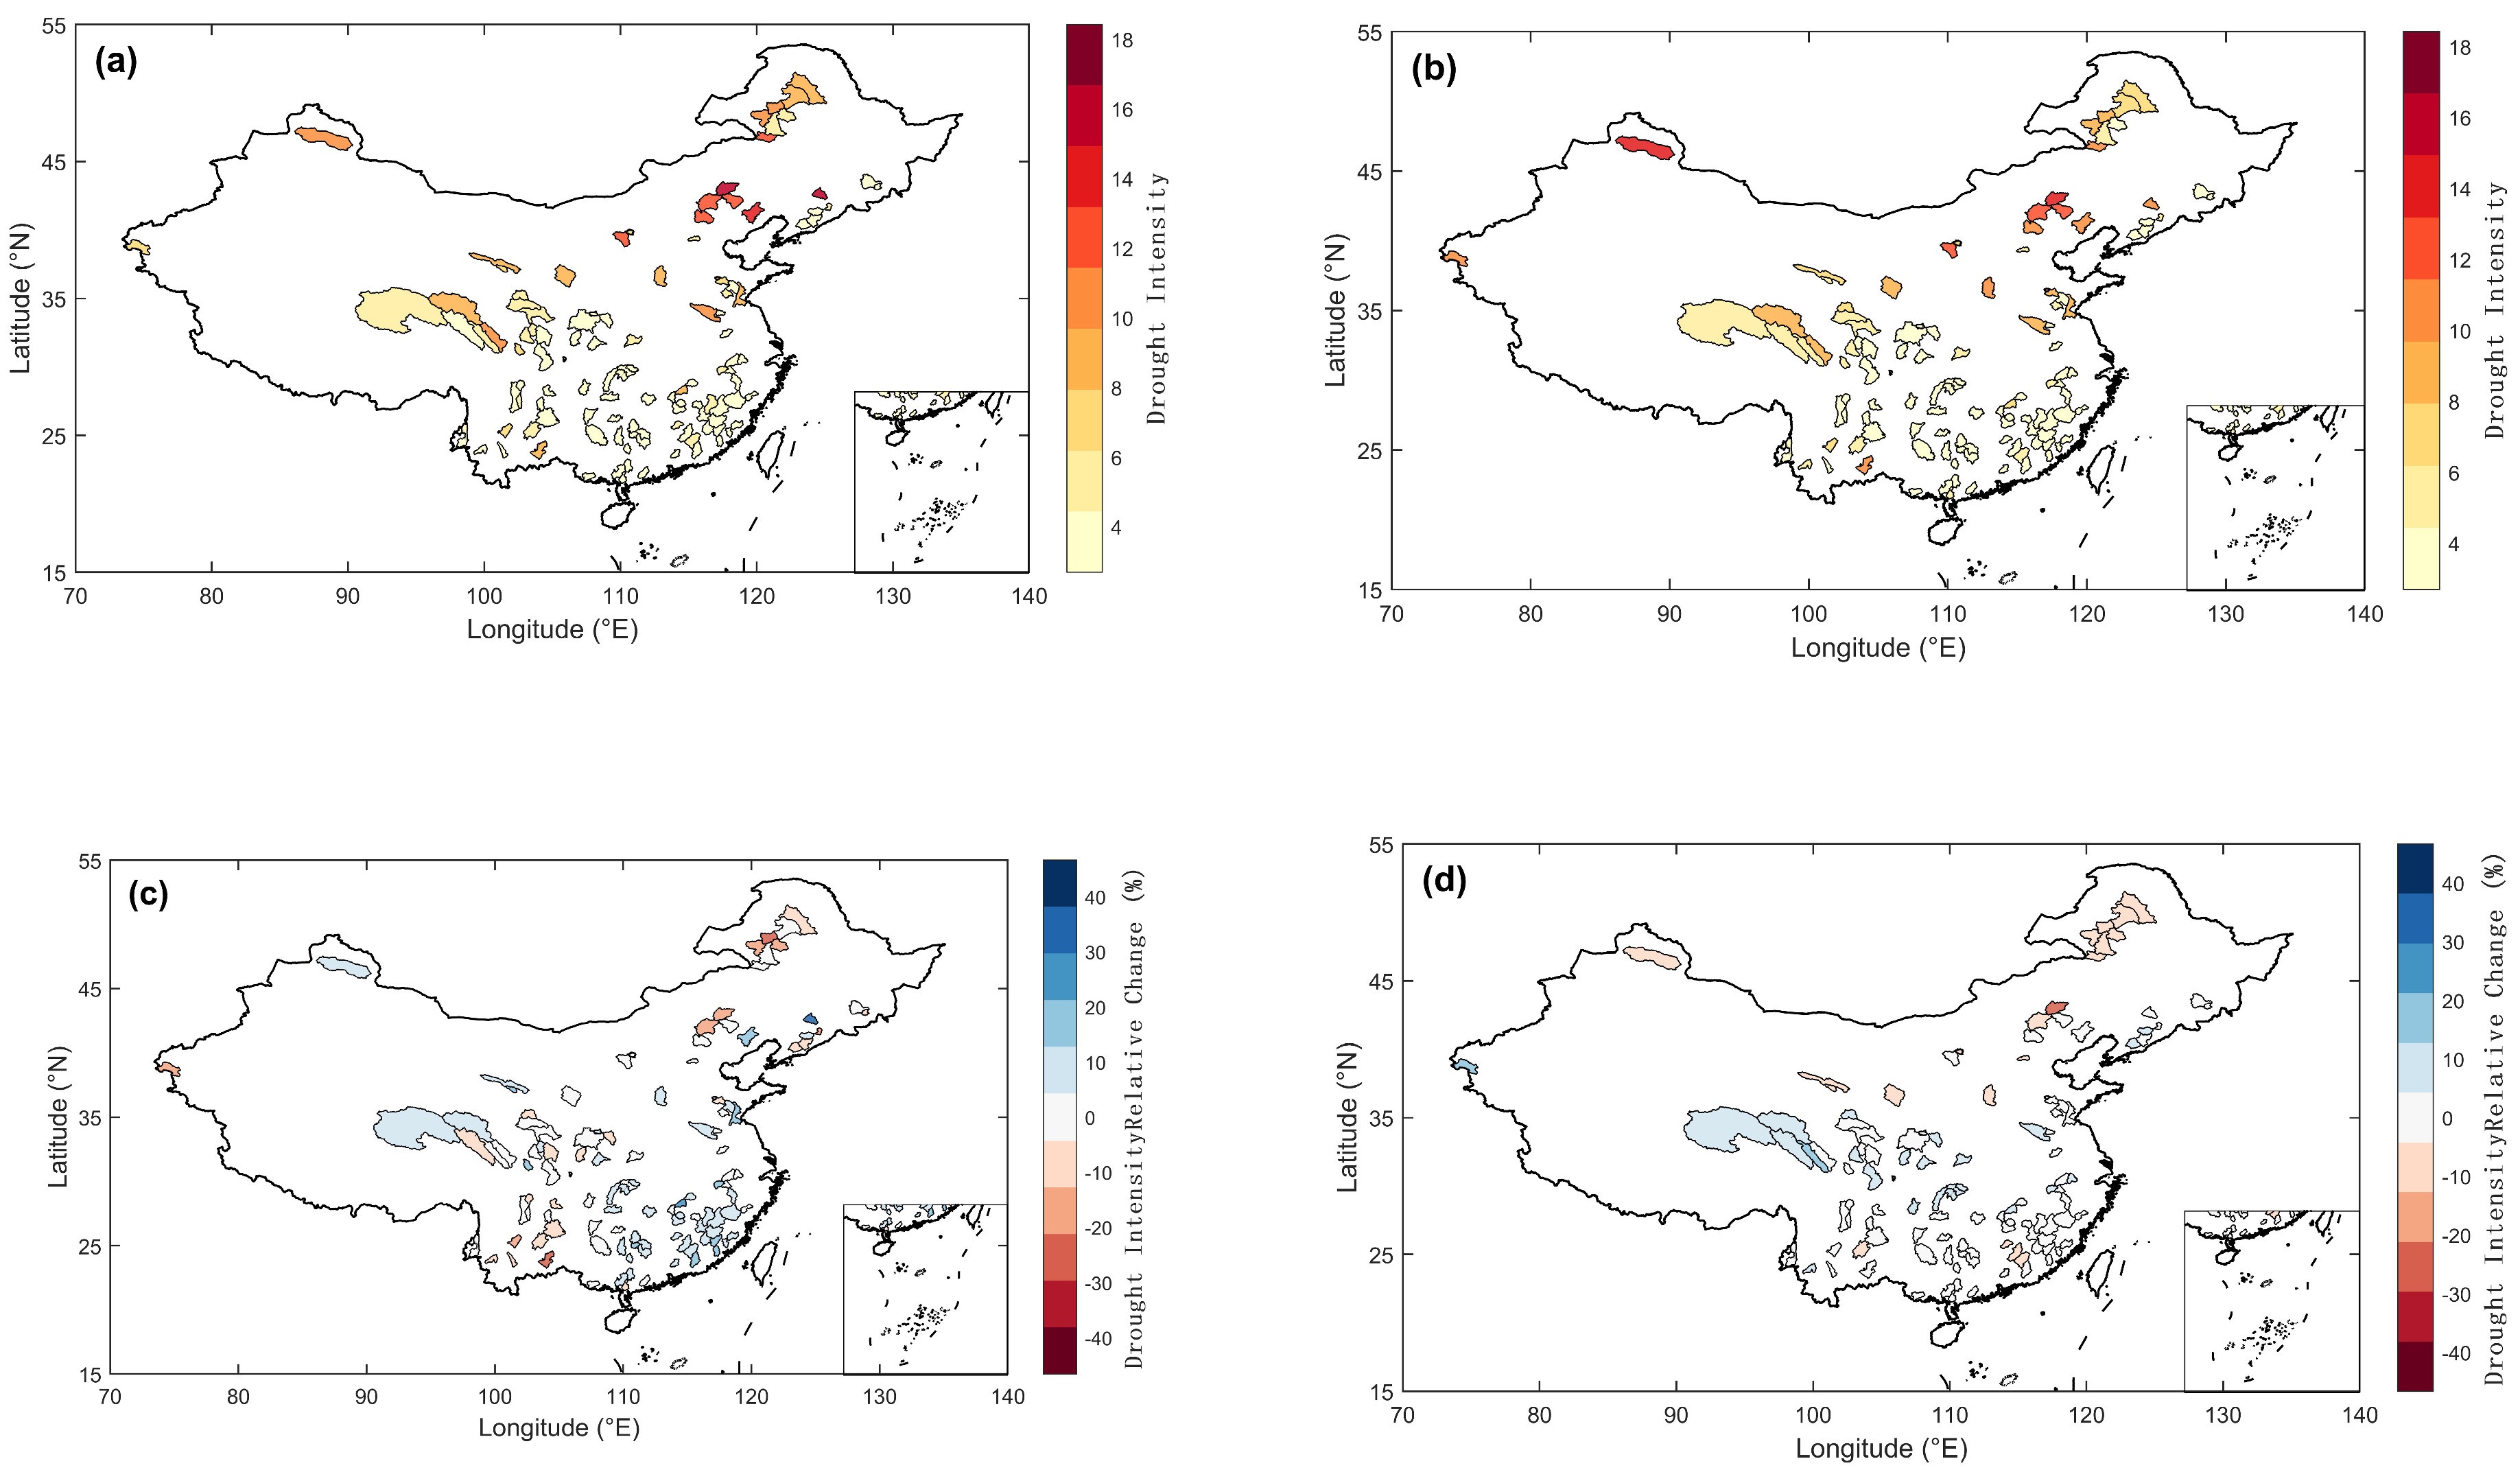
Figure 8 presents the projected hydrological drought intensity and its relative changes in 120 study basins across China during 2071–2100 under the SSP3-7.0 emission scenario, based on the CMIP6 multi-model ensemble averages (Figure 8a,c) and the CESM2-LE multi-member ensemble averages (Figure 8b,d). Comparing the results from these two ensemble approaches provides insights into the regional differences and consistent trends in future drought intensity as well as the influence of ensemble methodology on intensity projections.
In terms of absolute drought intensity distribution (Figure 8a,b), both CMIP6 and CESM2-LE ensembles show a pronounced north–south gradient, with intensity values gradually increasing from south to north. Southern basins, such as the middle and lower reaches of the Yangtze River, the Pearl River basin, and southeastern coastal areas, generally exhibit low intensity values, mostly below 6, indicating that although future drought frequency may increase, the severity of individual events is relatively moderate. In contrast, northeastern regions (particularly the Northwestern Songliao River basin), parts of the Liao River basin, and some areas in the upper and middle reaches of the Yellow River basin exhibit significantly higher drought intensity. CMIP6 multi-model ensemble values in these regions typically range from 12 to 18, while CESM2-LE ensemble averages concentrate between 10 and 18, reflecting a higher likelihood of severe drought events in these areas in the future.
Regarding relative changes in drought intensity (Figure 8c,d), CMIP6 ensemble averages indicate a marked increase in Northeastern China compared with historical periods, with relative increases in some regions reaching 20–40%, especially in the Songliao River basin and the middle and lower Liao River basin. Meanwhile, southwestern basins, particularly the western upper Yangtze River, show a clear decreasing trend in drought intensity, with reductions around 20–30%, suggesting a potential mitigation of future drought severity in these regions. Some southeastern coastal areas display a slight increase in intensity (approximately 5–10%), though overall changes remain modest.
CESM2-LE ensemble predictions are broadly consistent with CMIP6 in terms of spatial patterns and trends, but with slight differences in magnitude. As shown in Figure 8d, CESM2-LE also projects increased intensity in Northeastern and parts of Northern China, though the relative increases are slightly lower than those of CMIP6, ranging locally from 15% to 25%. In southwestern basins, particularly in the upper Yangtze River region, CESM2-LE predicts a more pronounced decreasing trend, with relative reductions reaching 30–40%, further highlighting the potential alleviation of drought severity in these areas.
Overall, both ensemble approaches reveal pronounced spatial differences in future hydrological drought intensity across China: southern regions are projected to maintain stable or slightly reduced intensity, while northern regions, particularly parts of Northeastern and Northern China, show significant increases. The “north increase, south stable” trend is highly consistent across both ensembles, indicating that Northeastern China may face higher-intensity hydrological drought events in the future, warranting focused attention and mitigation measures. The differences between ensemble approaches also reflect the sensitivity of drought intensity projections to the choice of climate multi-model versus multi-member ensemble strategies.

4.2.3. Analysis of Hydrological Drought Duration in Future Periods

Figure 9 illustrates the spatial distribution of projected hydrological drought duration for 120 study basins in China during 2071–2100 under the SSP370 scenario, as simulated by the CMIP6 multi-model ensemble and the CESM2-LE multi-member ensemble. Overall, the future drought duration predicted by most climate models is relatively short, with majority of drought events lasting between 1.5 and 10 months. The spatial distribution patterns of drought duration are largely consistent across different models, with notable differences occurring only in a few localized regions.
In terms of north–south differences, most models—including ACCESS-CM2, ACCESS-ESM1-5, MRI-ESM2-0, CMCC-CM2-SR5, BCC-CSM2-MR, NorESM2-MM, GFDL-ESM4, IPSL-CM6A-LR, INM-CM5-0, and CESM2-LE—consistently predict relatively short drought durations in the majority of southern basins, typically ranging from 1.5 to 5 months. This indicates that while the frequency of hydrological droughts may increase in the future, the duration of individual drought events is expected to remain relatively moderate.
In contrast, regions where drought duration is projected to lengthen are primarily concentrated in Northern China, particularly in the northwestern part of the Songliao River Basin in Northeast China and certain sub-basins of the Liao River. All climate models show a clear increasing trend in drought duration, mostly ranging from 5 to 10 months, indicating that these areas may face more persistent hydrological drought risks in the future. Notably, the CanESM5 (Figure 9d) and FGOALS-g3 (Figure 9i) models predict drought durations of 10–14 months in localized basins of Northeast China, significantly higher than other models, suggesting that these two models are more sensitive to prolonged droughts and highlighting the potential for intensified medium- to long-term drought risks in the region. Meanwhile, BCC-CSM2-MR (Figure 9f) and IPSL-CM6A-LR (Figure 9j) also indicate local increases in drought duration, but the growth is moderate, mainly ranging from 6 to 9 months, with a more limited spatial distribution. The CESM2-LE ensemble mean (Figure 9l) aligns with most CMIP6 models, showing generally short durations in southern basins, with slight increases (approximately 5–8 months) in some areas of Northeast China, but without significant changes or extreme prolonged drought characteristics.
Overall, the multi-model results indicate that the spatial pattern of drought duration in Chinese basins is likely to continue the historical “longer in the north, shorter in the south” characteristic. However, under a warming climate, the trend of extended drought duration in Northeast China is consistently reflected across multiple climate models, suggesting that this region may face more persistent hydrological drought in the future.
Figure 10 presents the simulated results of hydrological drought duration and its relative change in 120 Chinese study basins during 2071–2100 under the SSP370 scenario, based on the CMIP6 multi-model ensemble mean (Figure 10a,c) and the CESM2-LE multi-member ensemble mean (Figure 10b,d). Comparative analysis of these two ensemble approaches allows for the assessment of regional trends in future drought persistence and the sensitivity of predicted results to ensemble methodology.
In terms of absolute spatial distribution (Figure 10a,b), both ensembles consistently display a “longer in the north, shorter in the south” pattern. In southern regions (e.g., the middle and lower Yangtze River, Pearl River Basin, and southeastern coastal areas), drought durations are generally short, with CMIP6 ensemble values mainly ranging from 2 to 5 months and slightly higher CESM2-LE results of around 2–6 months. This suggests that although drought frequency may increase in the south, individual drought events are expected to remain relatively short. In contrast, northern regions exhibit significantly longer drought durations, particularly in the Western Songliao River Basin, the Liao River Basin, and parts of North China. CMIP6 ensemble averages show durations of 8–12 months in these areas, while CESM2-LE predicts local maxima of 10–13 months, indicating the potential for more persistent hydrological drought in northern China.
Regarding relative changes in drought duration (Figure 10c,d), both ensembles project substantial increases in parts of Northeast and North China compared to historical periods. The CMIP6 ensemble (Figure 10c) shows 20–30% increases in the Northwestern Songliao River Basin, Liao River Basin, and the middle reaches of the Yellow River, with some basins exceeding 30%. Conversely, southwestern regions, such as the upper Yangtze River and central Yunnan Plateau, show declining drought durations, with localized reductions of 15–25%. The CESM2-LE ensemble (Figure 10d) exhibits similar overall trends but with slightly larger magnitudes. Predicted increases in Northeast China exceed 35% in some basins, while the reduction in drought duration in the southwest is slightly weaker, mostly ranging from 10 to 20%.
In summary, both ensemble simulations indicate that the spatial pattern of hydrological drought duration in Chinese study basins will continue to follow the “longer in the north, shorter in the south” trend in the future. Northern regions, especially localized basins in Northeast China, are projected to face significantly extended drought durations, whereas southern basins show stable or slightly shortened durations. This trend is highly consistent across both CMIP6 and CESM2-LE ensembles, highlighting Northeast China as a key area for drought risk management. It should be noted that the CESM2-LE ensemble, averaging 100 members, may exhibit a smoothing effect on extreme values and thus serves as a reference for hydrological drought projections that consider the influence of internal climate variability.

4.3. Comparative Analysis of Internal Climate Variability and Anthropogenic Climate Change in Hydrological Drought Assessment

4.3.1. Spatial Distribution Characteristics of the Signal-to-Noise Ratio for Drought Frequency

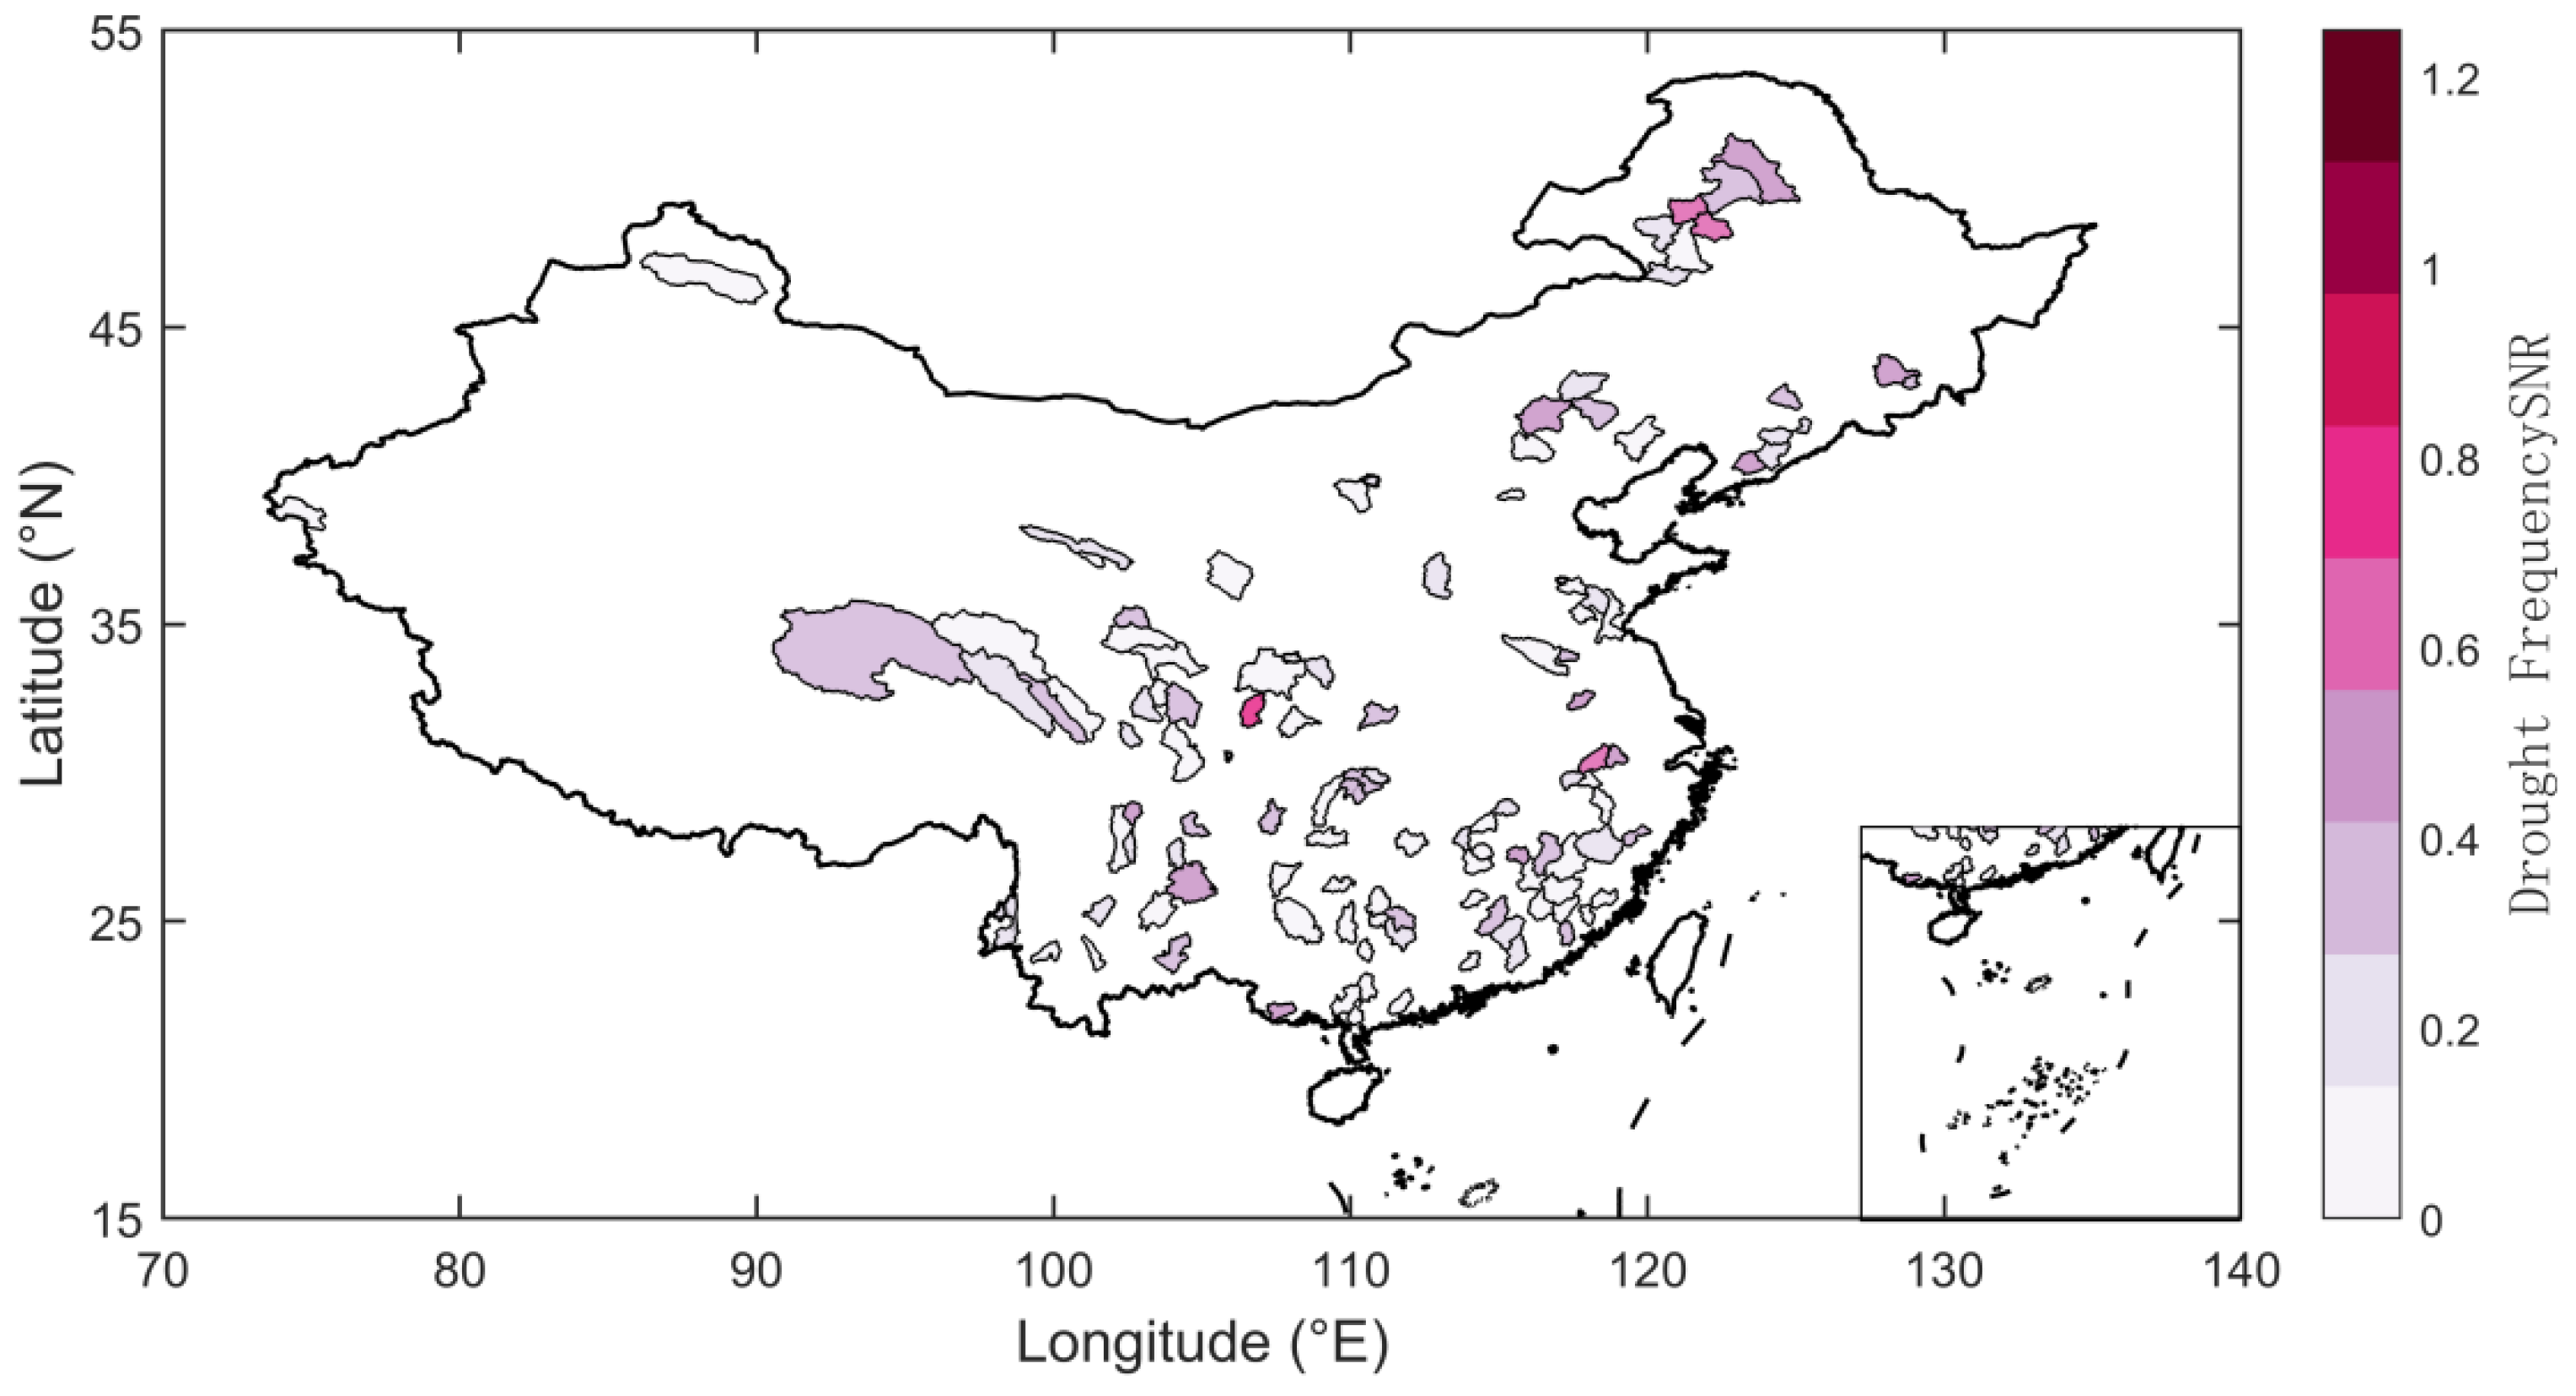
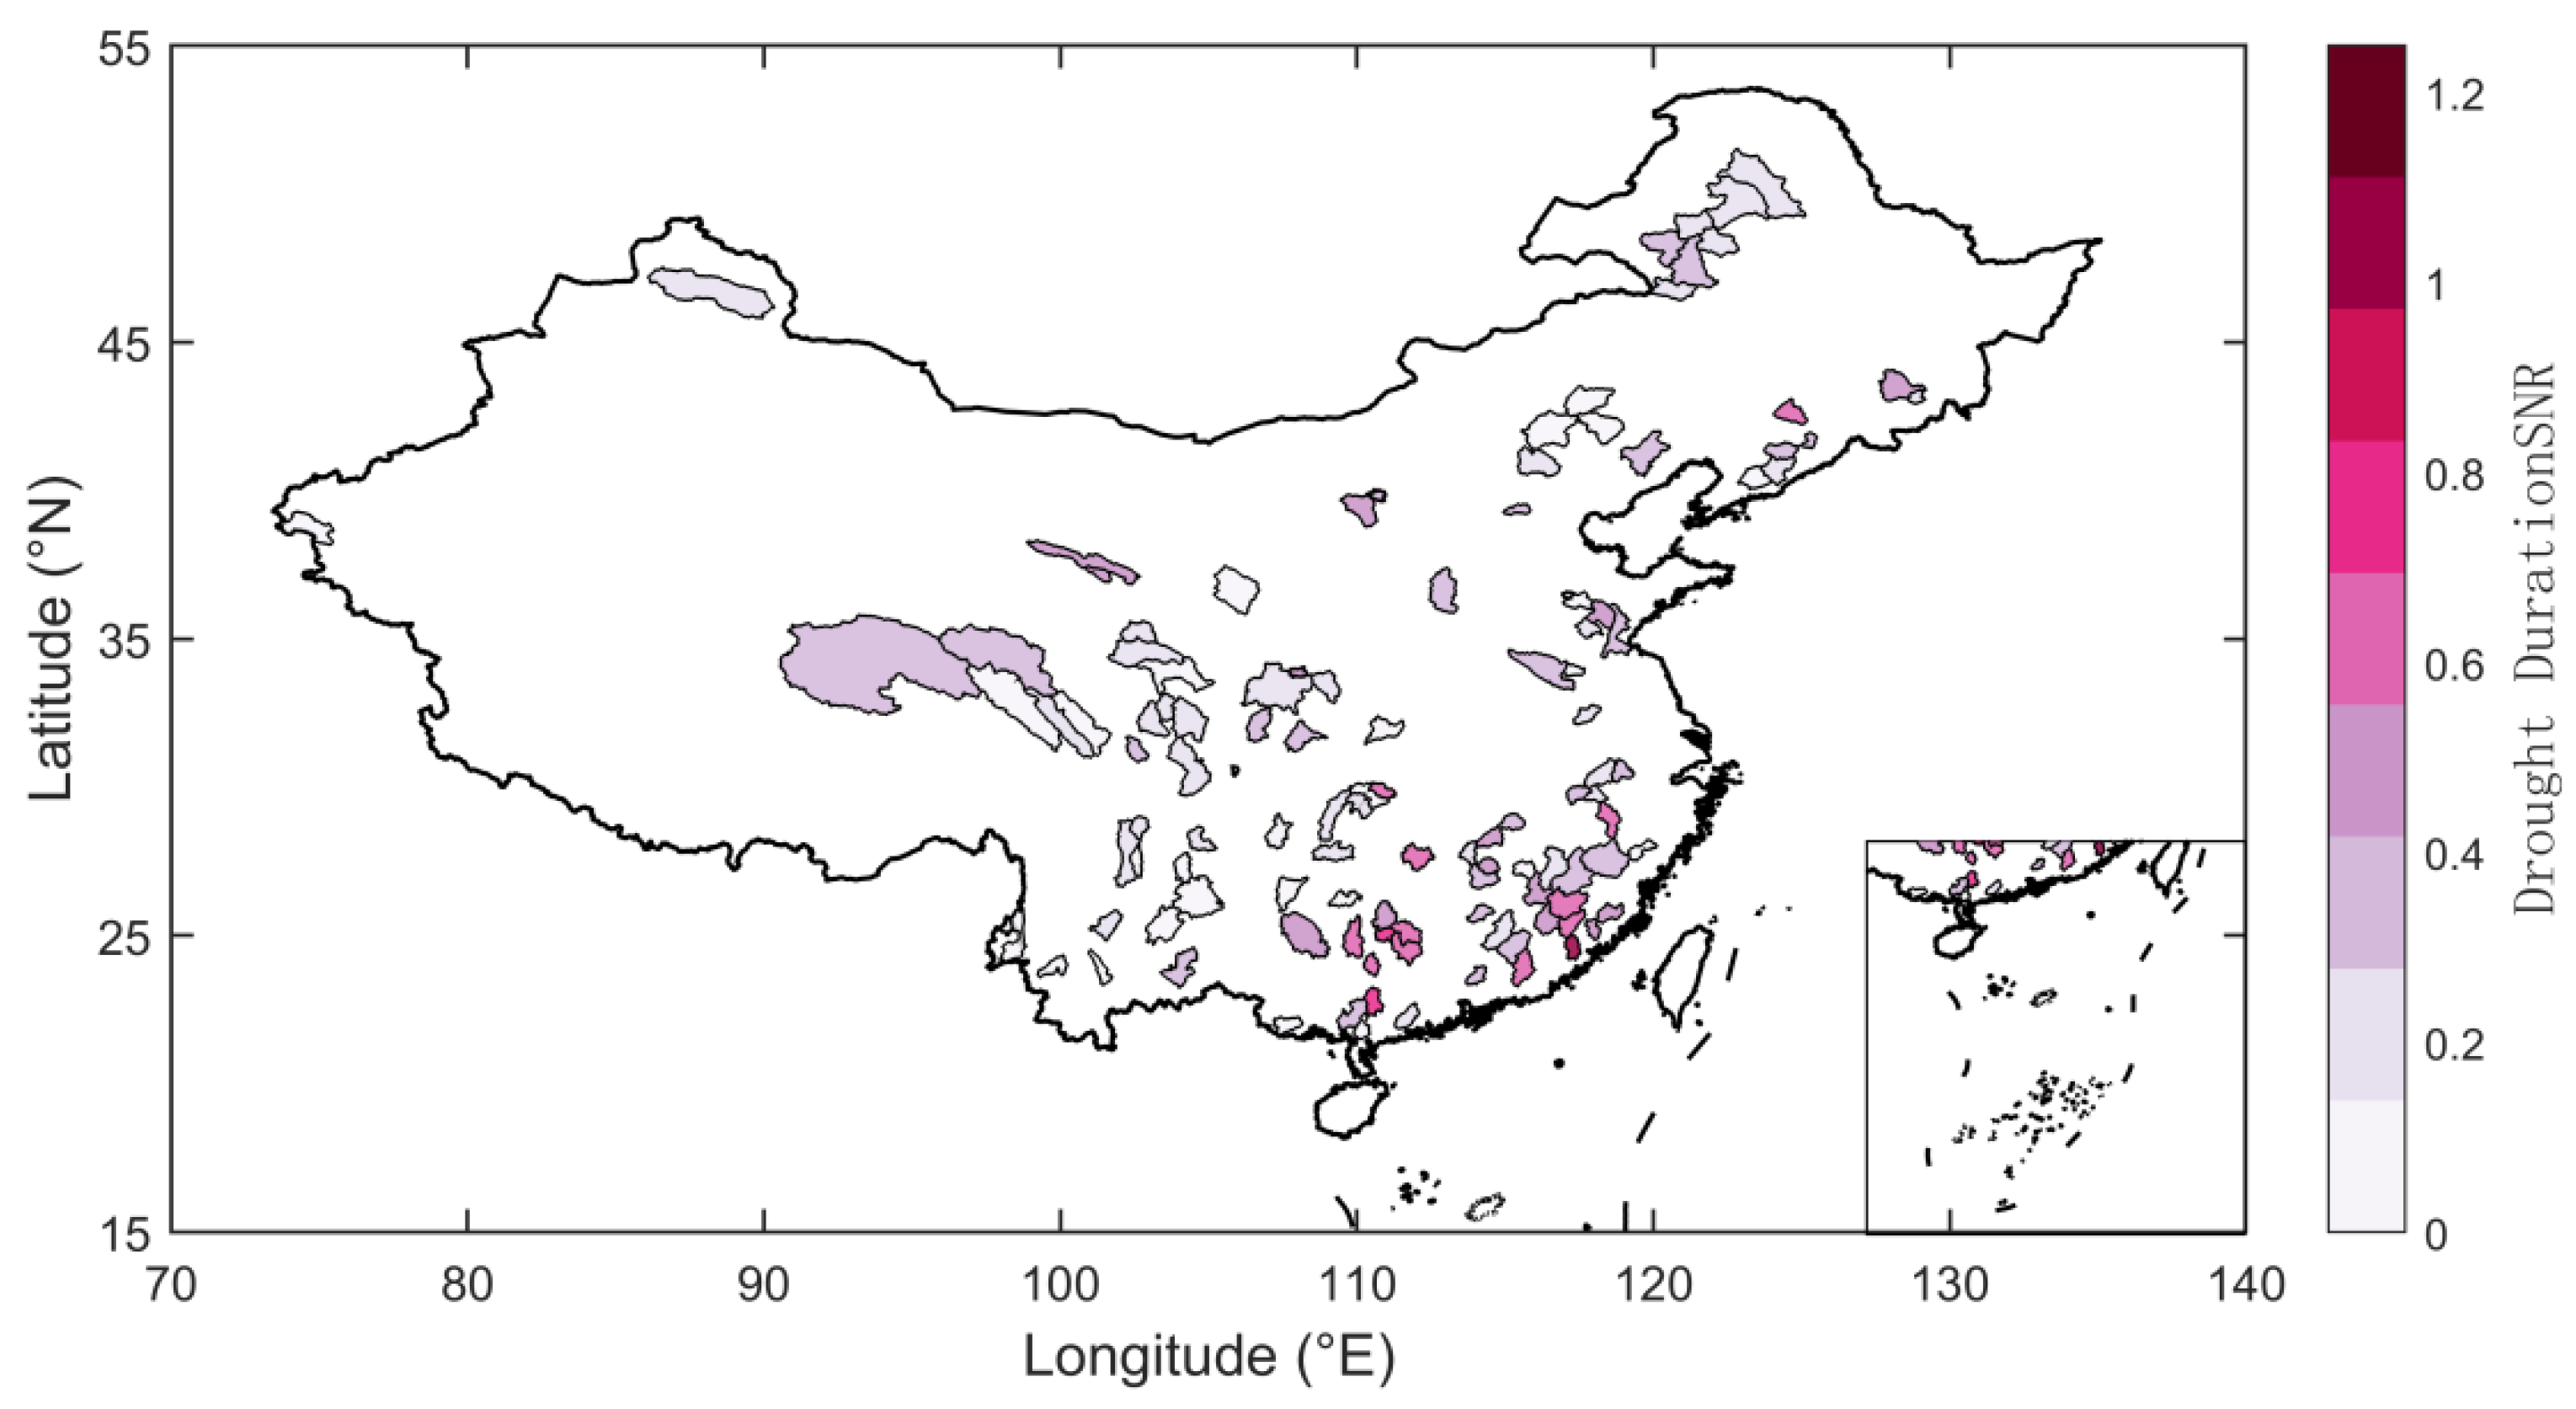
Figure 11 illustrates the spatial distribution of the signal-to-noise ratio (SNR) between the anthropogenic climate change (ACC) signal and internal climate variability (ICV) for future hydrological drought frequency in typical Chinese river basins. The SNR can be used to identify the dominant driver of changes in hydrological drought indicators: SNR > 1 indicates ACC dominance with a clear trend signal, whereas SNR < 1 indicates ICV dominance, implying greater uncertainty in the projections.
Overall, the SNR values for drought frequency across China are generally low, ranging from 0.0027 to 0.87, with most values concentrated between 0.2 and 0.6 and only a few exceeding 0.8. This suggests that changes in future drought frequency are primarily governed by ICV in most regions, and the anthropogenic climate change signal has not yet become a dominant factor at the frequency level. In particular, the arid regions of Northwest China, the upper reaches of the Yellow River, the mid-to-upper reaches of the Yangtze River, and parts of the southern coastal basins exhibit SNR values generally below 0.4, indicating strong ICV dominance. In these regions, future changes in drought frequency are largely dependent on internal climate variability, and climate models have limited ability to capture clear trend signals.
In contrast, some basins in Northeast China show relatively higher SNR values, especially in the northwest of the Songliao River basin, where SNR exceeds 0.8. This indicates that future changes in drought frequency in this area are more likely driven by ACC, with a relatively smaller influence from ICV. Additionally, some central regions, such as the Huai River basin, have SNR values of around 0.6, representing a transitional zone influenced by both ACC and ICV.
In summary, ICV is the dominant factor controlling future changes in hydrological drought frequency in China. Spatially, most areas in Northwest China, central regions, and the southern coastal zones are dominated by ICV, resulting in higher projection uncertainty. Meanwhile, the influence of anthropogenic climate change on drought frequency is relatively evident in the mid-to-upper Yangtze River basin and the Northwest Songliao River basin, providing a relatively stable and predictable trend.

4.3.2. Spatial Distribution Characteristics of the Signal-to-Noise Ratio for Drought Intensity

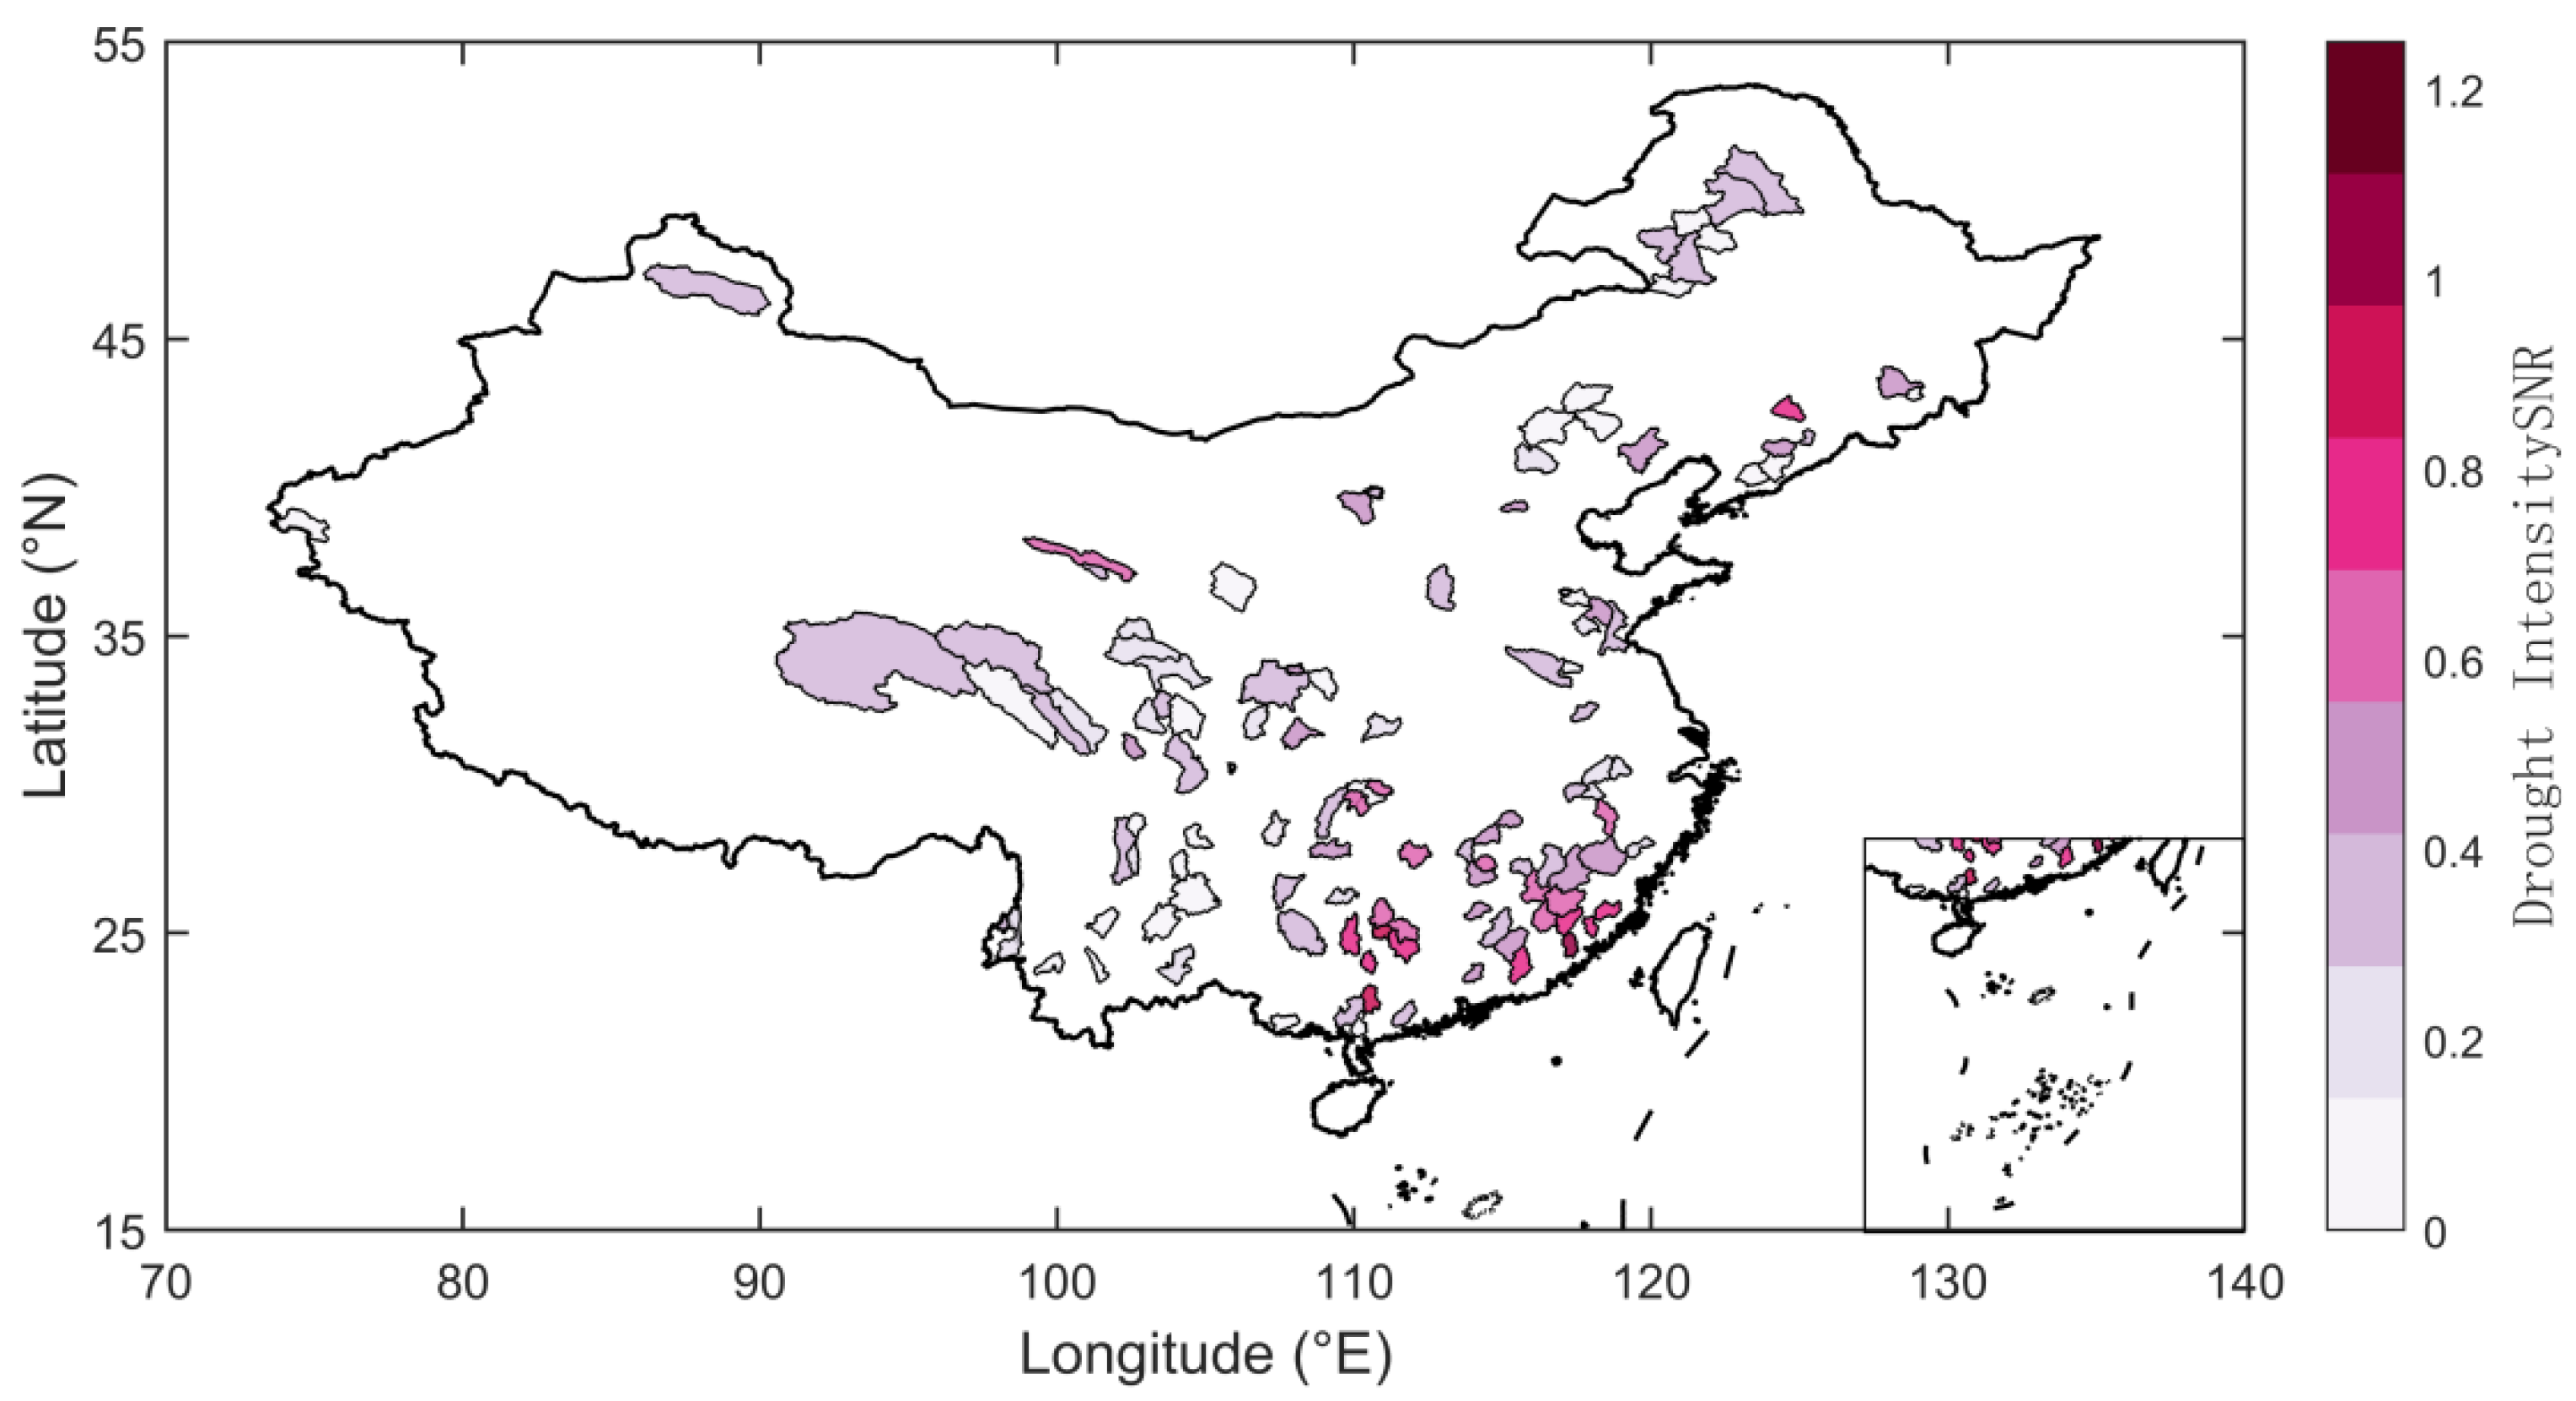
Figure 12 illustrates the spatial distribution of the signal-to-noise ratio (SNR) between anthropogenic climate change (ACC) and internal climate variability (ICV) for future hydrological drought intensity across Chinese river basins. The SNR of drought intensity ranges from 0.0002 to 1.15. Overall, most basins nationwide exhibit SNR values below 1, indicating that ICV will continue to dominate changes in future drought intensity. However, compared with drought frequency, the SNR values for drought intensity are generally higher, suggesting that the relative influence of ACC on drought intensity begins to emerge in certain regions.
From a spatial perspective, the southeastern coastal areas and the Pearl River Basin exhibit relatively high SNR values, with some basins exceeding 1.0, indicating that changes in drought intensity in these regions are significantly driven by ACC and show strong trends and predictability. Meanwhile, the middle and lower reaches of the Yangtze River and inland regions of southern China mostly show SNR values between 0.6 and 0.8, representing a transitional phase from ICV-dominated to ACC-dominated conditions; ACC signals are strengthening, but ICV remains non-negligible. In contrast, the northwestern and northeastern regions generally have SNR values below 0.6, indicating that drought intensity in these areas is primarily controlled by ICV, with substantial uncertainty in future trends.
In summary, ICV continues to play a dominant role in future changes in drought intensity across Chinese river basins, while ACC dominates in the southeastern coastal regions and the Pearl River Basin. The North China Plain and southwestern basins are strongly influenced by ICV, whereas the northeastern and some central regions (e.g., the middle Yangtze and Huai River regions) are subjected to a combined influence of ACC and ICV.

4.3.3. Spatial Distribution Characteristics of the Signal-to-Noise Ratio for Drought Duration

Figure 13 presents the spatial distribution of the signal-to-noise ratio (SNR) between anthropogenic climate change (ACC) and internal climate variability (ICV) for future hydrological drought duration in typical Chinese basins. At the national scale, SNR values for drought duration are generally low, ranging from 0.0018 to 1.16, with most basins falling between 0.2 and 0.6, and only a few exceeding 0.8. This indicates that drought duration is predominantly controlled by ICV.
Spatially, some basins in southern China, such as the middle–lower Yangtze River and parts of the Pearl River basin, exhibit slightly higher SNR values, mostly between 0.6 and 0.8. This suggests that the ACC signal has begun to emerge in these regions’ drought duration, although it has not yet become the dominant driver. Nationwide, these high-SNR areas are relatively sparse, indicating that drought duration remains largely governed by ICV in most regions, and climate models have limited ability to capture its trend, leaving future changes highly dependent on natural variability. In northern China, particularly the Huang–Huai–Hai Plain, the Northeast Plain, and inland basins in the northwest, SNR values are generally below 0.4, demonstrating that drought duration is almost entirely controlled by ICV, with negligible ACC influence, and that predictions of future drought duration carry substantial uncertainty.
In summary, compared with drought frequency and intensity, future changes in drought duration are most strongly dominated by internal climate variability (ICV). In Northern, Northwestern, and Northeastern China, ICV almost completely governs the evolution of drought duration, whereas in some southern regions, particularly the Pearl River basin and southeastern coastal areas, ACC signals begin to appear. These results highlight that predicting future drought duration requires particular attention to the uncertainties introduced by ICV.

4.3.4. Policy Implications: Addressing Uncertainty in Regions with SNR < 1

As the preceding analysis shows, most river basins in China exhibit SNR < 1 for hydrological drought frequency, intensity, and duration, indicating that internal climate variability (ICV) dominates, leading to high uncertainty in future projections. For policymakers, addressing this uncertainty requires strategies that prioritize flexibility, adaptability, and regional differentiation, rather than relying on fixed, trend-based plans. Specific actionable measures are proposed as follows.
In basins where SNR consistently falls below unity, the dominance of internal climate variability implies that any single-model or single-member projection is likely to be swamped by unforced noise. For policymakers, this translates into three actionable guidelines. First, water resource plans should be stress-tested against a range of internally generated drought sequences—e.g., the driest 10% of CESM2-LE members—rather than relying on the ensemble mean trend alone. Second, adaptive management pathways that embed decision triggers (e.g., reservoir rule curves conditional on 3-month SRI) are preferable to static infrastructure designs, because they allow course-correction as the true climate trajectory emerges. Third, in these low-SNR regions, investments should prioritize no-regret measures—demand-side efficiency, inter-basin transfer flexibility, and drought-tolerant cropping systems—that perform robustly regardless of which internal variability phase materializes. By explicitly incorporating the SNR metric into risk frameworks, decision-makers can allocate adaptation funds toward high-SNR areas where anthropogenic signals are actionable, while reserving flexibility for the large residual uncertainty where ICV dominates.

4.4. Comparative Analysis of Internal Climate Variability and Climate Model Uncertainty in Hydrological Drought Assessment

4.4.1. Spatial Distribution Characteristics of Uncertainty Components for Drought Frequency

Climate model uncertainty (IMU) primarily arises from structural differences among climate models, including variations in model architecture, physical parameterizations, and initial condition settings. Its impact on future drought projections cannot be ignored. To quantitatively evaluate the relative contributions of internal climate variability (ICV) and IMU to drought changes, this study introduces the uncertainty component indicator FOSD, which measures the dominant factor influencing prediction uncertainty. When FOSD > 1, ICV contributes more to the uncertainty in drought projections; when FOSD < 1, model uncertainty is more significant.
Figure 14 presents the spatial distribution of FOSD for future drought frequency across typical Chinese basins. The results indicate that FOSD values for drought frequency changes range from 0.5 to 3.5, with most basins concentrated between 0.6 and 1.8. Over 64% of basins have FOSD values greater than 1, indicating that, nationwide, ICV is the primary source of uncertainty in drought frequency projections. In particular, western regions (e.g., the upper Yellow River, Qinghai, Gansu) and southeastern coastal areas (e.g., Fujian, Guangdong) generally exhibit FOSD values between 1.2 and 2.0, significantly higher than other regions. This suggests that future drought frequency changes in these areas are strongly dominated by ICV, with relatively minor influence from model uncertainty. Enhancing predictive capability in these regions requires improved identification and simulation of ICV characteristics.
In contrast, some basins in North China, Northeast China, and Southwest China show relatively lower FOSD values, mostly between 0.6 and 1.0. This indicates that structural differences among climate models have a more pronounced effect on drought frequency projections in these regions. In such areas, the choice of model can lead to substantial deviations in projected results, and drought trends depend on specific model outputs. Therefore, approaches such as multi-model ensemble integration or model weighting optimization are needed to reduce the interference of model uncertainty in decision-making.
In summary, the spatial distribution of FOSD for future drought frequency exhibits clear regional differences: ICV dominates in western and southeastern coastal areas, whereas IMU has a relatively greater impact in North China, Northeast China, and Southwest China. Optimizing model selection and ensemble strategies is essential in regions with high model uncertainty.

4.4.2. Spatial Distribution Characteristics of Uncertainty Components for Drought Intensity

Figure 15 presents the spatial distribution of the uncertainty component index (FOSD) for hydrological drought intensity in typical Chinese river basins during the future period (2071–2100), reflecting the relative contributions of internal climate variability (ICV) and climate model uncertainty (IMU). Similar to the results for drought frequency, FOSD is predominantly governed by ICV in most regions. However, the FOSD values for drought intensity are generally higher, ranging from 0.6 to 3.0, with over 64% of basins exhibiting FOSD values greater than 1. This indicates that natural climate variability plays a more dominant role than model uncertainty in predicting drought intensity.
Specifically, the Haihe River Basin, the middle reaches of the Yellow River Basin, and the midsection of the Yangtze River Basin exhibit significantly higher FOSD values, generally between 1.4 and 1.8. This reflects that in these regions, the contribution of ICV to the uncertainty in drought intensity predictions far exceeds the structural differences among climate models, and the predictive bias introduced by model selection is relatively small. Therefore, improving prediction reliability in these areas primarily requires enhancing the accuracy of ICV simulations and the representativeness of multi-member ensemble simulations.
In contrast, the Pearl River Basin and the southeastern coastal regions of China (e.g., Fujian, Guangdong, Hainan) generally show FOSD values between 0.6 and 1.0, indicating that IMU contributes more substantially to the uncertainty in drought intensity trend predictions. This suggests that in these regions, differences among climate models significantly affect future drought intensity simulations, and predictive outcomes are more dependent on the selected models. Accordingly, reducing uncertainty necessitates approaches such as multi-model ensemble integration, model evaluation, and weighting optimization.
In summary, the spatial distribution of FOSD for future drought intensity in China exhibits notable regional differences: the major central basins (middle reaches of the Yellow River, midsection of the Yangtze River, and Haihe River) are dominated by ICV, with relatively minor influence from model uncertainty, whereas the southeastern coastal regions and the Pearl River Basin are more strongly influenced by IMU.

4.4.3. Spatial Distribution Characteristics of Uncertainty Components in Drought Duration

Figure 16 shows the spatial distribution characteristics of the Fraction of Sources of Uncertainty Difference (FOSD)—an uncertainty component index—between Internal Climate Variability (ICV) and Inter-Model Uncertainty (IMU) regarding the future hydrological drought duration in typical river basins of China. The results indicate that the FOSD values for changes in drought severity range from 0.5 to 3.3, and over 60% of the river basins have an FOSD value greater than 1. This continues the basic pattern of “ICV-dominated in most areas and IMU-dominated in local regions” observed in drought frequency and severity. However, in terms of the drought duration index, the spatial differences are more prominent.
From a regional distribution perspective, the FOSD values in the middle and upper reaches of the Yangtze River Basin, North China (e.g., the Haihe River Basin, the middle and lower reaches of the Yellow River), and Northeast China (the Songliao River Basin) are generally high, mostly ranging from 1.4 to 1.8. This indicates that in the prediction of drought duration in these regions, ICV plays a dominant role, and the natural fluctuations of the climate system have a far greater impact on drought duration than the deviations caused by differences in climate model structures.
In contrast, the FOSD values in the Pearl River Basin and southeastern coastal areas are relatively low, mainly concentrating between 0.6 and 1.0. This suggests that in these regions, the prediction results of drought duration are more dependent on climate models, and the uncertainty caused by inter-model differences is more significant. Therefore, during water resource management and drought response in such regions, priority should be given to strategies such as model evaluation and integrated optimization to reduce potential deviations caused by IMU.
In summary, the FOSD values for future changes in drought duration in China exhibit a certain degree of spatial heterogeneity: the middle and upper reaches of the Yangtze River, North China, and Northeast China are mainly dominated by ICV, while the Pearl River Basin and southeastern coastal areas are more susceptible to the impact of climate model uncertainty (IMU).

5. Discussion

This study focuses on projections of hydrological drought against the background of climate change. Using multi-model climate data from CMIP6 and multi-member large ensemble data from CESM2-LE (LENS2), a hydrological drought simulation framework was developed based on the Quantile Delta Mapping (QDM) bias-correction method. For runoff in 120 typical river basins across China, the standardized runoff index (SRI-3) combined with run theory was employed to systematically analyze the spatiotemporal variations in hydrological drought frequency, severity, and duration during the historical baseline period (1985–2014) and the future period (2071–2100) under the SSP370 scenario. Furthermore, based on 100 ensemble members from CESM2-LE (LENS2) and the CMIP6 multi-model ensemble, the contributions of internal climate variability (ICV), anthropogenic climate change (ACC), and inter-model uncertainty (IMU) to changes in hydrological drought characteristics in Chinese river basins during 2071–2100 were extracted and quantified, providing a detailed assessment of the role of ICV in the uncertainty of drought projections under climate change.
The main results are as follows:
(1) Historical patterns indicate pronounced north–south contrasts in the spatial distribution of hydrological drought. Southern and northeastern basins experienced more frequent drought events (mean ≈ 19 events, with some exceeding 30), but these were mostly short-lived and of low severity, reflecting a pattern of frequent yet mild droughts. In contrast, the North China Plain and parts of northeastern China exhibited longer drought durations (up to 14 months) and higher severity (severity index > 18), indicating that drought processes in Northern China tend to be more persistent and intense.
(2) Future projections (2071–2100) from both CMIP6 and CESM2-LE ensembles suggest a marked intensification of hydrological drought risk in southern China. The middle–lower Yangtze River Basin, the Pearl River Basin, and southeastern coastal regions are projected to experience significantly higher drought frequencies, with some basins exceeding 30 events, representing increases of over 10% compared to the historical period. In terms of severity, the future spatial pattern shows a “stronger north–weaker south” distribution. Western Songliao and Liao River basins in the northeast exhibit marked increases in severity (locally exceeding 38), with growth rates of 20–35%, whereas most southern basins remain at low severity levels (< 8) with minimal changes. Regarding duration, projections reveal a “longer north–shorter south” pattern: drought events in the northeast and north are projected to lengthen significantly, with some basins exceeding 12 months, and CESM2-LE ensemble means surpassing 13 months, implying that Northern China may face more frequent, severe, and persistent droughts in the future.
(3) Comparing ICV and ACC contributions, ICV exerts a more dominant influence on hydrological drought changes across most regions than ACC. For drought frequency, the signal-to-noise ratio (SNR) is below 1 for all basins, indicating that ICV is the primary driver, especially in northwestern China, the upper–middle Yangtze, and the southern coastal region. Severity changes are likewise dominated by ICV, notably in the North China Plain and Southwestern China; however, in southeastern coastal areas and the Pearl River Basin, ACC plays the leading role. In Central and Northeastern China, severity changes result from the combined influence of ICV and ACC. For drought duration, ICV dominance is even stronger, particularly in northern, northwestern, and northeastern regions, where it almost entirely dictates changes, while ACC is more influential in parts of the south, especially the Pearl River Basin and southeastern coast.
(4) Comparing ICV and IMU contributions, spatial patterns reveal that most basins have an uncertainty component (FOSD) greater than 1, implying that ICV plays a stronger role than IMU in driving future hydrological drought changes. For frequency, western and southeastern coastal regions are mainly controlled by ICV, whereas parts of Northern, Northeastern, and Southwestern China are more affected by IMU. For severity, central major basins (middle Yellow River, middle Yangtze, and Hai River) are dominated by ICV, while southeastern coastal regions and the Pearl River Basin are more influenced by IMU. For duration, changes in the upper–middle Yangtze, Northern China, and Northeast China are primarily driven by ICV, whereas the Pearl River Basin and southeastern coast are more affected by IMU.
(5) Overall, ICV remains the dominant factor influencing hydrological drought changes in Chinese basins, particularly in northwestern and northern inland regions. In the southeastern coast and Pearl River Basin, however, ACC exerts a stronger influence on drought severity and duration. Therefore, hydrological drought impact assessments should account for region-specific dominance between ICV and ACC when attributing uncertainty. Additionally, projections for the Pearl River Basin, southeastern coast, and parts of Northeastern China are highly sensitive to climate model structure, with uncertainties strongly affected by IMU. In these areas, improving projection reliability requires careful climate model selection and weighting.

6. Conclusions

6.1. Main Findings

The intensification of global climate change has become a central concern of the international community. Climate change has accelerated the hydrological cycle, leading to a more uneven distribution of water resources and an increased frequency of extreme hydrological events. Among these, hydrological drought has emerged as one of the most significant climate-related hazards. In China, droughts are particularly prominent, characterized by long duration, high frequency, wide spatial extent, and severe socio-economic impacts, posing serious constraints on sustainable regional development. Against the backdrop of global warming, improving the bias-correction accuracy of climate model outputs, accurately projecting future basin-scale hydrological drought trends, and elucidating the relative contributions of internal climate variability (ICV), anthropogenic climate change (ACC), and inter-model uncertainty (IMU) to drought evolution represent both key challenges and research frontiers.
In this context, this study selects 120 representative basins across China as the research domain, integrating CMIP6 multi-model ensemble data with CESM2-LE large ensemble simulations. A climate model bias-correction framework combining statistical methods with deep learning techniques is developed to enhance the spatiotemporal accuracy of multi-model data. Furthermore, based on the “abcd” water balance model, this study simulates the hydrological drought characteristics of Chinese basins under the SSP370 scenario for the period 2071–2100 and quantitatively assesses the relative contributions of ICV, ACC, and IMU to hydrological drought projections. The main research contents and findings are as follows:
(1) Improving climate model bias correction and capturing extreme events
To address the limitations in bias correction accuracy and the representation of extreme events, a Quantile Delta Mapping (QDM) bias-correction model is proposed, integrating statistical correction techniques with a deep learning framework to perform spatiotemporal joint correction of temperature and precipitation. The performance of different correction methods in improving precipitation and temperature simulation accuracy is systematically evaluated. Using multi-dimensional metrics—including spatial error patterns, correlation coefficients, statistical distribution characteristics, and temporal deviations—across 12 climate models, the results show that the QDM method significantly improves simulation accuracy, particularly for Southern China. For example, after QDM correction, the mean RMSE for precipitation in Southeastern China is reduced by approximately 31.2%, while the national mean RMSE for temperature decreases from about 3.8 °C to 2.1 °C.
(2) Projection of hydrological drought in Chinese basins under SSP370 (2071–2100)
Using bias-corrected multi-model climate data, hydrological drought projections for 120 basins in China are conducted. Historical baseline analysis (1985–2014) reveals that southern and northeastern basins exhibit high drought frequency (often exceeding 19 events per 30 years) but low severity and short duration, whereas northern and northeastern inland regions show high severity (exceeding 18 in severity index) and long duration (up to 14 months). Future projections indicate that southern basins—including the middle–lower Yangtze, Pearl River Basin, and southeastern coastal regions—will experience a marked increase in drought frequency, with some basins exceeding 30 events and increases of over 10% relative to the historical period. In contrast, drought severity in northern and northeastern regions will intensify significantly (exceeding 38 in severity index), with drought duration commonly surpassing 12 months, and in some cases exceeding 13 months. These findings highlight a projected spatial shift towards a “high-frequency south, high-intensity north” drought pattern in future China, emphasizing the importance of multi-model and multi-scenario simulations for regional water resource risk assessment and planning.
(3) Quantifying the influence of ICV, ACC, and IMU on drought evolution
To clarify the role of ICV in hydrological drought evolution, signals of ICV, ACC, and IMU are extracted from CMIP6 multi-model ensembles and CESM2-LE large ensemble data, enabling systematic quantification of the relative contributions of these factors. Results indicate that ICV is the dominant driver of future hydrological drought changes in most Chinese basins, particularly in the northwest, north, and northeast. For drought frequency, over 70% of basins have a signal-to-noise ratio (SNR) below 0.6, especially in the northwest, upper Yellow River, and upper Yangtze regions. Drought severity changes are also largely driven by ICV, with the North China Plain and southwest regions being most affected. However, in some southeastern coastal and Pearl River basins, ACC emerges as the primary factor. Drought duration is predominantly influenced by ICV nationwide, with over 80% of basins having SNR values below 0.6, especially in the northeast and northern drought-prone zones. Additionally, analysis of the Fraction of Sources of Uncertainty Difference (FOSD) reveals that FOSD values generally exceed 1.2 in western and southeastern coastal regions, indicating that ICV is the main source of uncertainty in drought projections in these areas. In contrast, FOSD values below 1.0 in the Pearl River Delta, middle–lower Yangtze, and parts of the northeast suggest that IMU plays a more substantial role locally, underscoring the need for careful climate model selection in these regions.

6.2. Policy Implications

The findings of this study carry significant implications for water resource management and climate adaptation policy in China. First, the projected increase in drought frequency in southern China—particularly in the Yangtze and Pearl River basins—calls for enhanced drought monitoring and early-warning systems in these regions. Policymakers should prioritize the development of flexible water allocation mechanisms and reservoir operation strategies to cope with more frequent dry spells.
Second, the intensification of drought severity and duration in Northern and Northeastern China highlights the urgent need for long-term water security planning. This includes investing in water-saving technologies, promoting agricultural drought resilience, and potentially re-evaluating land use policies in drought-prone areas.
Third, the dominant role of internal climate variability (ICV) in driving future drought changes suggests that historical climate patterns may not be reliable predictors of future conditions. This underscores the importance of adopting robust, uncertainty-aware planning frameworks that account for a wide range of climate futures.
Lastly, the spatial heterogeneity in the sources of projection uncertainty—particularly the notable influence of inter-model uncertainty (IMU) in regions like the Pearl River Delta and the middle–lower Yangtze—emphasizes the need for careful model selection and ensemble-based approaches in regional climate impact assessments. Investment in regional downscaling and model evaluation initiatives should be prioritized to reduce IMU and improve the reliability of local-scale projections.

Author Contributions

Conceptualization, H.L., X.W., Y.L. and X.L.; methodology, H.L., X.W., H.W. and X.L.; validation, Y.L., H.H. and C.C.; formal analysis, X.P., H.H. and C.C.; investigation, H.W. and C.C.; resources, H.H. and J.G.; data curation, H.L., X.W. and X.L.; writing—original draft preparation, H.L., X.W. and X.L.; writing—review and editing, Y.L. and H.W.; visualization, H.L., X.W. and X.L.; supervision, H.L. and H.W.; project administration, H.L. and X.W.; funding acquisition, Y.L. and J.G. All authors have read and agreed to the published version of the manuscript.

Funding

The National Natural Science Foundation of China (Grant NO: U2340211), the Key Science and Technology Project of Water Conservancy in Hubei Province (Grant NO: HBSLKY202413), the National Key R&D Program of China (Grant NO: 2023YFC3209105), the National Key R&D Program of China (Grant NO: 2022YFC3002704), and the Strategic Consulting Project supported by the Chinese Academy of Engineering (CAE) (Grant NO: HB2024C18).

Data Availability Statement

The original contributions presented in this study are included in the article. Further inquiries can be directed to the corresponding author.

Conflicts of Interest

Authors Haochuan Li and Han Wu were employed by the company Powerchina Zhongnan Engineering Corporation Limited. The remaining authors declare that the research was conducted in the absence of any commercial or financial relationships that could be construed as a potential conflict of interest.

References

  1. Naidoo, S. Commentary on the Contribution of Working Group III to the Sixth Assessment Report of the Intergovernmental Panel on Climate Change. S. Afr. J. Sci. 2022, 118, 16–19. [Google Scholar] [CrossRef] [PubMed]
  2. Siegmund, P.; Abermann, J.; Baddour, O.; Sparrow, M.; Nitu, R.; Tarasova, O.; Canadell, P.; Cazenave, A.; Derksen, C.; Mudryk, L.; et al. The Global Climate in 2015–2019; World Meteorological Organization (WMO): Geneva, Switzerland, 2020. [Google Scholar]
  3. Qin, D. Climate change science and sustainable development. Prog. Geogr. 2014, 33, 874–883. [Google Scholar]
  4. Foster, G.; Rahmstorf, S. Global Temperature Evolution 1979–2010. Environ. Res. Lett. 2011, 6, 44022. [Google Scholar] [CrossRef]
  5. Rahmstorf, S.; Foster, G.; Cahill, N. Global Temperature Evolution: Recent Trends and Some Pitfalls. Environ. Res. Lett. 2017, 12, 54001. [Google Scholar] [CrossRef]
  6. Allen, M.R.; Ingram, W.J. Constraints on Future Changes in Climate and the Hydrologic Cycle. Nature 2002, 419, 224–232. [Google Scholar] [CrossRef]
  7. Held, I.M.; Soden, B.J. Robust Responses of the Hydrological Cycle to Global Warming. J. Clim. 2006, 19, 5686–5699. [Google Scholar] [CrossRef]
  8. Wang, X.; Jiang, D.; Lang, X. Future Extreme Climate Changes Linked to Global Warming Intensity. Sci. Bull. 2017, 62, 1673–1680. [Google Scholar] [CrossRef]
  9. Feng, G. China’s Blue Book on Climate Change (2021) has been released. Environment 2021, 75–77. Available online: https://kns.cnki.net/kcms2/article/abstract?v=w3MPIJRjtYGh8B4zPJOgd_NPCKfeSE7eK31nluadf8rTkHCnqw9U2v0IUeRlXZVtmdVBZCaV8d2vFyDaGXdEw3UX-WgtYsyQ0enknXQx9g5w5auapp104_rjhegkyBfsKECn7qI-V4u5njXf-Gg0RUr_4Epm74k_4oe0LuMq79QrgojtUX0GJg==&uniplatform=NZKPT&language=CHS (accessed on 18 August 2025).
  10. Wang, G.; Zhang, J.; He, R. Impacts of environmental change on runoff in Fenhe river basin of the middle Yellow River. Adv. Water Sci. 2006, 17, 853–858. [Google Scholar]
  11. Chen, J.; Brissette, F.P.; Leconte, R. Uncertainty of Downscaling Method in Quantifying the Impact of Climate Change on Hydrology. J. Hydrol. 2011, 401, 190–202. [Google Scholar] [CrossRef]
  12. Qin, P.; Liu, M.; Du, L.; Xu, H.; Liu, L.; Xiao, C. Climate change impacts on runoff in the upper Yangtze River basin. Clim. Change Res. 2019, 15, 405–415. [Google Scholar]
  13. Xu, W.; Chen, J.; Gu, L.; Zhu, B.; Zhuan, M. Runoff response to 1.5 °C and 2.0 °C global warming for the Yangtze River basin. Clim. Change Res. 2020, 16, 690–705. [Google Scholar]
  14. Deser, C.; Phillips, A.; Bourdette, V.; Teng, H. Uncertainty in Climate Change Projections: The Role of Internal Variability. Clim. Dyn. 2012, 38, 527–546. [Google Scholar] [CrossRef]
  15. Shen, Y.; Wang, G. Key Findings and Assessment Result of IPCC WGI Fifth Assessment Report. J. Glaciol. Geocryol. 2013, 35, 1068–1076. [Google Scholar]
  16. Song, X.; Zhang, J.; Zhan, C.; Liu, C. Review for impacts of climate change and human activities on water cycle. J. Hydraul. Eng. 2013, 44, 779–790. [Google Scholar]
  17. Piao, S.; Ciais, P.; Huang, Y.; Shen, Z.; Peng, S.; Li, J.; Zhou, L.; Liu, H.; Ma, Y.; Ding, Y.; et al. The Impacts of Climate Change on Water Resources and Agriculture in China. Nature 2010, 467, 43–51. [Google Scholar] [CrossRef] [PubMed]
  18. Yin, J.; Gentine, P.; Zhou, S.; Sullivan, S.C.; Wang, R.; Zhang, Y.; Guo, S. Large Increase in Global Storm Runoff Extremes Driven by Climate and Anthropogenic Changes. Nat. Commun. 2018, 9, 4389. [Google Scholar] [CrossRef] [PubMed]
  19. Dai, A. Increasing Drought under Global Warming in Observations and Models. Nat. Clim. Change 2013, 3, 52–58. [Google Scholar] [CrossRef]
  20. Orlowsky, B.; Seneviratne, S.I. Elusive Drought: Uncertainty in Observed Trends and Short- and Long-Term CMIP5 Projections. Hydrol. Earth Syst. Sci. 2013, 17, 1765–1781. [Google Scholar] [CrossRef]
  21. Lehner, F.; Deser, C.; Terray, L. Toward a New Estimate of “Time of Emergence” of Anthropogenic Warming: Insights from Dynamical Adjustment and a Large Initial-Condition Model Ensemble. J. Clim. 2017, 30, 7739–7756. [Google Scholar] [CrossRef]
  22. Naumann, G.; Alfieri, L.; Wyser, K.; Mentaschi, L.; Betts, R.A.; Carrao, H.; Spinoni, J.; Vogt, J.; Feyen, L. Global Changes in Drought Conditions under Different Levels of Warming. Geophys. Res. Lett. 2018, 45, 3285–3296. [Google Scholar] [CrossRef]
  23. Kiem, A.S.; Johnson, F.; Westra, S.; Van Dijk, A.; Evans, J.P.; O’Donnell, A.; Rouillard, A.; Barr, C.; Tyler, J.; Thyer, M.; et al. Natural Hazards in Australia: Droughts. Clim. Change 2016, 139, 37–54. [Google Scholar] [CrossRef]
  24. Mondal, A.; Mujumdar, P.P. Return Levels of Hydrologic Droughts under Climate Change. Adv. Water Resour. 2015, 75, 67–79. [Google Scholar] [CrossRef]
  25. Fischer, E.M.; Knutti, R. Detection of Spatially Aggregated Changes in Temperature and Precipitation Extremes. Geophys. Res. Lett. 2014, 41, 547–554. [Google Scholar] [CrossRef]
  26. Zheng, X.-T.; Hui, C.; Yeh, S.-W. Response of ENSO Amplitude to Global Warming in CESM Large Ensemble: Uncertainty Due to Internal Variability. Clim. Dyn. 2018, 50, 4019–4035. [Google Scholar] [CrossRef]
  27. Martel, J.-L.; Mailhot, A.; Brissette, F.; Caya, D. Role of Natural Climate Variability in the Detection of Anthropogenic Climate Change Signal for Mean and Extreme Precipitation at Local and Regional Scales. J. Clim. 2018, 31, 4241–4263. [Google Scholar] [CrossRef]
  28. Gu, L.; Chen, J.; Xu, C.-Y.; Kim, J.-S.; Chen, H.; Xia, J.; Zhang, L. The Contribution of Internal Climate Variability to Climate Change Impacts on Droughts. Sci. Total Environ. 2019, 684, 229–246. [Google Scholar] [CrossRef]
  29. Shiogama, H.; Fujimori, S.; Hasegawa, T.; Hayashi, M.; Hirabayashi, Y.; Ogura, T.; Iizumi, T.; Takahashi, K.; Takemura, T. Important Distinctiveness of SSP3–7.0 for Use in Impact Assessments. Nat. Clim. Change 2023, 13, 1276–1278. [Google Scholar] [CrossRef]
  30. Wang, L.; Deng, A.; Huang, R. Wintertime Internal Climate Variability over Eurasia in the CESM Large Ensemble. Clim. Dyn. 2019, 52, 6735–6748. [Google Scholar] [CrossRef]
  31. Sui, Y.; Lang, X.; Jiang, D. Time of Emergence of Climate Signals over China under the RCP4.5 Scenario. Clim. Change 2014, 125, 265–276. [Google Scholar] [CrossRef]
  32. Nguyen, T.-H.; Min, S.-K.; Paik, S.; Lee, D. Time of Emergence in Regional Precipitation Changes: An Updated Assessment Using the CMIP5 Multi-Model Ensemble. Clim. Dyn. 2018, 51, 3179–3193. [Google Scholar] [CrossRef]
  33. Hawkins, E.; Sutton, R. The Potential to Narrow Uncertainty in Regional Climate Predictions. Bull. Am. Meteorol. Soc. 2009, 90, 1095–1108. [Google Scholar] [CrossRef]
  34. Hawkins, E.; Sutton, R. Time of Emergence of Climate Signals. Geophys. Res. Lett. 2012, 39, L01702. [Google Scholar] [CrossRef]
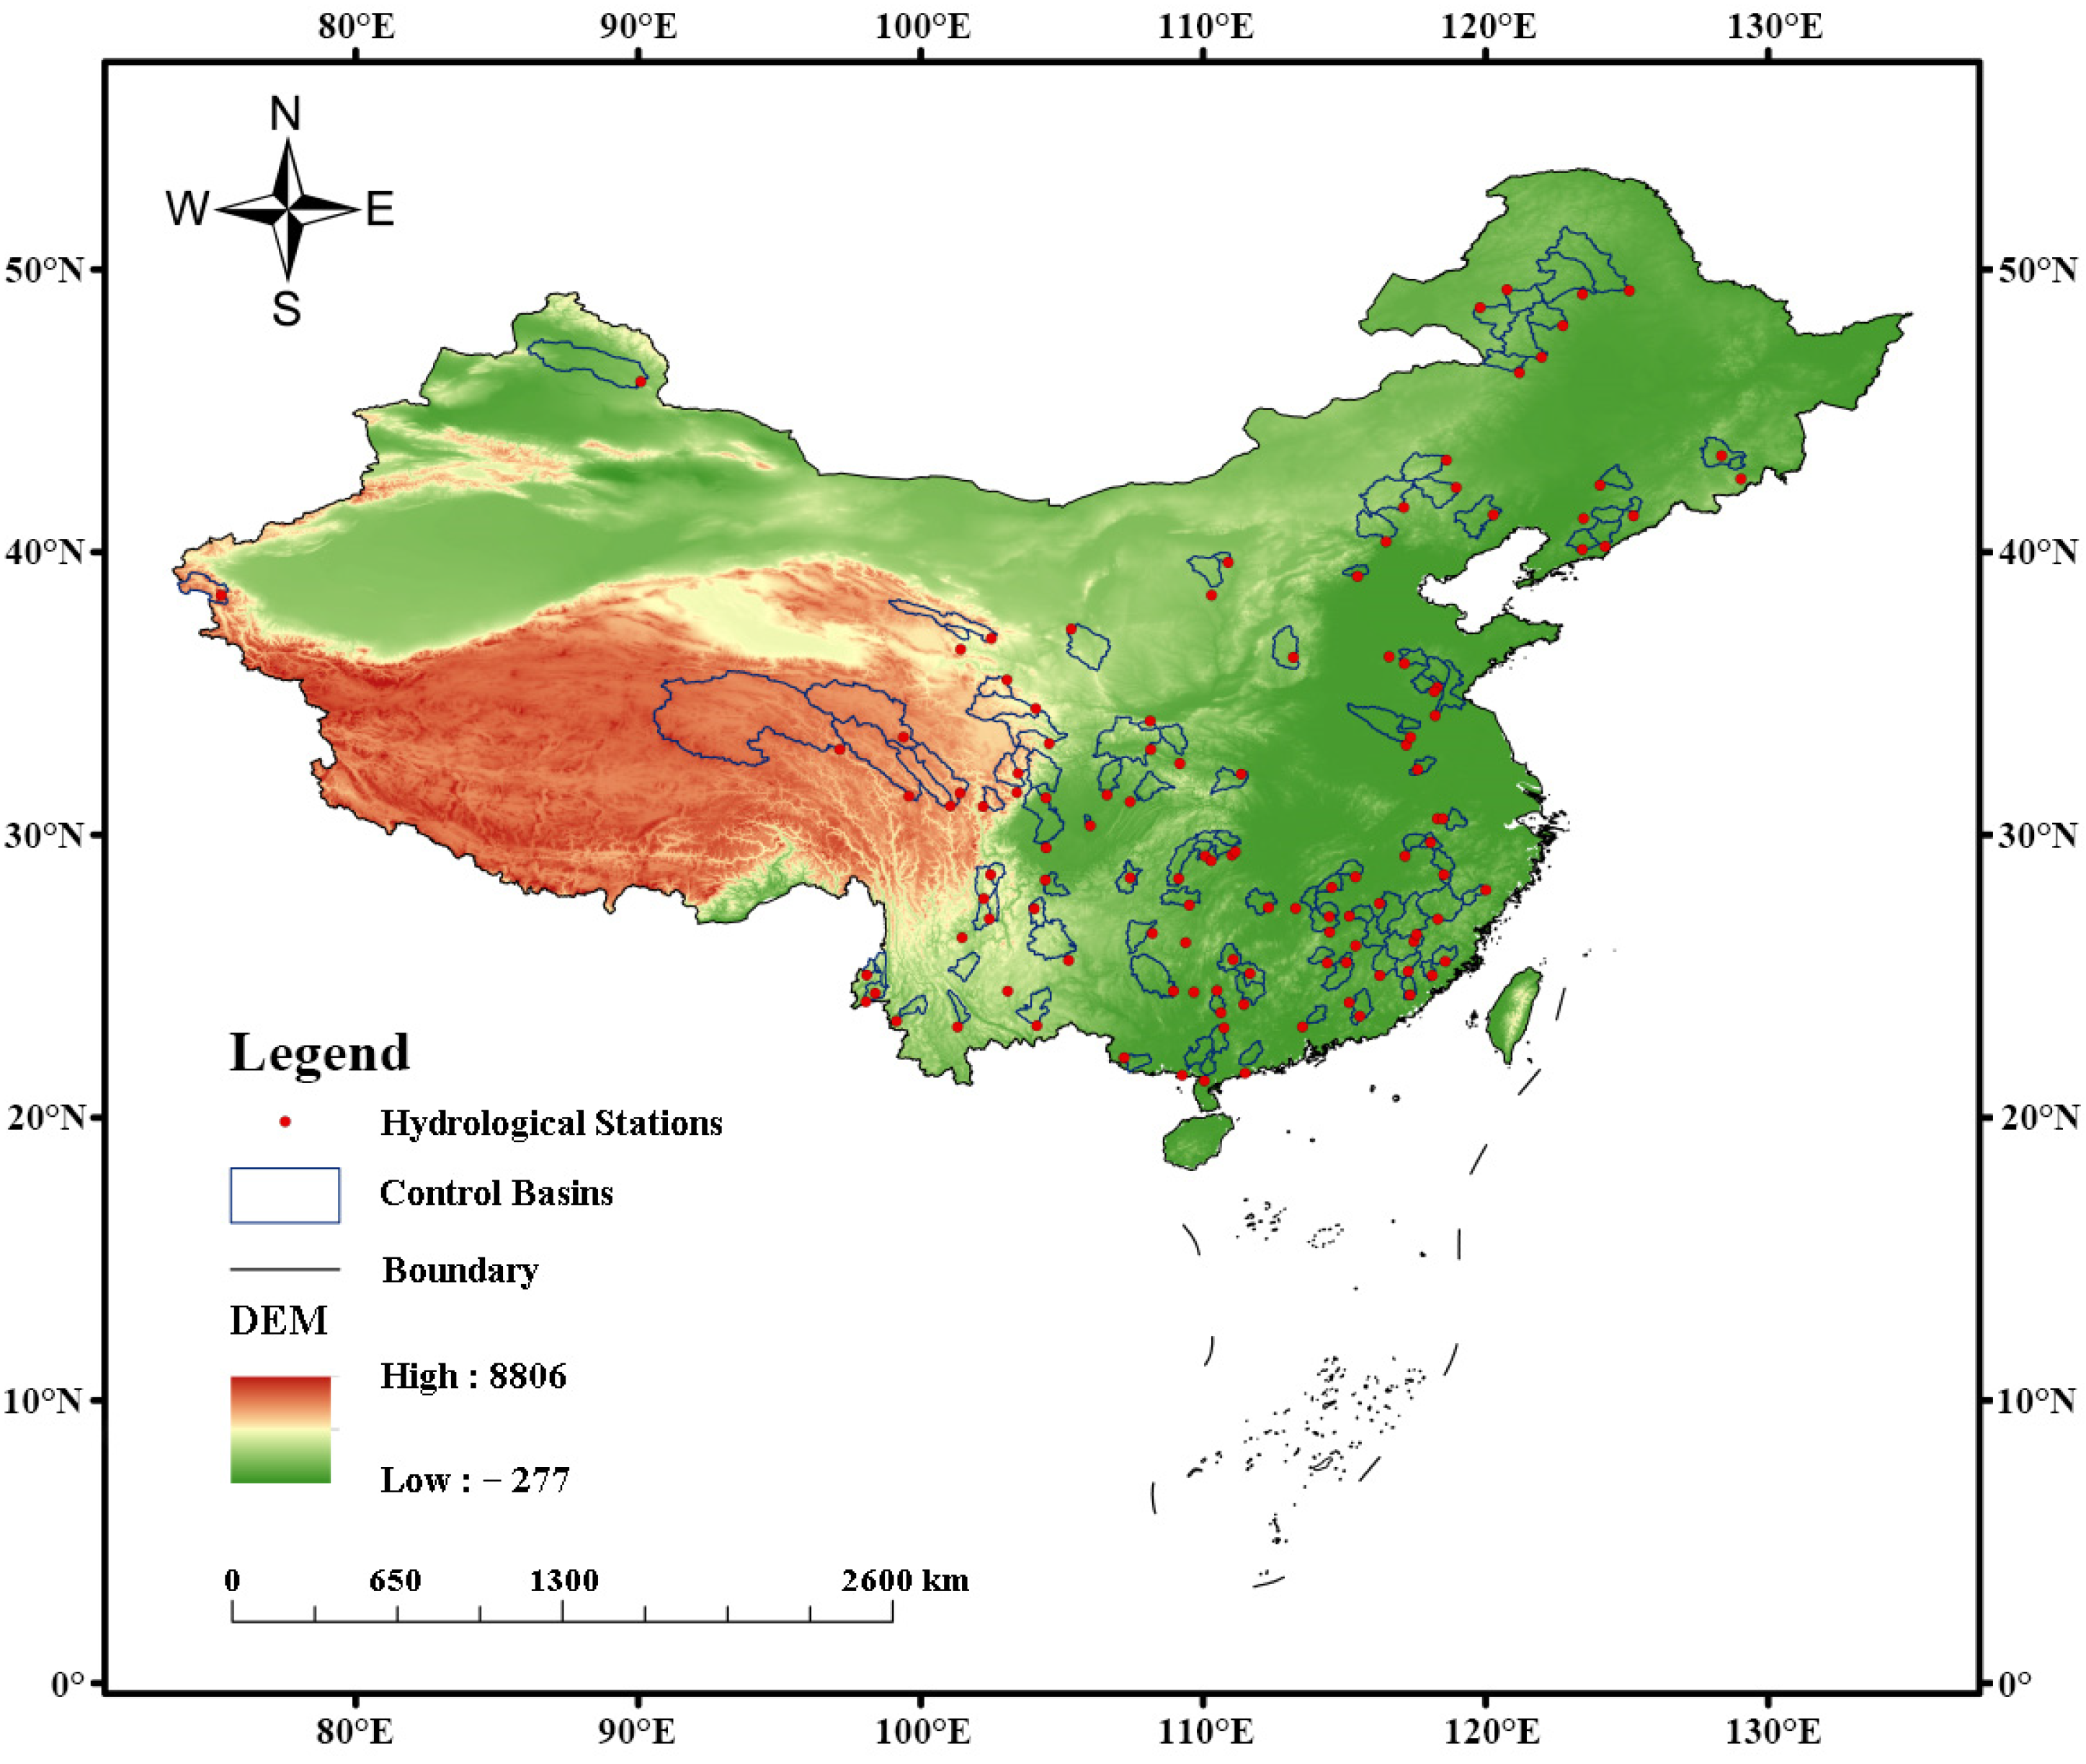
Figure 1. Spatial distribution of hydrological stations and control basins.
Water 17 02736 g001
Figure 2. Schematic diagram of run theory.
Water 17 02736 g002
Figure 3. Comparison of the spatial distribution of monthly precipitation RMSE for the multi-model ensemble over China during 2010–2014: (a) represents the raw model data; (b) represents the results after QDM correction.
Water 17 02736 g003
Figure 4. Comparison of the spatial distribution of monthly temperature RMSE for the multi-model ensemble over China during 2010–2014: (a) represents the raw model data; (b) represents the results after QDM correction.
Water 17 02736 g004
Figure 5. Spatial distribution of hydrological drought frequency in Chinese study basins for 2071–2100, simulated by CMIP6 multi-models and CESM2-LE under the SSP3-7.0 scenario.
Water 17 02736 g005
Figure 6. Frequency and relative changes in basin-scale droughts during 2071–2100 based on the CMIP6 multi-model ensemble mean and CESM2-LE multi-member ensemble mean. Figures (a,c) represent the projected future hydrological drought frequency and relative changes from the CMIP6 multi-model ensemble; Figures (b,d) represent the projected future hydrological drought frequency and relative changes from the CESM2-LE multi-member ensemble.
Water 17 02736 g006
Figure 7. Projected distribution of hydrological drought intensity in Chinese study basins during 2071–2100 under SSP3-7.0 Based on CMIP6 multi-model and CESM2-LE simulations.
Water 17 02736 g007
Figure 8. Projected hydrological drought intensity and relative changes in 2071–2100 based on CMIP6 multi-model and CESM2-LE multi-member ensemble averages. Figures (a,c) represent future drought intensity and relative changes from the CMIP6 multi-model ensemble; Figures (b,d) represent future drought intensity and relative changes from the CESM2-LE multi-member ensemble.
Water 17 02736 g008
Figure 9. Spatial distribution of hydrological drought duration in 120 Chinese study basins during 2071–2100 simulated by the CMIP6 multi-model ensemble and CESM2-LE multi-member ensemble under the SSP370 scenario.
Water 17 02736 g009
Figure 10. Drought duration and its relative change in river basins during 2071–2100 based on the CMIP6 multi-model ensemble mean and the CESM2-LE multi-member ensemble mean. Figures (a,c) represent future hydrological drought duration and relative change from the CMIP6 multi-model ensemble; Figures (b,d) represent the same from the CESM2-LE multi-member ensemble.
Water 17 02736 g010
Figure 11. Spatial distribution of the signal-to-noise ratio (SNR) for future (2071–2100) basin-scale hydrological drought frequency under the influences of internal climate variability (ICV) and anthropogenic climate change (ACC).
Water 17 02736 g011
Figure 12. Spatial distribution of the signal-to-noise ratio (SNR) of future (2071–2100) basin-scale hydrological drought intensity based on the relative contributions of internal climate variability (ICV) and anthropogenic climate change (ACC).
Water 17 02736 g012
Figure 13. Spatial distribution of the signal-to-noise ratio (SNR) for future basin-scale hydrological drought duration (2071–2100) based on the relative influences of internal climate variability (ICV) and anthropogenic climate change (ACC).
Water 17 02736 g013
Figure 14. Spatial distribution of uncertainty components (FOSD) for basin-scale hydrological drought frequency in the future period (2071–2100) based on differences between internal climate variability (ICV) and climate model uncertainty (IMU).
Water 17 02736 g014
Figure 15. Spatial distribution of uncertainty components (FOSD) in future (2071–2100) hydrological drought intensity in river basins based on the differential impacts of internal climate variability (ICV) and climate model uncertainty (IMU).
Water 17 02736 g015
Figure 16. Spatial distribution of the uncertainty component (FOSD) in future (2071–2100) hydrological drought duration in river basins based on differences between internal climate variability (ICV) and climate model uncertainty (IMU).
Water 17 02736 g016
Table 1. Information on GCMs used in this study.
NoModel NameResearch InstitutionHorizontal Resolution
1ACCESS-CM2CSIRO-ARCCSS1.8750° × 1.25°
2ACCESS-ESM1-5CSIRO1.8750° × 1.25°
3BCC-CSM2-MRBCC1.125° × 1.1213°
4CanESM5CCCma2.8125° × 2.7893°
5CMCC-CM2-SR5CMCC1.25° × 0.9424°
6FGOALS-g3CAS2° × 2.2785°
7GFDL-ESM4NOAA-GFDL1.25° × 1°
8MRI-ESM2-0MRI1.1250° × 1.1213°
9NorESM2-MMNCC1.25° × 0.9424°
10INM-CM5-0INM2° × 1.5°
11IPSL-CM6A-LRIPSL2.5° × 1.2676°
1ACCESS-CM2CSIRO-ARCCSS1.8750° × 1.25°
Disclaimer/Publisher’s Note: The statements, opinions and data contained in all publications are solely those of the individual author(s) and contributor(s) and not of MDPI and/or the editor(s). MDPI and/or the editor(s) disclaim responsibility for any injury to people or property resulting from any ideas, methods, instructions or products referred to in the content.