Article

Spatio–Temporal Dynamics of Groundwater Levels in the Piedmont Po Plain (NW Italy): Impacts of Climate Change and Land Use

Earth Sciences Department, University of Torino, 10125 Torino, Italy
*
Author to whom correspondence should be addressed.
Water 2025, 17(18), 2712; https://doi.org/10.3390/w17182712
Submission received: 31 July 2025 / Revised: 2 September 2025 / Accepted: 11 September 2025 / Published: 13 September 2025
(This article belongs to the Section Hydrogeology)

Abstract

This study analyses spatio–temporal trends in groundwater level (GWL) across the Piedmont Po Plain (NW Italy), aiming to assess the impacts of climate change (CC) and human drivers on regional groundwater systems. Data were collected from a network of automated monitoring wells over the period 2010–2022, supported by meteorological records from regional weather stations. Results indicate a widespread decline in GWL, with an average of −4.32 cm/y and a maximum of −16.74 cm/y in the time period observed, particularly in recent years. These trends align with decreasing precipitation patterns observed in the region. However, deviations from this general behaviour are also identified. More specifically, local land use practices—specifically rice field and irrigation—may be artificially maintaining GWL. Moreover, hydrometric level data from the main rivers of the region were analysed to evaluate potential interactions with GWL variations. This comparison showed that, in general, no clear correspondence exists between river level fluctuations and groundwater dynamics, except in cases where monitoring wells are located within 50 m of a river channel. In addition, this study was compared with a previous study on the same area concerning temperature variations in groundwater, which allowed for an understanding of both the qualitative and quantitative impacts of CC on the groundwater in the area. The combined analysis highlights the interplay between CC and anthropogenic influences, emphasising the need for integrated groundwater management strategies that account for both climate variability and land use dynamics. Furthermore, the seasonal analysis of GWL revealed a clear hydrological cycle shaped by irrigation activity. In particular, the occurrence of GWL peaks during summer (irrigation season) confirms the role of irrigation in controlling aquifer behaviour in agricultural areas. The absence of a general correlation with river stage, combined with the occurrence of GWL peaks during summer (irrigation season), confirms that irrigation is the main driver of GWL fluctuations over the study period. This finding is critical for the accurate interpretation of groundwater responses and for developing effective and sustainable water management strategies in intensively cultivated regions.

1. Introduction

Climate change (CC) is a global phenomenon that exerts substantial influence on environmental components, including groundwater (GW) resources [1,2,3]. As a key component of the hydrological cycle, GW is highly sensitive to shifts in precipitation (P) patterns, temperature regimes, evapotranspiration rates, and land use changes [4,5,6]. These climate-induced variations affect recharge rates, storage capacity, and discharge processes, often leading to fluctuations in GW levels (GWLs) [7,8,9,10,11,12,13,14,15,16,17].
In particular, altered P patterns—characterised by changes in intensity, frequency, and spatial distribution—can either enhance or reduce GW recharge, while rising air temperatures typically increase evapotranspiration, exacerbating water stress [1,2,5]. Additionally, the anthropogenic footprint, especially through irrigation, urbanisation, and deforestation, further modifies GW recharge dynamics and amplifies vulnerability to climate extremes [1,18,19,20,21,22]. Understanding these complex interactions is essential for sustainable GW management, particularly in light of growing water demands and increasing climate variability. Developing integrated adaptation strategies that consider both natural and human factors is critical for ensuring long-term groundwater resilience and water security [23,24,25,26].
However, despite evidence of the direct impact of CC on GWLs, it is only rarely possible to have up-to-date studies at a regional level that provide an overview of the quantitative status of GW resources. This is particularly true for the Piedmont Po Plain, where a detailed understanding of GWLs responses to both climatic and anthropogenic pressures is crucial for effective water resource management.
This study aims to focus on the current quantitative state of GW in the Piedmont Po Plain (NW-Italy) to provide a comprehensive analysis of the impacts of CC and human drivers on GWLs in the period between 2010 and 2022. Such analysis is crucial given the known global critical role GW plays in sustaining agricultural, industrial, and domestic demands within this densely populated and economically significant region [27,28,29,30,31].
The Piedmont Po Plain, renowned for its diverse geological and hydrogeological characteristics, plays a pivotal role in sustaining agriculture, and GW represents the main water resource, for agricultural uses, industrial purposes and for drinking water supply [32,33]. For this reason, in the recent past, there has been a focus on studying the quantitative aspects of the resource by analysing GWL [16,32,34,35], often with a particular focus on recharge mechanisms [36,37].
The intensification of extreme weather events, such as more frequent and severe droughts in the Piedmont Region, underscores the vulnerability of the Po Plain to CC [38]. Furthermore, increased water demand for irrigation, coupled with altered precipitation regimes, has led to a significant increase in GW abstraction, further stressing these vital reserves [39,40,41,42]. This situation was particularly evident during the severe drought events documented in 2017 and 2022, which strongly affected northern Italy [38,40,42]. In this context, the present study also contributes to understanding the quantitative response of shallow aquifers to such extreme periods, providing insights into the resilience and vulnerability of GW resources under prolonged climatic stress.
Consequently, the objective of this paper is to observe how the quantitative status of GW in the Piedmont Po Plain has changed from 2010 to 2022 in relation to extreme events caused by CC [43]. More specifically, this study aims to analyse the decadal variations in GWL across 15 monitoring wells uniformly distributed throughout the Piedmont Po Plain. Secondarily, an analysis of GW variation due to other human drivers (irrigation and land use) was also conducted in order to complete the overall picture and obtain greater clarity regarding groundwater dynamics. This comprehensive spatiotemporal assessment will integrate high-resolution climate data with detailed land use information to identify the primary drivers of GWL fluctuations in this critical region. This integrated approach will allow for an understanding of how climatic variability, rivers and direct human interventions collectively shape the region’s hydrogeological response, providing critical insights for future water resource planning and climate adaptation strategies. Such an exhaustive analysis is paramount for developing robust policies that ensure the long-term sustainability of GW resources in the face of ongoing environmental transformations and escalating anthropogenic pressures.

2. Study Area

The study area is the Piedmont Po Plain in northwest Italy, which hosts a critical and extensive GW resource for the Piedmont Region. The Piedmont Po plain represents the westernmost part of the larger Po Plain, one of Europe’s most significant lowland areas. Covering approximately 27% of Piedmont’s territory [32], this vast plain is crossed by rivers and characterised by fertile alluvial soils deposited by the Po River and its tributaries over millennia. The plain is a crucial agricultural and economic hub, supporting the cultivation of crops such as rice, corn, and fruit [34].

2.1. Climatic Setting

The climatic setting of the Piedmont Po Plain is shaped by the interaction of continental, Mediterranean, and Atlantic influences, resulting in a temperate climate with well-defined seasonal variability. Historical meteorological data (1958–2009) indicate a mean annual air temperature (AT) of approximately 12.5 °C in lowland areas, with average summer and winter temperatures of 22 °C and 3.3 °C, respectively [44].
AT varies seasonally and spatially, typically ranging from around 0 °C (in winter) to 25 °C (in summer). Since the mid-1980s, a more pronounced rise in average temperature has been observed, particularly during the winter, spring, and summer months [37] (Figure 1). P patterns also reflect this climatic complexity [38,45]. Annual P between 2010 and 2022 ranged from approximately 400 to 1400 mm, with higher values generally recorded in the western and northern sectors of the plain due to orographic effects [44]. On average, annual P from 2002 to 2017 exceeded 900 mm, exhibiting a bimodal distribution typical of a continental (prealpine or subalpine) climate, with two maxima in spring (March–April) and autumn (September–October), and two minima in winter (January) and summer (June) [44].
To better illustrate recent trends in AT and P within the study area, Figure 2 reports the annual average values recorded at the Torino–Giardini Reali meteorological station [46], located in the provincial capital of the study region. The graph shows a clear increasing trend in AT and a decreasing trend in P between 2010 and 2022. Notably, 2017 and 2022 stand out for remarkably low P (in 2017 around 500 mm/y and in 2022 around 300 mm/y), representing a local extreme that may have significantly affected surface and GW dynamics [44]. These deviations confirm the increasing frequency of hydro–climatic extremes.
More broadly, recent decades have shown clear evidence of CC, which is altering regional climatic regimes [44]. These shifts include increasing AT, a higher frequency of extreme events, such as heatwaves, and significant changes in P patterns [37,38,47]. These factors, in turn, are impacting the hydrological cycle, particularly groundwater recharge and availability [8,16,47,48].
The effects of CC are particularly evident in recent years. Notably, the year 2022 was recorded as the hottest and driest in the past 65 years, with the highest temperature anomaly and the most pronounced P deficit in the entire historical series [38,49].

2.2. Hydrogeological Setting

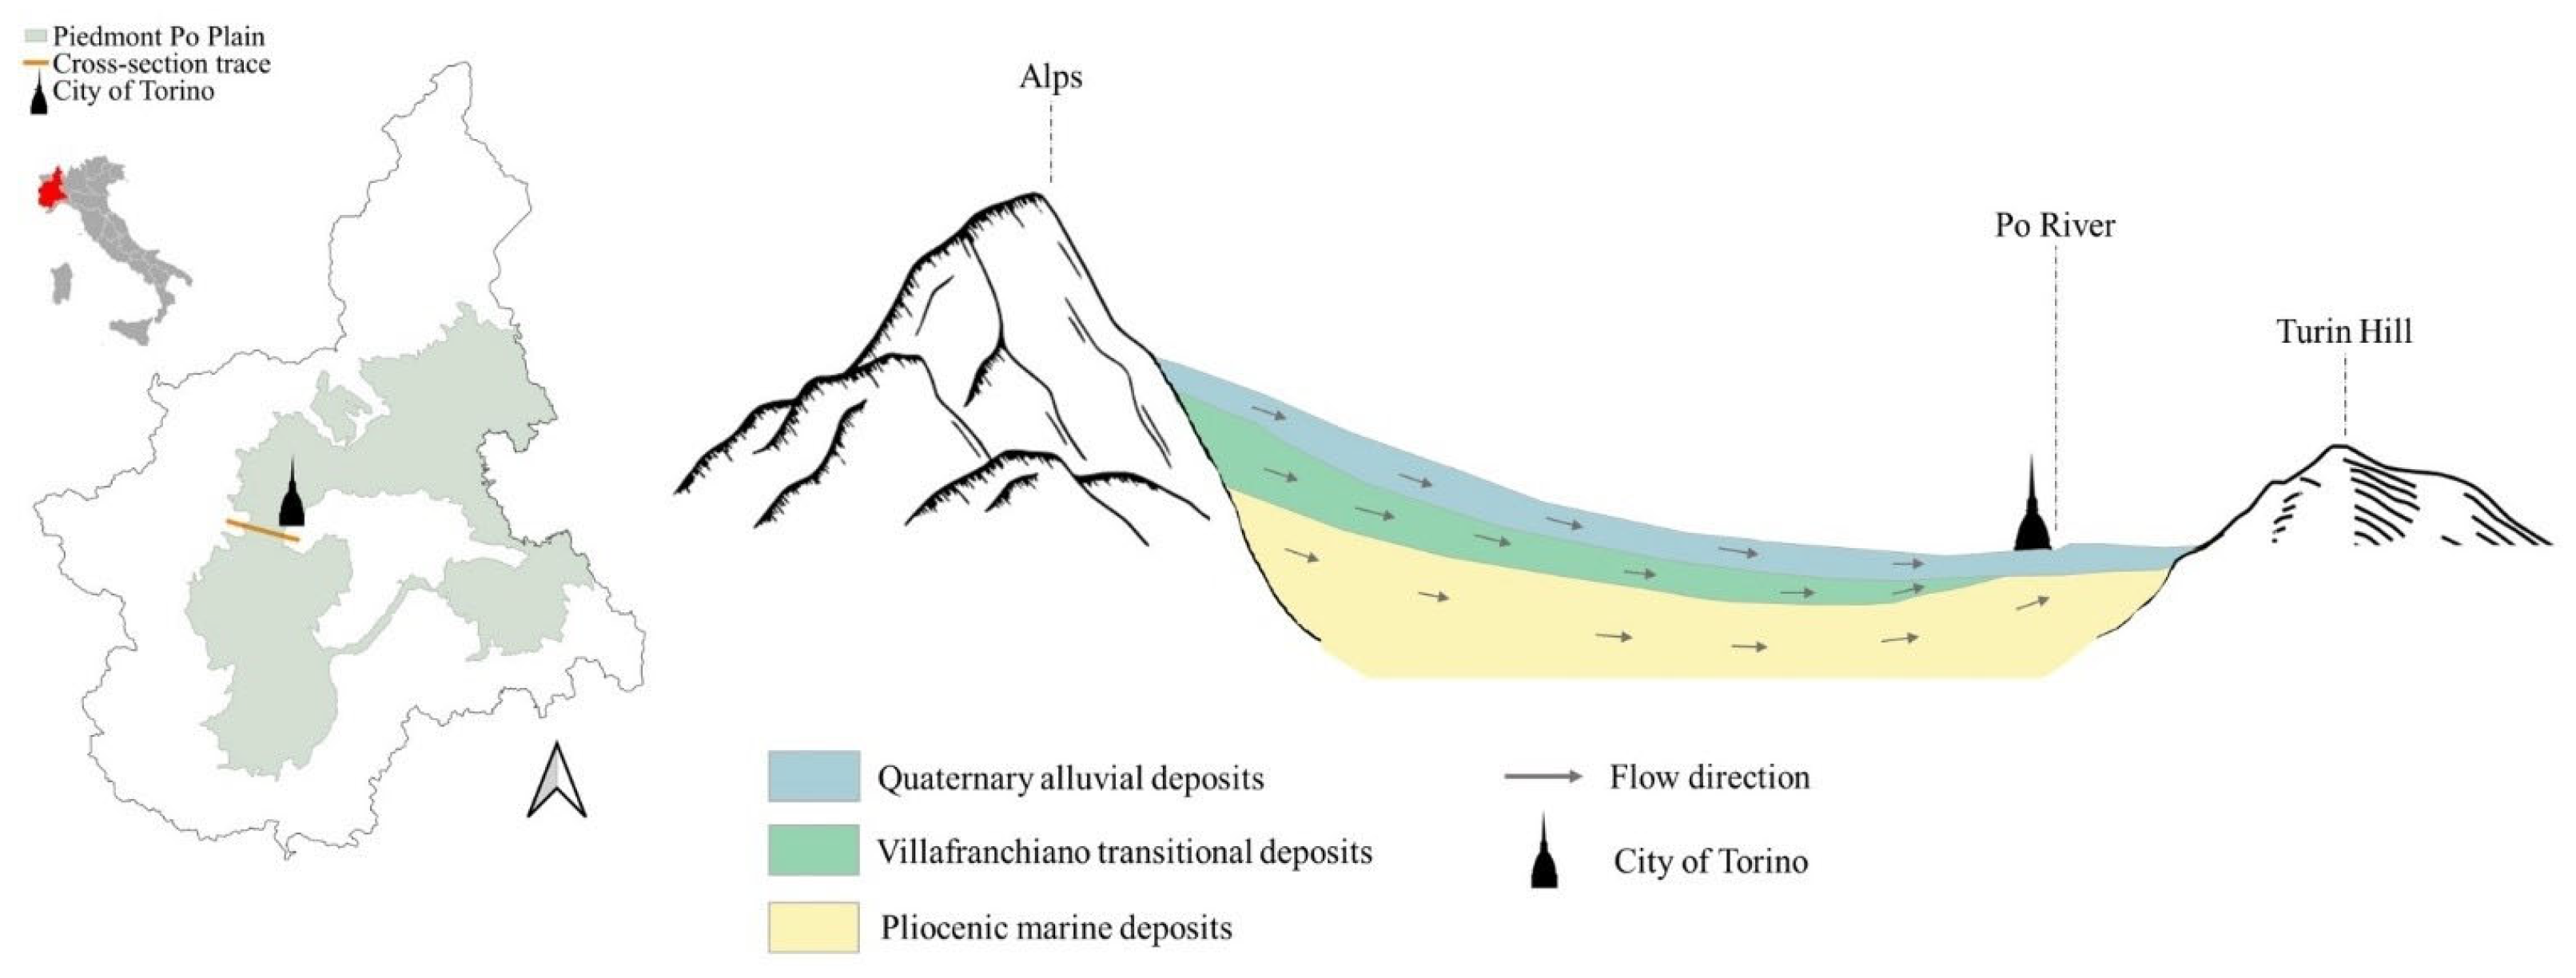
From a hydrogeological point of view, from top to bottom, the Piedmont Po plain consists of the following (Figure 3) [32,50]:
-
Quaternary alluvial deposits (lower Pleistocene–Holocene), that host a shallow unconfined aquifer. Formed by fluvial deposits due to the erosion and sedimentation processes of rivers, including the Po and its tributaries, and by fluvioglacial deposits, this complex consists mainly of gravel and sand. Alluvial deposits are prevalent in the low-lying areas of the plain and contribute to its fertile soils;
-
Villafranchiano transitional deposits (late Pliocen–early Pleistocene), which host a multi-layered aquifer. They are predominantly lacustrine, swamp and fluvial sediments and consist of both permeable deposits (pebble, gravel, sand) and low-permeability deposits (silt and clay);
-
Pliocenic marine deposits (Pliocene), hosting a confined aquifer. Predominantly found in the southern and western margins of the plain, marine deposits originate from ancient seas that once covered the area. These deposits comprise layers of sand, silt, and clay, reflecting past marine environments. Marine deposits may contain valuable fossil records.
For its features and its size, the Piedmont Po plain is considered the most important GW reservoir of the Piedmont region [32,52].
The analyses in this study were conducted through the observation of the shallow unconfined aquifer, hosted in the Quaternary alluvial deposits. This aquifer consists of coarse gravels and sands of fluvial or fluvioglacial origin, with minor intercalations of silty clay deposits, and a thickness between 20 and 50 m [53]. At the base of the shallow aquifer, locally thick and continuous layers of silt or clay-rich deposits are present, which represent the separation between the shallow aquifer and the deep aquifers [54].
The decision to study the shallow aquifer in detail is twofold. The first is linked to the susceptibility of this aquifer to CC since, being the most superficial, it is the most exposed to the climatic variations. The second motivation is linked to the quantity of data relating to this aquifer from the main regional agencies (Arpa Piemonte and Regione Piemonte) and the ease with which it is possible to carry out measurements.

3. Materials and Methods

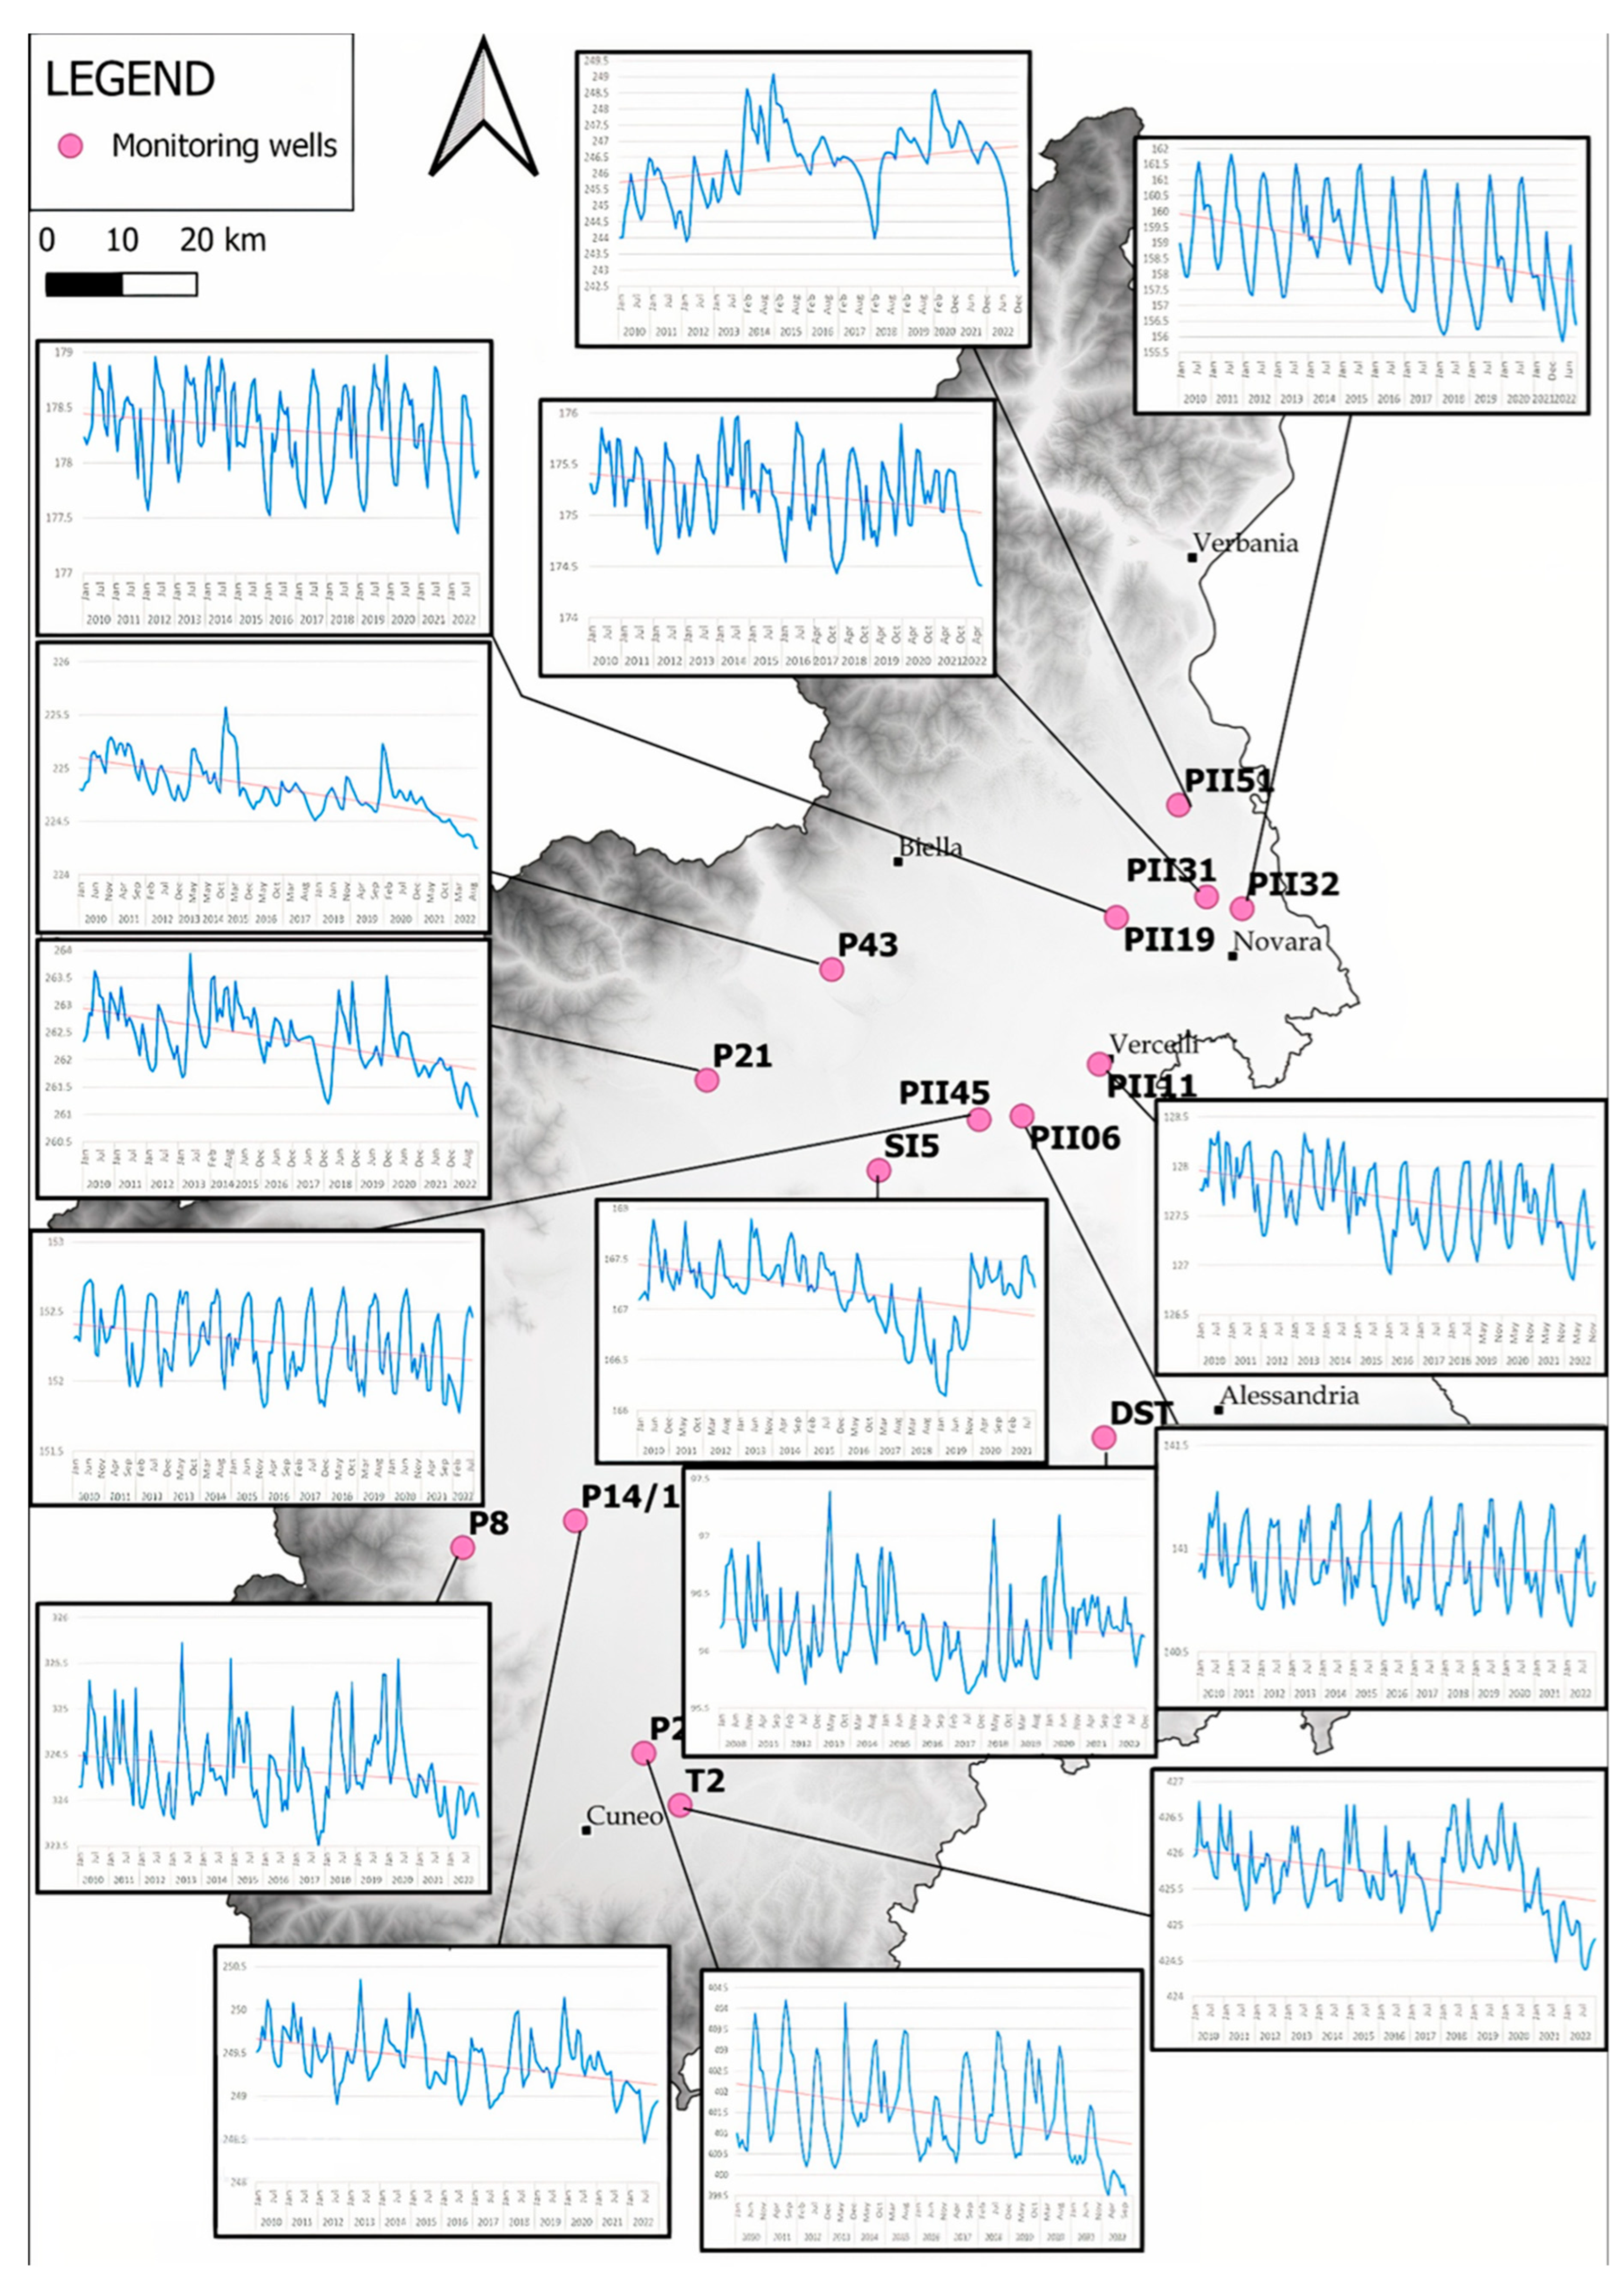
Fifteen monitoring wells (all capturing the shallow aquifer) were selected across the Piedmont Po Plain to better investigate variations in the phreatic GWL throughout the study area (Figure 4).
The selection of these wells was based on the availability of accurate and continuous GWL data over the entire period of analysis, but also because these same monitoring points were previously used to assess groundwater temperature (GWT) variations for the same time interval, as reported in [51]. All selected wells are part of the regional monitoring network and were chosen to ensure a spatially uniform coverage of the study area. GWL data are freely available and consist of two automatic measurements per day, recorded at 00:00 and 12:00 [55]. For all analyses, these raw data were first averaged daily and subsequently aggregated to monthly means; the resulting monthly average values were then used for statistical analyses.
Each well in the study area is instrumented with an OTT Orpheus Mini (OTT Hydromet GmbH, Loveland, CO, USA), an integrated pressure sensor and datalogger for level measurement in GW.
The Mann–Kendall test and the Thei–Sen estimator were selected and applied as the primary methods for trend analysis in line with the most commonly adopted approaches in the scientific literature for this type of study [56,57,58].
Before doing a statistical analysis, a completeness index (CI) analysis [59] was carried out for each monitor point, according to the following equation:
C I = n u m b e r   o f   a v a i l a b l e   G W L   d a t a m a x i m u m   n u m b e r   o f   d a t a   i n   t h e   c o n s i d e r e d   i n t e r v a l × 100
GWL variations were analysed using the Mann–Kendall trend test method [60,61] with the PAST programme [62]. With this programme, a trend non-parametric test is employed, requiring a single column of data. Missing values are excluded, and the number of observations in the dataset (‘n’) is adjusted accordingly, following Gilbert’s procedure [63]. The data considered, denoted as x1, x2,…, xn, represent, in this specific case, the sequence of GWL measurements ordered in time.
An indicator function is defined as follows:
s g n   X =   1   i f   X > 0 0   i f   X = 0 1   i f   X < 1
where X corresponds to the difference between two data values (xj − xi).
The Mann–Kendall S statistic is computed by summing over all pairs of values as follows:
S =   i = 1 n 1   j = i + 1 n   s g n   X j   X i
A negative S indicates a decreasing trend, S = 0 indicates no trend, and a positive S indicates an increasing trend.
For small samples (n ≤ 0), the p-value is derived from an exact values table [63]; for larger samples (n > 10), a normal approximation is applied.
When identical values occur in the dataset, they form tied groups. Each tied group j contains tj identical values, and the total number of these groups is denoted as g. These tied values must be accounted for in the variance of S. Then, the standard deviation (SD) of S is estimated using the following formula:
S D = 1 18 [ n n 1 2 n + 5 j = i g t j ( t j 1 ) ( 2 t j + 5 ) ]
Next, the Z statistic is computed using the following formula:
Z = S 1 S D s g n   S
This Z statistic is utilised to determine the p-value from the cumulative normal distribution with the customary continuity correction of subtracting 1.
Once the Mann–Kendall test confirmed the presence or absence of a statistically significant monotonic trend, the Theil–Sen estimator [64,65] was applied to quantify its magnitude. The Theil–Sen method estimates the median slope of the trend, which is less sensitive to outliers than parametric approaches. This method makes it possible to quantify the total change in the parameter analysed (in this study GWL and AT), providing a reliable estimate of the trend.
The slope is calculated as the median of the slopes determined by all possible pairs of points (Xi, Yi) and (Xj, Yj) in the time series, where j > i. The slope for each pair is defined by the following formula:
S l o p e i j = Y j Y i X j X i ,   f o r   j > i
Once the slopes for all pairs have been calculated, the Theil–Sen estimator is given by the median of these slopes as follows:
S l o p e   T h e i l S e n = M e d i a n Y j Y i X j X i
This median provides a robust estimate of the overall rate of change of the variable over time, reducing the influence of outliers that could distort results in parametric methods.
The final result of the estimator can be interpreted directly as the average change per unit time of the variable under consideration. Positive values of the slope indicate an increase over time, while negative values indicate a decrease.
To better understand the dynamics behind the observed variations in GWL, P and river water levels data were also analysed across the study area. Three representative meteorological stations and three representative river stations, chosen from the regional monitoring network [46], were selected based on their geographic coverage and data availability, as shown in Figure 4. Daily P and water level data from these stations were aggregated into monthly averages, with P data also aggregated into annual averages. As with GWL, the monthly mean values were then used to perform a visual assessment of temporal trends.

4. Results

With regard to the completeness index CI, all points had a good level of completeness (≥89%), as shown in Table 1. The CI confirmed that all 15 monitoring points had a sufficiently robust dataset for trend analysis, which allowed the analysis to continue on all points using the methods described above.
The results of the Mann–Kendall trend test identified a statistically significant negative trend in GWL in 13 out of the 15 wells examined (Table 2), indicating a consistent and widespread decline across the study area over the period 2010–2022.
Only two points deviate from the general statistically significant negative trend:
-
DST does not show a statistically significant trend;
-
PII51 shows a positive statistical trend.
Subsequently, for the 14 points showing a statistically significant trend (positive or negative), it was possible to calculate the Theil–Sen estimator, the results of which are shown in Table 3. The results show an average lowering of GWL of −4.32 cm/year, with a maximum decline of −16.74 cm/year recorded at well PII32.
As regards the average monthly GWL trends, the results are reported in full for all points in Figure 5 and graphically illustrate what has already been confirmed by the static test results, showing a general decrease in GWL throughout the entire area.
Figure 6 shows both clear seasonal oscillations and long-term variations. Most wells show a regular intra-annual cycle, with higher GWL typically occurring in summer and lower levels during winter. Regarding what concerns interannual dynamics, it is possible to observe that throughout the study period, a general tendency toward declining GWL can be seen in the majority of wells, particularly from around 2015 onward. The downward trend becomes especially evident during the drought years of 2017 and 2022, which correspond to the lowest GWL values recorded in many wells, such as PII32, P14/1, and P21. Moreover, as already stated by the statistical analysis, well PII51 stands out from the regional pattern by displaying a steadily increasing GWL throughout the entire period.
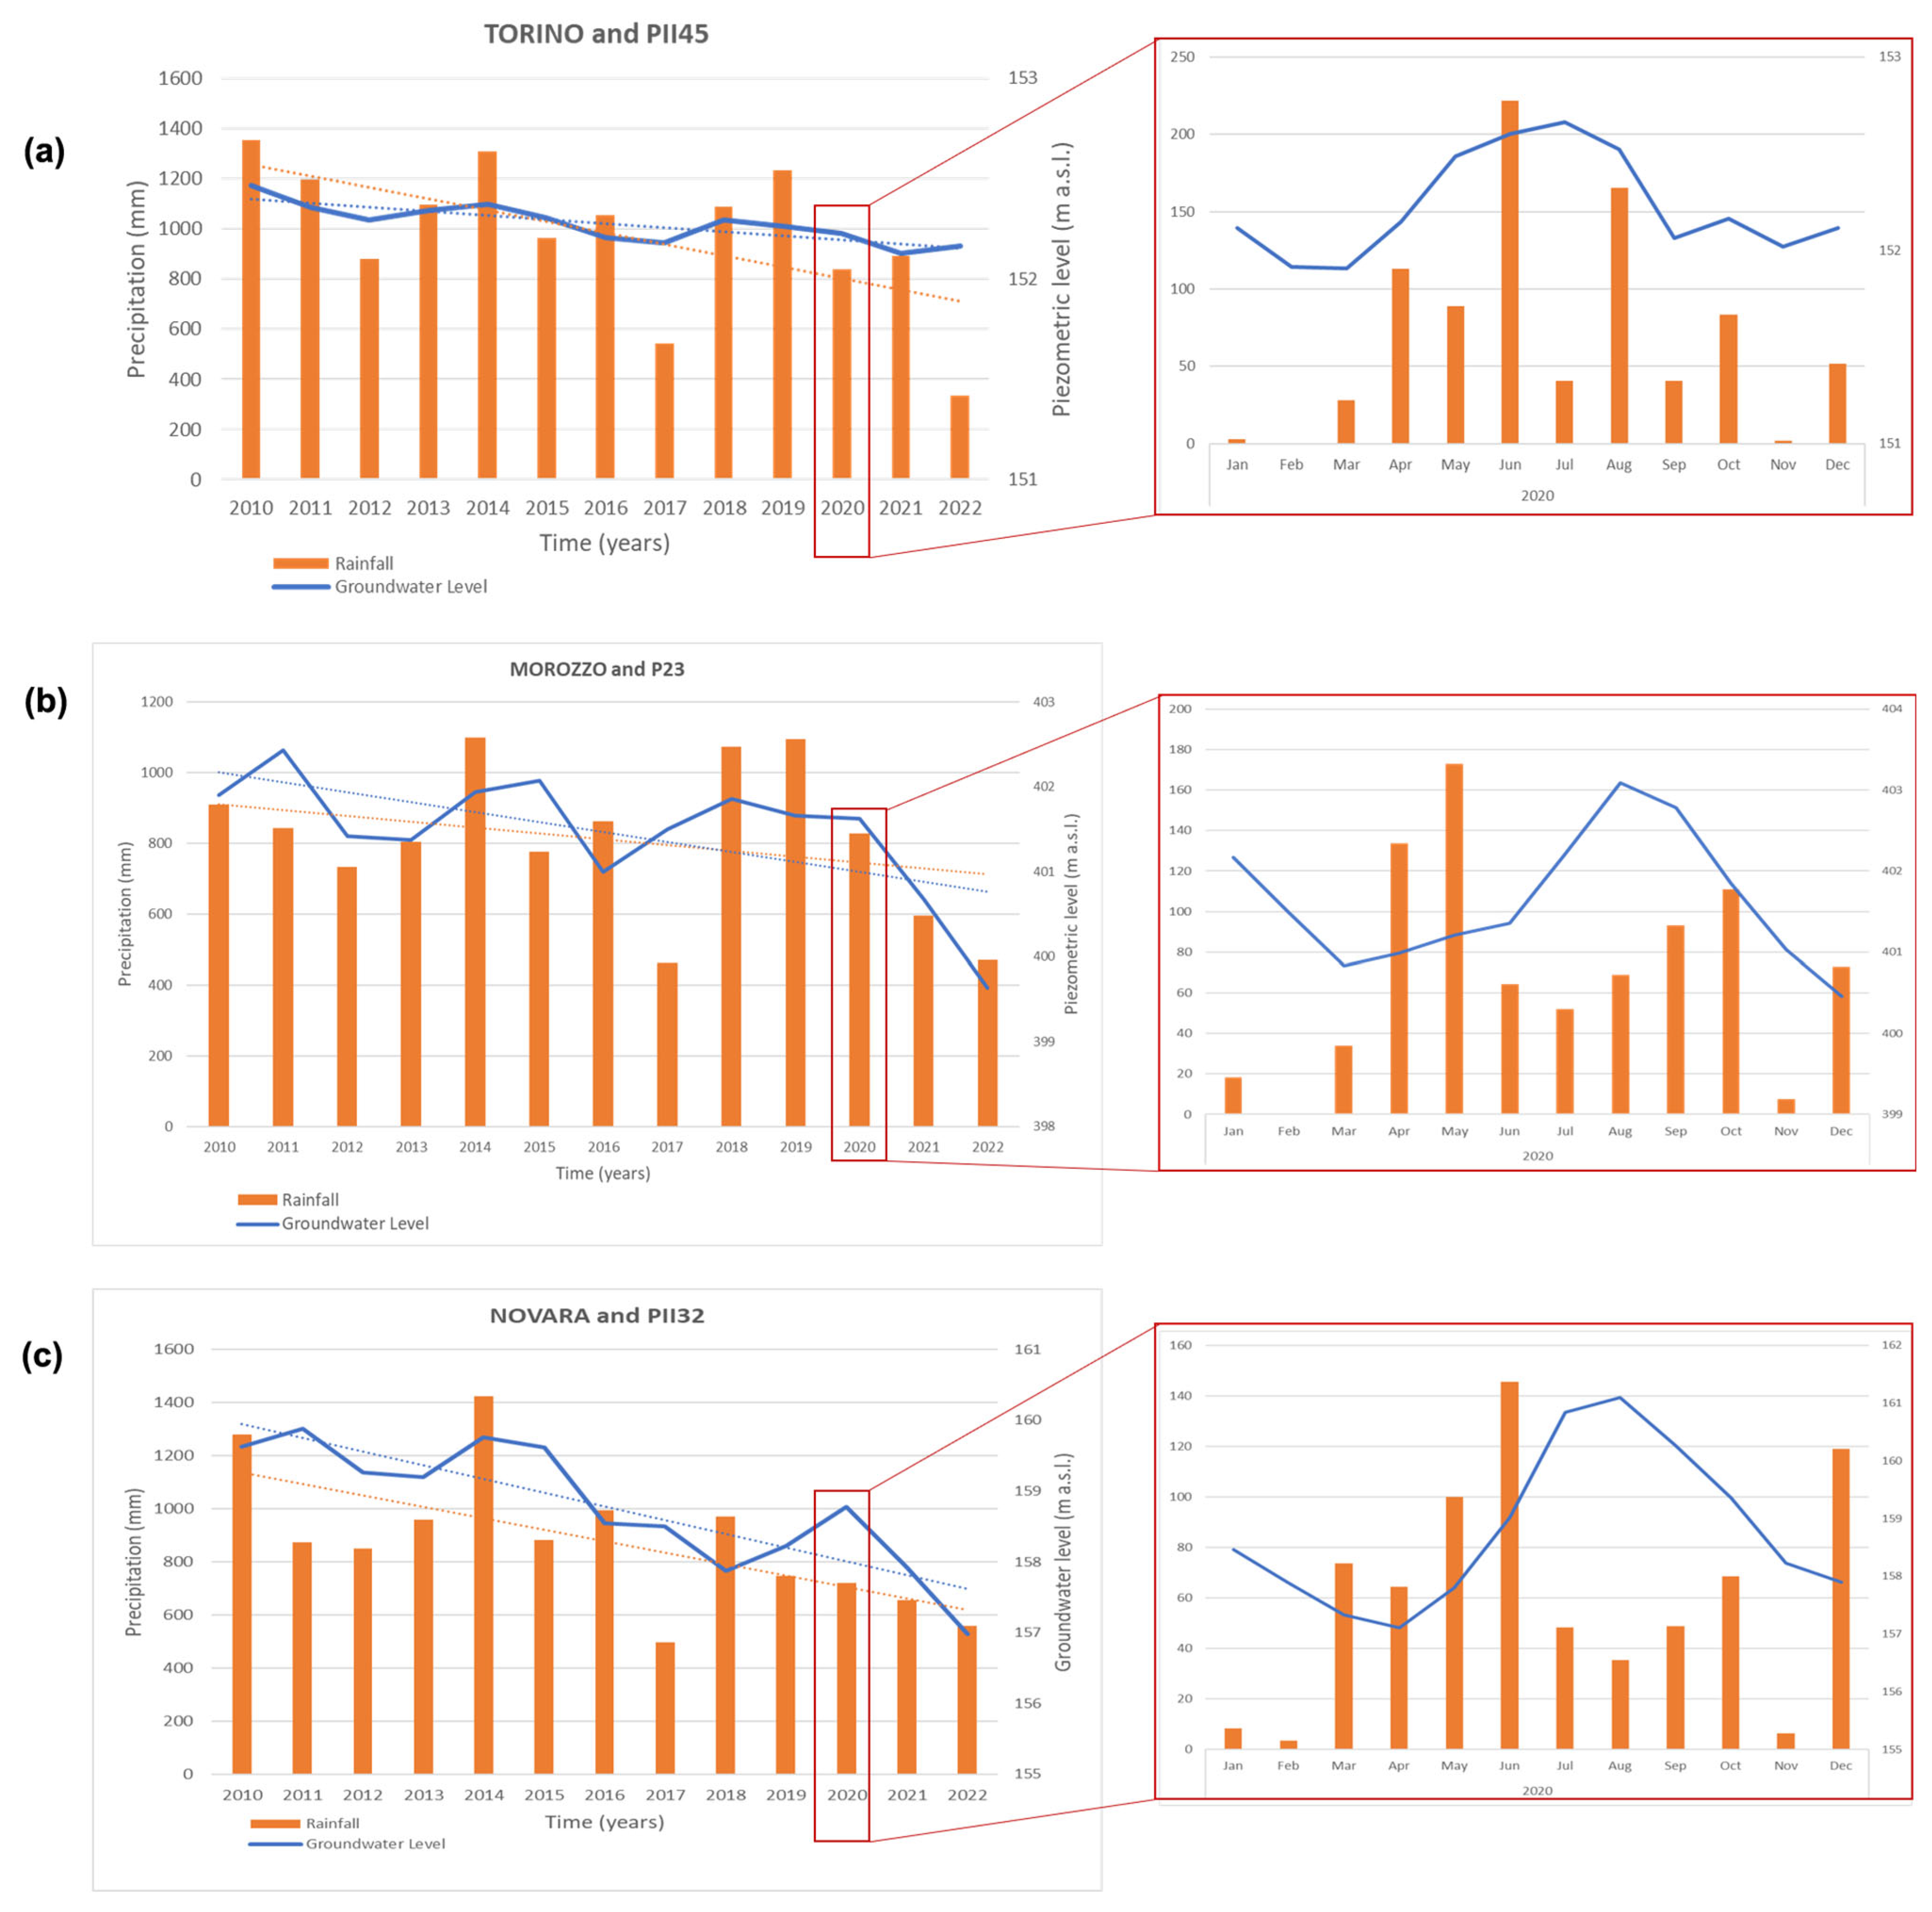
Figure 7 presents a direct comparison between monthly P and GWL for wells PII45 (with Torino weather station), P23 (with Morozzo weather station), and PII32 (with Novara weather station).
In all three cases, despite seasonal oscillations typical of temperate climates, a long-term decrease is evident in both P and GWL. The linear trendlines confirm a general reduction in monthly P totals, which aligns with the observed negative GWL trends detected in the area.
All three weather stations show a current peak of P is typically observed in the spring and autumn months, consistent with the bimodal precipitation regime typical of the Piedmont region [48,66]. Despite the persistence of this seasonal cycle, a general decrease is evident at all locations and appears gradual but consistent, particularly after 2015.
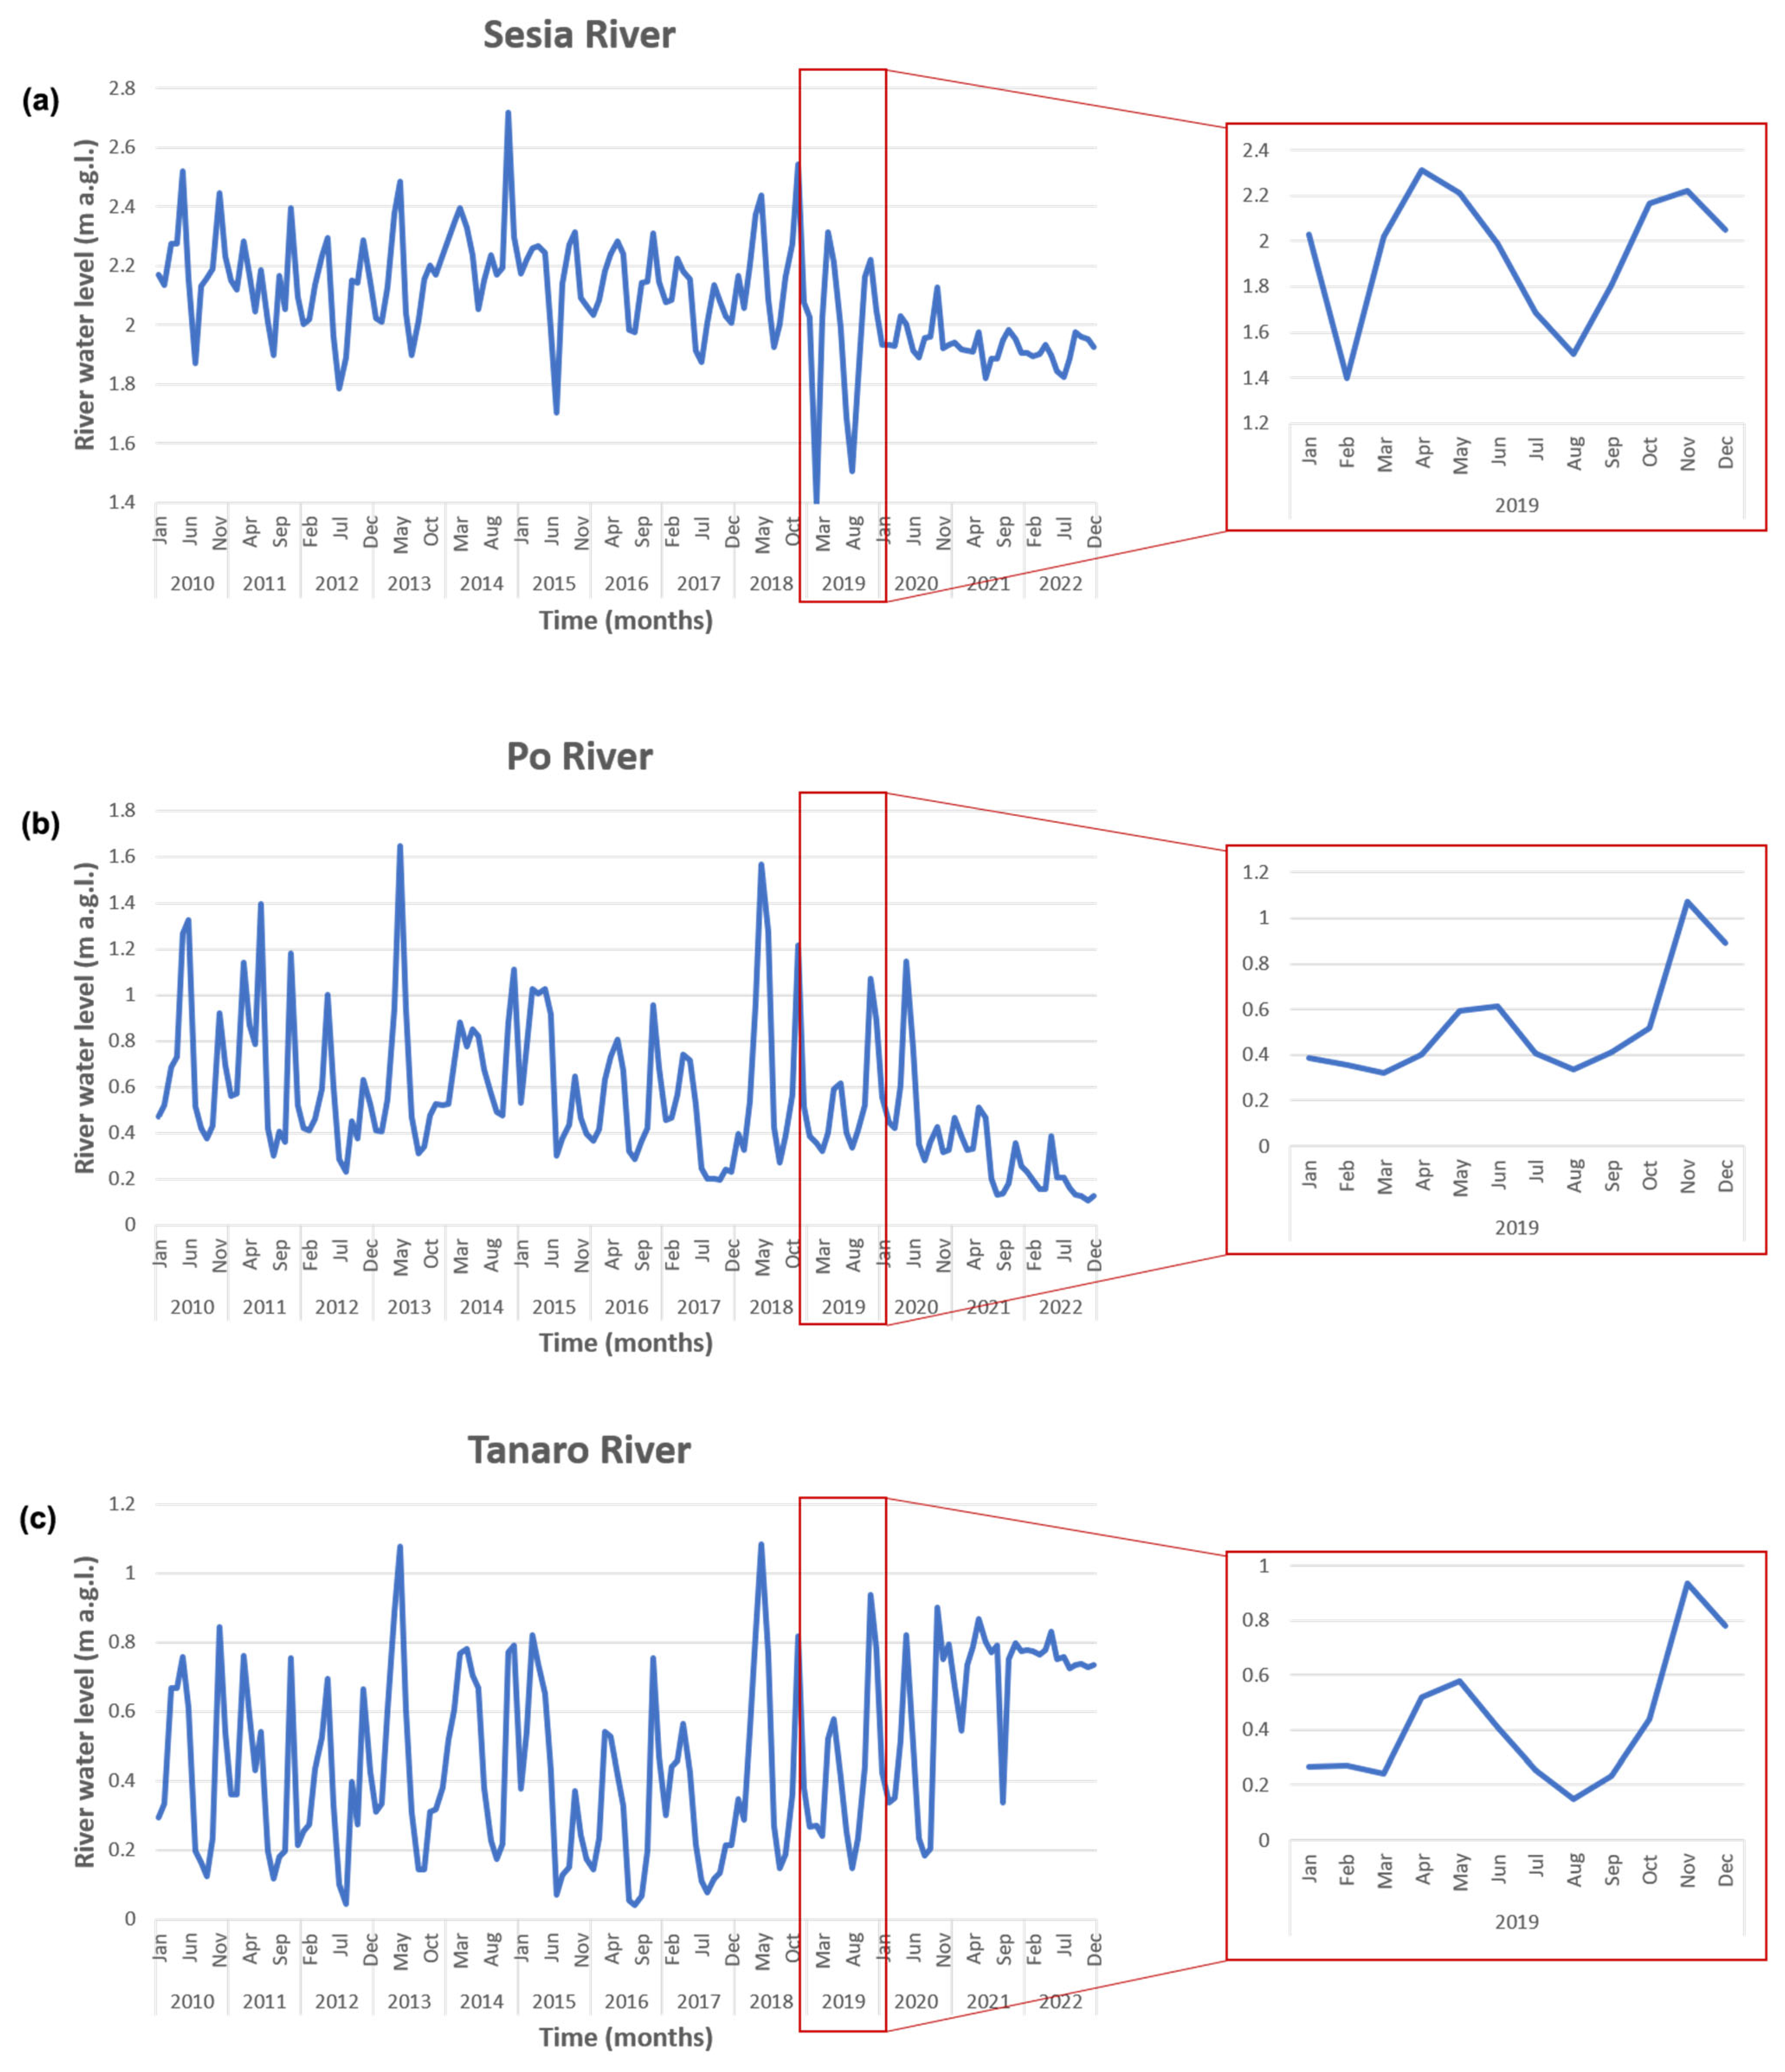
Regarding the analysis of the mean monthly river water level trends at the three selected monitoring stations (Figure 8), the results show a generally regular seasonal pattern across the Sesia, Po, and Tanaro rivers. Over the long-term series (2010–2022), the fluctuations appear consistent with natural hydrological cycles, characterised by higher river water levels in spring and autumn and lower values during summer. This seasonal behaviour, with a clear minimum in July–August, coincides with the peak of the irrigation period.

5. Discussion

The analysis of GWL time series from 15 monitoring wells across the Piedmont Po Plain during the period 2010–2022 reveals important insights into both seasonal and long-term GW dynamics. To better contextualise and interpret these results, land use data of the region were also considered, as reported in Figure 9.
The analysis of the monthly GWL trends (Figure 5 and Figure 6) confirms a coherent and repeated seasonal hydrological cycle across most of the study area. GWL typically reach their annual maxima in summer and their minima in winter. This behaviour clearly indicates the strong influence of irrigation practices on groundwater dynamics. In fact, as shown in Figure 4, the land use of the Piedmont Po plain is dominated by arable lands (shown in yellow in the figure), rice paddies (in orange/red, mostly in the northeastern part of the region), and a smaller portion of fruit trees in the western area (light orange). The dominant portion of arable lands, mainly cultivated with wheat and corn, is characterised by an irrigation period during the summer months, starting from May/June and lasting until July/August, whereas for rice cultivation, irrigation typically starts in May and finishes in August.
Under natural, non-irrigated conditions, GWLs in the Piedmont region would generally peak in spring (caused by snowmelt and seasonal rainfall) and have a minimum in summer/fall (dry season) [16,34]. However, in this study, the observed summer peak, often occurring in August, coincides with the agricultural irrigation season. This highlights how, in lowland agricultural areas, the hydrogeological cycle is heavily shaped by irrigation schedules rather than purely climatic or natural hydrological drivers. This is a crucial factor to consider for sustainable GW resource management, as it underscores the need to account for land use and irrigation practices when assessing aquifer behaviour. This interpretation is further supported by the seasonal analysis comparing P and GWL (see Figure 7), which clearly shows a temporal shift: the P peak occurs in spring, while the GWL peak is delayed to summer (usually August), indicating that the aquifer responds more strongly to irrigation inputs than to natural ones. To better understand the relationship between GWL and P, correlation plots were created using mean monthly data over the entire period (2010–2022) for the points already analysed in Figure 7 (Figure 10). These scatter plots did not show any evident correlation, with very low correlation values (R2 < 0.25). This confirms that GWL dynamics cannot be explained by precipitation alone, but are also influenced by other factors, such as irrigation practices.
Moreover, the analysis of river water levels in the study area (see Figure 8) highlights that the summer GWL maximum cannot be attributed to river–aquifer interactions, since river water levels show their annual minimum during the same period.
Beyond the seasonal variability, longer-term trends indicate a widespread and statistically significant decline in GWL across most of the study area (see Figure 5). The decreasing trend becomes especially evident from 2015 onward, with 2017 and 2022 standing out as years of particularly sharp decline, coinciding with documented drought events in northern Italy [38,49,69].
More specifically, for the study are, the statistical tests used showed that 13 of the 15 wells analysed show a statistically significant downward trend. The only two wells that deviate from this trend are the DST well and the PII51 well.
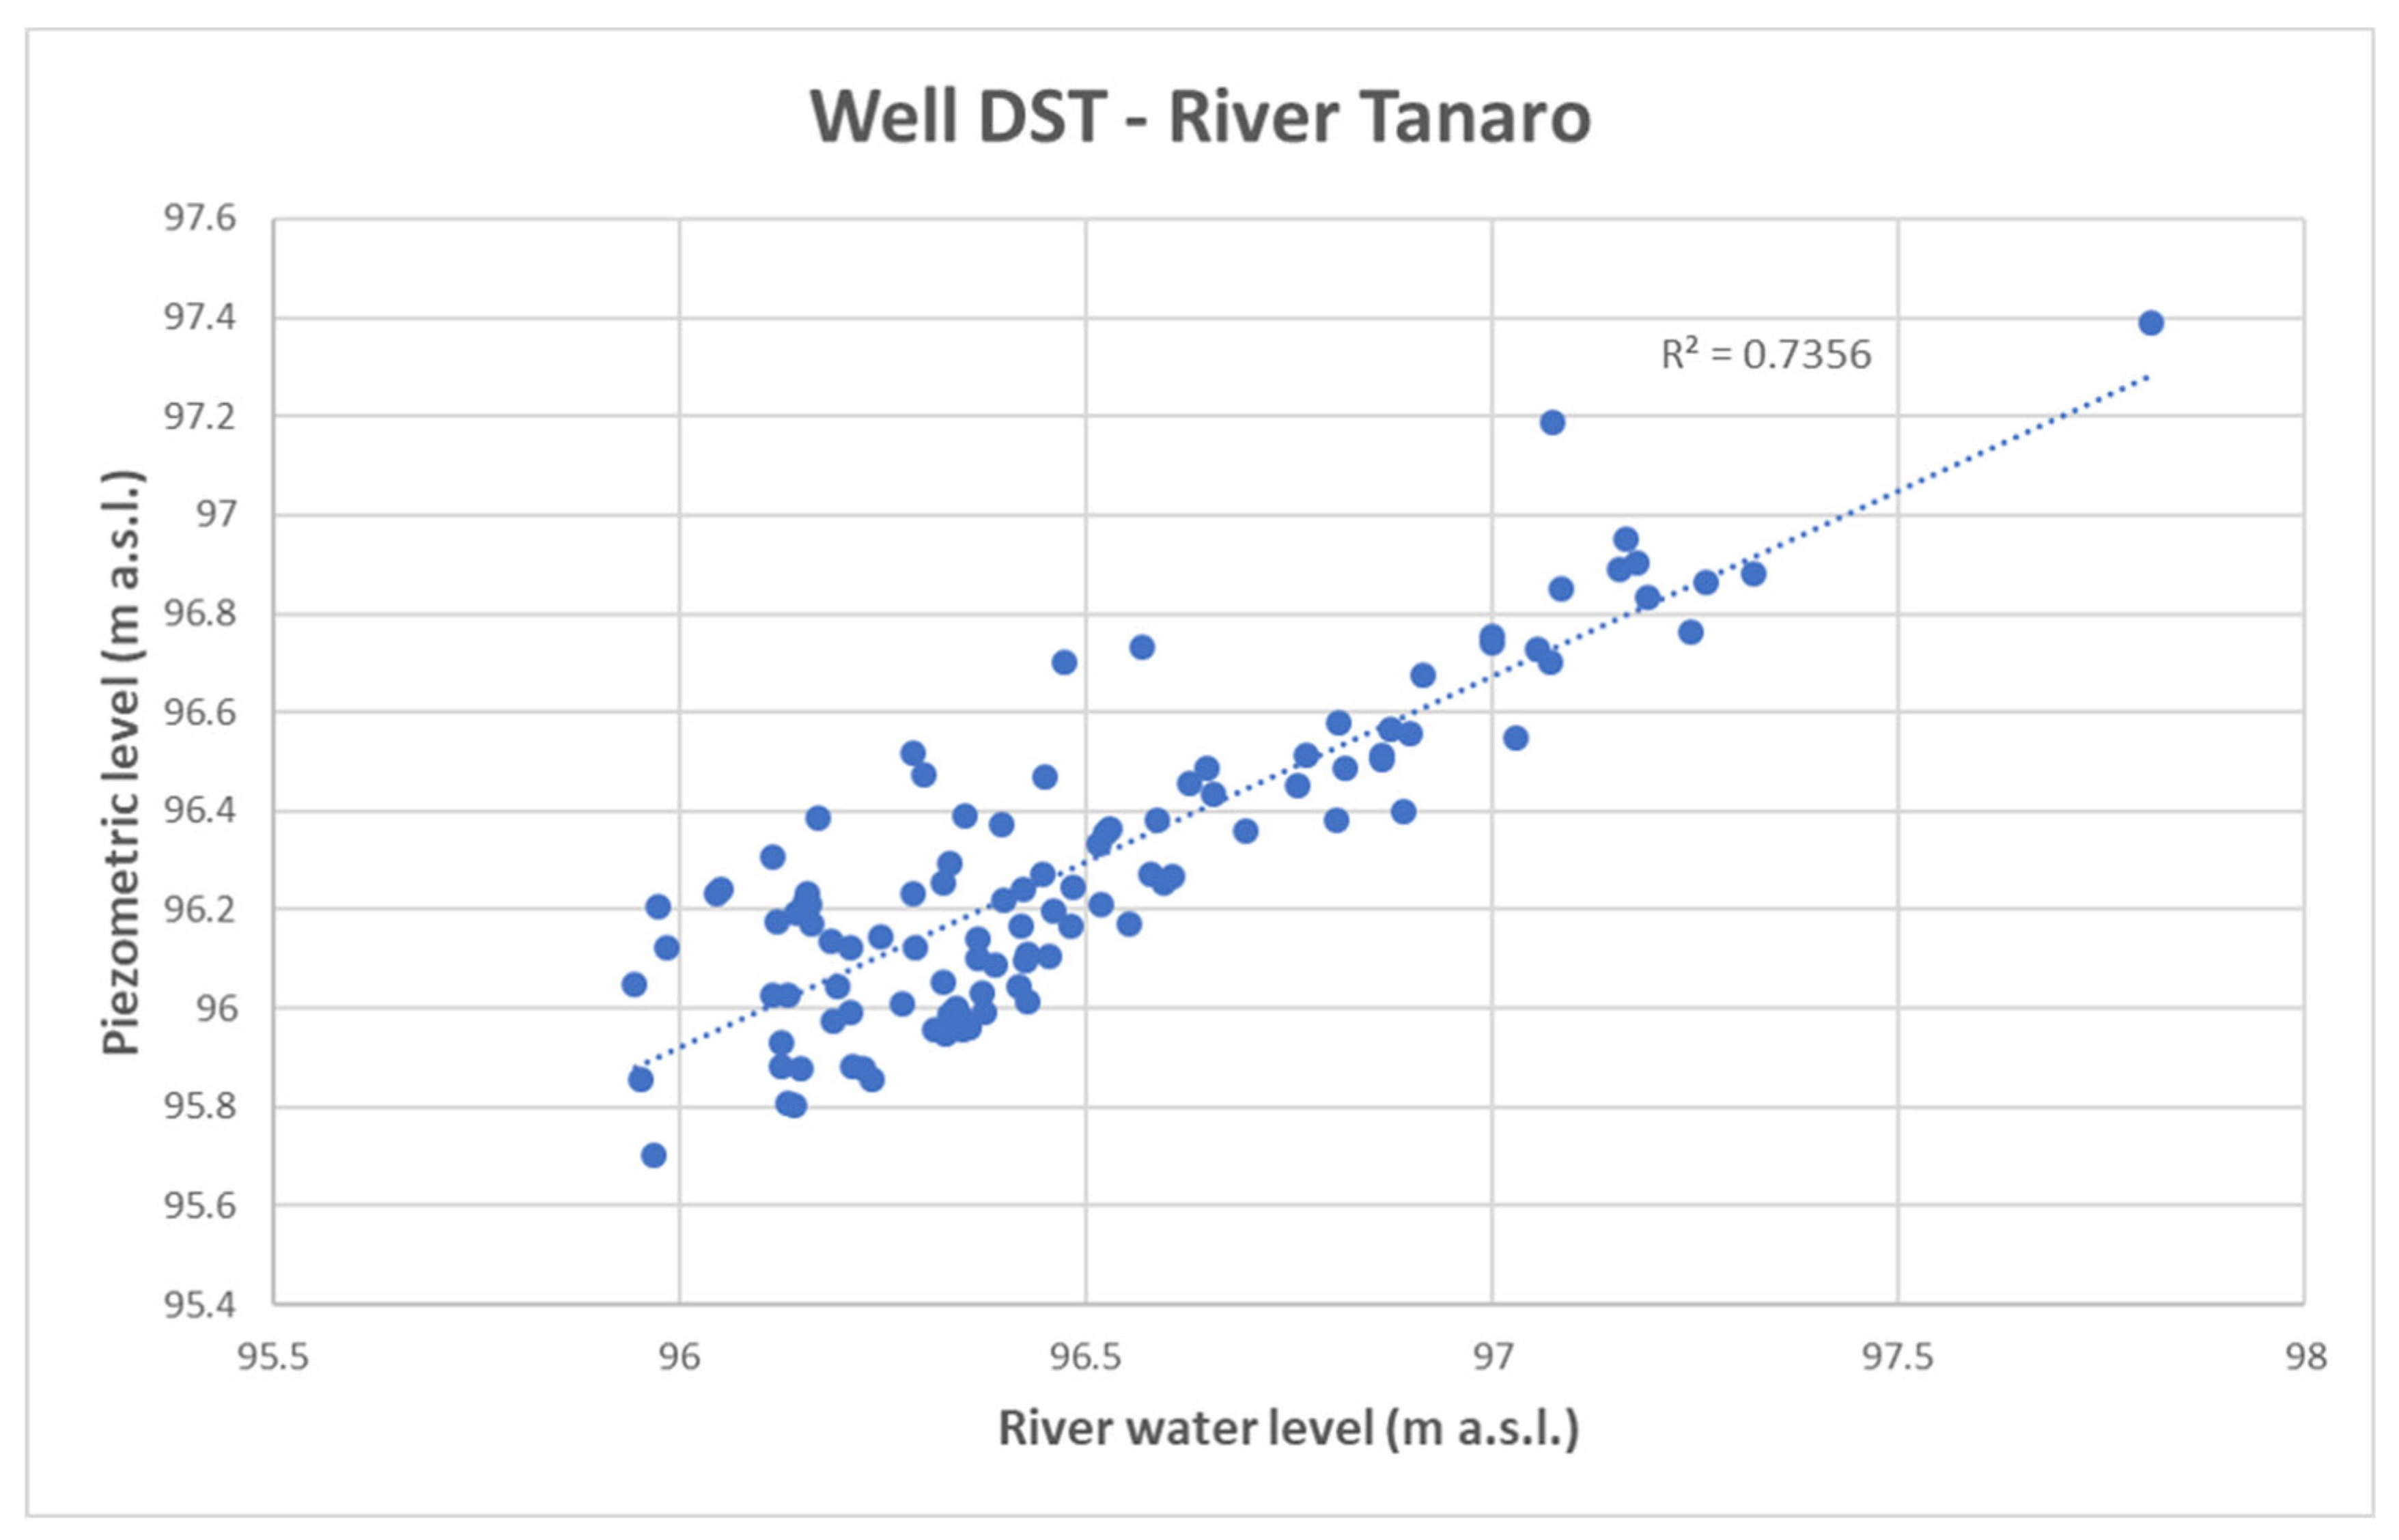
The DST well is located in Masio (in the province of Alessandria), approximately 40 metres from the Tanaro River, and is the only monitoring well that does not have a statistical trend. It also represents, in the study area, the only monitoring point located at a distance of less than 100 m from a river. Given its proximity to the river, to better understand the relationship between the DST well and the Tanaro River, a river monitoring station located in close proximity to the DST well was considered [70]. Monthly average hydrometric level data were used and compared with the monthly average piezometric level data from the DST well for the same time period (January 2010 to December 2022). The resulting scatter plot showed in Figure 11 highlights a R2 value of 0.74, indicating a good correlation between piezometric and hydrometric levels, and thus confirming the strong connection between the two parameters. The variability of DST levels is therefore explained by the dynamics of the Tanaro River, which masks or counterbalances possible long-term declining trends of the GWL in this monitoring well.
Well PII51, on the other hand, is the only monitored well showing a statistically significant upwards trend. This is a piezometer located in the province of Novara, which is known for rice fields (shown in Figure 9). This type of agriculture uses special irrigation techniques that are recognised in the literature [34] as being able to influence the hydrogeological regime even on a small scale. Although other monitoring wells in the same area display a statistically significant decreasing trend, this behaviour can be justified by different degrees of subsoil permeability. Although the northern sector is characterised by finer soils that typically require smaller irrigation volumes, the upwards trend at PII51 can be attributed to local water retention in fine-grained soils, which slows drainage and promotes accumulation, as well as possible contributions from nearby canals or small-scale irrigation practices [71]. According to studies conducted in the region, even such a relatively small area is characterised by different degrees of permeability, which strongly affect GW recharge. Moreover, rice cultivation practices can vary, ranging from dry seeding to continuous flooding and these different irrigation methods may influence GWLs even at such a local scale [72,73,74].
For what concern the correlation between GWL and P in time series, this is clearly evident revealing an almost parallel downward trends over the 2010–2022 period, especially during drought years (in particular 2022). The temporal coincidence between low GWL values and prolonged dry periods reinforces the hypothesis that reduced recharge due to altered P regimes is a major driver of groundwater decline in the region over the long term.
This is further supported by a comparison with GWT data from previous research, which used the same set of monitoring wells and time period [51]. While this study demonstrates a widespread reduction in GWL, the previous one on GWT revealed a concurrent GWT warming trend across the Piedmont Po Plain. These findings confirm that CC is exerting a dual impact on regional GW systems: quantitatively through declining GWL and qualitatively through rising GWT. Such changes have implications not only for water availability but also for aquifer thermal regimes, with potential effects on GW-dependent ecosystems. In fact, even small GWT increases of about 1–2 °C, if sustained over time and combined with reduced discharge, may also impact sensitive habitats, aquatic species, and biological processes [75,76,77].
Moreover, PII51 shows a rising trend in GWT stripes [51], consistent with the general warming observed at other monitoring points. This suggests that the local increase in GWL at PII51 is not climate-driven, but more likely influenced by land use practices (paddy fields) which highlights the distinct hydrological behavior of rice irrigation systems compared to other agricultural areas.
These results are consistent with what has been observed at the global scale, where GW systems are undergoing widespread declines, often accelerated in agricultural floodplains. Large-scale analyses involving more than 1600 aquifer systems about one-third of global aquifers show accelerating depletion trends, with declines often exceeding 0.5 m/year [56]. The strongest links are observed in intensively cultivated drylands, where irrigation accounts for around 70% of global GW withdrawals [78]. This highlights that the dynamics observed in the Piedmont Po Plain are not isolated, but form part of a broader global pattern linking irrigation practices, climatic stress, and GW depletion.
When placed in a global context, the Piedmont case mirrors conditions in other agricultural floodplains, such as the Indo-Gangetic Plain [79,80] and the North China Plain [81,82,83].
Conversely, there are also cases of partial recovery. For example, in the Bangkok Basin, groundwater levels rose after the introduction of pumping fees and well licensing [84]; in Iran’s Abbas-e Sharghi Basin, declines were reversed through surface water diversion from the Kharkeh Dam [85]; and in Arizona (USA), managed aquifer recharge (MAR) using Colorado River water helped stabilize GW storage [86]. These success stories in areas also similar to Piedmont Po plain underline that recovery is possible with a correct and sustainable management of water resources, though usually at slower rates than depletion.

6. Conclusions

This study provides a detailed analysis of GWL trends in the Piedmont Po Plain over the period 2010–2022, clarifying how shallow aquifers respond to the combined pressures of climate variability and human activities. The findings reveal a widespread and statistically significant decline in GWL across most monitoring points, with an average decrease of −4.32 cm/year, and peak declines reaching up to −16.74 cm/year. The coincidence between sharp declines and drought years, such as 2017 and 2022, highlights the system’s vulnerability to prolonged dry periods. A key contribution of this work is the integration of climatic variables, land use patterns, and river–aquifer interactions to interpret the observed trends.
The seasonal analysis reveals that irrigation practices, particularly in corn and rice cultivation areas, have reshaped the natural hydrological cycle, producing unusual summer groundwater maxima. This demonstrates how agricultural practices can locally override climatic drivers, creating heterogeneous responses even within short distances, as exemplified by the contrasting behaviour of wells PII51 and PII32.
Moreover, the correlation between drought years (such as 2017 and 2022) and accelerated GWL decline highlights the vulnerability of the aquifer system to drought periods. An exception to this general trend is well PII51, located within a rice cultivation area, which displayed a positive GWL trend likely driven by artificial recharge through traditional irrigation practices. This highlights the importance of considering land use and irrigation methods when interpreting aquifer dynamics.
By linking GWL dynamics with previous research on GWT in the same monitoring network [51], this study also reinforces the evidence of CC impacts on both the quantitative and thermal regimes of GW systems of the shallow aquifer of the Piedmont Po plain. This dual perspective underlines the importance of integrated approaches when assessing GW vulnerability.
Overall, the observed trends (seasonal, interannual, and spatial) underscore the complex interplay between climate variability and human activity in shaping GW dynamics in the Piedmont Po Plain. This paper underscores the urgent need for integrated GW management strategies that account for climatic variability, land use patterns, and water use efficiency. Future research should focus on refining the analysis of rainfall and temperature trends, as well as incorporating land use data and seasonal GW abstraction rates. In addition, future work should aim to expand monitoring networks to include deeper aquifers, such as the Villafranchiano multi-layered aquifer, for which new monitoring wells are currently being constructed. Furthermore, developing comprehensive and publicly accessible datasets on groundwater abstraction in the study area would greatly enhance the understanding of aquifer dynamics and support more effective management strategies. Such efforts are crucial to developing adaptive management policies capable of safeguarding GW resources under ongoing and future CC scenarios.

Author Contributions

Conceptualisation, E.E. and M.L.; methodology, E.E.; validation, D.A.D.L. and M.L.; data curation, D.C.; writing—original draft preparation, E.E. and M.L.; writing—review and editing, M.L.; visualisation, D.C. All authors have read and agreed to the published version of the manuscript.

Funding

This research received no external funding.

Data Availability Statement

The original data presented in the study relating to meteorological variables (precipitation and air temperatures) and piezometric levels are openly available at https://www.arpa.piemonte.it/ (accessed on 30 June 2025); data relating to land use are available at https://land.copernicus.eu/en/products/corine-land-cover (accessed on 30 June 2025).

Conflicts of Interest

The authors declare no conflicts of interest.

References

  1. Wu, W.-Y.; Lo, M.-H.; Wada, Y.; Famiglietti, J.S.; Reager, J.T.; Yeh, P.J.-F.; Ducharne, A.; Yang, Z.-L. Divergent Effects of Climate Change on Future Groundwater Availability in Key Mid-Latitude Aquifers. Nat. Commun. 2020, 11, 3710. [Google Scholar] [CrossRef] [PubMed]
  2. Mc, M. Climate Change Impacts on Groundwater: Literature Review. Environ. Risk Assess. Remediat. 2018, 2. [Google Scholar] [CrossRef]
  3. Lall, U.; Josset, L.; Russo, T. A Snapshot of the World’s Groundwater Challenges. Annu. Rev. Environ. Resour. 2020, 45, 171–194. [Google Scholar] [CrossRef]
  4. Wang, H.; Gao, J.; Li, X.; Wang, H.; Zhang, Y. Effects of Soil and Water Conservation Measures on Groundwater Levels and Recharge. Water 2014, 6, 3783–3806. [Google Scholar] [CrossRef]
  5. Earman, S.; Dettinger, M. Potential Impacts of Climate Change on Groundwater Resources—A Global Review. J. Water Clim. Change 2011, 2, 213–229. [Google Scholar] [CrossRef]
  6. Stigter, T.Y.; Miller, J.; Chen, J.; Re, V. Groundwater and Climate Change: Threats and Opportunities. Hydrogeol. J. 2023, 31, 7–10. [Google Scholar] [CrossRef]
  7. Holman, I.P. Climate Change Impacts on Groundwater Recharge-Uncertainty, Shortcomings, and the Way Forward? Hydrogeol. J. 2006, 14, 637–647. [Google Scholar] [CrossRef]
  8. Dragoni, W.; Sukhija, B.S. Climate Change and Groundwater: A Short Review. Geol. Soc. Lond. Spec. Publ. 2008, 288, 1–12. [Google Scholar] [CrossRef]
  9. Taylor, C.A.; Stefan, H.G. Shallow Groundwater Temperature Response to Climate Change and Urbanization. J. Hydrol. 2009, 375, 601–612. [Google Scholar] [CrossRef]
  10. Taniguchi, M.; Holman, I.P. Groundwater Response to Changing Climate; CRC Press: Boca Raton, FL, USA, 2010; p. 245. [Google Scholar]
  11. Apaydin, A. Response of Groundwater to Climate Variation: Fluctuations of Groundwater Level and Well Yields in the Halacli Aquifer (Cankiri, Turkey). Environ. Monit. Assess. 2010, 165, 653–663. [Google Scholar] [CrossRef]
  12. Green, T.R.; Taniguchi, M.; Kooi, H.; Gurdak, J.J.; Allen, D.M.; Hiscock, K.M.; Treidel, H.; Aureli, A. Beneath the Surface of Global Change: Impacts of Climate Change on Groundwater. J. Hydrol. 2011, 405, 532–560. [Google Scholar] [CrossRef]
  13. Taylor, R.G.; Scanlon, B.; Döll, P.; Rodell, M.; van Beek, R.; Wada, Y.; Longuevergne, L.; Leblanc, M.; Famiglietti, J.S.; Edmunds, M.; et al. Ground Water and Climate Change. Nat. Clim. Change 2013, 3, 322–329. [Google Scholar] [CrossRef]
  14. Smerdon, B.D. A Synopsis of Climate Change Effects on Groundwater Recharge. J. Hydrol. 2017, 555, 125–128. [Google Scholar] [CrossRef]
  15. Cui, Y.; Liao, Z.; Wei, Y.; Xu, X.; Song, Y.; Liu, H. The Response of Groundwater Level to Climate Change and Human Activities in Baotou City, China. Water 2020, 12, 1078. [Google Scholar] [CrossRef]
  16. Lasagna, M.; Mancini, S.; De Luca, D.A. Groundwater Hydrodynamic Behaviours Based on Water Table Levels to Identify Natural and Anthropic Controlling Factors in the Piedmont Plain (Italy). Sci. Total Environ. 2020, 716, 137051. [Google Scholar] [CrossRef]
  17. Górecki, K.; Rastogi, A.; Stróżecki, M.; Gąbka, M.; Lamentowicz, M.; Łuców, D.; Kayzer, D.; Juszczak, R. Water Table Depth, Experimental Warming, and Reduced Precipitation Impact on Litter Decomposition in a Temperate Sphagnum-Peatland. Sci. Total Environ. 2021, 771, 145452. [Google Scholar] [CrossRef]
  18. Hughes, A.; Mansour, M.; Ward, R.; Kieboom, N.; Allen, S.; Seccombe, D.; Charlton, M.; Prudhomme, C. The Impact of Climate Change on Groundwater Recharge: National-Scale Assessment for the British Mainland. J. Hydrol. 2021, 598, 126336. [Google Scholar] [CrossRef]
  19. Zhang, Y.; Li, H.; Reggiani, P. Climate Variability and Climate Change Impacts on Land Surface, Hydrological Processes and Water Management. Water 2019, 11, 1492. [Google Scholar] [CrossRef]
  20. Ngo, T.-M.-L.; Wang, S.-J.; Chen, P.-Y. Assessment of Future Climate Change Impacts on Groundwater Recharge Using Hydrological Modeling in the Choushui River Alluvial Fan, Taiwan. Water 2024, 16, 419. [Google Scholar] [CrossRef]
  21. Epting, J.; Michel, A.; Affolter, A.; Huggenberger, P. Climate Change Effects on Groundwater Recharge and Temperatures in Swiss Alluvial Aquifers. J. Hydrol. X 2021, 11, 100071. [Google Scholar] [CrossRef]
  22. Carlson, G.; Massari, C.; Rotiroti, M.; Bonomi, T.; Preziosi, E.; Wilder, A.; Whitaker, D.; Girotto, M. Intensive Irrigation Buffers Groundwater Declines in Key European Breadbasket. Nat. Water 2025, 3, 683–692. [Google Scholar] [CrossRef]
  23. Ahmed, T.; Zounemat-Kermani, M.; Scholz, M. Climate Change, Water Quality and Water-Related Challenges: A Review with Focus on Pakistan. Int. J. Environ. Res. Public Health 2020, 17, 8518. [Google Scholar] [CrossRef]
  24. Silwal, C.B.; Pathak, D.; Adhikari, D.; Adhikari, T.R. Climate Change and Its Possible Impact in Groundwater Resource of the Kankai River Basin, East Nepal Himalaya. Climate 2020, 8, 137. [Google Scholar] [CrossRef]
  25. Stewart, S.; Green, G. The Importance of Legislative Reform to Enable Adaptive Management of Water Resources in a Drying Climate. Water 2022, 14, 1404. [Google Scholar] [CrossRef]
  26. Mukherjee, A.; Jha, M.K.; Kim, K.-W.; Pacheco, F.A.L. Groundwater Resources: Challenges and Future Opportunities. Sci. Rep. 2024, 14, 28540. [Google Scholar] [CrossRef]
  27. Mourot, F.M.; Westerhoff, R.S.; White, P.A.; Cameron, S.G. Climate Change and New Zealand’s Groundwater Resources: A Methodology to Support Adaptation. J. Hydrol. Reg. Stud. 2022, 40, 101053. [Google Scholar] [CrossRef]
  28. Swain, S.; Taloor, A.K.; Dhal, L.; Sahoo, S.; Al-Ansari, N. Impact of Climate Change on Groundwater Hydrology: A Comprehensive Review and Current Status of the Indian Hydrogeology. Appl. Water Sci. 2022, 12, 120. [Google Scholar] [CrossRef]
  29. Altayyar, M.O.; Ali, S.; Larson, A.E.; Boving, T.; Thiem, L.; Akanda, A.S. Quantifying Groundwater Depletion in Arabian Peninsula Transboundary Aquifer Systems: Understanding Natural and Anthropogenic Drivers. Groundw. Sustain. Dev. 2024, 26, 101293. [Google Scholar] [CrossRef]
  30. Ouyang, Y.; Wan, Y.; Jin, W.; Leininger, T.D.; Feng, G.; Han, Y. Impact of Climate Change on Groundwater Resource in a Region with a Fast Depletion Rate: The Mississippi Embayment. J. Water Clim. Change 2021, 12, 2245–2255. [Google Scholar] [CrossRef] [PubMed]
  31. Zhou, W.; Hao, L. How Urban Expansion and Climatic Regimes Affect Groundwater Storage in China’s Major River Basins: A Comparative Analysis of the Humid Yangtze and Semi-Arid Yellow River Basins. Remote Sens. 2025, 17, 1292. [Google Scholar] [CrossRef]
  32. De Luca, D.A.; Lasagna, M.; Debernardi, L. Hydrogeology of the Western Po Plain (Piedmont, NW Italy). J. Maps 2020, 16, 265–273. [Google Scholar] [CrossRef]
  33. Nistor, M.-M. Groundwater Vulnerability in the Piedmont Region under Climate Change. Atmosphere 2020, 11, 779. [Google Scholar] [CrossRef]
  34. Egidio, E.; Lasagna, M.; Mancini, S.; De Luca, D.A. Climate Impact Assessment to the Groundwater Levels Based on Long Time-Series Analysis in a Paddy Field Area (Piedmont Region, NW Italy): Preliminary Results. Acque Sotter.—Ital. J. GroundwaterAcque Sotter. 2022, 3, 21–29. [Google Scholar] [CrossRef]
  35. Cocca, D.; Lasagna, M.; De Luca, D.A. Groundwater Chemical Trends Analyses in the Piedmont Po Plain (NW Italy): Comparison with Groundwater Level Variations (2000–2020). Water 2024, 16, 1240. [Google Scholar] [CrossRef]
  36. Acquaotta, F.; Fratianni, S. Analysis on Long Precipitation Series in Piedmont (North-West Italy). Am. J. Clim. Change 2013, 02, 14–24. [Google Scholar] [CrossRef]
  37. Brussolo, E.; Palazzi, E.; von Hardenberg, J.; Masetti, G.; Vivaldo, G.; Previati, M.; Canone, D.; Gisolo, D.; Bevilacqua, I.; Provenzale, A.; et al. Aquifer Recharge in the Piedmont Alpine Zone: Historical Trends and Future Scenarios. Hydrol. Earth Syst. Sci. 2022, 26, 407–427. [Google Scholar] [CrossRef]
  38. Mombrini, E.; Tamea, S.; Viglione, A.; Revelli, R. A 60-Year Drought Analysis of Meteorological Data in the Western Po River Basin. Hydrol. Earth Syst. Sci. 2025, 29, 2255–2273. [Google Scholar] [CrossRef]
  39. Orecchia, C.; Giambastiani, B.M.S.; Greggio, N.; Campo, B.; Dinelli, E. Geochemical Characterization of Groundwater in the Confined and Unconfined Aquifers of the Northern Italy. Appl. Sci. 2022, 12, 7944. [Google Scholar] [CrossRef]
  40. Montanari, A.; Nguyen, H.; Rubinetti, S.; Ceola, S.; Galelli, S.; Rubino, A.; Zanchettin, D. Why the 2022 Po River Drought Is the Worst in the Past Two Centuries. Sci. Adv. 2023, 9, eadg8304. [Google Scholar] [CrossRef]
  41. Straffelini, E.; Tarolli, P. Climate Change-Induced Aridity Is Affecting Agriculture in Northeast Italy. Agric. Syst. 2023, 208, 103647. [Google Scholar] [CrossRef]
  42. Marchina, C.; Natali, C.; Bianchini, G. The Po River Water Isotopes during the Drought Condition of the Year 2017. Water 2019, 11, 150. [Google Scholar] [CrossRef]
  43. Arpa Piemonte Arpa Piemonte—Home Page. Available online: http://rsaonline.arpa.piemonte.it/meteoclima50/clima_ed_indicatori.htm (accessed on 7 December 2024).
  44. RSA 2025|Stato Dell’ambiente in Piemonte. Available online: https://relazione.ambiente.piemonte.it/2025/ (accessed on 30 July 2025).
  45. Baronetti, A.; Dubreuil, V.; Provenzale, A.; Fratianni, S. Future Droughts in Northern Italy: High-Resolution Projections Using EURO-CORDEX and MED-CORDEX Ensembles. Clim. Change 2022, 172, 22. [Google Scholar] [CrossRef]
  46. Arpa Piemonte Home Page|Arpa Piemonte. Available online: https://www.arpa.piemonte.it/rischi_naturali/snippets_arpa_graphs/map_meteoweb/?rete=stazione_meteorologica (accessed on 16 May 2025).
  47. Egidio, E.; Mancini, S.; De Luca, D.A.; Lasagna, M. The Impact of Climate Change on Groundwater Temperature of the Piedmont Po Plain (NW Italy). Water 2022, 14, 2797. [Google Scholar] [CrossRef]
  48. Lasagna, M.; Ducci, D.; Sellerino, M.; Mancini, S.; De Luca, D.A. Meteorological Variability and Groundwater Quality: Examples in Different Hydrogeological Settings. Water 2020, 12, 1297. [Google Scholar] [CrossRef]
  49. Monteleone, B.; Borzí, I. Drought in the Po Valley: Identification, Impacts and Strategies to Manage the Events. Water 2024, 16, 1187. [Google Scholar] [CrossRef]
  50. Forno, M.G.; De Luca, D.A.; Festa, V.; Bonasera, M.; Bucci, A.; Gianotti, F.; Lasagna, M.; Longhitano, S.G.; Lucchesi, S.; Petruzzelli, M.; et al. Synthesis on the Turin Subsoil Stratigraphy and Hydrogeology (NW Italy). AMQ 2018, 31, 1–24. [Google Scholar] [CrossRef]
  51. Lasagna, M.; Egidio, E.; De Luca, D.A. Groundwater Temperature Stripes: A Simple Method to Communicate Groundwater Temperature Variations Due to Climate Change. Water 2024, 16, 717. [Google Scholar] [CrossRef]
  52. Castagna, S.E.D.; De Luca, D.A.; Lasagna, M. Eutrophication of Piedmont Quarry Lakes (North-Western Italy): Hydrogeological Factors, Evaluation of Trophic Levels and Management Strategies. J. Environ. Assmt. Pol. Mgmt. 2015, 17, 1550036. [Google Scholar] [CrossRef]
  53. Barbero, D.; De Luca, D.A.; Forno, M.G.; Lasagna, M. Preliminary Results on Temperature Distribution in the Quaternary Fluvial and Outwash Deposits of the Piedmont Po Plain (NW Italy): A Statistical Approach. ROL 2016, 41, 272–275. [Google Scholar] [CrossRef]
  54. Irace, A.; Clemente, P.; Natalicchio, M.; Ossella, L.; Trenkwalder, S.; De Luca, D.A.; Mosca, P.; Piana, F.; Polino, R.; Violanti, D. Geologia e Idrostratigrafia Profonda Della Pianura Padana Occidentale (Regione Piemonte); La NuovaLito: Florence, Italy, 2009. [Google Scholar]
  55. Arpa Piemonte Story Map Journal. Available online: https://webgis.arpa.piemonte.it/monitoraggio_qualita_acque_mapseries/sotterranee_webapp/ (accessed on 28 July 2025).
  56. Jasechko, S.; Seybold, H.; Perrone, D.; Fan, Y.; Shamsudduha, M.; Taylor, R.G.; Fallatah, O.; Kirchner, J.W. Rapid Groundwater Decline and Some Cases of Recovery in Aquifers Globally. Nature 2024, 625, 715–721. [Google Scholar] [CrossRef] [PubMed]
  57. Ribeiro, L.; Kretschmer, N.; Nascimento, J.; Buxo, A.; Rötting, T.; Soto, G.; Señoret, M.; Oyarzún, J.; Maturana, H.; Oyarzún, R. Evaluating Piezometric Trends Using the Mann-Kendall Test on the Alluvial Aquifers of the Elqui River Basin, Chile. Hydrol. Sci. J. 2015, 60, 1840–1852. [Google Scholar] [CrossRef]
  58. Helsel, D.R.; Hirsch, R.M.; Ryberg, K.R.; Archfield, S.A.; Gilroy, E.J. Statistical Methods in Water Resources; Techniques and Methods: Reston, VA, USA, 2020; p. 484. [Google Scholar]
  59. Braca, G. ISPRA: Idrologia, Idromorfologia, Risorse Idriche, Inondazioni e Siccità. Available online: https://www.isprambiente.gov.it/pre_meteo/idro/ANABASI_ISPRA.html#download_anabasi (accessed on 28 November 2023).
  60. Mann, H.B. Nonparametric Tests Against Trend. Econometrica 1945, 13, 245. [Google Scholar] [CrossRef]
  61. Kendall, M.G. Rank Correlation Measures; Charles Griffin: London, UK, 1955; p. 202.
  62. Hammer, O.; Harper, D.A.T.; Ryan, P.D. PAST: Paleontological Statistics Software Package for Education and Data Analysis. Palaeontol. Electron. 2001, 4, 1–9. [Google Scholar]
  63. Gilbert, R.O. Statistical Methods for Environmental Pollution Monitoring; Nachdr.; Van Nostrand Reinhold: New York, NY, USA, 1995; ISBN 978-0-442-23050-0. [Google Scholar]
  64. Sen, P.K. Estimates of the Regression Coefficient Based on Kendall’s Tau. J. Am. Stat. Assoc. 1968, 39, 1379–1389. [Google Scholar] [CrossRef]
  65. Theil, H. A Rank-Invariant Method of Linear and Polynomial Regression Analysis. In Henri Theil’s Contributions to Economics and Econometrics; Raj, B., Koerts, J., Eds.; Advanced Studies in Theoretical and Applied Econometrics; Springer: Dordrecht, The Netherlands, 1992; Volume 23, pp. 345–381. ISBN 978-94-010-5124-8. [Google Scholar]
  66. Mancini, S.; Egidio, E.; De Luca, D.A.; Lasagna, M. Application and Comparison of Different Statistical Methods for the Analysis of Groundwater Levels over Time: Response to Rainfall and Resource Evolution in the Piedmont Plain (NW Italy). Sci. Total Environ. 2022, 846, 157479. [Google Scholar] [CrossRef]
  67. CORINE Land Cover—Copernicus Land Monitoring Service. Available online: https://land.copernicus.eu/en/products/corine-land-cover (accessed on 29 August 2025).
  68. Okabe, M.; Ito, K. Color Universal Design (CUD)/Colorblind Barrier Free. Available online: https://jfly.uni-koeln.de/color/?utm_ (accessed on 1 September 2025).
  69. Secci, D.; Tanda, M.G.; D’Oria, M.; Todaro, V.; Fagandini, C. Impacts of Climate Change on Groundwater Droughts by Means of Standardized Indices and Regional Climate Models. J. Hydrol. 2021, 603, 127154. [Google Scholar] [CrossRef]
  70. Arpa Piemonte Monitoraggio Della Qualità Delle Acque in Piemonte. Available online: https://webgis.arpa.piemonte.it/monitoraggio_qualita_acque_mapseries/introduzionePage (accessed on 19 March 2025).
  71. De Luca, D.A.; Falco, F.; Falco, M.; Lasagna, M. Studio Della Variazione Del Livello Piezometrico Della Falda Superficiale Nella Pianura Vercellese (Piemonte). G. Geol. Appl. 2005, 2, 387–392. [Google Scholar]
  72. LaHue, G.T.; Linquist, B.A. The Contribution of Percolation to Water Balances in Water-Seeded Rice Systems. Agric. Water Manag. 2021, 243, 106445. [Google Scholar] [CrossRef]
  73. Liu, C.-W.; Chen, S.-K.; Jou, S.-W.; Kuo, S.-F. Estimation of the Infiltration Rate of a Paddy Field in Yun-Lin, Taiwan. Agric. Syst. 2001, 68, 41–54. [Google Scholar] [CrossRef]
  74. Neumann, R.B.; Polizzotto, M.L.; Badruzzaman, A.B.M.; Ali, M.A.; Zhang, Z.; Harvey, C.F. Hydrology of a Groundwater-irrigated Rice Field in Bangladesh: Seasonal and Daily Mechanisms of Infiltration. Water Resour. Res. 2009, 45, 2008WR007542. [Google Scholar] [CrossRef]
  75. Egidio, E.; De Luca, D.A.; Lasagna, M. How Groundwater Temperature Is Affected by Climate Change: A Systematic Review. Heliyon 2024, 10, e27762. [Google Scholar] [CrossRef]
  76. Horsak, M.; Polaskova, V.; Zhai, M.; Bojkova, J.; Syrovatka, V.; Sorfova, V.; Schenkova, J.; Polasek, M.; Peterka, T.; Hajek, M. Spring-Fen Habitat Islands in a Warming Climate: Partitioning the Effects of Mesoclimate Air and Water Temperature on Aquatic and Terrestrial Biota. Sci. Total Environ. 2018, 634, 355–365. [Google Scholar] [CrossRef]
  77. Andrushchyshyn, O.P.; Wilson, K.P.; Williams, D.D. Climate Change-Predicted Shifts in the Temperature Regime of Shallow Groundwater Produce Rapid Responses in Ciliate Communities. Glob. Change Biol. 2009, 15, 2518–2538. [Google Scholar] [CrossRef]
  78. Margat, J.; Gun, J.V.D. Groundwater Around the World; CRC Press: Boca Raton, FL, USA, 2013; ISBN 978-0-203-77214-0. [Google Scholar]
  79. Bonsor, H.C.; MacDonald, A.M.; Ahmed, K.M.; Burgess, W.G.; Basharat, M.; Calow, R.C.; Dixit, A.; Foster, S.S.D.; Gopal, K.; Lapworth, D.J.; et al. Hydrogeological Typologies of the Indo-Gangetic Basin Alluvial Aquifer, South Asia. Hydrogeol. J. 2017, 25, 1377–1406. [Google Scholar] [CrossRef]
  80. MacDonald, A.M.; Bonsor, H.C.; Ahmed, K.M.; Burgess, W.G.; Basharat, M.; Calow, R.C.; Dixit, A.; Foster, S.S.D.; Gopal, K.; Lapworth, D.J.; et al. Groundwater Quality and Depletion in the Indo-Gangetic Basin Mapped from in Situ Observations. Nat. Geosci. 2016, 9, 762–766. [Google Scholar] [CrossRef]
  81. Wang, S.; Song, X.; Wang, Q.; Xiao, G.; Liu, C.; Liu, J. Shallow Groundwater Dynamics in North China Plain. J. Geogr. Sci. 2009, 19, 175–188. [Google Scholar] [CrossRef]
  82. Meng, S.; Liu, J.; Zhang, Z.; Lei, T.; Qian, Y.; Li, Y.; Fei, Y. Spatiotemporal Evolution Characteristics Study on the Precipitation Infiltration Recharge over the Past 50 Years in the North China Plain. J. Earth Sci. 2015, 26, 416–424. [Google Scholar] [CrossRef]
  83. Gong, H.; Pan, Y.; Zheng, L.; Li, X.; Zhu, L.; Zhang, C.; Huang, Z.; Li, Z.; Wang, H.; Zhou, C. Long-Term Groundwater Storage Changes and Land Subsidence Development in the North China Plain (1971–2015). Hydrogeol. J. 2018, 26, 1417–1427. [Google Scholar] [CrossRef]
  84. Buapeng, S.; Foster, S. Controlling Groundwater Abstraction and Related Environmental Degradation in Metropolitan Bangkok—Thailand; World Bank Case Profile Collection No. 20.; World Bank: Washington, DC, USA, 2008. [Google Scholar]
  85. Karami, E.; Karimi, H.; Tavakoli, M.; Banparvari, G. Investigating the Effects of Water Transfer from Karkheh Dam on the Physico-Chemical Properties of Soil in Dasht-e Abbas Plain, Ilam. Geopersia 2015, 5, 151–160. [Google Scholar]
  86. Scanlon, B.R.; Reedy, R.C.; Faunt, C.C.; Pool, D.; Uhlman, K. Enhancing Drought Resilience with Conjunctive Use and Managed Aquifer Recharge in California and Arizona. Environ. Res. Lett. 2016, 11, 035013. [Google Scholar] [CrossRef]
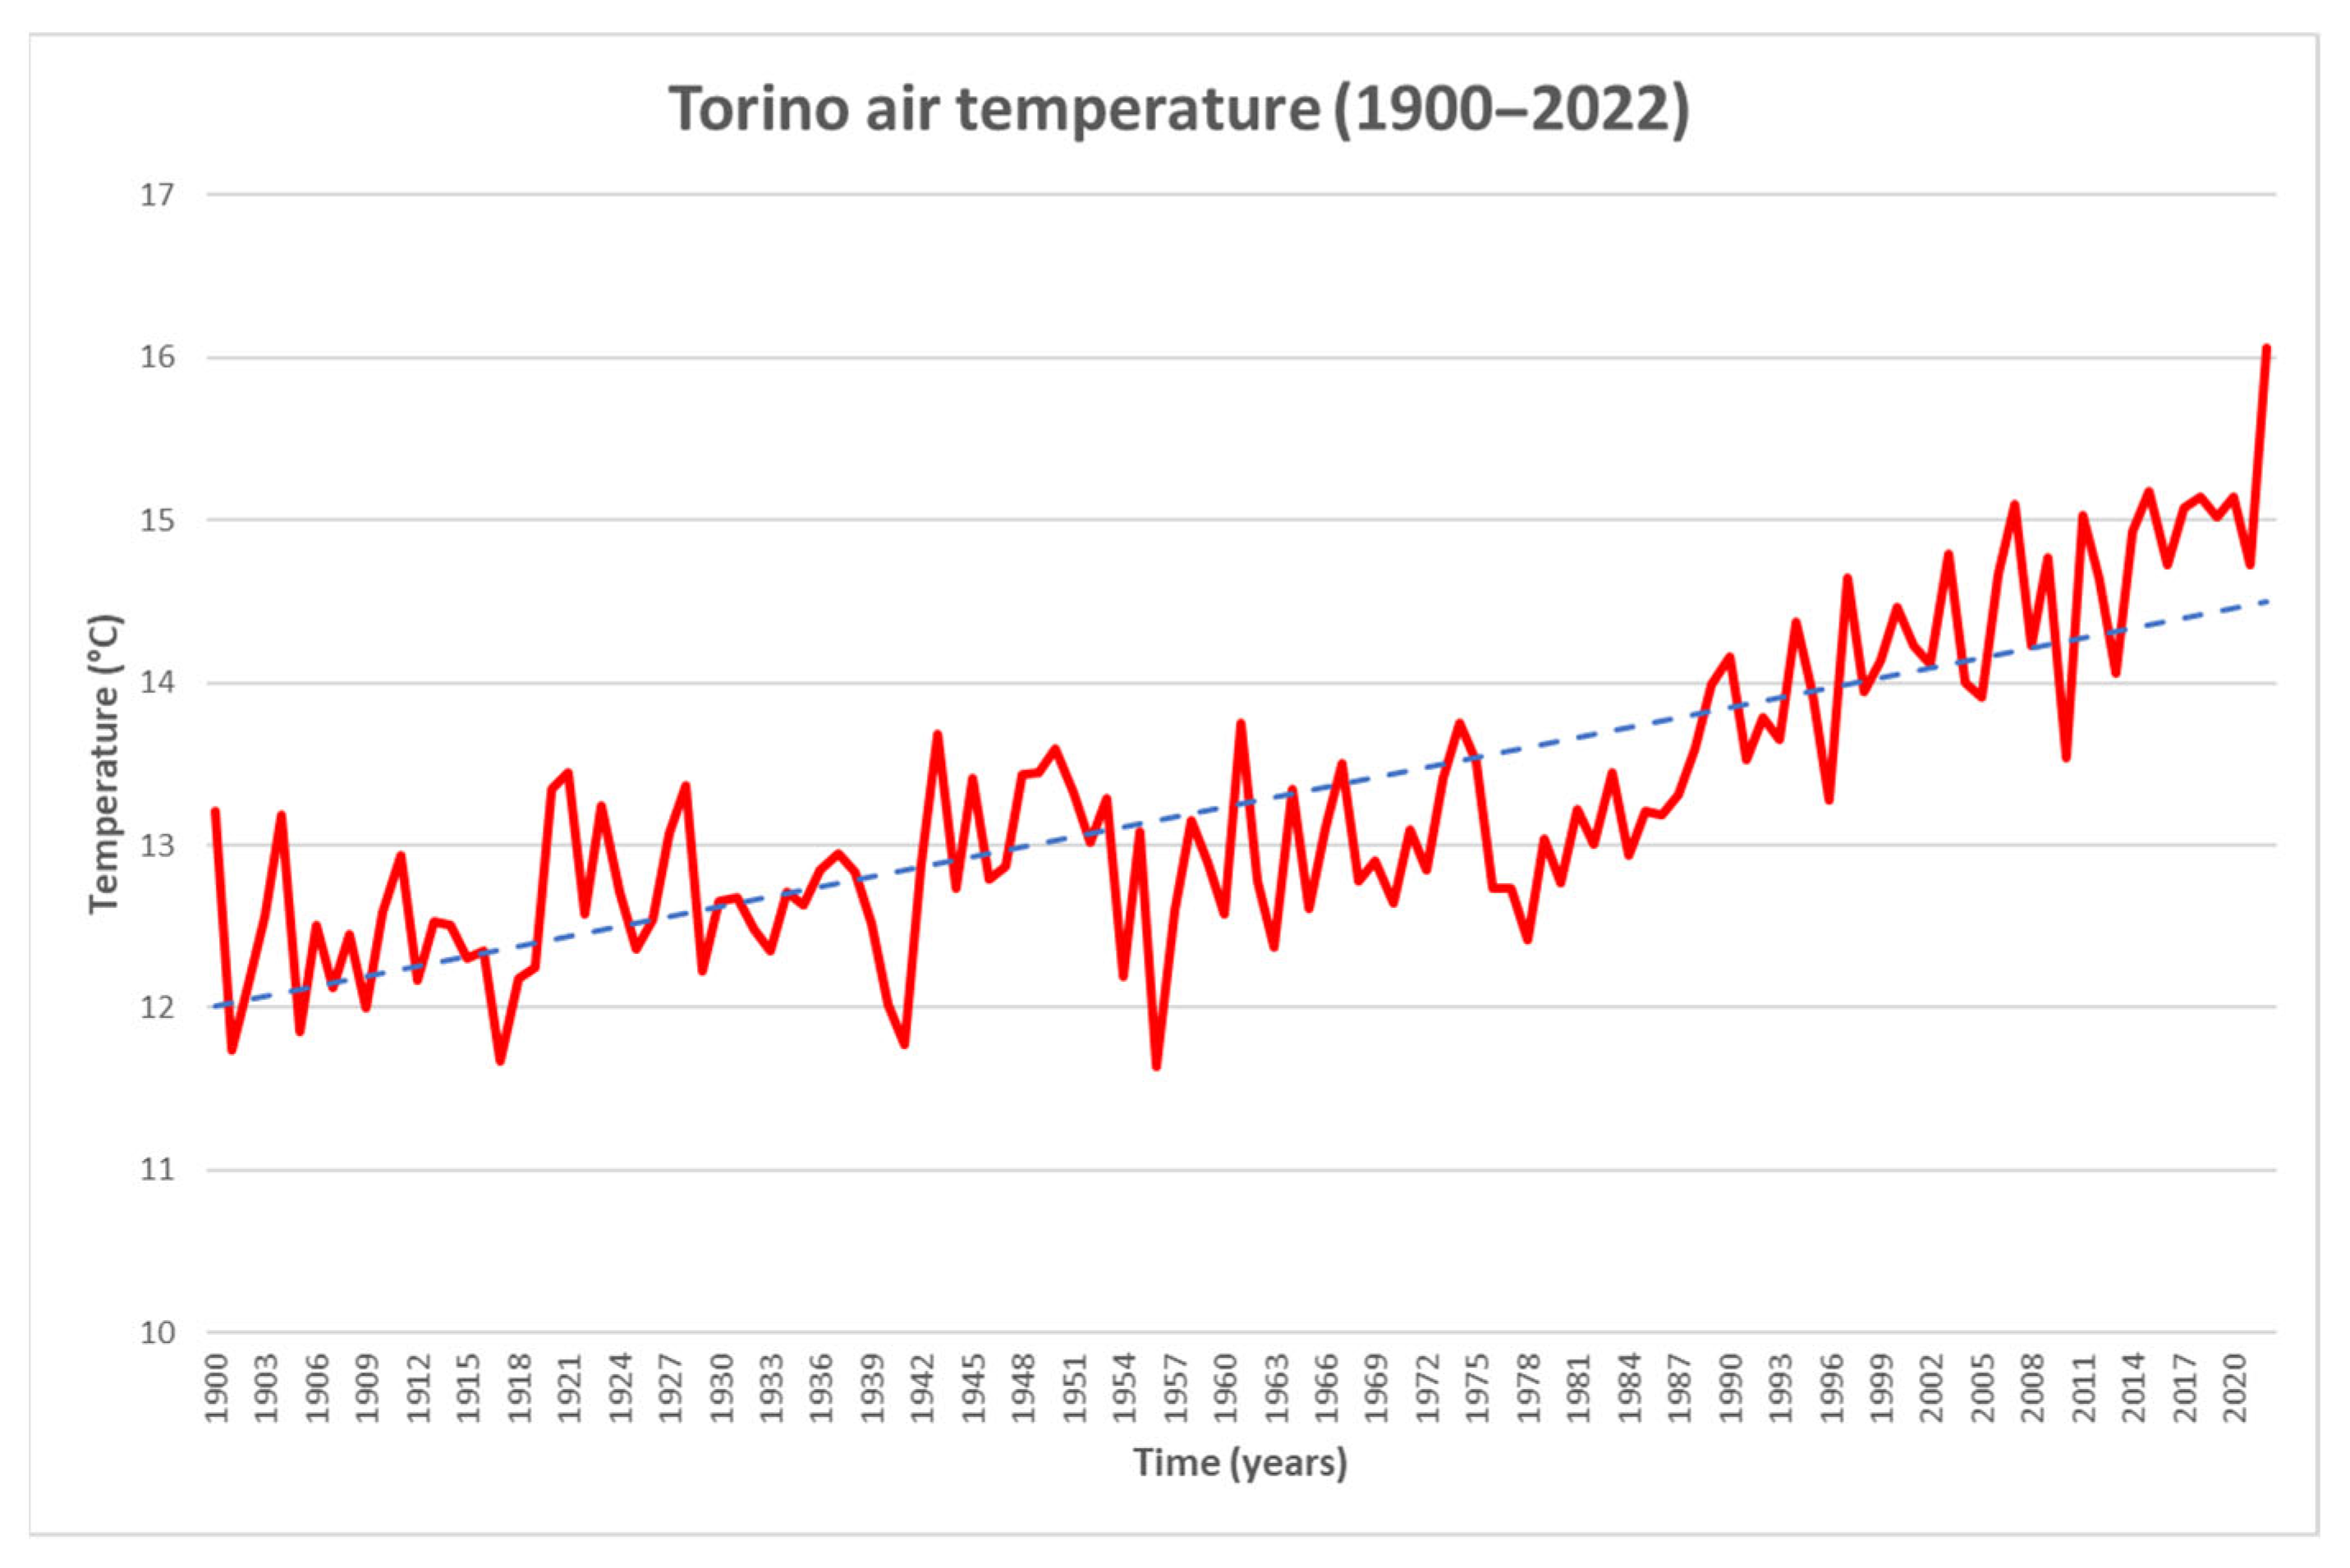
Figure 1. Graph showing the average annual temperature in Torino from 1900 to 2022, based on data collected over more than a century [43]. The red line represents the air temperature trend, while the blue dashed line represents the trend line. Although there has been a general increase throughout the period observed, it is clear that this trend has become more pronounced since the 1980s.
Water 17 02712 g001
Figure 2. Annual average precipitation (blue bars, in mm) and air temperature (orange line, in °C) recorded at the Torino–Giardini Reali weather station from 2010 to 2022. The dotted lines represent linear trends over the period, showing a general decrease in precipitation and an increase in air temperature. The red box shows an extraction of the GW seasonal variations (2020).
Water 17 02712 g002
Figure 3. Sketch of a W-E cross-section (orange in the Piedmont figure) of the hydrogeological complexes of the Piedmont Po plain. In the top left corner there is an image of Italy (in grey) with the Piedmont region highlighted in red (from [51]).
Water 17 02712 g003
Figure 4. Location of the monitoring wells, the weather and the river stations in the study area. The principal rivers of the region are also highlighted.
Water 17 02712 g004
Figure 5. Map showing the results relating to average monthly changes in GWL for all 15 piezometers in the period 2010–2022. In all figures, the blue line indicates the average monthly fluctuation of GWL, while the red dotted line represents the trend line.
Water 17 02712 g005
Figure 6. Example of monthly average groundwater level variations for wells P23 (a), PII06 (b) and PII32 (c) from 2010 to 2022. The red dashed line represents the linear trend over the observed period. The red box shows a focus of the GW seasonal variations ((a,b): 2020–2021; (c): 2019–2020). In all three wells, it can be observed that they are characterised by a summer maximum and a winter minimum.
Water 17 02712 g006
Figure 7. (a) Comparison between the Torino meteorological station and piezometer PII45; (b) comparison between the Morozzo meteorological station and piezometer P23; (c) comparison between the Novara meteorological station and piezometer PII32. In all three graphs, the monthly trend of GWL is shown in blue, while precipitation P is shown in orange. For both variables, a dashed line in the corresponding colour represents the linear trend over the observation period (2010–2022). The red box shows a focus of the monthly seasonal variations (2020) of both parameters.
Water 17 02712 g007
Figure 8. (a) Mean monthly river water level at the Sesia River station; (b) mean monthly river water level at the Po River station; (c) mean monthly river water level at the Tanaro River station. In all three graphs, the blue line represents the observed monthly river water level (2010–2022). The red box highlights a focus on monthly seasonal variations (2019).
Water 17 02712 g008
Figure 9. Location of the monitoring wells and details of the land use of the Piedmont region (modified from [67]). The land use classes are displayed using colours from a colorblind-friendly palette [68].
Water 17 02712 g009
Figure 10. Scatter plots showing the relationship between mean monthly precipitation (mm) and piezometric levels (m a.s.l.) for the monitoring wells considered in this study. Weather stations are indicated as Novara (a), Morozzo (b), and Torino (c), while the corresponding monitoring well codes are PII32 (a), P23 (b), and PII45 (c). The low R2 values indicate a weak correlation between the parameters considered. The green dotted line in all three figures represents the trend line of the data.
Water 17 02712 g010
Figure 11. Scatter plot between monthly average piezometric levels at well DST and monthly average hydrometric levels of the Tanaro River at the nearest gauging station (2010–2022). The strong positive correlation (R2 = 0.74) indicates that groundwater levels at DST are largely controlled by river stage fluctuations, consistent with the well’s location less than 40 m from the riverbank. The blue dotted line represents the trend line of the data.
Water 17 02712 g011
Table 1. Completeness index CI of the analysed monitoring wells.
Monitoring WellDSTP8P14/1P21P23P43PII06PII11PII19PII31PII32PII45PII51SI5T2
CI (%)100100100969992100971009495979789100
Table 2. Mann–Kendall trend test results. S indicates the Mann–Kendall statistic, Z is the standardised test statistic, and p-value represents the significance of the trend. Out of 15 monitored points, 14 show a statistically significant trend (13 negative and one positive), while only 1 point does not show a statistically significant trend.
SZp ValueStatistical Trend
DST−835−1.2780.20123No
P8−1878−2.87640.0040229Negative
P14/1−3919−6.0041.92 × 10−9Negative
P21−4580−7.51565.67 × 10−14Negative
P23−3011−4.70252.57 × 10−6Negative
P43−5537−9.66214.37 × 10−22Negative
PII06−1283−1.96460.049464Negative
PII11−3613−5.75438.70 × 10−9Negative
PII19−1658−2.53920.01111Negative
PII31−2003−3.3530.00079949Negative
PII32−3110−5.15452.54 × 10−7Negative
PII45−2406−3.83140.0001274Negative
PII5128194.53395.79 × 10−6Positive
SI5−2613−4.75631.97 × 10−6Negative
T2−3084−4.72452.31 × 10−6Negative
Table 3. Results of the Theil–Sen estimator. N° of data indicates the number of observations used for each point, Theil–Sen trend line slope represents the estimated slope of the groundwater level trend, GWL variation (m/13 years) shows the total change over the 13-year period, GWL variation (m/y) is the average annual change in meters per year, and GWL variation (cm/y) is the same expressed in centimeters per year.
Monitoring WellN° of DataTheil–Sen Trend Line SlopeGWL Variation (m/13 Years)GWL Variation (m/y)GWL Variation (cm/y)
P8156−0.002−0.312−0.02−2.40
P14/1156−0.0034−0.5304−0.04−4.08
P21149−0.0075−1.1175−0.09−8.60
P23154−0.0094−1.4476−0.11−11.14
P43143−0.0041−0.5863−0.05−4.51
PII06156−0.0006−0.0936−0.01−0.72
PII11152−0.0038−0.5776−0.04−4.44
PII19156−0.0018−0.2808−0.02−2.16
PII31147−0.0026−0.3822−0.03−2.94
PII32148−0.0147−2.1756−0.17−16.74
PII45152−0.0017−0.2584−0.02−1.99
PII511510.00751.13250.098.71
SI5139−0.0037−0.5143−0.04−3.96
T2156−0.0046−0.7176−0.06−5.52
Disclaimer/Publisher’s Note: The statements, opinions and data contained in all publications are solely those of the individual author(s) and contributor(s) and not of MDPI and/or the editor(s). MDPI and/or the editor(s) disclaim responsibility for any injury to people or property resulting from any ideas, methods, instructions or products referred to in the content.