1. Introduction
China has become one of the high–risk areas for global geological disasters due to its unique geological structure and complex natural environment [
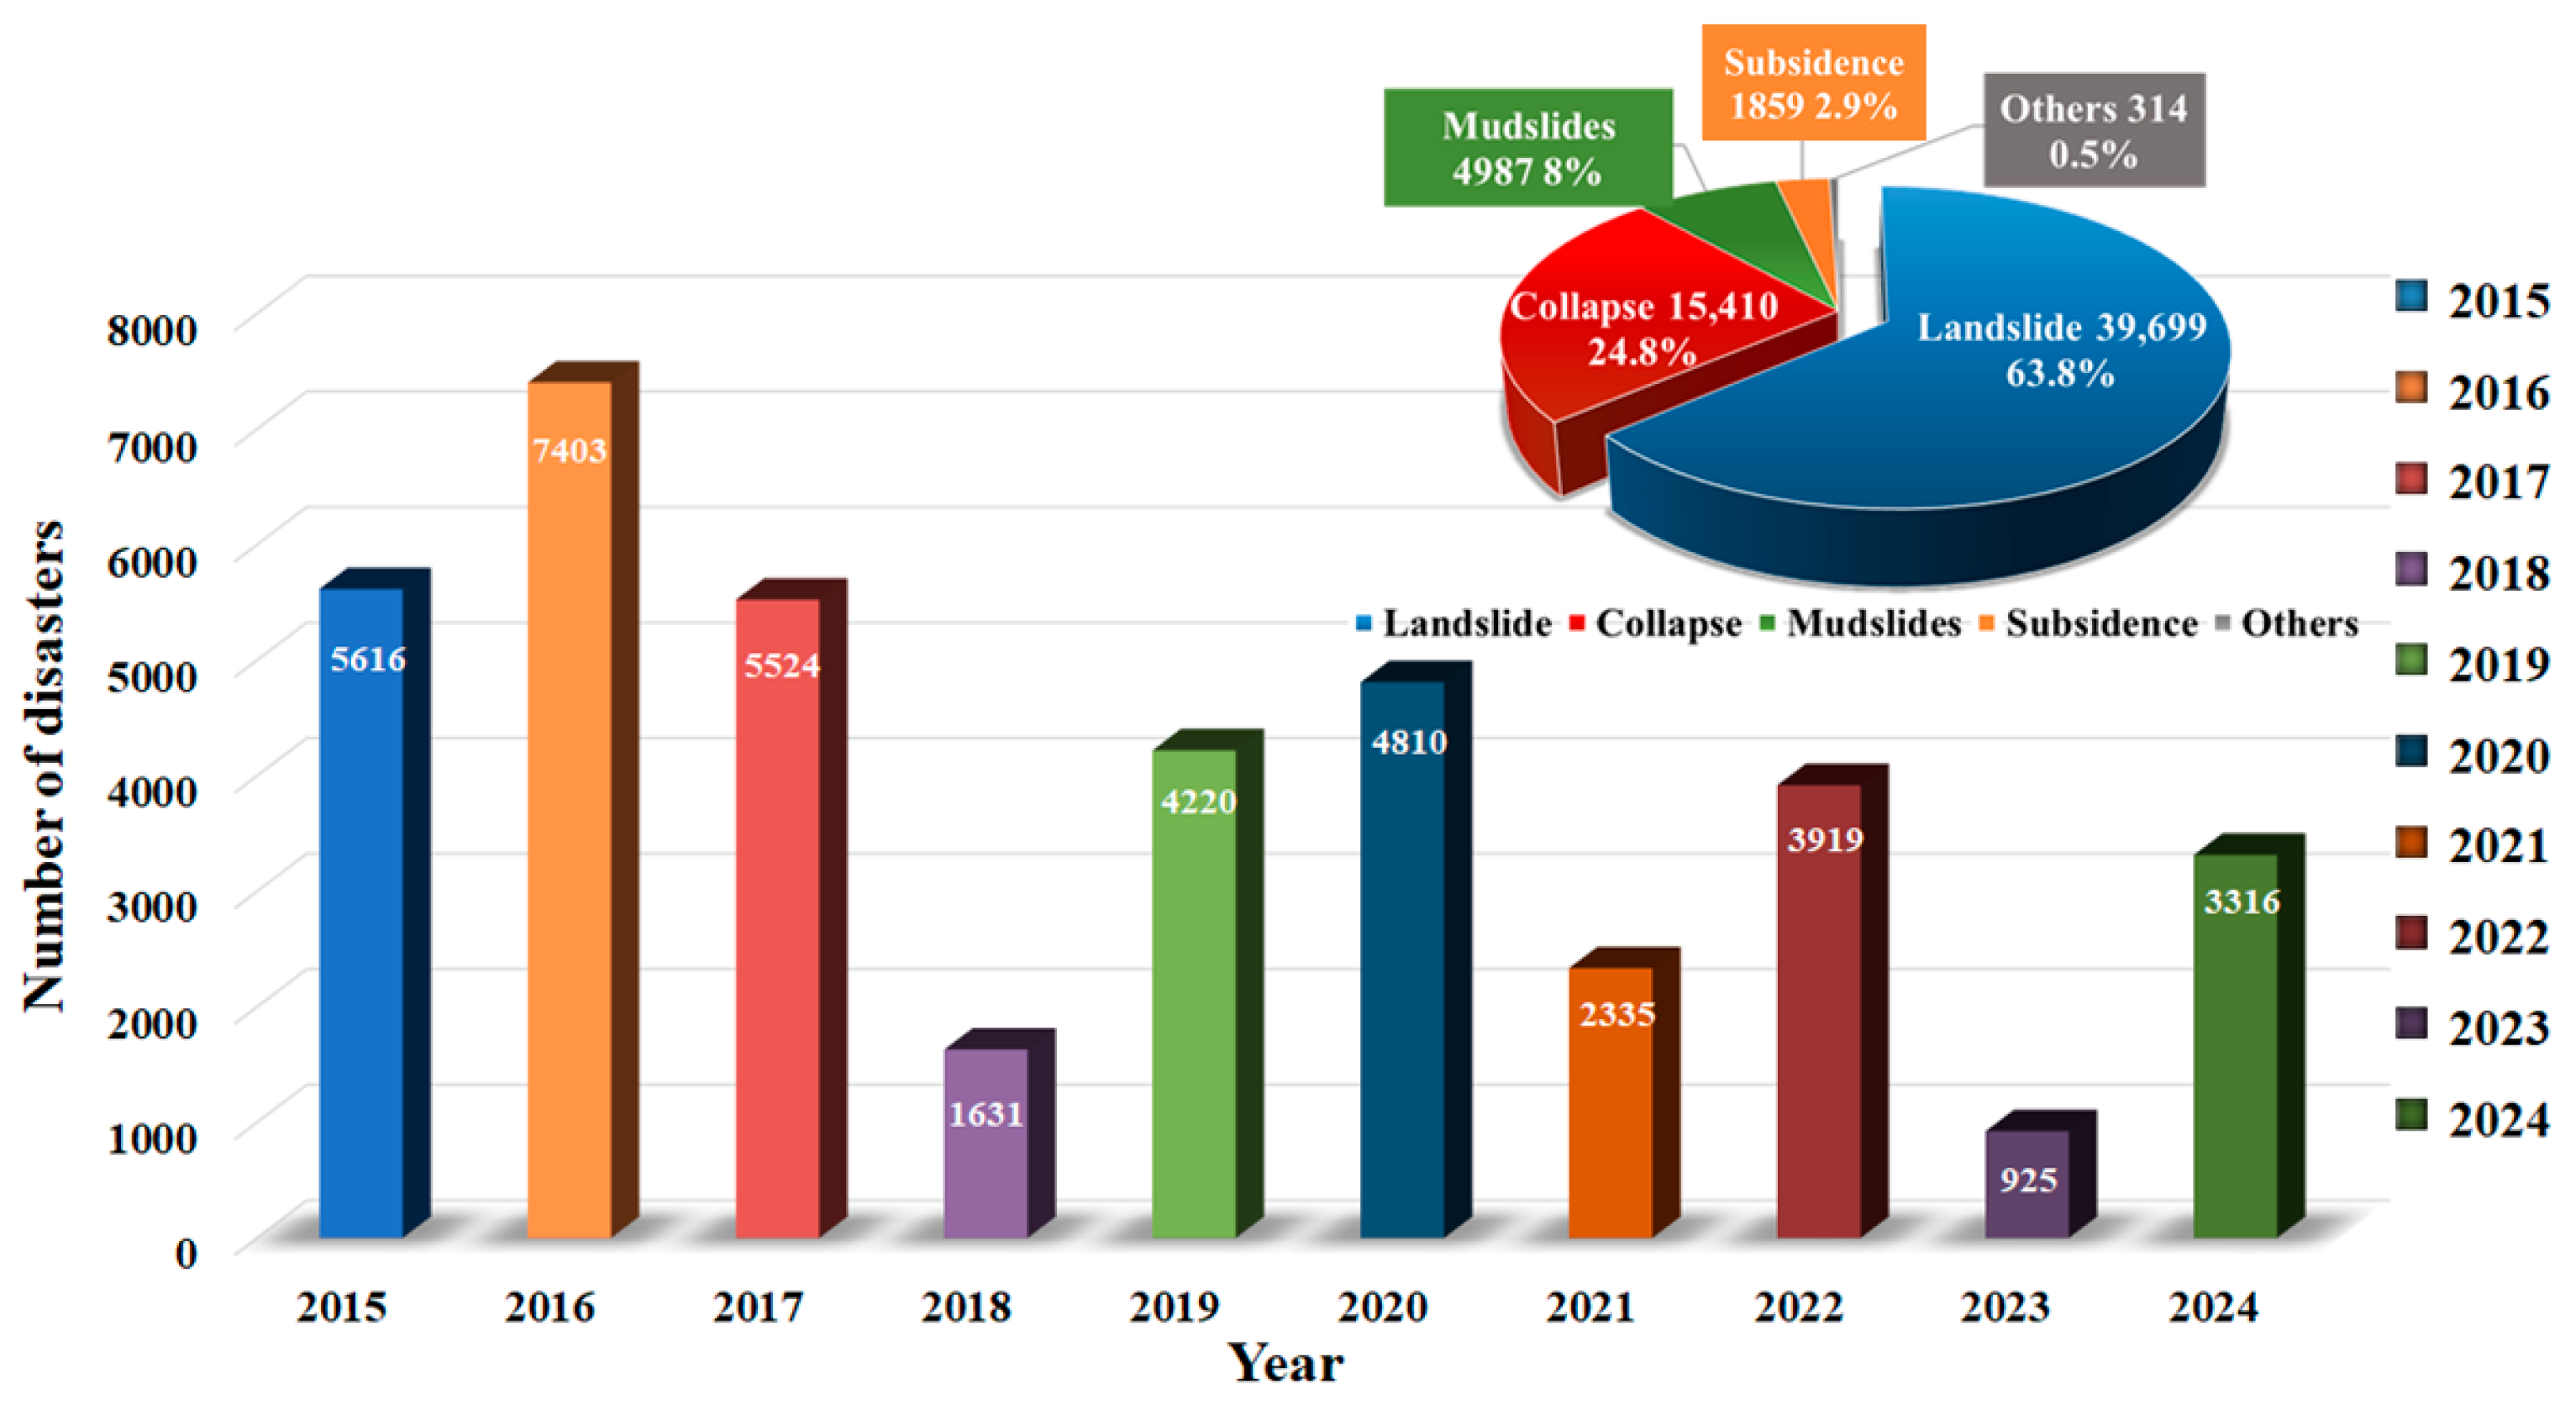
1]. China’s geological hazards are diverse and widely distributed, including landslides, collapses, and mudslides. According to relevant statistics, there were 5719 geological disasters that occurred in China in 2024, of which 3316 were landslides, accounting for 57.9%, causing direct economic losses of up to CNY 263.04 billion.
Figure 1 shows the distribution of geological hazards in China over the past decade [
2,
3,
4,
5,
6,
7,
8,
9,
10]. The stability of slopes is influenced by multiple factors. In terms of natural factors, rainfall is one of the key factors that induce slope instability. Precipitation can lead to an increase in pore water pressure in the slope’s rock and soil mass, resulting in a decrease in its shear strength [
11]. Earthquakes can instantly change the stress balance of slopes, and seismic waves can be transmitted to the rock and soil mass of the slope, causing severe vibrations and thus damaging the original stable state of the slope. Weathering is a long–term, slow process of destruction that gradually weakens the physical and mechanical properties of the rock and soil, leading to a gradual decrease in the stability of the slope. In terms of human activities, excavation behavior in engineering construction can alter the original gradient and shape of the slope, disrupting the natural equilibrium state of the slope. Loading will increase the load on the slope, causing the rock and soil mass of the slope to bear greater pressure. When the pressure exceeds its bearing capacity, it will cause slope instability. The hazards of landslides, collapses, and other disasters caused by slope instability are multifaceted. Firstly, slope disasters pose a serious threat to the safety of various engineering facilities, such as tunnels and bridges in transportation engineering, dams in water conservancy engineering, etc. Once subjected to slope disasters, they can cause traffic interruption and damage to water conservancy facilities [
12]. Secondly, slope disasters can cause huge losses to people’s lives and property safety, threatening the safety of surrounding residents’ lives and property [
13]. In addition, slope disasters can also cause huge economic losses, including direct property damage from the disaster, as well as the financial investment required for disaster recovery and reconstruction [
14].
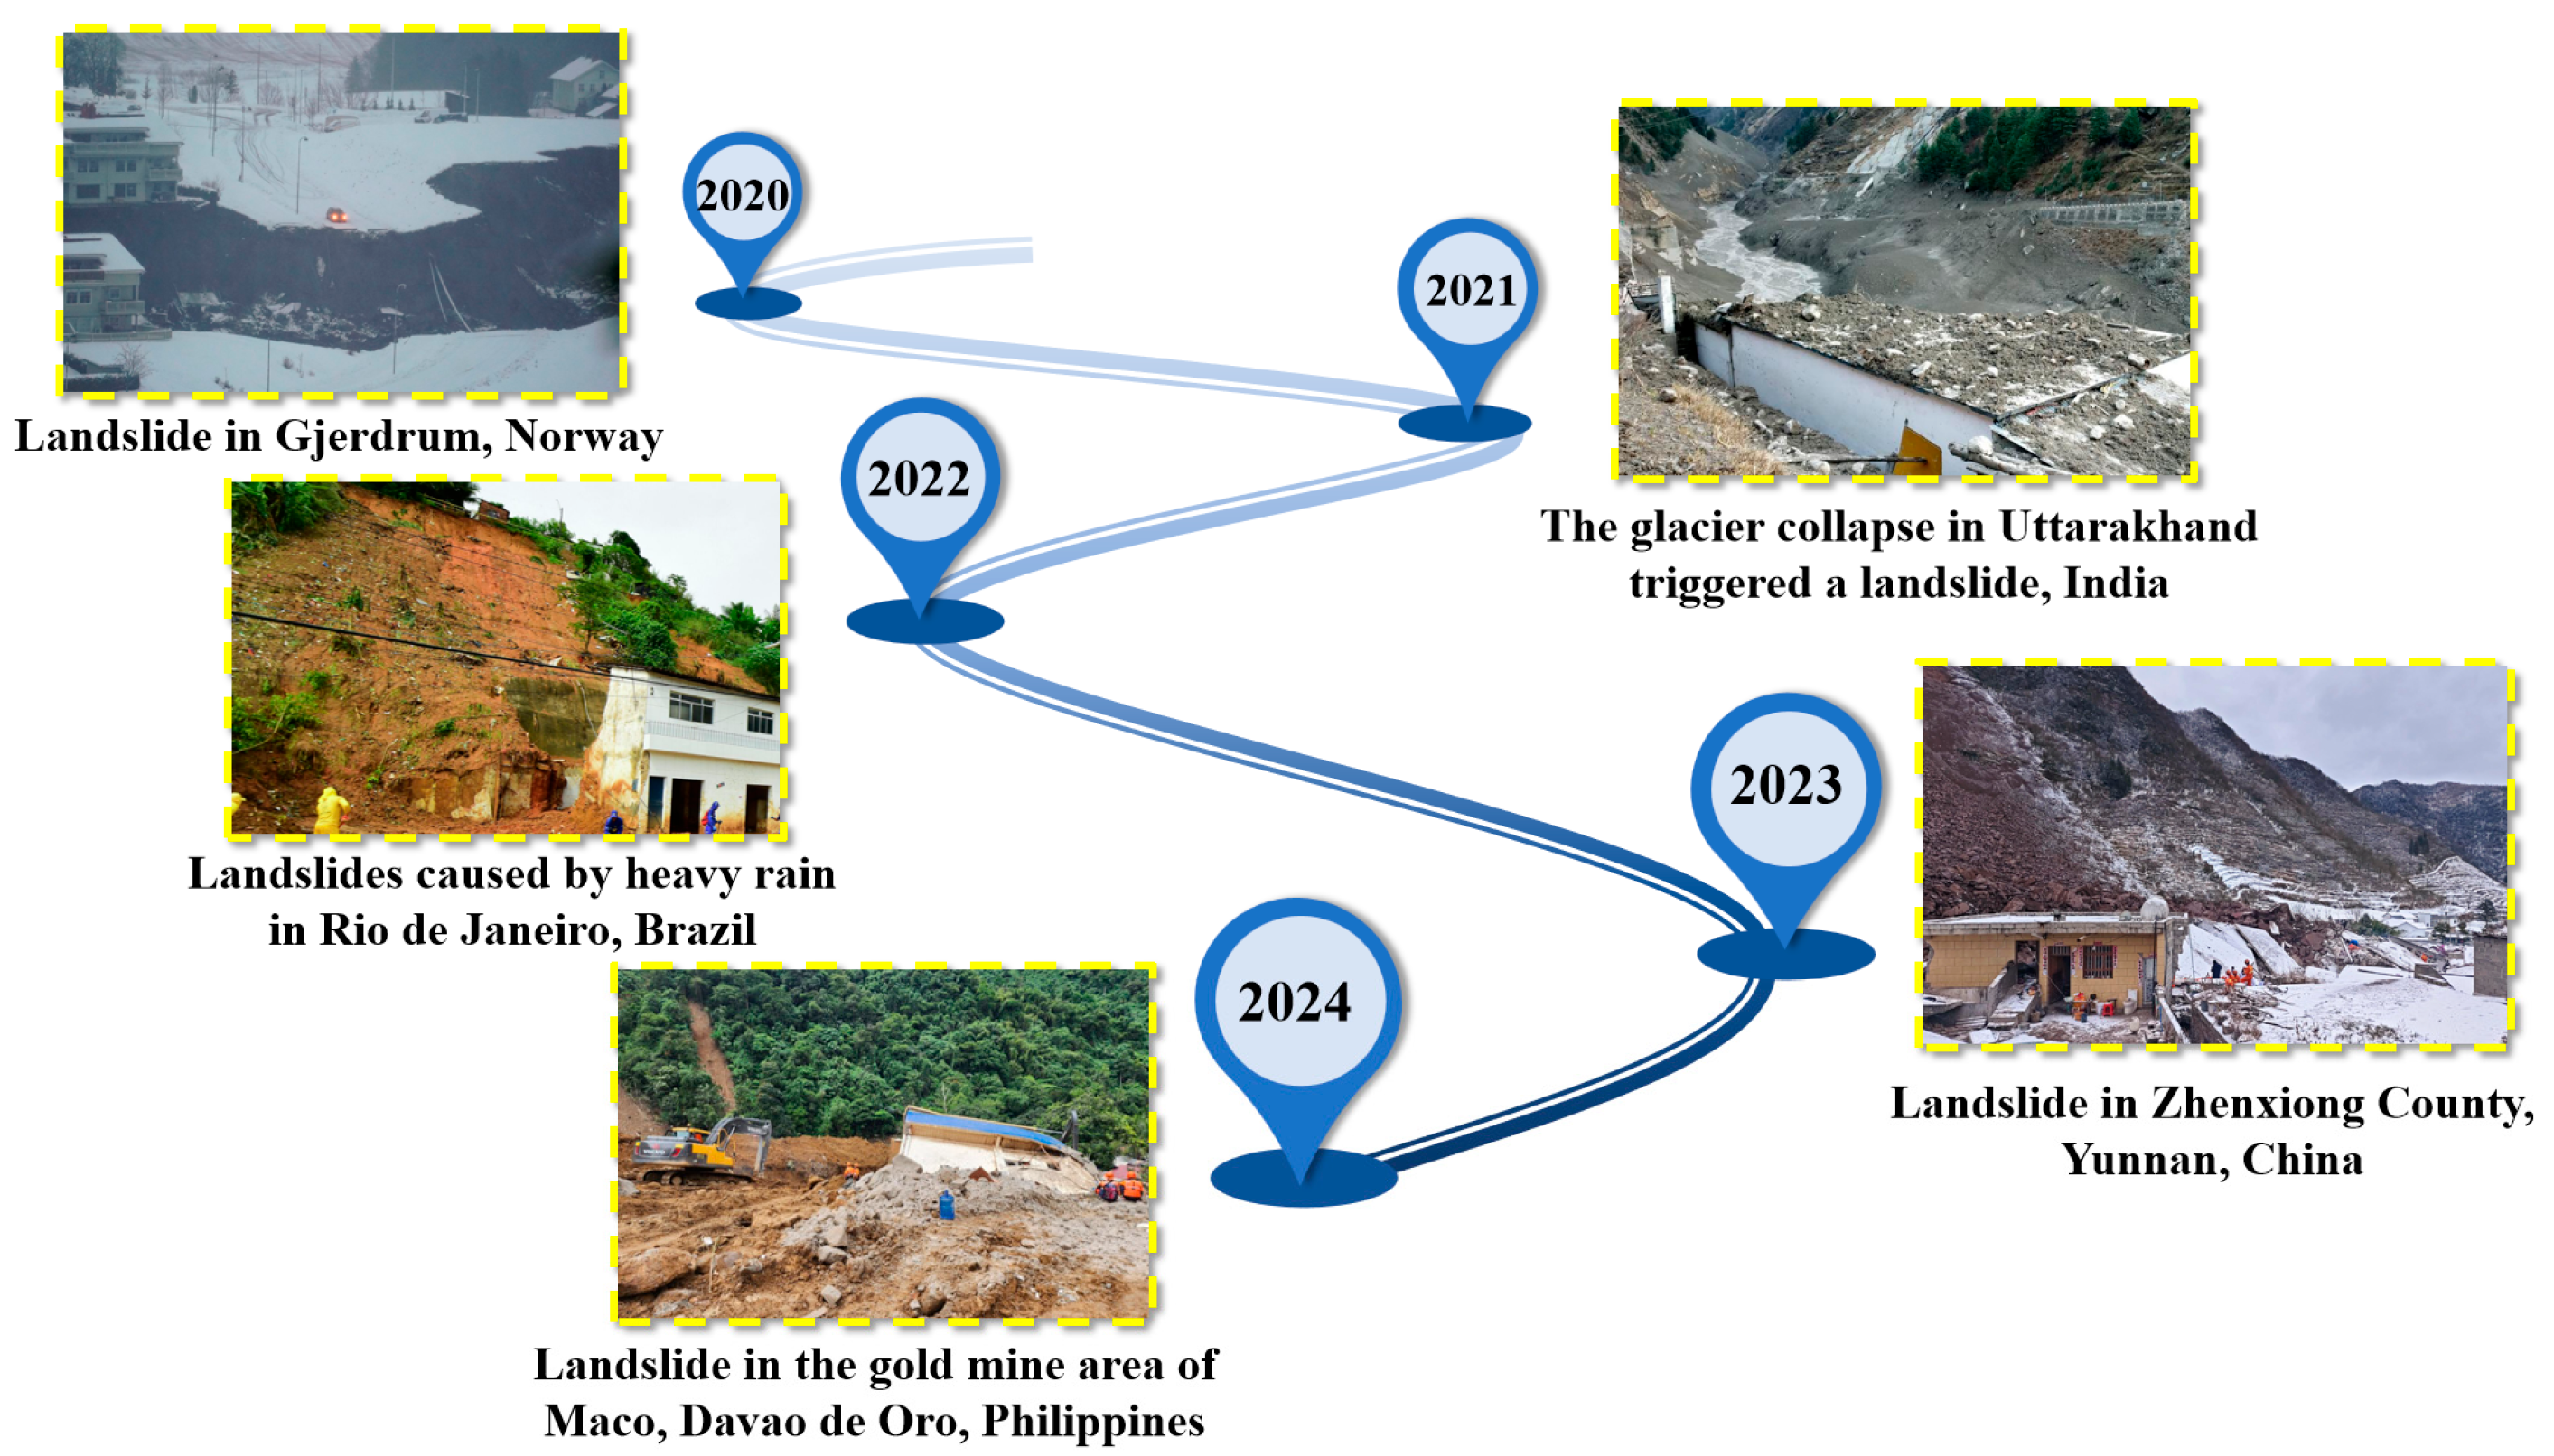
Figure 2 shows typical landslide disaster scenes in different countries.
Given the serious harm of slope disasters and their significant impact on the national economy, society, and the safety of people’s lives and property, the continuous monitoring of slope deformation and stability assessments, as well as in–depth research on the spatiotemporal evolution laws of slopes, are not only research needs in the field of engineering geology but also major requirements for ensuring infrastructure safety and maintaining social stability at the national level.
In the field of engineering geological monitoring, traditional slope monitoring methods mainly rely on manual measurements and instrument monitoring, which often have shortcomings such as a low efficiency, limited accuracy, and high susceptibility to environmental interference [
15]. For example, manual measurement methods are inefficient and have limited accuracy due to human factors and measurement conditions. Although instrument monitoring has improved the automation level of monitoring to a certain extent, it is often susceptible to environmental factors such as electromagnetic interference, temperature changes, humidity changes, etc. These interference factors can affect the accuracy and reliability of the monitoring data, limiting the further improvement of the monitoring accuracy. In addition, traditional monitoring methods also have shortcomings in continuity and real–time data collection, making it difficult to meet the high–precision and real–time monitoring data requirements for slope stability analysis [
16].
In recent years, fiber optic neural sensing technology has gradually been applied in the field of slope monitoring as an emerging monitoring technology. This technology has many significant advantages, such as a strong resistance to electromagnetic interference, stable operation in complex electromagnetic environments, and no interference from external electromagnetic signals. Good corrosion resistance is capable of promoting long–term stable operations in harsh natural environments, suitable for various complex geological conditions. A high measurement accuracy provides high–precision monitoring data, meeting the strict requirements for data accuracy in slope stability analysis. The distributed measurement capability is strong, which can achieve the real–time continuous monitoring of key physical quantities, such as the stress, strain, and temperature, inside the slope and obtain detailed physical state information inside the slope. Based on this, fiber optic neural sensing technology can provide high–precision in situ data for slope stability analysis, providing strong data support for in–depth research on slope mechanical behavior and stability evolution laws.
In view of this, this paper systematically expounds the classification, principles, and characteristics of distributed fiber optic sensing technology for slope engineering and analyzes the significant advantages of this technology in the field of slope engineering monitoring applications. Taking the landslide on the reservoir bank of the Three Gorges as the research object, this paper elaborately introduces the fiber optic neural perception technology on the reservoir bank slope and the mechanism of the slope’s temporal and spatial evolution, providing important technical support for the precise identification of slope hazard points and the scientific evaluation of the sliding potential.
2. Distributed Fiber Optic Sensing Technology for Slope Engineering
The evolution of slope disasters often manifests as a complex process of multi–scale deformation coupling and the coordinated evolution of multi–field information, and the disaster–prone environment has significant heterogeneity, anisotropy, and dynamic disturbance characteristics. However, traditional monitoring techniques have two major limitations in slope deformation monitoring: On the one hand, due to complex geological conditions and harsh monitoring environments, the structure, quantity, and installation process of sensors in traditional monitoring technologies are constrained by various factors, resulting in monitoring data that lacks the precision and volume required for refined analysis. On the other hand, single monitoring technology often fails to achieve the synchronous monitoring of multiple parameters, thus failing to meet the requirements of the multiple parameters and real–time monitoring of slope deformation and instability, resulting in difficulty in quickly and accurately identifying potential hidden danger points on slopes. Therefore, in the practical monitoring of slopes, further research and development of multi–source and multi–field fiber optic sensing technology should be carried out to achieve the distributed and continuous real–time acquisition of multi–field spatiotemporal data of slopes; promote slope engineering from in situ detection, detection, and monitoring to perception; and provide more comprehensive and accurate technical support for the safety warning and landslide disaster prevention of slope engineering.
In the past thirty years, distributed fiber optic sensing technology has developed rapidly and has become an innovative force in the field of geological hazard monitoring [
17,
18]. This technology uses itself as a medium to obtain parameters such as the strain, temperature, and vibration along the fiber optic path. It has significant advantages such as a high measurement accuracy, a long monitoring distance, full real–time monitoring, a strong resistance to electromagnetic interference, a small sensor size, and easy deployment. It is the best technology choice for achieving the continuous spatiotemporal perception of slope state information. According to the different types of scattered signals and measured parameters, distributed fiber optic sensing technology is mainly divided into distributed strain sensing (DSS), distributed temperature sensing (DTS), and distributed acoustic sensing (DAS) (
Figure 3) [
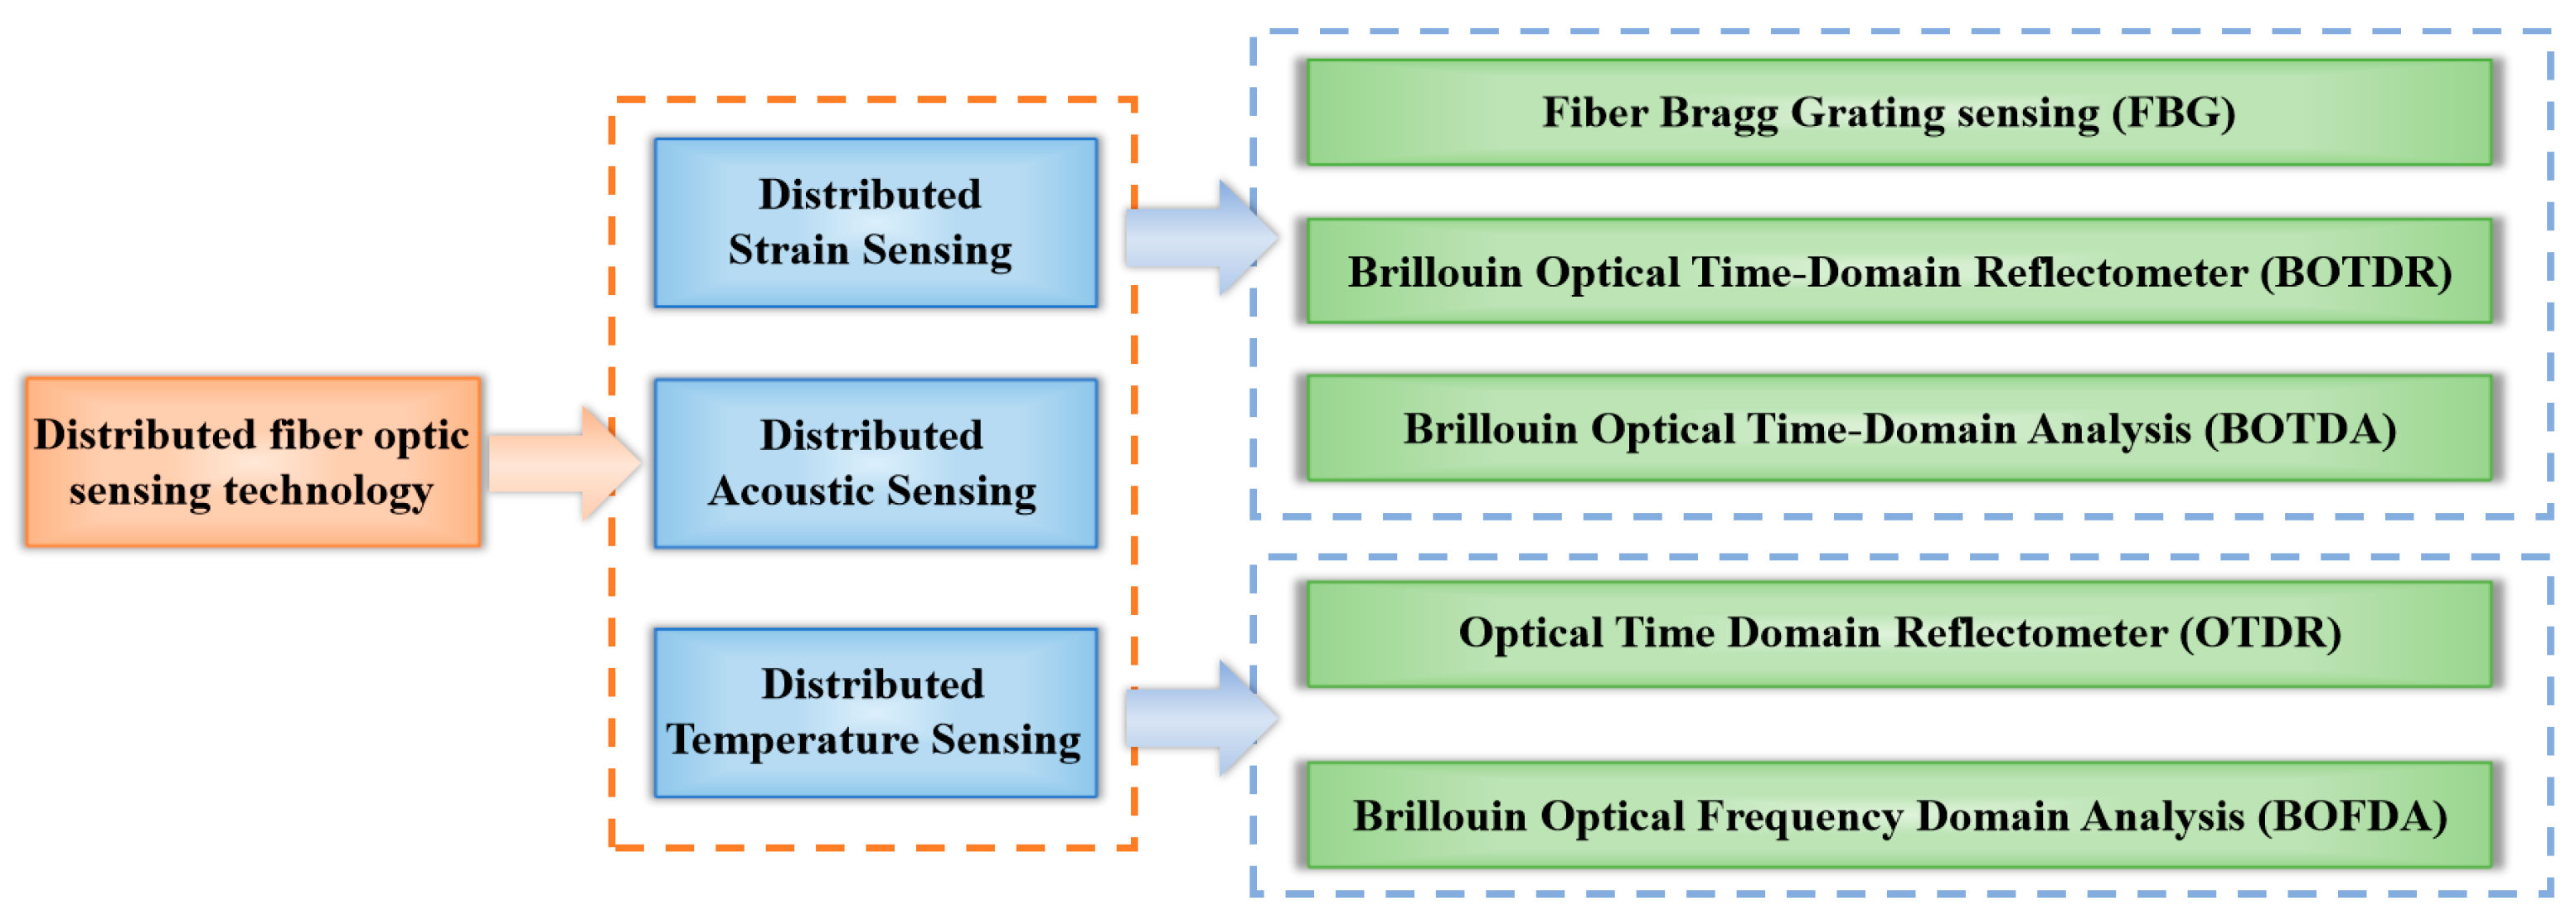
19]. Among them, DSS is mainly used to monitor the strain distribution inside the slope, which can capture small deformation signals; DTS focuses on temperature monitoring and can be used to analyze the changes in the thermal field within slopes. DAS technology detects vibration signals around optical fibers and senses the dynamic response of slopes in real time.
Table 1 summarizes the principles and characteristics of the above–mentioned fiber optic sensing technologies. At present, the continuous spatiotemporal sensing based on distributed fiber optic sensing technology has preliminarily achieved the multi–view and full–dimensional monitoring of slopes, which can obtain real–time continuous data of multiple physical fields such as slope deformation, temperature, seepage, and vibration. However, due to the significant differences in monitoring indicators among various technologies, low data coupling, and the insufficient robustness of sensors and monitoring systems in harsh environments, further research is needed on spatiotemporal continuous sensing technology for slope deformation to enhance its application efficiency and reliability in complex geological environments.
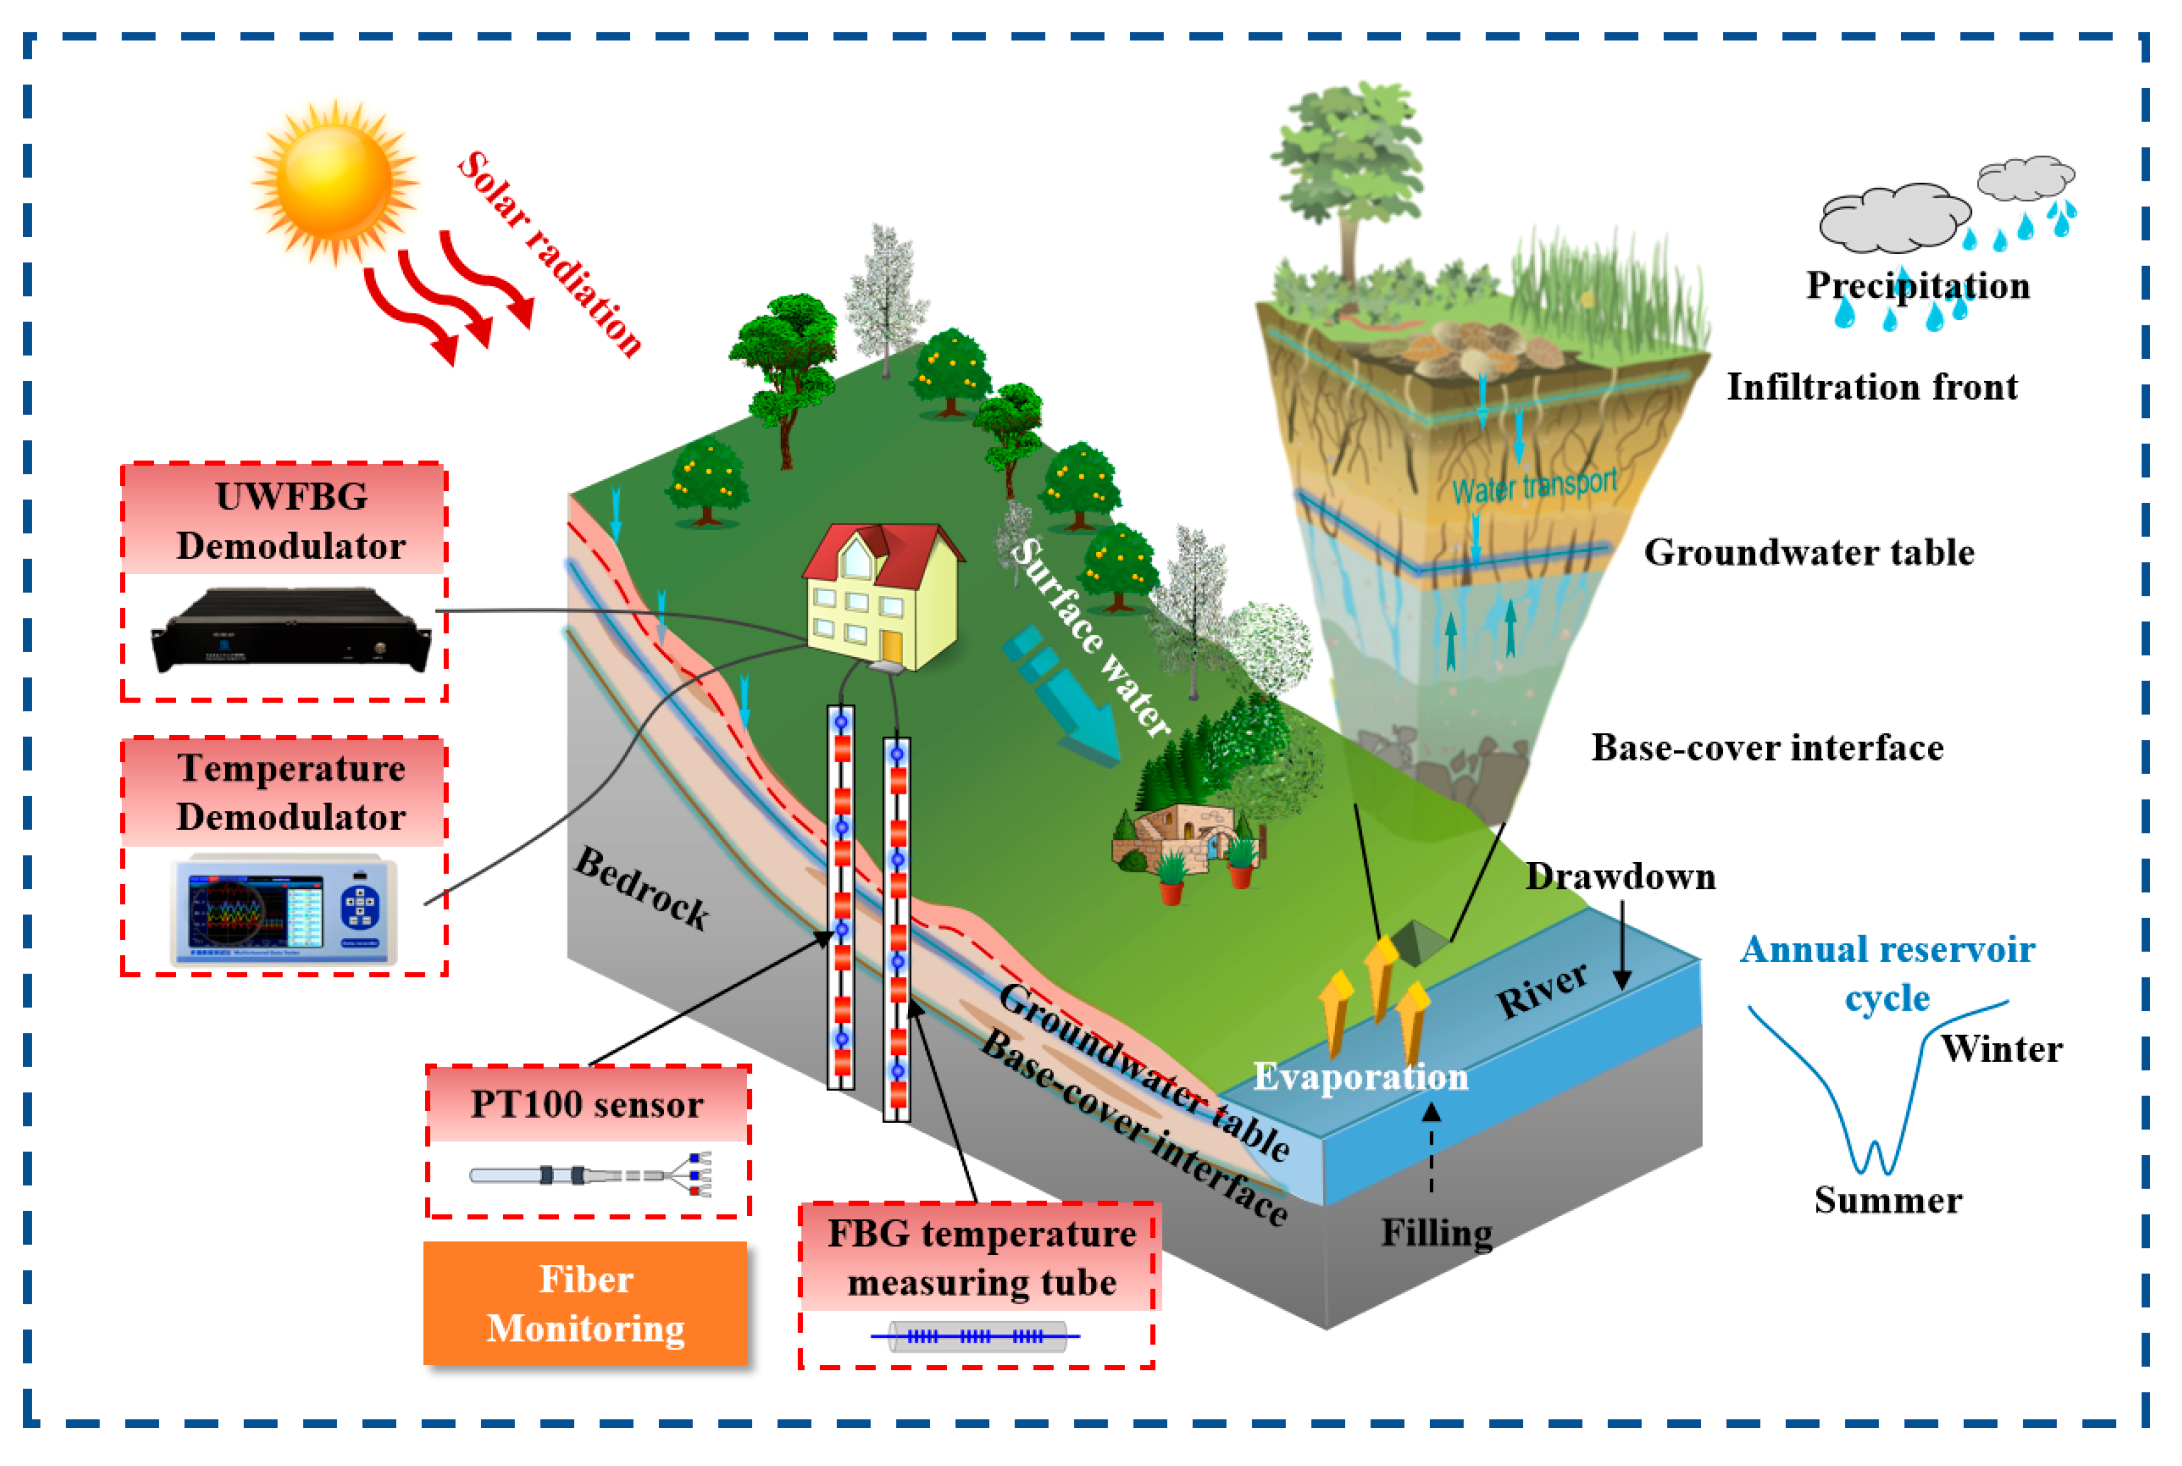
Based on the aforementioned distributed fiber optic sensing technology for slopes, we have initially achieved the comprehensive monitoring and dynamic analysis of the multi–field coupling effects of slopes, providing more comprehensive and precise data support for the slope stability assessment and disaster warning (
Figure 4). However, due to differences in the data accuracy, spatial resolution, and real–time performance among various monitoring technologies, and the need to further improve adaptability and synergy in complex geological environments, it is still necessary to strengthen research on intelligent analysis technology and continuously improve the overall efficiency and reliability of slope monitoring systems.
3. Research and Application of Fiber Optic Neural Perception in Slope Engineering
The instability and failure of slopes are often the result of multiple environmental and engineering factors, among which rainfall infiltration and human engineering activities (such as excavation and loading) are considered the two key disturbance factors that induce landslides [
20,
21,
22,
23,
24,
25]. Numerous studies have shown that construction disturbances, such as loading and excavation, in slope engineering can significantly alter the stress state of the rock and soil, leading to stress redistribution in the slope body [
26,
27]. Meanwhile, the effect of rainfall can cause significant changes in the pore water pressure, which in turn will have an impact on the deformation characteristics, failure mode, and stability of the slope. Therefore, conducting in–depth research on the stability of slopes under complex working conditions has important theoretical and engineering significance.
In order to reveal the deformation and failure mechanism of slopes under the coupling effect of loading and rainfall, and verify the applicability and progressiveness of distributed optical fiber sensing technology in slope monitoring, this paper carried out an indoor physical model experiment study of slopes based on optical frequency domain reflectometry (OFDR). OFDR technology has shown broad application prospects in the field of geological and geotechnical engineering monitoring due to its high spatial resolution, high measurement accuracy, and good resistance to electromagnetic interference [
28]. This technology can achieve a millimeter–level spatial resolution for strain and temperature distributed sensing within a range of 100 m, with a measurement accuracy of ±0.1 °C/±1.0 με. It has been widely used in monitoring geological disasters such as landslides, debris flows, and ground collapses. Using OFDR technology to conduct physical model experiments on slopes under loading and rainfall conditions can not only achieve the real–time monitoring of deformation and temperature fields inside the slope but also accurately locate potential failure areas of the slope. Based on this, the impact of multi–field coupling on slope stability can be revealed, providing technical support for the safety assessment and disaster warning of slope engineering.
3.1. Slope Loading Excavation Model Txperiment
3.1.1. Experimental Materials and Equipment
The physical model experiment system for the slope adopted in this experiment is mainly composed of the following components: a transparent acrylic material model box (1.0 m × 0.6 m × 0.5 m) and a slope model (1.0 m × 0.6 m × 0.35 m). The experimental material selected is typical yellow sand from the Suzhou area, and its initial moisture content is kept within the range of 7–8% through precise control. During the model construction process, a cross layout scheme was adopted: strain monitoring optical cables were arranged horizontally and vertically, while temperature monitoring optical cables were added vertically. The layered compaction and backfilling method was used to ensure the compactness of the soil, thereby achieving the dynamic monitoring of the strain and temperature distribution characteristics inside the slope. After the model was constructed, it was left to stand and cure for no less than 8 h. Then, by relying on the self–weight of the soil, the slope structure was made stable.
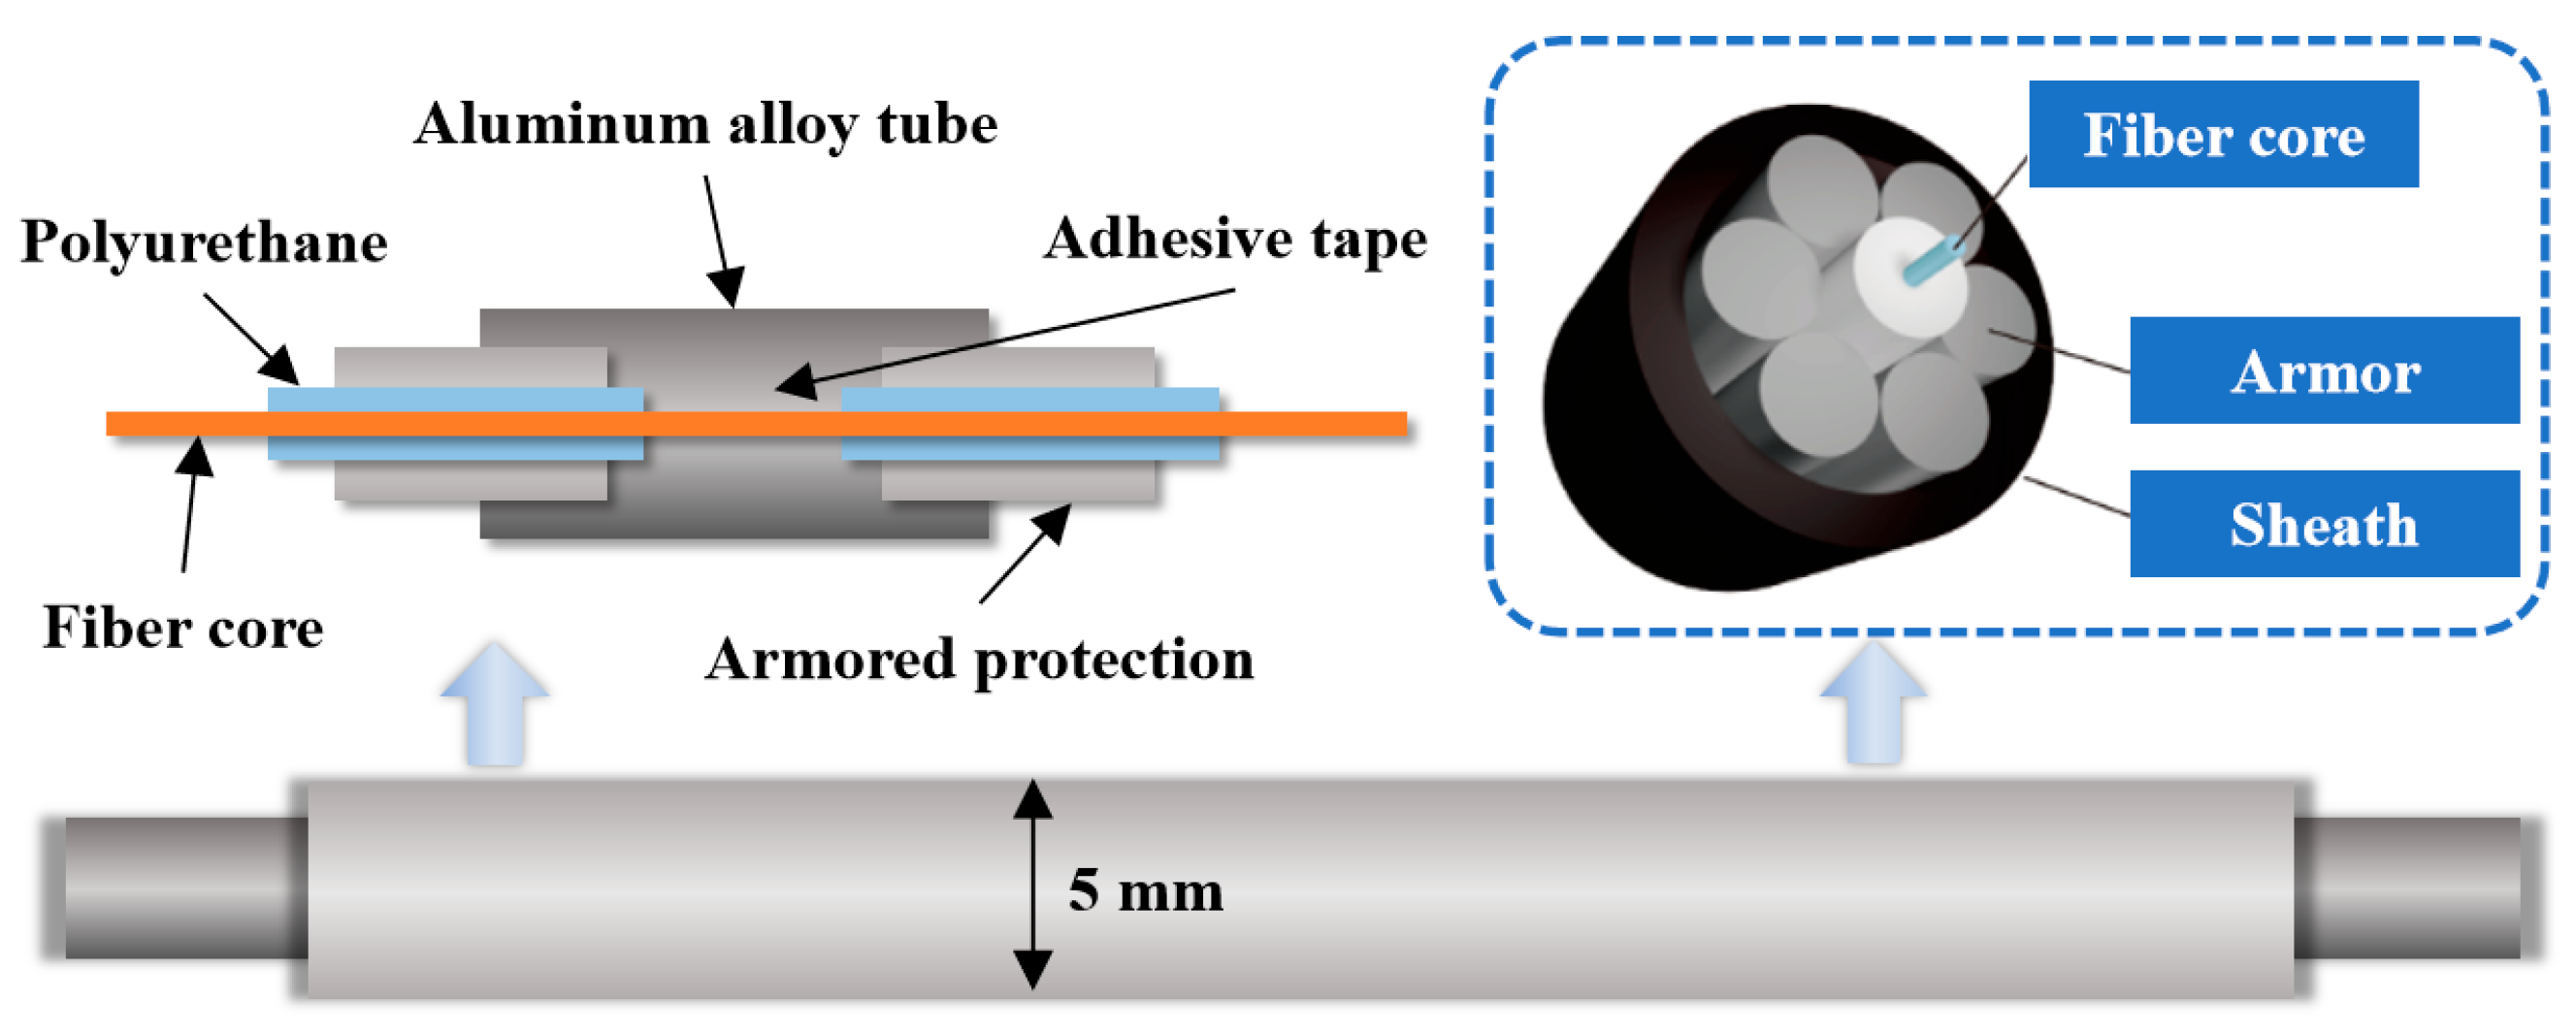
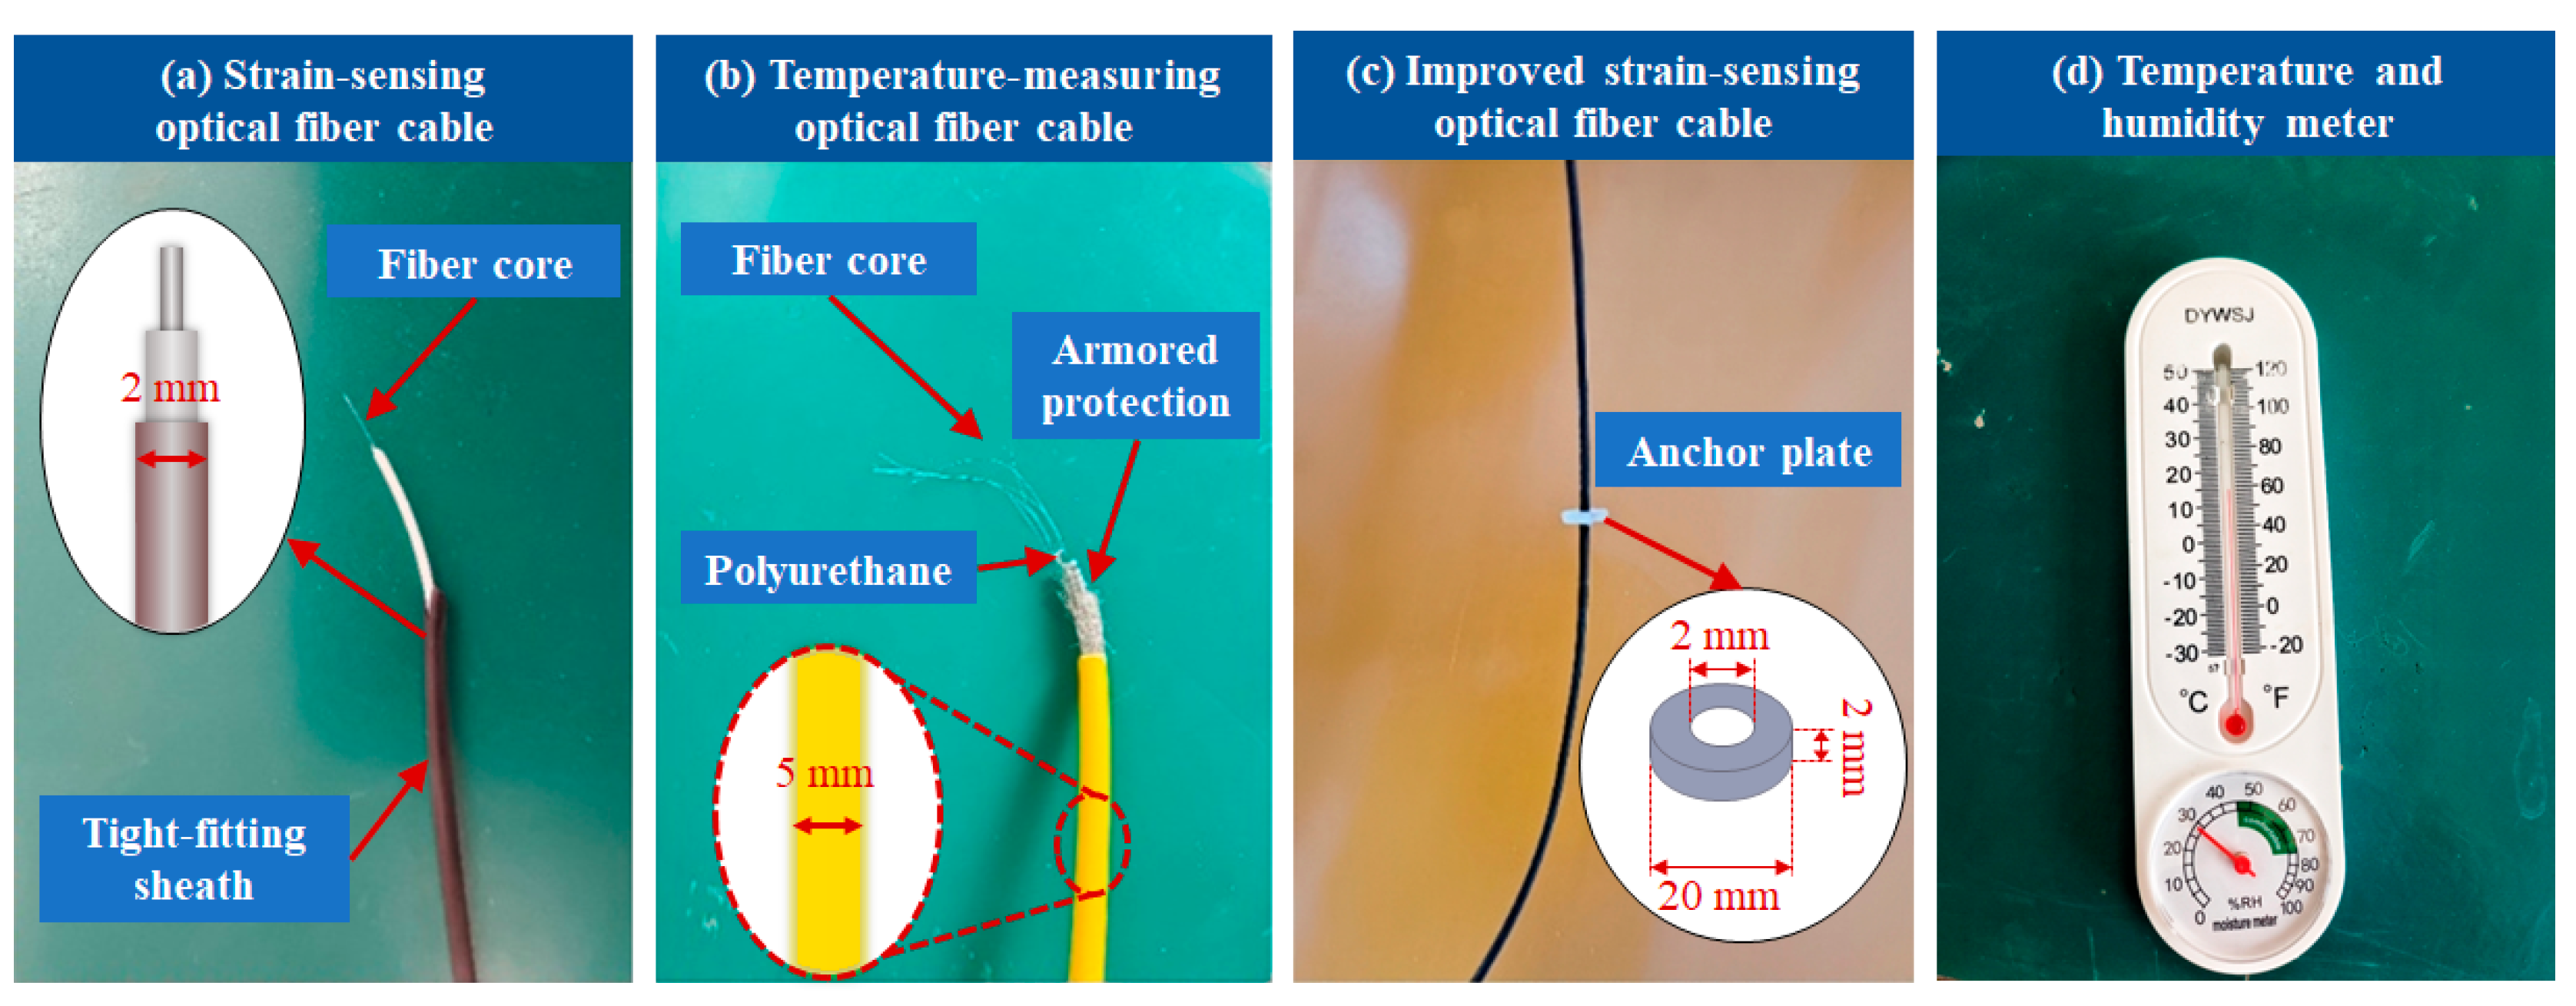
In terms of the selection and configuration of sensing optical cables, deformation monitoring adopts a specially designed tight–sheathed distributed strain sensing optical cable (diameter 2.0 mm). To improve sensing performance, an acrylic friction reinforcement device (outer diameter 20 mm, thickness 2 mm, central aperture 2 mm) was installed on the surface of the optical cable, significantly enhancing the strain transmission effect of the cable. The temperature monitoring uses a 5 mm diameter armored plastic sealed temperature sensing optical cable (
Figure 5), which significantly improves the anti–interference performance and temperature response characteristics. The experiment equipment is shown in
Figure 6.
The monitoring system integrates two advanced fiber optic demodulation technologies: optical frequency domain reflectometry (OFDR) and fiber Bragg grating (FBG). The specific equipment configuration includes a JUNNO OSI–C series OFDR demodulator and a NanZee Sensing NZS–FBG–A01 FBG demodulator. The technical parameters of the relevant equipment are detailed in
Table 2.
3.1.2. Experiment Scheme
This experiment constructs a spatially staggered distributed fiber optic sensing network architecture to synchronously collect real–time data on the strain field and temperature field of slope models under excavation loads. The specific deployment plan is as follows:
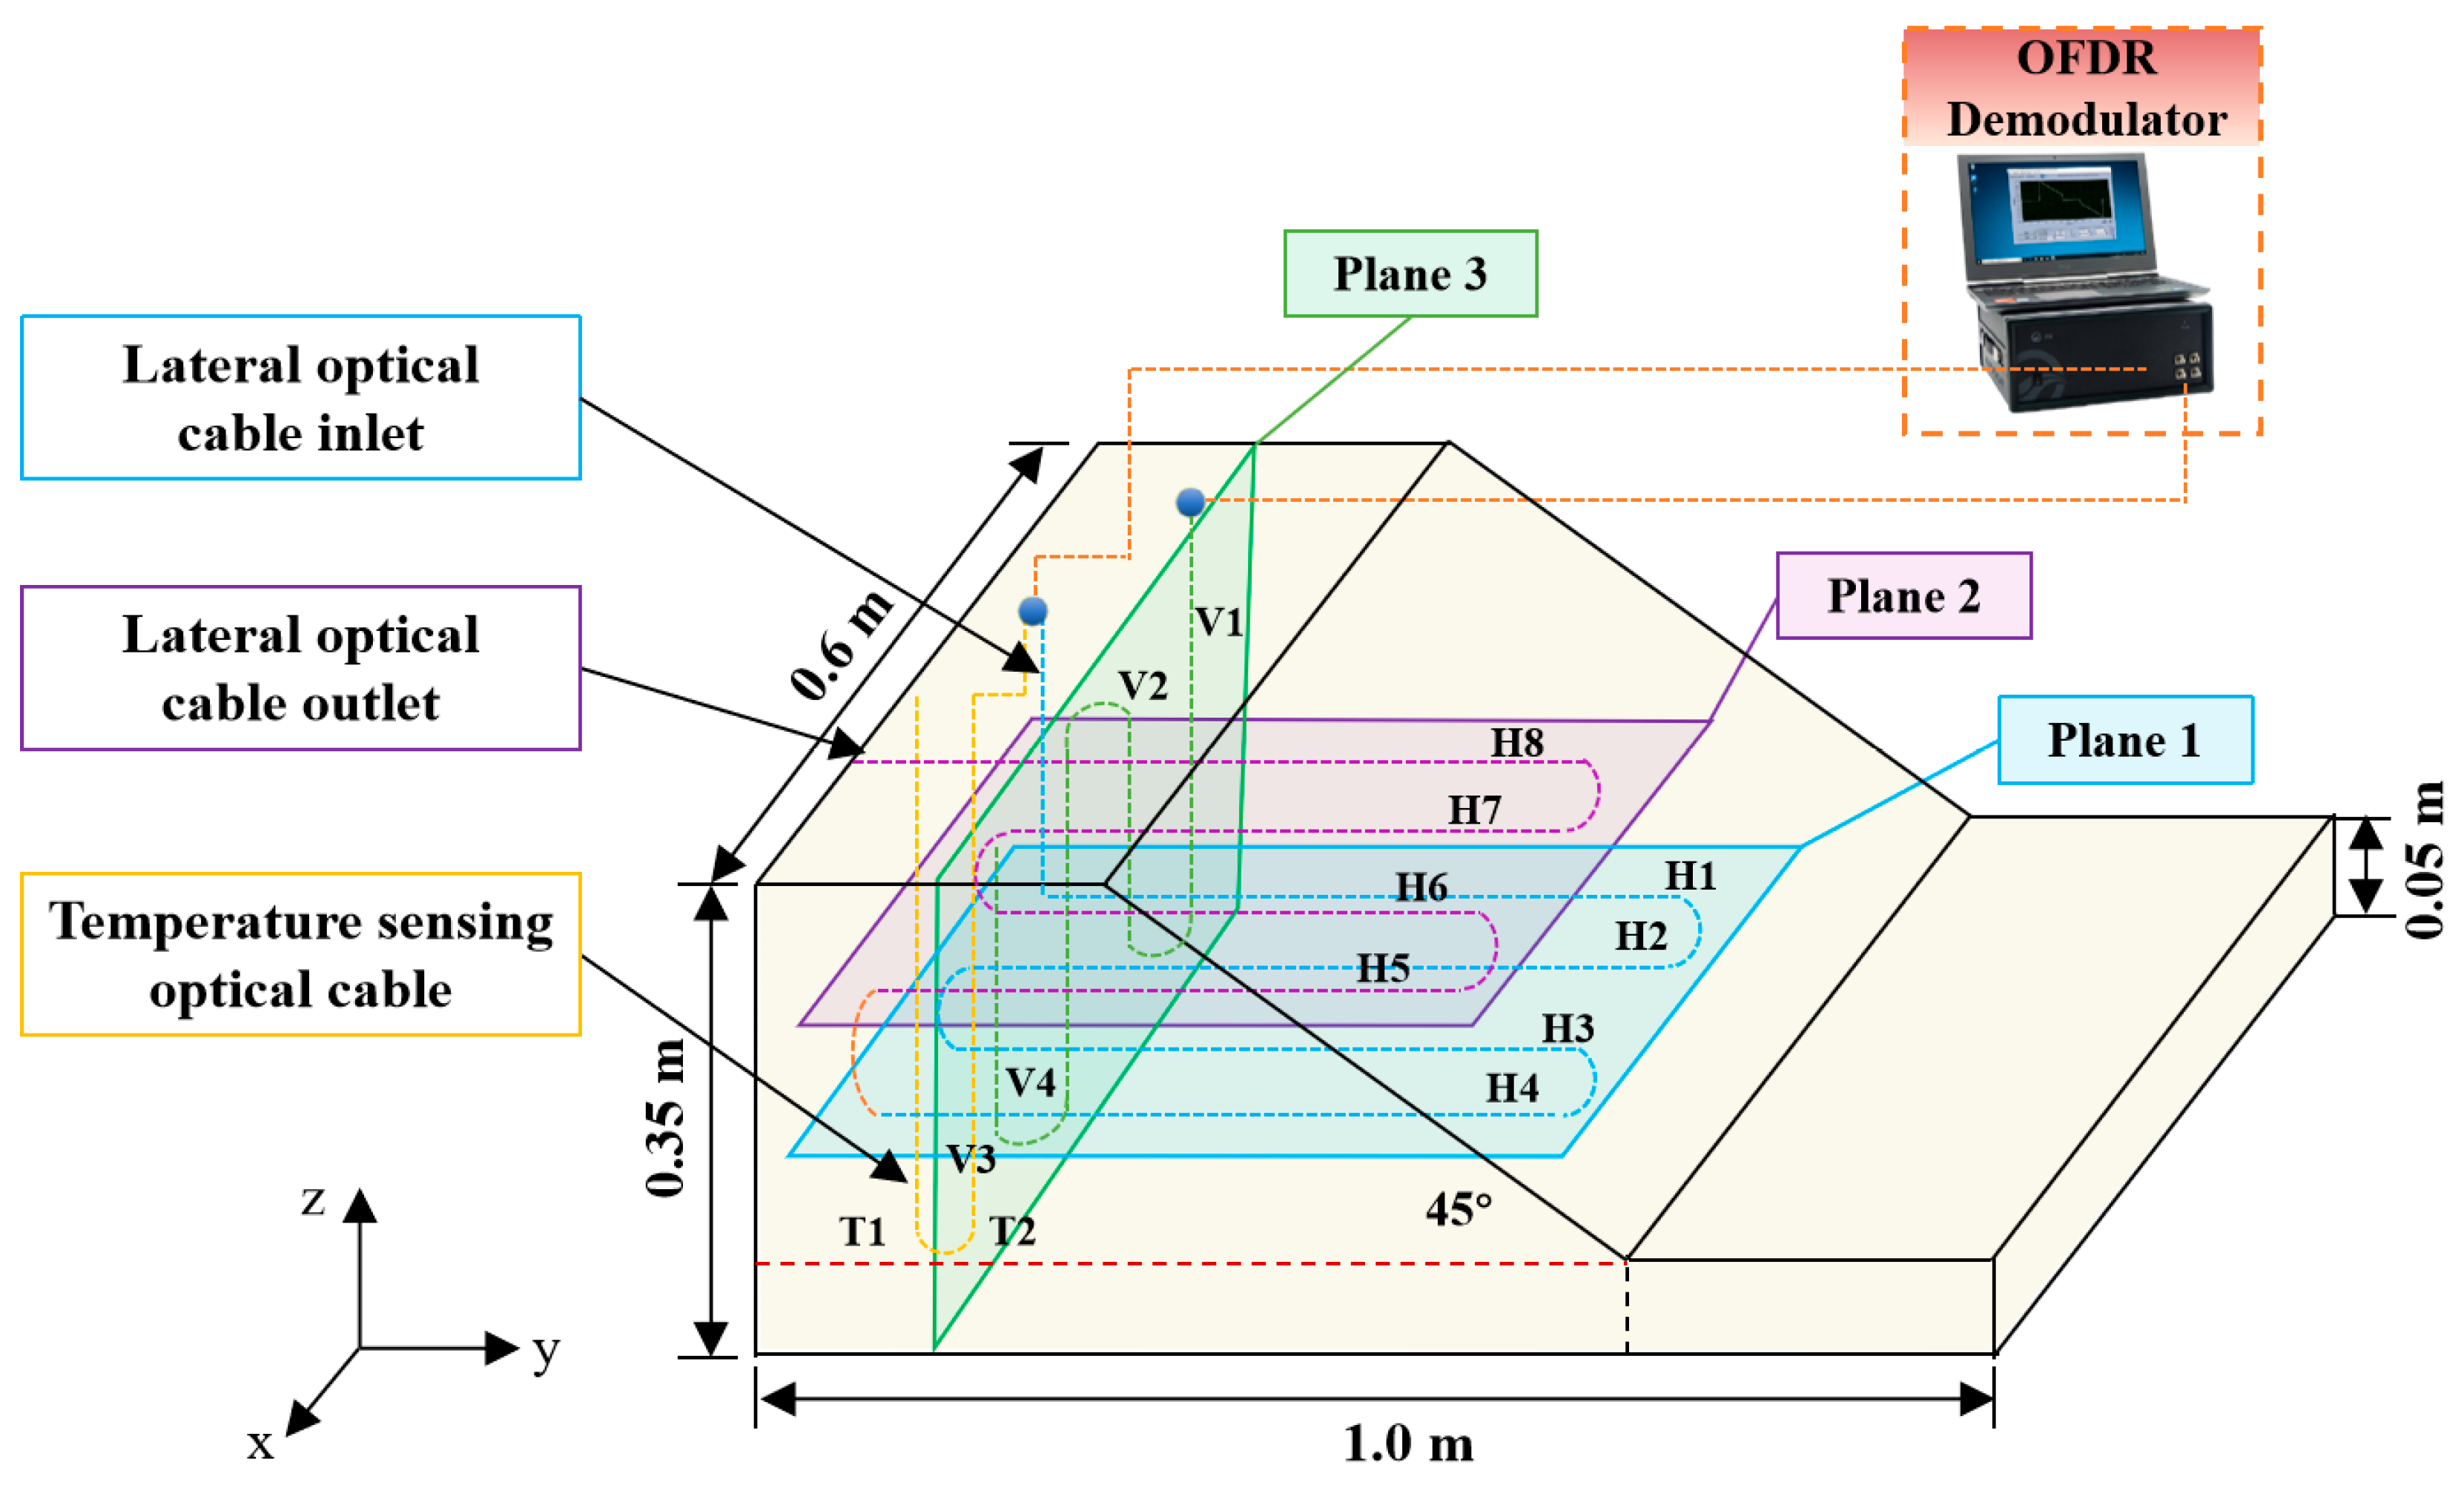
Set two monitoring planes along the vertical direction (Z–axis), located at depths of 0.15 m and 0.25 m below the reference plane of the slope top. The optical cables in each monitoring plane are arranged in a U–shaped loop topology with two sets of sensing optical cables, totaling 8 effective monitoring sections, numbered H1–H8 in sequence.
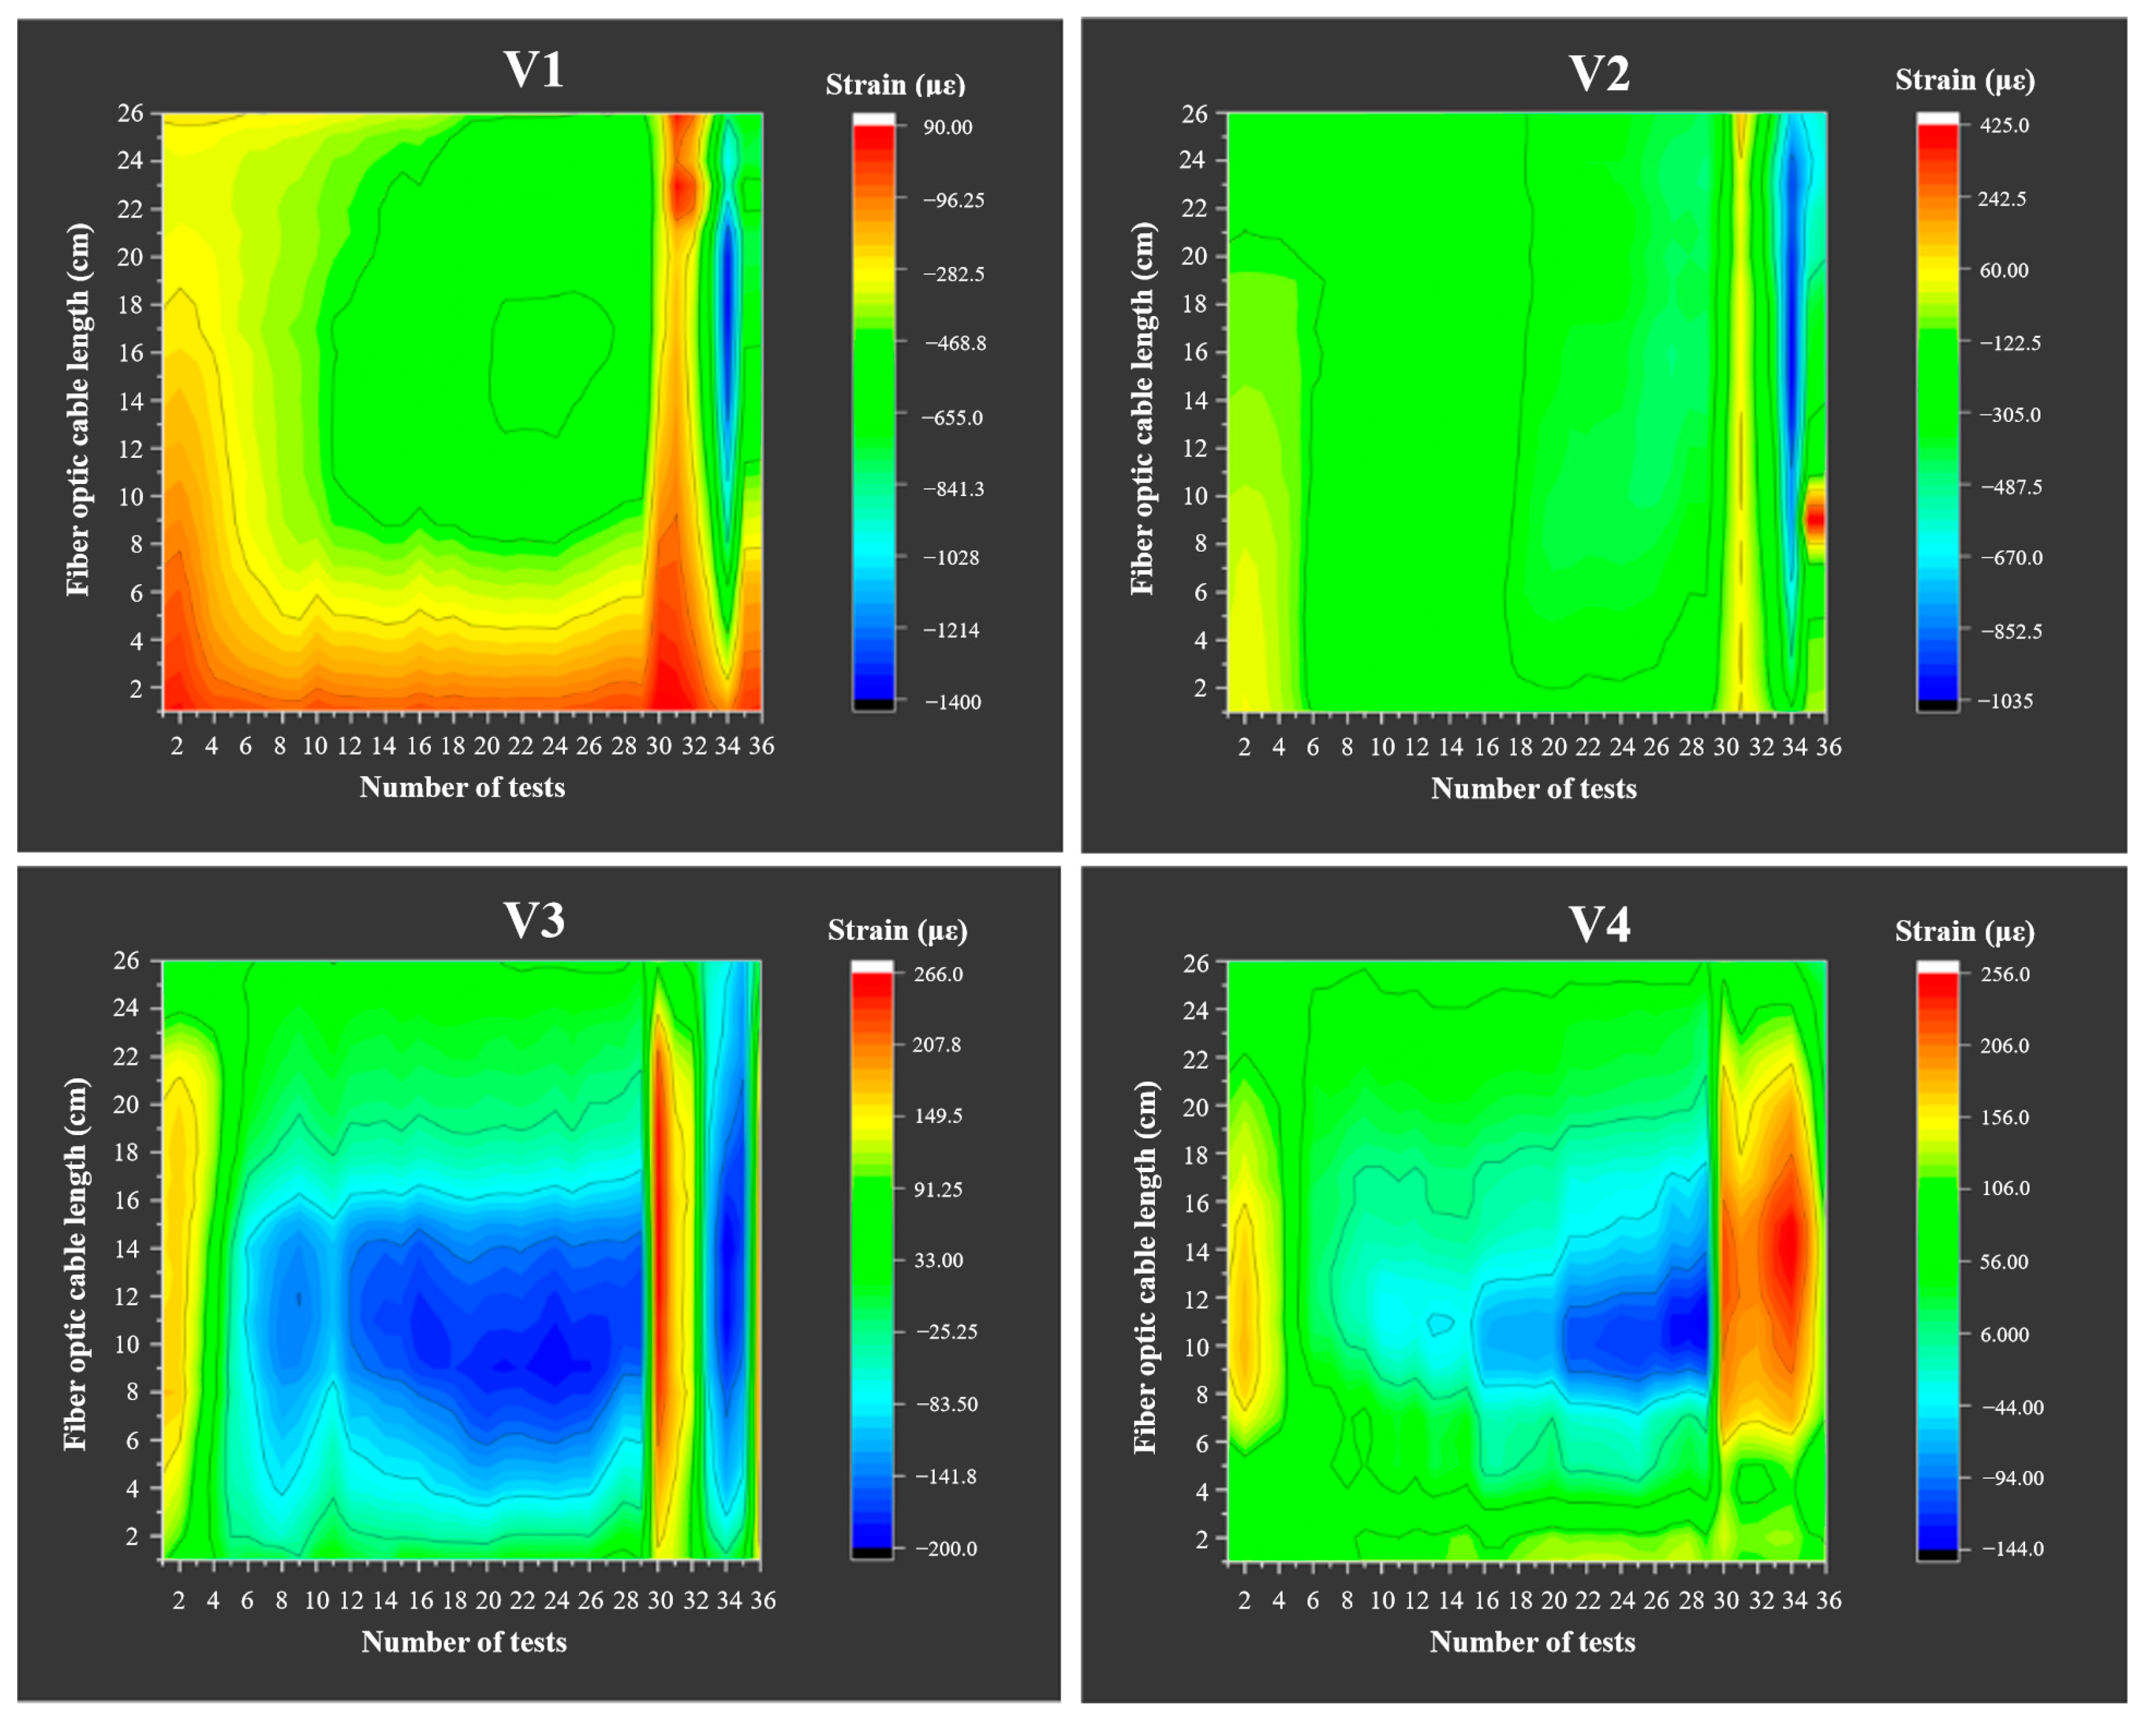
Four vertical sensing optical cables are laid on the longitudinal section of the model, with horizontal coordinates of 0.1 m, 0.2 m, 0.3 m, and 0.4 m (numbered V1–V4) from the left boundary. Each vertical optical cable is also laid in a U–shape. To ensure the verticality of the optical cable, a PVC conduit is installed at the top of the model as a geometric reference frame.
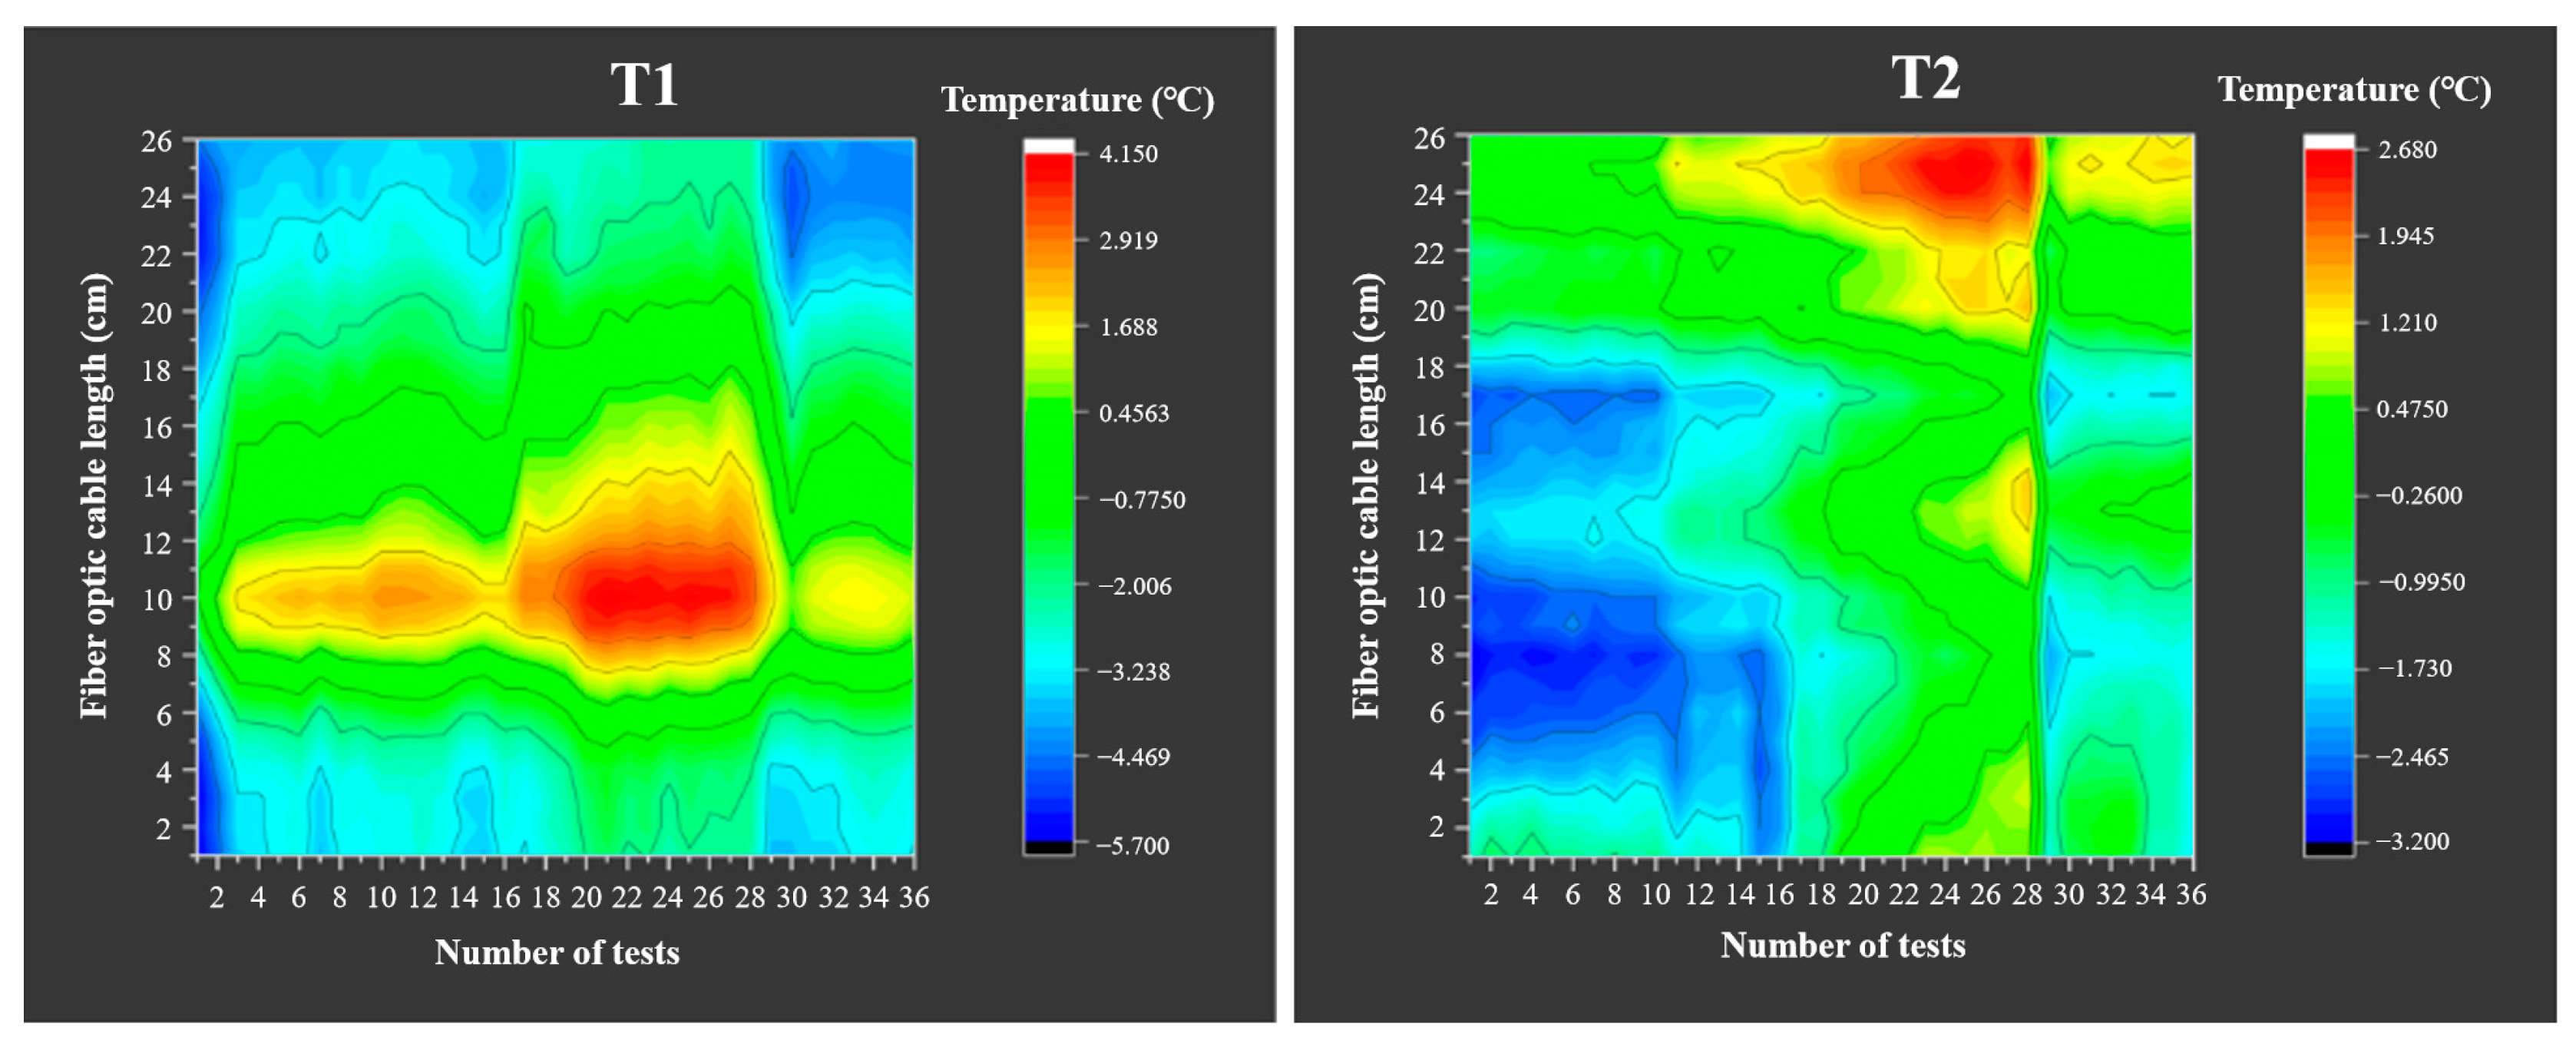
In addition, two longitudinal temperature sensing optical cables (T1, T2) are installed at the center position 0.1 m away from the boundary on the inner side of the slope top, using a U–shaped topology structure to achieve real–time dynamic monitoring of temperature changes inside the model. The spatial layout of horizontal and vertical optical cables in the model is shown in
Figure 7.
3.1.3. Experimental Flow
This experiment adopts a combination of graded loading and progressive excavation to study the deformation and failure characteristics of slope models under load. The specific experimental steps are as follows:
(1) Graded loading stage: The weight grading loading method is used, with an increment of 10 kg per stage until the total load reaches 200 kg. After each loading stage, the model is left to stand for 5 min until deformation stabilizes, and then the strain and temperature data from the optical cables are collected.
(2) Initial excavation stage (load of 200 kg): When the load reaches 200 kg, according to real–time monitoring data, significant strain has been generated inside the model slope. At this time, the model was left to stand for 30 min before excavation. The excavation position is located at the foot of the slope and adopts a layered excavation method, with a depth of 3 cm for each layer and an excavation area of 2 cm × 2 cm. A total of seven excavations were conducted in the experiment.
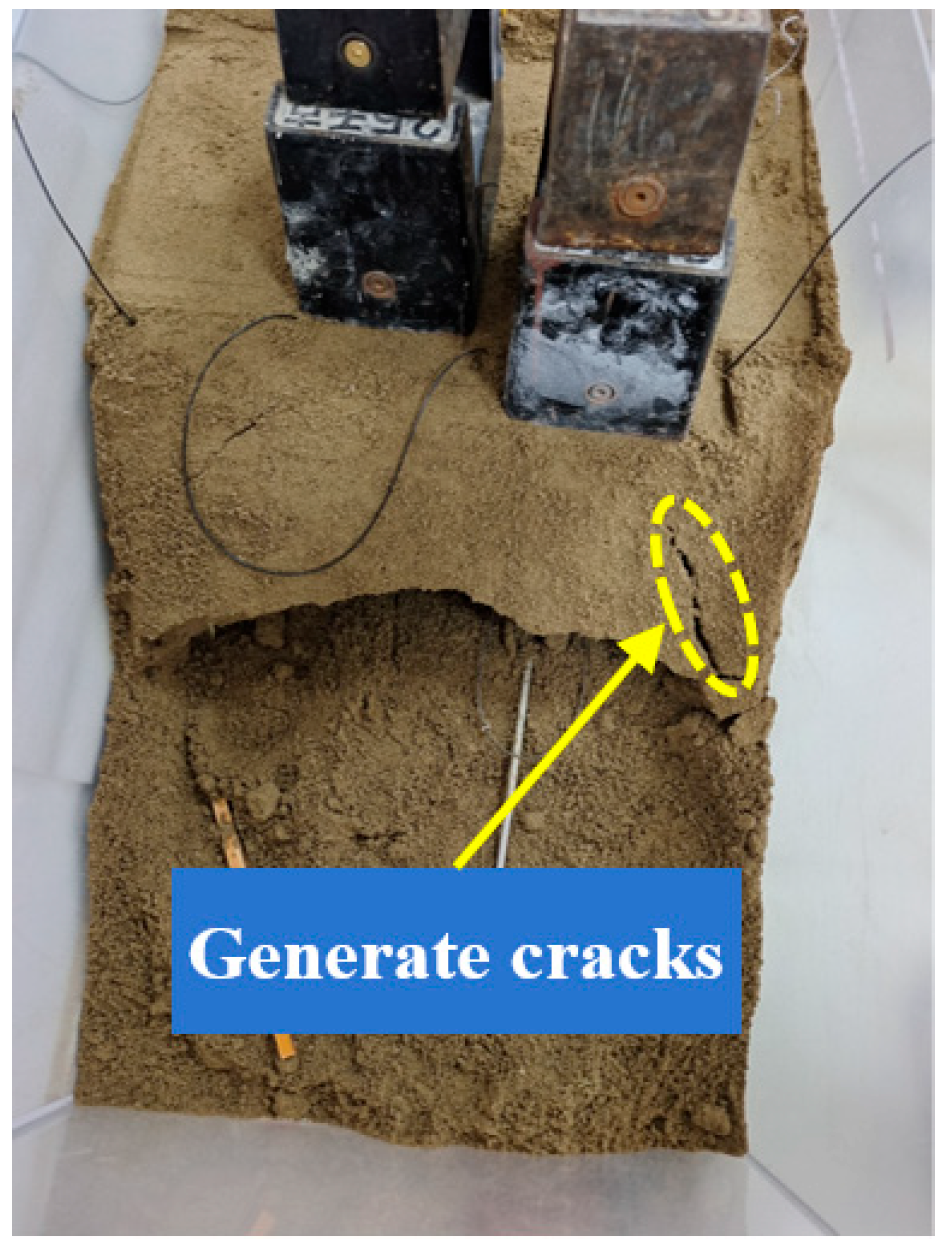
(3) Destruction development stage: After the 7th excavation, obvious cracks and local collapse appeared on the slope. At this time, all loads were removed and left to stand for 60 min. Subsequently, the 8th excavation was carried out, and the deformation of the slope rapidly intensified, and further collapse occurred.
(4) Limit loading stage: The slope enters the critical instability state, and additional loads of 70 kg, 100 kg, and 120 kg are applied to the top of the slope in sequence. When the load increases to 120 kg, the model undergoes large–scale overall collapse.
During the experiment, the evolution law of the slope from initial deformation to final failure was systematically observed through the coupling effect of load excavation.
3.1.4. Conclusion of Slope Loading and Excavation Model Experiment
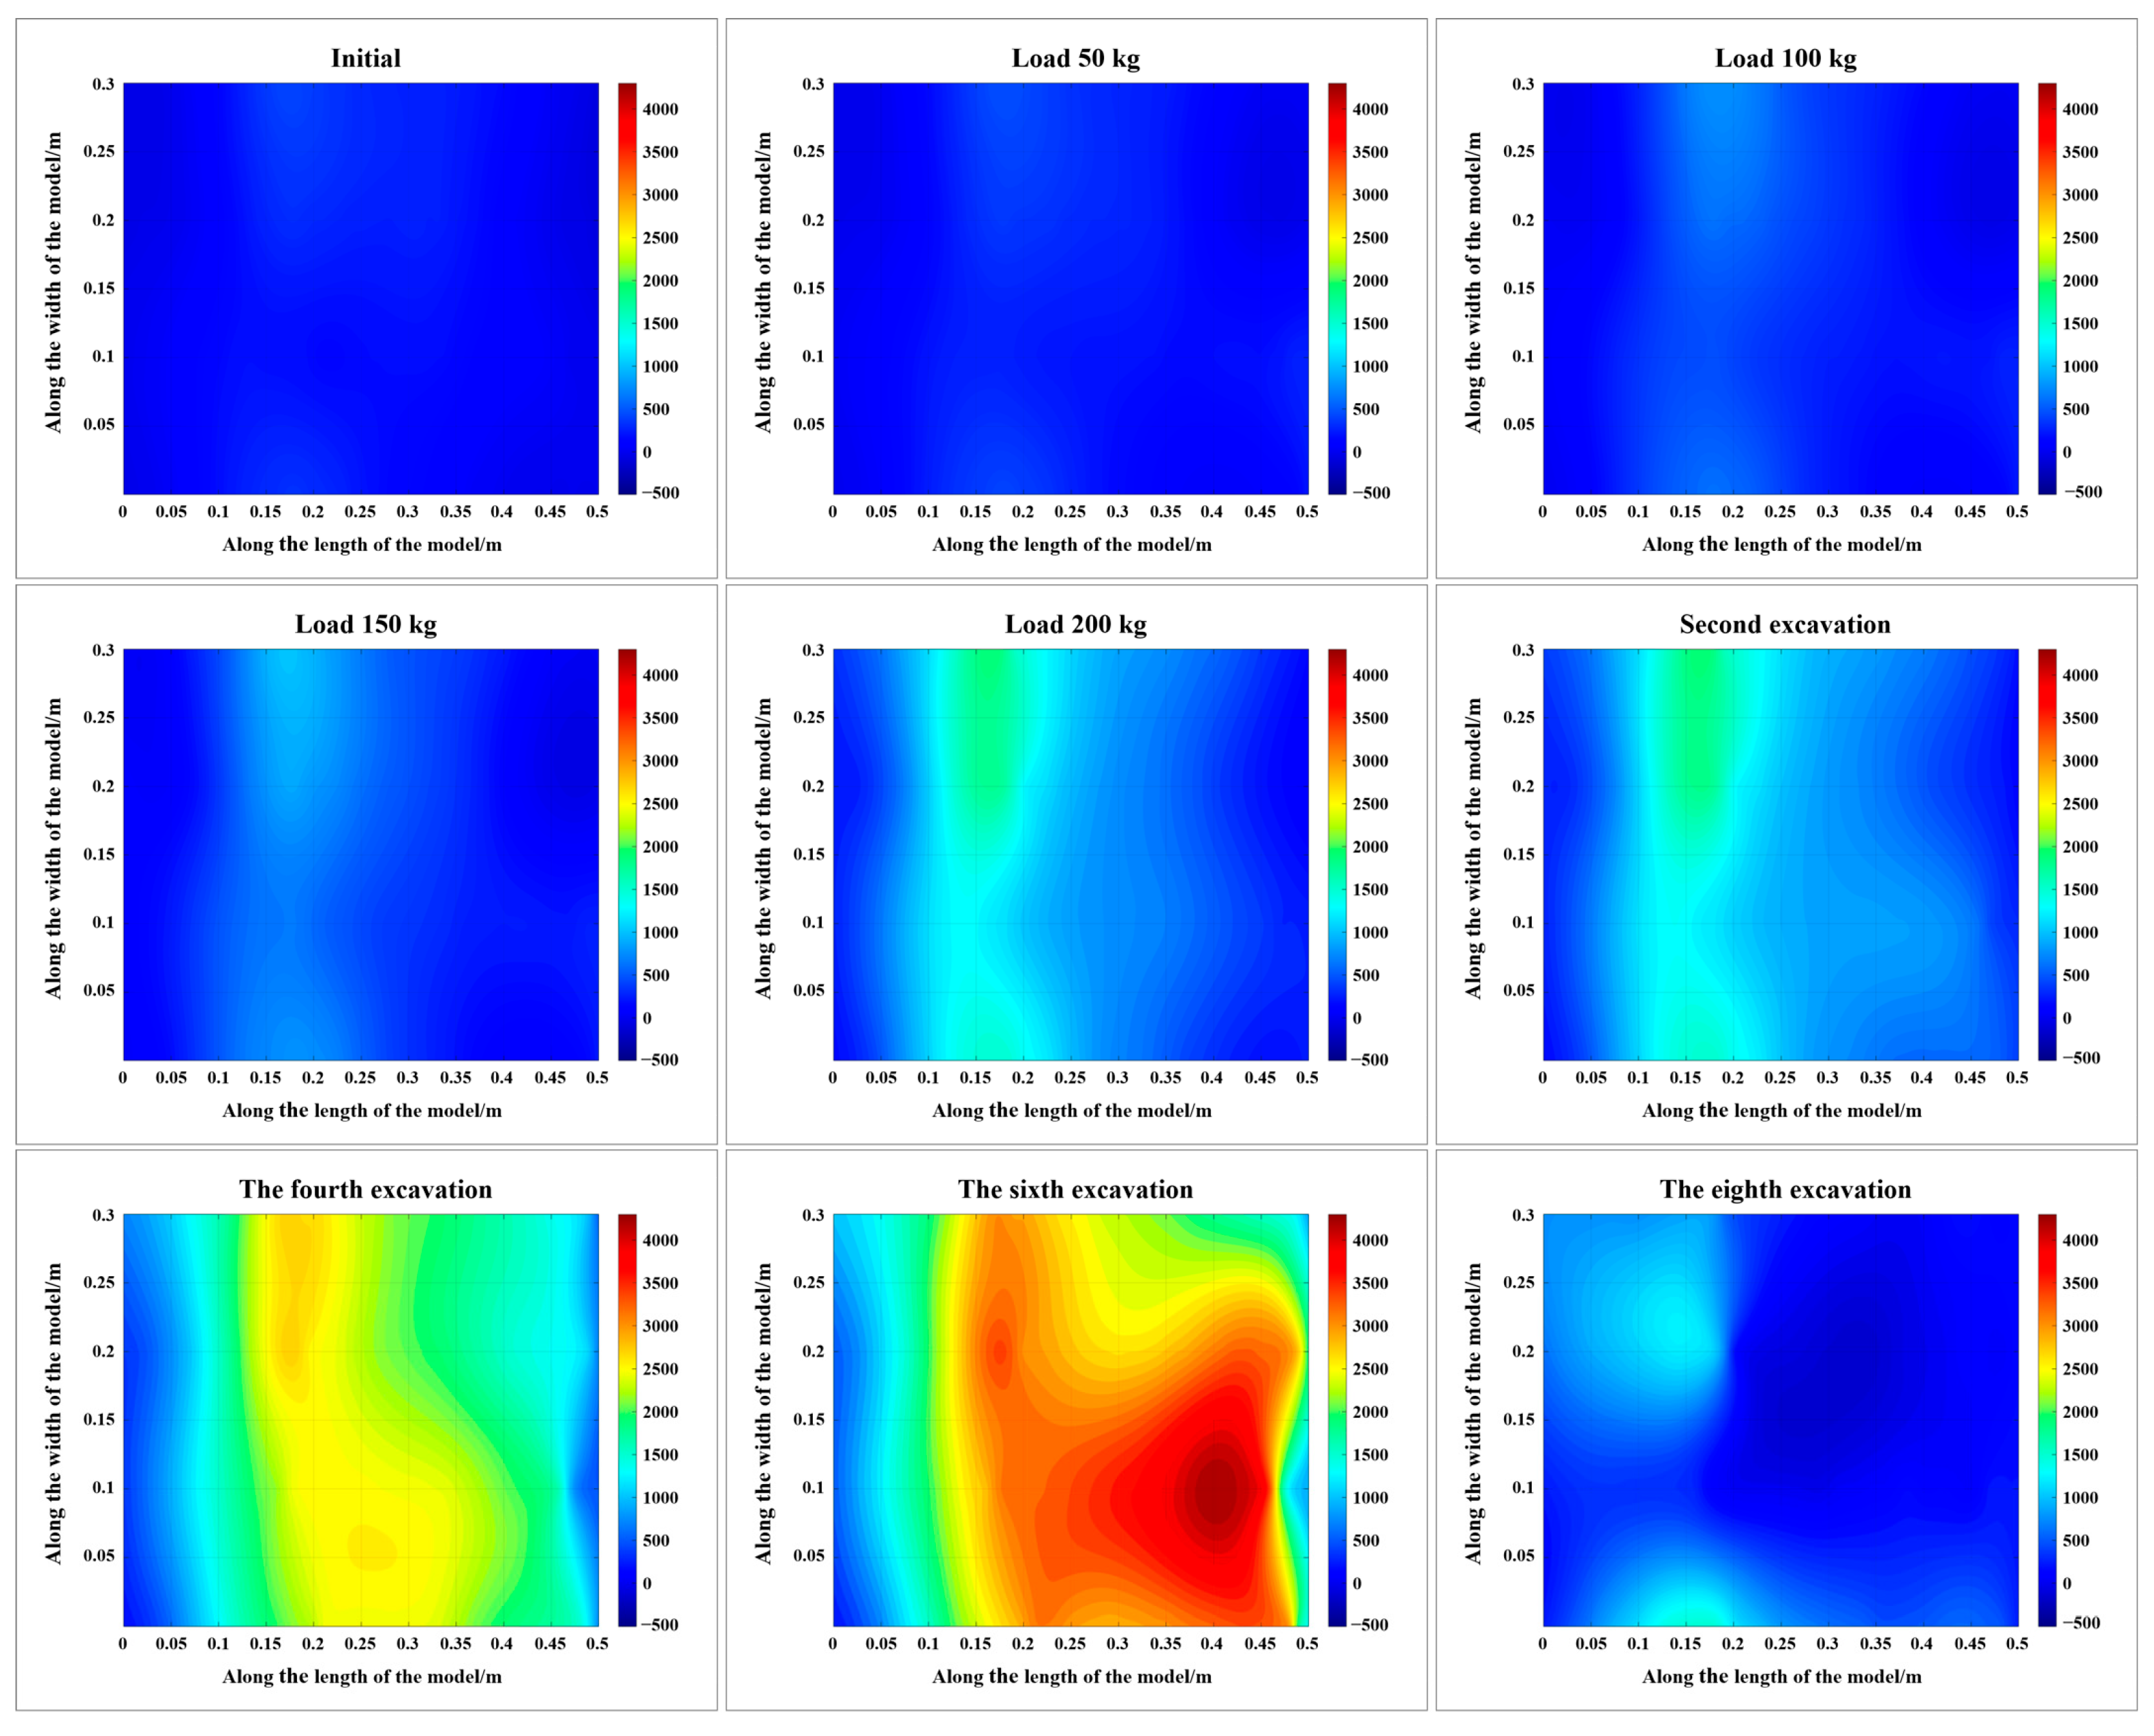
According to the above experimental steps, a total of 36 sets of strain and temperature change data were measured. The cloud maps of the transverse monitoring planes P1 and P2 are shown in
Figure 8 and
Figure 9, respectively; the longitudinal profile monitoring cloud map is shown in
Figure 10; the local failure inside the slope after the second loading of 70 kg is shown in
Figure 11; and the temperature measurement line monitoring cloud map is shown in
Figure 12.
(1) As shown in
Figure 8, as the load increases from 0 to 200 kg, the strain value gradually increases. When the load reaches 200 kg, the maximum strain reaches 1920 με, indicating that the deformation inside the slope gradually increases with the increase in load. At the same time, as the excavation continues, the strain distribution range inside the slope gradually expands, and there is a phenomenon of alternating positive and negative strain values, indicating that the slope has undergone local compression and tension deformation under the excavation disturbance. The above variation characteristics are clearly demonstrated by the strain cloud maps of the second to eight excavations in
Figure 8.
(2) As shown in
Figure 9, under the same load conditions, the maximum strain value of the P2 plane reaches 3500 με, which is significantly higher than that of the P1 plane (1950 με). After the sixth excavation, a clear band–shaped high–strain zone (2500–4000 με) appeared in the strain cloud map, until the eighth excavation when the area was connected, and obvious cracks appeared at the corresponding slope position. In the 34th to 35th excavation experiments, significant peak compressive strain was observed in the local monitoring area, which was caused by the sliding of the slope and the sliding of the loading weight directly acting on the exposed optical cable, resulting in abnormal secondary disturbance at the corresponding position of the optical cable.
(3) By comparing the strain monitoring maps of the P1 plane and the P2 plane, it can be seen that during the staged loading and sequential excavation process, the strain distribution range of the P2 plane is wider, which is consistent with the phenomenon that the shallow rock and soil layers slip first when a landslide occurs.
(4) From the initial state to when a load of 200 kg was applied, the strain values of the longitudinal V1–V4 optical cables all showed a significantly increasing trend (
Figure 10), and the increase rate was positively correlated with the load value. The variation in longitudinal strain is directly related to the disturbance caused by the excavation at the toe of the slope. During the sixth to eighth excavation stages, the high–strain areas gradually spread from V1 to V2 and V3. The strain values at some measurement points changed from positive to negative, and a tension–compression conversion phenomenon occurred. At this time, a local collapse occurred at the corresponding slope body.
(5) As the experiment was conducted indoors, according to the temperature monitoring data in
Figure 12, the temperature change amplitude during the experiment was relatively small, and the temperature change mainly came from the driving effect of energy changes inside the slope: during the stage of the increasing load, the compression and compaction of the rock and soil mass are accompanied by trace frictional heat generation, leading to an increase in temperature; after the landslide occurred, the sliding surface was exposed to the air, causing the heat to dissipate rapidly. At this time, the temperature monitoring data of the optical cable showed a significant decreasing trend.
3.2. Slope Rainfall Model Experiment
3.2.1. Experimental Materials and Equipment
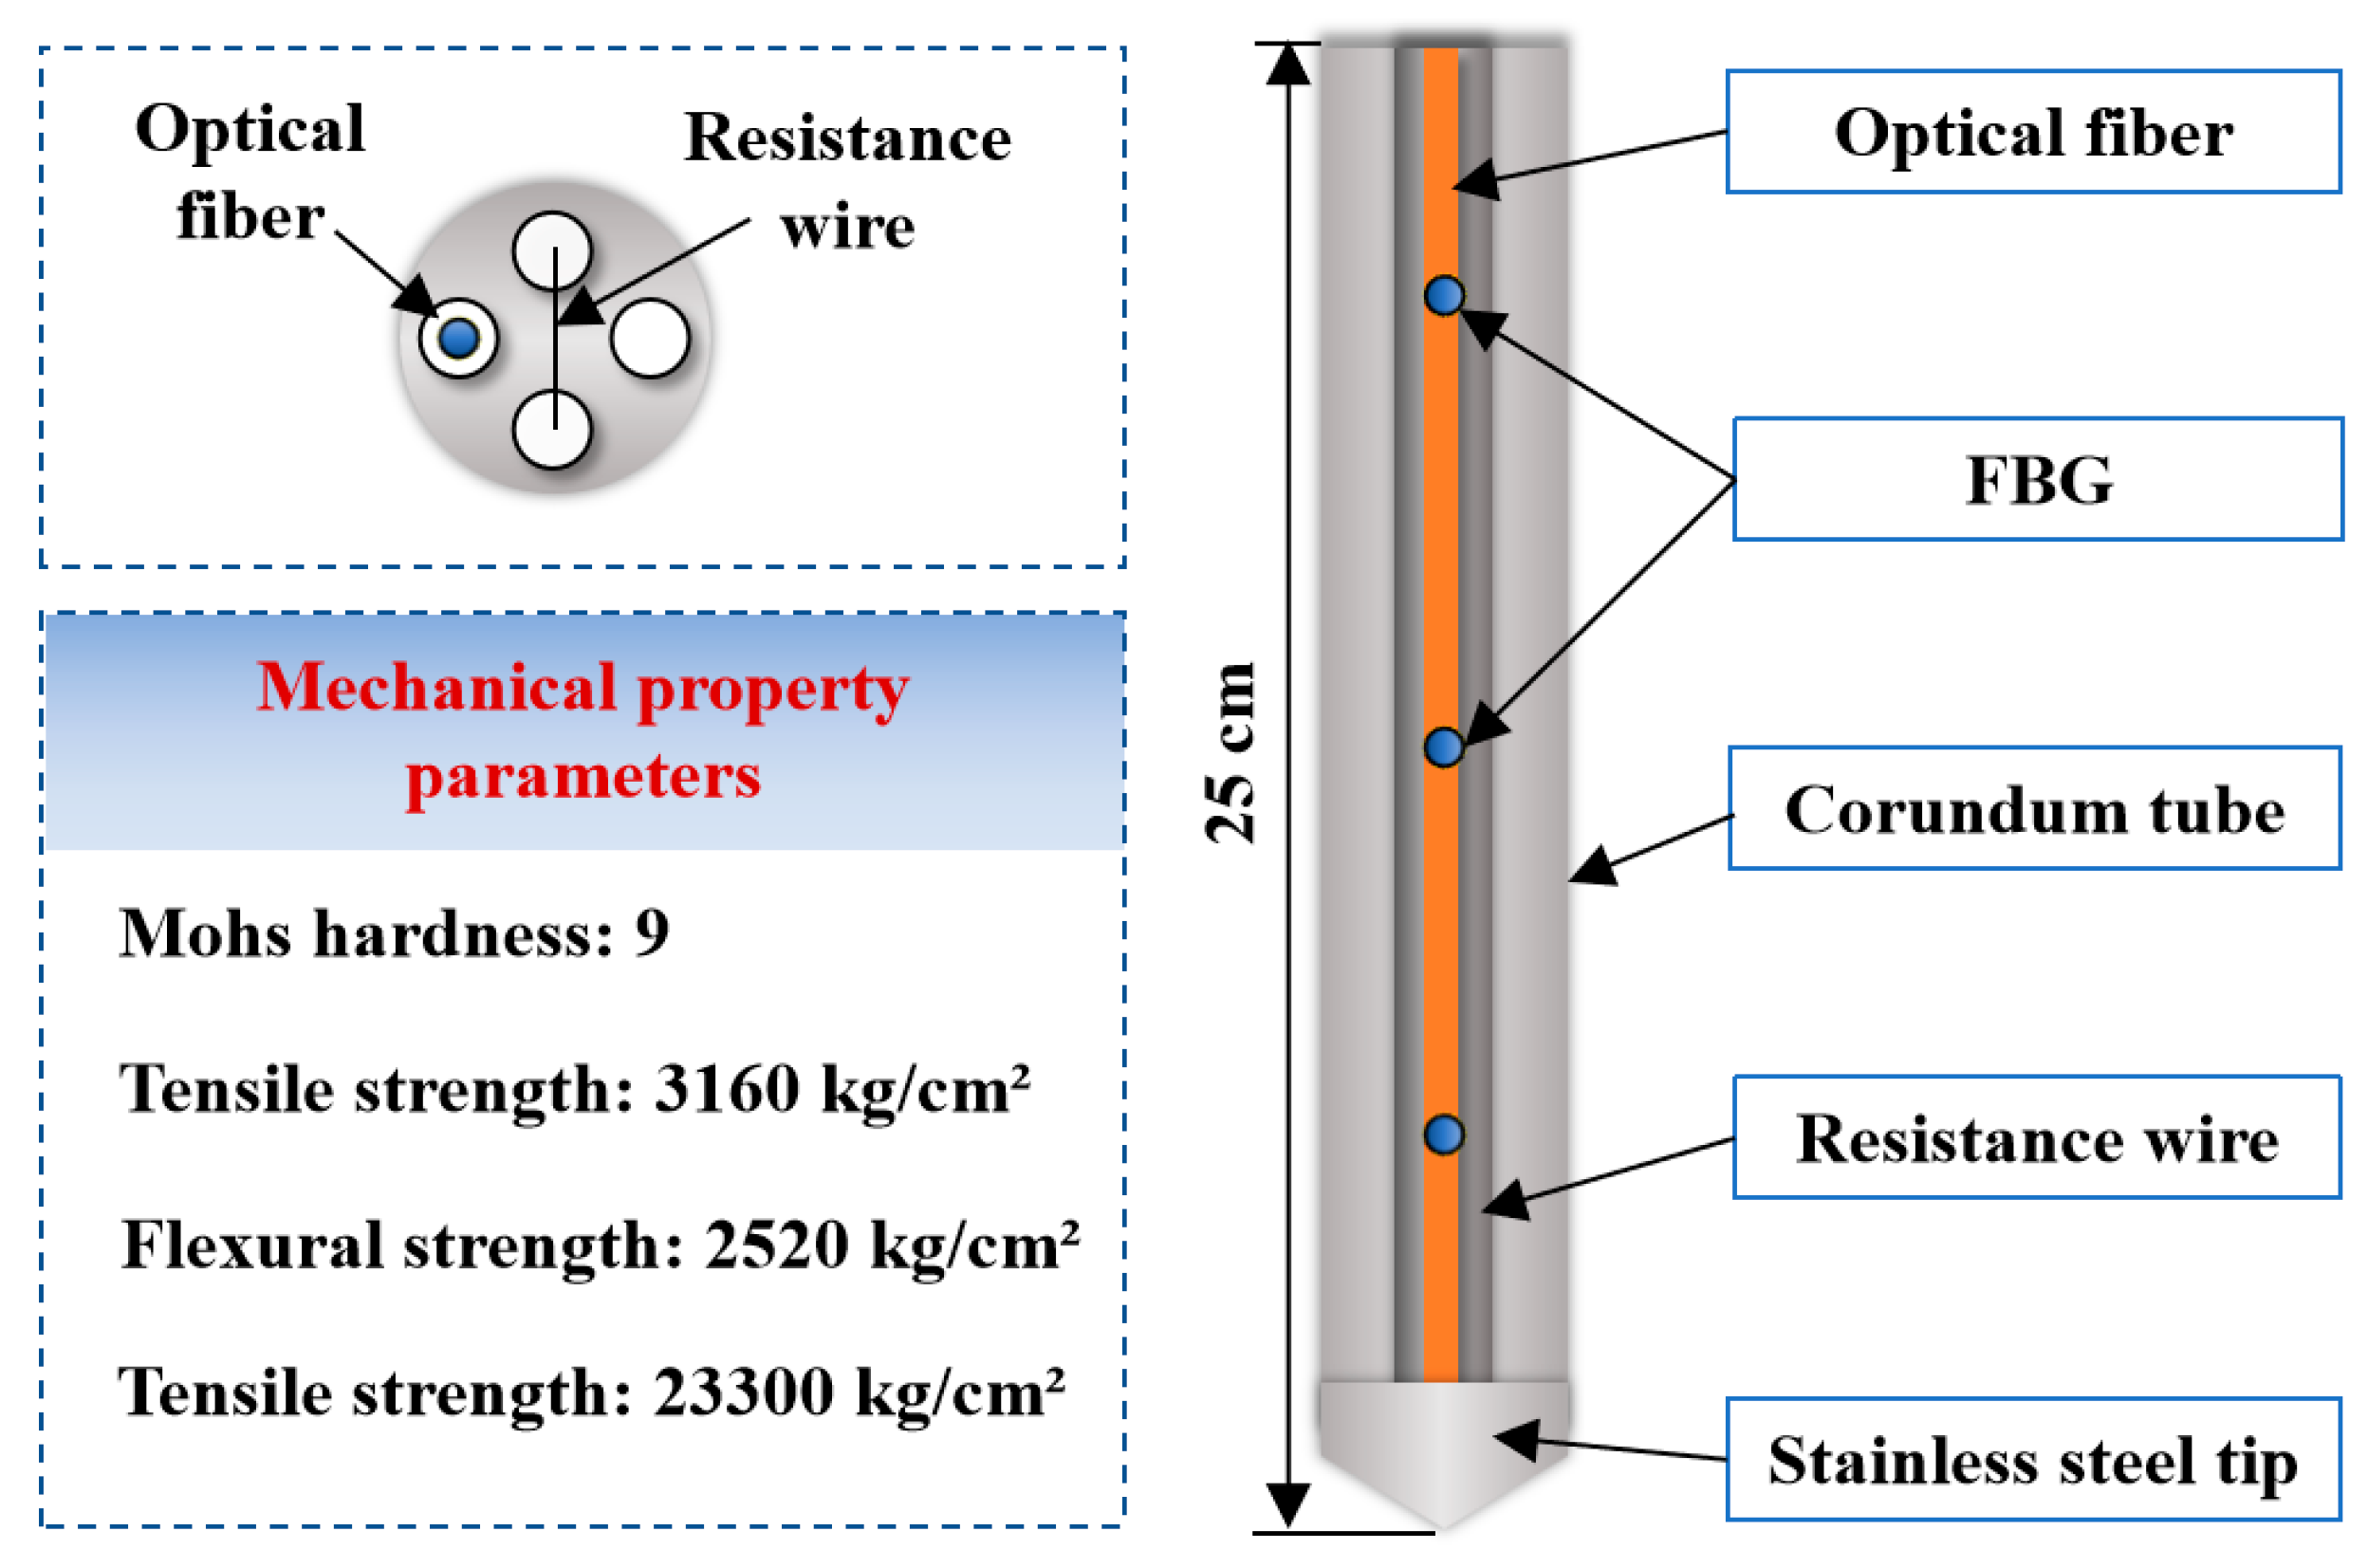
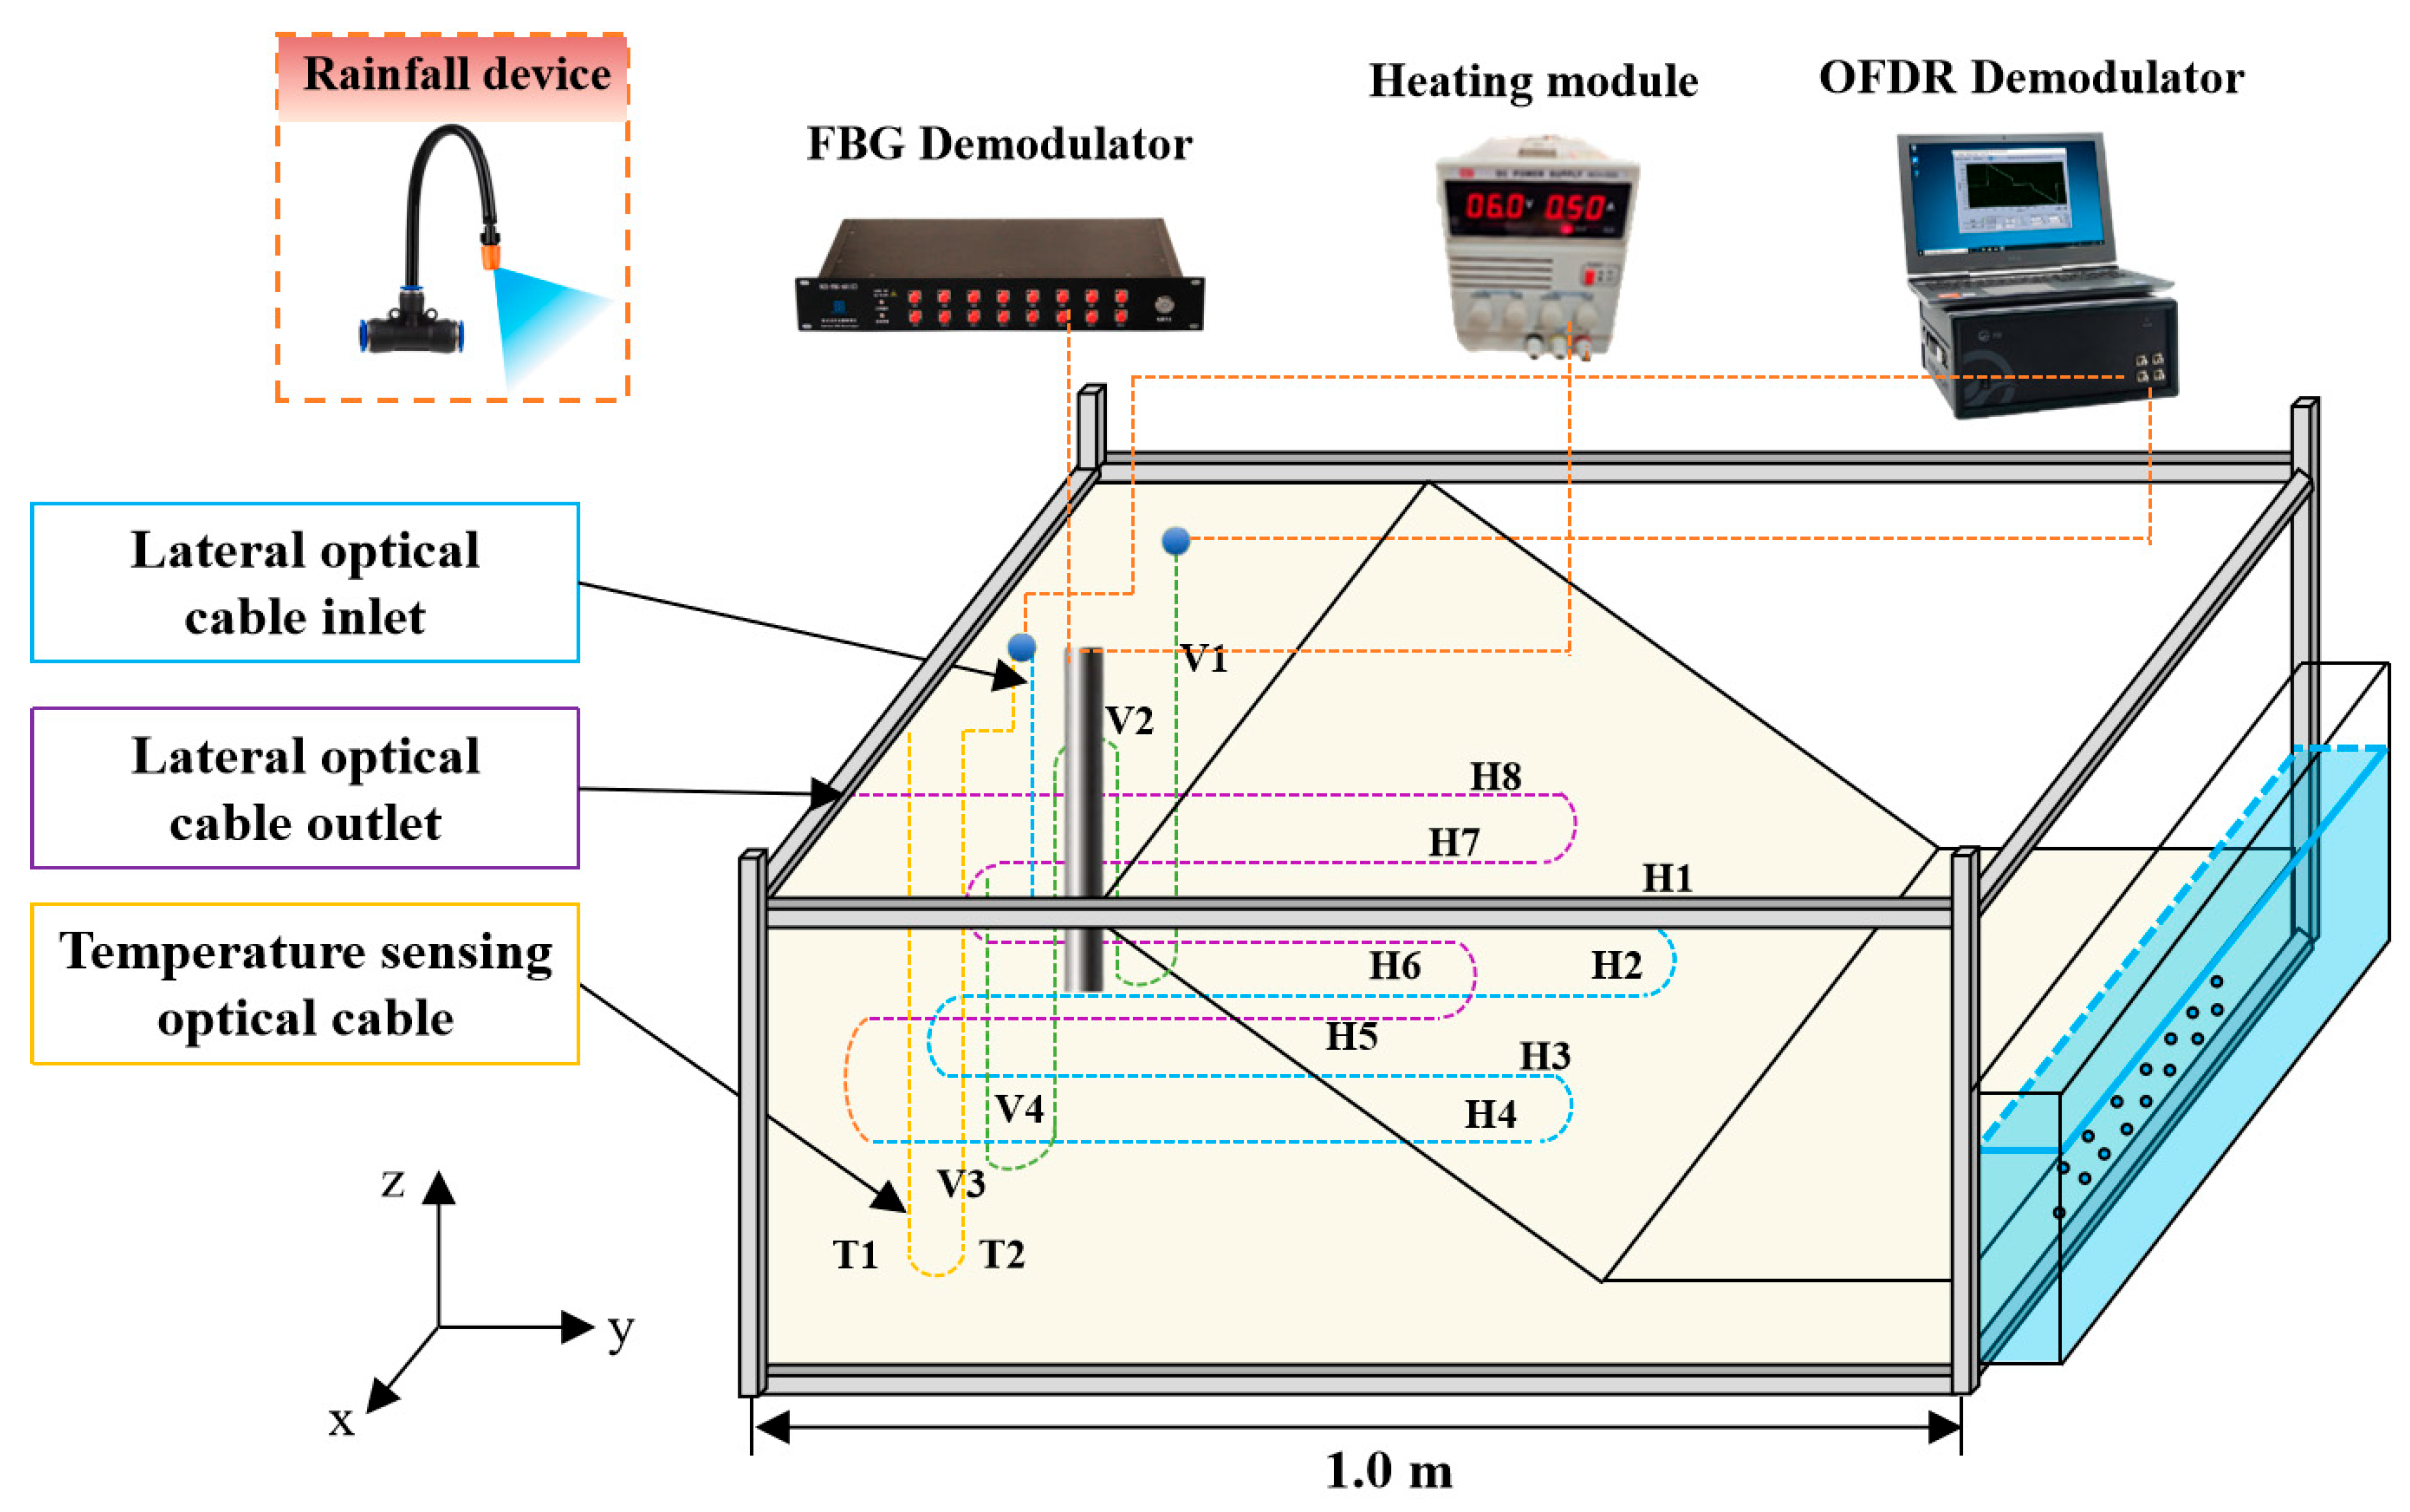
In order to conduct slope rainfall experiments, the model box was improved by adding rainfall and drainage devices, as well as corundum pipes for monitoring the soil moisture content, on the basis of the original model box, to simulate the process of the sand water injection and pumping in the slope model. The experiment used a 25 cm long FBG corundum tube to monitor the soil moisture content. The mechanical property parameters and structure of this tube are shown in
Figure 13. Meanwhile, a heating module and an FBG demodulator (NZS–FBG–A01) were equipped for the corundum tube to accurately measure the moisture content within the soil.
3.2.2. Experiment Scheme
In this experiment, a cross–distributed optical fiber sensing network was employed to conduct real–time monitoring of the lateral and longitudinal strains as well as the temperature of the slope model under rainfall conditions. Meanwhile, corundum tube sensors were embedded inside the model to dynamically acquire the data on the changes in the soil moisture content during the rainfall infiltration process. The specific layout of the experiment is shown in
Figure 14.
This experiment uses a 25 cm long corundum tube sensor, with three fiber Bragg grating measuring points arranged along the axis of the tube, corresponding to positions 10 cm, 15 cm, and 20 cm below the model slope, to obtain the moisture content data of the soil at different depths. The preparation work for the experiment is as follows: Firstly, measure the initial resistance value of the corundum tube to ensure that it maintains an output power of 15 W/m (the heating module parameters are set to voltage of 6 V and current of 0.5 A). Secondly, conduct sensor calibration experiments to establish the conversion relationship between FBG temperature characteristic values and the soil moisture content.
3.2.3. Experimental Flow
This experiment uses intermittent rainfall loading to study slope stability. The specific implementation steps of the experiment are as follows:
(1) Rainfall loading: After obtaining the initial state monitoring data of the slope, the slope model was subjected to seven cycles of rainfall. Each rainfall lasted for 1 min, and the interval between each two rainfalls was set at 60 min.
(2) Moisture content monitoring: Start the heating module 30 min after each rainfall to heat the corundum tube, with a heating duration of 20 min. Furthermore, the steady–state data at the 15th minute of the heating stage were selected for calculating the soil moisture content, and a 40 min cooling period was reserved to ensure the reliability of the monitoring results for the next cycle.
(3) Data collection: Fiber optic strain and temperature data of the slope were collected 2 min and 25 min after each rainfall, ensuring the immediacy of the rainfall loading and the stability of the slope condition. A total of 15 sets of comparative data were obtained throughout the entire experiment.
(4) Slope failure: After the seventh rainfall, the soil was in a high moisture content state, and local sliding occurred on the slope. Subsequently, a 20 kg concentrated load was applied at the top of the slope. Under the combined effect of the rainfall and the concentrated load, the slope underwent extensive progressive failure, indicating that saturated soil can experience instability under relatively small loads.
3.2.4. Conclusion of Slope Rainfall Model Experiment
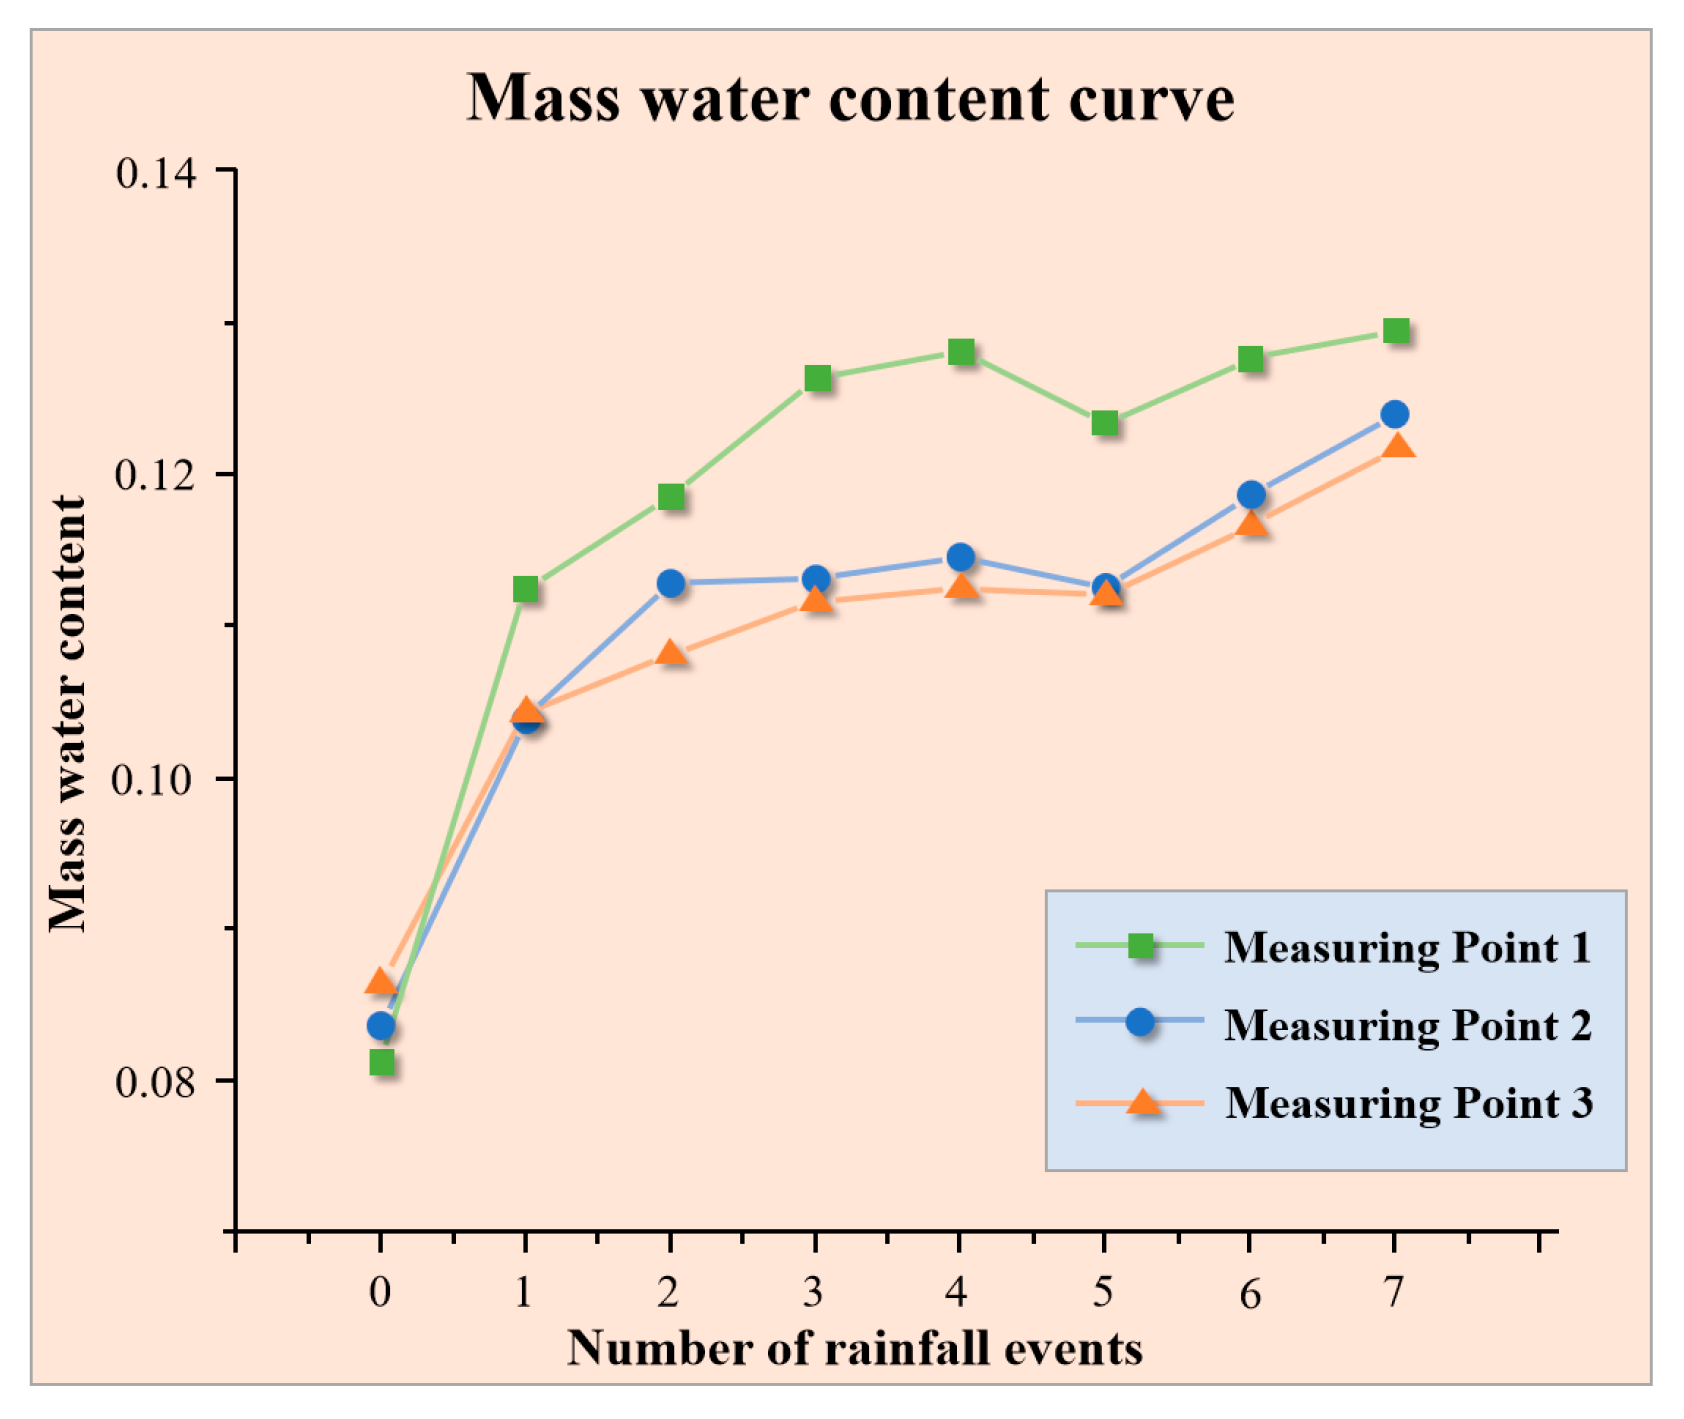
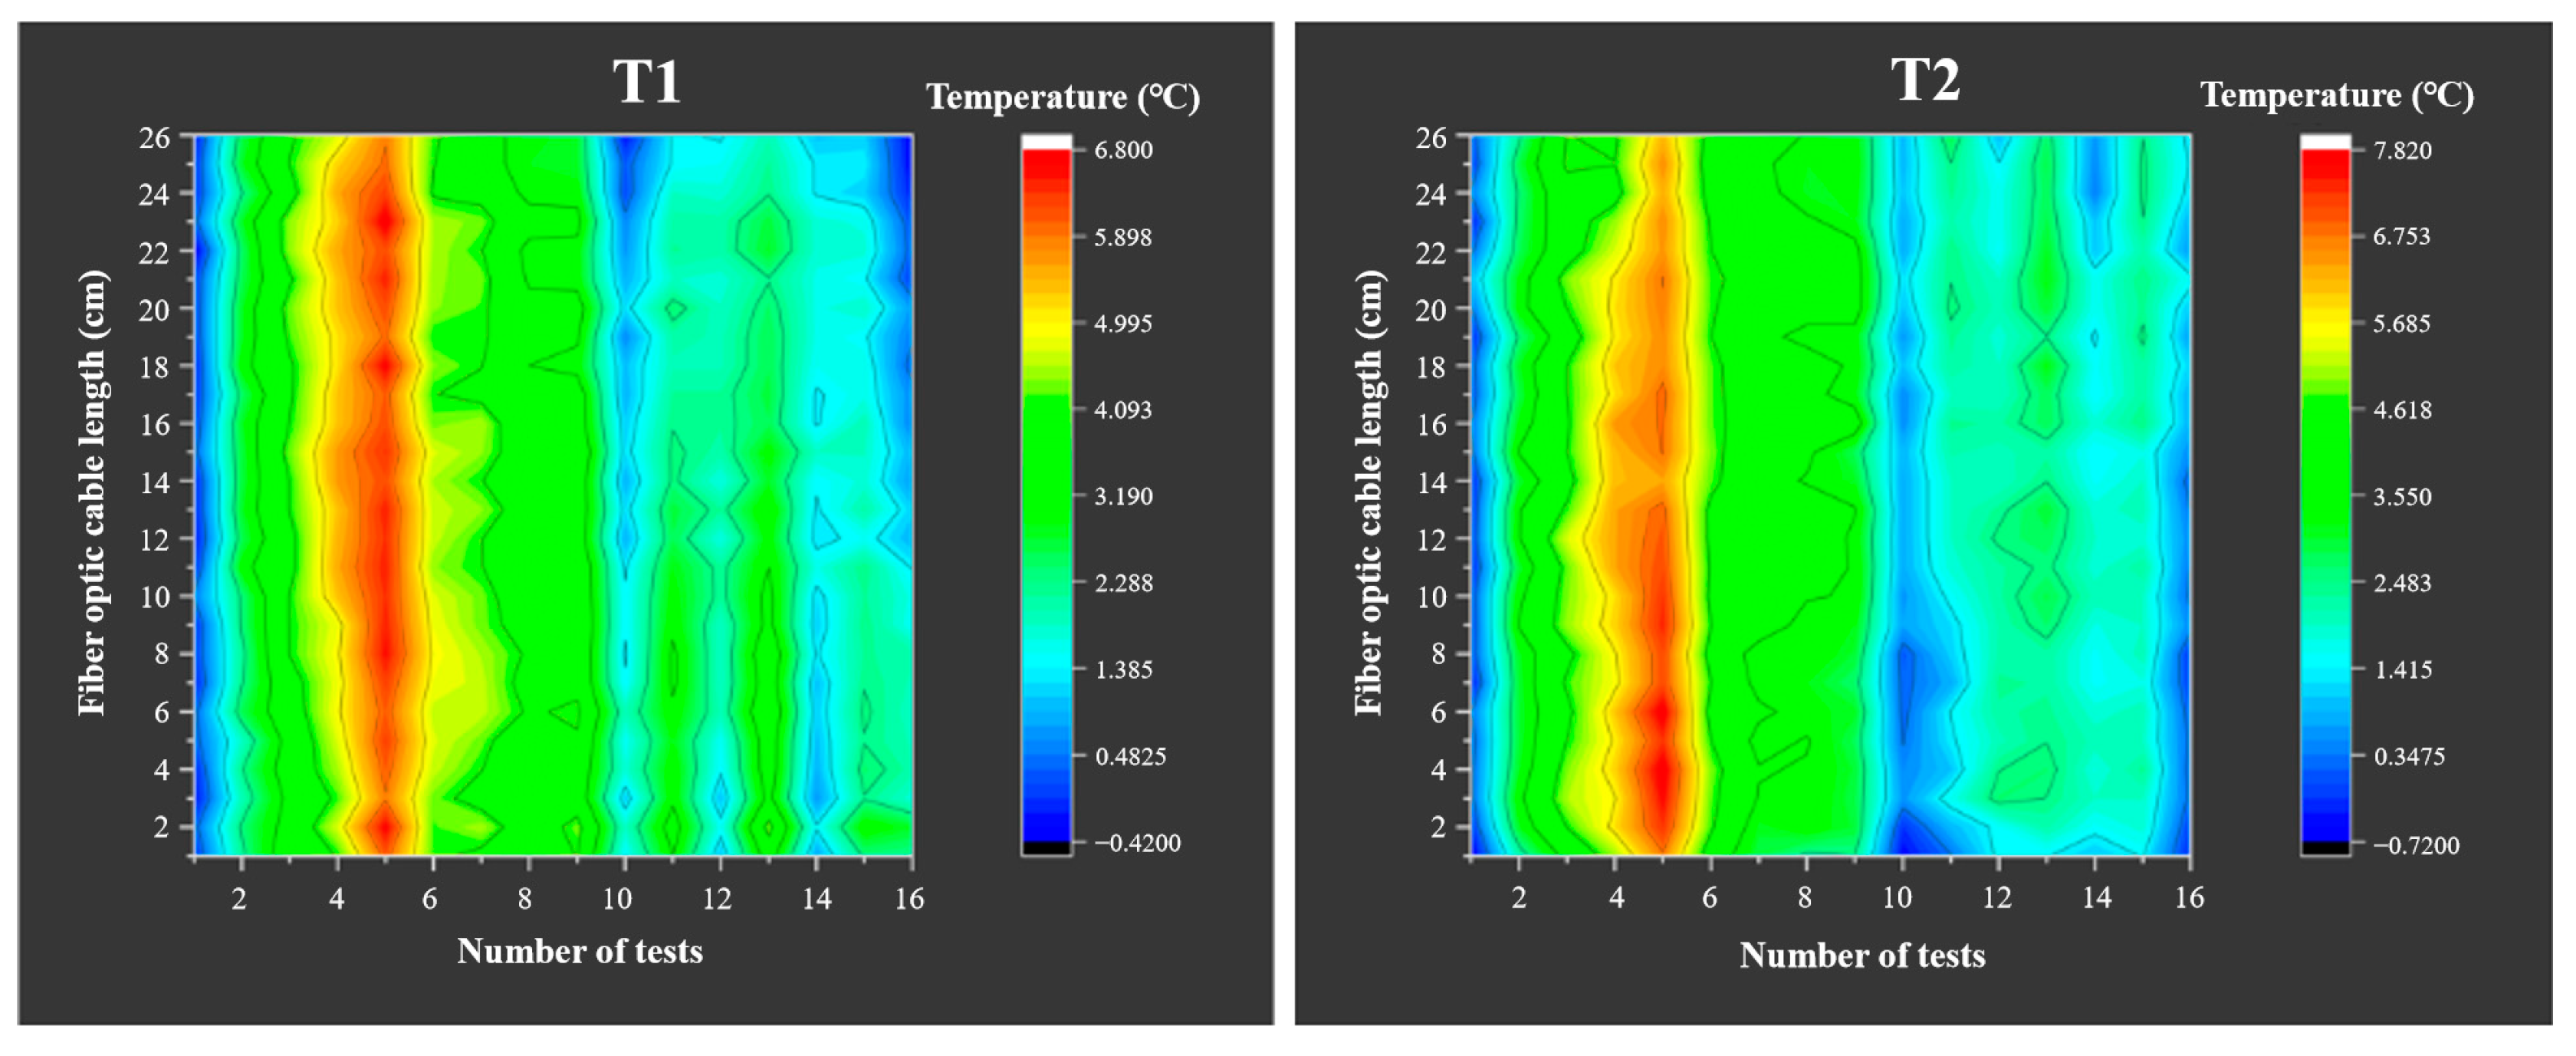
Based on the above experiment monitoring, 16 sets of strain and temperature monitoring data were obtained, and 8 sets of moisture content change curves were obtained through corundum tubes (
Figure 15). The temperature measurement line monitoring cloud map is shown in
Figure 16.
As shown in
Figure 15 during the experiment period, the water content of the slope model showed a significant upward trend as the rainfall continued, and the slope’s top area was significantly higher than the deep soil layer of the slope. However, due to the long rainfall interval in this experiment and the efficient drainage system designed in the model box, there was no significant water accumulation inside the model. Under actual engineering conditions, when the drainage performance of the slope is limited or heavy rainfall occurs, a large amount of water will seep into the interior of the slope, causing a sharp decrease in the shear strength of the slope soil. Once the drainage and emergency measures are improper, it will directly affect the instability and failure of the slope.
3.3. Analysis of Slope Physical Model Results
Through indoor model experiments of slopes, the dynamic evolution processes of the stress field, temperature field, and seepage field of the slope under two conditions of graded loading excavation and rainfall were systematically studied. By using data from slope deformation and temperature optical fibers, the state and evolution trend of the slope under different external influencing factors were characterized. The influence of multi–physics field coupling on the stability of the slope was analyzed. Based on this, the failure mode and disaster evolution mechanism of the slope were revealed. The main results are as follows:
(1) During the loading and excavation stages, the deformation of the slope mass exhibits significant “spatial heterogeneity”. The strain of the soil near the landslide boundary is greater than that of the stable soil. Shallow soil strains (H5–H8) are more sensitive to landslides, while the peak values of deep soil strains (H1–H4) are higher, but the temperature field fluctuations are relatively small. During the loading process, the internal strain of the slope continues to accumulate but still maintains a relatively balanced state. However, excavation results in a redistribution of the stress field at the foot of the slope and a sharp change, leading to the slope entering a critical instability state. At this point, a smaller additional load can trigger the occurrence of landslide disasters. From this, it can be seen that the excavation work at the foot of the slope will significantly reduce the stability of the slope and intensify the influence of the slope’s own weight on the stability of the slope. Therefore, in practical slope engineering practice, it is necessary to strictly control excavation construction parameters and comprehensively evaluate the potential impact of construction disturbances on slope stability.
(2) The effect of rainfall can significantly reduce the stability of the slope, causing it to be in a non–equilibrium critical state. Experiments have found that rainfall infiltration not only increases the self–weight of the slope but also triggers seepage–stress coupling, thereby leading to a decrease in the shear strength of the soil. Therefore, in practical slope engineering, it is necessary to strengthen the design of drainage systems, fully consider the impact of extreme rainfall on slope drainage, and avoid the slope body being in a saturated state for a long time, which may lead to a sudden drop in stability. Furthermore, the interaction between the temperature field and the seepage field may further influence the deformation field of the slope, resulting in a superimposed effect. Therefore, in actual slope monitoring, it is necessary to comprehensively consider the multi–field coupling effect of slopes, continuously improve the accuracy of landslide disaster prediction, and minimize the probability of disaster occurrence and losses caused by disasters.
4. Discussion
For a long time, slope engineering has faced problems such as complex geological conditions, harsh monitoring environments, and numerous external influencing factors [
29,
30,
31,
32]. In addition, extreme rainfall, fluctuations in reservoir water levels, and the combined effects of dynamic and static loads have posed a serious threat to slope stability [
33,
34]. Slope engineering monitoring achieves the early warning and prediction of slope instability and sliding by obtaining parameters such as the surface and internal displacements, seepage, and temperature of the slope. This significantly reduces the probability and losses of disaster accidents and thus is widely applied in slope engineering safety evaluation and landslide disaster warning [
35,
36,
37,
38]. This study is based on the method of fiber optic neural sensing, systematically exploring the spatiotemporal evolution mechanism of slope deformation disasters under multi–field coupling conditions and discussing the aspects of experimental advantages, limitations, and inspirations.
4.1. Advantages of This Study
This experiment takes the Three Gorges Reservoir bank slope as a prototype and uses millimeter–level spatial resolution OFDR and point–based high–precision FBG to synchronously obtain multi–parameter data, such as the displacement, seepage, temperature, and moisture content, achieving the real–time, continuous, and distributed monitoring of “thermal–hydro–mechanical” multi–field information. On this basis, the experimental scheme systematically simulated two typical working conditions affecting slope instability, “loading–excavation” and “rainfall–loading”, and used a U–shaped loop topology structure to finely capture the stress redistribution and local failure precursors inside the slope, providing data support for the quantification of slope instability criteria.
4.2. Limitations and Considerations
However, due to limitations of the indoor model scale and experimental conditions, this experiment still has certain limitations: (1) The soil type is single. The model uses homogeneous yellow sand and lacks clay interlayers, crack development, and heterogeneous structures, which fail to reproduce the complex geological structure of natural slopes. (2) The rainfall intensity is fixed. The lack of coverage of real rainfall spectrum characteristics, such as sustained rainfall or changes in rainfall, has led to a biased idealization of the coupled response between seepage and stress. In subsequent research, a sand–clay composite slope model will be constructed, supplemented with multi–level rainfall conditions, and combined with an MPM numerical inversion and sensitivity analysis to further reveal the mechanism of the slope deformation and failure.
4.3. Implications for Landslide Stability Analysis
Experimental results demonstrate that the internal fiber optic strain exhibits a marked piecewise–linear relationship with the applied load: during the early loading stage (0–150 kg), no localized failure occurs in the slope, the fiber–soil interface remains strongly coupled, and the stress–strain curve displays a relatively gentle slope; once the load reaches 150 kg, internal cracks initiate and the curve slope increases sharply. Accordingly, 150 kg can be regarded as the critical threshold at which the fiber–soil interface transitions from strong to weak coupling. At the same time, with the continuous excavation, the strain distribution range inside the slope gradually expands and induces a sharp transition of the tension–compression strain in local areas, with a magnitude difference of over 10,000 με. At this time, local collapse occurs at the slope. Therefore, the tension–compression strain conversion of optical cables can serve as a key criterion for the early instability and failure of slopes.
5. Conclusions
This study provides a detailed introduction to fiber optic neural sensing technology for slope engineering, aiming to enhance early warning capabilities by capturing displacement, seepage, temperature, and vibration data to reduce disaster risks. A physical model experiment of the slope was conducted based on the Three Gorges Reservoir bank landslide, and the deformation and instability evolution process of the slope was analyzed. This research has reached the following conclusions:
(1) We systematically introduced the fiber optic neural sensing technology for slope engineering, breaking through the limitations of traditional single monitoring methods, such as the “point discretization, single parameter monitoring, and insufficient resolution”, and providing technical support for the full distribution, multi–parameter, and high–precision acquisition of multi–field data such as slope deformation, temperature, seepage, and vibration.
(2) Taking the Three Gorges Reservoir landslide as a case study, this research introduces fiber optic neural sensing technology for reservoir slopes. Model experiments under excavation and rainfall conditions show that vertically laid cables are more sensitive to loading, while horizontally laid cables better capture excavation effects. The observed tension–compression strain conversion aligns well with the local slope damage, providing a key indicator of early instability. Rainfall infiltration greatly reduces the soil strength: while failure occurred only after the eighth excavation under the 120 kg load in dry conditions, saturation led to failure at just 20 kg of load. Thus, rainfall poses a greater threat to slope stability than engineering activities.
