Article

Utilizing Aquifer Hydraulic Parameters to Assess Local and Regional Recharge Potentials for Enhancing Water Allocations in Groundwater-Dependent Areas in De Aar, Northern Cape, South Africa

by
Lucky Baloyi
1,2,*,
Thokozani Kanyerere
2,
Innocent Muchingami
3,
Harrison Pienaar
4,5,6,
Ndubuisi Igwebuike
2,7 and
Mxolisi B. Mukhawana
8
1
Belville Office, Department of Water and Sanitation, 52 Voortrekker Road, Cape Town 7530, South Africa
2
Department of Earth Science, University of the Western Cape, Bellville, Cape Town 7535, South Africa
3
Department of Geo-Sciences, University of Namibia, Southern Campus, Keetmanshoop 1727, Namibia
4
Smart Place Cluster, Council for Scientific and Industrial Research (CSIR), Pretoria 0001, South Africa
5
Institute of Africa Water Resources and Environmental Engineering, Handan 056000, China
6
Centre for Environmental Management, Faculty of Natural and Agricultural Science, University of the Free State, Bloemfontein 9300, South Africa
7
Boone Pickens School of Geology, Oklahoma State University, 105 Noble Research Center, Stillwater, OK 74075, USA
8
Department of Water and Sanitation, 178 Francis Baard Street, Pretoria 0001, South Africa
*
Author to whom correspondence should be addressed.
Water 2025, 17(18), 2709; https://doi.org/10.3390/w17182709
Submission received: 29 July 2025 / Revised: 7 September 2025 / Accepted: 9 September 2025 / Published: 13 September 2025

Abstract

The precise and accurate use of aquifer hydraulic parameters for assessing local and regional recharge potential for enhancing groundwater allocation planning is vital for many hydrogeological studies. The conventional approach for allocating groundwater presents a challenging scenario, as it remains uncertain whether the applied recharge estimate is local or regional recharge. The approach does not account for the extent of the aquifer recharge in terms of local and regional scale; instead, it assumes that recharge is distributed across the catchment. This study aimed to demonstrate the use of aquifer hydraulic parameters (transmissivity and storativity) to explain areas of potential recharge (local and regional) for enhancing groundwater allocation planning with a specific case study of De Aar, Northern Cape, South Africa. It argues that not integrating local and regional recharge potentials in planning for groundwater allocations can result in over- or under-allocation of groundwater resources to users. A constant discharge pumping test and recovery test matching the duration of pumping were conducted for data collection. The Flow Characteristics method was used as a diagnostic tool to understand the different aquifer flow regimes in the study area. To develop an integrated understanding of the groundwater system, a hydrogeological conceptual model was used to visualize areas with higher or lower recharge potential across local and regional scales. Results showed significant variability in transmissivity, ranging from 213 to 596 m2/d, and storativity, ranging from 0.0000297 to 0.000185. The transmissivity values suggest that groundwater moves faster; meanwhile, the storativity values suggest that the aquifer system has high water storage capacity. These results will assist water resource planners in making informed decisions on how to allocate groundwater to users. This study demonstrated that aquifer hydraulic parameters are a valuable tool for improving groundwater allocations, thereby highlighting the importance of considering areas for potential recharge, both local and regional, in planning groundwater allocation.

1. Introduction

Globally, the demand for groundwater is increasing, yet little attention is given to improving plans for groundwater allocation [1]. In De Aar, Northern Cape Province, South Africa, characterized by low rainfall and high evaporation rates, groundwater remains a vital source of freshwater supply for communities, agriculture, and industry. The spatial pattern of the rainfall, together with high evaporation rates, controls the hydrology of the Province [2]. For decades, groundwater has been allocated from a system consisting of six separate wellfields confined to the Brak River valley in De Aar. Recently, the area has been experiencing a continuous decline in static groundwater levels due to overexploitation driven by high water demand, presenting a significant challenge to water security [3]. This aspect further exacerbates a water stress situation for the community, which is heavily dependent on groundwater resources to meet its daily needs. In such groundwater-dependent areas, the sustainable management of a wellfield depends on the precise and accurate use of aquifer hydraulic parameters to assess local and regional recharge potentials, thereby enhancing groundwater allocation plans [4]. In South Africa, various mechanisms for allocating groundwater have been developed and prescribed under Chapter 4 of the National Water Act (NWA Act No. 36 of 1998). This involves allocating groundwater through issuing a water use license authorization (WULA), confirming the general authorization (GA), conducting verification and validation of the existing lawful use (ELU), as well as Schedule 1 water use. Despite these mechanisms, over- or under-allocation of groundwater remains a serious problem for users who rely heavily on groundwater resources [5]. Before water can be allocated to users, the NWA requires that a certain amount of water be set aside for ecological water requirements (EWR) and basic human needs (BHN) of groundwater-dependent populations. Such a component of the reserve is defined by the following relationship [6]:
R e s e r v e = E W R g w + B H N g w d p
where EWRgw represents the ecological water requirements from groundwater, and BHNgwdp represents the basic human needs for the groundwater-dependent population. The following relationship defines the allocable water:
A l l o c a b l e   g r o u n d w a t e r = R e ( E W R g w + B H H g w d p ) ,
where Re represents the recharge component [6]. The reserve is subtracted from the recharge (Re), and the remainder is allocated to the users. This conventional approach for allocating groundwater presents a challenging scenario, as it remains uncertain whether the recharge applied in the current practice for groundwater allocation represents local or regional recharge. Therefore, to enhance understanding of groundwater allocation, recharge must consider the type and spatiotemporal scale variability it represents. However, the major limitation of the current approach is that recharge does not account for the type and extent of the aquifer in terms of local and regional scale variability; instead, it assumes that recharge is uniformly distributed across the catchment. This problem can be resolved by using aquifer hydraulic properties from a wide range of available methods and justified by developing a simplified regional hydrogeological conceptual model [7]. According to Walvoord et al. [8], a conceptual model is a visual representation of the groundwater flow system, frequently in the form of a cross-section or block diagram. It is developed based on geological, geophysical, hydrological, and hydrogeochemical information [9]. The properties of each unit’s hydraulic parameters, the locations of the phreatic and piezometric surfaces, and the groundwater flow conditions are also included in conceptual models. Betancur et al. [10] demonstrated that integrating multiple methods, such as data analysis, modelling, geochemical studies, and risk evaluation, can produce a reliable hydrogeological conceptual model. Applied in Colombia’s Bajo Cauca region, this approach revealed a three-unit aquifer system with multiple recharge sources and contamination risks from human activities [10]. The model was validated and proved effective for groundwater management. Rojas et al. [2] evaluated conceptual model uncertainty for the Pampa del Tamarugal aquifer in Northern Chile using a multi-model ensemble of eight alternatives. They emphasized that accounting for model uncertainty is crucial for sustainable groundwater management, especially under high demand and climate variability. Their study also highlighted the need for diverse models, better data, and refined model probabilities to improve reliability. Karlović et al. [9] developed a validated hydrogeological conceptual model of an alluvial aquifer in De Aar, South Africa, using diverse environmental data. Featuring a three-layer structure and recharge estimates from the WetSpass-M model, it supports future groundwater flow modeling and resource management. Baloyi et al. [11] identified a multi-layer aquifer system in De Aar, South Africa, with varying groundwater potential. Borehole data revealed fully penetrating wells through unconfined and semi-confined layers, indicating a double-layer aquifer structure. High-yield boreholes (over 5 L/s) are typically found in weathered, fractured contact zones between dolerite intrusions and shale beneath alluvium, especially in areas with total calcification. Estimation of aquifer hydraulic properties for understanding the hydrogeologic processes is a basic prerequisite for sustainable allocation of groundwater resources [12]. This is particularly important because sustainable water allocation, as framed by the 2030 Agenda and sustainable development goal 6 (SDG), is about equitable, efficient, and resilient distribution of water resources, ensuring that all people, ecosystems, and sectors have access to water now and in the future, while balancing the complex social, economic, and environmental demands of a changing world [13]. Therefore, by accurately estimating aquifer hydraulic parameters and integrating local and regional recharge into planning for groundwater allocation, groundwater practitioners and managers can sustainably manage groundwater and enhance understanding of recharge potential areas and resilience, thereby achieving Sustainable Development Goal 6, particularly in areas relying heavily on groundwater.
Several conventional methods, including field tests, lab analyses, and empirical calculations, are used to estimate aquifer hydraulic properties [14]. Khadri and Moharir [12] conducted a study using pumping tests in hard rock regions, finding that well storage affects results in low-permeability aquifers. They recommended a radial flow model for greater accuracy. It also highlighted a research gap in understanding regional aquifer recharge, stressing the need for further studies. Ali et al. [15] used pumping tests to estimate key aquifer parameters and recommended more deep borehole tests to support sustainable, catchment-wide groundwater management. Gomo [16] found that applying the Cooper–Jacob method to multi-borehole pumping tests in confined aquifers can lead to systematic deviations in transmissivity and storativity estimates, depending on the observation borehole’s distance from the pump. Boucher et al. [17] demonstrated that Magnetic Resonance Sounding is a promising non-invasive method for estimating transmissivity and specific yield in shallow unconfined aquifers, though it may overestimate water content compared to pumping tests. Woodford’s study in South Africa found that standard aquifer test methods are unsuitable for fractured aquifers, leading to the adoption of the Flow Characteristic (FC) method, now widely used in Africa for estimating hydraulic parameters [18]. Van Tonder [19] further introduced an alternative method called Methods of Derivative Fitting (MDF), alongside the FC method, for estimating sustainable yields in fractured rock aquifers. Edwin et al. [20] investigated an alluvial aquifer using various methods and found notable differences in hydraulic properties between riverbed and riverbank sediments, attributed to heterogeneity. Their work improved understanding of the system, with pumping tests identified as the most reliable method for estimating overall hydraulic properties.
Single pumping tests with two observations were used per catchment to estimate aquifer properties. Over the years, groundwater studies focused on local alluvial aquifers and are available through the Department of Water and Sanitation. The choice of data analysis method depends on the flow regime, with graphical methods suited for steady-state and type curves for transient flow [15]. When the pumping tests are performed in a small-diameter borehole, several methods are available for analyzing the pumping test data, depending upon the type of aquifer [21]. Conventional methods assume negligible well storage in small-diameter boreholes, but in fractured hard-rock formations, large-diameter boreholes are used, where initial pumping primarily draws from well storage [21]. As pumping continues, well storage contribution decreases, and the aquifer increasingly supplies the pumped water, eventually becoming the sole source [21]. This study aimed to demonstrate the use of aquifer hydraulic parameters (transmissivity and storativity) to explain areas of potential recharge (local and regional) for enhancing groundwater allocation in groundwater-dependent areas. It employs the Flow Characteristics method, supported by the Cooper–Jacob method for validation, and uses a conceptual hydrogeological model to visualize potential recharge areas. The central argument is that not integrating local and regional recharge potentials in planning for groundwater allocations can result in over- or under-allocation of groundwater to users and potential users, undermining the long-term sustainability. In other words, aquifers with low recharge may receive more groundwater allocations, while aquifers with high recharge may receive less groundwater allocation.

2. Geology

The Karoo sedimentary rock layers, which are horizontally stratified with a slight dip and are periodically modified by obvious dolerite intrusions, serve as the primary foundation of the study region [22]. According to research conducted by Vegter [22], the study area’s stratigraphy is made up of sediments from the Ecca and Beaufort Groups, particularly the Tierberg and Middleton formations. The elder of the two, the Ecca Group, is made up of siltstone and dark grey shale formations that are mostly located in the lower catchment (north-western side of the research area) and expand into portions of the middle catchment (north-eastern side) [22]. The shale succession is periodically broken up at different strata by geological layers and lenses of siltstone and fine-grained sandstone [23]. The late Permian-era Beaufort Group is made up of sandstone, siltstone, and mudstone formations [23]. The rocks are important targets for groundwater in regions where these sediments have been shattered by intrusive dolerite formations. Dolerites usually appear as different thicknesses of sheets, sills, and dykes. Common dolerite formations are ring-shaped, with curved outcrops that overlap up to 30 m in width (Figure 1a). These formations range in width from 1 m to over 10 m and in length from 1 to 7 km [23]. They change direction and shape before becoming almost horizontal sheet bodies [22]. In the upper catchment southeast of the study region, kimberlites can be found as pipes or dykes [23]. Significant lateral and vertical heterogeneity can be seen in alluvial deposits, which are mainly found in river valleys. These deposits have a maximum thickness of 10 to 15 m. Areas with shallow groundwater frequently have surface limestone deposits, which are created as salt builds up in layers through evaporation [19].

3. Hydrogeology

The unconfined and confined layers, which are connected both vertically and horizontally, make up the aquifer system in this study [11]. Sand, clay, silt, and gravel make up the weathered alluvium formation that forms the unconfined aquifer system. The bedrock unit of the confined aquifer system consists of sandstone, mudstone, shale, and dolerite in an alternating order. Monitoring boreholes reveal that the depth to the static water level ranges from 3.3 to 4.7 m. High elevation regions typically constitute the majority of the aquifers’ local and regional recharge areas. High-yielding groundwater strikes are frequently found in the upper and lower contact zones between sandstone and dolerite, or shale and dolerite, although dolerite intrusive formations are not particularly productive for groundwater [23]. Compared to the underlying dolerite portions, the water strike in the sedimentary layers above the dolerite is noticeably larger. The fractured sandstone beneath the alluvium formation in these zones has boreholes that yield more than 5 L/s, especially in areas where almost total calcification has taken place (Figure 1b) [18]. Vegter classifies the groundwater quality in the study area as class II because the total dissolved solids (TDS) are more than 1000 mg/L, and the electrical conductivity (EC) is between 150 and 250 mS/m [23]. In terms of water supply, the aquifer is the sole source of water available to users. This means that the aquifer represents the only available source of groundwater allocation derived solely from the aquifer units. Shallow and deep boreholes that penetrate both confined and unconfined aquifers, representing the entire aquifer system, abstract groundwater for the community’s water supply. Excessive pumping causes water level changes that have a significant impact on this aquifer.

4. Materials and Methods

4.1. Description of the Study Area Location

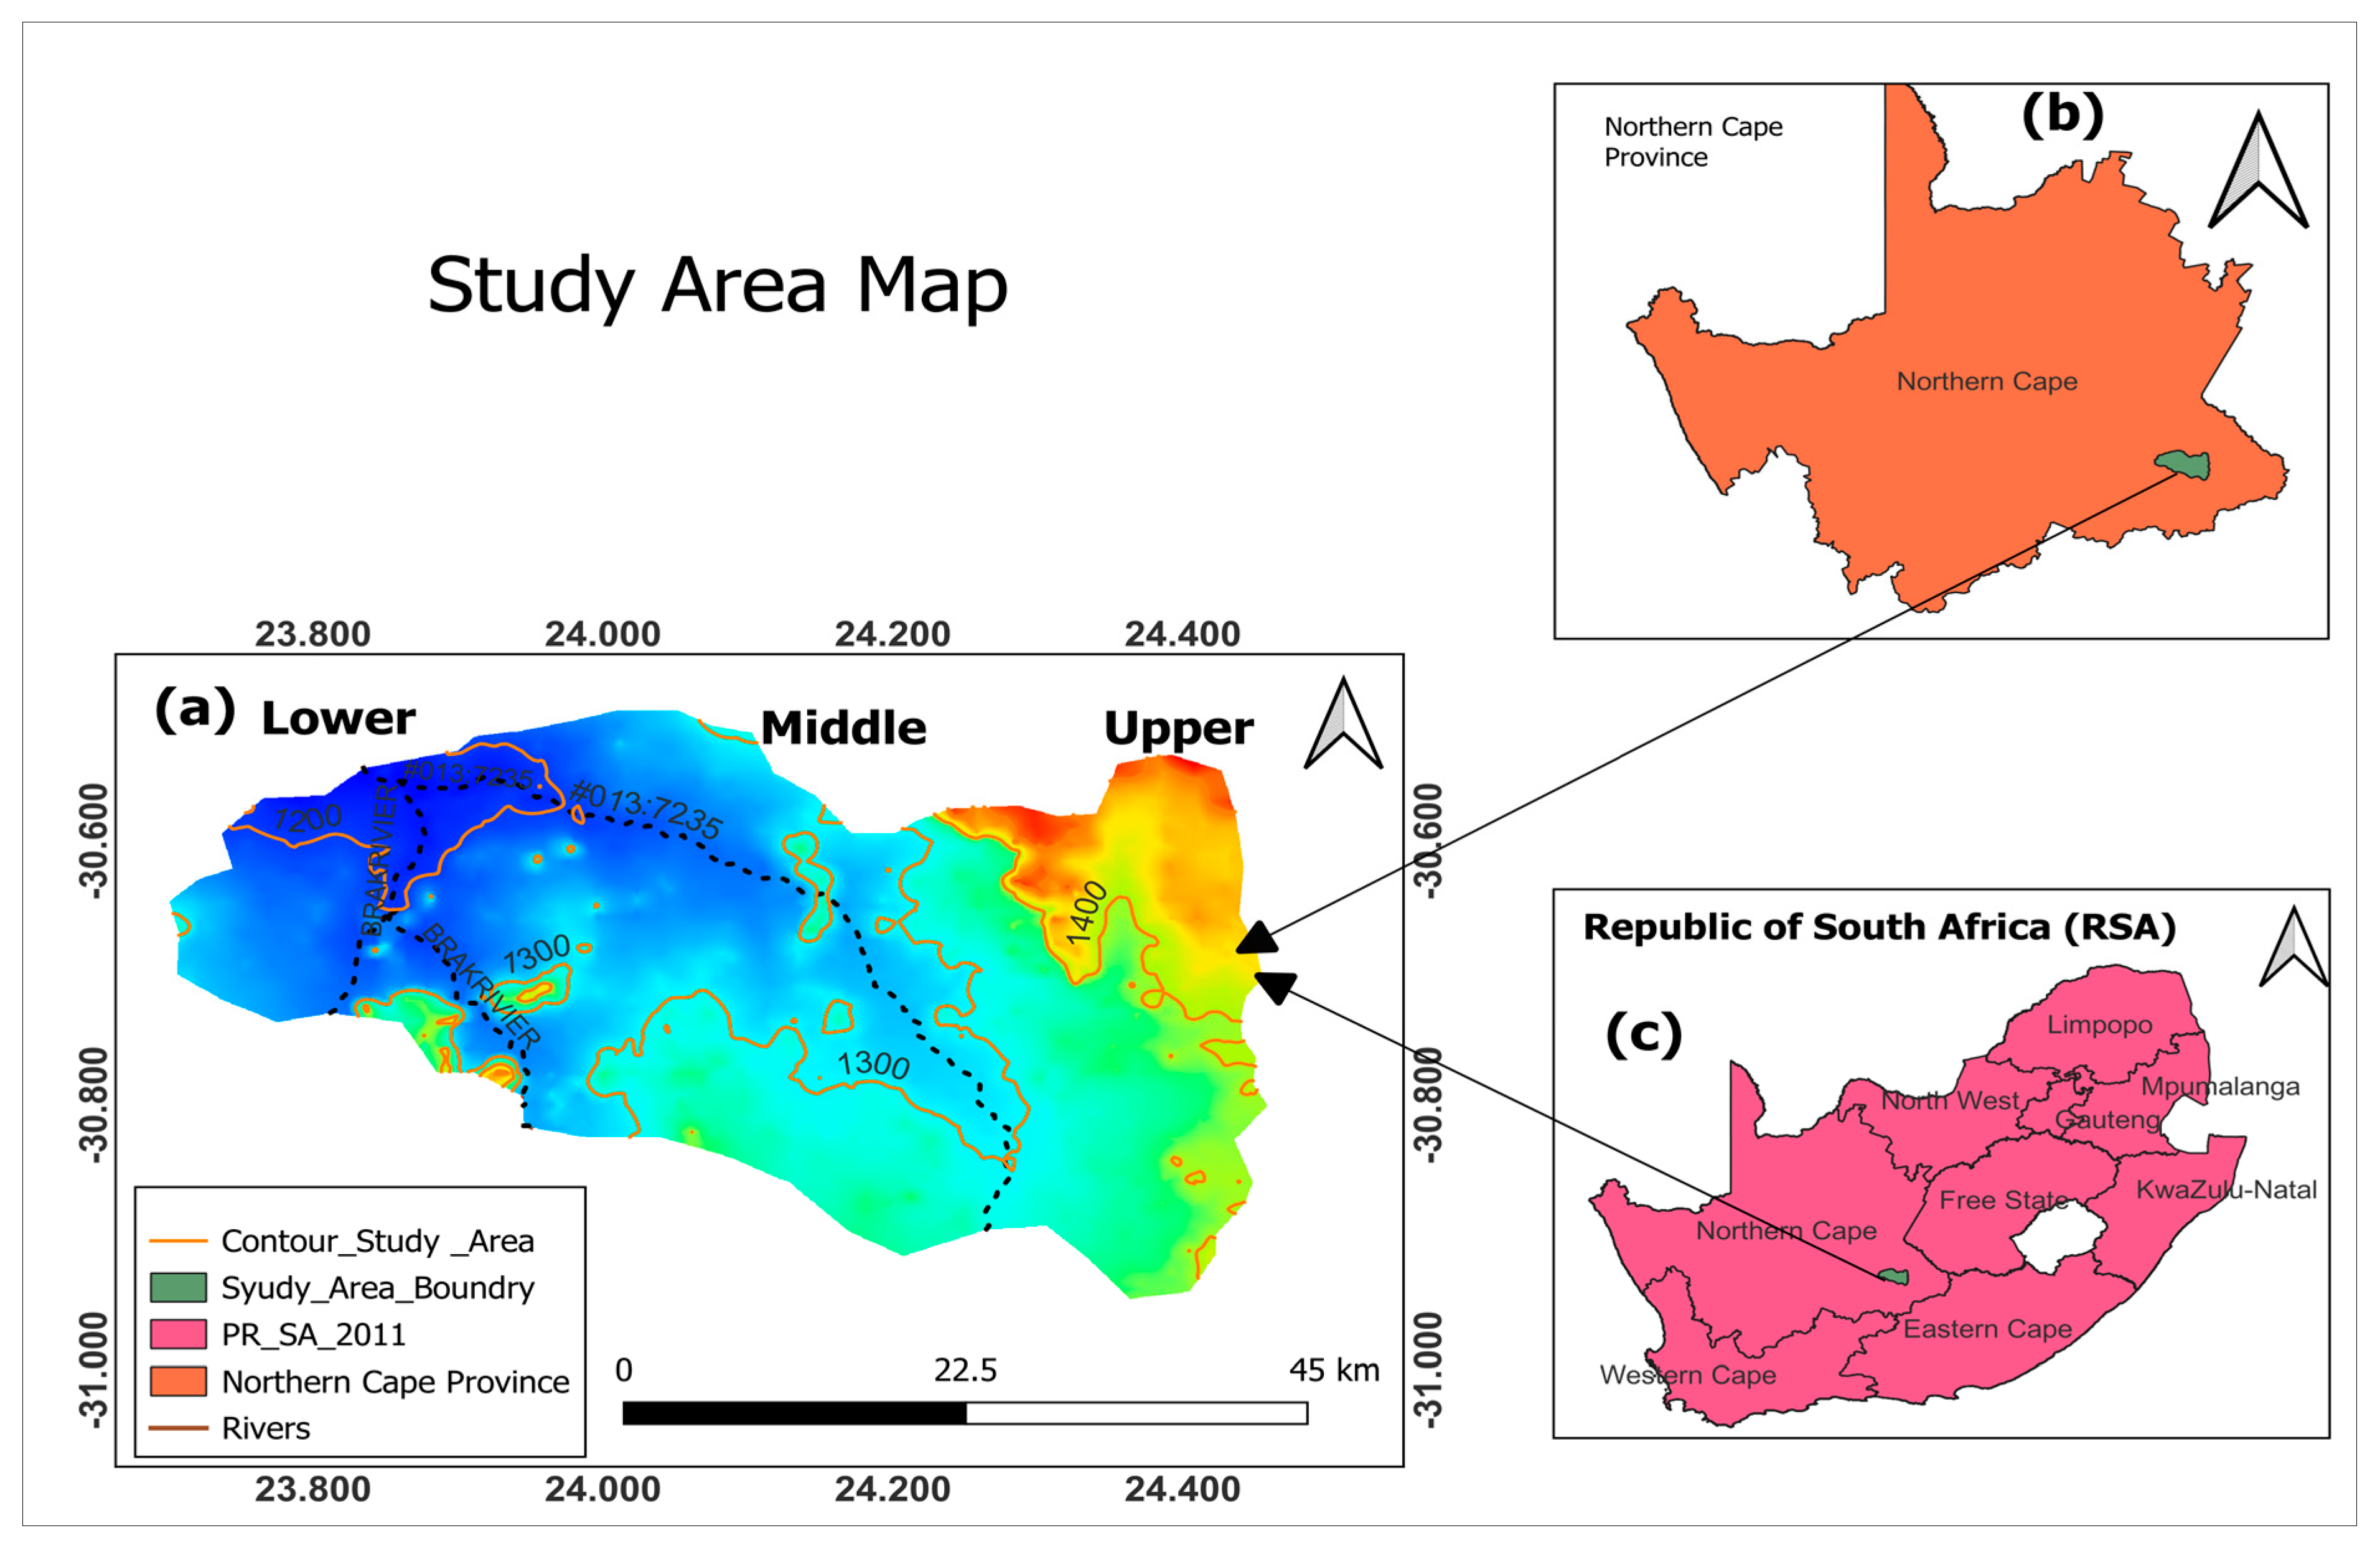
This study was carried out in De Aar, situated in the Northern Cape Province of South Africa, and falls within the Vaal–Orange Catchment Management Agency (VOCMA). In particular, it falls in the Lower Orange Water Management Area (WMA) on a portion of the quaternary catchment drainage regions D62C and D62D (Figure 2). De Aar lies at an elevation of between 1100 m and 1500 m in the Eastern Karoo physiographic region, forming part of the Brak River catchment. The catchment area was further subdivided into three sub-catchments based on ground elevation and borehole locations, namely, the lower (altitude from 1183 to 1233 m), middle (altitude from 1233 to 1261 m), and upper catchments (altitude from 1261 to above 1404 m). The catchment is underlain by the Karoo supergroup aquifers, which are reported to have low transmissivity, hydraulic conductivity, and relatively low specific yields of less than 1 L/s [22]. However, contrary to this, large volumes of groundwater are sometimes pumped from wellfields supplying towns, mines, and communities with potable water daily [22]. Furthermore, the study area covers approximately 2226 km2, characterized by a semi-arid climate with an average annual rainfall of 29.83 mm calculated from monthly totals. Most of this rainfall typically falls during the summer months from November to December and from March to April. The monthly mean day temperatures range from 23 °C in January to 8 °C in July, with diurnal temperature variations between 15 °C in the summer months (March/April) and 17 °C in September. The summer temperatures can peak between 25 °C and over 40 °C, while winter temperatures can drop as low as 3 °C to −10 °C. Geomorphologically, the study area is characterized by scattered rings of dolerite hills, reaching diameters of up to 12 km and covering an area of 50–60 km2, and are formed by horizontally layered dolerite sheets [11]. Thus, this region is classified as lowland, interspersed with mountainous hills nestled between river valleys. The Elandsfontein Spruit River, originating southeast of Hanover and the Brak River near Caroluspoort, along with several minor tributaries, drains the entire catchment (Figure 1a). These rivers typically have a brief annual flow period, usually triggered by a heavy rainfall event. Numerous slopes of dolerite hills frequently intersect the intermediate valley areas [23]. The riverbeds of the ephemeral rivers within the study area typically lie above the groundwater table, forming standing pools of water along the Elandsfontein Spruit and Brak River systems [23]. The primary land use is extensive livestock farming, primarily sheep and goats, which are well-adapted to the semi-arid climate conditions. Land cover comprises sparse vegetation, with grasslands and scrublands being the most common natural cover types. Irrigated agriculture exists in the study area, but is limited to areas where reliable groundwater and surface water are readily accessible.

4.2. Data Collection for Aquifer Hydraulic Parameter Estimation

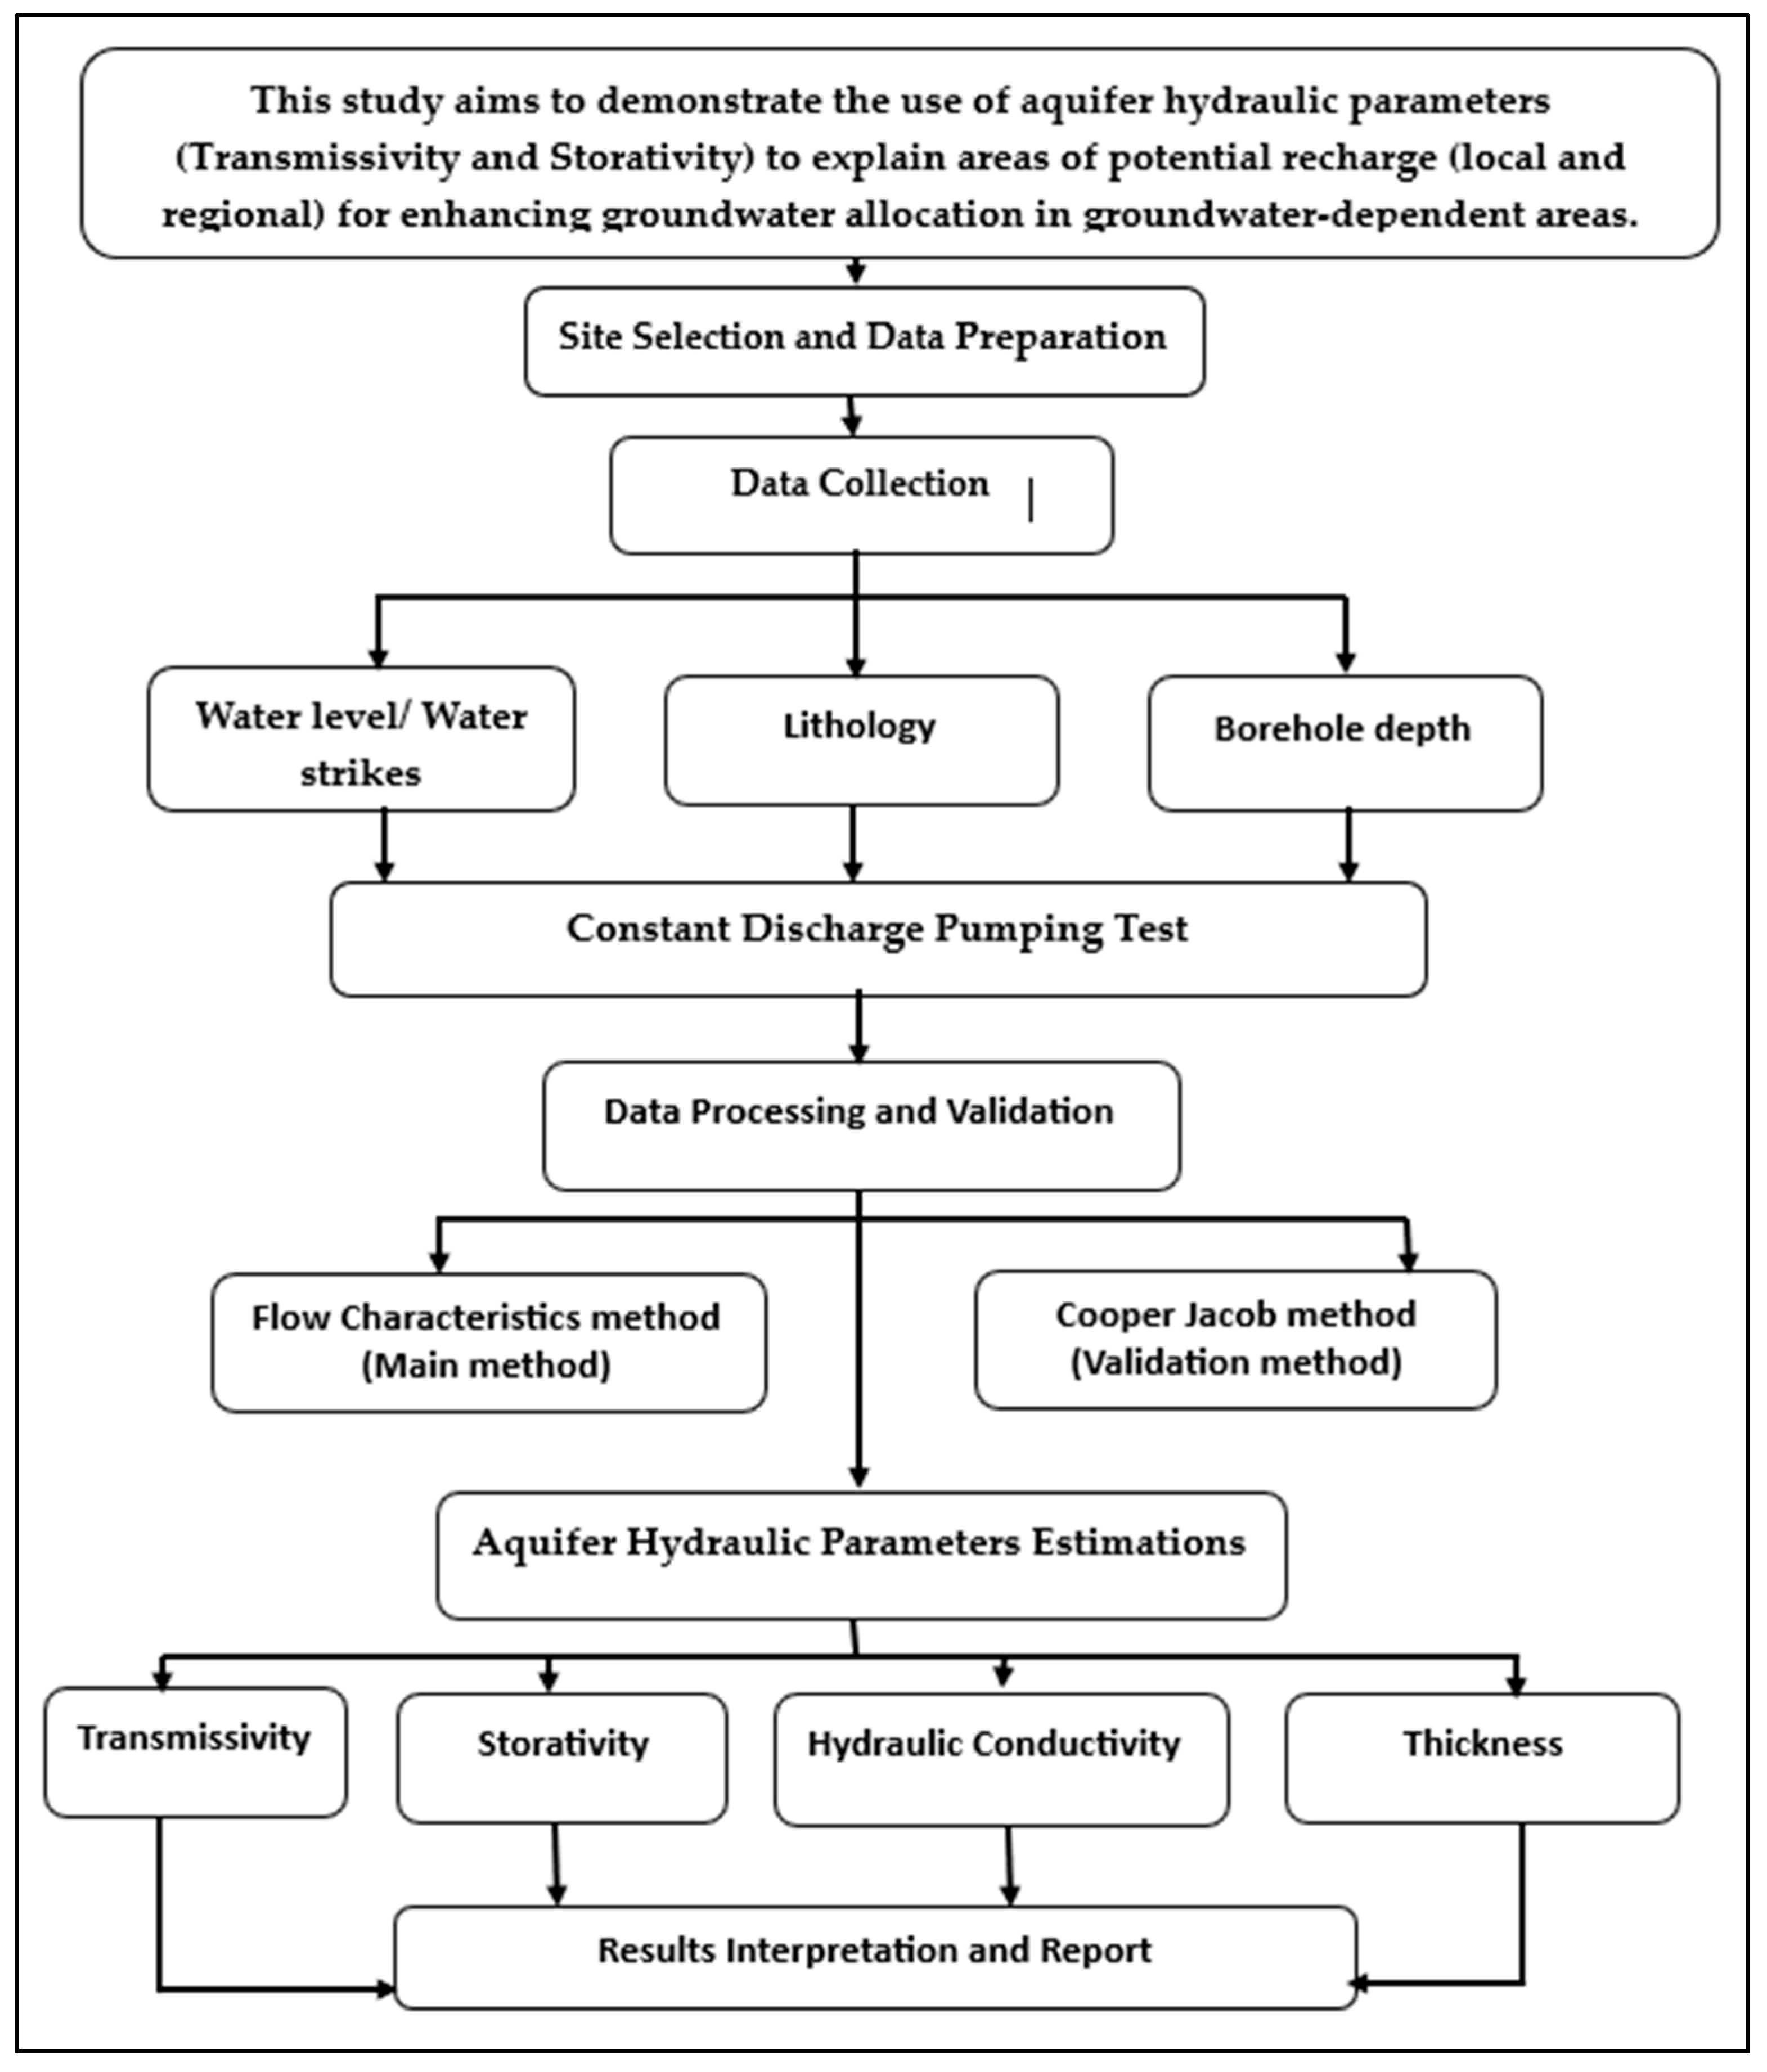
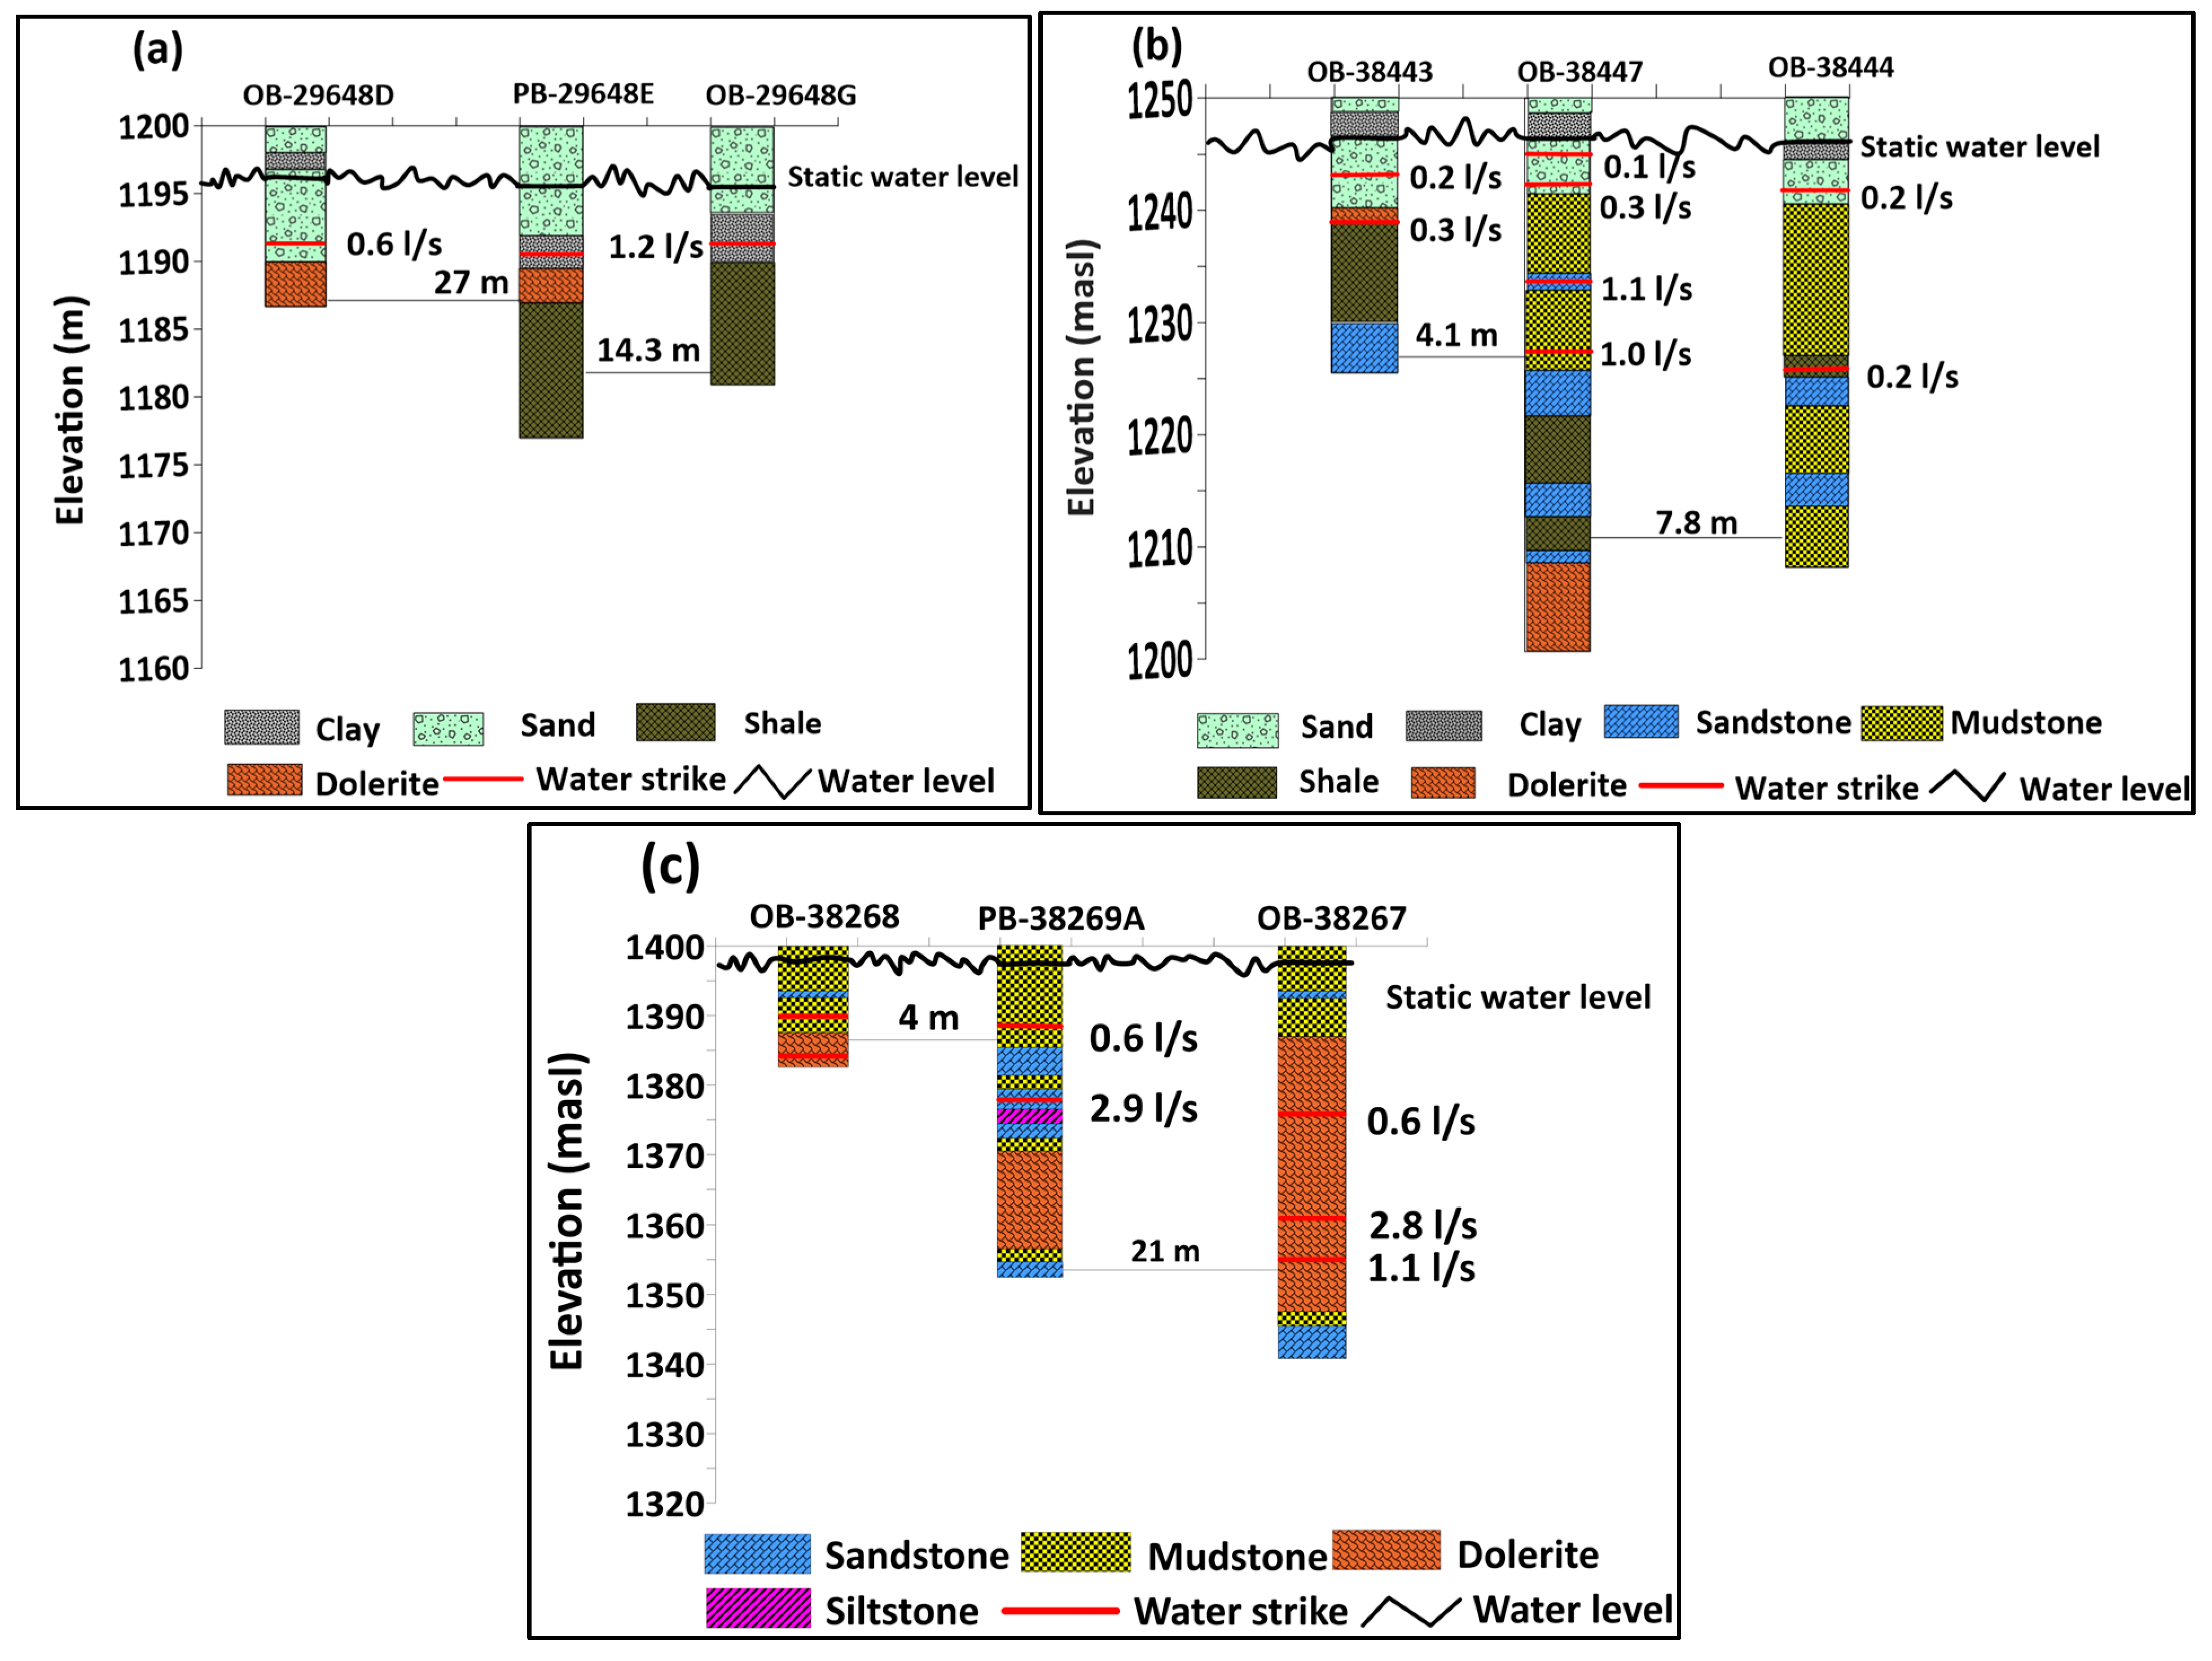
A total of nine boreholes across the study area: one pumping test borehole and two observation boreholes in each investigation site, were selected. The spatial distribution of these boreholes was not a deliberate choice; instead, they were the only available boreholes at specific locations with complete dataset availability. On the other hand, site accessibility, borehole penetration depth, and relevance to the major geological features and fractured rock units under investigation informed the selection of these boreholes. A simple methodological flowchart for estimating aquifer hydraulic parameters is presented in Figure 3. Before starting the pump, hydrogeological field data, including lithology, depth to water level, water strike, and borehole depth, were collected and recorded (Figure 3). Then, a fully penetrating constant discharge pumping test was carried out to determine the aquifer hydraulic parameters, following the standard procedure and guidelines for the groundwater resources development document [19,23]. Generally, longer-duration pumping tests, a minimum of 24 h, are often recommended to capture late-time reactions. According to Kruseman and Ridder [24] and Mofokeng [25], the duration of pumping tests depends on the type of aquifer and the degree of accuracy required to establish its hydraulic characteristics. Halford et al. [26] conducted a pumping test of less than 12 h and successfully established a steady drawdown from a partially penetrated and vertically anisotropic aquifer. Oliver et al. [27] conducted a pumping test for 180 min (3 h) and were able to confirm that integrating lithology data with limited pumping test data can effectively estimate aquifer hydraulic parameters [27]. In this current study, the pumping test lasted for 8 to 12 h, and the following reasons justify a shorter pumping test duration: 1. The drawdown stabilizes quickly on the pumping borehole, making longer testing unnecessary. 2. More than 95% recovery was reached within the pumping hours. 3. The nature of borehole construction and aging restricted longer testing. This approach was in line with that of Falowo et al. [28], who conducted a pumping test lasting 5 to 12 h. The duration of their test depended on the time it took for the individual pumping borehole to achieve equilibrium. Kruseman and Rider [24] and Mofokeng [25] have stated that in some tests, steady-state or equilibrium conditions occurred a few hours after the start of pumping, while in others, they occurred within a few days or weeks. In others, they never occurred, even though pumping would continue for years. This was the case in this study, where steady-state conditions occurred within a few minutes of pumping between 20 and 60 minutes. The pumping test involved abstracting water from a borehole at a controlled rate and observing the changes in water level over time [12]. As shown in Figure 4, observation boreholes are labeled as OB-29648D, OB-29648, OB-38443, OB-38444, OB-38268, and OB-38267, while the pumping boreholes are labeled as PB-29648E, PB-38447, and PB-38269A. After starting the pump, drawdown data were continuously measured manually using the water level meter (dip meter) at predefined intervals until a steady state or equilibrium condition was reached. Table 1 shows the time from the start of the pump to the end and the time interval in minutes.
Discharge rate was measured by filling a bucket of a known volume over time, attached near the outlet of the delivery pipe. After the pump was turned off, a recovery test matching the duration of the pumping test was conducted [19]. Similar to the pumping test, the recovery data were manually collected at regular intervals until the depth to water level had fully recovered. The recovery test was performed to provide an indication of the ability of the borehole and groundwater system to recover from the stress of abstraction, either quickly or slowly. Samani et al. [29] showed that the recovery test can be used to calculate an aquifer’s hydraulic parameters, to establish whether recharge has taken place during or shortly after a constant discharge test. Furthermore, Atangana [30] has stated that recovery test measurements allow for the transmissivity of the aquifer under the investigation to be determined more accurately, because the residual drawdown field data is more reliable than the pumping test data and occurs at the constant rate of recovery, whereas in practice, it is often difficult to achieve constant discharge during pumping [24,25].

4.3. The Conceptual Cross-Section of This Study

Figure 4 illustrates the litho-stratigraphic layers of the pumping test and observation boreholes used for the estimation of aquifer hydraulic parameters. The geological profile of the research study area was created using information from nine boreholes drilled along the Brak River system, which represented the lower, middle, and upper catchment regions. The data were obtained from the Department of Water and Sanitation’s (DWS) National Groundwater Archives (NGA) database system. The borehole data included lithology logs, borehole identifier, top-to-bottom depth of each layer, formation name of each layer, water strike depth, yields, and static water level (Table 2). Figure 3 shows the geological cross-sectional profile of the pumping and observation boreholes used for the estimation of aquifer hydraulic parameters and conceptualization of the study area. Firstly, surface elevation points were generated using the Google Earth Pro software program. Using Surfer Golden software version 16, the elevation points were converted into a grid of data points to infer geological formations and define the zones of groundwater recharge potential [11]. Subsequently, the profile line representing the desired cross-section path was created and used to slice the grid, generating a cross-sectional profile. For the processing, analysis, and interpretation of the lithology data, borehole logs were initially sorted using a Microsoft Excel spreadsheet to determine the top-to-bottom extent of each layer for the estimation of each layer’s thickness. The unconfined aquifer was measured from the confining unit at the aquifer base to the static water level. The semi-confined/confined aquifer was measured from the confining unit at the aquifer base to the confining unit at the aquifer top. The lithological correlation of each borehole log was analyzed to determine the lateral continuity of different layers, to establish the subsurface geological structures explaining different types of aquifers [31]. Finally, the cross-sectional profile was customized, labeled, and filled with layers using lithology logs.

4.4. Data Processing, Analysis, and Interpretation

The study area’s aquifer hydraulic parameters were estimated using the derivative plots and the diagnostic straight line fitting methods, which were incorporated in the Flow Characteristics (FC) software program [19]. The method of derivative fitting (MDF) was applied to determine which part of the time drawdown and recovery curve correctly fits the log derivative and diagnostic straight-line curve, as well as to identify the dominant flow regime. The intermediate and the late time behavior of the curve based on MDF has been proven to be true for the Karoo fractured rock aquifer system [32]. While the diagnostic straight line fitting approximation of the FC methods has been proven to make the correct curve fitting decision, the use of a single straight-line fitting technique may introduce bias; therefore, the Cooper–Jacob method was also applied to validate transmissivity values in the results. The Cooper–Jacob approximation is a simplified form of the Theis solution (1935) [32]. The analysis and interpretation of the pumping test results were performed with general assumption that (1) The aquifer was confined; (2) The aquifer was homogenous, isotropic, and had a constant aquifer thickness over the area of influence during the test; (3) The piezometric surface was horizontal over the area influenced by the test before the start of the pumping test; (4) The aquifer was pumped at a constant discharge rate and the discharge borehole fully penetrated the entire thickness of the aquifer; (5) The flow to the borehole was in unsteady state; thus, drawdown change with time is negligible, nor is the hydraulic gradient constant with time [24]. The limitation of using the diagnostic straight-line fitting and Cooper–Jacob analytical solutions was revealed when calculating the storativity (S) for the fractured rock aquifer system. While the Cooper–Jacob equation is widely used in hydrogeology, it has several limitations when applied to a fractured rock aquifer [33]. It assumes uniform aquifer properties and does not account for the double-porosity system; instead, it assumes porous media flow [19,33]. Kruseman and Rider [24] and Grobler [32] stated that an incorrect or unrealistic S value can be obtained for fractured rock aquifers because the analytical solutions are not able to consider two or more aquifers at once. In this study, the aquifer thickness (b), transmissivity (T), storativity (S), and hydraulic conductivity (K) were the primary aquifer hydraulic parameters of interest. The T-value was estimated by fitting a straight line at the intermediate or late time using Equation (1).
T = 2.3 Q 4 π T l o g 2.25 T t 0 r 2 S
where T is the transmissivity (m2/day); S is the storativity; s is the drawdown (m); t0 (min) is a sufficiently late time during the hydraulic test, and r (m) is the distance from the pumping borehole, where s is measured in the observation borehole or piezometer [26]. Transmissivity as T is related to hydraulic conductivity K (m/day) through aquifer thickness b (m), as shown in Equation (2):
T = Kb
The hydraulic conductivity of an unconfined and confined aquifer was determined as a function of transmissivity divided by aquifer thickness [26]. Many practitioners have used this method to analyze drawdowns and recovery data in confined and unconfined aquifers, regardless of differences between field conditions and theory [32].
K = T b ,
where K is the hydraulic conductivity, b is the aquifer thickness, and T is the transmissivity. For storativity/storage coefficient values,
S s =   ρ g α + n β ,
where Ss is specific storage; ρ is fluid density; g is the acceleration of gravity; α is aquifer compressibility; n is the porosity, and β is the fluid compressibility. Storativity S is related to specific storage again through aquifer thickness b in
S = S s + b
Lohman [34] reported that the specific storage of a confined aquifer can be approximated as 0.0000033 (3.3 × 10⁻⁶). Michael et al. [35] reported that values for specific storage generally range from approximately 10−5 to 10−2 for materials in the confined aquifer system. Woesser et al. [36] suggested that the specific storage of a confined aquifer typically ranges from 1 × 10⁻⁵ to 1 × 10⁻³. In this study, the Lohman approximation was applied to estimate the storativity of a confined aquifer, where Equation (5) was applied.

5. Results

Analysis and Interpretation of the Pumping Test
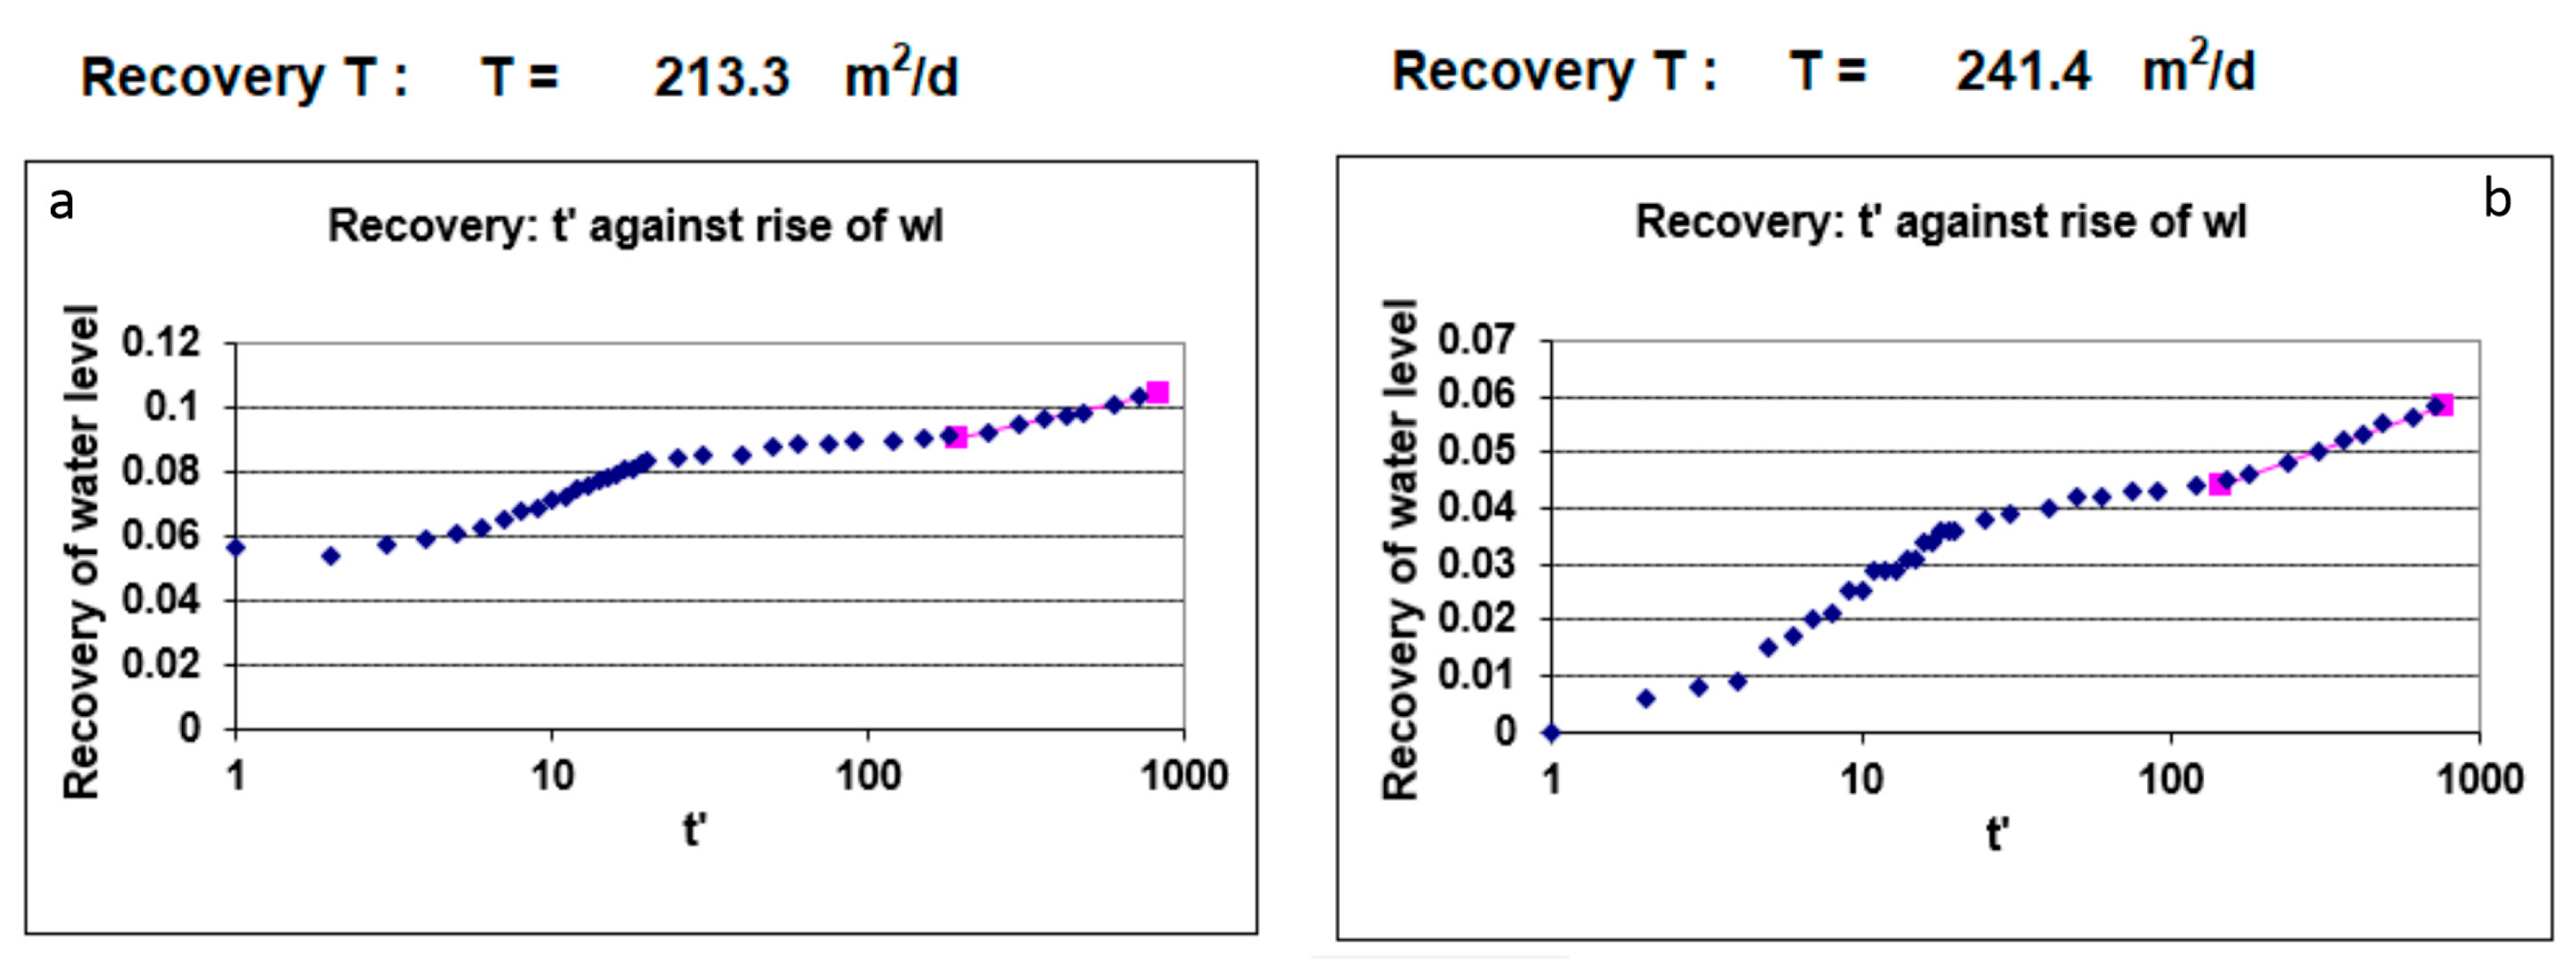
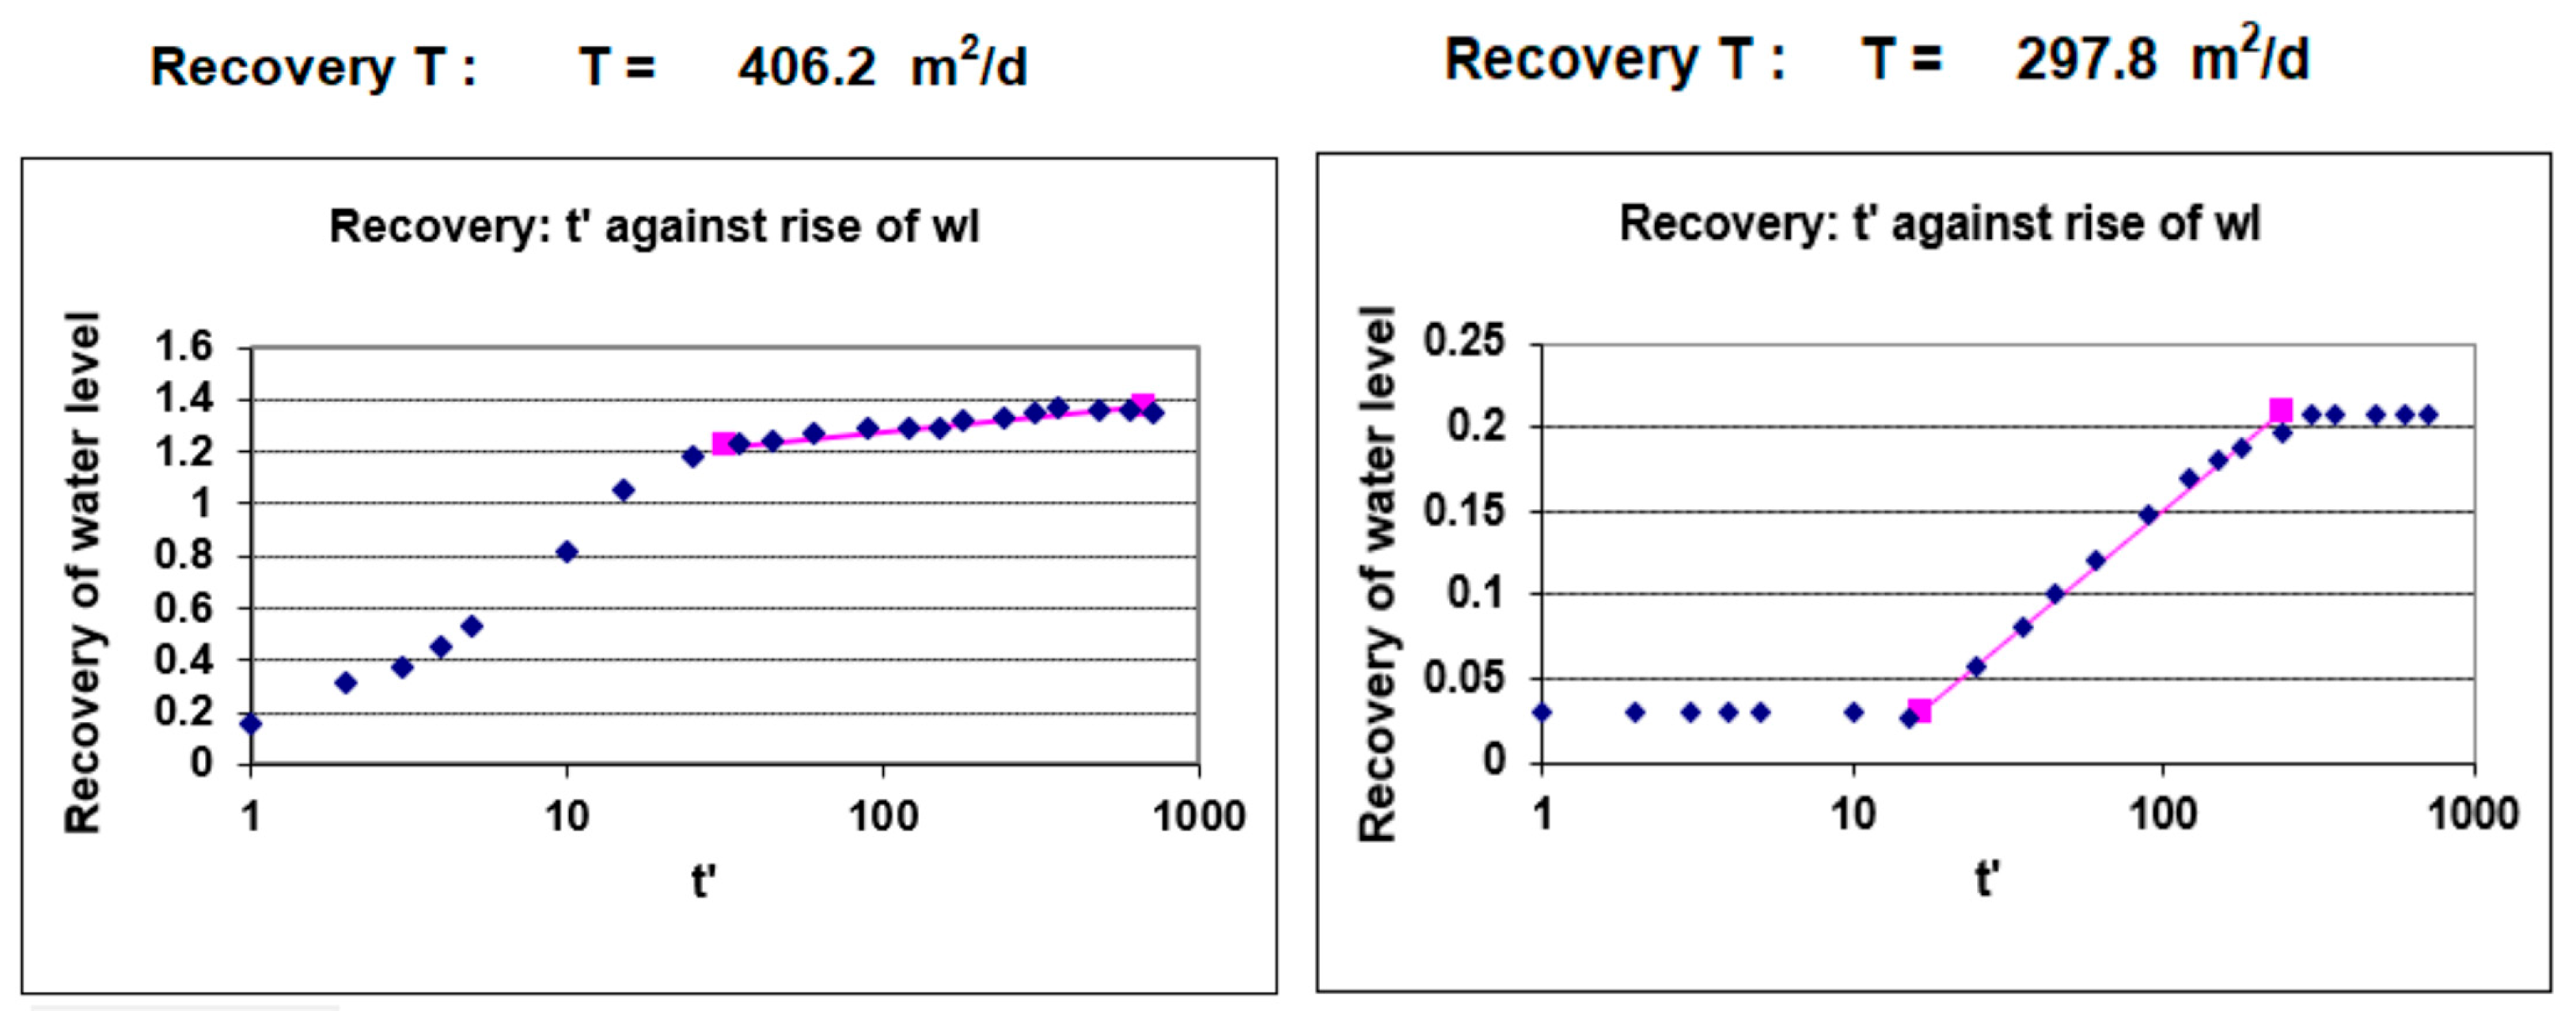
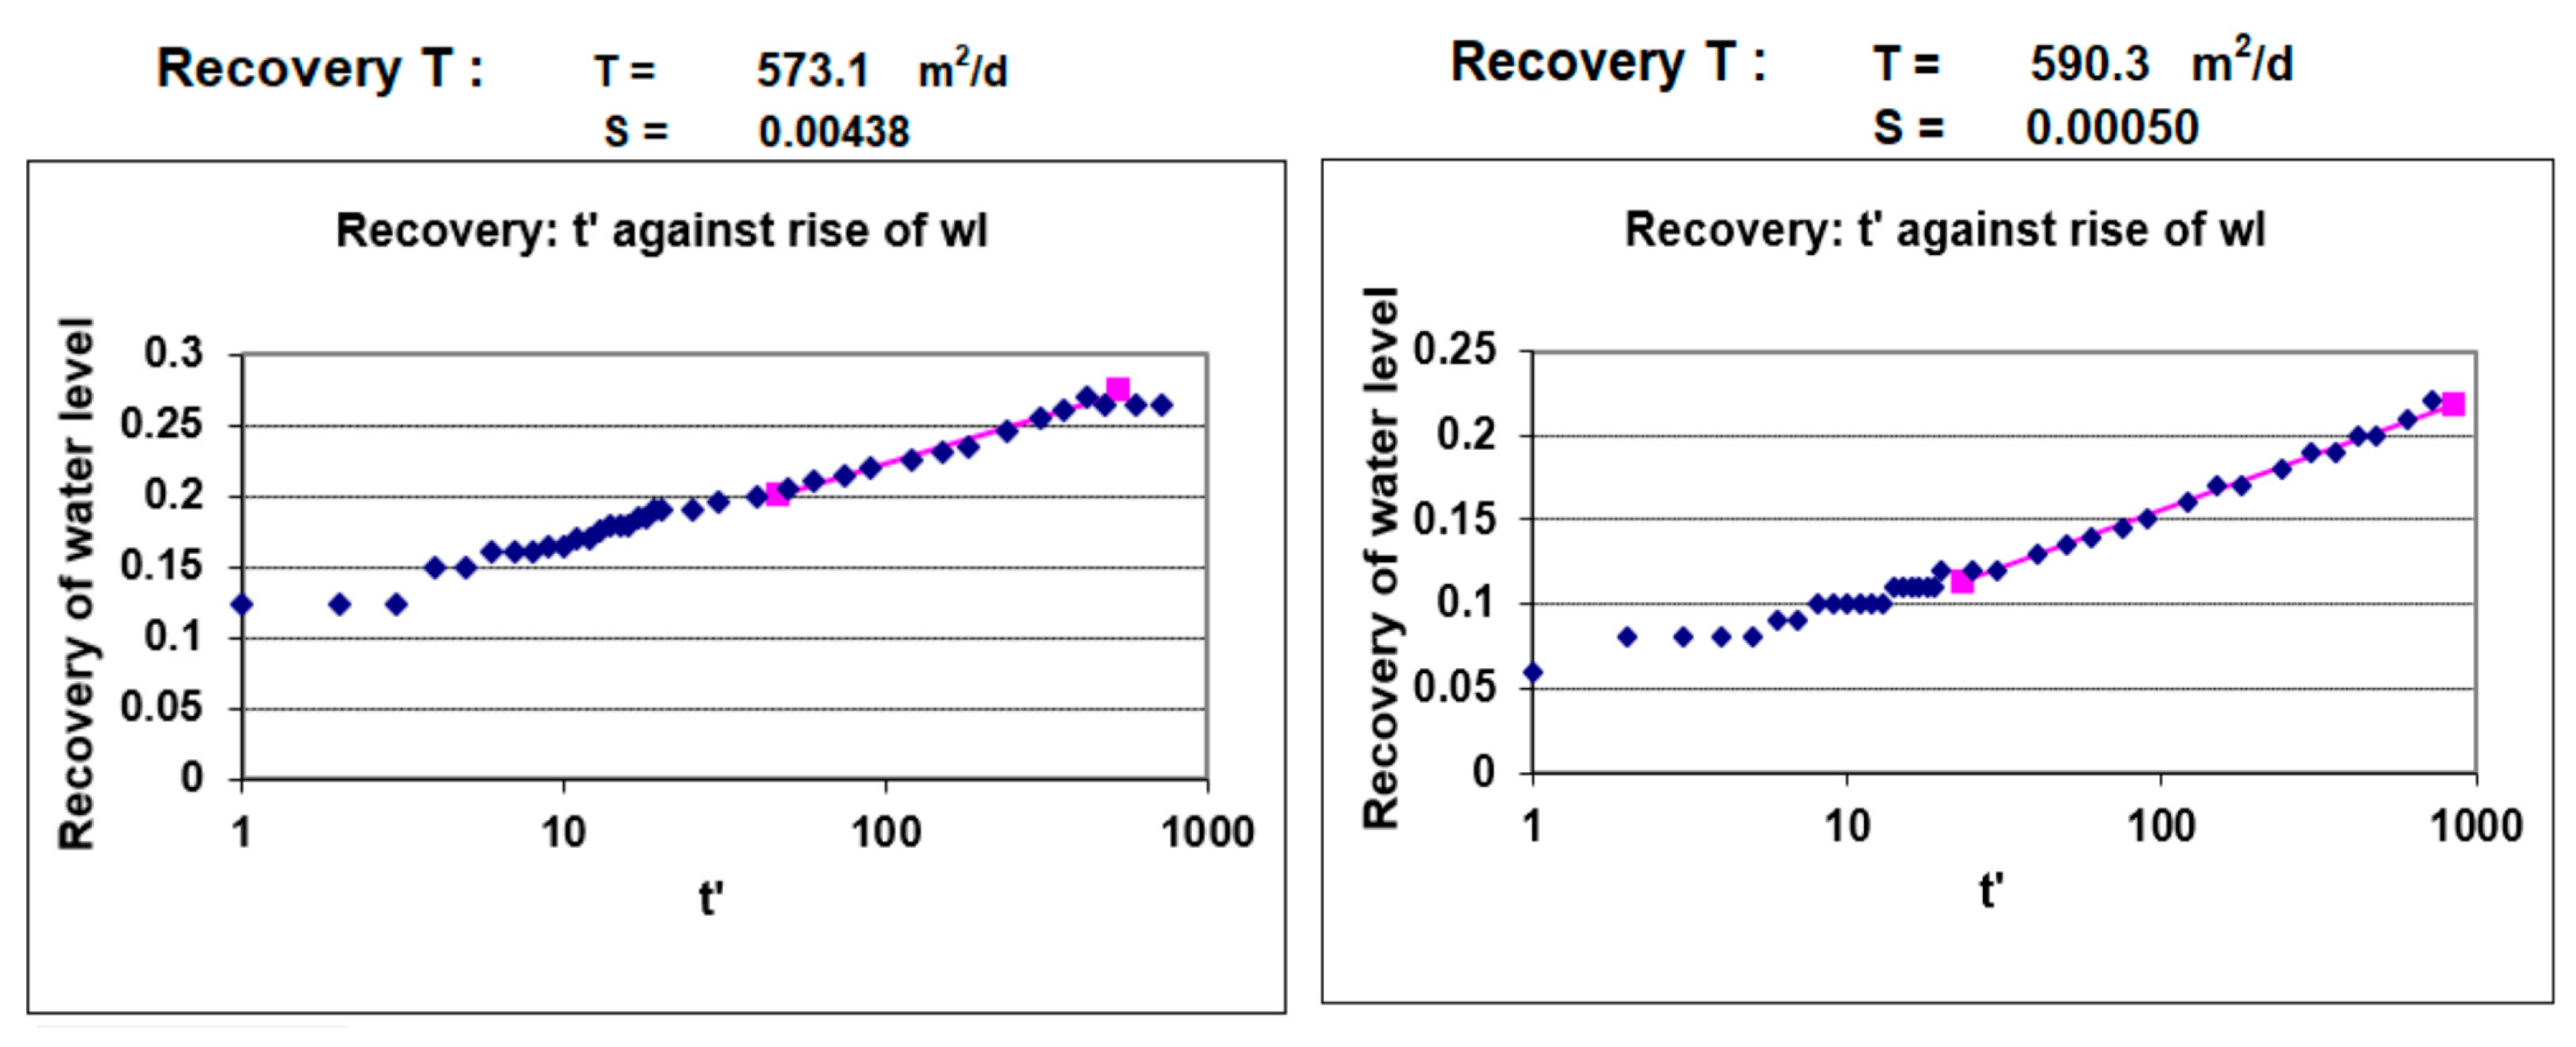
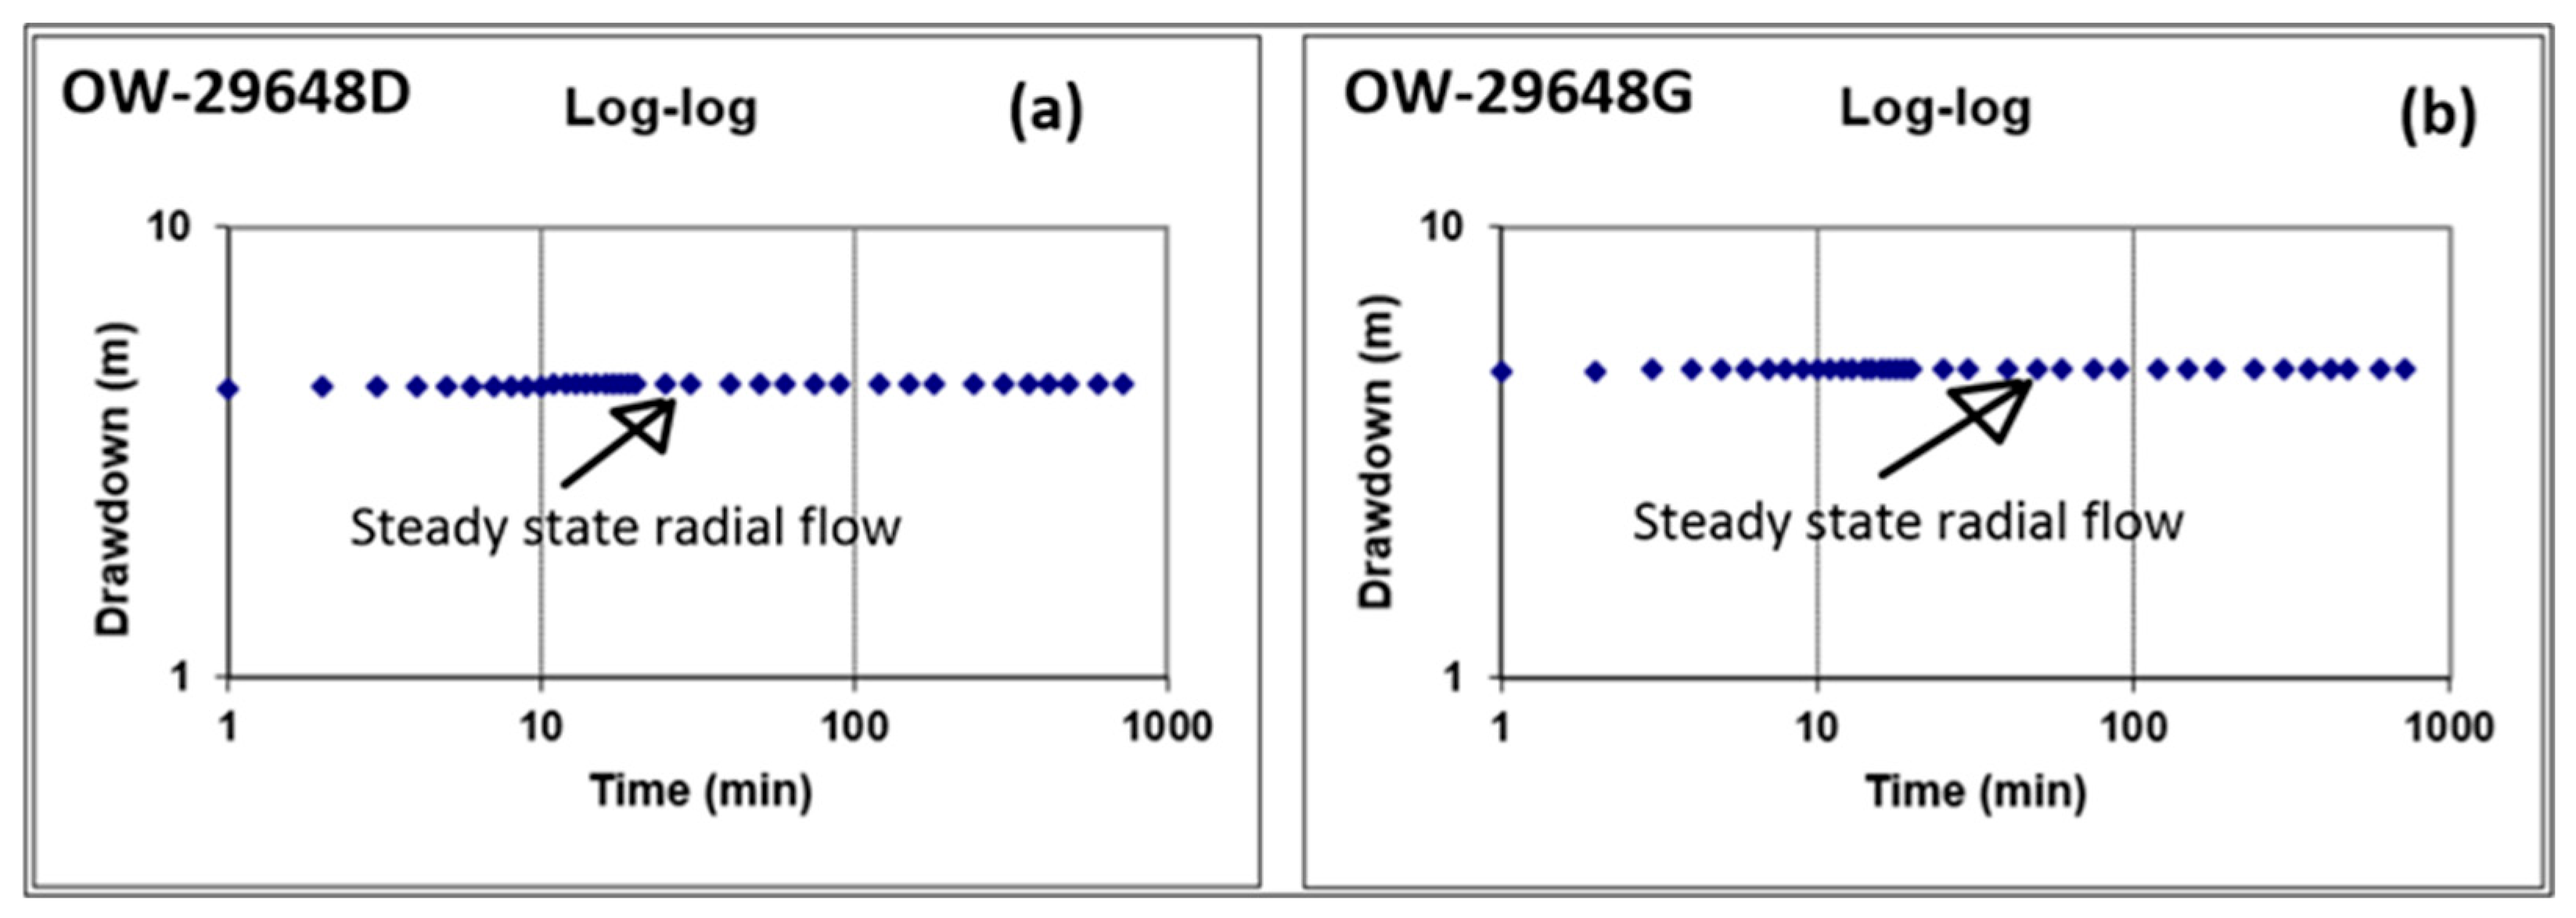
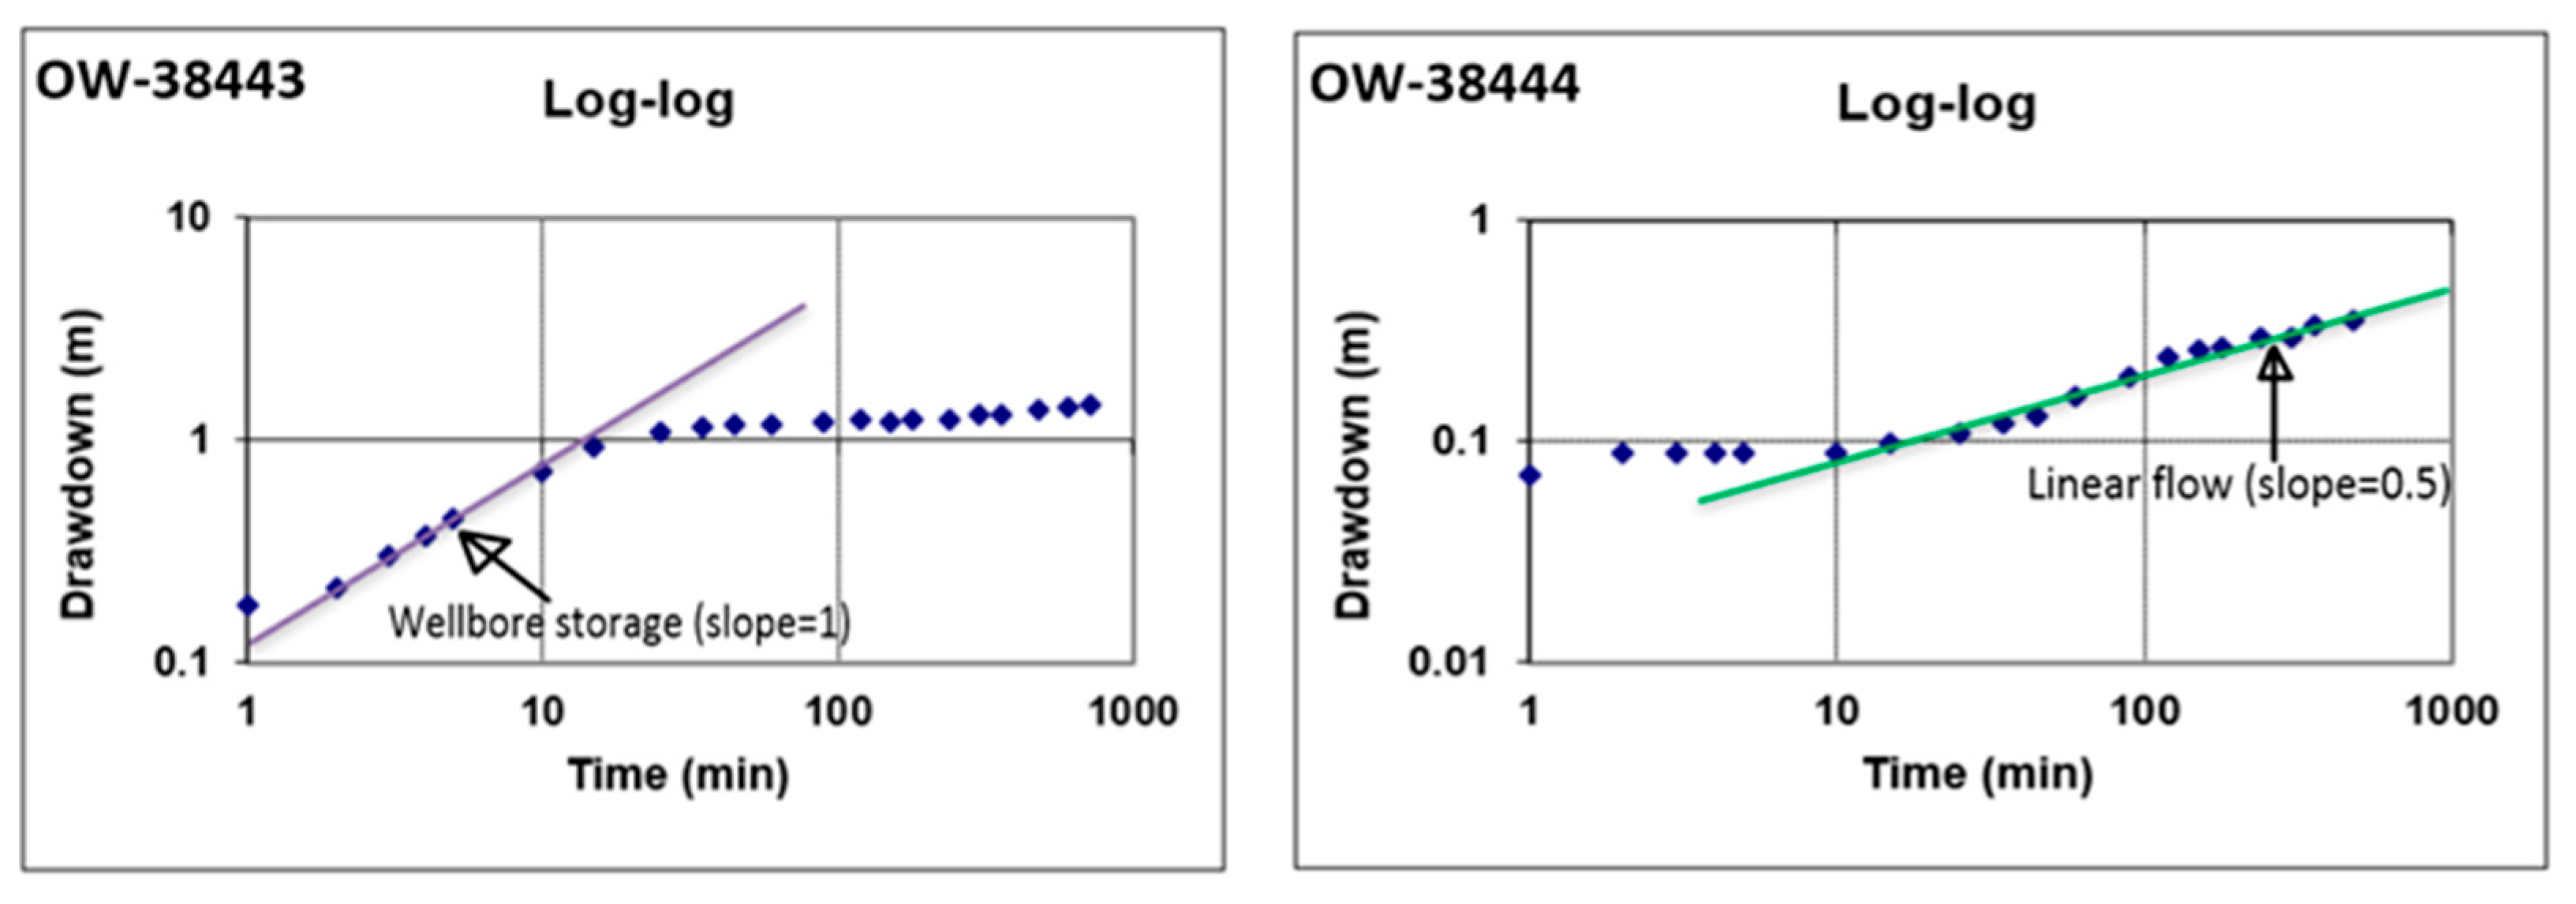
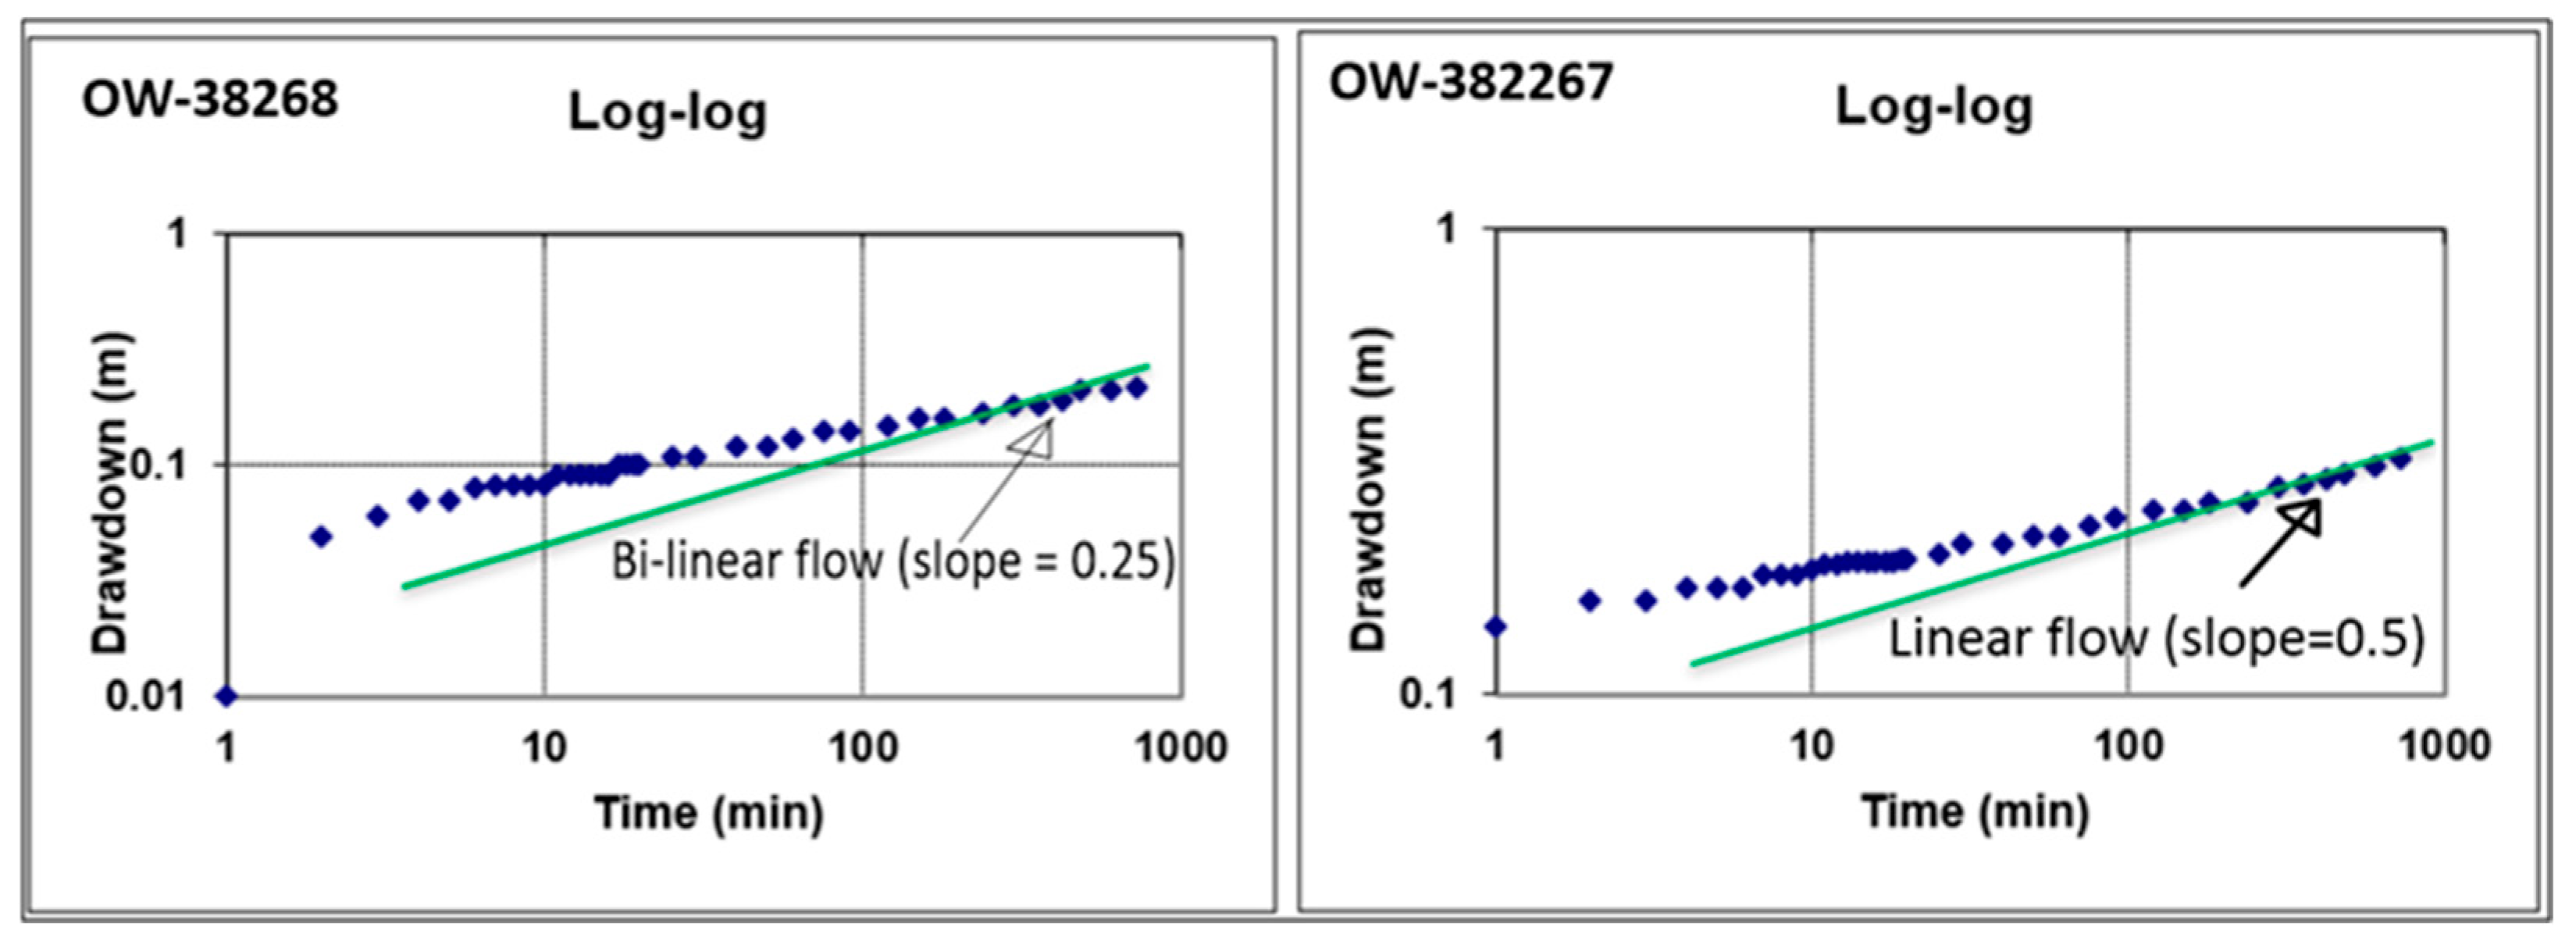
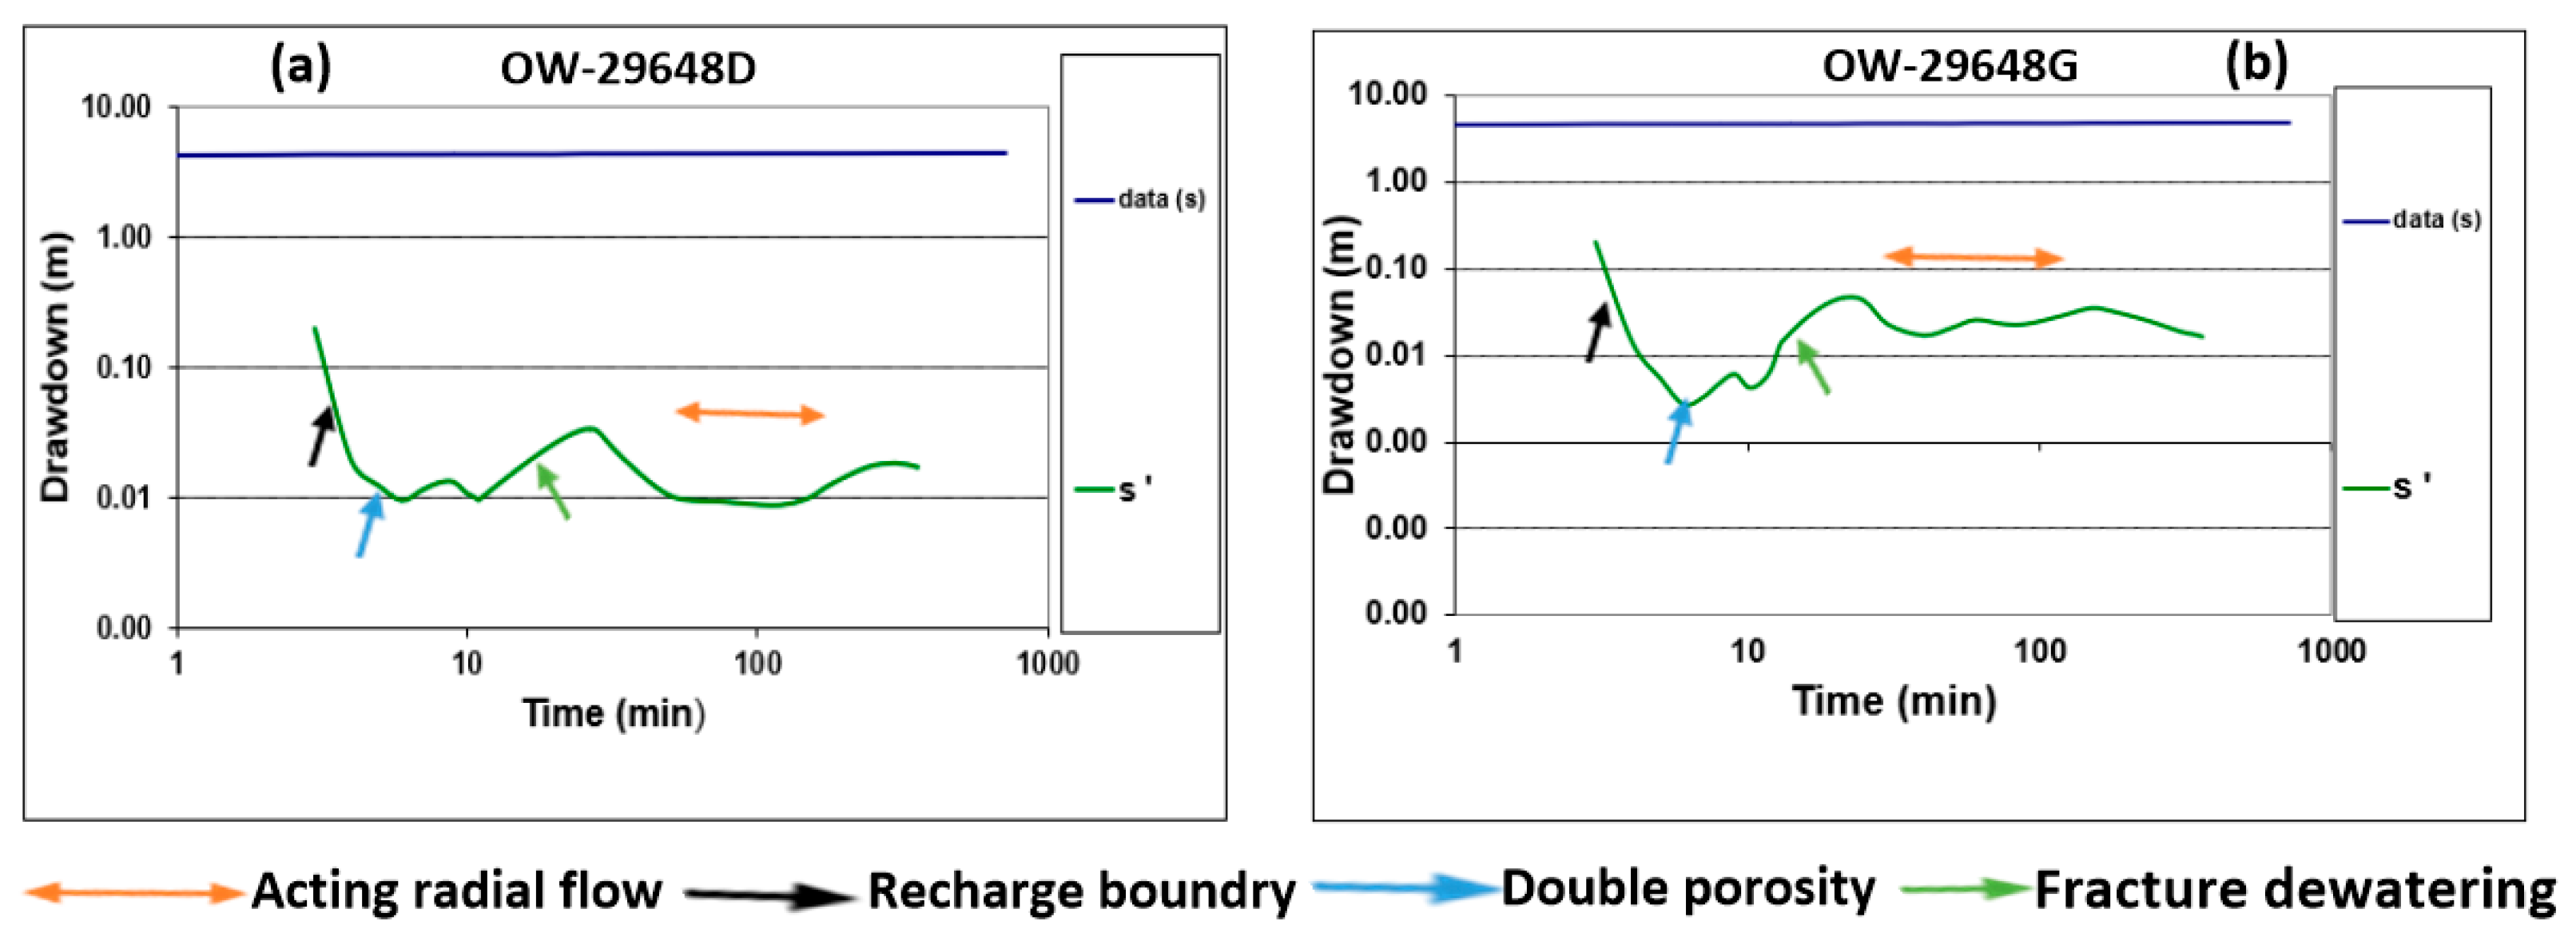
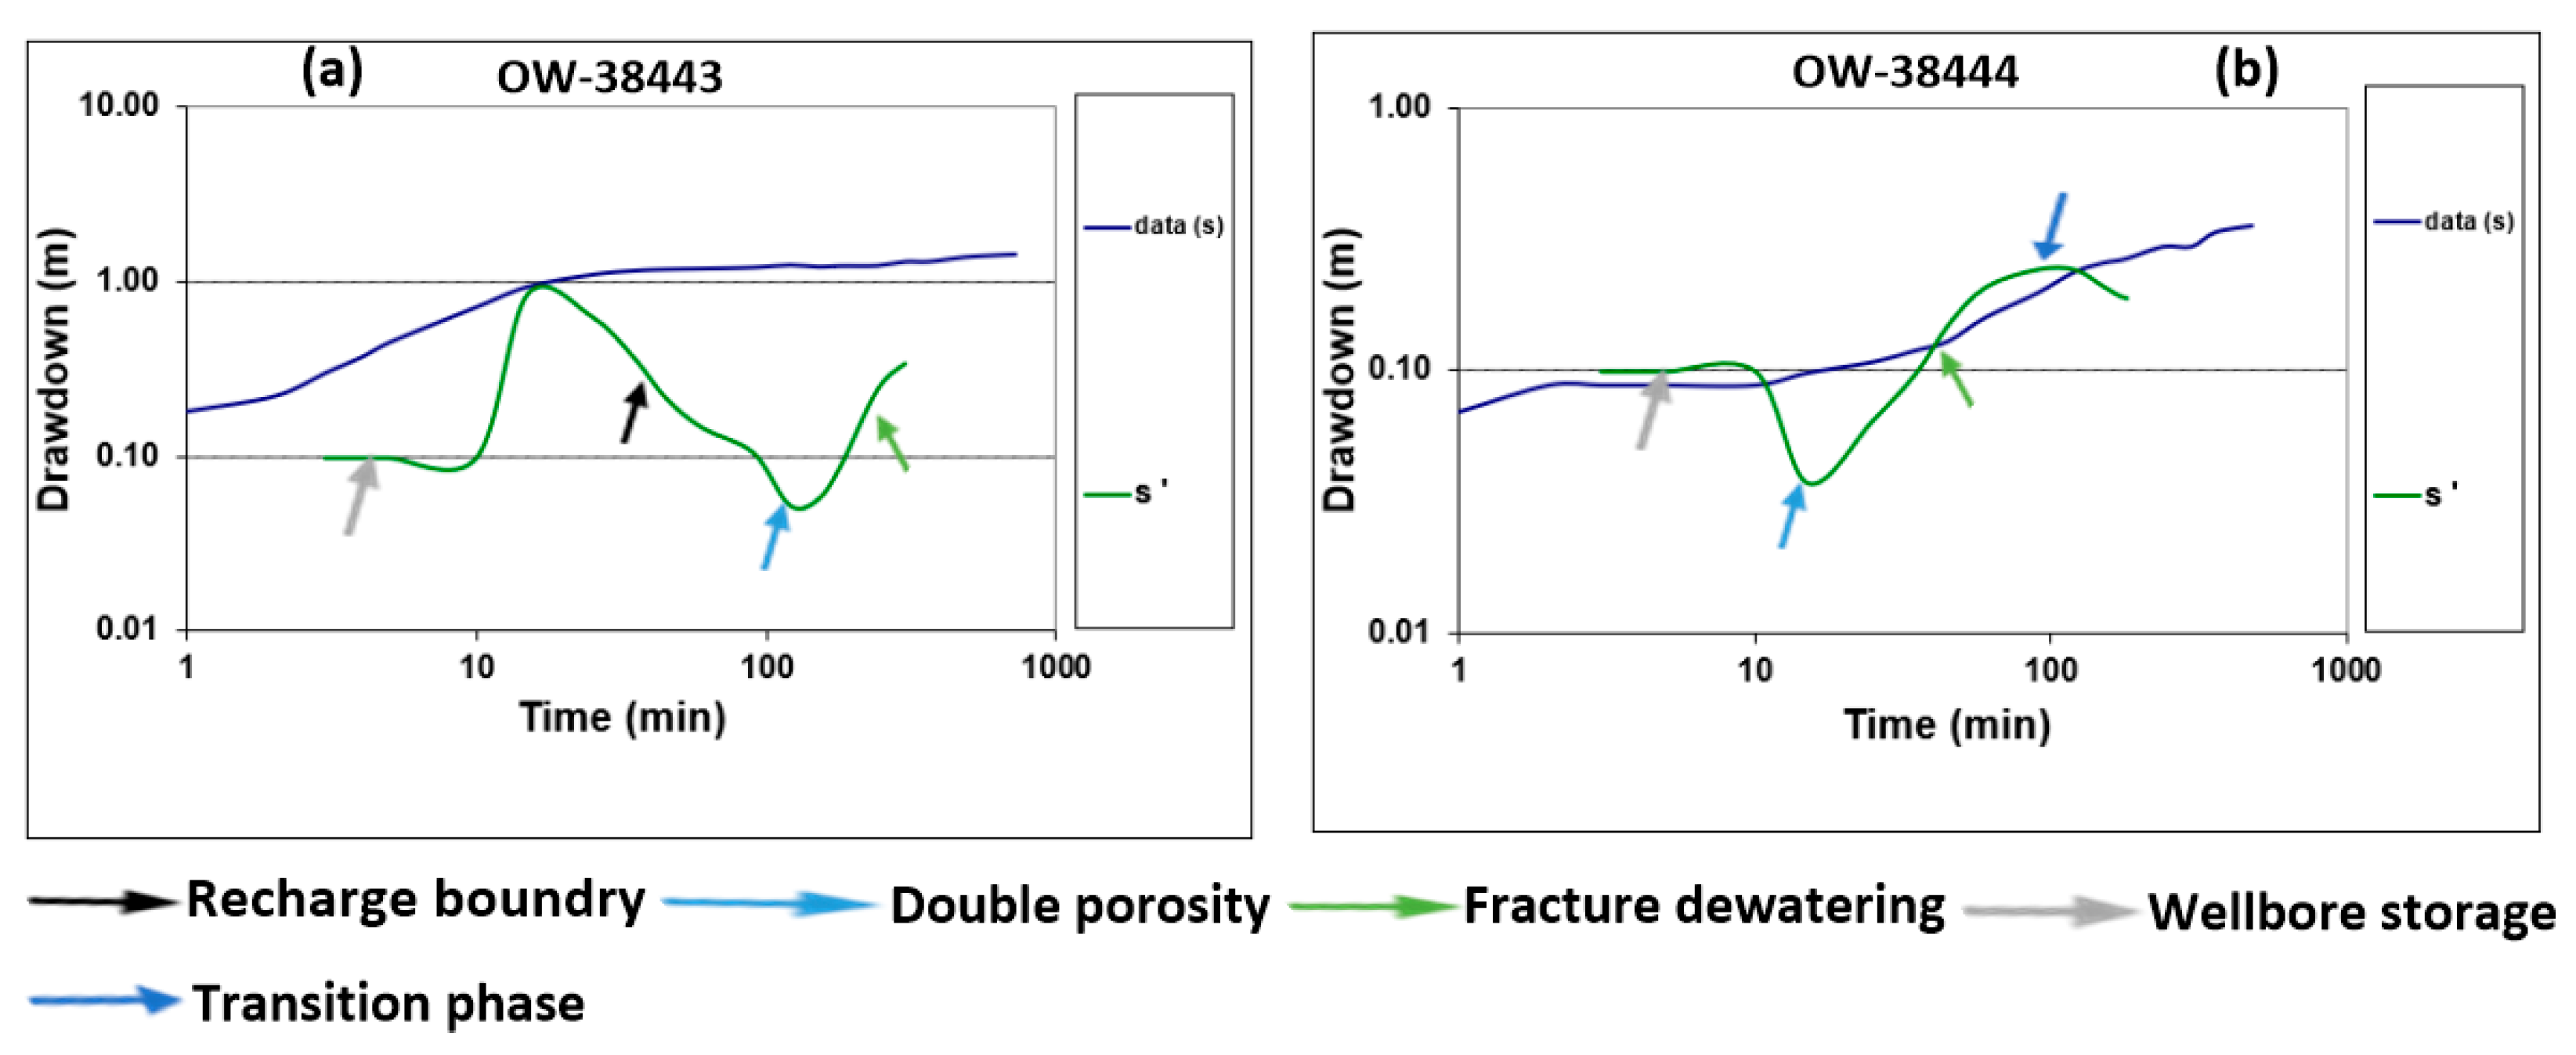
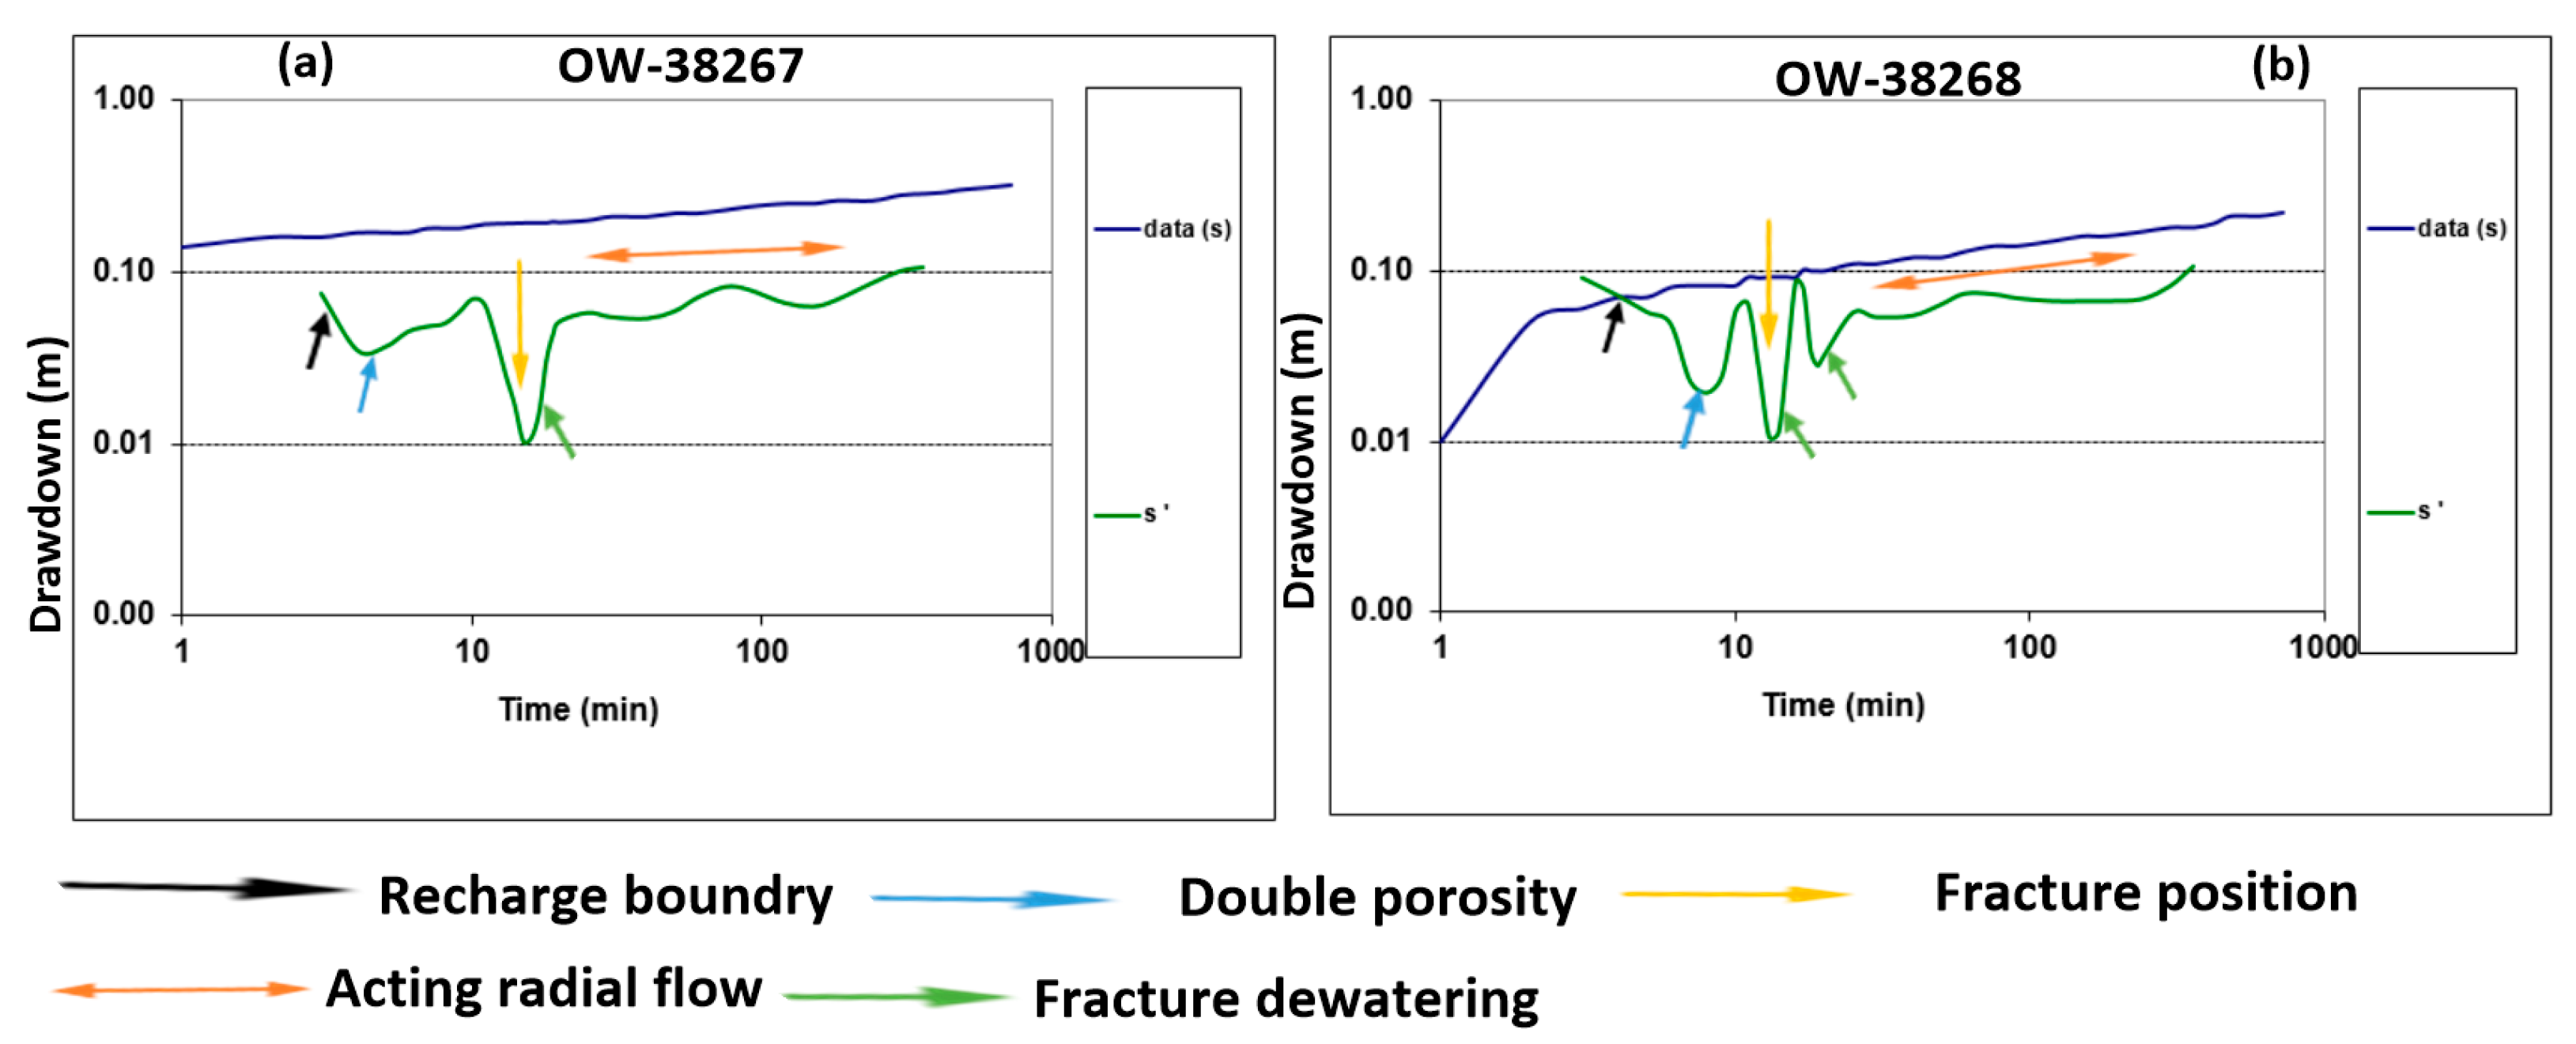
Figure 5, Figure 6 and Figure 7 show the patterns of recovery data from the observation boreholes throughout the study area. The estimated values of the aquifer hydraulic parameters are displayed in Table 3. The Flow Characteristic method yielded transmissivity values ranging from 213 to 596 m2/day, hydraulic conductivity values ranging from 8 to 42 m/day, and storativity values ranging from 0.0000297 to 0.000185 (Table 3). In contrast, the Cooper–Jacob storativity and transmissivity values were 0.000759–0.039 and 55–563 m2/day, respectively (Figure A1, Figure A2 and Figure A3). According to Vegter [22], the transmissivity and storativity in fractured bedrock environments range from 155 m2/day to 773 m2/day, while in alluvial deposits, they typically range from 212 m2/day to 347 m2/day and from 0.004 to 0.143, respectively. The storativity and transmissivity of the lower catchment are comparatively lower than those of the middle and upper catchments (Figure 5, Figure 6 and Figure 7. Additionally, the lower catchment had low hydraulic conductivity and aquifer thickness values, whereas the middle and upper catchments had significantly moderate to high values (Figure 5, Figure 6 and Figure 7). The aquifer thickness values varied from 9 to 56 m (Table 3). The alluvium sand–clay material represented the unconfined aquifers that ranged from 0 to 10 m, indicating a comparatively low to moderate storage capacity. In semi-confined aquifers, the estimated aquifer thickness ranged from 10 to 56 m, indicating greater water storage capacity (Table 3). Figure 8, Figure 9 and Figure 10 present the patterns of the drawdown data from observation boreholes to evaluate the dominant flow regime within the study area. The results show a stabilization trend from the start to the end of the pumping test (Figure 8). Two distinct flow types were observed in the middle catchment. The first flow has a gradient slope of 1.0 at early time, between 5 and 20 min, indicating a wellbore storage, while the other flow has a slope of 0.5 at intermediate to late time, between 30 and 480 min, indicating linear flow condition (Figure 9). In the upper catchment, two flow regimes exist, one with a slope of 0.25 and the other with a slope of 0.5 in the late period between 240 and 720 min (Figure 10). The plot with a slope of 0.25 indicates bi-linear flow and 0.5 linear flow conditions. The drawdown derivative plot in the lower catchment indicates a quick decline curve around 5 min early time, between 15 and 100 min into the intermediate phase in the middle catchment, and during the early period of 8 min after pumping starts in the upper catchment, suggesting a recharge boundary (Figure 11, Figure 12 and Figure 13). The observed acting radial flow condition during an intermediate phase that follows the double-porosity dip system represents a different fracture position (Figure 11a,b). These results agree with those reported by Veltman [37], who suggested that the confined nature of the aquifer changes to a semi-confined or leaky aquifer once the primary fracture at the borehole is dewatered, which is the situation in the study area. The middle catchment’s derivative plots show wellbore storage in the early period, lasting between 5 and /8 min, followed by dewatering (Figure 11a). The transition period and the beginning of a double-porosity dip are indicated by the first phase of early time, 5–10 min after pumping starts in the lower and upper catchment, while in the middle catchment, it is seen during the intermediate phase (Figure 11, Figure 12 and Figure 13). Fracture dewatering is shown during the intermediate phase after 10 min of pumping, indicating that a no-flow boundary may have been reached in all catchments (Figure 13a,b).

6. Discussion

6.1. Aquifer Hydraulic Parameter

The transmissivity, hydraulic conductivity, aquifer thickness, and storativity are the four primary aquifer hydraulic parameters of interest, which help define how water moves and is stored within the aquifer system. The two most important of the four parameters are transmissivity and storativity. The latter, in the context of an unconfined aquifer, is referred to as specific yield (Figure 5, Figure 6 and Figure 7). Although the Cooper–Jacob values were marginally lower than those of the Flow Characteristic (FC) method, both the FC and Cooper–Jacob procedures have produced comparable parameter values. In the lower and middle catchments, transmissivity and hydraulic conductivity decreased with increasing distance, indicating lower groundwater transmission. In contrast, the upper catchment showed higher transmissivity closer to the source, suggesting a greater groundwater flow capacity (Figure 5, Figure 6 and Figure 7). According to Gomo [16], the general increase in transmissivity with observation distance can be attributed to the fact that, as the observation distance from a pumping borehole increases, the rate of hydraulic head decline decreases continuously as the aquifer’s area of influence expands. Similarly, storativity values increased with increasing aquifer thickness, suggesting that large quantities of water can be stored and released due to pressure charges, and this often correlates with regional recharge potential areas (Table 3). The storativity values ranged from 0.0000297 to 0.000185, which is characteristic of confined aquifers. The lowest value of 0.0000297 suggests tight, low-storage confined aquifers. The highest value of 0.000185 suggests a confined aquifer with somewhat higher compressibility, still much lower than unconfined conditions. The highest value of 0.000185 suggests a confined aquifer with somewhat higher compressibility, still much lower than unconfined conditions. In terms of groundwater availability in the study area, low storativity means that the aquifer does not hold or release much water per unit area per change in head. Regarding the pumping response, the early pumping stage, which resulted in a rapid drawdown near the borehole, was due to the small storativity, which made the aquifer feel tight, causing only small changes in head and releasing only small amounts of water. The later pumping stage could have resulted in the drawdown cone expanding farther out in the aquifer to supply the same pumping rate. The influence of a pumping borehole can extend for tens of kilometers in confined systems with low storativity. Thirdly, when the obtained values were compared, one can say that the lowest value (0.0000297) suggested a tight aquifer, shown by sharp drawdowns, suggesting a wide area affected, leading to slower recovery after pumping. These results imply that a careful groundwater allocation plan must be implemented more specifically in the lower catchment to prevent users from receiving too much or too little groundwater. Woessner et al. [36] indicated that since a system with a higher transmissivity can transport more water, it is a better target for groundwater allocation. Despite low rainfall, the middle and upper catchment aquifers proved most reliable for sustainable groundwater supply, with sand clay storing more water but releasing it slowly, while fractured rocks like mudstone, sandstone, shale, and dolerite provided faster, long-term groundwater availability [36]. The multiple water strikes intersected at the middle and upper catchment sites, especially in areas with fractured shale, dolerite, mudstone, or sandstone, suggest vertical and horizontal connectivity between aquifer units. According to Vegter [22], these aquifers are highly transmissive fractures, representing confined or semi-confined aquifers. The current study found that thick clay layers were present in the lower catchment, where only a single fracture flow was observed during pumping tests, which restricted the movement of water. According to Igwebuike et al. [38], deeper semi-confined aquifer layers may interact with the shallow unconfined layers if the clay layer is not continuous. The author highlighted the fact that these clay-free areas may pose a risk to groundwater quality protection since they could provide entry points for pollutants. The discussion on the use of aquifer hydraulic parameters for assessing local and regional recharge and its potential implications for recharge potentials is generally limited in the literature, and therefore, this study aims to address the information gap.

6.2. Determining Flow Characteristics Using the Method of Derivative Fitting

Figure 8, Figure 9 and Figure 10 present log–log plots of drawdown data used to estimate the flow regime via the method of derivative fitting (MDF). The stabilization of the drawdown curve between 1 and 720 min indicates that steady-state radial flow away from the borehole was reached early within 12 h (Figure 8). On the West Coast, South Africa, Igwebuike et al. [38] reported that when the plot stabilizes in the sedimentary and igneous rock formations, it shows a flat circular disc, indicating that a horizontal flow pathway converged in the borehole throughout that period. He further suggested that the aquifer’s permeability might have allowed water to enter from all directions. Typically, drawdown follows a non-linear pattern initially and stabilizes over time. However, Barker [39] noted a contrasting observation, suggesting that under steady-state conditions, inflow declines rapidly, simplifying steady-state prediction for practitioners. To simplify the analysis and discussion of the results in this study, it was assumed that the system was in a steady state condition for the period of investigation [39]. Furthermore, the results were interpreted along with borehole logs and compared with previously estimated flow regimes for calibration and validation purposes [24]. Nonetheless, these findings suggest a homogeneous fractured aquifer environment composed of shale and dolerite formation in the lower catchment, which is indicative of uniform permeability and makes the radial-acting flow a reliable approximation (Figure 8). It assumes an equilibrium system, which means that over time, the rates of inflow into the borehole were equal to the rate of outflow during the pumping test. In water allocation, steady-state conditions simplify modeling; however, without close monitoring, groundwater allocations and recharge potential are often overestimated. The wellbore storage was observed in the middle catchment between 1 and 10 min early time. According to Bennett et al. [31], wellbore storage indicates that the water may have been briefly stored in the boreholes before the adjacent aquifer started contributing to the drawdown decrease. On the other hand, Veltman [37] fitted the early time data and found a similar gradient at early and intermediate times, while the late time data displayed a double-porosity system. The findings of this study support the hypotheses of Van Tonder et al. [40], who stated that, for a horizontal fracture, the flow from the matrix to the fracture is constant as long as the piezometric level in the rock matrix does not significantly alter over time, as was the case in this investigation during the pumping test. Since water held in the wellbore storage flow was released before the aquifer surrounding the borehole stabilizes, groundwater allocation based on wellbore storage will be erroneous. This is because the wellbore storage flow can indicate a high-yielding aquifer, leading to over-allocation of groundwater by practitioners. To provide sustainable long-term groundwater allocation, it is recommended that practitioners integrate the wellbore storage with regional recharge (horizontal), as nearby boreholes might only be able to recharge locally (vertical) under linear flow conditions. According to Van Tonder [19], groundwater under linear flow conditions is largely confined to a small zone and is horizontally restricted to a narrow region surrounding the borehole, usually in the radial direction. Bilinear flow was detected in both the middle and upper catchment (Figure 9 and Figure 10). The linear flow suggested a single flow pathway through fractures; meanwhile, the bi-linear flow suggested two flow pathways, one through fracture networks and the other through the underlying matrix, making it a double-porosity system. Spane et al. [41] suggested that a non-radial flow condition can be a sign of a boundary condition that diverges from the horizontal flow direction or a vertical flow leaky aquifer. When groundwater allocation is based on bilinear flow conditions, it can be affected, which makes it harder to predict how groundwater would behave in different locations, resulting in over-allocation of groundwater, especially if recharge is limited.

6.3. Derivative Plot Analysis of the Drawdown Data

Figure 11, Figure 12 and Figure 13 show drawdown derivative plots and observation data indicating a recharge boundary, marked by early and intermediate declines in pressure. This suggests water inflow from the surrounding rock matrix, similar to findings by Veltman [37], where early recharge points implied external water sources like surface water. Effective groundwater management in such systems should account for contributions from nearby water bodies and leaky aquifers, as these can introduce pollutants across layers and impact drinking water quality, necessitating regular monitoring. The observed double-porosity dip after the intermediate-phase radial flow indicates a secondary fracture response, where the rock matrix gradually releases water post-fracture dewatering (Figure 11a,b). This aligns with Veltman [37], who reported that dewatering of primary fractures can shift a confined aquifer to a semi-confined or leaky state, as seen in the study area. Van Tonder et al. [42] reported that early-time drawdown in a double-porosity aquifer shows a straight line on a semi-log plot, reflecting fracture-controlled flow. As matrix storage contributed over time, the curve flattened, which was consistent with the findings of this study, where initial flow was dominated by fractures, followed by delayed matrix contribution in recharge. If groundwater allocations are based on these assumptions, there is a risk of over-allocating groundwater, as double-porosity or radial flow often overestimates the actual groundwater flow [42]. In the middle catchment, early-time derivative plots (5–8 min) indicate wellbore storage, followed by fracture dewatering (Figure 11a). Botha et al. [43] reported that highly permeable fractures dewater quickly under pumping unless replenished, raising sustainability concerns. Van Tonder et al. [42] warned that such dewatering can lead to clogging from mineral precipitation. In the study area, fracture dewatering and double-porosity dips are key to the flow regime, aligning with Veltman [37], who observed similar patterns in the Karoo fracture-dominated environment. As reported by Sun et al. [44], a wellbore storage can be misinterpreted as radial flow, potentially leading to incorrect parameter estimation. Because of the high degree of fracturing and connectivity, the geology in the upper catchments supported the regional recharge potentials in the context of the recharge mechanism. While fracture dewatering offers short-term groundwater access, it poses long-term risks by potentially depleting the aquifer. Effective allocation planning must consider fracture–matrix interactions, slow matrix recharge, and the need to balance immediate use with long-term sustainability.

6.4. Determining Local and Regional Recharge Potentials

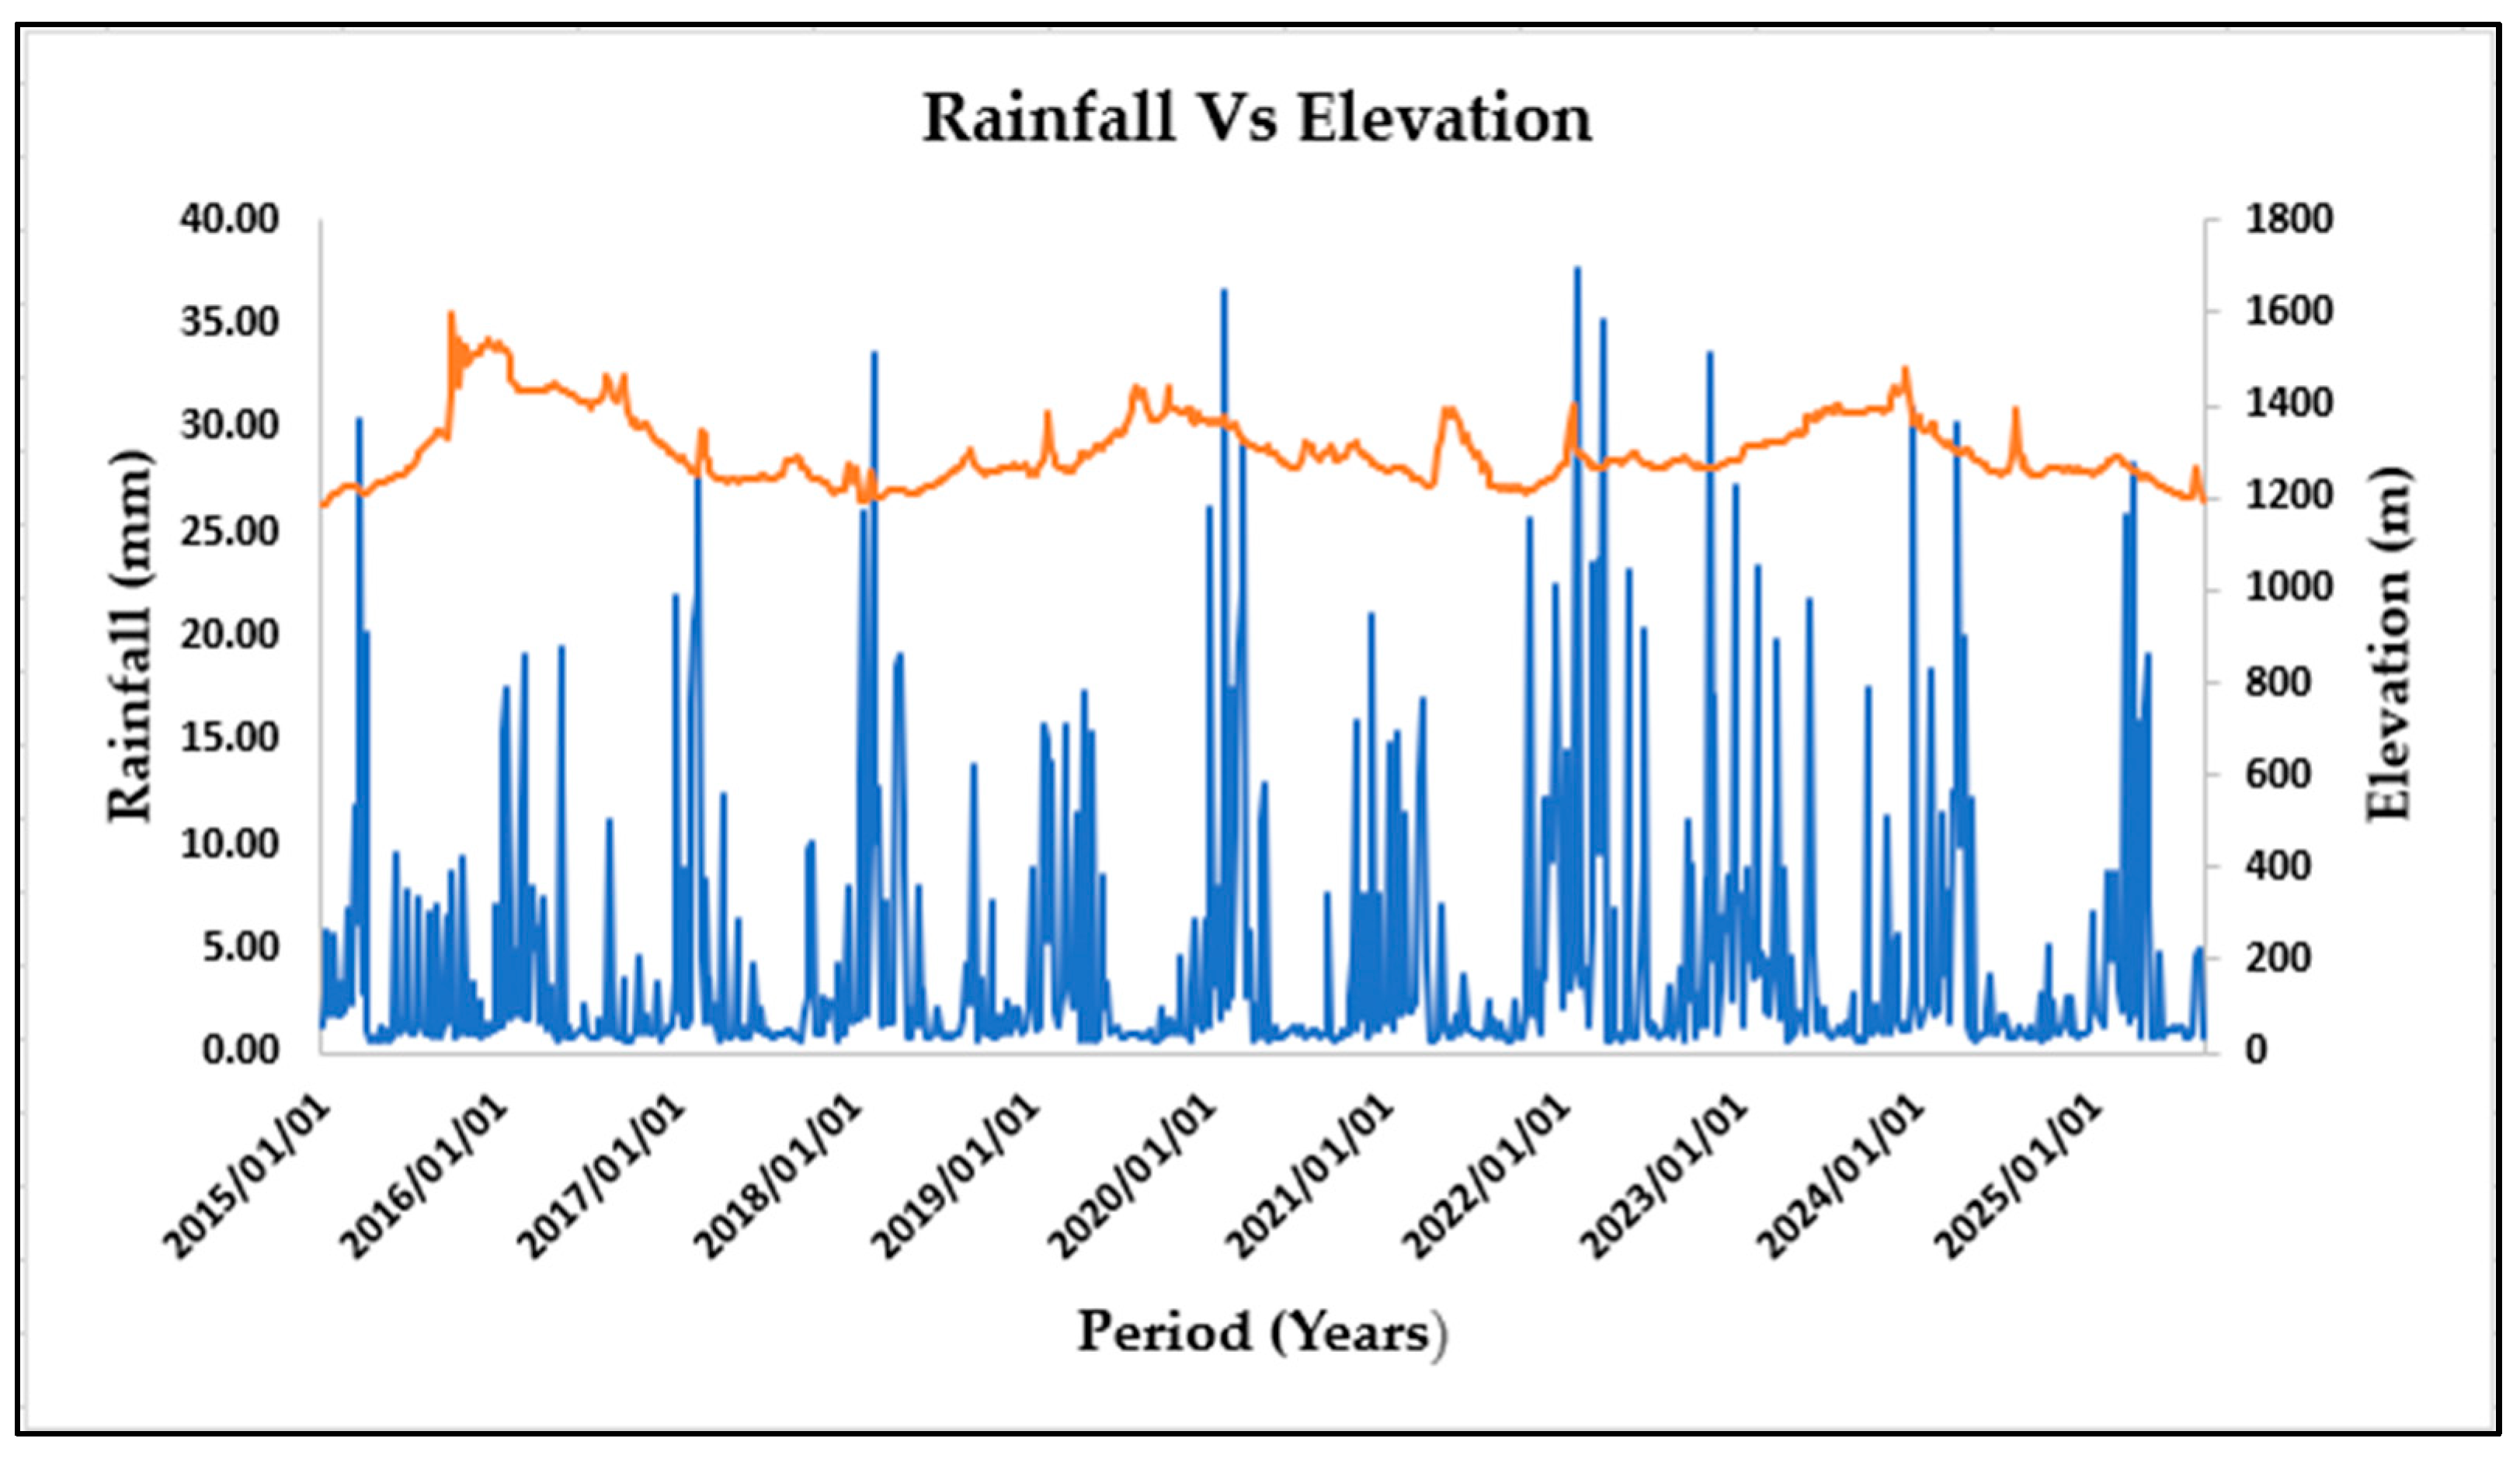
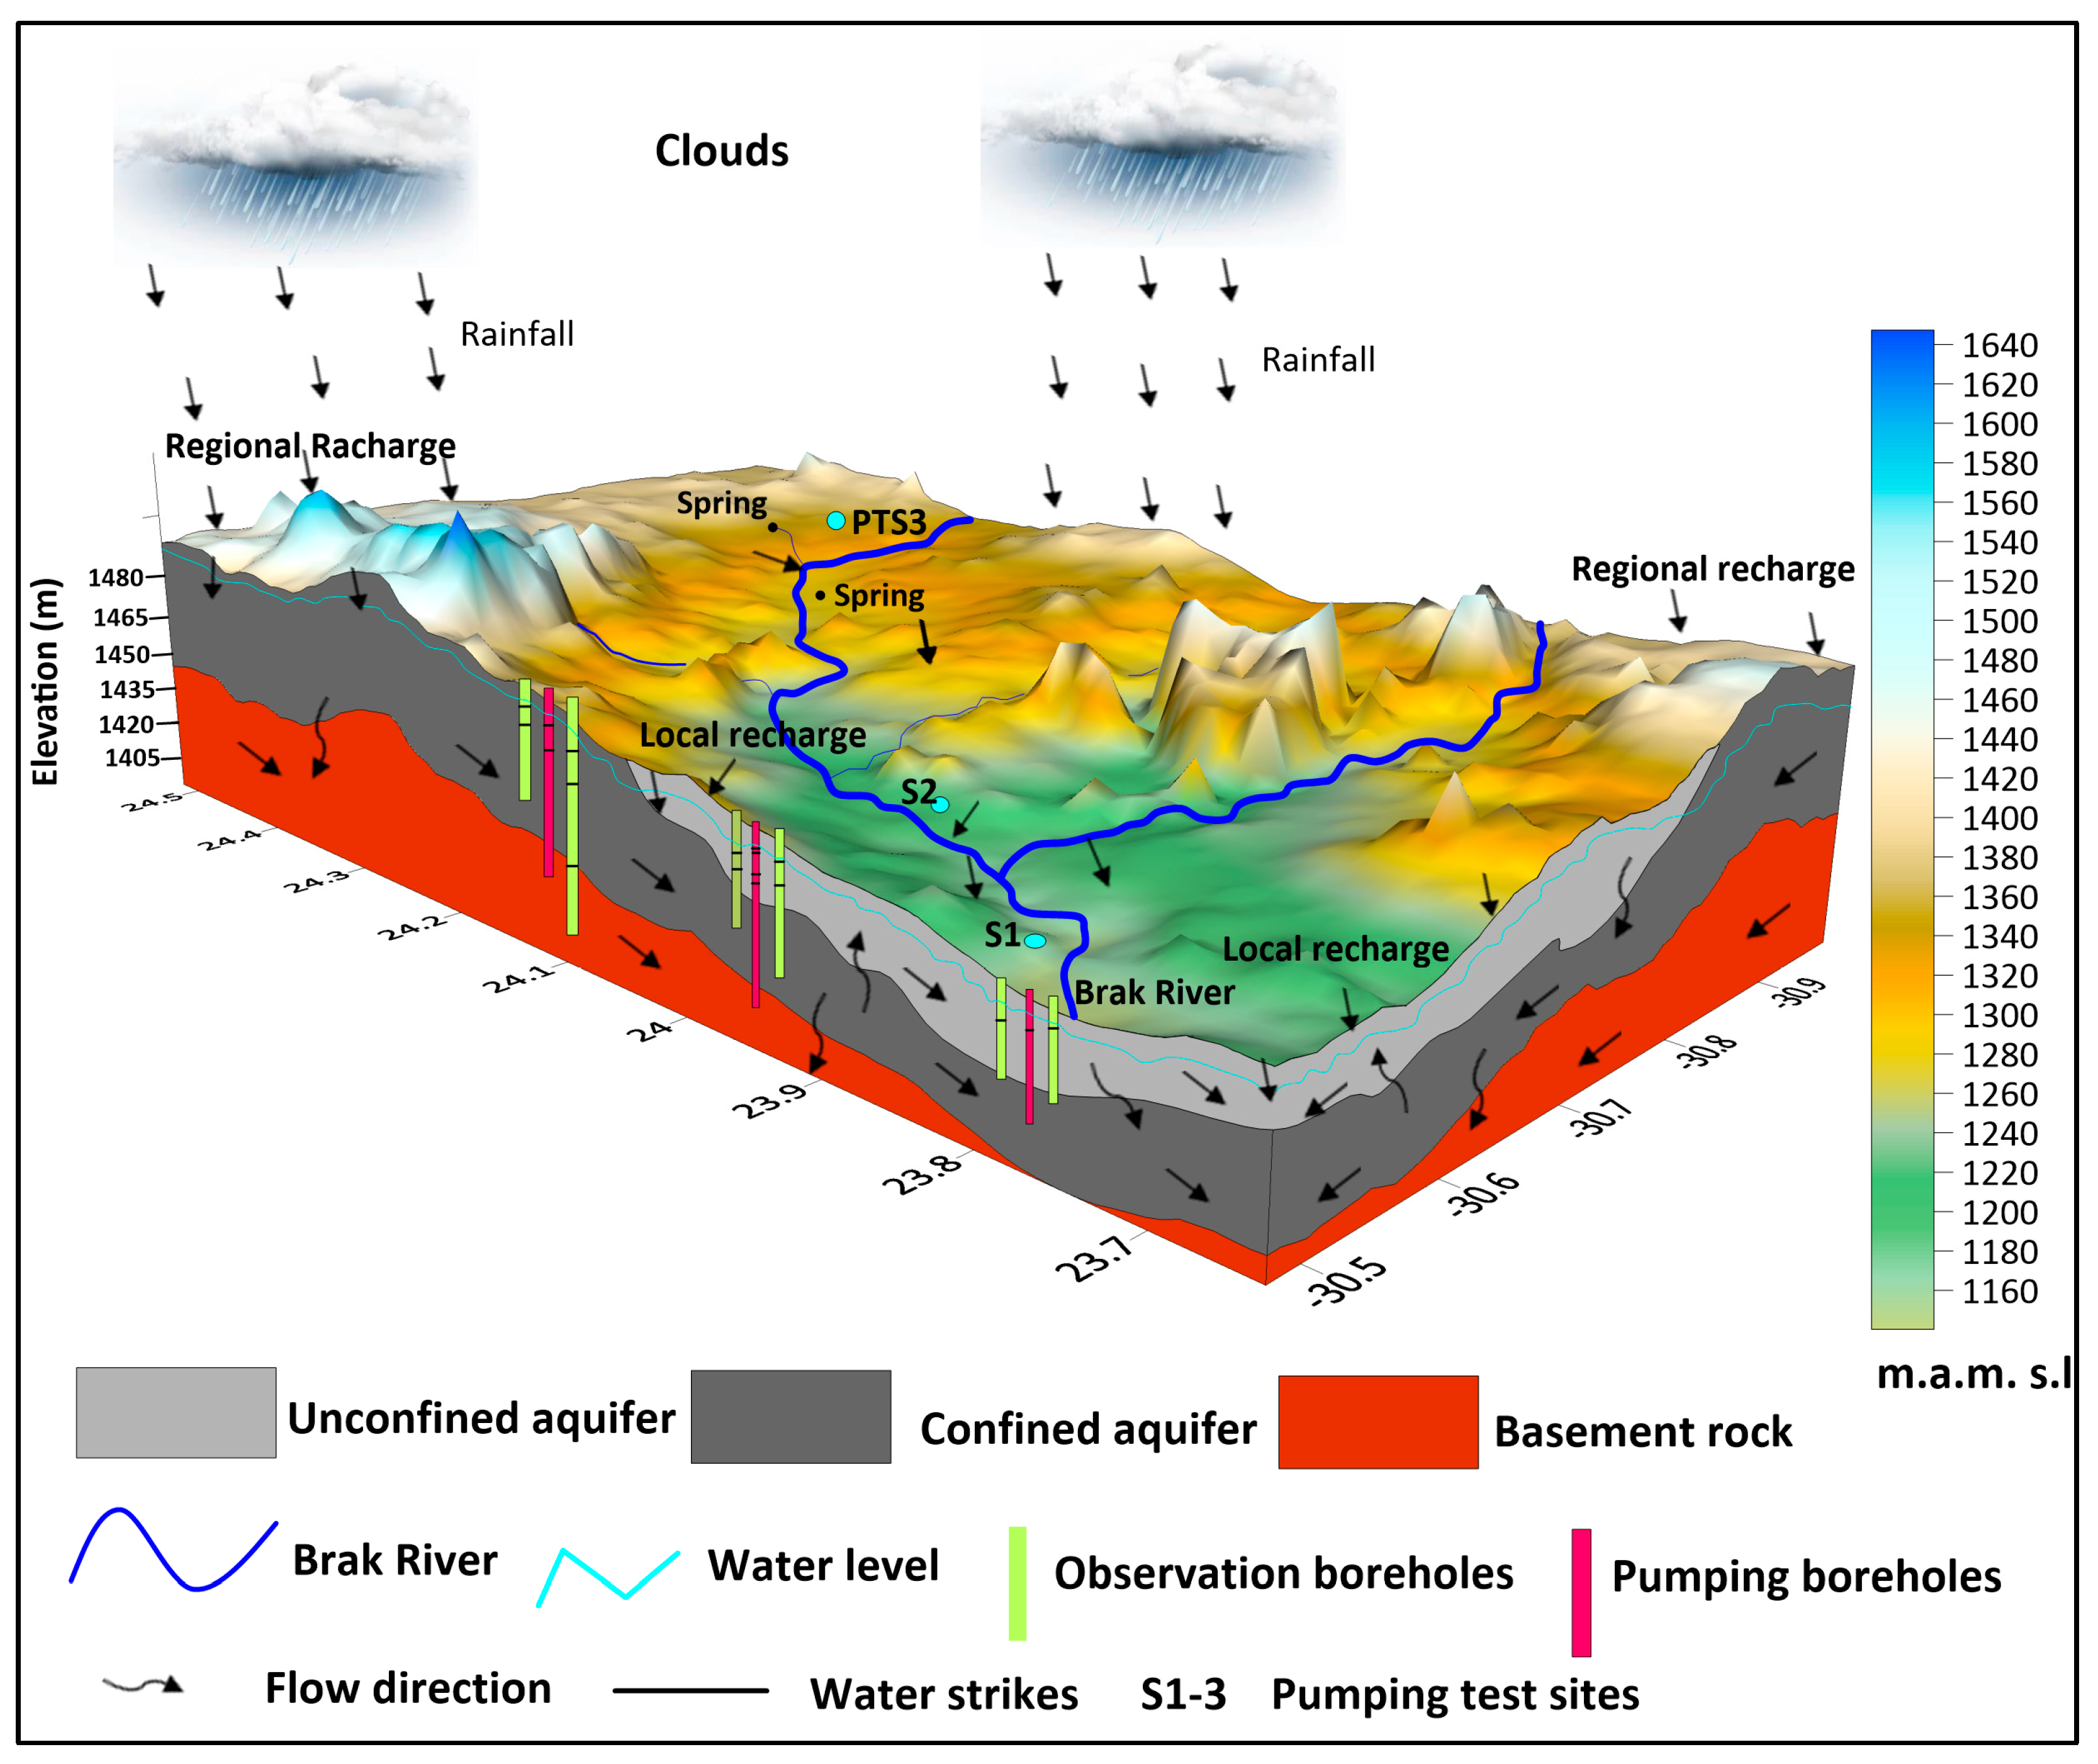
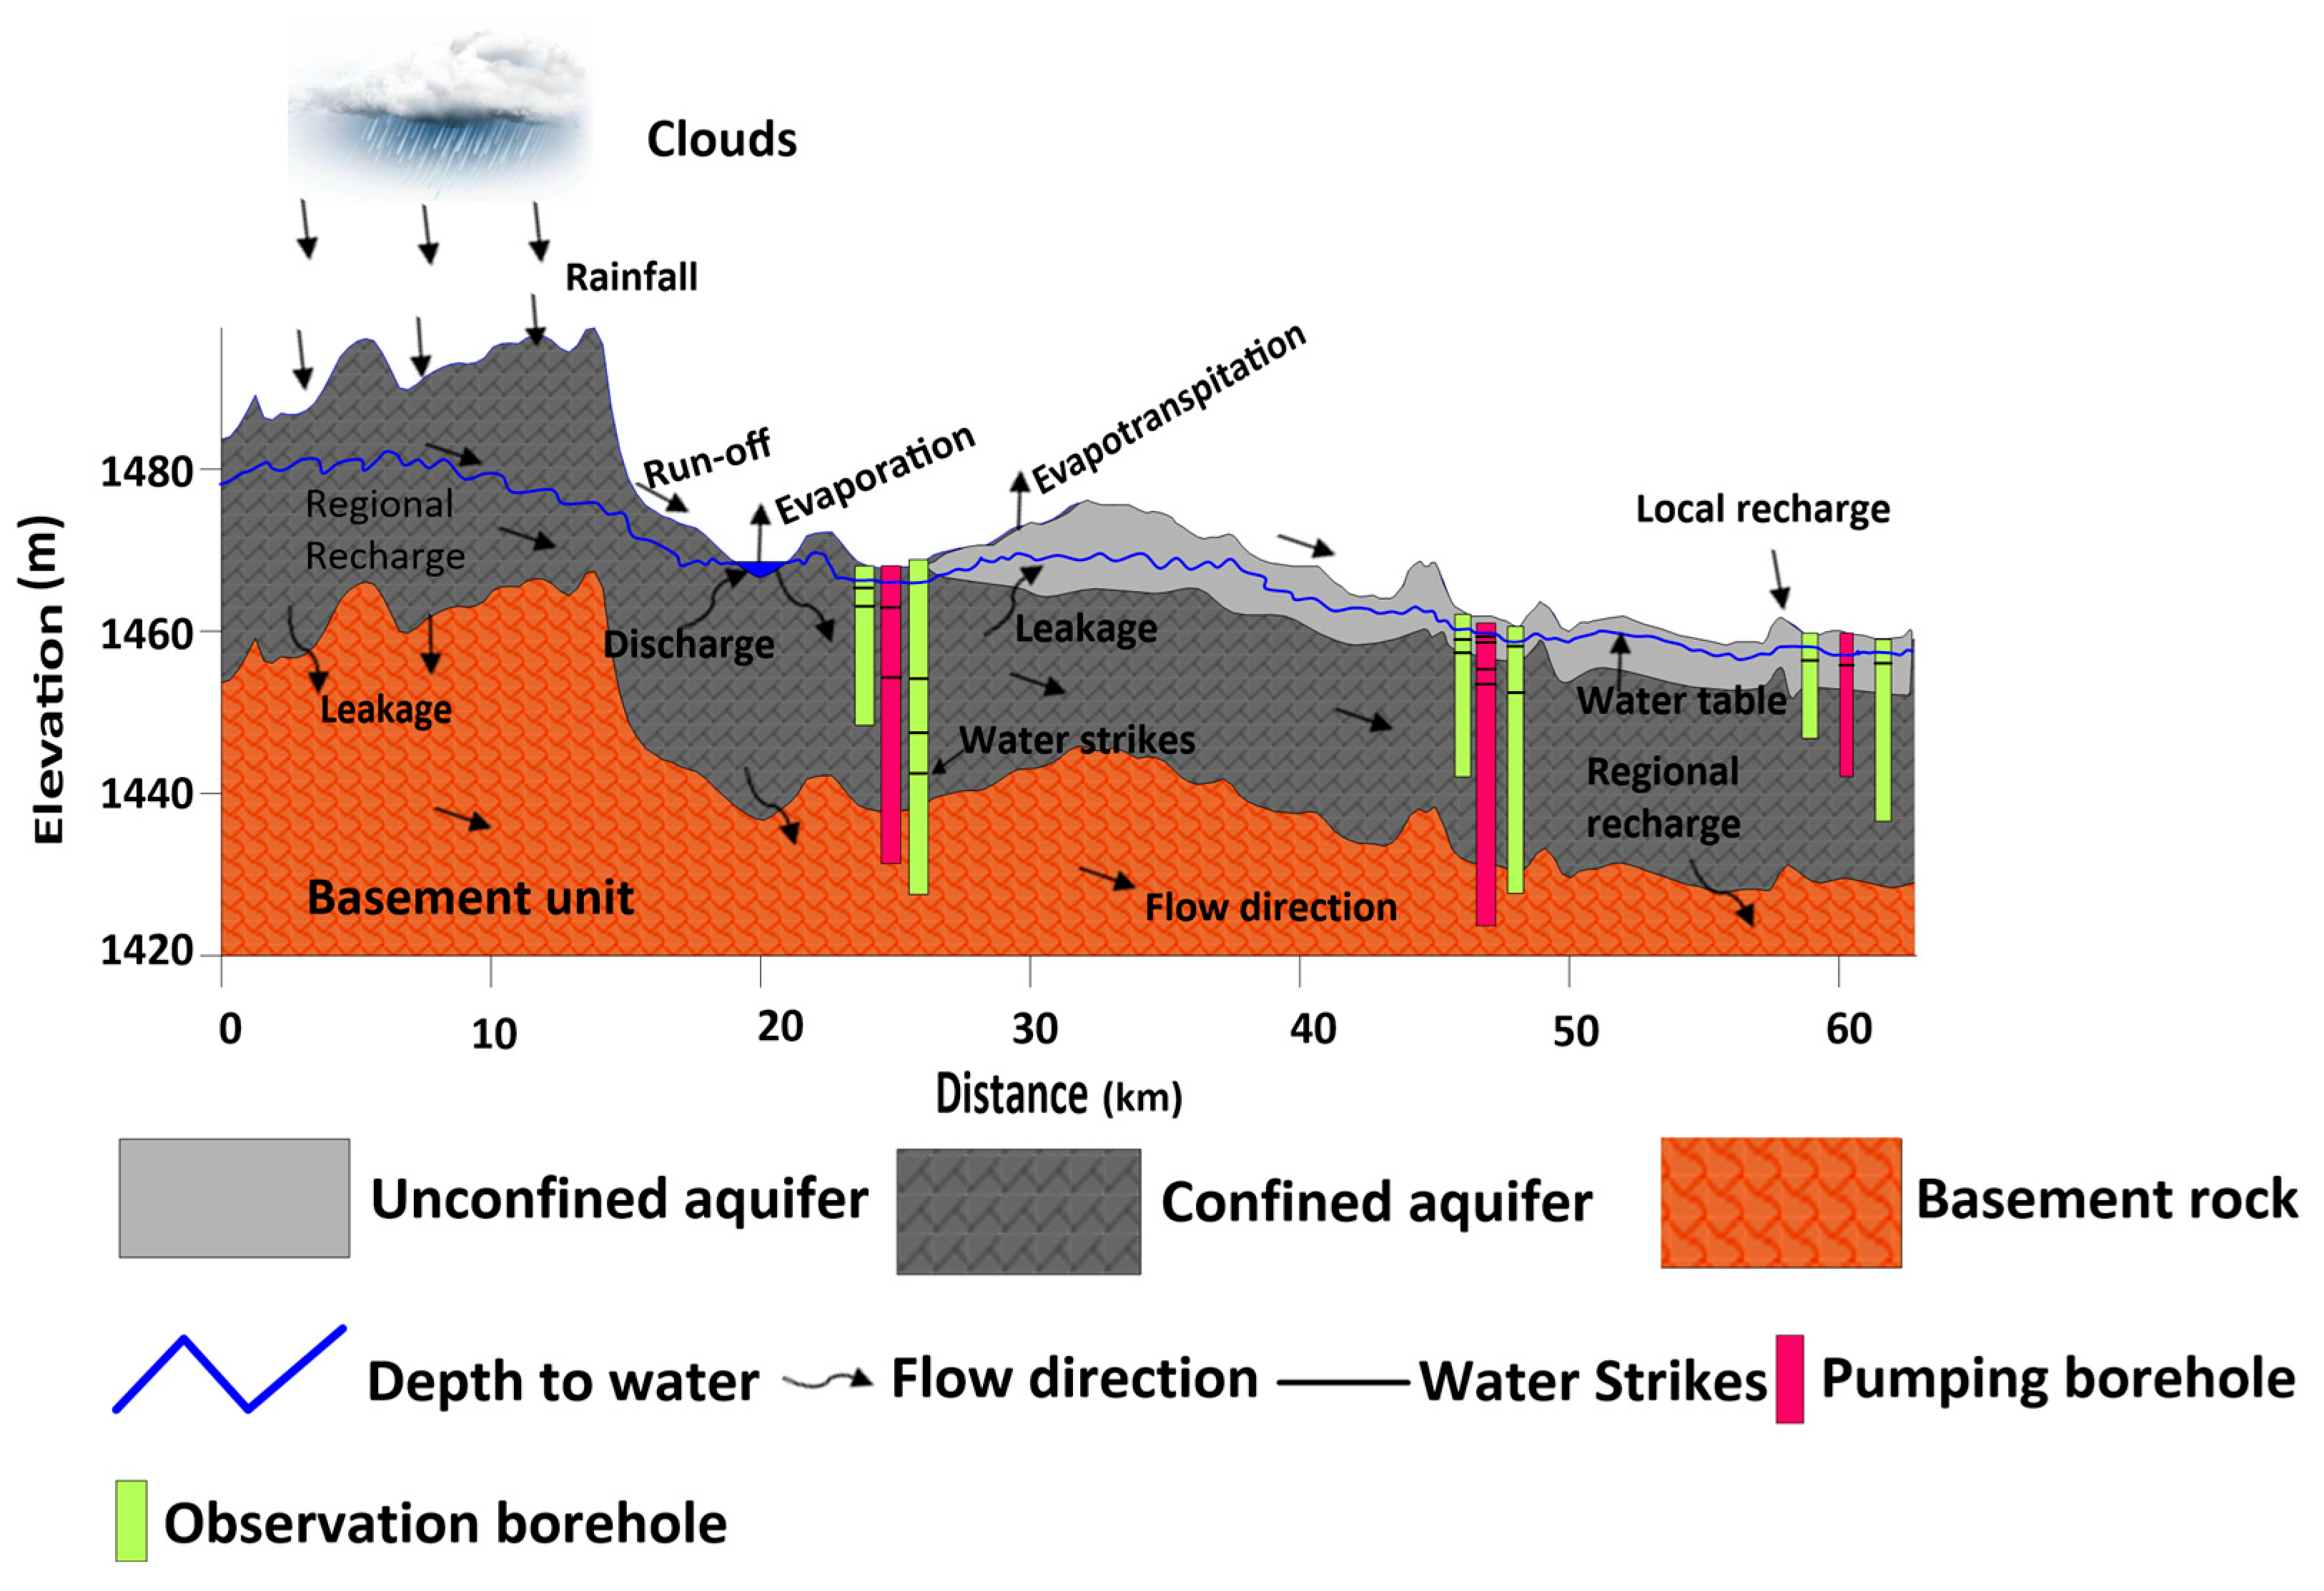
This section discusses how well an aquifer can accept and transmit groundwater with specific reference to storativity and transmissivity in assessing local and regional recharge potential areas. The rainfall and the hydraulic gradient play a pivotal role in groundwater movement and in determining recharge potential areas. Figure 14 illustrates the relationship between rainfall and elevation, which are the drivers of local and regional recharge potentials. As previously stated, the transmissivity and storativity are the two main parameters used to establish aquifer capacity to transmit and store water. In this study, the transmissivity is also used to broaden the understanding of aquifer hydraulic connectivity. The groundwater flow direction is justified using topography, fracture connectivity, and water table fluctuations difference based on the principle that groundwater moves from areas of higher hydraulic gradient to the areas of lower hydraulic gradient, and that topography often influences local and regional recharge potentials [3]. In this study, groundwater moves from the upper catchment (recharge area) through the middle catchment, following the gradient toward discharge areas at the lower catchment. At the recharge area, known as the Bargersville recharge zone in the upper catchment, the transmissivity is higher up to 596 m2/day, and hydraulic conductivity up to 42 m/day, compared to the middle and lower catchments, indicative of high fracture connectivity, faster groundwater movement, and greater recharge potentials. However, going toward the middle and lower catchment, the hydraulic gradient tends to flatten, and the transmissivity decreases to <213 m2/day and hydraulic conductivity to <16 m/day, indicating reduced fracture connectivity, limiting the aquifer’s ability to transmit more water. The storativity seems to increase with increasing aquifer thickness, suggesting greater storage potentials. Based on the analysis of the results in this study, there seems to be a horizontal and vertical hydraulic connection between unconfined and semi-confined aquifers. According to Van der Schyff [45], a horizontal hydraulic connection is commonly found in semi-confined to confined aquifers, indicative of regional recharge potentials. This claim is supported by the existence of linear and bilinear flow regimes across the study area. These flow regimes help assess how water moves through the subsurface, which, in turn, reflects local and regional recharge potentials (Figure 15 and Figure 16). The linear flow regime indicated localized recharge potential, which was influenced by nearby rivers or direct infiltration from local rainfall. On the other hand, the bilinear flow regime implied that recharge occurred from multiple different sources, indicating regional recharge potential pathways.

7. Conceptual Models of Groundwater Processes

A 3D conceptual model explaining areas of potential recharge, both local and regional, and flow characteristics was created using the surface elevations and geology derived from drill log data (Figure 15). The study’s findings recommended a model consisting of two to three layers with varying hydrogeological properties: unconfined, semiconfined, and the basement aquifer [9]. In the lower and middle catchment areas, sand, clay, and gravel form the unconfined aquifer with a thickness ranging from 0 to 10 m. The underlying semi-confined aquifer is represented by low-permeable shale, with dolerite dominant in the lower catchment, as well as mudstone and sandstone, and has a thickness ranging from 15 to 50 m. A confined aquifer is covered above by low-permeability clay layers (aquitards) in the lower and middle catchments, and below by alternating mudstone and shale formations. In the upper catchment, stratigraphic data indicate impermeable layers both above and below the aquifer, limiting vertical flow and resulting in pressurized groundwater conditions (Figure 15). The bottom layer represents the basement aquifer, which is made up of dolerite formations situated below 50 m (Figure 15). The middle and upper catchments had thin alternating layers, whereas the lower catchment had a consistent thick layer of shale and dolerite. Higher elevations are where recharge occurs because of rainfall infiltrating into the subsurface. After that, the groundwater flows through the aquifer in a downward direction from the upper catchment (high elevation) to the lower catchment (lower elevation) (Figure 16). Groundwater discharge occurs as springs where the topography drops below the water table or where a confining layer pushes the flow to the surface (Figure 15). The borehole depth ranges from 13.5 to 60 m, depth to static water level from 3.32 to 4.77 m, water strike from 5.5 to 41 m, and the yield of 0.5 to 4.5 L/s. Yields exceeding 5 L/s can be found in the weathered and fractured shale and mudstone beneath the alluvial formation, particularly in areas where nearly complete calcification has occurred [17]. The Elandsfontein Spruit River, originating southeast of Hanover and the Brak River near Caroluspoort, along with several minor tributaries, drains the entire study area (Figure 15). The confluence of these two ephemeral river systems lies approximately 10 km northwest of De Aar town. These rivers typically flow briefly and mainly during and after heavy rainfall. Numerous slopes of dolerite hills frequently intersect the intermediate valley areas. The riverbeds lie above the groundwater table, leading to the formation of standing pools of water along the Elandsfontein Spruit and Brak River systems [10]. The lower catchment exhibited transmissive fractures and relatively low hydraulic conductivity, indicating limited groundwater movement and recharge (Table 3). Compared to the lower catchment, the middle and upper catchments exhibited moderate to high storativity and transmissive fractures, indicating greater water storage and release from the matrix, as well as faster groundwater transmission. Furthermore, the results indicate that local and regional recharge potentials predominate in the study area, with regional recharge sustaining groundwater availability. The lower catchment is dominated by regional recharge rather than local recharge, resulting in reliable groundwater allocation.

8. Conclusions and Recommendations

The current study demonstrates the applicability of using aquifer hydraulic parameters to assess local and regional recharge potentials for enhancing groundwater allocation in groundwater-dependent areas. This study found that both the upper and middle catchments support local recharge potentials with high transmissivity, indicating faster infiltration and percolation of water in the subsurface toward saturated zones (local recharge). The presence of a high fracture network implied a high recharge zone, even though the connectedness of the fracture networks was not conclusive. However, high values for transmissivity suggested a quick movement of water toward the aquifer, thereby enhancing local recharge. The lower catchment, with lower transmissivity, indicated limited fracture connectivity, resulting in a limited recharge potential. This may also indicate the presence of a confined aquifer system, suggesting that a discharge area is associated with the observed dykes and dolerites. The summary in Table 3 provided values of aquifer hydraulic parameters of the study area. Therefore, arranging the values from lowest to highest storativity as follows: 0.0000297 < 0.0000462 < 0.0000495 < 0.0000627 < 0.000122 < 0.000185, meaning that the highest storativity is 0.000185 in the upper catchment, which stored or released the most water, and the lowest is 0.0000297 in the lower catchment, which stored or released the least water in the study aquifer system. In the context of aquifer systems, the storativity values suggest that the study area has confined aquifers with storativity (S) ranging from 0.0000297 to 0.000185. This indicates that the water released is primarily due to the elastic compression of the aquifer and the expansion of water. This is true in the lower catchment, where there is a less fractured rock system. By extension, it can be said that such water is recharged largely outside the study catchment, regionally. Secondly, it shows that there are unconfined aquifers with a storativity ≈ 0.01–0.3 (≈specific yield, Sy), suggesting that water released is mainly due to drainage of pore spaces (gravity drainage). This is true in the upper catchment, where a more fractured rock system allows for more water to enter the groundwater system. By extension, such aquifers are recharged with local rains, leading to local recharge. Therefore, using aquifer hydraulic parameters such as storativity and transmissivity, local and regional recharge potentials can be determined. These results reinforce the need for continuous groundwater monitoring activities. In terms of SDG 6, these results respond to the issue of harnessing groundwater, where the UN-Water encourages the quantification of groundwater whose quantity remains unknown in many places, leading to over-abstraction of such resources. Thus, exploring, protecting, and sustainably using groundwater is central to adapting to climate change and meeting the needs of a growing population, especially in groundwater-dependent communities. Flow regimes, such as linear and bilinear flow, along with double-porosity systems, highlight the complex fracture–matrix interactions that affected the observed and recorded water storage. Derivative fitting and drawdown analysis revealed features such as wellbore storage and fracture dewatering, informing aquifer behavior and sustainability. Short-duration pumping tests (<24 h) provided practical insight into aquifer behavior and dynamics, although along pumping durations of ≥24 h could have revealed more realistic and reliable aquifer dynamics. Nevertheless, such limitations provided an opportunity for future plans for pumping tests in such hydro-stratigraphic environments. During pumping test durations, often missing late-time matrix responses, capturing only early fracture-dominated flow, provides the use of multi-methods for comparative analysis and interpretations. Therefore, in order to compare the 12 h test and ascertain variations in accuracy, aquifer pumping tests lasting longer than 24 h in a dominated fractured aquifer setting are suggested to increase confidence in data analysis and interpretation on aquifer characterization. This study has demonstrated that using aquifer hydraulic parameters to assess local and regional recharge potential is an additional technique in the groundwater recharge field. These hydraulic parameters via pumping responses and storativity values provide information that enables practitioners to regulate groundwater availability and monitor management implications, leading to sustainable utilization of groundwater resources in groundwater-dependent communities. This supports the SDG 6.4 target to substantially increase efficiency across all sectors and ensure sustainable abstraction of groundwater to address water scarcity. In the future, these parameters can be tested in physiographic and hydrogeologic conditions similar to those available in the catchment where the current study was carried out.

Author Contributions

Conceptualization, L.B., T.K. and H.P.; methodology, L.B.; software, L.B. and N.I.; validation, N.I., T.K., H.P., and I.M.; formal analysis, L.B.; investigation, L.B., T.K., and H.P.; resources, H.P. and T.K.; data curation, L.B., N.I., and I.M.; writing—original draft preparation, L.B.; writing—review and editing, L.B., N.I., T.K., H.P., I.M., and M.B.M.; visualization, L.B.; supervision, T.K. and H.P.; project administration, L.B.; funding acquisition, L.B., and T.K. All authors have read and agreed to the published version of the manuscript.

Funding

This research was funded by the National Department of Water and Sanitation, South Africa. The fieldwork was co-funded by the University of the Western Cape (UWC) and the Council for Scientific and Industrial Research (CSIR).

Data Availability Statement

The raw data supporting the conclusions of this article will be made available by the authors upon request.

Acknowledgments

This paper forms part of the corresponding author’s Ph.D. studies currently underway. The author wishes to thank the following institutions: the National Department of Water and Sanitation, the University of the Western Cape, the Council for Scientific and Industrial Research, and the University of Namibia for their unwavering contributions. The authors acknowledge the contributions of the following individuals for their technical support and resources during field investigations: Madlala T., Makhetha J., Zikhali T., Umunezero A.A., Nicholls A., Zulu S.M., Aron C., and Nasson Q. To the reviewers, the authors are grateful for their valuable time and comments on this manuscript.

Conflicts of Interest

The authors declare no conflicts of interest.

Appendix A. Cooper Jacob’s Analytical Solution (Validation Results)

Figure A1. A straight line fitted to a late time drawdown data for the estimation of transmissivity and storativity from the observation boreholes OB-29648G (a) and OB-29648D (b) in the lower catchment.
Water 17 02709 g0a1
Figure A2. A straight line fitted to a late time drawdown data for the estimation of transmissivity and storativity from the observation boreholes OB38443 (a) and OB-38444 (b) in the lower catchment.
Water 17 02709 g0a2
Figure A3. A straight line fitted to a late time drawdown data for the estimation of transmissivity and storativity from the observation boreholes OB-38267 (a) and OB-38268 (b) in the lower catchment.
Water 17 02709 g0a3

References

  1. Heiskanen, A.-S.; Belinskij, A. Handbook on Water Allocation in Transboundary Context; United Nations: New York, NY, USA, 2022. [Google Scholar]
  2. Rojas, R.; Batelaan, O.; Feyen, L.; Dassargues, A. Assessment of conceptual model uncertainty for the regional aquifer Pampa del Tamarugal-North Chile. Hydrol. Earth Syst. Sci. 2010, 14, 171–192. [Google Scholar] [CrossRef]
  3. Sami, K.; Hughes, D.A. A comparison of recharge estimates to a fractured sedimentary aquifer in South Africa from a chloride mass balance and an integrated surface-subsurface model. J. Hydrol. 1996, 179, 111–136. [Google Scholar] [CrossRef]
  4. Wolny, F.; Marciniak, M.; Kaczmarek, M. Une méthode pour l’estimation de doubles transmissivités à partir de tests d’infiltration (slug tests). Hydrogeol. J. 2018, 26, 407–416. [Google Scholar] [CrossRef]
  5. Williams, S.E. Water Allocation for Productive Use: Policy and Implementation. A Case Study of Black Emerging Farmers in the Breede-Gouritz Water Management Area, Western Cape; WRC Report 2530/1; Water Research Commission: Pretoria, South Africa, 2018; Available online: https://wrcwebsite.azurewebsites.net/wp-content/uploads/mdocs/25301.pdf (accessed on 1 September 2025).
  6. Dennis, I.; Witthüsser, K.; Vivier, K.; Dennis, R.; Mavurayi, A. Groundwater Resource Directed Measures; Water Research Commission: Pretoria, South Africa, 2012; Available online: https://www.wrc.org.za/wp-content/uploads/mdocs/TT299-07.pdf (accessed on 1 September 2025).
  7. Petrone, P.; De Vita, P.; Marsiglia, P.; Allocca, P.; Coda, S.; Cusano, D.; Lepore, D.; Allocca, V. Hydrogeological conceptual model and groundwater recharge of Avella Mts. karst aquifer (southern Italy): A literature review and update. J Hydrol. Reg. Stud. 2024, 54, 101871. [Google Scholar] [CrossRef]
  8. Walvoord, M.A.; Stonestrom, D.A.; Andraski, B.J.; Striegl, R.G. Constraining the Inferred Paleohydrologic Evolution of a Deep Unsaturated Zone in the Amargosa Desert. Vadose Zone J. 2004, 3, 502–512. [Google Scholar] [CrossRef]
  9. Karlović, I.; Marković, T.; Vujnović, T.; Larva, O. Development of a hydrogeological conceptual model of the Varaždin alluvial aquifer. Hydrology 2021, 8, 19. [Google Scholar] [CrossRef]
  10. Betancur, T.V.; Palacio, C.T.A.; Escobar, J.M.F. Conceptual Models in Hydrogeology, Methodology and Results. In Hydrogeology—A Global Perspective; IntechOpen: London, UK, 2012. [Google Scholar]
  11. Baloyi, L.; Kanyerere, T.; Muchingami, I.; Pienaar, H. Application of Hydrogeophysical Techniques in Delineating Aquifers to Enhancing Recharge Potential Areas in Groundwater-Dependent Systems, Northern Cape, South Africa. Water 2024, 16, 2652. [Google Scholar] [CrossRef]
  12. Khadri, S.F.R.; Moharir, K. Characterization of aquifer parameter in basaltic hard rock region through pumping test methods: A case study of Man River basin in Akola and Buldhana Districts, Maharashtra, India. Model. Earth Syst. Environ. 2016, 2, 33. [Google Scholar] [CrossRef]
  13. UN-Water. Blueprint for Acceleration: Sustainable Development Goal 6. Synthesis Report on Water and Sanitation; United Nations: New York, NY, USA, 2018; Available online: https://www.unwater.org/sites/default/files/app/uploads/2018/12/SDG6_SynthesisReport2018_WaterandSanitation_04122018.pdf (accessed on 1 September 2025).
  14. Abdullahi, M.G. The Application of Vertical Electrical Sounding (VES) for Groundwater Exploration in Tudun Wada, Kano State, Nigeria. J. Geol. Geosci. 2015, 4, 4–6. [Google Scholar] [CrossRef]
  15. Ali, M.H.; Zaman, M.H.; Biswas, P.; Islam, M.A.; Karim, N.N. Estimating Hydraulic Conductivity, Transmissibility and Specific Yield of Aquifer in Barind Area, Bangladesh Using Pumping Test. Eur. J. Environ. Earth Sci. 2022, 3, 90–96. [Google Scholar] [CrossRef]
  16. Gomo, M. On the interpretation of multi-well aquifer-pumping tests in confined porous aquifers using the Cooper and Jacob (1946) method. Sustain. Water Resour. Manag. 2019, 5, 935–946. [Google Scholar] [CrossRef]
  17. Boucher, M.; Favreau, G.; Vouillamoz, J.M.; Nazoumou, Y.; Legchenko, A. Estimating specific yield and transmissivity with magnetic resonance sounding in an unconfined sandstone aquifer (Niger). Hydrogeol. J. 2009, 17, 1805–1815. [Google Scholar] [CrossRef]
  18. Woodford, A.C. Preliminary Evaluation of Aquifer Tests Conducted in the South Eastern-Burgerville Areas, South East of De Aar. 1989. Available online: https://www.dws.gov.za/ghreport/Home/Download.aspx?Id=2617 (accessed on 1 September 2025).
  19. Van Tonder, G.J. Manual on Pumping Test Analysis in Fractured-Rock Aquifers: Report Submitted to Water Research Commission; WRC: Pretoria, South Africa, 2002. [Google Scholar]
  20. Edwin, O.K.; Alemaw, B.F.; Laletsang, K.; Tafesse, N.T. Estimating Hydraulic Properties of Alluvial Sand Aquifer in Motloutse River course. Eastern Botswana. Asian Rev. Environ. Earth Sci. 2017, 4, 28–35. [Google Scholar] [CrossRef]
  21. Rushton, K.R. Numerical and conceptual models for recharge estimation in arid and semi-arid zones. In Estimation of Natural Groundwater Recharge; Springer: Dordrecht, The Netherlands, 1988; pp. 223–238. [Google Scholar]
  22. Vegter, J.R. De Aar’s Groundwater Supply—A Digest of the Past and an Outlook for the Future. GH3775; 1992. Available online: https://www.dws.gov.za/ghreport/Home/Download.aspx?Id=2969 (accessed on 25 May 2025).
  23. Vegter, J.R. Evaluation of an Alluvial Aquifer at Caroluspoort, De Aar, South Africa. GH2828; 1975. Available online: https://www.dws.gov.za/ghreport/Home/Download.aspx?Id=1703 (accessed on 13 March 2025).
  24. Kruseman, G.P.; Ridder, N.A.D. Analysis and Evaluation of Pumping Test Data; International Institute for Land Reclamation and Improvement: Wageningen, The Netherlands, 2000. [Google Scholar]
  25. Mofokeng, S.S.I. Groundwater Resource Assessment for Development and Use in Jozini, KwaZulu-Natal. Master’s Thesis, University of the Free State, Bloemfontein, South Africa, 2017. Available online: https://scholar.ufs.ac.za/items/4ba2d91f-a109-4dbd-8c45-2e8c7942e914 (accessed on 1 September 2025).
  26. Halford, K.J.; Weight, W.D.; Schreiber, R.P. Interpretation of transmissivity estimates from single-well pumping aquifer tests. Ground Water 2006, 44, 467–471. [Google Scholar] [CrossRef]
  27. Olivier, K.K.J.; Jules, M.O.M.; Parfait, S.A.; Frédéric, P.; Brou, D.; Didier, G. Elaboration of a hydrogeological conceptual model by application of electrical resistivity tomography: Case of the Lobo catchment (Centre-Western Côte d’Ivoire). Sci. Afr. 2022, 16, e01234. [Google Scholar] [CrossRef]
  28. Falowo, O.O.; Daramola, A.S.; Ojo, O.O. Aquifers Hydraulic Parameters Measurement and Analysis by Pumping Test. Am. J. Water Resour. 2019, 7, 146–154. [Google Scholar]
  29. Samani, N.; Pasandi, M.; Barry, D.A. Characterizing a heterogeneous aquifer by derivative analysis of pumping and recovery test data. J. Geol. Soc. Iran 2006, 1, 29–41. [Google Scholar]
  30. Atangana, A. Analytical solutions for the recovery tests after constant-discharge tests in confined aquifers. Water SA 2014, 40, 595–600. [Google Scholar] [CrossRef]
  31. Bennett, G.; Van Camp, M.; Shemsanga, C.; Kervyn, M.; Walraevens, K. Delineation of the aquifer structure and estimation of hydraulic properties on the flanks of Mount Meru, Northern Tanzania. J. Afr. Earth Sci. 2022, 196, 104673. [Google Scholar] [CrossRef]
  32. Grobler, R.J. Hydrogeological Exploration and Characterisation of the Aquifers Found in Middelburg, Eastern Cape, for Town Water Supply; University of the Free State: Bloemfontein, South Africa, 2014; Available online: https://scholar.ufs.ac.za/items/14bbe7b9-4c6c-457f-a432-a71fa08b23e8 (accessed on 1 September 2025).
  33. Abdullahi, I.-N. Estimating Aquifer Hydraulic Properties in Bida Basin, Central Nigeria Using Empirical Methods. Earth Sci. Res. 2013, 2, 209–221. [Google Scholar] [CrossRef]
  34. Lohman, S.W. Groundwater Hydraulics; US Government Printing Office: Washington, DC, USA, 1972; Volume 708. Available online: https://www.nrc.gov/docs/ML1735/ML17355A590.pdf (accessed on 1 September 2025).
  35. Michael, H.A.; Voss, C.I. Estimation of regional-scale groundwater flow properties in the Bengal Basin of India and Bangladesh. Hydrogeol. J. 2009, 17, 1329–1346. [Google Scholar] [CrossRef]
  36. Woessner, W.W.; Eileen, P.P. Hydrogeologic Properties of Earth Materials and Principles of Groundwater Flow; The Groundwater Project: Guelph, ON, Canada, 2020; Available online: https://books.gw-project.org/hydrogeologic-properties-of-earth-materials-and-principles-of-groundwater-flow/ (accessed on 1 September 2025).
  37. Veltman, S. Analysis of Borehole Pumping Tests, Petrusburg—Aquifer Parameters; Department of Water Affairs and Forestry (DWAF): Pretoria, South Africa, 2003. [Google Scholar]
  38. Igwebuike, N.; Muchingami, I.; Kanyerere, T. Application of hydrogeophysics and diagnostic plots in setting up a sustainable managed aquifer recharge scheme, West Coast, South Africa. J. Afr. Earth Sci. 2023, 206, 105039. [Google Scholar] [CrossRef]
  39. Barker, J.A. A generalized radial flow model for hydraulic tests in fractured rock. Water Resour. Res. 1988, 24, 1796–1804. [Google Scholar] [CrossRef]
  40. Van Tonder, G.J.; Botha, J.F.; Chiang, W.-H.; Kunstmann, H.; Xu, Y. Estimation of the sustainable yields of boreholes in fractured rock formations. J. Hydrol. 2001, 241, 70–90. [Google Scholar] [CrossRef]
  41. Spane, F.A., Jr.; Wurstner, S.K. DERIV—A computer program for calculating pressure derivatives for use in hydraulic test analysis. Groundwater 1993, 31, 814–822. [Google Scholar] [CrossRef]
  42. Van Tonder, G.J. Aquifer Test Interpretation with Special Emphasis on the Drawdown Evaluation for Wells Within Fracture Networks Smaller than the Representative Elementary Volume (REV). Ph.D. Dissertation, University of the Free State, Bloemfontein, South Africa, 2002. Available online: https://scholar.ufs.ac.za/items/3047346f-8a54-4ff9-aa98-cc2c37aa3e63 (accessed on 1 September 2025).
  43. Botha, J.F. Karoo Aquifers: Their Geology, Geometry and Physical Properties; Water Research Commission: Pretoria, South Africa, 1998; Available online: https://www.wrc.org.za/wp-content/uploads/mdocs/487-1-98.pdf (accessed on 1 September 2025).
  44. Sun, X.; Xiang, Y.; Shi, Z. Estimating the hydraulic parameters of a confined aquifer based on the response of groundwater levels to seismic Rayleigh waves. Geophys. J. Int. 2018, 213, 919–930. [Google Scholar] [CrossRef]
  45. Van der Schyff, M.; Kanyerere, T.; Israel, S.; Vermaak, N. Using multiple tracers and geological techniques to determine the connectivity between aquifer systems, West Coast, South Africa. Phys. Chem. Earth Parts A/B/C 2020, 118, 102863. [Google Scholar] [CrossRef]
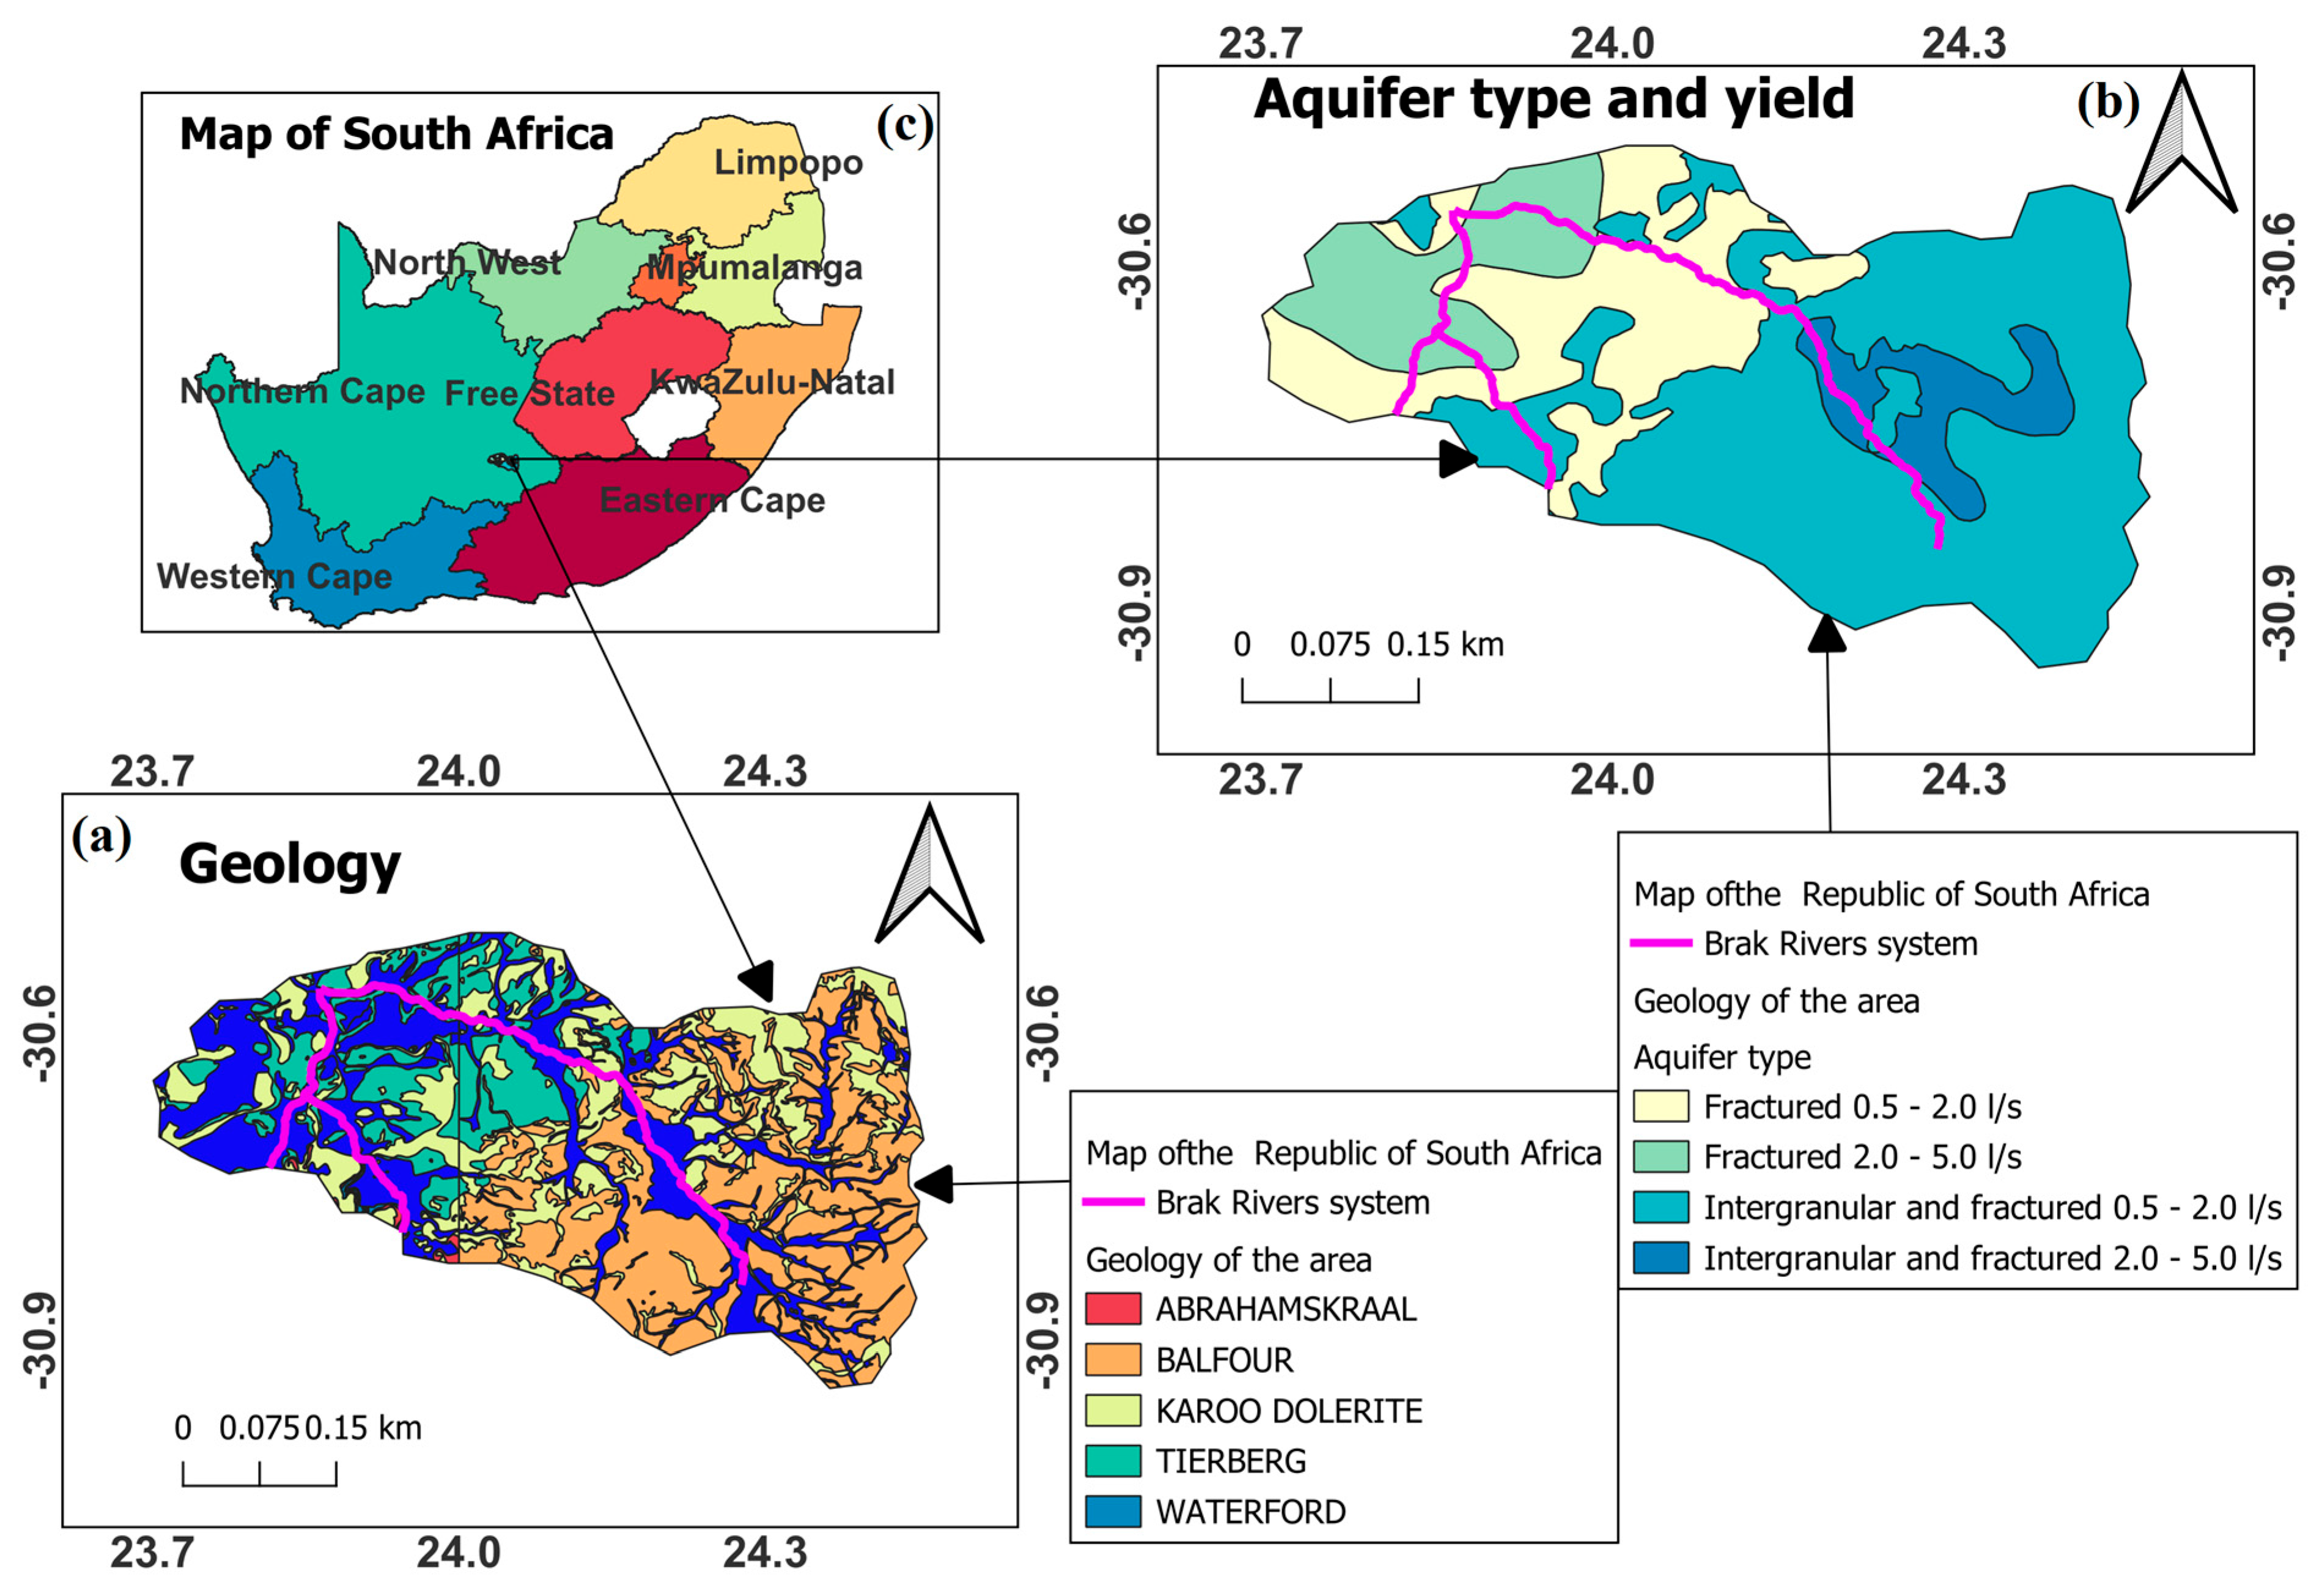
Figure 1. (a) Surface geology represented by Tierberg and Middleton’s formation, which is composed of shale, sandstone, mudstone, and siltstone, as well as Quaternary sediment of calcrete, sand, silt, clay, and gravel. (b,c) Aquifer characteristics and the associated yields with specific reference to the De Aar, Northern Cape Province, South Africa.
Water 17 02709 g001
Figure 2. (a) The location of the study area with physiographic environmental features like Brak River systems (dashed line), contours (orarage solid lines), and elevations (various colour coding). (b,c) show the study area location with specific reference to the De Aar region, Northern Cape Province, South Africa.
Water 17 02709 g002
Figure 3. Methodological workflow for aquifer hydraulic parameter estimation.
Water 17 02709 g003
Figure 4. (ac) Litho-stratigraphy of the pumping test and observation boreholes used for the estimation of aquifer hydraulic parameters and conceptualization of the litho-stratigraphy of the study area.
Water 17 02709 g004
Figure 5. The straight line fitted to recovery data for estimating transmissivity from the observation boreholes in the lower catchment site. (a,b) show the late-time recovery response where transmissivity is estimated, where the aquifer system has moved past early transient effects.
Water 17 02709 g005
Figure 6. The straight line fitted to the recovery data to estimate transmissivity values from observation boreholes in the middle catchment site. The line illustrates intermediate and late time transmissivity estimates, where the aquifer system has moved past early transient effects.
Water 17 02709 g006
Figure 7. Illustrate the straight line fitted to recovery data to estimate transmissivity values during the immediate time to late-time response, where the aquifer system has moved past early transient effects.
Water 17 02709 g007
Figure 8. Steady-state flow condition identified using drawdown data from two observation boreholes in the lower catchment site, with horizontal line in borehole OW-29648D (a) and OW-29648G (b) illustrates stability of the drawdown, indicating no further change with time.
Water 17 02709 g008
Figure 9. The borehole OW-38443 illustrates a straight line fit to the wellbore storage drawdown response dominated by water coming from the surrounding aquifer, and the flow is coming from one direction, while, OW-38444 illustrate the linear flow dominant from one or two directions in the middle catchment.
Water 17 02709 g009
Figure 10. Borehole OW-38268 illustrates fitted bi-linear flow transitioning from the fracture to the matrix flow condition, while OW-382267 illustrates the linear flow dominant from one or two directions.
Water 17 02709 g010
Figure 11. Shows the derivative plot of the flow regimes during the test, i.e, recharge boundary, double porosity, fracture dewatering, and acting radial flow from observation borehole OW-29648D (a) and OW-29648G (b) in the lower catchment.
Water 17 02709 g011
Figure 12. Shows the derivative plot of the flow regimes during the test, i.e, recharge boundary, double porosity, fracture dewatering, wellbore storage and transition phase in the middle catchment from observation borehole OW-38443 (a) and OW-38444 (b) in the middle catchment.
Water 17 02709 g012
Figure 13. Shows the derivative plot of the flow regimes during the test, i.e, recharge boundary, double porosity, fracture position, acting radial flow, and fracture dewatering in the upper catchment from observation borehole OW-38267 (a) and OW-38268 (b) in the upper catchment.
Water 17 02709 g013
Figure 14. The relationship between rainfall and elevation in establishing local and regional recharge potentials.
Water 17 02709 g014
Figure 15. The hydrogeological conceptual model of groundwater recharge potential and flow processes.
Water 17 02709 g015
Figure 16. Hydrogeological cross-sectional profile of the study area.
Water 17 02709 g016
Table 1. Time since the pumping started and time intervals.
NoTime Since Start PumpingTime Intervals
10–20 min1 min
220–30 min5 min
330–60 min10 min
460–90 min15 min
590–180 min30 min
6180–480 min1 h
7480–720 min2 h
Table 2. Available data and information extracted from the NGA system used as input for the construction of the conceptual model and cross-sectional profile of this study.
Lower CatchmentMiddle CatchmentUpper Catchment
Site IDPB-
29648E
OB-29648DOB-29648GPB-
38447
OB-
38443
OB-
038444
PB-38269AOB-
038267
OB-
38268
Depth (m)2413.519.5482442486018
Distance from P-BH014.32704.17.80214
Depth water level (m)4.774.474.484.394.634.413.84.13.32
Water strike (m)9885; 8; 17; 248.5 and 125.5 and 2512 and 2222; 34; 415.5 and 12
Pump install depth18--30--25--
Pumping rate (L/s)0.3--2.5--2.5--
Lithology ClaySandClaySand clay, SandstoneSand claySand clay
Shale
Sandstone
mudstone
DoleriteSandstone Mudstone
Total yield (L/s)1.2 0.60.62.50.50.42.54.5-
Coordinates23.9388 23.9436123.926324.17824.1795224.2145524.3667224.366424.3663
−30.5505−30.550024.1795−30.686−30.6886−30.6814−30.74779−30.7471−30.7472
Table 3. Summary of the aquifer hydraulic parameters of the study area.
FC Analytical MethodCooper–Jacob Method
CatchmentIDB (m)T (m2/day)K (m/day)ST (m2/day)K (m/day)S
LowerOB29648D9213230.00002975560.00334
OB29648G15241160.0000495195130.00495
MiddleOB-3844319487250.0000627446230.00131
OB-384443729780.00012220050.0395
UpperOB-3826814590420.0000462563400.000769
OB-3826756596100.00018550280.000759
Disclaimer/Publisher’s Note: The statements, opinions and data contained in all publications are solely those of the individual author(s) and contributor(s) and not of MDPI and/or the editor(s). MDPI and/or the editor(s) disclaim responsibility for any injury to people or property resulting from any ideas, methods, instructions or products referred to in the content.