Article

Distribution and Environmental Implications of GDGTs in Sediments from Three Asian Mangrove Wetlands

1
College of Oceanography and Ecological Science, Shanghai Ocean University, Shanghai 201306, China
2
Department of Ocean Science and Engineering, Southern University of Science and Technology, Shenzhen 518055, China
3
Department of Zoology, Faculty of Life and Earth Sciences, Jagannath University, Dhaka 1100, Bangladesh
4
Guangxi Key Laboratory of Marine Environmental Change and Disaster in Beibu Gulf, Beibu Gulf University, Qinzhou 535011, China
*
Authors to whom correspondence should be addressed.
These authors contributed equally to this work.
Water 2025, 17(18), 2677; https://doi.org/10.3390/w17182677
Submission received: 27 July 2025 / Revised: 1 September 2025 / Accepted: 5 September 2025 / Published: 10 September 2025
(This article belongs to the Section Ecohydrology)

Abstract

Glycerol Dialkyl Glycerol Tetraethers (GDGTs) are microbial membrane lipids that can provide crucial information for identifying organic carbon sources and understanding paleoenvironments. Despite numerous studies reporting the presence of GDGTs in various terrestrial and marine environments, there is a paucity of reports concerning GDGTs in mangrove wetlands that are characterized by unique hydrological conditions and disproportionately high accumulation rates of blue carbon (i.e., carbon sequestered in coastal ecosystems, where tidal flooding and anaerobic sediments facilitate exceptional long-term carbon storage). This study investigates GDGTs in 81 sediment samples from 5 sediment cores collected from three Asian mangrove wetlands in Bangladesh, Hong Kong, and Guangxi Province, China. The Hong Kong mangrove sediments had the highest GDGT concentration (370.18 ± 58.00 ng·g−1 dws), followed by Bangladesh mangrove sediments (136.70 ± 41.70 ng·g−1 dws), while Guangxi mangrove sediments had the lowest (100.80 ± 28.71 ng·g−1 dws). All samples demonstrated high BIT index values (>0.8), low IIIa/IIa index values (0.09–0.19) and the predominance of tetramethylated brGDGTs (70.38 ± 2.21%), indicating that terrestrial inputs are the primary source of organic carbon. Despite overall low methylation index (MI) values (0.15–0.35) and GDGT-0/Cren ratios, deeper sediment samples in the lower part of HK exhibited GDGT-0/Cren > 2, likely reflecting enhanced contributions of methanogenic archaea under distinct redox conditions compared to upper sediments. This in situ production may complicate the application of GDGT-based paleo-proxies, as indicated by the substantial deviations between CBT’-pH (MBT’5ME-temperature) and measured pH (instrumental temperature). The dominant bacterial phyla in the mangrove sediments of Guangxi and Bangladesh were Proteobacteria, Actinobacteriota, Chloroflexi, Acidobacteriota, and Firmicutes (>70% relative abundance). However, correlations between microbial community compositions and brGDGT isomers are different among sampling sites. Our study emphasizes that site- and depth-specific microbial activity may significantly contribute to organic matter cycling and the in situ production of GDGTs in mangrove sediments. These factors should be taken into account for organic carbon sequestration and the validity of GDGT-based paleo-proxies in mangrove wetlands.

1. Introduction

Glycerol dialkyl glycerol tetraethers (GDGTs) are biomarker lipids produced by certain archaea and bacteria [1,2]. Based on differences in biological origin, carbon chain structure, and stereochemistry, GDGTs can be classified into two main types: isoprenoid GDGTs (isoGDGTs), which are synthesized by archaea, and branched GDGTs (brGDGTs), which are synthesized by some bacteria (Figure 1). The number of pentacyclic rings, the number of methyl branches, and the positions of these methyl groups in the synthesized GDGTs by the source microorganisms are closely related to the environmental conditions and climatic parameters (such as temperature and pH) [3,4,5,6,7]. Consequently, various environmental indicators based on GDGTs have been proposed. For instance, the TEX86 (TetraEther indeX of 86 carbons) is indicative of sea surface temperature (SST) [8]; the MBT (Methylation index of Branched Tetraethers) index is mainly controlled by atmospheric (soil) temperature, and to less extent by soil pH [3,9], while the CBT (Cyclization ratio of Branched Tetraethers) index is solely influenced by soil pH [3]. Additionally, the BIT (Branched and Isoprenoid Tetraether) index [10] and the brGDGTs IIIa/IIa ratio [11] are indices that can quantify the relative contribution of terrestrial and marine organic carbon sources. Considering that archaea play an important role in methane biogeochemical cycling, Zhang and colleagues proposed a methane index (MI) based on isoGDGTs’ compositions for reconstructing marine sedimentary methane fluxes [12,13]. These indicators have been extensively applied in various environmental samples over different temporal scales, including soil [14,15], marine sediments [16,17], lakes [18], lake sediments [19,20], peat [21], stalagmites [22], loess-paleosol sequences [23], and hydrothermal vents [24,25].
Mangroves, located at the interface between marine and terrestrial ecosystems, play a crucial role in carbon sequestration and biodiversity maintenance [26,27]. The microbial communities in mangrove wetlands are influenced by multiple environmental parameters, such as salinity, temperature, oxygen and pH, and changes in these microbial communities can, in turn, affect the composition and spatial distribution of GDGTs [28,29,30]. Given the important ecological functions of mangroves and their unique hydrological environments, it is essential to investigate the content, composition, and distribution characteristics of GDGTs in mangrove sediments, the primary factors influencing these characteristics, and the potential application of GDGTs as environmental indicators.
This study focuses on three Asian mangrove wetlands located in Bangladesh, Guangxi Province of China, and Hong Kong, China. By examining the content and composition of GDGTs in sediments, and comparing with sediment physicochemical parameters (such as temperature and pH) and microbial community composition, we aim to explore the source of GDGTs, the relationship between microbial community composition and the spatial distribution of GDGTs, as well as the environmental application potential of GDGTs indicators in mangrove wetlands. The novelty of this study lies in its multi-site analysis of GDGTs in mangrove sediments, offering new insights into in situ production and proxy reliability in blue carbon ecosystems.

2. Materials and Methods

2.1. Study Area and Sampling

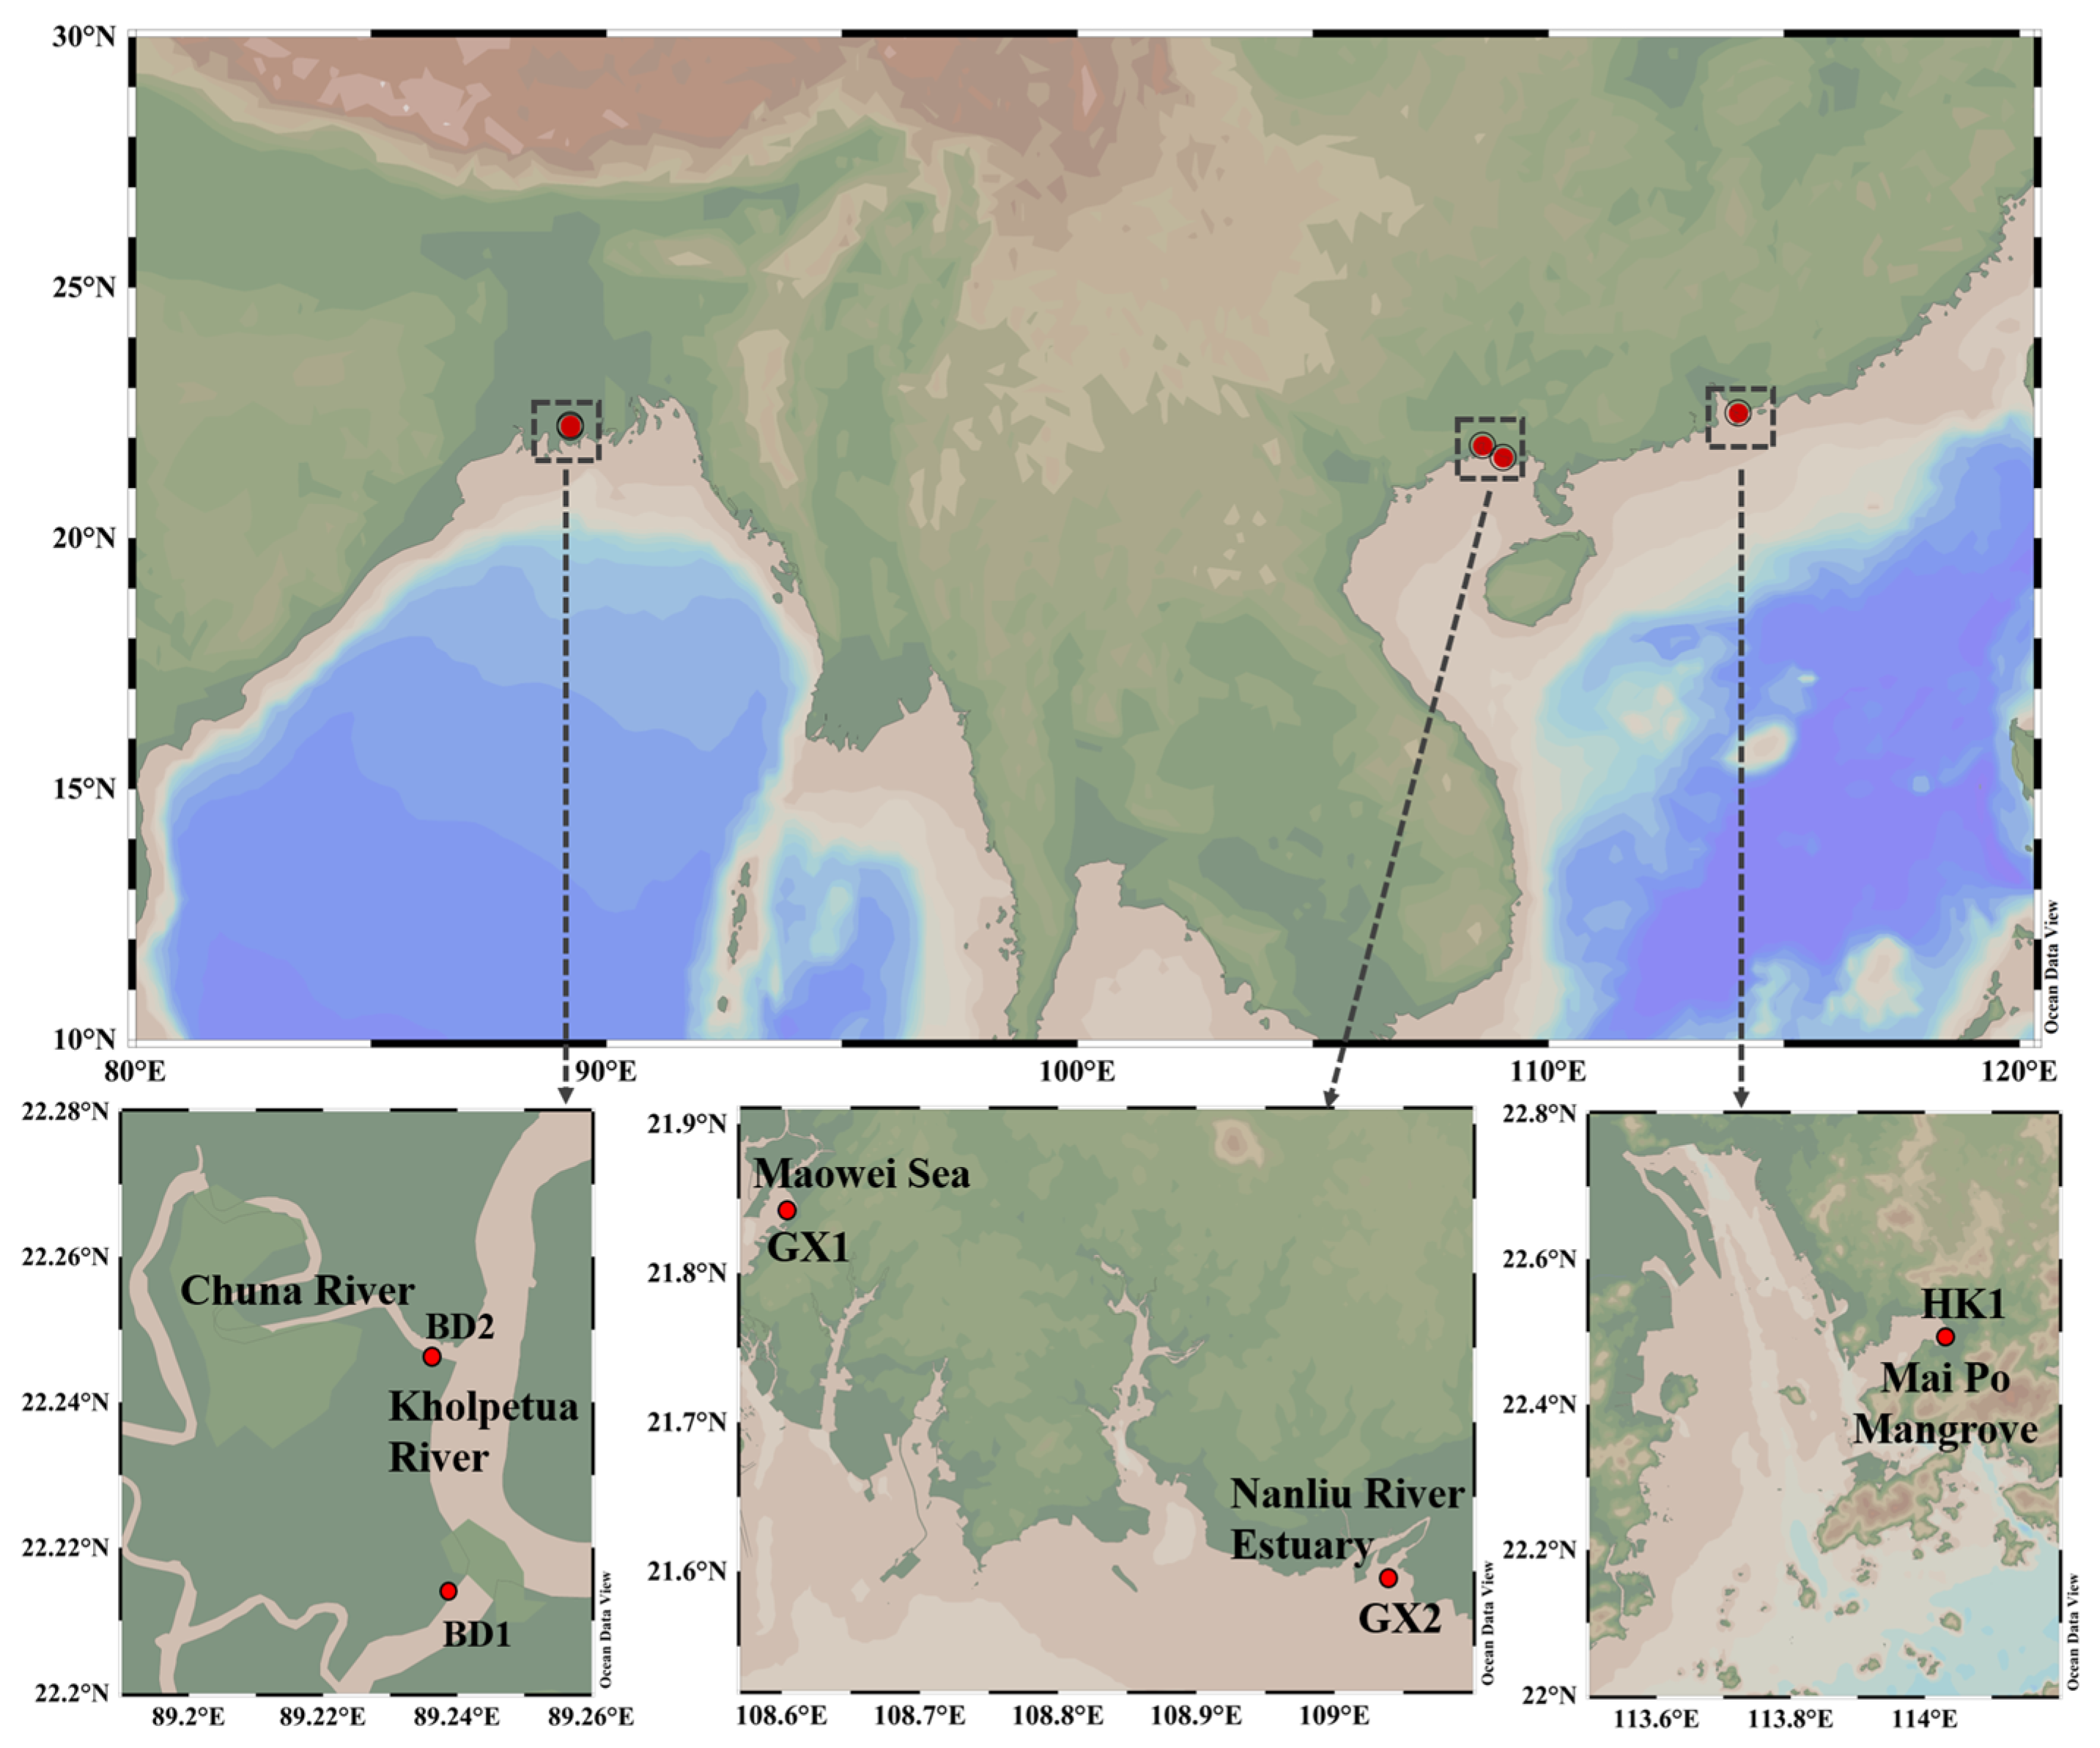
The three mangrove regions are located at the Kholpetua River and Chuna River estuaries in the northwestern Sundarbans of Bangladesh, the Mai Po Marshes Nature Reserve in Hong Kong, China, and the Maowei Sea and Nanliu River estuary in Guangxi Province, China. A total of five sediment cores were collected from these three regions, with two cores from Bangladesh (namely BD1, BD2), one core from Hong Kong (namely HK1), and two cores from Guangxi (namely GX1, GX2) (Figure 2). The BD1 core was collected from the Kholpetua River (22.21° N, 89.24° E) and the BD2 core was obtained from the Chuna River (22.25° N, 89.24° E), both having a length of 30 cm. The HK1 core, 25 cm long, was collected from Mai Po in Hong Kong (22.49° N, 114.03° E). The GX1 core, 75 cm long, was obtained from the Maowei Sea in Guangxi (21.84° N, 108.60° E) and the GX2 core, 90 cm long, was collected from the estuary of the Nanliu River in Guangxi (21.60° N, 109.04° E). Sediment samples were collected using custom-built gravity samplers constructed from PVC pipes during periods of low tide. Following sample retrieval, the sediments were sectioned at a resolution of 1 cm for cores BD 1 and BD 2, at intervals of 1 to 5 cm for core HK, and at 15 cm intervals for cores GX1 and GX2. All samples were stored at −20 °C in the lab until further processing.

2.2. Environmental Parameter Measurement

The pH values of samples were determined following the method described by Weijers et al. [3]. The sediment samples were mixed with deionized water in a ratio of 2.5:1 (v:w, mL/g). After allowing the mixture to stand for 30 min, the pH of the suspension was measured within one hour using a pH meter. Each sample was measured in triplicate (with a deviation of less than 0.05), and the average value was recorded as the pH of the sediment.
For total organic carbon (TOC) content measurement, about 2 g of the freeze-dried sample was mixed with 15 mL hydrochloric acid (3 mol/L). After complete reaction to remove carbonates, the sample was washed with ultrapure water until the pH approached neutrality, and the supernatant was removed from the centrifuge tube. The resulting sediment sample was then heated and dried before being ground into a powder. An elemental analyzer (Vario EL cube) (ELEMENTAR, Langenselbold, Germany) was used for TOC content analysis with the analytical precision of 0.1%.
Sea Surface Temperature (SST) data were obtained from https://psl.noaa.gov/data/gridded/data.cobe2.html (accessed on1 February 2025), which provides global monthly SST data on a 360 × 180 grid from January 1850 to the present. Mean Annual Air Temperature (MAAT) data were sourced from https://psl.noaa.gov/data/gridded/data.ghcncams.html (accessed on 1 February 2025), offering global monthly MAAT data on a 360 × 720 grid from January 1948 to the present. For analysis, latitude and longitude matching was performed using Python 3 software, with proximal SST and MAAT data selected based on site-specific coordinate proximity for subsequent analysis.

2.3. Extraction and Analysis of GDGTs

After freeze-drying, 1.5–3 g sediment samples were weighed, and ground uniformly in a mortar. The ground samples were then placed in FEP tubes for further use. A certain amount of the internal standard C46-GTGT was added [31], along with 15 mL of a mixed organic solvent composed of dichloromethane and methanol (3:1 v:v), and the mixture was subjected to ultrasonic extraction for 15 min. Subsequently, the samples were centrifuged at 3500 rpm for 10 min, and the supernatant was transferred to a pre-labeled round-bottom glass flask. The ultrasonic extraction and centrifugation steps were repeated two more times. The combined supernatants from the three extractions were concentrated to 2 mL using a rotary evaporator. The resulting extract was transferred to a glass vial, dried completely under nitrogen, and then dissolved in an appropriate amount of n-hexane: isopropanol (99:1 v:v). The solution was filtered through a 0.45 μm organic phase syringe filter (nylon) to remove any particulate matter, and the filtered liquid was transferred to a 1.5 mL injection vial for analysis using a high-performance liquid chromatography-mass spectrometry (HPLC-MS/MS) system (Agilent 1290 Infinity II-6460 Triple Quad) (Agilent Technologies, Santa Clara, CA, USA).
The chromatographic separation was performed on two Hypersil GOLD™ silica HPLC columns in tandem, maintained at 40 °C. The mobile phase A was 100% n-hexane, while mobile phase B consisted of a 9:1 mixture of n-hexane (HEX) and isopropanol (IPA) (v:v). A sample volume of 10 μL was injected, and eluted over a 5-min period using 16% mobile phase B and 84% mobile phase A. A linear gradient from 5 to 45 min increased mobile phase B to 17% and decreased mobile phase A to 83%. From 45 to 55 min, mobile phase B increased to 20% while mobile phase A decreased to 80%. From 50 to 90 min, mobile phase B increased to 100%, with a flow rate of 0.200 mL/min. Between 90 and 100 min, mobile phase A was linearly increased back to 84%, while mobile phase B decreased to 16%. The total run time was 100 min, with a 10-min equilibration time.
The mass-to-charge ratios (m/z) of the GDGT compounds analyzed were 1302, 1300, 1298, 1296, 1292, 1050, 1048, 1046, 1036, 1034, 1032, 1022, 1020, and 1018, while the m/z of the standard C46 GTGT was 744. Qualitative identification of the compounds was based on the characteristic ion mass spectra obtained from the scans. Quantitative analysis was performed by integrating the peaks of the identified compounds in the chromatograms, with the peak area ratio to the internal standard used to calculate the concentration of the respective compounds, which was then converted to the concentration in the sediments. Since we did not determine the response factors of individual GDGTs, the concentrations reported could be only considered to be semi-quantitative. The average reproducibility of the indices, based on duplicate analysis of sediments, was 0.003 for the BIT and 0.010 for TEX86.

2.4. GDGTs-Derived Indices

Several indices were calculated based on individual GDGT compounds, including BIT, IIIa/IIa, MBT’5ME, CBT’, TEX86, MI and GDGT-0/Cren. The BIT index is defined as:
BIT = ( I a   +   II a   +   III a   +   II a   +   III a ) ( I a   +   II a   +   III a   +   II a   +   III a   +   Cren )
The BIT values of soil samples usually range from 0.8 to 1.0, which are significantly higher than those of marine sediments with minimal terrestrial input (<0.2). In contrast, sediments from estuarine and marginal sea environments, which are significantly influenced by terrestrial input, exhibit BIT values that fall between those of soil and open ocean sediments [3,10].
The brGDGT IIIa/IIa ratio is based on the abundance ratio of hexamethylated brGDGTs to pentamethylated brGDGTs without cyclopentane moieties [11]:
Σ III a Σ II a = III a   +   III a II a   +   II a
A statistical analysis of over 1000 global samples revealed that the ∑IIIa/∑IIa ratio is lower than 0.59 in soils, greater than 0.92 in open ocean environments, and falls between 0.59 and 0.92 in areas impacted by significant terrestrial inputs [11].
Schouten et al. [8] proposed that the distribution of isoGDGTs was controlled by the growth temperatures of their source organisms (mainly Thaumarchaeota), and introduced the TEX86 index based on the relative distribution of the number of cyclopentane rings:
TEX 86 = GDGT - 2   +   GDGT - 3   +   Cren GDGT - 1   +   GDGT - 2   +   GDGT - 3   +   Cren
Kim et al. [32] investigated GDGTs in marine sediment samples globally and established a new calibration formula of TEX86-SST applicable to temperature ranges from 5 °C to 30 °C:
SST   =   56.2   ×   TEX 86     10.78   r 2   =   0.935 ,   n   =   223 ;   RMSE   =   1.7   ° C
The MBT’ is defined as the relative abundance of branched methyl groups of brGDGTs in soils [3]:
MBT = ( I a   +   I b   +   I c ) ( I a   +   I b   +   I c   +   II a   +   II b   +   II c   +   III a   +   II a   +   II b   +   II c   +   III a )
De Jonge et al. [33] improved the separation resolution of brGDGTs by using two HPLC columns in tandem and found that brGDGT isomers previously thought to be single compound contained at least two isomers, 5-methyl and 6-methyl isomers. They observed that these isomers respond differently to environmental conditions, leading to the proposal of the MBT’5ME and CBT’ indices based solely on the 5-methyl isomer. Additionally, they developed an improved transformation function based on the fitting of modern samples with temperature and pH parameters.
MBT 5 ME = ( I a + I b + I c ) ( I a + I b + I c + II a + II b + II c + III a )
MAT MBT 5 ME = 8.57 + 31.45   ×   MBT 5 ME ( n = 222 , r 2 = 0.66 , R M S E = 4.8   ° C )
C B T = l o g 10 I c + I I a + I I b + I I c + I I I a + I I I b + I I I c I a + I I a + I I I a
pH CBT = 7.15 + 1.59   ×   CBT   ( n = 221 ,   r 2 = 0.85 ,   RMSE = 0.52 )
In addition, two methane indexes were developed based on isoGDGT compounds. Zhang et al. [12] proposed a MI proxy based on three types of isoGDGTs (GDGT-1, GDGT-2, and GDGT-3), which are mainly produced by ANMEs (belong to anaerobic methane-oxidizing archaea) and Thaumarchaeota (Ammonia-oxidizing archaea). The MI is defined as:
MI = GDGT - 1   +   GDGT - 2   +   GDGT - 3 GDGT - 1   +   GDGT - 2   +   GDGT - 3   +   Cren   +   Cren
The high MI values (>0.3–0.5) are strongly associated with high methane fluxes and shallow sulfate-methane transition zone depths (<1–3 m) commonly linked to gas hydrate dissociations [12,13]. The applications of MI to modern and paleo-samples demonstrate that MI can serve as a sensitive and quantitative proxy to reconstruct the history of marine methane biogeochemical cycling. Additionally, Blaga et al. [34] examined 47 European lakes and proposed an indicator based on the abundance ratio of GDGT-0 and Creanarchaol (GDGT-0/Cren). It is generally higher than 2 when the methane-producing archaea contributes significantly to the isoGDGTs pool. To facilitate understanding of the summation operations and statistical calibration parameters in the subsequent equations, Table 1 supplements the definitions of the symbols involved in the equations.

2.5. DNA Extraction and Sequencing

For DNA analysis, approximately 500 mg subsamples were taken from the freeze-dried sample sediments. DNA analyses were conducted on 25 mangrove sediment samples collected from different depths at sites BD1, BD3, GX1, and GX2. We did not analyze DNA for core HK1 due to limited samples. Total genomic DNA extraction from microbial communities was performed according to the protocol provided by the E.Z.N.A.® Soil DNA Kit (Omega Bio-tek, Norcross, GA, USA). The quality of the extracted genomic DNA was assessed using 1% agarose gel electrophoresis, and DNA concentration and purity were measured with NanoDrop 2000 (Thermo Scientific, Waltham, MA, USA).
Using the extracted DNA as a template, PCR amplification of the V3-V4 variable region of the bacterial 16S rRNA gene was performed with the upstream primer 338F (5′-ACTCCTACGGGAGGCAGCAG-3′) and downstream primer 806R (5′-GGACTACHVGGGTWTCTAAT-3′), both containing barcode sequences. This primer pair is known to cover a broad taxonomic range of bacteria [35]. The PCR reaction mixture consisted of 4 μL of 5 × TransStart FastPfu buffer, 2 μL of 2.5 mM dNTPs, 0.8 μL of upstream primer (5 µM), 0.8 μL of downstream primer (5 µM), 0.4 μL of TransStart FastPfu DNA polymerase, 10 ng of template DNA, and the volume was adjusted to 20 μL with distilled water. The amplification program was as follows: initial denaturation at 95 °C for 3 min, followed by 27 cycles of denaturation at 95 °C for 30 s, annealing at 55 °C for 30 s, and extension at 72 °C for 30 s, with a final extension at 72 °C for 10 min, and the samples were stored at 4 °C (PCR machine: ABI GeneAmp® 9700) (Thermo Scientific, Waltham, MA, USA). PCR products were recovered using 2% agarose gel and purified with a DNA gel recovery kit (PCR Clean-Up Kit, China Yuhua), followed by quantification of the recovered products using Qubit 4.0 (Thermo Fisher Scientific, Waltham, MA, USA). The sequencing was performed on the Illumina NextSeq 2000 platform (Shanghai Meiji Biomedical Technology Co., Ltd., Shanghai, China).
Quality control of the paired-end raw sequencing reads was conducted using fastp (version 0.19.6) [36] and sequence assembly was performed with FLASH (version 1.2.11). The UPARSE v7.1 software was utilized for operational taxonomic unit (OTU) clustering at a 97% similarity threshold [37,38], and chimeric sequences were removed (http://drive5.com/uparse/, accessed on 9 January 2024). To minimize the impact of sequencing depth on subsequent data analysis, all samples were drawn flat at the minimum number of sample sequences. Taxonomic classification of OTUs was conducted using the RDP classifier (version 2.11) in comparison with the Silva 16S rRNA gene database (v138), with a confidence threshold set at 70%. The community composition for each sample was then statistically analyzed at various taxonomic levels

2.6. Statistical Analysis

Data calculations and analyses, including Spearman correlation coefficients and analysis of variance (ANOVA), were conducted using IBM SPSS Statistics 24, while linear regression analyses were performed using ORIGIN PRO 2022.

3. Results

3.1. Concentration and Composition of GDGTs in Surface Sediments

The six isoGDGT compounds and thirteen brGDGT compounds, shown in Figure 1, were detected in surface sediments. It should be noted that all GDGT concentrations reported herein are semi-quantitative due to the lack of response factor calibration. The total concentration of GDGTs varied from 91.66 to 428.94 ng·g−1 dry weight sediment (dws). Comparing the surface sediments of the three mangrove regions revealed the highest GDGT concentration in core HK1 (428.94 ng·g−1 dws), followed by cores BD1 and BD2 (139.63 ± 9.64 ng·g−1 dws; mean ± standard deviation (SD)), while the lowest concentrations were observed in cores GX1 and GX2 (101.70 ± 14.21 ng·g−1 dws). For the Guangxi mangrove wetlands and Bangladesh mangrove wetlands that contain two sampling sites, the concentrations of total GDGTs in surface sediments are comparable between BD1 (132.81 ng·g−1 dws) and BD2 (146.45 ng·g−1 dws), as well as between GX1 (111.75 ng·g−1 dws) and GX2 (91.66 ng·g−1 dws).
Among all samples, the abundance of brGDGTs was consistently higher than that of isoGDGTs (82.16 ± 11.22% vs. 17.84 ± 11.22%), with corresponding concentration ranges of 80.20 to 279.30 ng·g−1 dws for brGDGTs and 4.88 to 149.63 ng·g−1 dws for isoGDGTs. Crenarchaeol (Cren) was the most abundant isoGDGT compound, followed by GDGT-0, while Crenarchaeol isomer (Cren’) had the lowest abundance. Among the brGDGTs, GDGT-Ia was the most abundant, followed by GDGT-Ib, while GDGT-IIIb and GDGT-IIIb’ had the lowest concentrations.

3.2. Depth Distributions of TOC and GDGTs in Core Sediments

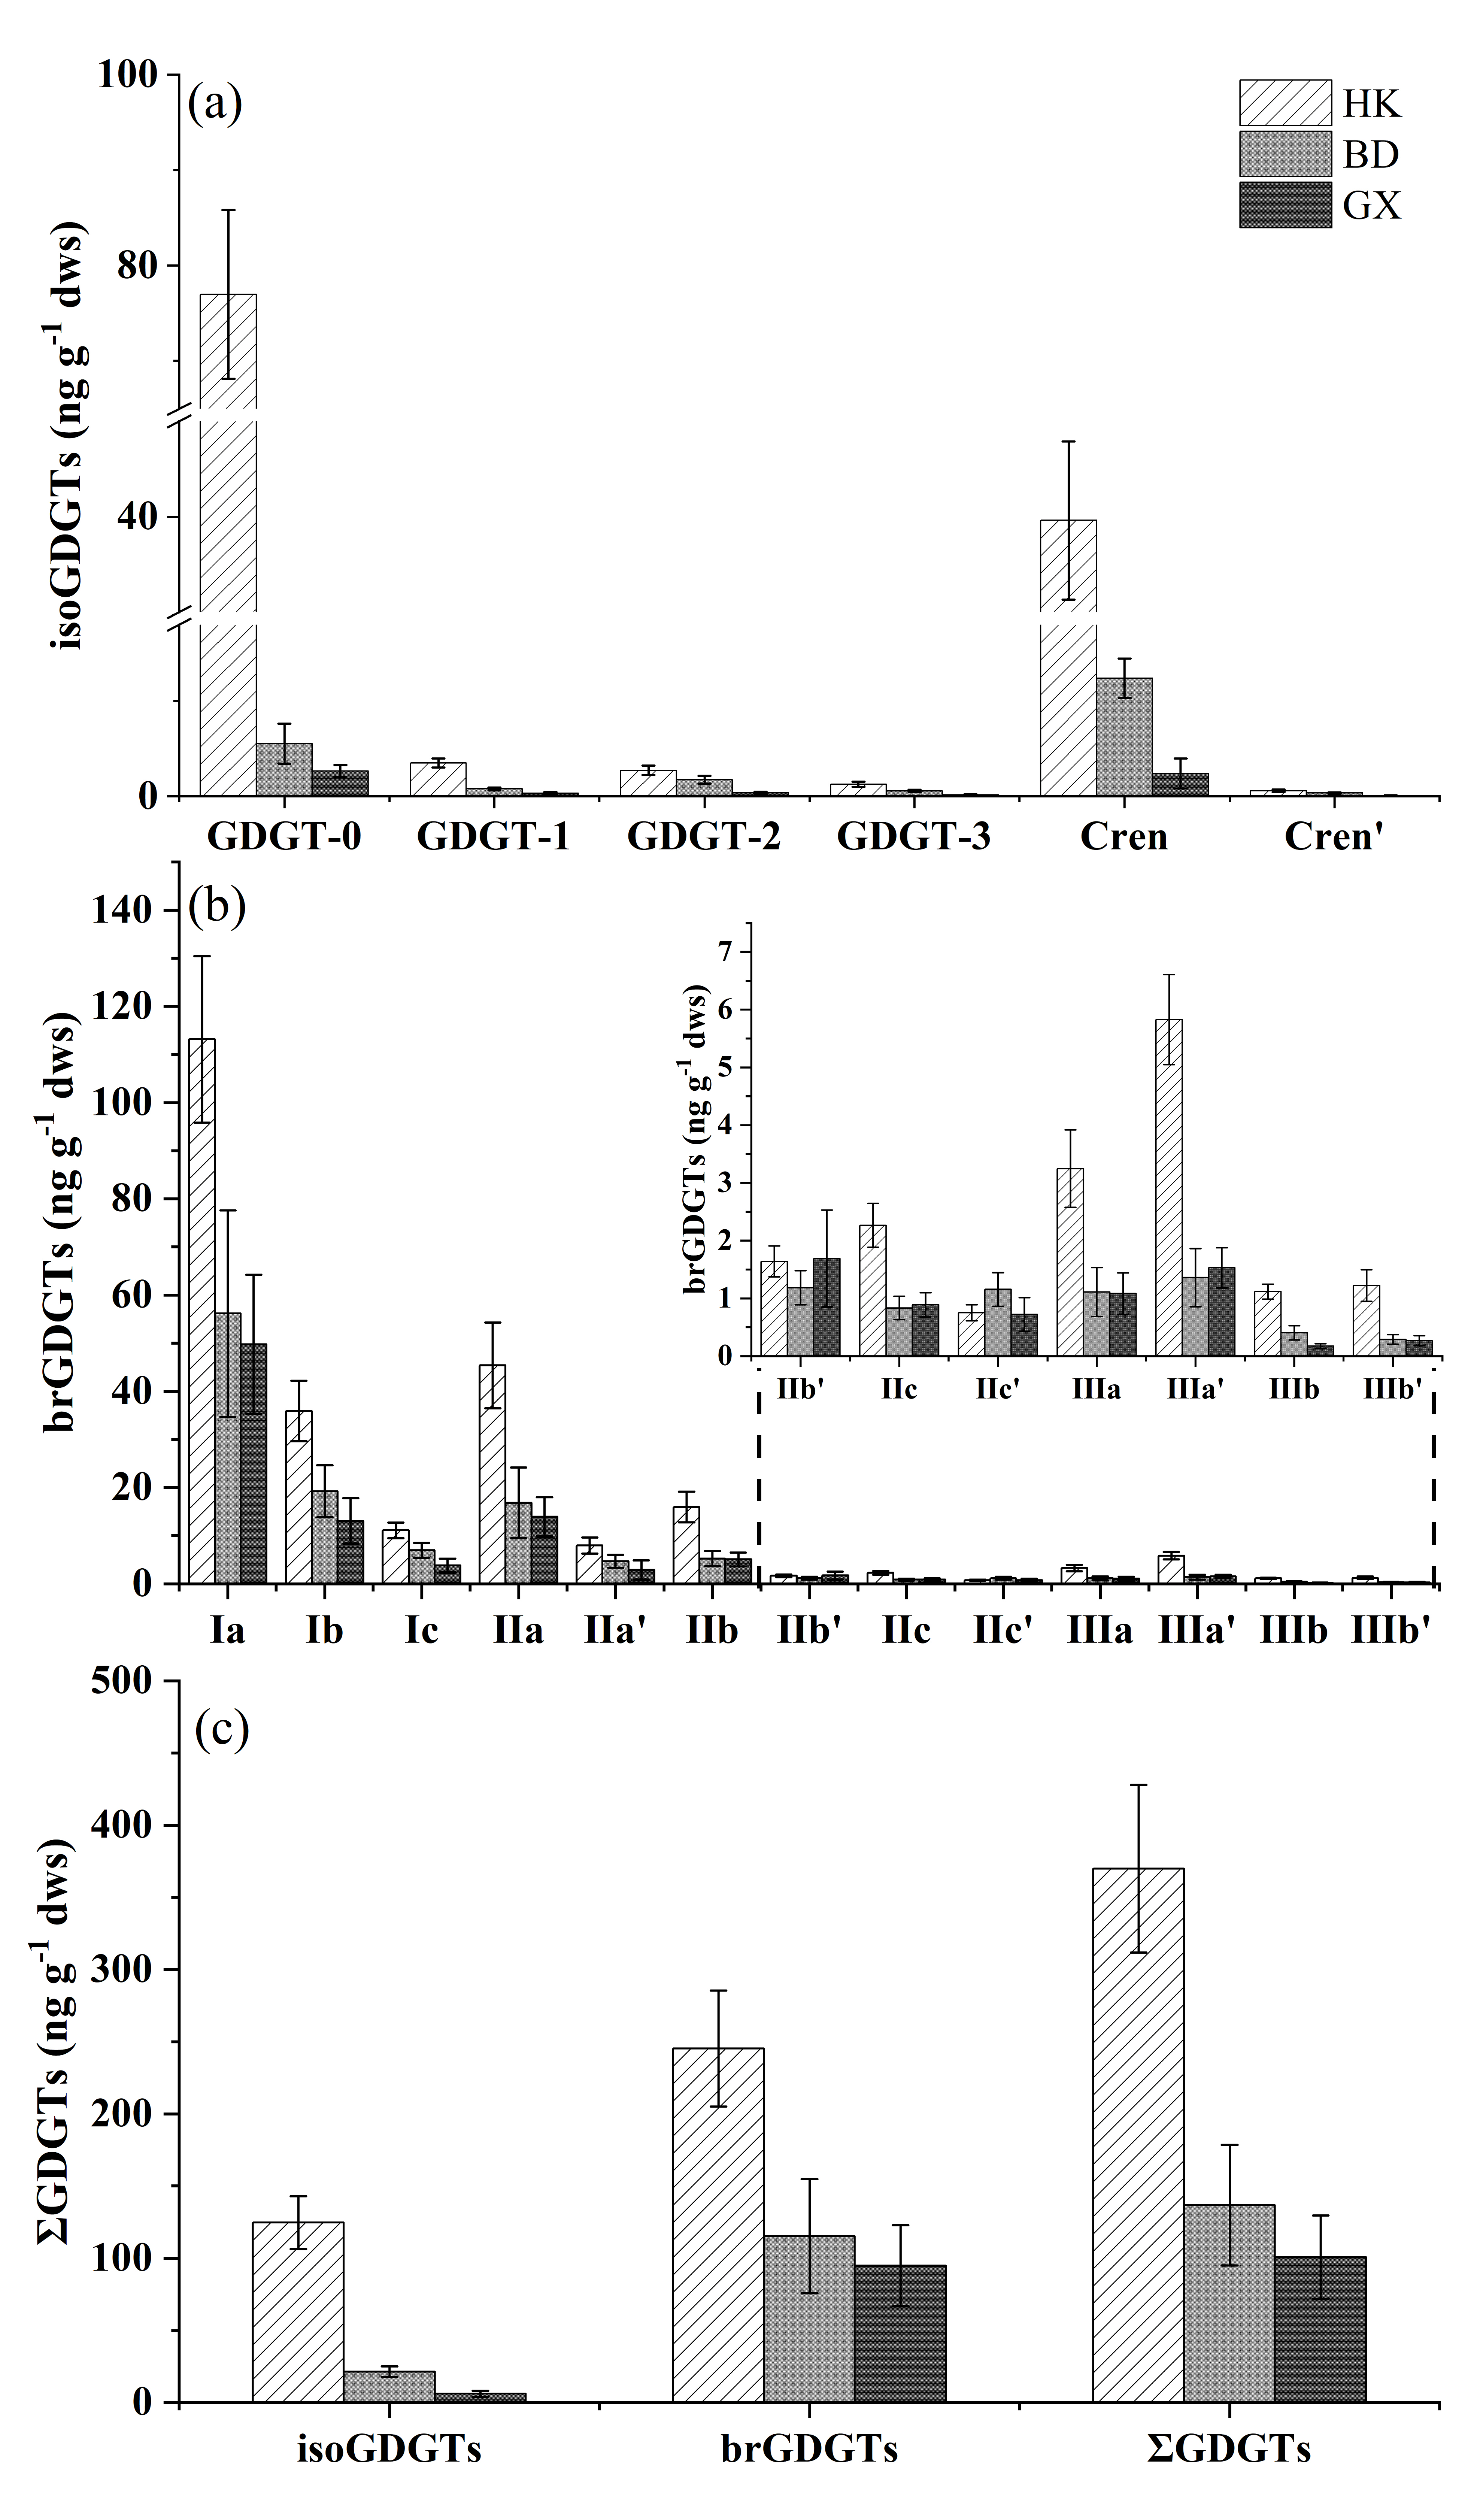
The composition and concentration of GDGTs in the core sediments from the three regions were shown in Figure 3. The total concentration of GDGTs ranged from 61.04 to 432.91 ng·g−1 dws. A comparison of the core sediments from the three mangroves indicated that the highest GDGT concentration was in the mangrove sediments of Hong Kong (370.18 ± 58.00 ng·g−1 dws), followed by those in Bangladesh (136.70 ± 41.70 ng·g−1 dws), while the lowest concentrations were observed in the Guangxi Maoweihai and Nanliu River estuary mangrove sediments (100.80 ± 28.71 ng·g−1 dws) (Figure 3c). The average concentrations of total GDGTs are comparable between cores BD1 and BD2 (131.29 ± 20.69 ng·g−1 dws vs. 142.30 ± 55.63 ng·g−1 dws). In contrast, there is a significant difference in the average concentrations of total GDGTs between cores GX1 and GX2, with values of 126.57 ± 17.43 ng·g−1 dws and 79.33 ± 13.75 ng·g−1 dws, respectively.
Figure 4 shows depth profiles of TOC content and GDGTs in five sediment cores. As illustrated in Figure 4a, the TOC content in core HK1 varied from 1.90% to 2.61%, with a mean of 2.20 ± 0.21% (n = 11). This value is significantly higher than that observed in cores BD1 and BD2, where TOC ranged from 0.53% to 0.79% (0.60 ± 0.08%; n = 12), and in cores GX1 and GX2, where TOC ranged from 0.26% to 0.55% (0.38 ± 0.11%; n = 10). Analysis of variance (ANOVA) revealed statistically significant differences in TOC among the three mangrove regions (p < 0.01). For individual cores, the average TOC values were comparable between cores BD1 and BD2 (0.61 ± 0.10% vs. 0.59 ± 0.07%), but significantly higher in cores GX1 than GX2 (0.48 ± 0.07% vs. 0.29 ± 0.02%).
The abundance of brGDGTs was generally higher than that of isoGDGTs (82.81 ± 7.82% vs. 17.19 ± 7.82%; n = 81), with corresponding concentration ranges of brGDGTs and isoGDGTs being 57.93 to 301.57 ng·g−1 dws and 3.11 to 149.63 ng·g−1 dws, respectively. In the core sediments, GDGT-0 had the highest average abundance among the isoGDGT series, followed by Cren, with Cren’ having the lowest abundance (Figure 3a). In the brGDGTs, GDGT-Ia was the most abundant, followed by GDGT-Ib, while GDGT-IIIb’ had the lowest concentration (Figure 3b).
The concentrations of GDGTs exhibited distinct patterns of variation with increasing burial depth. Both isoGDGTs and brGDGTs showed a significant decreasing trend with depth in core HK1, but only minor changes throughout cores GX1, GX2, BD1 and BD2 (Figure 4). Despite the notable decline with depth, the core HK1 consistently exhibited significantly higher levels of total GDGTs than other four cores across all depths, with a mean concentration of 370.18 ± 58.00 ng·g−1 dws, 136.70 ± 41.70 ng·g−1 dws, and 100.80 ± 28.72 ng·g−1 dws, respectively (Figure 4d). For isoGDGTs, the average concentrations were 124.64 ± 18.27 ng·g−1 dws in Hong Kong mangrove sediments (HK1), 21.35 ± 3.65 ng·g−1 dws in Bangladesh mangrove sediments (BD1 and BD2), and 6.01 ± 2.22 ng·g−1 dws in Guangxi mangrove sediments (GX1 and GX2) (Figure 4b). For brGDGTs, the average concentrations were 245.54 ± 40.16 ng·g−1 dws in Hong Kong mangrove sediments, 115.34 ± 39.46 ng·g−1 dws in Bangladesh mangrove sediments, and 94.79 ± 28.05 ng·g−1 dws in Guangxi mangrove sediments (Figure 4c).
The BIT, IIIa/IIa, MI, and GDGT-0/Cren indices of the sediment cores from the three mangrove regions exhibited different depth profiles. Although the BIT values remained consistently high (ranging from 0.80 to 0.98), there was a slight increasing trend with depth, particularly evident in the core HK1. The BIT values across the three regions indicated that GX mangrove sediment cores (0.89 to 0.98) were significantly higher than those in BD (0.81 to 0.96) and HK (0.80 to 0.83) (Figure 4e). Meanwhile, the IIIa/IIa values across the three regions ranged from 0.10 to 0.19 (Figure 4f). The IIIa/IIa values in the core from HK (0.16 to 0.19) were significantly higher than those in BD (0.10 to 0.14) and GX (0.14 to 0.18). Additionally, the IIIa/IIa values in GX mangrove sediments showed a slight decreasing trend with depth, while those in the HK and BD mangroves exhibited a slight increasing trend with depth. The MI values in HK (0.15 to 0.17) were notably lower than those in the other two mangrove regions (0.16 to 0.35) (Figure 4g). In contrast, the GDGT-0/Cren values in HK (1.68 to 2.38) were significantly higher than those in BD and GX (0.34 to 1.78).

3.3. Bacterial Communities in Mangrove Sediments

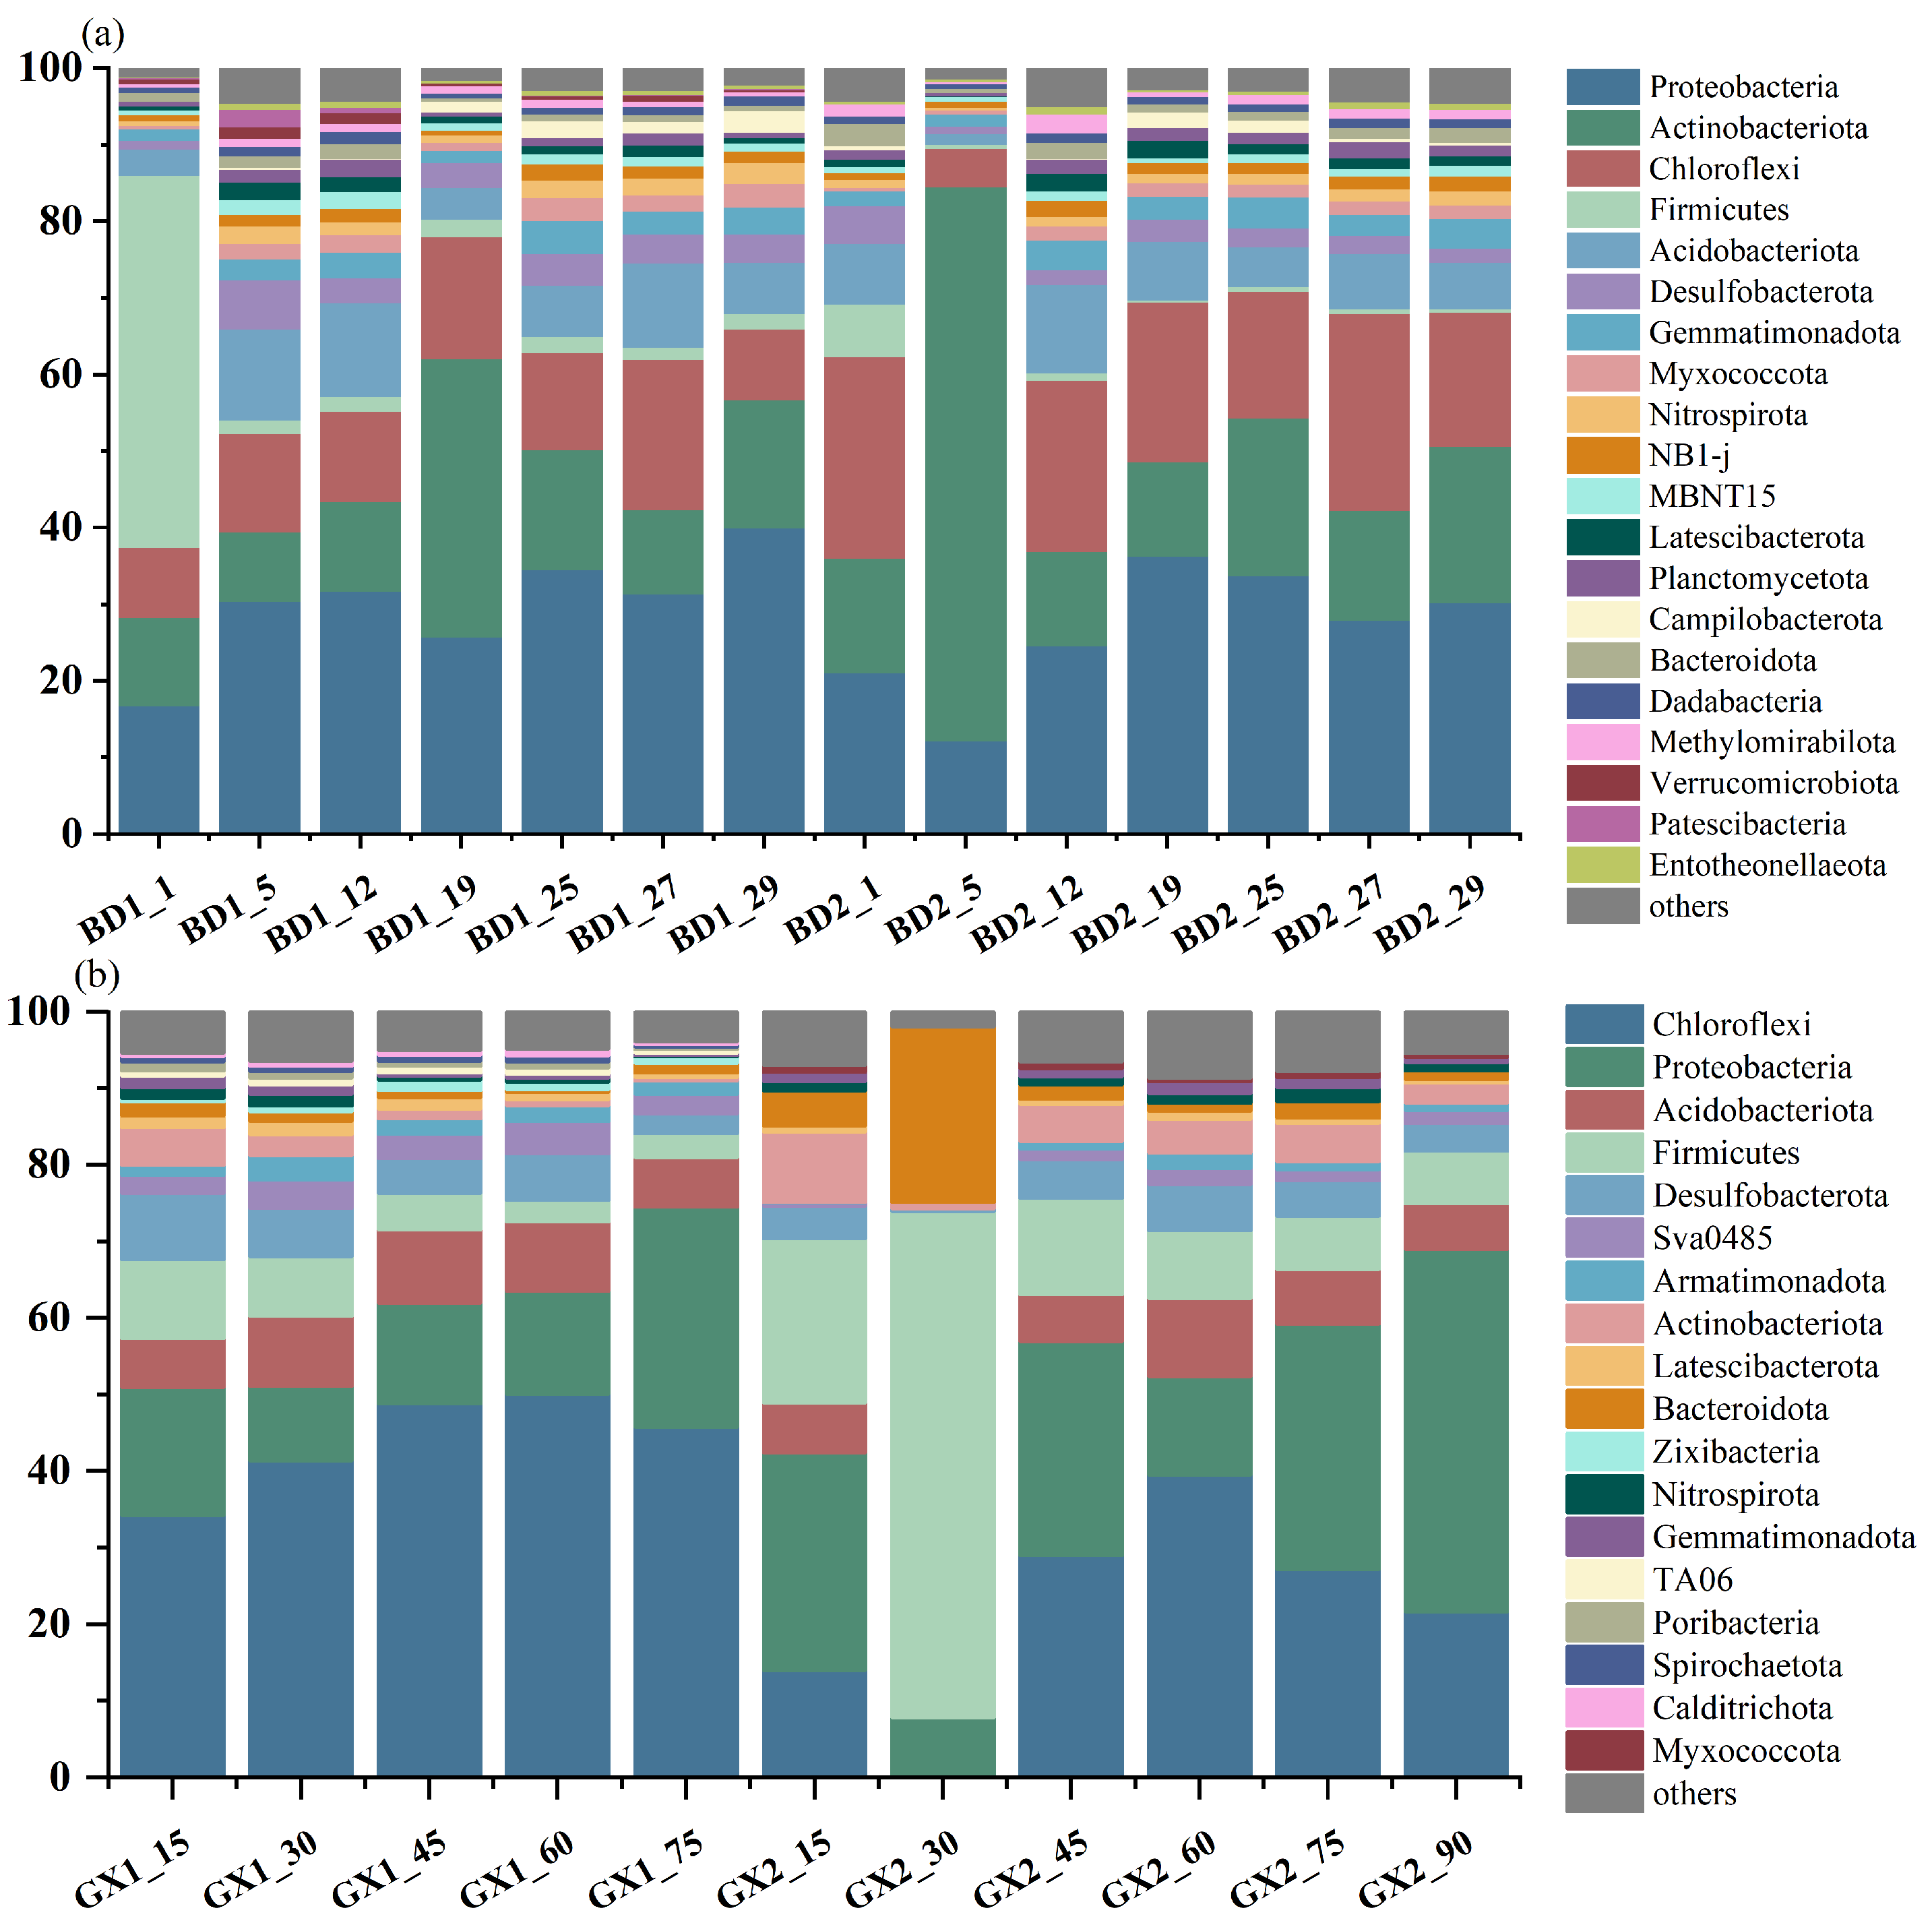
Bacterial communities in the selected mangrove sediments were illustrated in Figure 5. The major bacterial phyla were generally similar among different regions, although the orders in relative abundance were different. The mangrove sediments of Bangladesh, the dominant bacterial phyla in core BD1 were Proteobacteria, Actinobacteriota, Chloroflexi, Firmicutes, and Acidobacteriota, while in core BD2, the predominant bacterial phyla were Proteobacteria, Actinobacteriota, Chloroflexi, Acidobacteriota, and Gemmatimonadota. In the sediments from Guangxi mangrove, the dominant bacterial phyla in GX1 included Chloroflexi, Proteobacteria, Acidobacteriota, Firmicutes, and Desulfobacterota, while in GX2, the dominant phyla were Proteobacteria, Chloroflexi, Firmicutes, and Acidobacteriota. The total relative abundance of these dominant bacterial phyla exceeded 70% at each sampling site. Although there were some differences in the dominant bacterial phyla among the various sites, certain dominant phyla exhibited relatively high abundance across multiple sites; for example, in BD1 and BD2, Desulfobacterota was found to be the third most abundant phylum after Acidobacteriota and Gemmatimonadota.
As depth increased, the microbial communities exhibited notable changes. In the regions of Bangladesh (BD1 and BD2) and Guangxi (GX1 and GX2), the relative abundance of Proteobacteria was observed to be greater in the deeper sediment layers compared to the surface layers. The core BD2 exhibited the highest abundance of Proteobacteria at a depth of 19 cm. The Proteobacteria phylum included the classes Alphaproteobacteria, Zetaproteobacteria, unclassified Proteobacteria, and Gammaproteobacteria. Among these, Alphaproteobacteria (8.87 ± 4.30%) and Gammaproteobacteria (16.45 ± 8.67%) displayed relatively high abundances in the mangrove sediment samples from both Bangladesh and Guangxi. The relative abundance of Chloroflexi varied among the sampling sites; in BD1 and GX1, it showed an increasing trend with depth, while in BD2, it exhibited an overall decreasing trend with depth, and in GX2, it initially increased before decreasing. The relative abundance of Firmicutes demonstrated similar patterns in the two sampling sites in Bangladesh, characterized by high values at the surface, followed by a rapid decline to low values, remaining stable with depth. In contrast, the two sites in Guangxi showed different trends: in GX1, the relative abundance of Firmicutes gradually decreased with increasing depth, while in GX2, it peaked at 30 cm before declining and then stabilizing with depth. The relative abundance of Acidobacteriota varied across the sampling sites, showing low values at 1 cm, 19 cm, and 29 cm in BD1, while in BD2, GX1, and GX2, it exhibited an overall trend of increasing followed by decreasing abundance with depth.

3.4. pH and Temperature

The measured pH values of the sediments from three mangrove regions ranged from 7.34 to 8.46, with an average of 8.09 ± 0.24 (n = 71), indicating a generally neutral to alkaline character (Figure 6). The pH values for the mangroves in BD, HK, and GX were 8.17 ± 0.16 (n = 51), 8.11 ± 0.21 (n = 9), and 7.70 ± 0.19 (n = 11), respectively. The variation in pH values with depth was not particularly pronounced across the three mangrove sites. For BD1, the pH values ranged from 7.87 to 8.46, showing a characteristic where the pH at the bottom was higher than that at the top. In BD2, the pH values ranged from 7.62 to 8.39, with the highest mean level among the five sampling sites. The pH values for HK1 ranged from 7.78 to 8.39, demonstrating an increasing trend with depth. At the two sites in Guangxi Province, GX1 exhibited pH values ranging from 7.56 to 8.01, displaying an initial increase followed by a decrease with depth, while GX2 had pH values ranging from 7.34 to 7.94, showing a consistent increasing trend with depth.
During the January 2020 sampling campaign in the Mai Po mangrove of Hong Kong, the mean annual air temperature (MAAT) was recorded as 24.42 °C, while the mean annual sea surface temperature (SST) was 25.07 °C. For the Guangxi sampling areas, data collected in January 2024 indicated that the MAAT at sites GX1 and GX2 was 24.43 °C and 24.31 °C, respectively, with corresponding annual SST values of 25.19 °C and 25.22 °C. In the Sundarbans mangrove of Bangladesh, results from the January 2023 sampling period showed that both sites BD1 and BD2 exhibited a MAAT of 27.70 °C, whereas their mean annual SST was measured at 28.15 °C.

4. Discussion

4.1. Source of GDGTs in Sediments from Three Mangrove Wetlands

The concentrations of combined isoGDGTs and brGDGTs in the sediments from the three mangrove regions are comparable to previously reported concentrations in Xiamen mangroves within Chinese coastal wetlands (ranging from 248.3 to 1012.6 ng·g−1 dry sediment) [39]. In order to assess the sources of GDGTs, we considered multiple indices including BIT, IIIa/IIa, MI, GDGT-0/Cren, and the fractional abundance of tetramethylated, pentamethylated, and hexamethylated brGDGTs. These indices rely on relative abundances or ratios of GDGT compounds, which are unaffected by the semi-quantitative nature of concentration data. The BIT index is commonly used to assess the relative contribution of terrestrial and marine organic matter [10], with BIT values approaching 1 in terrestrial soils and peats, and near 0 in open ocean environments. In our study, BIT values ranged from 0.80 to 0.98 (0.87 ± 0.05, n = 81), suggesting that organic matter is primarily derived from terrestrial microbial inputs. This result is consistent with low brGDGTs IIIa/IIa ratio, varing from 0.09 to 0.19 (0.13 ± 0.02, n = 81). According to the compilation of global marine sediment and soil data [40], which defines IIIa/IIa thresholds (soils < 0.59; open ocean > 0.92). The IIIa/IIa ratios in the three mangrove regions are all below 0.59, indicating that local sedimentary source microorganisms are the primary producers of brGDGTs in all three mangrove wetlands.
The ternary diagram depicting the proportions of tetramethylated, pentamethylated, and hexamethylated brGDGTs (Figure 7) indicates that all three regions are predominantly composed of tetramethylated brGDGTs, which constitute an average proportion of 70.38 ± 2.21%. This is followed by pentamethylated brGDGTs, which account for 26.54 ± 1.59%, while hexamethylated brGDGTs are present at the lowest levels (3.08 ± 0.69%). Previous studies [11,40] reported the following proportions of brGDGTs in various environments: in global marine sediments, tetramethylated, pentamethylated, and hexamethylated brGDGTs were found at 47.69 ± 18.93%, 31.10 ± 9.28%, and 21.21 ± 15.32%, respectively; in global soils, the proportions were 26.60 ± 13.29%, 40.00 ± 11.96%, and 33.37 ± 22.72%; in global lake sediments, they were 44.17 ± 25.08%, 42.05 ± 16.29%, and 13.73 ± 10.88%; and in global peat, the values were 68.32 ± 18.60%, 27.13 ± 14.43%, and 4.55 ± 5.58%. Consequently, mangrove sediments exhibit brGDGT compositions most similar to those of peat samples, although there is some overlap with certain soil samples (Figure 7). However, systematic differences exist in the brGDGT composition between mangrove sediments and global lake or marine sediments. The precise reasons for these differences warrant further investigation, but they are likely related to factors such as redox conditions, water content, and pH, among others.

4.2. Heterogenous Distributions of GDGTs in Three Mangrove Wetlands

Although terrestrial input represents a major source in all three mangrove wetlands, some variations in GDGTs’ composition were observed. A comparison of the three mangrove regions indicates that the brGDGT compositions of the BD and GX mangrove sediments are more similar, whereas HK mangrove sediments exhibit notable differences (Figure 7). Specifically, the former two regions were characterized by a higher proportion of tetramethylated brGDGTs (71.36 ± 0.76% and 70.22 ± 1.06% vs. 65.40 ± 0.81%), while the latter contains a higher proportion of pentamethylated brGDGTs (29.92 ± 0.89% vs. 25.89 ± 0.70% and 26.53 ± 0.93%). In addition, significant differences in the BIT and IIIa/IIa values among the three mangrove regions (p < 0.01). The BIT values were the lowest in Hong Kong mangrove sediments (0.82 ± 0.01), intermediate in Bangladesh mangrove sediments (0.86 ± 0.03), and the highest values observed in Guangxi mangrove sediments (0.96 ± 0.03). Correspondingly, the IIIa/IIa values were the highest ratio in Hong Kong mangrove sediments (0.17 ± 0.01), followed by the Guangxi mangrove sediments (0.16 ± 0.01), and the lowest in Bangladesh mangrove sediments (0.12 ± 0.01). Considering the three mangrove regions share similar latitudes and temperatures, the observed differences in brGDGTs composition might be influenced by factors other than temperature. Microbial community shifts could be a key driver since different microbes produce different membrane lipids including GDGTs. Environmental parameters such as salinity, as highlighted by Wang et al. [45], water content [15], and vegetation [46] cannot be ruled out. These factors, alongside microbial community dynamics, may collectively contribute to the GDGT profiles in mangrove sediments.
The MI index varied between 0.15 and 0.35 across the three mangrove regions, with a mean value of 0.20 ± 0.04 (n = 81). Results from ANOVA indicated significant statistical differences in MI values among the three mangrove areas (p < 0.01). The highest MI values were observed in the GX (0.28 ± 0.06), followed by BD (0.20 ± 0.02), while the HK exhibited the lowest value (0.16 ± 0.01). According to the survey of global marine sediments, the MI index primarily reflects the contribution of methanogenic archaea ANME-1 to GDGTs during anaerobic oxidation of methane and high MI values (ranging from 0.3 to 0.5) indicate high methane fluxes [12,13]. In our three mangrove regions, the low MI values suggest that methanogenic archaea are not the primary contributor to isoGDGTs. However, it is important to note that the MI index, developed based on marine sediments, may be biased when isoGDGTs are primarily derived from terrestrial inputs. Blaga et al. [34] studied sediments from 47 European lakes and found that when GDGT-0/Cren ratios exceed 2, methanogenic archaea significantly contributed to GDGT-0. In this study, the GDGT-0/Cren ratios for the three mangrove regions ranged from 0.34 to 2.38, with a mean value of 0.78 ± 0.61 (n = 81). However, the ANOVA analysis revealed significant statistical differences in GDGT-0/Cren among the three mangrove regions (p < 0.01), with the highest ratio in HK (1.99 ± 0.23), followed by GX (1.30 ± 0.38), and the lowest ratio observed in BD (0.46 ± 0.23). Notably, GDGT-0/Cren ratios exceeding 2 were observed in core HK1 at depths of 12.5 to 25 cm, indicating a substantial contribution from methanogenic archaea. Additionally, three cores, GX2, HK1, and BD2, exhibited the highest levels of GDGT-0/Cren and the MI (Figure 4g,h), suggesting enhanced activity of methanogenic archaea, likely due to the prevailing anoxic conditions in the deeper sediments of mangrove wetlands. Interestingly, the concentration of isoGDGTs decreased in the order of HK1, BD1/BD2, and GX1/GX2, which aligns with the TOC content in these cores (Figure 4a,b). This consistency implies that archaea rely on the degradation of organic matter in mangrove sediments. Given that mangrove sediments act as significant blue carbon sinks, they may facilitate active carbon cycling through the mediation of microbial communities. The in situ production of GDGTs may substantially alter the composition of these compounds, potentially leading to biases in GDGT-based proxies. However, our current analysis focused solely on core GDGTs, which are degraded products of intact lipid tetraethers that can be used as biomarkers for living archaea and certain bacteria in sedimentary environments [47,48]. The transformation from intact GDGTs to core GDGTs results in the loss of much biological and living biomass information. In future studies, we will investigate both intact and core GDGTs in mangrove sediments to better understand the microbial community and its contributions to carbon cycling. As such, core GDGTs may not fully reflect active microbial production, and this limitation should be considered when applying GDGT-based proxies.

4.3. GDGTs-Based Temperature and pH Indices in Mangrove Sediments

4.3.1. pH Reconstruction Based on CBT’

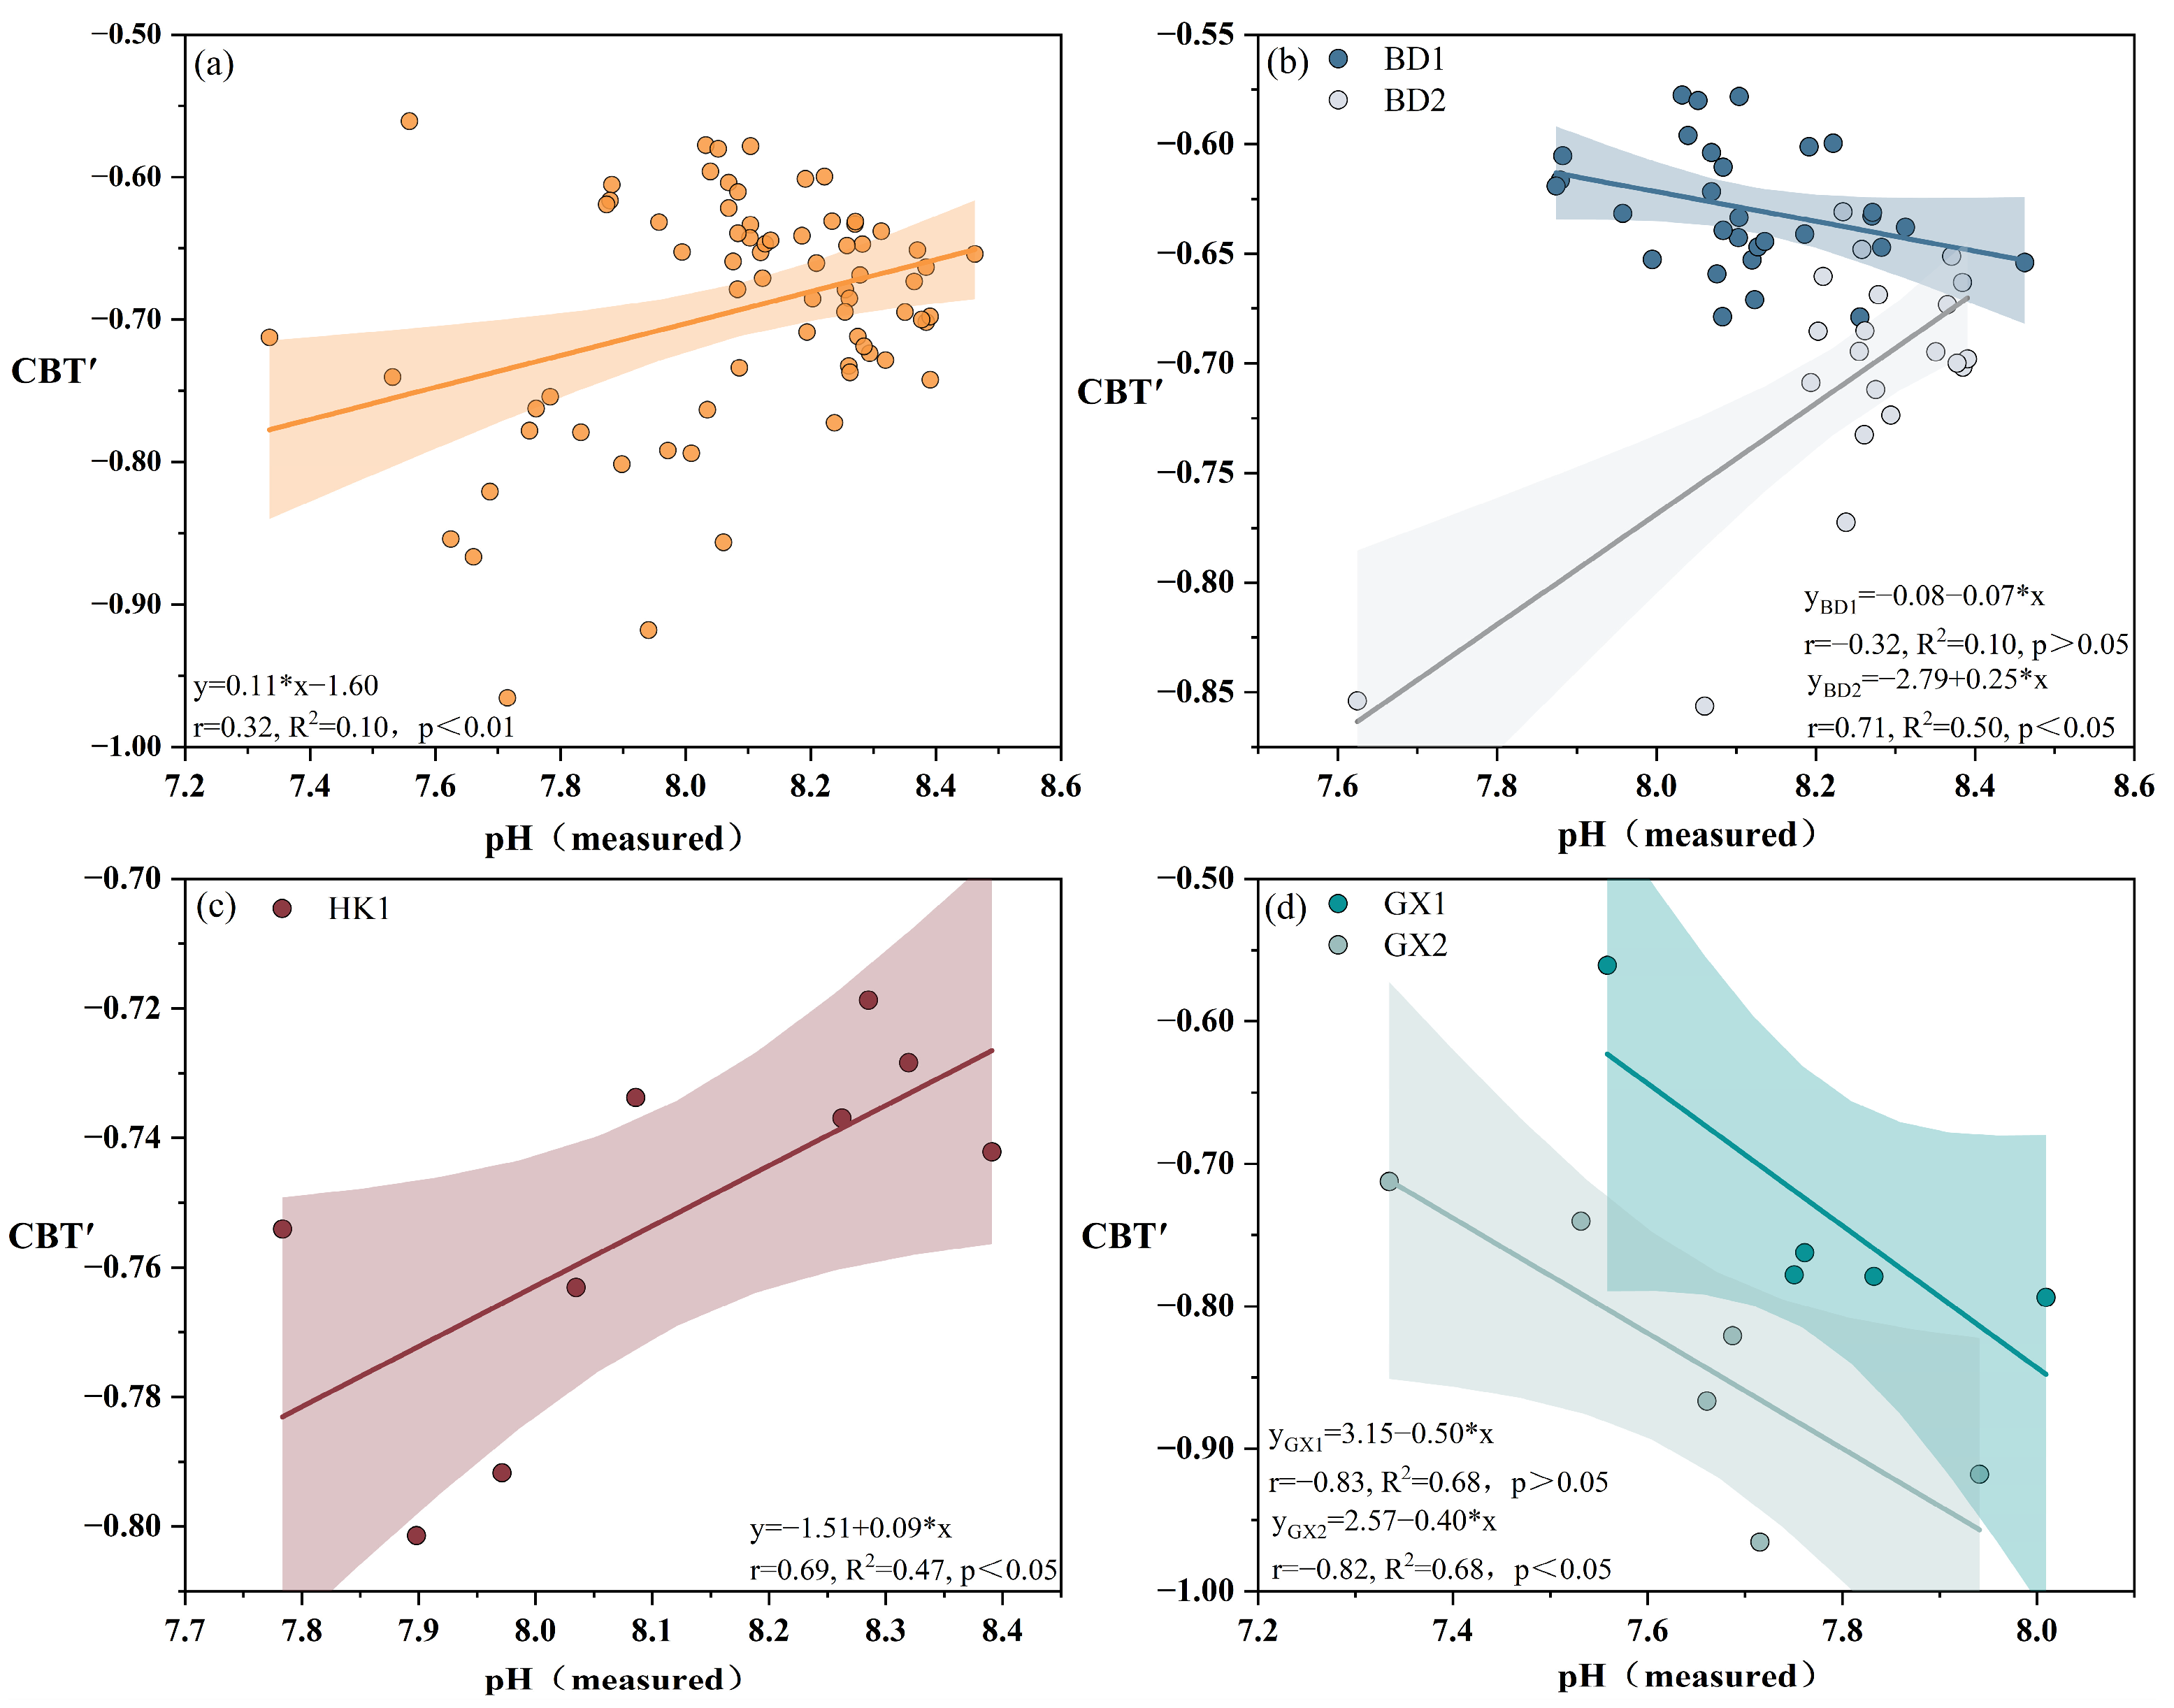
In all three mangrove regions, the reconstructed pH values based on global calibrations [33] were noticeably lower than the measured pH values, with differences ranging from 1.30 to 2.42. This discrepancy is notably higher than the root mean square error (RMSE: 0.52) of the global CBT’-pH calibration [33], suggesting that global calibration may not be applicable to the mangrove environments. A fitting analysis between the calculated CBT’-pH values and the measured pH values revealed a weak linear correlation (R2 = 0.10, p < 0.01; Figure 8a). This lack of correlation may be attributed to the relatively narrow range of soil pH variations (7.34 to 8.46) in this study, which is considerably smaller than that in the global soil pH ranges (pH: 3 to 10) [3,9]. Therefore, the minor pH variations in our studied mangrove sediments may not be sufficient to affect the composition of brGDGTs.
De Jonge et al. [33] demonstrated that the global CBT’-pH calibration may underestimate pH in arid soils due to the increase in the fractional abundances of brGDGT IIa’. Naafs et al. [49] demonstrated that CBT’ in peat is influenced by both pH and anaerobic conditions, with 6-methyl brGDGTs less abundant in water-saturated peats than in mineral soils. This reduction in 6-methyl brGDGTs in water-saturated (anoxic) peats weakens the pH signal captured by CBT’. Given these findings, mangrove wetlands where sediment conditions are influenced by tidal dynamics and variable salinity, the relationship between CBT’ and pH may be confounded by hydrological factors. Consequently, applying a global CBT’-pH calibration to such environments may yield unreliable results, necessitating region-specific calibrations that account for local environmental drivers.
Chen et al. [50] conducted laboratory culture studies using a brGDGT-producing bacterium (Candidatus Solibacter usitatus Ellin6076) and identified a strong positive correlation between pH and CBT5ME. This finding contrasts with the general relationship observed in the global soil database, which indicates a negative correlation [33]. Therefore, the relationship between CBT’ and pH may depend on the specific bacterial strain, and variations in microbial communities across different mangrove sites may diminish the reliability of brGDGTs-CBT’ as a pH index. Analyses of the CBT’-pH relationships in various mangrove regions revealed significant differences in correlation. The measured pH values for core BD1 and core GX1 did not show a significant correlation with CBT’ (p > 0.05; Figure 8b,d). In contrast, the measured pH values for another site in the Sundarbans (BD2) and core HK1 in Hong Kong exhibited a significant positive correlation with CBT’ (Figure 8b,c), align with the trends observed in global fitting curves [33]. However, for cores GX1 and GX2 in Guangxi, significant negative correlations were found between the measured pH values and CBT’, despite different slopes and intercepts (Figure 8d). The measured pH values for samples from GX2 were predominantly below 7.8, whereas those from BD1 and HK1 were generally above 7.8. Collectively, these regional differences may be attributed to the varying pH levels of mangrove sediments across different locations, resulting in distinct linear correlation relationships.

4.3.2. Temperature Based on MBT’5ME

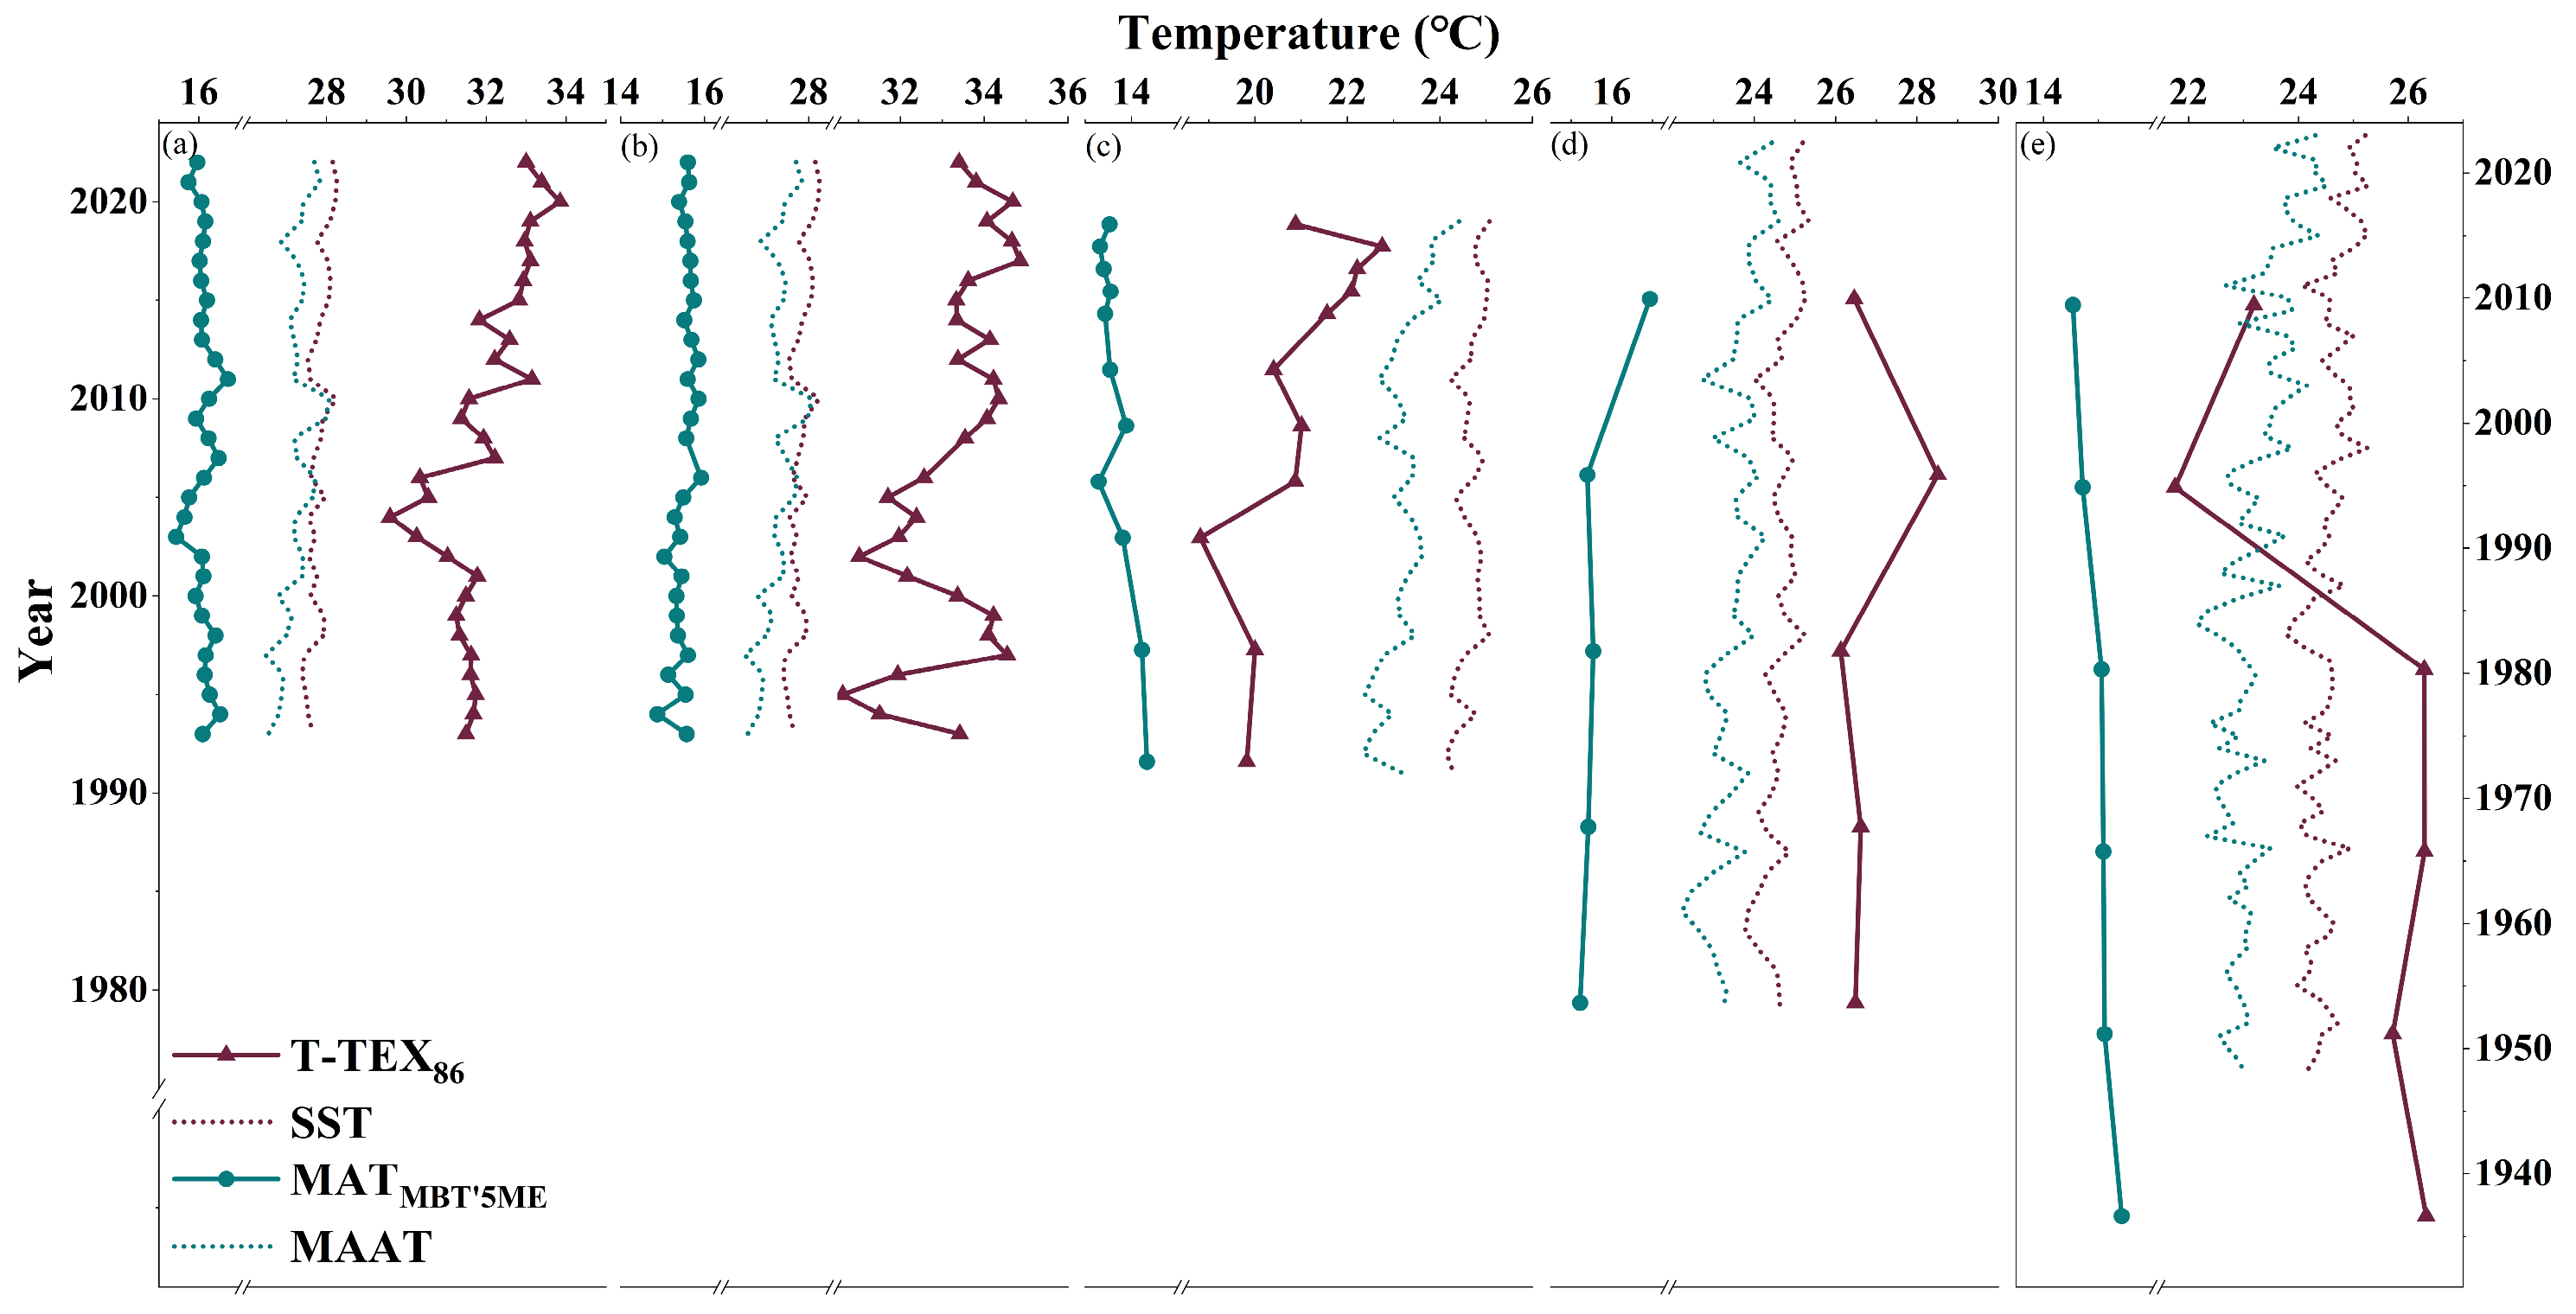
Due to the lack of direct dating data for each sediment core, we employed previously reported sedimentation rates specific to each region. The sedimentation rates were 1.03 cm·a−1 for the Nanliu River Estuary (near GX1) and 1.68 cm·a−1 for the Guangxi Maowei Sea (near GX2) [51,52], 0.88 cm·a−1 for the Shenzhen Futian Mangrove Wetland (near HK1) [53], and 1.0 cm·a−1 for the Sundarbans Mangrove in Bangladesh (BD1, BD2) [54]. Given that our sediment cores range in length from 25 to 90 cm, they represent a sedimentation history of approximately 30 to 90 years. As a result, the change in MAAT at each site is anticipated to be within a range of 2 °C, which is below the margin of error associated with the MBT’5ME–MAAT proxy (4.8 °C). Therefore, we have refrained from discussing specific trends in GDGT-based temperature variations and have instead concentrated on evaluating the relative error between the reconstructed temperatures and the instrumental temperatures for the contemporary period.
Weijers et al. [55] reported that when the BIT index exceeds 0.4, the TEX86 proxy becomes unsuitable for reconstructing SST. In this study, all samples from the investigation area exhibited BIT values greater than 0.8, indicating that TEX86 is not applicable in coastal mangrove wetlands. The discrepancies between TEX86-reconstructed temperatures and mean annual SST ranged from 1 to 5 °C (4 ± 2 °C) (Figure 9). This standard deviation is notably higher than that observed in the global calibration of the TEX86-SST relationship, which is 1.7 °C [32]. In contrast, the reconstructed temperature (MAAT) using the MBT’5ME proxy was substantially lower than the instrumental records by 7 to 12 °C (10 ± 2 °C) (Figure 9), which also exceeds the global calibration for the MBT’5ME-MAAT relationship (4.8 °C) [33]. Since the three mangrove wetlands are all situated in tropical regions, the seasonal variation in the brGDGTs signal appears to be negligible. These systematic overestimates or underestimates indicate that the application of global calibrations is not appropriate for the mangrove wetlands under investigation.
Tidal fluctuations in mangrove wetlands create cyclical oxygen variations [56,57]. These oxygen shifts may influence Thaumarchaeota GDGT composition, as demonstrated by pure culture experiments showing increased GDGT-2 and -3 under low oxygen [58]. Spatial heterogeneity in oxygen levels [57] likely contributes to regional differences in GDGTs distributions. Such oxygen-driven biases could explain discrepancies between TEX86-SST and SST in mangrove wetlands. Further validation using paired oxygen and TEX86 measurements in modern mangrove systems would help constrain the magnitude of this effect, improving the reliability of TEX86 as a proxy in these dynamic coastal settings.
Culture experiments with Solibacter usitatus Ellin6076 [50,59] demonstrate that temperature strongly controls brGDGT methylation, aligning with global soil calibrations. Molecular dynamics simulations by Naafs et al. [60] reveal that increased methylation reduces membrane rigidity, supporting homeoviscous adaptation as the underlying mechanism. However, our DNA analysis revealed that strain Ellin6076 was not present in the three studied mangrove wetlands, at least as a major species (comprising less than 0.5%). Therefore, it is likely that different bacterial species responsible for producing brGDGTs may exhibit varying responses to temperature fluctuations.

4.4. Effect of Bacterial Community on brGDGTs in Mangrove Sediments

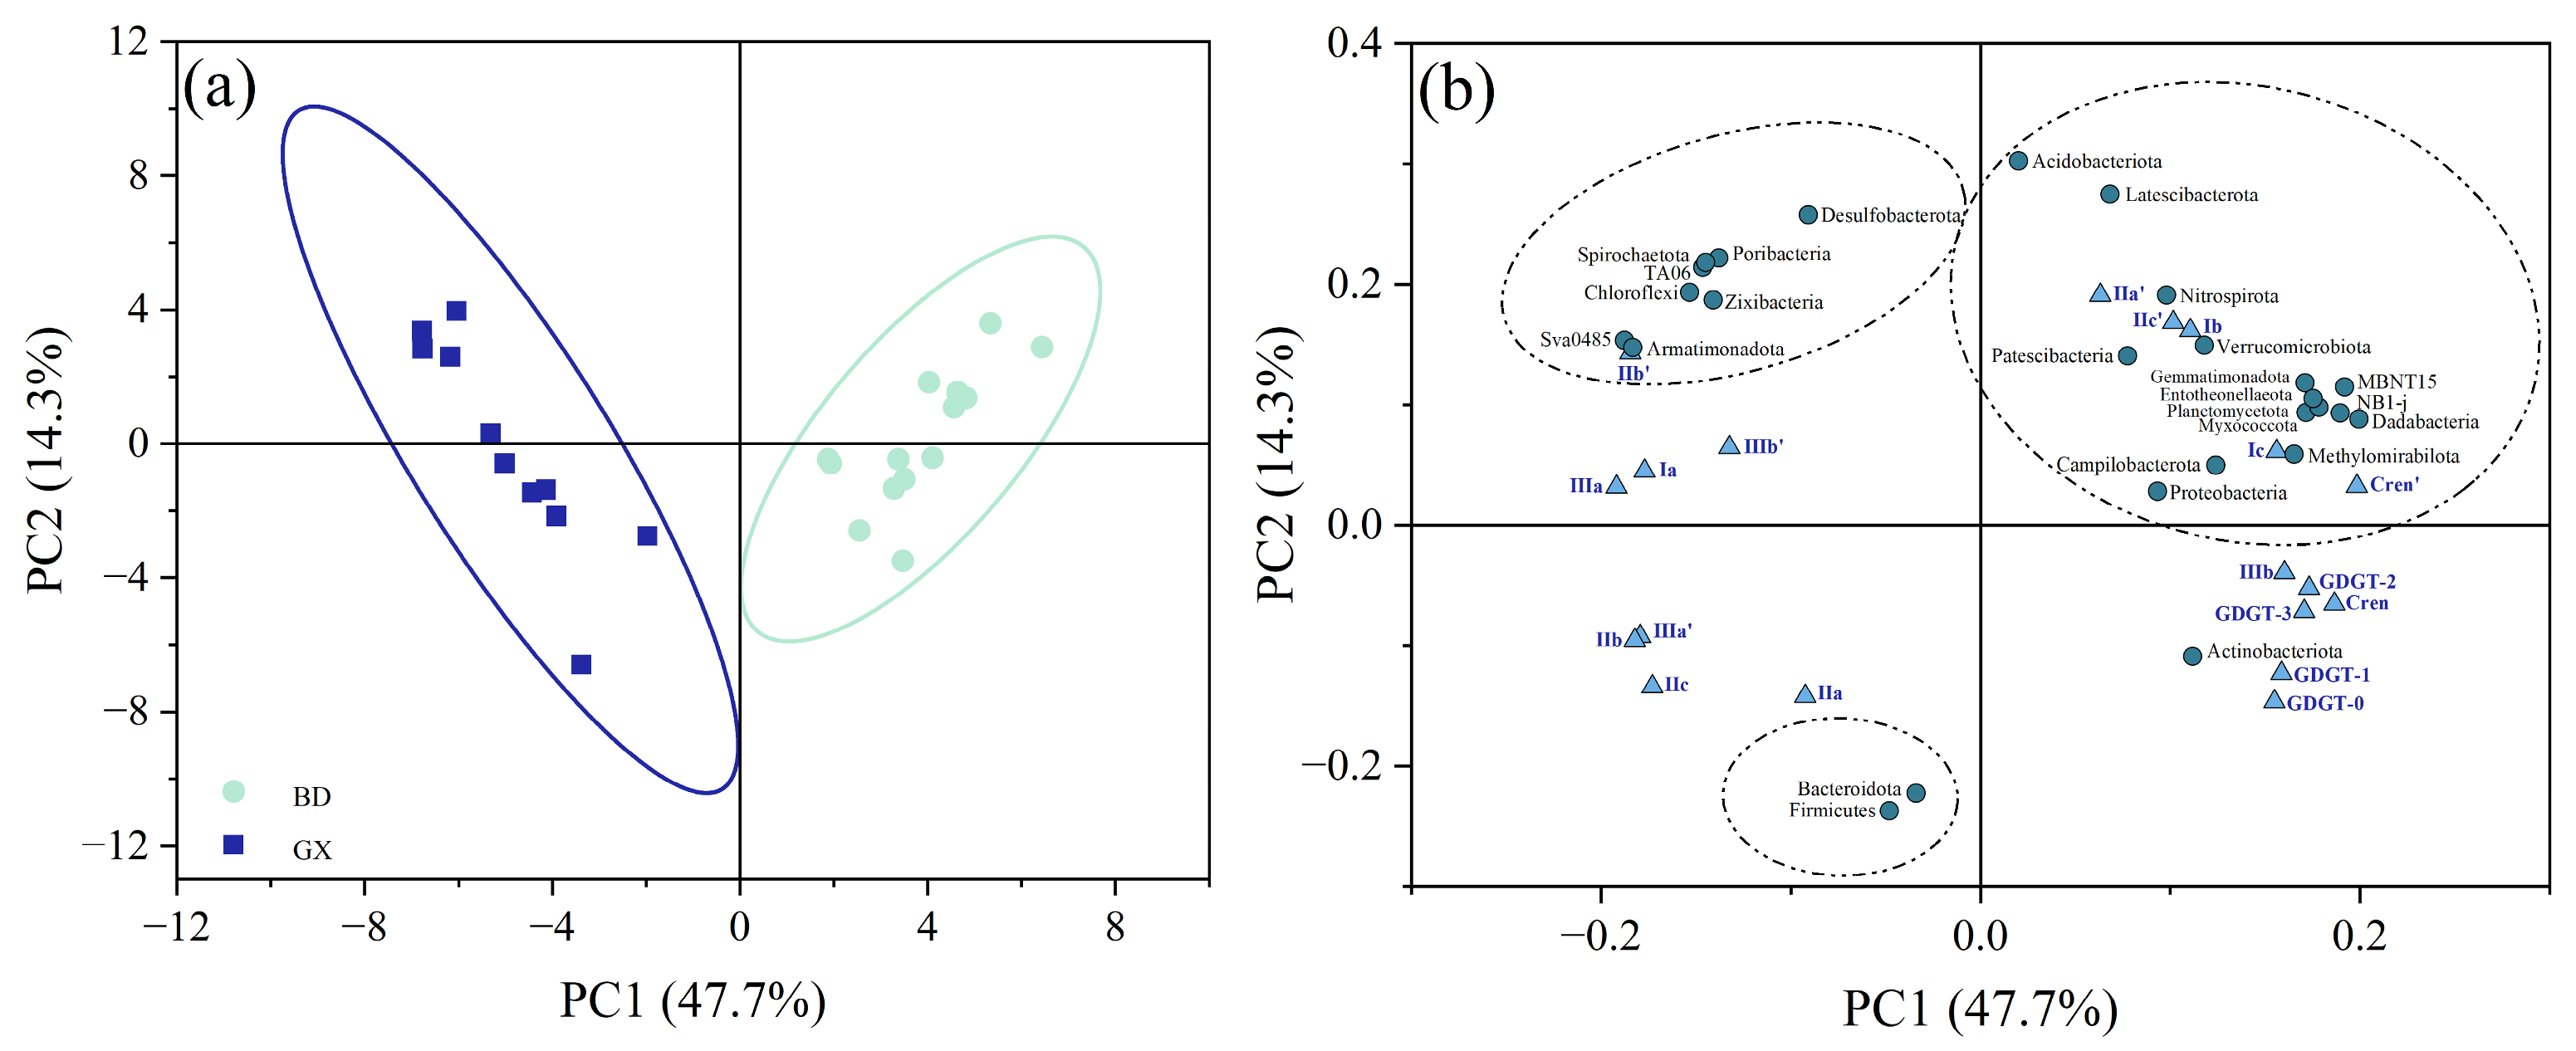
Principal Component Analysis (PCA) was performed using bacterial DNA data from cores BD and GX. The first two principal components (PC1 and PC2) accounted for 47.7% and 14.3% of the total variance, respectively. The results clearly distinguished sediment samples into two groups: core BD samples exhibited positive loadings on PC1, while core GX samples showed negative loadings on PC1 (Figure 10a), indicating a systematic difference in bacterial community composition between the two cores. Additionally, bacterial phyla were categorized into three distinct groups (Figure 10b). Group 1, characterized by positive loadings on both PC1 and PC2, included Proteobacteria, Acidobacteriota, Campilobacterota, Latescibacterta, Nitrospirota, Verrucomicrobiota, Patescibacteria, Gemmatimonadota, Entotheonellaeota, Planctomycetota, Myxococcota, Dadabacteria, Methylomirabilota, MBNT15, and NB1-j. Group 2, which exhibited positive loading on PC2 and negative loading on PC1, comprised Desulfobacterota, Chloroflexi, Poribacteria, Spirochaetota, Zixibacteria, Armatimonadota, TA06 and SV0485. Group 3, characterized by negative loadings on both PC1 and PC2, included Firmicutes and Bacteroidota. The observed separations in the PCA suggest differential controls on bacterial phyla. Furthermore, bacterial phyla in Group 1 are more closely associated with those brGDGTs containing 6-methyl groups (i.e., IIa’, IIc’) and two cyclopentane moieties (i.e., Ic), whereas those in Group 2 are more related to brGDGTs with 0 or 1 cyclopentane moiety (i.e., Ia, IIIa, IIb’ and IIIb’); bacterial phyla in Group 3 correlate more with pentamethylated and hexamethylated brGDGTs without cyclopentane moieties (e.g., IIa and IIIa’). These differences imply that the composition of brGDGTs is dependent on bacterial strains in addition to environmental factors such as temperature and pH.
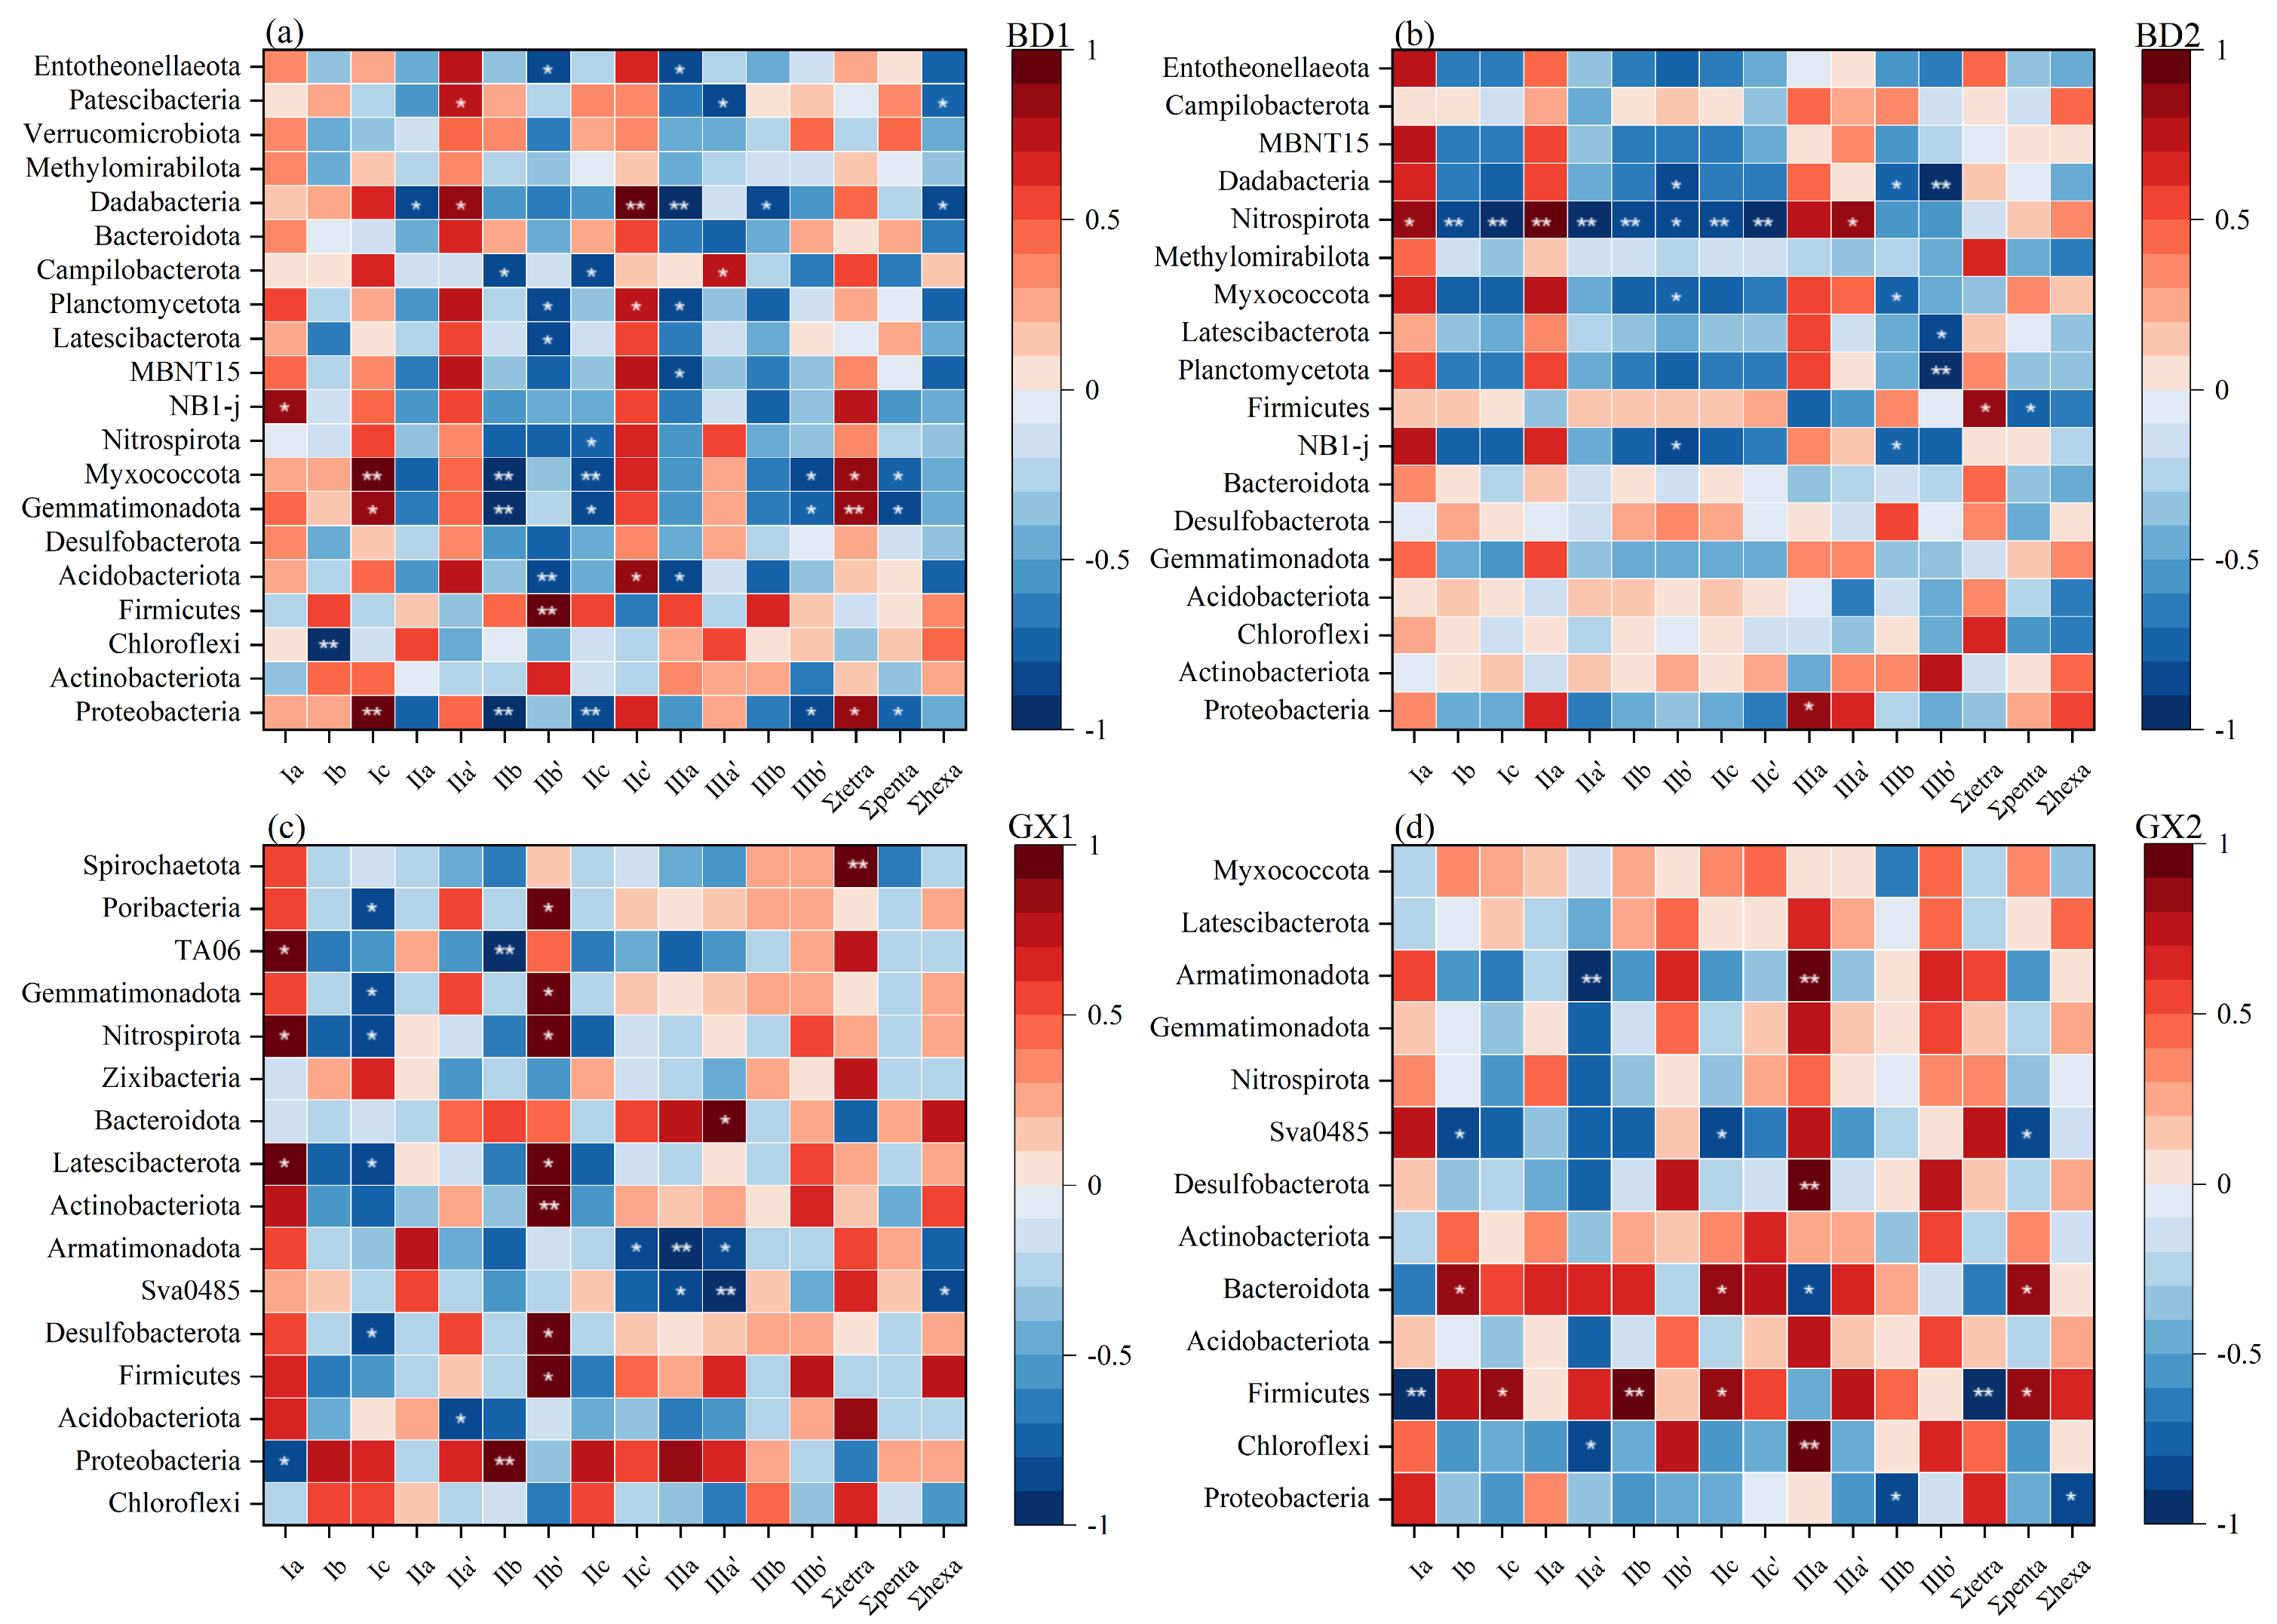
The heatmap analysis illustrates the correlation coefficients between the abundance fractions of brGDGTs and bacterial phyla across different core sites, visualizing the variation in their correlation strengths (Figure 11). For instance, significant correlations were observed between brGDGTs Ic, IIb, and IIc with Proteobacteria, Gemmatimonadota, and Myxococcota in core BD1; however, these correlations were absent in cores BD2, GX1, and GX2 (Figure 11a–d). Conversely, Nitrospirota exhibited significant correlations with brGDGTs Ib, Ic, IIa, IIa’, IIb, and IIc in core BD2, which were not detected in cores BD1, GX1, and GX2. Notably, core GX2 displayed a unique pattern, as Firmicutes showed significant correlations with brGDGTs Ia and IIb. Acidobacteria have been proposed as a potential source of brGDGTs, as certain subdivisions produce 5- and 6-methyl derivatives of iso-diabolic acid, a key structural precursor of brGDGTs, with methyl positions matching those of 5- and 6-methyl brGDGTs in environmental samples [61,62]. However, despite the detection of Acidobacteria, their abundance is relatively low (0.02~12.23%, 7.18 ± 3.05%), which may be attributed to the high pH levels observed in our sediments (ranging from 7.34 to 8.46). Moreover, the relative abundance of Acidobacteria did not consistently correlate with the levels of brGDGTs; however, positive correlations were observed with IIIa and IIb’ in core BD1 (Figure 11a) and IIa’ in core GX1 (Figure 11c). Our findings are consistent with previous research conducted in grassland soils along an aridity gradient in Inner Mongolia, where Acidobacteria abundances also exhibited no significant relationships with brGDGTs, pH, or aridity [63]. These findings indicate that the biosynthesis of brGDGTs in various environments is complex and influenced by both the source organisms and external environmental conditions.

5. Conclusions

We examined GDGTs in five sediment cores from three Asian mangrove wetlands, based on which three conclusions were obtained.
(1) High BIT values (>0.8), low IIIa/IIa ratios (<0.19), and the predominance of tetramethylated brGDGTs (>70%) indicate that the sedimentary organic carbon in three Asian mangrove wetlands is primarily derived from terrestrial sources.
(2) Two methane indices, MI and GDGT-0/Cren, exhibit distinct levels in upper and deeper sediments across three cores (GX2, HK1, and BD2), suggesting enhanced activity of methanogenic archaea in the deeper sediments of these mangrove wetlands, likely as a result of variable redox conditions between upper and deeper sediments. This in situ microbial activity may accelerate organic carbon cycling, thereby diminishing the carbon sink capacity of the mangrove wetlands and introducing bias in GDGT-based proxies, such as the MBT/CBT indices.
(3) The dominant bacterial phyla in the mangrove wetlands of Bangladesh and Guangxi exhibit similarities; however, there is a varying degree of correlation between the bacterial communities and brGDGTs at different sampling sites. This finding suggests significant spatial heterogeneity between bacterial communities and GDGTs, which have different responses to environmental parameters. Future studies will focus on investigating both intact and core GDGTs in mangrove sediments to assess the contribution of in situ microbial carbon and its influence on the composition of GDGTs.

Author Contributions

Conceptualization, Y.W. and Y.X.; methodology, Q.L. and Y.W.; software, Q.L.; validation, Y.W. and Y.X.; investigation, Q.L.; resources, Y.X., X.L., J.Z., M.A.B. and S.S.; writing—original draft preparation, Q.L. and Y.W.; writing—review and editing, Y.X., X.L., J.Z., M.A.B. and S.S.; supervision, Y.W. and Y.X.; project administration, Y.W.; funding acquisition, Y.X. All authors have read and agreed to the published version of the manuscript.

Funding

This research was funded by the Shanghai Science and Technology Commission (23230760300), and the National Natural Science Foundation of China (41676058).

Data Availability Statement

The data that support this study’s findings are available upon request from the corresponding author.

Conflicts of Interest

The authors declare no conflicts of interest. The funders had no role in the design of the study; in the collection, analyses, or interpretation of data; in the writing of the manuscript; or in the decision to publish the results.

References

  1. Schouten, S.; Hopmans, E.C.; Sinninghe Damsté, J.S. The organic geochemistry of glycerol dialkyl glycerol tetraether lipids: A review. Org. Geochem. 2013, 54, 19–61. [Google Scholar] [CrossRef]
  2. Lloyd, C.T.; Iwig, D.F.; Wang, B.; Cossu, M.; Metcalf, W.W.; Boal, A.K.; Booker, S.J. Discovery, structure and mechanism of a tetraether lipid synthase. Nature 2022, 609, 197–203. [Google Scholar] [CrossRef] [PubMed]
  3. Weijers, J.W.H.; Schouten, S.; van den Donker, J.C.; Hopmans, E.C.; Sinninghe Damsté, J.S. Environmental controls on bacterial tetraether membrane lipid distribution in soils. Geochim. Cosmochim. Acta 2007, 71, 703–713. [Google Scholar] [CrossRef]
  4. Kim, J.-H.; van der Meer, J.; Schouten, S.; Helmke, P.; Willmott, V.; Sangiorgi, F.; Koç, N.; Hopmans, E.C.; Sinninghe Damsté, J.S. New indices and calibrations derived from the distribution of crenarchaeal isoprenoid tetraether lipids: Implications for past sea surface temperature reconstructions. Geochim. Cosmochim. Acta 2010, 74, 4639–4654. [Google Scholar] [CrossRef]
  5. Boyd, E.S.; Pearson, A.; Pi, Y.; Li, W.-J.; Zhang, Y.G.; He, L.; Zhang, C.L.; Geesey, G.G. Temperature and pH controls on glycerol dibiphytanyl glycerol tetraether lipid composition in the hyperthermophilic crenarchaeon Acidilobus sulfurireducens. Extremophiles 2011, 15, 59–65. [Google Scholar] [CrossRef]
  6. De Jonge, C.; Guo, J.; Hällberg, P.; Griepentrog, M.; Rifai, H.; Richter, A.; Ramirez, E.; Zhang, X.; Smittenberg, R.H.; Peterse, F.; et al. The impact of soil chemistry, moisture and temperature on branched and isoprenoid GDGTs in soils: A study using six globally distributed elevation transects. Org. Geochem. 2024, 187, 104706. [Google Scholar] [CrossRef]
  7. Lattaud, J.; Gondwe, M.J.; Griepentrog, M.; Helfter, C.; De Jonge, C. Soil chemistry effect on GDGT abundances and their proxies in soils of the Okavango Delta. Org. Geochem. 2024, 195, 104847. [Google Scholar] [CrossRef]
  8. Schouten, S.; Hopmans, E.C.; Schefuß, E.; Sinninghe Damsté, J.S. Distributional variations in marine crenarchaeotal membrane lipids: A new tool for reconstructing ancient sea water temperatures? Earth Planet. Sci. Lett. 2002, 204, 265–274. [Google Scholar] [CrossRef]
  9. Peterse, F.; van der Meer, J.; Schouten, S.; Weijers, J.W.H.; Fierer, N.; Jackson, R.B.; Kim, J.-H.; Sinninghe Damsté, J.S. Revised calibration of the MBT–CBT paleotemperature proxy based on branched tetraether membrane lipids in surface soils. Geochim. Cosmochim. Acta 2012, 96, 215–229. [Google Scholar] [CrossRef]
  10. Hopmans, E.C.; Weijers, J.W.H.; Schefuß, E.; Herfort, L.; Sinninghe Damsté, J.S.; Schouten, S. A novel proxy for terrestrial organic matter in sediments based on branched and isoprenoid tetraether lipids. Earth Planet. Sci. Lett. 2004, 224, 107–116. [Google Scholar] [CrossRef]
  11. Xiao, W.; Wang, Y.; Zhou, S.; Hu, L.; Yang, H.; Xu, Y. Ubiquitous production of branched glycerol dialkyl glycerol tetraethers (brGDGTs) in global marine environments: A new source indicator for brGDGTs. Biogeosciences 2016, 13, 5883–5894. [Google Scholar] [CrossRef]
  12. Zhang, Y.G.; Zhang, C.L.; Liu, X.-L.; Li, L.; Hinrichs, K.-U.; Noakes, J.E. Methane Index: A tetraether archaeal lipid biomarker indicator for detecting the instability of marine gas hydrates. Earth Planet. Sci. Lett. 2011, 307, 525–534. [Google Scholar] [CrossRef]
  13. Kim, B.; Zhang, Y.G. Methane Index: Towards a quantitative archaeal lipid biomarker proxy for reconstructing marine sedimentary methane fluxes. Geochim. Cosmochim. Acta 2023, 354, 74–87. [Google Scholar] [CrossRef]
  14. Yang, H.; Pancost, R.D.; Dang, X.; Zhou, X.; Evershed, R.P.; Xiao, G.; Tang, C.; Gao, L.; Guo, Z.; Xie, S. Correlations between microbial tetraether lipids and environmental variables in Chinese soils: Optimizing the paleo-reconstructions in semi-arid and arid regions. Geochim. Cosmochim. Acta 2014, 126, 49–69. [Google Scholar] [CrossRef]
  15. Dang, X.; Yang, H.; Naafs, B.D.A.; Pancost, R.D.; Xie, S. Evidence of moisture control on the methylation of branched glycerol dialkyl glycerol tetraethers in semi-arid and arid soils. Geochim. Cosmochim. Acta 2016, 189, 24–36. [Google Scholar] [CrossRef]
  16. Zell, C.; Kim, J.-H.; Hollander, D.; Lorenzoni, L.; Baker, P.; Silva, C.G.; Nittrouer, C.; Sinninghe Damsté, J.S. Sources and distributions of branched and isoprenoid tetraether lipids on the Amazon shelf and fan: Implications for the use of GDGT-based proxies in marine sediments. Geochim. Cosmochim. Acta 2014, 139, 293–312. [Google Scholar] [CrossRef]
  17. Umoh, U.U.; Li, L.; Wang, J.; Kauluma, N.; Asuquo, F.E.; Akpan, E.R. Glycerol dialkyl glycerol tetraether signatures in tropical mesotidal estuary sediments of Qua Iboe River, Gulf of Guinea. Org. Geochem. 2022, 170, 104461. [Google Scholar] [CrossRef]
  18. Baxter, A.J.; van Bree, L.G.J.; Peterse, F.; Hopmans, E.C.; Villanueva, L.; Verschuren, D.; Sinninghe Damsté, J.S. Seasonal and multi-annual variation in the abundance of isoprenoid GDGT membrane lipids and their producers in the water column of a meromictic equatorial crater lake (Lake Chala, East Africa). Quat. Sci. Rev. 2021, 273, 107263. [Google Scholar] [CrossRef]
  19. Tierney, J.E.; Russell, J.M. Distributions of branched GDGTs in a tropical lake system: Implications for lacustrine application of the MBT/CBT paleoproxy. Org. Geochem. 2009, 40, 1032–1036. [Google Scholar] [CrossRef]
  20. Powers, L.; Werne, J.P.; Vanderwoude, A.J.; Sinninghe Damsté, J.S.; Hopmans, E.C.; Schouten, S. Applicability and calibration of the TEX86 paleothermometer in lakes. Org. Geochem. 2010, 41, 404–413. [Google Scholar] [CrossRef]
  21. Zheng, Y.; Pancost, R.D.; Naafs, B.D.A.; Li, Q.; Liu, Z.; Yang, H. Transition from a warm and dry to a cold and wet climate in NE China across the Holocene. Earth Planet. Sci. Lett. 2018, 493, 36–46. [Google Scholar] [CrossRef]
  22. Baker, A.; Blyth, A.J.; Jex, C.N.; McDonald, J.A.; Woltering, M.; Khan, S.J. Glycerol dialkyl glycerol tetraethers (GDGT) distributions from soil to cave: Refining the speleothem paleothermometer. Org. Geochem. 2019, 136, 103890. [Google Scholar] [CrossRef]
  23. Zech, R.; Gao, L.; Tarozo, R.; Huang, Y. Branched glycerol dialkyl glycerol tetraethers in Pleistocene loess-paleosol sequences: Three case studies. Org. Geochem. 2012, 53, 38–44. [Google Scholar] [CrossRef]
  24. Pan, A.; Yang, Q.; Zhou, H.; Ji, F.; Wang, H.; Pancost, R.D. A diagnostic GDGT signature for the impact of hydrothermal activity on surface deposits at the Southwest Indian Ridge. Org. Geochem. 2016, 99, 90–101. [Google Scholar] [CrossRef]
  25. Zhang, T.; He, W.; Liang, Q.; Zheng, F.; Xiao, X.; Zeng, Z.; Zhou, J.; Yao, W.; Chen, H.; Zhu, Y.; et al. Lipidomic diversity and proxy implications of archaea from cold seep sediments of the South China Sea. Front. Microbiol. 2023, 14, 1241958. [Google Scholar] [CrossRef]
  26. Barbier, E.B.; Hacker, S.D.; Kennedy, C.; Koch, E.W.; Stier, A.C.; Silliman, B.R. The value of estuarine and coastal ecosystem services. Ecol. Monogr. 2011, 81, 169–193. [Google Scholar] [CrossRef]
  27. Donato, D.C.; Kauffman, J.B.; Murdiyarso, D.; Kurnianto, S.; Stidham, M.; Kanninen, M. Mangroves among the most carbon-rich forests in the tropics. Nat. Geosci. 2011, 4, 293–297. [Google Scholar] [CrossRef]
  28. Saravanakumar, K.; Kathiresan, K.; MubarakAli, D.; Kayalvizhi, K.; Rajendran, N.; Hemalatha, S.; Chen, J. Soil-microbial communities indexing from mangroves rhizosphere and barren sandy habitats. Physiol. Mol. Plant Pathol. 2018, 104, 58–68. [Google Scholar] [CrossRef]
  29. Wei, P.; Lei, A.; Zhou, H.; Hu, Z.; Wong, Y.; Tam, N.F.Y.; Lu, Q. Comparison of microbial community structure and function in sediment between natural regenerated and original mangrove forests in a National Nature Mangrove Reserve, South China. Mar. Pollut. Bull. 2021, 163, 111955. [Google Scholar] [CrossRef] [PubMed]
  30. Yang, X.; Dai, Z.; Yuan, R.; Guo, Z.; Xi, H.; He, Z.; Wei, M. Effects of Salinity on Assembly Characteristics and Function of Microbial Communities in the Phyllosphere and Rhizosphere of Salt-Tolerant Avicennia marina Mangrove Species. Microbiol. Spectr. 2023, 11, e03000-22. [Google Scholar] [CrossRef]
  31. Huguet, C.; Hopmans, E.C.; Febo-Ayala, W.; Thompson, D.H.; Sinninghe Damsté, J.S.; Schouten, S. An improved method to determine the absolute abundance of glycerol dibiphytanyl glycerol tetraether lipids. Org. Geochem. 2006, 37, 1036–1041. [Google Scholar] [CrossRef]
  32. Kim, J.-H.; Schouten, S.; Hopmans, E.C.; Donner, B.; Sinninghe Damsté, J.S. Global sediment core-top calibration of the TEX86 paleothermometer in the ocean. Geochim. Cosmochim. Acta 2008, 72, 1154–1173. [Google Scholar] [CrossRef]
  33. De Jonge, C.; Hopmans, E.C.; Zell, C.I.; Kim, J.-H.; Schouten, S.; Sinninghe Damsté, J.S. Occurrence and abundance of 6-methyl branched glycerol dialkyl glycerol tetraethers in soils: Implications for palaeoclimate reconstruction. Geochim. Cosmochim. Acta 2014, 141, 97–112. [Google Scholar] [CrossRef]
  34. Blaga, C.I.; Reichart, G.-J.; Heiri, O.; Sinninghe Damsté, J.S. Tetraether membrane lipid distributions in water-column particulate matter and sediments: A study of 47 European lakes along a north–south transect. J. Paleolimnol. 2008, 41, 523–540. [Google Scholar] [CrossRef]
  35. Dai, T.; Wen, D.; Bates, C.T.; Wu, L.; Guo, X.; Liu, S.; Su, Y.; Lei, J.; Zhou, J.; Yang, Y. Nutrient supply controls the linkage between species abundance and ecological interactions in marine bacterial communities. Nat. Commun. 2022, 13, 175. [Google Scholar] [CrossRef]
  36. Chen, S.; Zhou, Y.; Chen, Y.; Gu, J. fastp: An ultra-fast all-in-one FASTQ preprocessor. Bioinformatics 2018, 34, i884–i890. [Google Scholar] [CrossRef]
  37. STACKEBRANDT, E.; GOEBEL, B.M. Taxonomic Note: A Place for DNA-DNA Reassociation and 16S rRNA Sequence Analysis in the Present Species Definition in Bacteriology. Int. J. Syst. Evol. 1994, 44, 846–849. [Google Scholar] [CrossRef]
  38. Edgar, R.C. UPARSE: Highly accurate OTU sequences from microbial amplicon reads. Nat. Methods 2013, 10, 996–998. [Google Scholar] [CrossRef] [PubMed]
  39. Lü, X.; Liu, X.; Xu, C.; Song, J.; Li, X.; Yuan, H.; Li, N.; Wang, D.; Yuan, H.; Ye, S. The origins and implications of glycerol ether lipids in China coastal wetland sediments. Sci. Rep. 2019, 9, 18529. [Google Scholar] [CrossRef]
  40. Xiao, W.; Wang, Y.; Liu, Y.; Zhang, X.; Shi, L.; Xu, Y. Predominance of hexamethylated 6-methyl branched glycerol dialkyl glycerol tetraethers in the Mariana Trench: Source and environmental implication. Biogeosciences 2020, 17, 2135–2148. [Google Scholar] [CrossRef]
  41. Liu, Y.; Xiao, W.; Wu, J.; Han, L.; Zhang, H.; Xu, Y. Source, composition, and distributional pattern of branched tetraethers in sediments of northern Chinese marginal seas. Org. Geochem. 2021, 157, 104244. [Google Scholar] [CrossRef]
  42. Raberg, J.H.; Miller, G.H.; Geirsdóttir, Á.; Sepúlveda, J. Near-universal trends in brGDGT lipid distributions in nature. Am. Assoc. Adv. Sci. 2022, 8, eabm7625. [Google Scholar] [CrossRef]
  43. Hällberg, P.L.; Schenk, F.; Jarne-Bueno, G.; Schankat, Y.; Zhang, Q.; Rifai, H.; Phua, M.; Smittenberg, R.H. Branched GDGT source shift identification allows improved reconstruction of an 8,000-year warming trend on Sumatra. Org. Geochem. 2023, 186, 104702. [Google Scholar] [CrossRef]
  44. Mei, X.; Wang, Z.; Xiong, W.; Zhang, Y.; Dou, Y.; Huang, L.; Mi, B.; Wang, Z.; Cong, J. Glycerol dialkyl glycerol tetraethers in surficial marine sediments across shelf-to-basin depth transects in the East China Sea: Their sources and potential as sea water temperature proxies. Palaeogeogr. Palaeoclimatol. Palaeoecol. 2024, 636, 111992. [Google Scholar] [CrossRef]
  45. Wang, H.; Liu, W.; He, Y.; Zhou, A.; Zhao, H.; Liu, H.; Cao, Y.; Hu, J.; Meng, B.; Jiang, J.; et al. Salinity-controlled isomerization of lacustrine brGDGTs impacts the associated MBT5ME’ terrestrial temperature index. Geochim. Cosmochim. Acta 2021, 305, 33–48. [Google Scholar] [CrossRef]
  46. Davtian, N.; Ménot, G.; Bard, E.; Poulenard, J.; Podwojewski, P. Consideration of soil types for the calibration of molecular proxies for soil pH and temperature using global soil datasets and Vietnamese soil profiles. Org. Geochem. 2016, 101, 140–153. [Google Scholar] [CrossRef]
  47. Lipp, J.S.; Morono, Y.; Inagaki, F.; Hinrichs, K.-U. Significant contribution of Archaea to extant biomass in marine subsurface sediments. Nature 2008, 454, 991–994. [Google Scholar] [CrossRef]
  48. Rossel, P.E.; Elvert, M.; Ramette, A.; Boetius, A.; Hinrichs, K.-U. Factors controlling the distribution of anaerobic methanotrophic communities in marine environments: Evidence from intact polar membrane lipids. Geochim. Cosmochim. Acta 2011, 75, 164–184. [Google Scholar] [CrossRef]
  49. Naafs, B.D.A.; Inglis, G.N.; Zheng, Y.; Amesbury, M.J.; Biester, H.; Bindler, R.; Blewett, J.; Burrows, M.A.; del Castillo Torres, D.; Chambers, F.M.; et al. Introducing global peat-specific temperature and pH calibrations based on brGDGT bacterial lipids. Geochim. Cosmochim. Acta 2017, 208, 285–301. [Google Scholar] [CrossRef]
  50. Chen, Y.; Zheng, F.; Yang, H.; Yang, W.; Wu, R.; Liu, X.; Liang, H.; Chen, H.; Pei, H.; Zhang, C.; et al. The production of diverse brGDGTs by an Acidobacterium providing a physiological basis for paleoclimate proxies. Geochim. Cosmochim. Acta 2022, 337, 155–165. [Google Scholar] [CrossRef]
  51. Li, Z.; Zhang, W.; Li, J.; Meng, X.; Liu, L.; Li, C. Pollen Assemblage and sedimentary environment evolution in the coastal zone in Qinzhou Bay, Guangxi Province. Quat. Res. 2010, 30, 598–608, (In Chinese with English Abstract). [Google Scholar] [CrossRef]
  52. Liu, T.; Liu, Y.; Yue, Y. Response of mangrove swamp sedimentation rate to climate change. J. Trop. Oceanogr. 2017, 36, 40–47. [Google Scholar] [CrossRef]
  53. Lei, Y.; Yan, H.; Zhong, C.; Feng, P.; Jiang, S. Regime shift recorded by sediments from the Futian mangrove ecosystem in the Shenzhen Bay. Acta Ecol. Sin. 2020, 40, 8539–8548. [Google Scholar] [CrossRef]
  54. Rogers, K.G.; Goodbred, S.L.; Mondal, D.R. Monsoon sedimentation on the ‘abandoned’ tide-influenced Ganges—Brahmaputra delta plain. Estuar. Coast. Shelf Sci. 2013, 131, 297–309. [Google Scholar] [CrossRef]
  55. Weijers, J.W.H.; Schouten, S.; Spaargaren, O.C.; Sinninghe Damsté, J.S. Occurrence and distribution of tetraether membrane lipids in soils: Implications for the use of the TEX86 proxy and the BIT index. Org. Geochem. 2006, 37, 1680–1693. [Google Scholar] [CrossRef]
  56. Knight, J.M.; Griffin, L.; Dale, P.E.R.; Sheaves, M. Short-term dissolved oxygen patterns in sub-tropical mangroves. Estuar. Coast. Shelf Sci. 2013, 131, 290–296. [Google Scholar] [CrossRef]
  57. Mattone, C.; Sheaves, M. Patterns, drivers and implications of dissolved oxygen dynamics in tropical mangrove forests. Estuar. Coast. Shelf Sci. 2017, 197, 205–213. [Google Scholar] [CrossRef]
  58. Qin, W.; Carlson, L.T.; Armbrust, E.V.; Devol, A.H.; Moffett, J.W.; Stahl, D.A.; Ingalls, A.E. Confounding effects of oxygen and temperature on the TEX86 signature of marine Thaumarchaeota. Proc. Natl. Acad. Sci. USA 2015, 112, 10979–10984. [Google Scholar] [CrossRef]
  59. Halamka, T.A.; Raberg, J.H.; McFarlin, J.M.; Younkin, A.D.; Mulligan, C.; Liu, X.L.; Kopf, S.H. Production of diverse brGDGTs by Acidobacterium Solibacter usitatus in response to temperature, pH, and O2 provides a culturing perspective on brGDGT proxies and biosynthesis. Geobiology 2023, 21, 102–118. [Google Scholar] [CrossRef]
  60. Naafs, B.D.A.; Oliveira, A.S.F.; Mulholland, A.J. Molecular dynamics simulations support the hypothesis that the brGDGT paleothermometer is based on homeoviscous adaptation. Geochim. Cosmochim. Acta 2021, 312, 44–56. [Google Scholar] [CrossRef]
  61. Sinninghe Damsté, J.S.; Rijpstra, W.I.; Hopmans, E.C.; Weijers, J.W.; Foesel, B.U.; Overmann, J.; Dedysh, S.N. 13,16-Dimethyl octacosanedioic acid (iso-diabolic acid), a common membrane-spanning lipid of Acidobacteria subdivisions 1 and 3. Appl. Environ. Microbiol. 2011, 77, 4147–4154. [Google Scholar] [CrossRef] [PubMed]
  62. Sinninghe Damsté, J.S.; Rijpstra, W.I.C.; Foesel, B.U.; Huber, K.J.; Overmann, J.; Nakagawa, S.; Kim, J.J.; Dunfield, P.F.; Dedysh, S.N.; Villanueva, L. An overview of the occurrence of ether- and ester-linked iso-diabolic acid membrane lipids in microbial cultures of the Acidobacteria: Implications for brGDGT paleoproxies for temperature and pH. Org. Geochem. 2018, 124, 63–76. [Google Scholar] [CrossRef]
  63. Guo, J.; Ma, T.; Liu, N.; Zhang, X.; Hu, H.; Ma, W.; Wang, Z.; Feng, X.; Peterse, F. Soil pH and aridity influence distributions of branched tetraether lipids in grassland soils along an aridity transect. Org. Geochem. 2022, 164, 104347. [Google Scholar] [CrossRef]
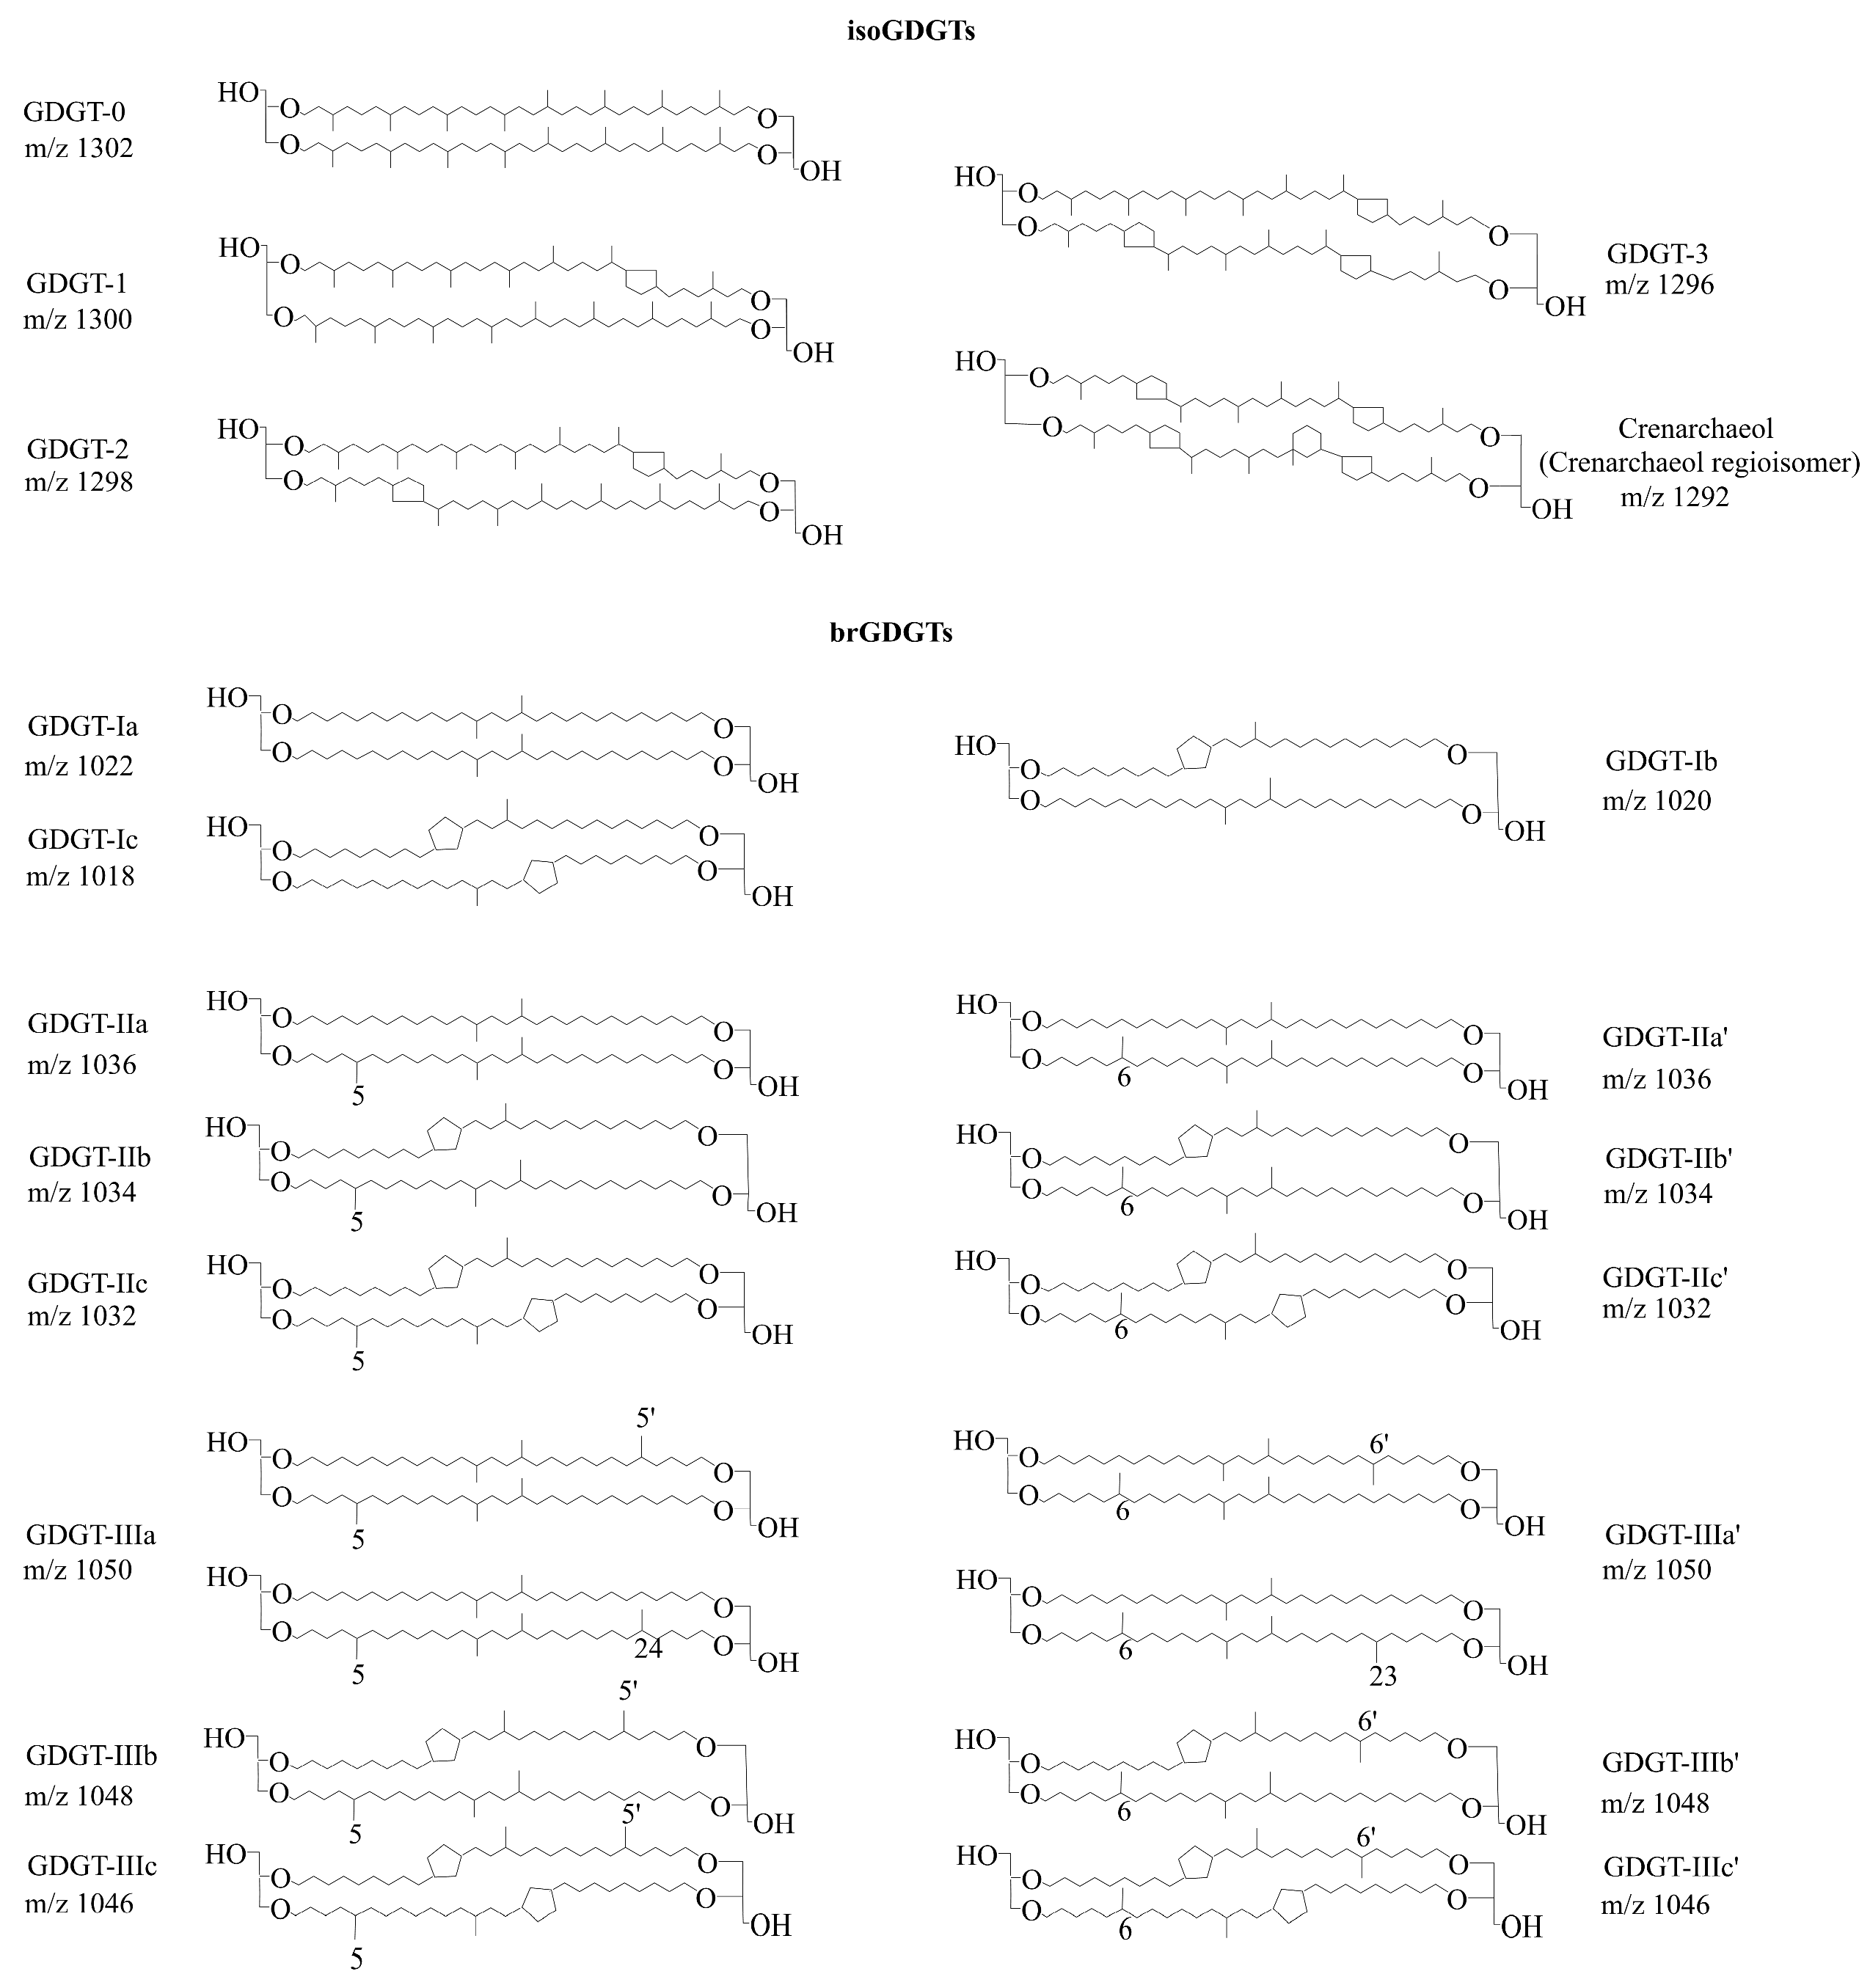
Figure 1. Chemical structures of representative GDGTs.
Water 17 02677 g001
Figure 2. Map illustrating the sampling locations across three mangrove wetlands: the Sundarbans in Bangladesh (BD1 and BD2), Maowei Sea (GX1) and Nanliu Estuary (GX2) in the Guangxi Province, as well as Mai Po in Hong Kong, China (HK1).
Water 17 02677 g002
Figure 3. Bar plots depicting the average concentrations of isoGDGTs (a), branched GDGTs (brGDGTs) (b), and total GDGTs (ΣGDGTs) (c) in whole core sediment samples, including surface sediment, collected from the three mangrove wetlands (HK, BD, GX).
Water 17 02677 g003
Figure 4. Depth profiles of TOC content, GDGT concentrations and derived indices, including: (a) TOC; (b) isoGDGTs, (c) brGDGTs, (d) ΣGDGTs, (e) BIT index, (f) ratio of brGDGT IIIa/IIa, (g) ratio of GDGT-0/crenarchaeol (Cren), and (h) Methane Index (MI).
Water 17 02677 g004
Figure 5. Bar plots depicting the composition of bacterial microorganisms in the mangrove wetlands of Bangladesh (BD1, BD2) (a) and Guangxi, China (GX1, GX2) (b). Bacteria with a mean fractional abundance of less than 0.5% are grouped under the category “Others.” Sample designations represent the sediment core along with the corresponding depth in centimeters. For instance, BD1-5 indicates sediment samples collected from the 5 cm depth layer in core BD1.
Water 17 02677 g005
Figure 6. Depth profiles of measured pH and reconstructed CBT’-pH values in three mangrove wetlands: (a) Bangladesh, (b) Hong Kong, China and (c) Guangxi Province, China.
Water 17 02677 g006
Figure 7. Ternary plots showing the fractional abundance of tetramethylated, pentamethylated, and hexamethylated brGDGTs in the three mangrove wetlands. Data from global oceans, lakes, and soils are referenced from previous studies [17,41,42,43,44].
Water 17 02677 g007
Figure 8. Linear correlations between measured pH and CBT’ values across the mangrove wetlands in total samples (a), Bangladesh (b), Hong Kong, China (c), and Guangxi Province, China (d). The yellow line and dots represent samples from all stations, the blue line and dots represent samples from BD-1, the gray line and dots represent samples from BD-2, the red line and dots represent samples from HK-1, the cyan line and dots represent samples from GX-1, and the light cyan line and dots represent samples from GX-2. The shaded areas in each plot indicate the 95% confidence intervals.
Water 17 02677 g008
Figure 9. Depth profiles representing deviations between TEX86-reconstructed temperature (T-TEX86) and instrumental recorded SST, as well as between MBT′5ME-reconstructed mean air temperature (MATMBT′5ME) and instrumental recorded mean annual air temperature (MAAT) across the mangrove wetlands in BD1 (a), BD2 (b), HK1 (c), GX1 (d), GX2 (e).
Water 17 02677 g009
Figure 10. The results of PCA based on the relative abundance of bacterial phyla exceeding 0.5%. Panel (a) illustrates the sediment samples, while panel (b) displays the bacterial phyla alongside the GDGTs.
Water 17 02677 g010
Figure 11. Spearman correlation heatmaps illustrating the relationships between bacterial microorganisms (with relative abundances ≥ 0.5%) and the relative abundances of branched GDGTs (brGDGTs) in mangrove sediment cores from Bangladesh, specifically BD1 panel (a) and BD2 panel (b), as well as from Guangxi mangrove sediment cores GX1 panel (c) and GX2 panel (d). Asterisks indicate statistical significance levels: * p < 0.05, ** p < 0.01.
Water 17 02677 g011
Table 1. Definitions of Mathematical Symbols and Statistical Parameters in Equations (1)–(10).
SymbolDefinitionCorresponding Equations
Σ Summation operator, representing the sum of relative abundances of the listed GDGT compounds (e.g., Σ III a = III a   +   III a )(2)
n Sample size, referring to the number of samples used for establishing regression calibration models.(4), (7), (9)
r 2 Coefficient of determination, an indicator of the goodness of fit for regression models. A value closer to 1 indicates a better fit between the independent and dependent variables.(4), (7), (9)
R M S E Root mean square error, reflecting the average deviation between the predicted values (from calibration models) and observed values. A smaller value indicates higher prediction accuracy.(4), (7), (9)
Disclaimer/Publisher’s Note: The statements, opinions and data contained in all publications are solely those of the individual author(s) and contributor(s) and not of MDPI and/or the editor(s). MDPI and/or the editor(s) disclaim responsibility for any injury to people or property resulting from any ideas, methods, instructions or products referred to in the content.