Abstract
Marine plastic pollution has become a critical transboundary environmental issue, particularly affecting coastal regions with insufficient waste management infrastructure. This study applies a modified Lagrangian hydrodynamic model, TrackMPD v.1, to simulate the movement and accumulation of macroplastics in the West Africa Coastal Area. The research investigates three case studies: (1) the Liberia–Gulf of Guinea region, (2) the Mauritania–Gulf of Guinea coastal stretch, (3) the Cape Verde, Mauritania, and Senegal regions. Using both forward and backward simulations, macroplastics’ trajectories were tracked to identify key sources and accumulation hotspots. The findings highlight the cross-border nature of marine litter, with plastic debris transported far from its source due to ocean currents. The Gulf of Guinea emerges as a major accumulation zone, heavily impacted by plastic pollution originating from West African rivers. Interesting connections were found between velocities and directions of the plastic debris and some of the characteristics of the West African Monson climatic system (WAM) that dominates the area. Backward modelling reveals that macroplastics beached in Cape Verde largely originate from the Arguin Basin (Mauritania), an area influenced by fishing activities and offshore oil and gas operations. Results are visualized through point tracking, density, and beaching maps, providing insights into plastic distribution and accumulation patterns. The study underscores the need for regional cooperation and integrated monitoring approaches, including remote sensing and in situ surveys, to enhance mitigation strategies. Future work will explore 3D simulations, incorporating degradation processes, biofouling, and sinking dynamics to improve the representation of plastic behaviour in marine environments. This research is conducted within the Global Development Assistance (GDA) Agile Information Development (AID) Marine Environment and Blue Economy initiative, funded by the European Space Agency (ESA) in collaboration with the Asian. Development Bank and the World Bank. The outcomes provide actionable insights for policymakers, researchers, and environmental managers aiming to combat marine plastic pollution and safeguard marine biodiversity.
1. Introduction
Marine litter, particularly plastic pollution, has emerged as a significant transboundary environmental challenge [1].
The accumulation of plastic waste in marine ecosystems has gained global attention due to its pervasive impacts on biodiversity, human health, and coastal economies [2]. Plastic pollution adversely affects marine species, as well as the livelihoods of coastal communities, by disrupting fisheries, tourism, and other marine-based activities [3]. The issue is particularly pronounced in regions with rapidly growing populations and insufficient waste management infrastructure, such as parts of West Africa [4]. Recent assessments, including reports by the World Bank and the West Africa Coastal Areas Management Program (WACA), highlight that coastal zones in this regions are severely affected by marine pollution, with plastics accounting for a substantial portion of the litter [5]. This context underscores the centrality of research focused on understanding and mitigating marine plastic pollution.
Plastic waste in marine environments predominantly originates from terrestrial sources, such as rivers, urban runoff, and waste treatment facilities [6]. It manifests in various forms and sizes [1]. Marine litter is composed of a variety of materials, including metal, glass, paper, and clothes [7]; however, plastic is by far the most abundant fraction, characterized by diverse shapes, dimensions, and polymeric compositions [8]. Macroplastics, defined as plastic fragments between 2.5 cm and 1 m, are particularly concerning due to their potential to entangle marine species and degrade into mesoplastics (between 5 mm and 2.5 cm) and then into microplastics (between 0.1 μm and 5 mm) [9], which can be ingested by marine organisms, thereby entering the food web [10]. Microplastics pose additional risks as they can absorb and transfer toxic chemicals, amplifying their potential harm to both marine ecosystems and human health [11].
Studies have demonstrated that rivers act as significant conduits for transporting plastic waste from land to sea, particularly during periods of heavy rainfall [12]. These dynamics are evident in regions such as West Africa, where rivers transport substantial quantities of plastic debris into marine ecosystems [13]. This is compounded by the fact that many of these rivers pass through densely populated urban areas where waste management systems are inadequate [14]. The increasing amounts of beached microplastics are connected with the enhanced presence of anthropogenic activities [15], and once these plastic elements are in the marine environment, their management and removal are more complicated [16].
To deal with this issue, a multi-disciplinary approach must account for hydrodynamic modelling and in situ and remote sensing monitoring [6,17,18,19,20]. Despite these advances, significant gaps remain in our understanding of the specific pathways and accumulation patterns of plastic pollution in the West Africa Coastal Area.
This study aims to contribute to filling this research gap by applying a modified Lagrangian hydrodynamic model, TrackMPD v.1 [20], to simulate the dispersion and accumulation of macroplastics in the West Africa Coastal Area. The model was applied in 2D, considering the South African region as its main source and highlighting the transboundary character of the issue [16]. Specifically, the study focuses on three case studies: (1) the region between Liberia and the Gulf of Guinea, (2) the area spanning from Mauritania to the Gulf of Guinea, (3) the region encompassing Cape Verde, Mauritania, and Senegal. By conducting both forward and backward simulations, the research seeks to track their trajectories and identify key sources of marine plastic pollution. This dual approach allows for the identification of both pollution sources and affected regions, offering a comprehensive view of the issue. The influence of the West African Monson climatic system (WAM) on the macroplastic transport was assessed.
This work is conducted within the framework of the Global Development Assistance (GDA) Agile Information Development (AID) Marine Environment and Blue Economy activity, funded by the European Space Agency in collaboration with the Asian Development Bank and the World Bank (https://gda.esa.int/thematic-area/marine/, accessed on 20 April 2024). This study provides actionable insights for policymakers, researchers, and environmental managers seeking to implement effective mitigation and adaptation strategies in the face of growing marine plastic pollution. In particular, giving a spatial distribution visualization of marine litter, this study highlights that marine litter is a cross-border issue, being interested in plastic debris areas far away from the plastic sources. These findings aim to enhance our understanding of the spatial distribution of marine litter and support efforts to mitigate its impacts in one of the world’s most vulnerable coastal regions.
2. Case Studies and Study Areas
The simulations were performed across various study areas, each delineated by distinct boxes, as illustrated in Figure 1.
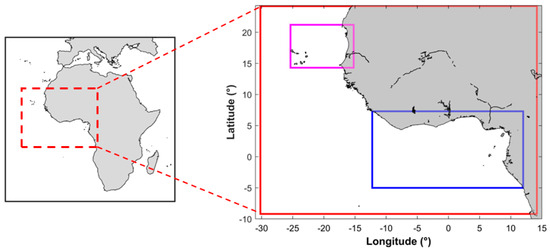
Figure 1.
Study areas related to Section 3.1 (blue box), Section 3.2 (red box), and Section 3.3 (magenta box).
The first Case Study (hereinafter “Section 3.1”) encompasses the area between the Liberia and Gabon regions, including the Gulf of Guinea (Figure 1, blue box). This region is characterized by high population density along the coast and significant river discharge, which acts as a primary pathway for plastic pollution entering the marine environment [13]. Rivers such as the Mano and Saint John, characterized by high flow, contribute to substantial plastic transport, particularly during rainy seasons when river flows intensify. The Gulf of Guinea’s complex hydrodynamics, including coastal currents and eddies [21], influence the distribution and accumulation of macroplastics in this area.
The second Case Study (“Section 3.2”) spans the coastal regions of “Section 3.1”, including all coastal regions between Mauritania and Gulf of Guinea (Figure 1, red box), with the aim of evaluating the impact of the northeast regions on marine litter issues, testing the effectiveness of the model on a larger area, and of evaluating the seasonal influence on plastic pollution transport. This expansive area includes diverse ecosystems ranging from arid zones in the north to tropical environments in the south [22]. Key contributors to plastic pollution in this region include urban runoff, industrial discharge, and inadequate waste management systems along the coast [5]. The hydrodynamic conditions are shaped by strong oceanic currents and wind patterns, which facilitate the long-range transport of macroplastics.
Simulations in Section 3.1 and Section 3.2 focused on forward modelling, releasing macroplastics from identified coastal source points to track their movement and accumulation patterns.
The third Case Study (“Section 3.3”) focuses on the enclosed area encompassing Cape Verde and the regions of Mauritania and Senegal (Figure 1, magenta box). This area presents a unique setting due to its semi-isolated oceanographic features and the influence of the Canary Current. A backward simulation approach was employed in this Case Study, with Cape Verde Island identified as a primary accumulation site of plastic pollution. The backward modelling aimed to trace the origins of macroplastic particles, providing insights into transboundary pollution dynamics and regional hotspots.
All the study areas are dominated by the West African Monsoon (WAM) system which is characterized by three phases: the onset (March–May), the high-rain period (June–August), and the southward retreat (September–October) [23]. Under the WAM regime, rainfall and convection over West Africa are significantly modulated at two intra-seasonal timescales: 10–25 and 25–60 days [23].
3. Material and Methods
The simulations were performed using the hydrodynamic Lagrangian TrackMPD v.1 model [20], which is capable of tracking the fate and transport of macro/microplastics in 2D or 3D, taking into account several phenomena such as biofouling, degradation, washing-off, sinking, etc. This model has been extensively used and its ability in replicating particle trajectories was tested via an ad hoc drifter experiment [24].
In this study, the model was modified specifically for this research. While the original TrackMPD is designed to track a group of particles simultaneously released from the source coordinates, it was adapted to allow the tracking of particles which are released daily from the source coordinates. Both forward and backward simulations were carried out. The former is useful to individuate the accumulation and beaching areas when the source points are known; in contrast, through backward simulations, pollution sources are identifiable.
All the analyses were conducted considering a 2D simulation mode, as several of the microplastics type float on the sea [25,26].
TrackMPD accounts for a variety of physical processes such as advection (deterministic) and dispersion (stochastic). The fact that probabilistic (not only deterministic) particle trajectories are computed partially compensates for some input inaccuracies.
In more detail, advective and diffusive displacements determine the 2D trajectories of particles according to
To the advective displacements , random displacement components are added to the particle motion to reproduce turbulent diffusion that occurs at the scale of the particle motion. The former were given by the Eulerian velocity field provided by the E.U. Copernicus Marine Service (CMS), U (x, y, z, t) and V (x, y, z, t), multiplied for the time step, dt. The latter were determined from random dU’ and dV’ components multiplied for the time step, dt.
The numerical solution of the model includes a Runge–Kutta [27,28] scheme of order 4/5 in both space and time to calculate particle movement due to advection using an iterative process that incorporates velocities at previous and future times. In this way, the model provides the most robust estimate of particle trajectory.
The input data necessary to operate the model are the eastward (U) and northward (V) velocities at the surface, the sea surface height above geoid (zos), and the bathymetry downloaded from the CMS. The product used (https://doi.org/10.48670/moi-00016, accessed on 14 January, 2022) has an 0.083° × 0.083° (i.e., ~8 km) spatial resolution and daily temporal resolution. This input data implicitly accounts for several physical variables, such as bathymetry data (ETOPO1 for the deep ocean and GEBCO8 in regions shallower than 200 m), atmospheric forcing (ECMWF IFS HRES, https://www.ecmwf.int/en/forecasts/datasets/set-i, accessed on 2 September 2025), and other data assimilated into the model such as Sea Surface Temperature (ODYSSEA, https://data.marine.copernicus.eu/product/SST_GLO_PHY_L4_NRT_010_043/description, accessed on 2 September 2025), Sea Ice Concentration (OSI SAF, https://osi-saf.eumetsat.int/, accessed on 2 September 2025), Sea Level Anomaly (AVISO, https://www.aviso.altimetry.fr/en/home.html, accessed on 2 September 2025), Temperature/Salinity profiles (CORIOLIS database, https://www.coriolis.eu.org/, accessed on 2 September 2025), and the flows of 100 major rivers.
The boundary of the coastal area is a necessary input to run the simulations. It was imputed to the model in a ‘.txt’ file with Longitude and Latitude coordinates. The initial particle positions were set up for each Case Study, consistent with the main goals of each simulation.
The main inputs and outcomes necessary for the model are schematised in Figure 2.
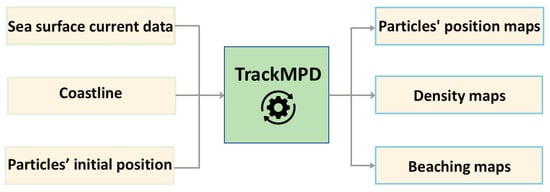
Figure 2.
Schematization of the TrackMPD model.
The outcome data were handled to produce the following: (i) particles’ position maps, which mapped the output with dots of different colours for each river, allowing us to track the path of each particle; (ii) density maps, useful to individuate the accumulation area on the sea surface; (iii) beaching maps, showing the most impacted coastal areas. Both the density and beaching maps allowed us to quantify the number of particles per pixel, with the same spatial resolution as the CMS data. The particles were considered as beached once these were within a coastal buffer of 2 times the spatial resolution of the CMS grid (i.e., ~16 km). Both the density and beaching maps have the same spatial resolution as the CMS data.
3.1. Case Study 1
The domain selected here was the enclosed area between the Liberia region and the Gulf of Guinea. Rivers are individuated as one of the main marine pollution sources by several research activities [29]. It is evident that, especially during the rainy season, high quantities of debris are transported in the sea environment [30]. The main Liberian rivers were identified via the Liberian Hydrological service, which provides the rainfall data and the geometric characteristics of each catchment. The ones with the highest flow were selected: the Mano, Lofa, Saint Paul, Saint John, and Sinoe rivers. The following conditions were established to set up the simulation, ensuring sustainability in terms of computational resources:
- (1)
- Each river discharged 5 macroplastic particles daily over the entirety of 2021, following a daily temporal resolution;
- (2)
- The release points for these discharges were positioned approximately 20 km from the coastline;
- (3)
- The ocean current data had a spatial resolution of approximately 8 km.
These conditions were carefully chosen to balance the accuracy of the simulation with the computational efficiency required for the study.
The discharging points and the relative rivers are represented with different colours in Figure 3.
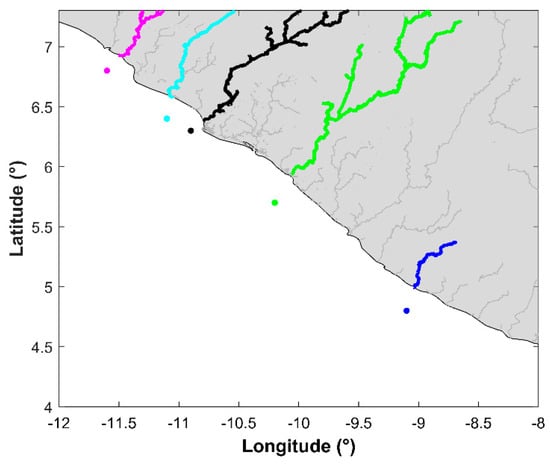
Figure 3.
Study area. The discharging points are represented with different colours: the Mano (pink), Lofa (light blue), St. Paul (black), St. John (green), and Sinoe (blue) rivers.
As the simulation was one year long, a trend analysis allowed us to check for possible influences of the WAM system on particle movements. Specifically, time series of the particles’ velocities and directions (and their averages) were computed. The average direction was further analyzed via a trend analysis to compute long-trend (LT) and seasonal-trend (ST) components, which were then qualitatively compared with the WAM system’s main characteristics (stages and periodicity).
3.2. Case Study 2
This Case Study examined all coastal regions from Mauritania to Gabon.
For each region, the river contributing the most to marine plastic litter was identified as the primary input source. These rivers were selected based on data from “River plastic emission to the World’s Ocen” [6], available on the OceanCleanUp website (https://theoceancleanup.com/sources/, accessed on 16 January 2022). The identified rivers included seasonal rivers (Mauritania) and the Sine-Saloum (Senegal), Gambia (Gambia), Rio Como (Guinea-Bissau), Konkourè (Guinea), Alligator (Sierra Leone), Mesurado (Liberia), Pra (Ghana), Lake Togo (Togo), Lake Nokouè (Benin), the Imò (Nigeria), and Michel Marine (Gabon). Given the high computational demand and the extensive area under analysis, one macroplastic particle was released daily from each river. The simulation was conducted during the rainy season, spanning from May to October (https://climateknowledgeportal.worldbank.org/, accessed on 2 September 2025).
As in Section 3.1, the particles were released approximately 20 km from the coastline, and the data had a spatial resolution of ~8 km.
Results were analyzed in terms of density mapping. Due to the extensive domain, beaching phenomena were not computed.
The study area and the dischargin points are presented in Figure 4.
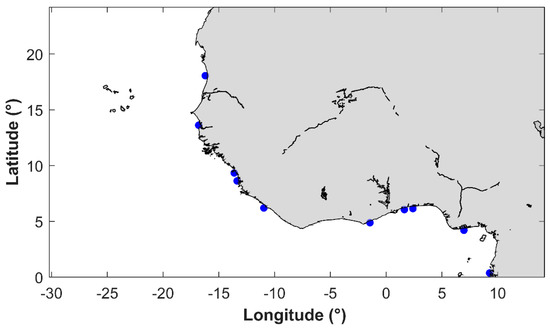
Figure 4.
Study area. The discharging points are highlighted with blue dots.
3.3. Case Study 3
Results from “Section 3.1” identify the coastline of Cape Verde as a significant beaching area. This finding is confirmed by an in situ monitoring campaign conducted on Santa Luzia Island, during which beach litter was quantified and removed [31]. This island plays a crucial ecological role but is under threat from substantial accumulations of debris, predominantly plastic items.
Upon analyzing the results of “Section 3.1”, the highest recorded instance of macroplastic debris beaching occurred on 30 April 2023, with 60 particles detected within the coastal buffer area on the beach of Praia dos Achados (Santa Luzia Island, Cape Verde). The particles were tracked backwards on a daily basis until 1 September 2022 (the earliest recorded point) to determine their coastal source area.
Given the large volume of particles and the associated computational demand, two different simulations were conducted, referred to as “Section 3.1 and Section 3.2”. The initial domain selected for “Section 3.1” (−26° W, −15° E; 13° S, 18° N) did not allow for the identification of the source coastal area, necessitating an expansion in “Section 3.2” (−26° W, −15° E; 14.5° S, 21° N).
As a result, a density map was produced with a spatial resolution of ~8 km.
4. Result and Discussion
The outcomes of the simulations were analyzed and visualized using various representations, tailored to the specific scientific questions addressed in each Case Study and the associated computational requirements. Below are the most representative maps produced for the different case studies. For both Section 4.1 and Section 4.2, the most impacted area is that of the Gulf of Guinea, where the results are reported.
4.1. Case Study 1
The most significant point maps (Figure 5) are reported from two-month intervals, beginning on 1 February and concluding on 1 December. These maps reveal a consistent trend among all particles, regardless of their source location. Due to the influence of the Canary Current System and the Guinea Current System [32], identified as the predominant currents in the West Africa domain, macroplastics released from the Liberia region were transported south-westward. The transboundary nature of marine litter was evident from the early months of the simulations, as particles rapidly drifted from Liberia to the Gulf of Guinea, where they accumulated. The Gulf of Guinea emerged as the most heavily impacted area, primarily due to its coastal geomorphology and the prevailing sea surface current patterns.
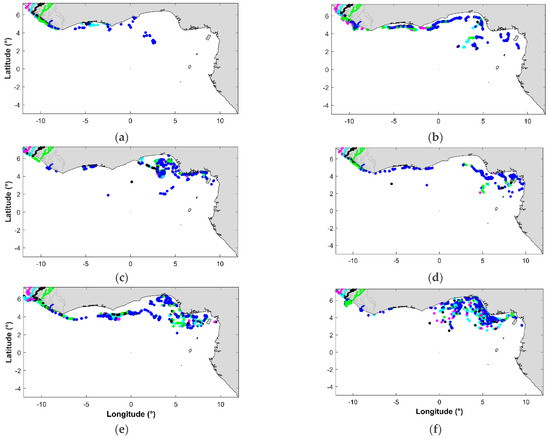
Figure 5.
Particles’ position maps for the most representative months, 2021 (the first day of each month is shown). (a) February; (b) April; (c) June; (d) August; (e) October; (f) December. Points in maps have the same colours as their discharging rivers: Mano (pink), Lofa (light blue), St. Paul (black), St. John (green), Sinoe (blue).
The significant impact on the Gulf of Guinea was further confirmed by the density maps, which allowed for the quantification of macroplastics within each pixel and clearly delineated the accumulation areas. Although density maps were generated for all simulation days, only those depicting the highest plastic concentrations are reported (Figure 6, left panel).
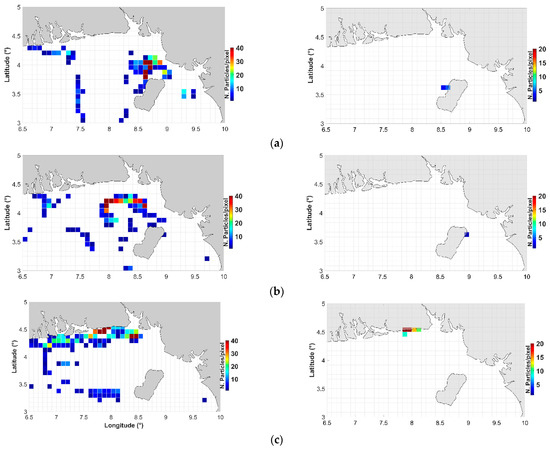
Figure 6.
Density maps (left panels) and beaching maps (right panels) related to the most representative days: (a) 30 July 2021; (b) 3 August 2021; (c) 13 August 2021.
In addition to being the area with the highest surface accumulation of macroplastics, the Gulf of Guinea also exhibited the largest number of beached particles, as indicated by the beaching maps (Figure 6, right panel). The coastal regions of Nigeria and Bioko Island were particularly affected by plastic pollution. Islands tend to be more susceptible to beach litter accumulation compared to continental coastlines. This vulnerability is primarily attributed to ocean currents and meteorological–oceanographic conditions [33]. Consequently, the majority of plastic debris found on these islands originates from continental areas, carried by ocean currents rather than being generated locally [34].
The average particle velocity (Figure 7, top panel) is higher in February–March and in June. By analyzing the one-St.-deviation confidence area, some particles are characterized by very high speeds in May and September (up to 0.5 m s−1). The average direction (Figure 7, middle panel) reveals that during May, June–July, and October–November, several intersections with the 0° line occur, meaning that particles experience rapid changes in direction, particularly in regard to passages between +90–100° (W-E direction) to −50° (SE-NW direction). The trend analysis of the average direction (Figure 7, bottom panel) reveals that the long-term trend is characterized by three main peaks in April–May, June–July, and October–November, plus a smaller peak in March–April. These peaks in the LT are qualitatively comparable with the stages of the WAM climatic system that dominates the area. The seasonal trend also reveals an interesting connection with the WAM system, as the periodicity of the ST is around 18–22 days, which agrees with one of the two intra-seasonal WAM timescales [27].
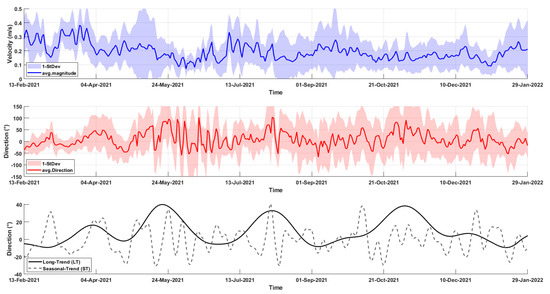
Figure 7.
Average particle velocity and 1-St-dev.confidence area (top panel); average particle direction and 1-St-dev.confidence area (middle panel); LT (black continuous line) and ST (dashed grey) resulting from the trend analysis performed on the average direction (bottom panel).
4.2. Case Study 2
Although the study area in this Case Study was expanded beyond the scope of “Section 4.1” the Gulf of Guinea remained the most affected region (Figure 8).
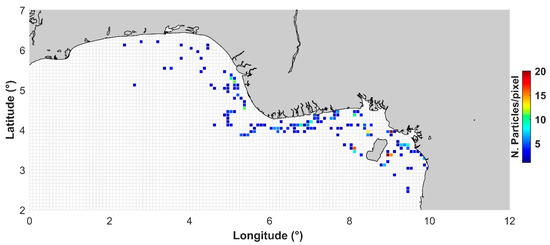
Figure 8.
Density map for the most representative day, 15 October 2021.
4.3. Case Study 3
As indicated by the results of “Section 4.1” (Figure 9a), identifying the coastal source area was not feasible within the initially defined domain. Consequently, the study area was expanded in “Section 4.2” (Figure 9b).
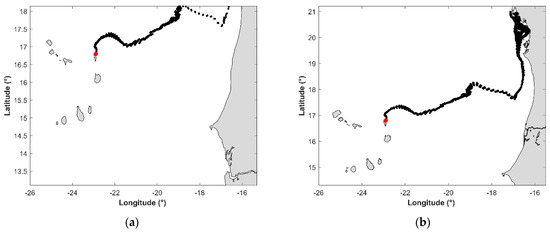
Figure 9.
Backward simulations. (a) “Section 3.1” and (b) “Section 3.2”. The red points represent the initial positions of the particles; black points are the particles’ positions tracked backward.
With the expanded study area, the Arguin Basin (Mauritania) was identified as a key coastal source region. This area is significantly influenced by fishing activities as well as offshore oil and gas exploration. These findings are further supported by a campaign conducted by the NGOs “Sea Shepherd” and “Biosfera [31]” which sought to trace the origins of beach litter collected from the shores of Cape Verde. Their investigation identified source areas spanning 25 different countries along the West African coast.
5. Conclusions
In this study, a hydrodynamic Lagrangian model was applied in a 2D framework in both forward and backward mode. Via Lagrangian simulations, the effect of a riverine plastic-discharging scenario was examined, highlighting both the severity degree of the marine plastic pollution in the area and the transboundary nature of the marine litter issue.
The forward simulations enabled the tracking of macroplastics released from the major rivers along the West African coast, with the primary objective of identifying the most affected areas in terms of accumulation and beaching. Conversely, the backward simulations were conducted to determine the coastal source areas of macroplastics that had washed ashore on Boko Island. The analysis of the velocities and directions of the simulated particles during one whole year (Case Study 1) revealed an interesting connection with the West Africa Monson (WAM) system in terms of its stages and periodicity characterizing the particle movements in the area.
The model was adapted to release macroplastics daily, allowing for an assessment of the continuous discharge of plastic waste from riverine sources. The high computational cost required by the model, depending on various factors such as the size of the study area, the quantities of macroplastics, and the phenomena considered (e.g., beaching, degradation, etc.), made it necessary to find a compromise between the number of plastics and the extent of the study area.
The simulations clearly demonstrate that marine plastic pollution is a transboundary issue, with accumulation zones often located far from the original discharge points. In many instances, plastic debris found along coastal areas is not locally generated but is transported from other regions by ocean currents.
It needs to be highlighted that, while Lagrangian models can be validated in principle via ad hoc drifter experiments (as in the case of the TrackMPD, employed in this study), a validation of plastic accumulation simulations is not feasible. Indeed, even when in situ data on plastic accumulation is available, the plastics’ source and timing are unknown (whether the plastics came from the sea, beaching, or were deliberately left on the beach by users). Thus, in this framework, Lagrangian simulations are validated tools for investigating scenarios, for guiding future in situ campaigns in areas where the simulations show plastic accumulation, and finally, for raising the awareness and preparedness of stakeholders who are involved in the effective mitigation of marine pollution, which requires international cooperation, with the implementation of shared regulations and coordinated strategies. Even if the mitigation framework is clearly complex, monitoring techniques coupled with hydrodynamic modelling can be useful for identifying the most affected areas: models can drive monitoring campaigns, and remote sensing and in situ activities are useful for a further characterization of the polymeric composition of marine debris.
Other solutions are to be set at different levels, including improved waste management and infrastructure, new technological solutions for river/sea cleanup, tailored policy and legislation, and new community and individual actions (such as reducing single-use plastic consumption, proper recycling, public participation in cleanups, and supporting relevant organizations).
As for further development, even if a large part of the plastic litter floats on the surface, the application of three-dimensional simulations could aim to incorporate processes which can have a biassing effect on plastic litter’s floatability, such as the biofouling.
Author Contributions
Conceptualization, L.C. and A.A.; methodology L.C., F.C. and G.C. (Giulio Ceriola); software, L.C. and F.C.; formal analysis, L.C. and F.C.; investigation, L.C.; resources, A.A.; data curation, L.C.; writing—original draft preparation, L.C.; writing—review and editing, L.C., F.C., A.A., G.C. (Giuseppe Ciraolo) and G.C. (Giulio Ceriola); visualization, L.C. and F.C.; supervision, A.A.; project administration, A.A.; funding acquisition, A.A. All authors have read and agreed to the published version of the manuscript.
Funding
This work was supported by the ESA Global Development Assistance (GDA) Agile EO Information Development (AID) programme under ESA Contract No. 4000138167/21/I-NB (Marine Environment & Blue Economy).
Data Availability Statement
The original data presented in the study are openly available in Copernicus Marine Service at https://doi.org/10.48670/moi-00016.
Acknowledgments
This study was conducted using E.U. Copernicus Marine Service Information; https://doi.org/10.48670/moi-00016, accessed on 15 January 2022. This work was supported by the ESA Global Development Assistance (GDA) Agile EO Information Development (AID) programme under ESA Contract No. 4000138167/21/I-NB (Marine Environment & Blue Economy).
Conflicts of Interest
Authors Giulio Ceriola and Antonello Aiello were employed by the company Planetek Italia s.r.l. The remaining authors declare that the research was conducted in the absence of any commercial or financial relationships that could be construed as a potential conflict of interest.
References
- Jambeck, J.R.; Geyer, R.; Wilcox, C.; Siegler, T.R.; Perryman, M.; Andrady, A.; Narayan, R.; Law, K.L. Plastic Waste Inputs from Land into the Ocean. Science 2015, 347, 768–771. [Google Scholar] [CrossRef] [PubMed]
- Kumar, R.; Verma, A.; Shome, A.; Sinha, R.; Sinha, S.; Jha, P.K.; Kumar, R.; Kumar, P.; Shubham; Das, S.; et al. Impacts of Plastic Pollution on Ecosystem Services, Sustainable Development Goals, and Need to Focus on Circular Economy and Policy Interventions. Sustainability 2021, 13, 9963. [Google Scholar] [CrossRef]
- Werner, S.; Budziak, A.; van Franeker, J.; Galgani, F.; Hanke, G.; Maes, T.; Matiddi, M.; Nilsson, P.; Oosterbaan, L.; Priestland, E.; et al. Harm Caused by Marine Litter: MSFD GES TG Marine Litter—Thematic Report; Publications Office of the European Union: Luxembourg, 2016; ISBN 978-92-79-64535-8. [Google Scholar]
- Moyen Massa, G.; Archodoulaki, V.-M. An Imported Environmental Crisis: Plastic Mismanagement in Africa. Sustainability 2024, 16, 672. [Google Scholar] [CrossRef]
- World Bank. Plastic Pollution in Coastal West Africa–Synthesis; World Bank: Washington, DC, USA, 2023. [Google Scholar]
- Meijer, L.J.J.; Van Emmerik, T.; Van Der Ent, R.; Schmidt, C.; Lebreton, L. More than 1000 Rivers Account for 80% of Global Riverine Plastic Emissions into the Ocean. Sci. Adv. 2021, 7, eaaz5803. [Google Scholar] [CrossRef]
- Bergmann, M.; Gutow, L.; Klages, M.; Alfred-Wegener-Institut; Göteborgs universitet (Eds.) Marine Anthropogenic Litter; Springer: Cham, Switzerland; Heidelberg, Germany; New York, NY, USA; Dordrecht, The Netherlands; London, UK, 2015; ISBN 978-3-319-16509-7. [Google Scholar]
- Taghizadeh Rahmat Abadi, Z.; Abtahi, B.; Fathi, M.B.; Mashhadi, N.; Grossart, H.-P. Size, Shape, and Elemental Composition as Predictors of Microplastic Surface Erosion. J. Hazard. Mater. 2024, 476, 134961. [Google Scholar] [CrossRef]
- Kroon, F.J.; Motti, C.E.; Jensen, L.H.; Berry, K.L.E. Classification of Marine Microdebris: A Review and Case Study on Fish from the Great Barrier Reef, Australia. Sci. Rep. 2018, 8, 16422. [Google Scholar] [CrossRef]
- Carbery, M.; O’Connor, W.; Palanisami, T. Trophic Transfer of Microplastics and Mixed Contaminants in the Marine Food Web and Implications for Human Health. Environ. Int. 2018, 115, 400–409. [Google Scholar] [CrossRef]
- Ali, S.S.; Alsharbaty, M.H.M.; Al-Tohamy, R.; Schagerl, M.; Al-Zahrani, M.; Kornaros, M.; Sun, J. Microplastics as Persistent and Vectors of Other Threats in the Marine Environment: Toxicological Impacts, Management and Strategical Roadmap to End Plastic Pollution. Environ. Chem. Ecotoxicol. 2025, 7, 229–251. [Google Scholar] [CrossRef]
- Wang, T.; Li, B.; Shi, H.; Ding, Y.; Chen, H.; Yuan, F.; Liu, R.; Zou, X. The Processes and Transport Fluxes of Land-Based Macroplastics and Microplastics Entering the Ocean via Rivers. J. Hazard. Mater. 2024, 466, 133623. [Google Scholar] [CrossRef] [PubMed]
- Lebreton, L.C.M.; van der Zwet, J.; Damsteeg, J.-W.; Slat, B.; Andrady, A.; Reisser, J. River Plastic Emissions to the World’s Oceans. Nat. Commun. 2017, 8, 15611. [Google Scholar] [CrossRef]
- Angnunavuri, P.N.; Attiogbe, F.; Mensah, B. Consideration of Emerging Environmental Contaminants in Africa: Review of Occurrence, Formation, Fate, and Toxicity of Plastic Particles. Sci. Afr. 2020, 9, e00546. [Google Scholar] [CrossRef]
- Lamprecht, A. The Abundance, Distribution and Accumulation of Plastic Debris in Table Bay; University of Cape Town: Cape Town, South Africa, 2013. [Google Scholar]
- van Sebille, E.; Aliani, S.; Law, K.L.; Maximenko, N.; Alsina, J.M.; Bagaev, A.; Bergmann, M.; Chapron, B.; Chubarenko, I.; Cózar, A.; et al. The Physical Oceanography of the Transport of Floating Marine Debris. Environ. Res. Lett. 2020, 15, 023003. [Google Scholar] [CrossRef]
- Corbari, L.; Maltese, A.; Capodici, F.; Mangano, M.C.; Gianluca, S.; Ciraolo, G. Indoor Spectroradiometric Characterization of Plastic Litters Commonly Polluting the Mediterranean Sea: Toward the Application of Multispectral Imagery. Sci. Rep. 2020, 10, 19850. [Google Scholar] [CrossRef]
- Corbari, L.; Capodici, F.; Ciraolo, G.; Topouzelis, K. Marine Plastic Detection Using PRISMA Hyperspectral Satellite Imagery in a Controlled Environment. Int. J. Remote Sens. 2023, 44, 6845–6859. [Google Scholar] [CrossRef]
- Capodici, F.; Corbari, L.; Gauci, A.; Basilone, G.; Bonanno, A.; Campanella, S.; Ciraolo, G.; Candela, A.; D’Amato, D.; Ferreri, R.; et al. Towards Microplastic Hotspots Detection: A Comparative Analysis of in-Situ Sampling and Sea Surface Currents Derived by HF Radars. Mar. Pollut. Bull. 2024, 209, 117237. [Google Scholar] [CrossRef]
- Jalón-Rojas, I.; Wang, X.H.; Fredj, E. A 3D Numerical Model to Track Marine Plastic Debris (TrackMPD): Sensitivity of Microplastic Trajectories and Fates to Particle Dynamical Properties and Physical Processes. Mar. Pollut. Bull. 2019, 141, 256–272. [Google Scholar] [CrossRef] [PubMed]
- Thiam, A.K.; Alory, G.; Dadou, I.; Napolitano, D.; Aguedjou, H.M.A.; Cardot, C.; Morvan, G.; Morel, Y.; Jouanno, J. Mesoscale dynamics and its interaction with coastal upwelling in the northern Gulf of Guinea. Front. Mar. Sci. 2024, 11, 1–17. [Google Scholar] [CrossRef]
- Bobe, R. The Evolution of Arid Ecosystems in Eastern Africa. J. Arid. Environ. 2006, 66, 564–584. [Google Scholar] [CrossRef]
- Sultan, B.; Janicot, S.; Diedhiou, A. The West African Monsoon Dynamics. Part I: Documentation of Intraseasonal Variability. J. Clim. 2003, 16, 3389–3406. [Google Scholar] [CrossRef]
- Soares, A.C.; Doto, K.; Silva, P.; Jalón-Rojas, I.; Bouyssou, R.; Pinho, G.L.L.; Fernandes, E. Modeling the Potential Source Routes of Marine Macroplastics on a Beach Adjacent to the Patos Lagoon Estuary, South Brazil. Mar. Pollut. Bull. 2025, 220, 118349. [Google Scholar] [CrossRef] [PubMed]
- Mutuku, J.; Yanotti, M.; Tocock, M.; Hatton MacDonald, D. The Abundance of Microplastics in the World’s Oceans: A Systematic Review. Oceans 2024, 5, 398–428. [Google Scholar] [CrossRef]
- Frias, J.P.G.L.; Lyashevska, O.; Joyce, H.; Pagter, E.; Nash, R. Floating Microplastics in a Coastal Embayment: A Multifaceted Issue. Mar. Pollut. Bull. 2020, 158, 111361. [Google Scholar] [CrossRef]
- Runge, C. Ueber die numerische Auflösung von Differentialgleichungen. Math. Ann. 1895, 46, 167–178. [Google Scholar] [CrossRef]
- Kutta, W. Beitrag Zur Näherungsweisen Integration Totaler Differentialgleichungen; Teubner: Berlin, Germany, 1901. [Google Scholar]
- Kalina, M.; Kwangulero, J.; Ali, F.; Abera, Y.G.; Tilley, E. “Where Does It Go?”: Perceptions and Problems of Riverine and Marine Litter amongst South Africa and Malawi’s Urban Poor. PLoS Water 2022, 1, e0000013. [Google Scholar] [CrossRef]
- van Emmerik, T.H.M.; Frings, R.M.; Schreyers, L.J.; Hauk, R.; de Lange, S.I.; Mellink, Y.A.M. River Plastic Transport and Deposition Amplified by Extreme Flood. Nat. Water 2023, 1, 514–522. [Google Scholar] [CrossRef]
- BIOSFERA. Mission D’expertise de Gestion Des Déchets Plastiques Des Îles de Santa Luzia et de São Vicente, Cap Vert; WACA Program: Abidjan, Ivoorkust, 2022. [Google Scholar]
- Foli, B.A.K.; Appeaning Addo, K.; Ansong, J.K.; Wiafe, G. Ocean State Projections: A Review of the West African Marine Environment. J. Coast. Conserv. 2022, 26, 61. [Google Scholar] [CrossRef]
- Perez-Venegas, D.; Pavés, H.; Pulgar, J.; Ahrendt, C.; Seguel, M.; Galbán-Malagón, C.J. Coastal Debris Survey in a Remote Island of the Chilean Northern Patagonia. Mar. Pollut. Bull. 2017, 125, 530–534. [Google Scholar] [CrossRef]
- Ramilo-Henry, M.; Umbelina, B.; Matilde, E.; Duncan, E.M. Plastic Pollution on Remote Islands: A Baseline Study of Príncipe, Gulf of Guinea. Mar. Environ. Res. 2023, 191, 106181. [Google Scholar] [CrossRef] [PubMed]
Disclaimer/Publisher’s Note: The statements, opinions and data contained in all publications are solely those of the individual author(s) and contributor(s) and not of MDPI and/or the editor(s). MDPI and/or the editor(s) disclaim responsibility for any injury to people or property resulting from any ideas, methods, instructions or products referred to in the content. |
© 2025 by the authors. Licensee MDPI, Basel, Switzerland. This article is an open access article distributed under the terms and conditions of the Creative Commons Attribution (CC BY) license (https://creativecommons.org/licenses/by/4.0/).