Article

Impact of Stepwise Salinity Elevation on Nitrogen Removal and Microbial Properties of Morphologically Distinct Anammox Sludge

by
Keying Sun
1,2,
Huining Zhang
2,*,
Kefeng Zhang
2,*,
Jianqing Ma
2,
Zhengmin Pan
1,2 and
Shuting Zhang
3
1
College of Civil Engineering and Architecture, Zhejiang University, Hangzhou 310058, China
2
School of Civil Engineering, NingboTech University, Ningbo 315100, China
3
School of Life and Health Technology, Dongguan University of Technology, Dongguan 523808, China
*
Authors to whom correspondence should be addressed.
Water 2025, 17(17), 2611; https://doi.org/10.3390/w17172611
Submission received: 9 August 2025 / Revised: 30 August 2025 / Accepted: 31 August 2025 / Published: 3 September 2025
(This article belongs to the Section Wastewater Treatment and Reuse)

Abstract

The anaerobic ammonium oxidation (anammox) process offers potential for saline wastewater treatment but is hindered by salt inhibition. This study investigates the salt tolerance mechanisms of granular (R1), biofilm-carrier (R2), and floccular (R3) sludge in up-flow anaerobic sludge blanket (UASB) reactors under 0–20 g/L NaCl. Granular sludge outperformed other biomass types, maintaining >90% ammonia nitrogen ( NH 4 + -N) removal at 20 g/L NaCl due to structural stability and extracellular polymeric substances (EPS) adaptation (shift from hydrophobic proteins to polysaccharides). Microbial analysis revealed a transition from Planctomycetes/Proteobacteria to salt-tolerant Pseudomonadota, with Candidatus_Kuenenia replacing Candidatus_Brocadia as the dominant anaerobic ammonium oxidation bacteria (AnAOB) (reaching 14.5% abundance in R1). Genetic profiling demonstrated coordinated nitrogen metabolism: Hzs/Hdh inhibition (>85%) and NirBD/NrfAH activation (0.23%) elevated NH 4 + -N, while NarGIV/NapA decline (1.10%→0.58%) increased nitrate nitrogen ( NO 3 -N). NxrB/NirSK maintained low nitrite nitrogen ( NO 2 -N), and GltBD upregulation (0.43%) enhanced osmoregulation. These findings underscore the superior resilience of granular sludge under high salinity, linked to microbial community shifts and metabolic adaptations. This study provides critical insights for optimizing anammox processes in saline environments, emphasizing the importance of biomass morphology and microbial ecology in mitigating salt inhibition.

1. Introduction

The rapid industrialization of sectors such as pickling, food processing, aquaculture, and flue gas treatment has led to increasing discharges of high-salinity wastewater containing elevated ammonia nitrogen ( NH 4 + -N) concentrations [1]. Defined as wastewater with total dissolved solids (TDS) ≥ 3.5% or total salt content ≥ 1.0%, such effluents represent about 5% of China’s total wastewater discharge [2]. The direct release of untreated high-salinity, ammonia-rich wastewater causes severe environmental impacts including soil compaction, eutrophication, and microbial toxicity in aquatic ecosystems, often resulting in black-odor water phenomena [3].
Current treatment approaches include both physicochemical and biological methods, with biological processes gaining prominence due to their cost-effectiveness. Among these, the anaerobic ammonium oxidation (anammox) process has emerged as particularly promising, offering 60% lower aeration demand and 90% reduced sludge production compared to conventional nitrification-denitrification [4]. However, treating high-salinity ammonia-rich wastewater presents significant challenges. NH 4 + -N concentrations often exceed several thousand mg/L, inhibiting nitrifying bacteria and causing system instability [5]. Additionally, elevated salinity disrupts microbial metabolism, reduces sludge settleability, and alters microbial community structures [6].
Salinity impacts microbial activity in complex ways. While low salinity conditions can enhance microbial adaptation and improve nitrogen removal [7,8], excessive salinity (>20 g/L) severely inhibits key microbial functions. Studies demonstrate that aerobic systems experience declining total nitrogen (TN), total phosphorus (TP), and chemical oxygen demand (COD) removal rates with increasing salinity, while anaerobic systems like up-flow anaerobic sludge blanket (UASB) and sequencing batch reactor (SBR) reactors show reduced microbial diversity and sludge disintegration at high salt concentrations [9].
The anammox process shows particular sensitivity to salinity, with 15 g/L widely recognized as the inhibition threshold [10]. Critical findings reveal that at ≥20 g/L, heme protein synthesis declines sharply [11], while key microbial groups like Chloroflexi become suppressed [12], leading to sludge deterioration. Granular anammox sludge disintegrates at ≥30 g/L, though biofilms may retain partial activity.
However, a critical and comparative assessment of how different sludge morphologies [13] (e.g., granules vs. biofilms) respond to salinity stress is still lacking, which hinders the rational selection and optimization of bioreactors for treating high-salinity wastewater [14]. Furthermore, the underlying mechanisms of microbial adaptation, particularly reflected in physiological changes like EPS secretion and community structure shifts, require further elucidation.
To address these knowledge gaps, this study was designed to systematically investigate (1) the nitrogen removal efficiency across a wide salinity gradient (0–20 g/L); (2) the physiological response of sludge, with a focus on EPS secretion and its role in salinity tolerance; and (3) the dynamics of microbial community structure to identify keystone species resilient to salt stress.
The novelty of this work lies in its comprehensive comparative approach that links reactor performance, sludge physicochemical properties, and microbial ecology under salinity stress. Our findings uniquely contribute to the field by providing a mechanistic basis for selecting and engineering robust anammox sludge systems for the treatment of high-salinity ammonia-rich wastewater.

2. Materials and Methods

2.1. The Characteristics of Inoculating Sludge

The inoculated sludge used in this study was commercially purchased anammox granular sludge, exhibiting an initial mixture of reddish-brown and black granules. After a period of stable cultivation in the laboratory, the sludge developed consistent brick-red coloration. The mixed liquor suspended solids (MLSS) in the reactor was approximately 4620 mg/L, with mixed liquor volatile suspended solids (MLVSS) at 3207 mg/L, yielding an MLVSS/MLSS ratio of 0.69.

2.2. The Protocol and Synthetic Wastewater

The study used a 4 L UASB reactor (effective volume 2.5 L) constructed from organic glass, featuring a three-phase separator for gas–liquid–solid separation (Figure S1). Suspended sludge captured by the separator eventually returned to the sludge bed by gravity. A recirculation line returned to the base to enhance degradation. Temperature was maintained at 30 ± 1 °C through a water-jacketed heating system, with light exposure prevented by blackout wrapping. Operational parameters included dissolved oxygen (DO) below 0.5 mg/L and hydraulic retention time (HRT) of 0.085 days.
The experiment investigating different sludge morphologies employed three identical UASB reactors, designated as R1, R2, and R3 reactors. The granular sludge described in Section 2.1 was thoroughly mixed and then evenly divided into three equal portions for inoculation. The R1 was directly inoculated with granular sludge. The remaining two portions were ground into flocculent sludge using a mortar. For the R2, part of the flocculent sludge was inoculated onto 1 cm3 cubic foam carriers (Figure S2a), with thirty foam cubes packed into each floating ball (Figure S2b,c)—totaling 20 floating balls. The remaining flocculent sludge settled at the reactor bottom (Figure S3). During the initial operation, excessive packing inhibited microbial degradation; so, on day 20, the number of foam cubes per floating ball was reduced to 10, with 15 floating balls total. The excess microorganisms settled at the reactor bottom and continued participating in the reaction. The R3 was directly inoculated with the ground flocculent sludge.
The artificial simulated wastewater was used for the influent, and the components were as follows (mg/L): NH4Cl (99.5%, Sinopharm, Beijing, China) 200, NaNO2 (99.0%, Aladdin, China) 220, NaHCO3 (99.5%, Sinopharm, Beijing, China) 500, KH2PO4 (99.0%, Macklin, Shanghai, China) 8.77, CaCl2·2H2O (99.0%, Sinopharm, Beijing, China) 50, MgSO4·7H2O (99.0%, Sinopharm, Beijing, China) 50, and trace elements. Settings of salinity gradient (g/L):0 (0–10 d), 5 (11–41 d), 10 (42–90 d), 15 (91–124 d), 20 (125–171 d). Components and content (mg/L) of trace element solution: FeSO4·7H2O (99.0%, Sinopharm, Beijing, China) 5000, CuSO4·5H2O (99.0%, Sinopharm, Beijing, China) 250, H3BO3 (99.5%, Aladdin, Shanghai, China) 14, ZnSO4·7H2O (99.5%, Macklin, Shanghai, China) 430, MnCl2·4H2O (99.0%, Sinopharm, Beijing, China) 990, NiCl2·6H2O (99.0%, Macklin, Shanghai, China) 190, EDTA (99.0%, Sinopharm, Beijing, China) 1000, CoCl2·6H2O (99.0%, Macklin, Shanghai, China) 240.

2.3. Conventional Water Quality Analysis

For both the high-salinity phase and sludge morphology comparison phase, daily influent and effluent samples from each reactor were filtered through 0.45 μm aqueous membrane filters prior to analysis. Measured parameters included NH 4 + -N, nitrite nitrogen ( NO 2 -N), nitrate nitrogen ( NO 3 -N), TN, volumetric nitrogen loading rate (NLR, kg·N/(m3·d)), and volumetric nitrogen removal rate (NRR, kg·N/(m3·d)). TN was calculated as the sum of NH 4 + -N, NO 2 -N, and NO 3 -N, per Equations (1) and (2) [15]. All nitrogen species were analyzed according to standardized methods: NH 4 + -N (Nessler’s reagent method), NO 2 -N (ultraviolet method), NO 3 -N (N-(1-naphthalene)-ethylenediamine method).
TN influent = NH 4 + N influent + NO 2 N influent
TN effluent = NH 4 + N effluent + NO 2 N effluent + NO 3 N effluent
In this study, the NLR and NRR were calculated using Equations (3) and (4), respectively.
NLR = TN influent / 1000 × HRT
NRR = TN influent TN effluent / 1000 × HRT

2.4. Methods for Analyzing Sludge Properties

MLSS and MLVSS concentrations were measured once at each salinity transition using gravimetric methods.
For macroscopic imaging, homogeneous sludge samples of different morphologies were transferred using a pipette onto disposable culture dishes with white paper backing, and surface photographs were taken with a digital camera. Microscopic imaging was performed using Image View (Version 1.9.3) software under optical microscopy (10× eyepiece) with 4× and 10× objective lenses to examine granular sludge, biofilm-carrier sludge, and flocculent sludge, documenting morphological changes through photographic records. Sludge morphology was documented at the conclusion of each salinity phase (0, 15, and 20 g/L).
Fourier Transform Infrared Spectroscopy (FTIR) was employed to identify functional groups in EPS. The extracted Tightly Bound-EPS (TB-EPS) and Loosely Bound-EPS (LB-EPS) were freeze-dried to complete dryness and ground into powder. The dried powder was then mixed with spectroscopic-grade KBr and pressed into pellets for analysis using an FTIR spectrometer (Cary 660 + 620, Agilent, Santa Clara, CA, USA) with a scanning range of 4000–400 cm−1. Major functional groups were identified from the obtained spectra.
Three-dimensional excitation–emission matrix (3D-EEM) fluorescence spectroscopy (Shimadzu Corporation, Kyoto, Japan) was used to quantitatively analyze the fluorescent characteristics of EPS (LB-EPS and TB-EPS). The excitation wavelength (Ex) ranged from 220 nm to 450 nm at 5 nm intervals, while the emission wavelength (Em) ranged from 220 nm to 550 nm at 5 nm intervals. Both excitation and emission slit widths were set at 10 nm with a scanning speed of 1200 nm/min. Deionized water served as the blank, and data were processed using Origin 9.0 software (Origin Lab, Northampton, MA, USA).
EPS extraction and quantification followed Li et al.’s method [16]. TB-EPS and LB-EPS were separately extracted using the heat extraction method [17]. Since EPS primarily consists of polysaccharides (PS) and proteins (PN) [18], the total EPS content was determined as the sum of PN and PS. PN content was measured using the Coomassie Brilliant Blue G-250 method [19], while PS content was determined by the anthrone–sulfuric acid method [20]. Total EPS content equaled the sum of LB-EPS and TB-EPS.
Dehydrogenase activity (DHA) was measured using an improved method based on Yin et al. [21]. After being processed, the sample’s filtrate absorbance was measured at 485 nm after 0.45 μm organic membrane filtration. DHA was calculated using a standard curve.
Specific Anammox Activity (SAA) was determined through batch tests [22]. SAA was calculated as the maximum substrate consumption rate (from concentration–time curves) divided by biomass concentration [23], as detailed in Equation (5) [24]. C0 (mg/L) and Ct (mg/L) represent the initial, time t substrate concentrations in the reactor, respectively. The t (h) represents the reaction time.
SAA = C 0 C t / MLVSS × t   ( mg / ( g   VSS · h ) )
The heme c content was determined using the pyridine hemochrome spectrophotometric method [25]. The heme c concentration was calculated according to Equation (6).
C = 12 × A 550 2 + A 550 3 + A 535 2 + A 535 3 + MLVSS × 23.97
Microbial community analysis was performed using high-throughput sequencing. DNA extraction was conducted using the E.Z.N.A™ Mag-Bind Soil DNA Kit (Omega Bio-tek, Norcross, GA, USA). DNA concentration and purity were quantified using a Qubit® 4.0 Fluorometer (Thermo Fisher) according to the manufacturer’s instructions. All extracted DNA samples met the quality control requirements for sequencing. The V4 region of 16S rRNA genes was amplified using primer pairs 515F (GTGCCAGCMGCCGCGGTAA) and 806R (GGACTACHVGGGTWTCTAAT) [26], with Polymerase Chain Reaction (PCR) amplification and Illumina platform-based high-throughput sequencing performed by Sangon Biotech (Shanghai) Co., Ltd, Shanghai, China.
The gene expression of microorganisms in this experiment was analyzed using metagenomic sequencing. The sludge samples met the same requirements as high-throughput sequencing. After passing the sequencing quality control, raw data were processed by Fastp for quality assessment and filtering at Sangon Biotech (Shanghai) to obtain relatively accurate valid data. Subsequently, sequence assembly was performed using megahit and Bowtie2 for hybrid assembly, yielding relatively complete contigs. Finally, binning was conducted to obtain high-completeness, low-contamination draft single-amplified genomes (SAGs).

3. Results and Discussion

This section may be divided by subheadings. It should provide a concise and precise description of the experimental results, their interpretation, as well as the experimental conclusions that can be drawn.

3.1. Effects of Salinity on Nitrogen Removal Effect of Three Different Forms of Sludge Systems

3.1.1. Variations in Nitrogen Removal by Different Sludge Morphologies Under Identical Salinity Levels

As shown in Figure 1, under gradient salinity conditions (0, 5, 10, 15, 20 g/L), the NH 4 + -N removal performance of reactors R1, R2, and R3 exhibited differential responses, all showing an adaptive lag after salinity increases. At 5 g/L salinity (10–40 d), under stable influent loading, all three reactors experienced a breakthrough release of NH 4 + -N on Day 13, with peak concentrations rising sharply before gradually declining. Concurrently, NO 2 -N and NO 3 -N concentrations display mirroring fluctuations, with amplitudes similar to NH 4 + -N variations.
When salinity increased to 10 g/L (41–86 d), nitrogen removal performance further diverged. R1 and R3 showed a sudden NH 4 + -N surge on Day 45, stabilizing at ~17.31 mg/L and ~37.92 mg/L, respectively, while R2 exhibited gradual NH 4 + -N accumulation over 17 days (41–58 d) before declining to ~32.94 mg/L. Notably, NO 2 -N accumulation varied significantly, with R3 peaking highest (69.56 mg/L), followed by R1 (36.60 mg/L), while R2 showed minimal fluctuation. Additionally, NO 3 -N concentrations in all reactors first rose then fell, suggesting that salinity may have stimulated salt-tolerant nitrifiers, enhancing nitrification.
At 15 g/L salinity (87–126 d), R1 maintained stable NH 4 + -N levels, whereas R2 and R3 experienced sharp NH 4 + -N accumulation (peaking at 84.16 mg/L and 99.17 mg/L on Days 95 and 96, respectively). Subsequently, R2 and R3 showed synchronized NH 4 + -N trends, with brief responses to influent fluctuations during 118–120 d. By the phase’s end, NH 4 + -N dropped to 4.30 mg/L (R1), 16.48 mg/L (R2), and 14.78 mg/L (R3). Meanwhile, NO 2 -N rapidly declined to near 0 mg/L after brief spikes, indicating efficient conversion via nitrite-oxidizing bacteria (NOB)–AnAOB synergy. In contrast, NO 3 -N remained stable (R1: 62.08 mg/L; R2: 75.99 mg/L, R3: 72.78 mg/L), demonstrating nitrification robustness under high salinity.
At 20 g/L (127–171 d), external water-quality disruptions (e.g., residual chlorine from lab shutdowns) altered microbial metabolism. NO 3 -N initially fell near detection limits but rebounded from Day 136, while NH 4 + -N degradation deteriorated—R1 and R2 peaked at 89.82 mg/L and 92.94 mg/L (Day 145) before dropping to 18.18 mg/L and 34.04 mg/L within 3 days. Notably, NO 2 -N conversion remained efficient (>93%), whereas NO 3 -N followed a “V-shaped” trend, possibly due to selective anammox inhibition by disinfectant byproducts, favoring denitrifiers [27].
Three reactors exhibited regular adaptation patterns during salinity increases. As salinity rose from 5 to 20 g/L, NH 4 + -N degradation lag times prolonged from 3 days (5–10 g/L) to 4 days (15 g/L) and 11 days (20 g/L). This hysteresis correlated with inoculum microbial composition, EPS secretion, and granule structure. Regarding conversion dynamics (Figure S4), each salinity increase caused transient NH 4 + -N conversion declines; R1 performed best (minimal drop, except at 15 g/L) and R3 was most sensitive. Specifically, R1 maintained >90% conversion with rapid recovery, R2 stayed >80% but fluctuated more, and R3 showed greater declines and delayed recovery. At 20 g/L, R3 displayed unique ‘delay–decline–recovery’ curves, reflecting microbial functional restructuring under high salinity.
The salinity dependence of nitrogen’s convergence was evident in Figure S4 Throughout the experiment, NO 2 -N conversion remained excellent at 10–15 g/L (R1: 97.34%; R2: 97.78%; R3: 93.99%), while NH 4 + -N conversion fluctuated more markedly. This disparity suggested that NOB had stronger salinity tolerance than ammonia oxidizing bacteria (AOB), making ammonia oxidation the rate-limiting step. R1’s superior adaptation likely stemmed from unique microbial ecology, requiring molecular verification. All reactors could handle salinity stress, but the differences in their recovery speeds directly reflect variations in the types and functions of the microbes inside.
With rising salinity, NH 4 + -N conversion decline lag times prolonged significantly. At 20 g/L, compounded stress (residual chlorine and high salinity) accentuated recovery differences; R1 rebounded fastest (98.36% → 48.54% → 91.30% in 3 days), while R2 reached 80.64% quickly but took longer for full recovery, possibly due to its hybrid foam-carrier and partially granulated structure—transitional morphology offered moderate resilience but less robustness than R1’s mature granules. R3 showed distinct linear decline (98.68% → 60.26% over 15 days) and limited recovery (77.51%), indicating poor adaptation to compound stress.
Notably, at 15 g/L, R1 demonstrated exceptional stability with sustained above 90% NH 4 + -N conversion. This performance likely arose from its granular sludge structure; accumulated EPS formed protective barriers, while dense granules provided salinity-resistant microenvironments. This aligned with Figure S5’s TN data—R1’s effluent TN stability surpassed R2/R3, with synchronized NH 4 + -N and NO 2 -N conversion.
Overall TN trends showed stable average conversion pre-20 g/L (R1: 78.93%; R2: 73.40%; R3: 71.77%). At 20 g/L, despite NH 4 + -N recovery, rising NO 3 -N increased effluent TN and reduced conversion. This nitrogen profile shift implied microbial succession; initial salinity gradients eliminated non-tolerant strains, while 20 g/L extreme conditions favored salt-tolerant heterotrophic nitrifiers, dominating nitrogen pathways. Thus, even with partial ammonia oxidation recovery, overall nitrogen removal efficiency declined due to restructured nitrifier communities and redistributed metabolic pathways.

3.1.2. Variations in NRR and NRE of Different Sludge Morphologies Under Varying Salinity Levels

As illustrated in Figure 2, the three reactor systems exhibited distinct responses in NRR to salinity changes. Under initial salt-free conditions, R1, R2, and R3 demonstrated comparable NRR levels, indicating the homogeneity of the inoculated sludge in conventional environments. When salinity increased to 5 g/L, system behaviors began to diverge; R1 and R3 displayed typical “V-shaped” recovery curves during 10–25 d, while R2 showed a unique two-phase response due to its biofilm carrier characteristics. Specifically, R2 initially experienced a 23.05% NRR reduction caused by bubble entrapment from excessive biofilm thickness, but after carrier replacement, improved mass transfer conditions restored NRR to 0.85 ± 0.03 kgN·m−3·d−1 within 7 days, comparable to R1 (0.87 ± 0.02 kgN·m−3·d−1) and R3 (0.84 ± 0.04 kgN·m−3·d−1).
At 10 g/L salinity, sludge morphology differences led to more pronounced divergence. Data from 41 to 57 d revealed that the granular sludge system (R1) had only a 17.7% NRR decline, significantly lower than the 36.3% reduction in the floccular sludge system (R3), while the biofilm carrier system (R2) exhibited intermediate behavior (17.6% decline). This gradient (R1 > R2 > R3) confirmed the decisive role of sludge structure in salinity tolerance. Notably, when influent NO 2 -N concentration increased by 40% during 60–69 d, all three systems showed synchronized NRR improvements (28–35%), suggesting that nitrite availability was the key limiting factor for denitrification within this salinity range. This implied similar metabolic pathways among the functional microbial communities in these systems.
During the 15 g/L salinity phase, R1 demonstrated exceptional stability with <5% NRR fluctuation, outperforming R2 (29.5% fluctuation) and R3 (38.1% fluctuation). Although R2 and R3 experienced sharp NRR drops initially (29.5% and 38.1%, respectively), both recovered to baseline levels within 72 h, likely due to activated osmoregulation mechanisms. It is worth noting that the synchronized NRR decline (average 12.71%) during 117–120 d directly correlated with reduced influent NO 2 -N concentration, reaffirming the regulatory role of substrate availability in system performance.
The 20 g/L salinity phase introduced more complex response patterns. During 132–145 d, synergistic effects of residual chlorine and disinfection byproducts selectively inhibited AnAOB and nitrifying bacteria, temporarily shifting the systems to denitrification-dominated pathways. This was evidenced by a 42% decrease in NO 3 -N concentration alongside a 53–61% NRR reduction. Upon restoring normal influent conditions, recovery kinetics varied markedly; R1 regained 92% of its original NRR within 9 days, while R3 required 21 days to recover only 79%. This recovery gradient (R1 > R2 > R3) aligned closely with each system’s sludge characteristics, further validating the critical role of granular structure in maintaining system stability.

3.1.3. Variations in Anammox Stoichiometric Ratios of Different Sludge Morphologies Under Varying Salinity Levels

The theoretical stoichiometric ratio for the anammox reaction is ∆ NH 4 + -Nconsumption:∆ NO 2 -Nconsumption:∆ NO 3 -Nproduction = 1:1.32:0.26. As shown in Figure S6, prior to 20 g/L salinity, the observed Δ NO 2 -N:Δ NH 4 + -N ratio was significantly lower than the theoretical value of 1.32, while the Δ NO 3 -N:Δ NH 4 + -N ratio exceeded the theoretical 0.26. This phenomenon indicates that under salinity conditions ≤ 15 g/L, metabolic competition consistently existed between nitrifying bacteria and AnAOB. Specifically, during the 5 g/L salinity phase, the Δ NO 2 -N:Δ NH 4 + -N ratios in all three reactors (R1: 1.09; R2: 1.11; R3: 1.11) deviated from the theoretical value, accompanied by elevated NO 3 -N production (60.00 ± 2.35 mg/L), confirming the competitive utilization of nitrite by conventional nitrification pathways. This competitive relationship underwent dynamic changes during the 10–15 g/L salinity phase. As salt-tolerant nitrifiers became enriched, the Δ NO 2 -N:Δ NH 4 + -N ratio gradually approached the theoretical value (1.28 ± 0.05), while NO 3 -N production increased by 35.7%, reflecting microbial community restructuring under salinity selection pressure. Notably, when influent NO 2 -N concentration increased during Days 60–69, effluent NO 3 -N concentration rose correspondingly, providing direct evidence of nitrifying bacteria’s competitive advantage through this dose–response relationship.
Upon reaching 20 g/L salinity, the stoichiometric ratios exhibited anomalous reversal; the ∆ NO 2 -N:∆ NH 4 + -N ratio exceeded the theoretical 1.32, while the ∆ NO 3 -N:∆ NH 4 + -N ratio decreased to 0.08 ± 0.03. When cross-referenced with the literature [27], this abnormality can be attributed to selective inhibition of anammox key enzymes (hydrazine dehydrogenase) by residual chlorine, which impeded N2H4 conversion to N2 while allowing relatively tolerant denitrifiers to become the dominant microbial population. After chlorine interference was eliminated, the stoichiometric ratios returned to fluctuate near theoretical values, though significant variations (1.32–1.67) have been reported across different studies [28]. This variability may stem from interactions among reactor types, operational parameters, and inoculated sludge characteristics. The particularly high NO 2 -N consumption observed in this study suggests salinity acclimation-induced functional differentiation of microbial communities, which requires further validation through metagenomics or other molecular approaches. These findings provide new insights into the redistribution of nitrogen transformation pathways under salinity stress and offer guidance for optimizing high-salinity wastewater treatment processes.

3.2. Effects of Salinity on Physical Characteristics of Three Sludge Morphologies

3.2.1. Influence of Salinity on Sludge Concentration

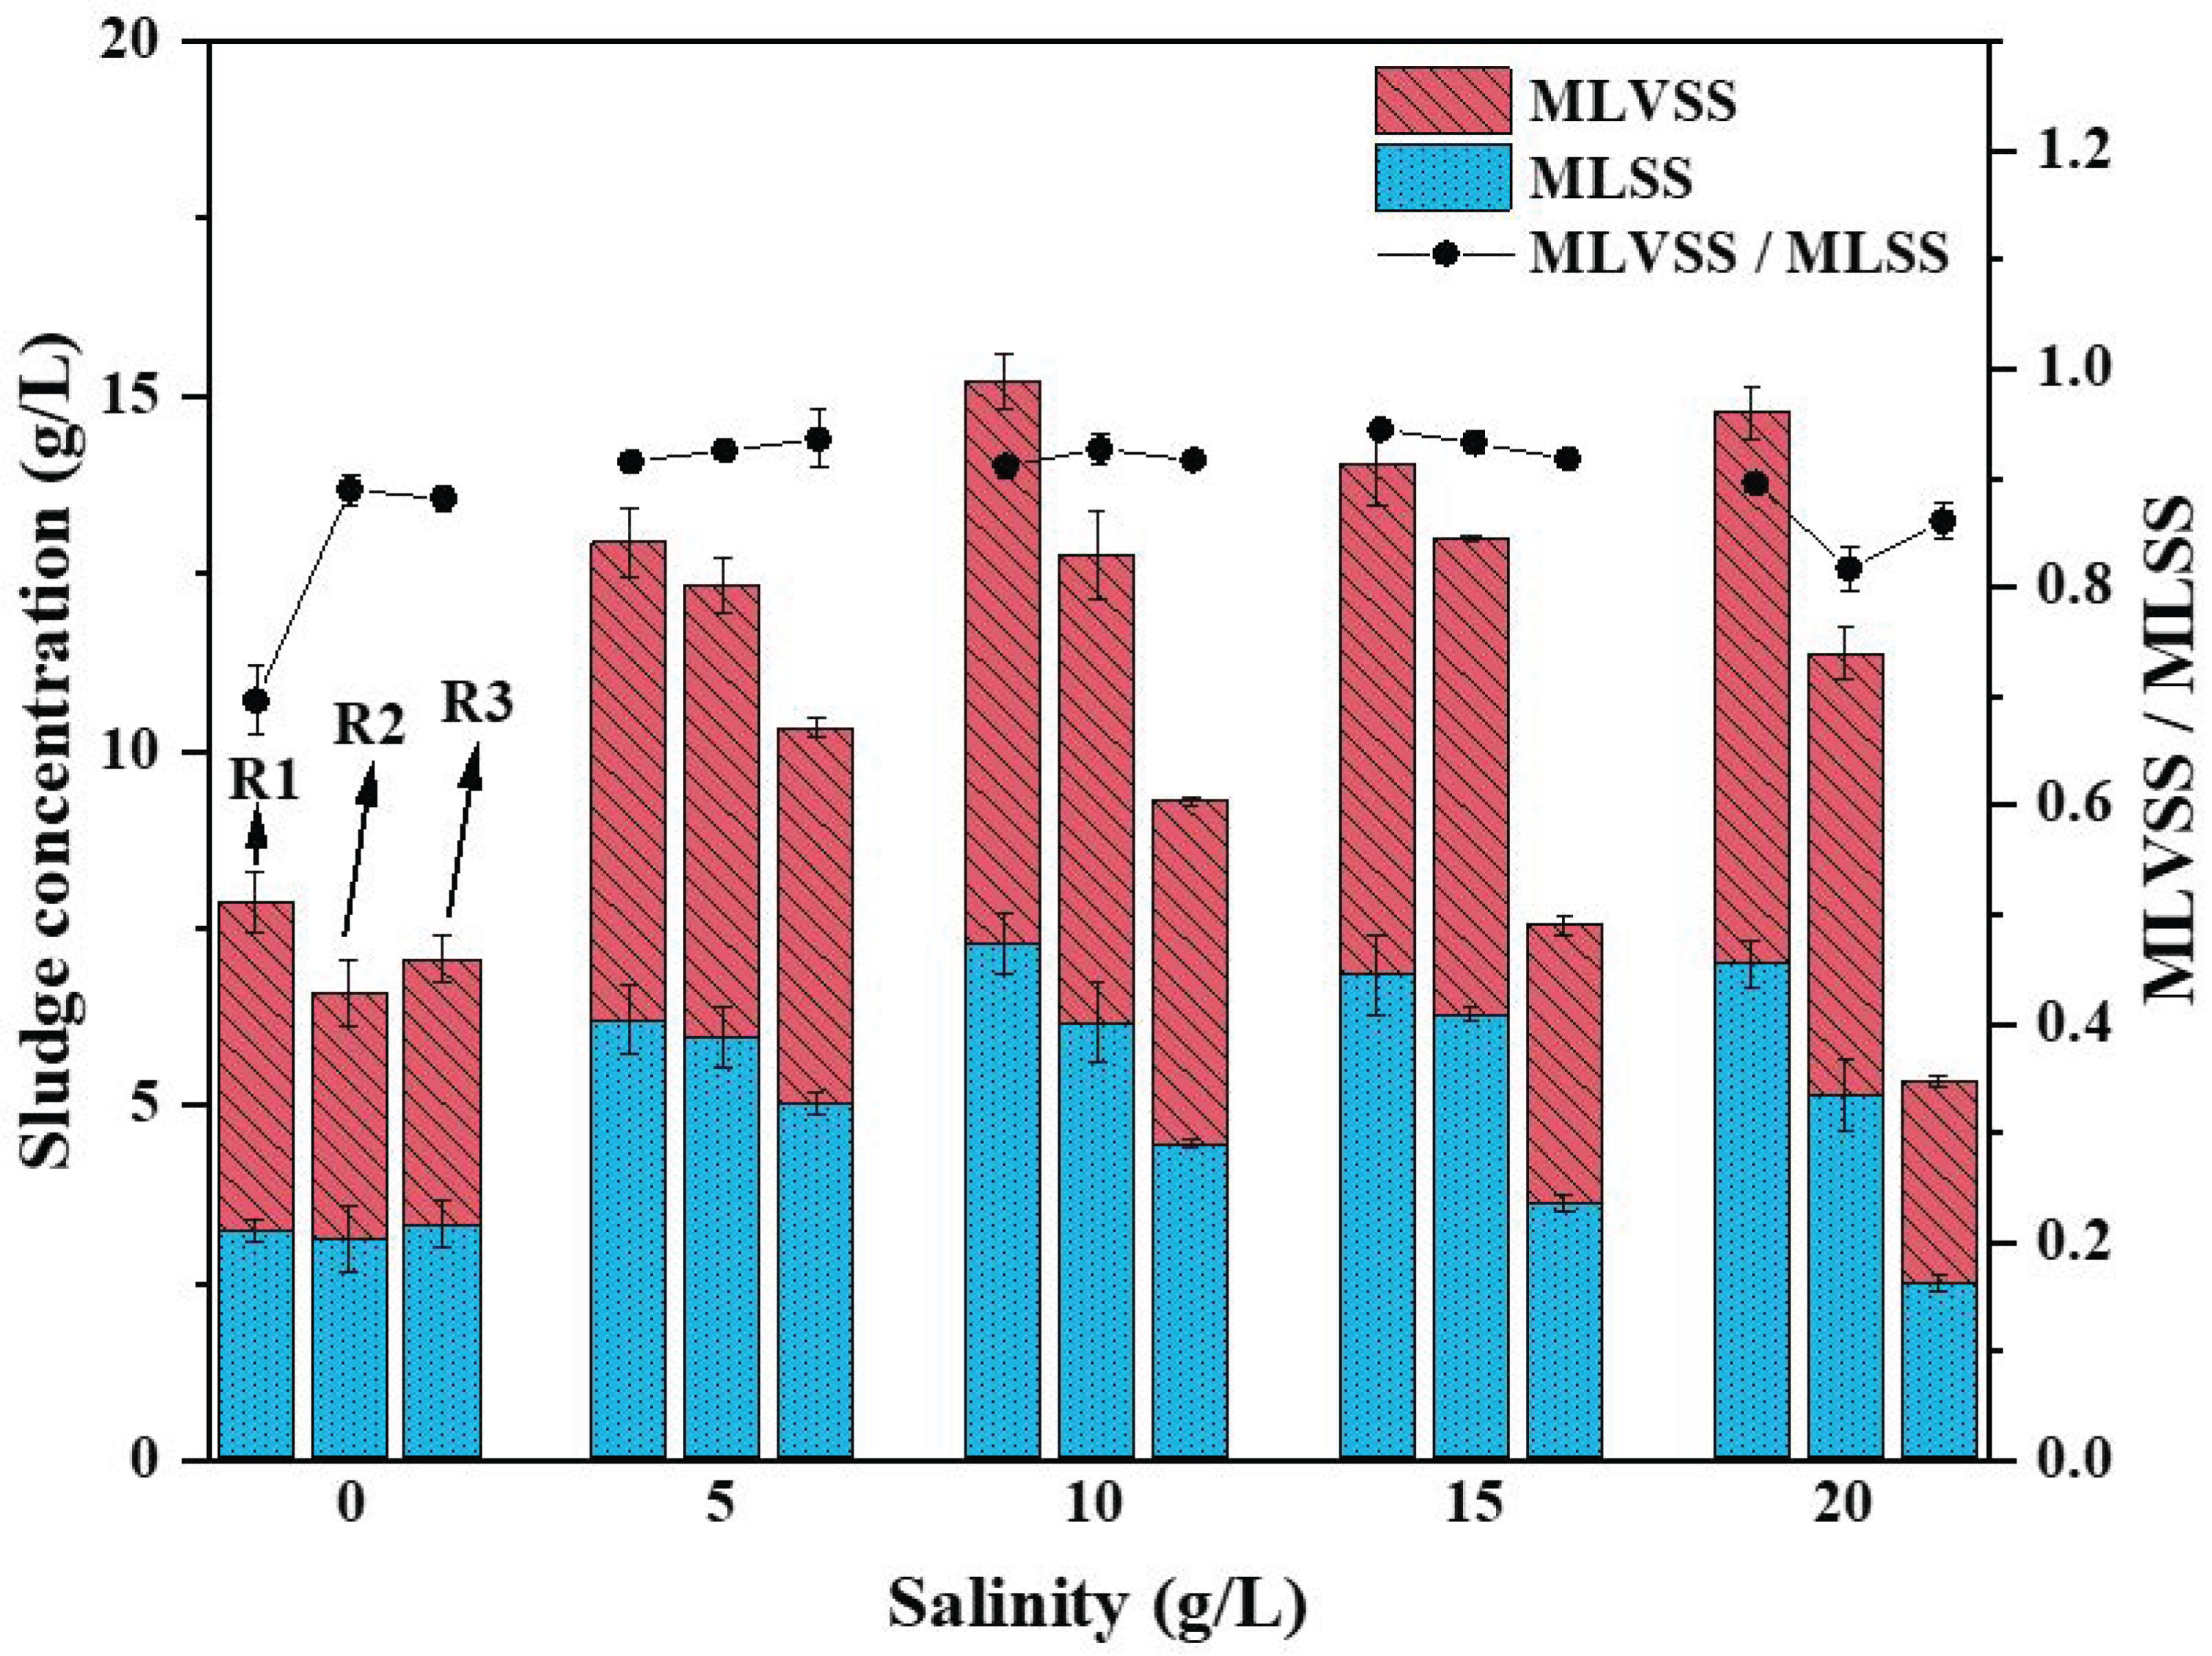
This study systematically monitored sludge characteristic variations in UASB reactors under different salinity conditions, revealing intrinsic relationships between sludge morphology and salinity adaptability. Considering the unique hydraulic characteristics of UASB reactors and salinity-induced sludge compression effects, we innovatively adopted a gravimetric method to determine total MLSS and MLVSS, with standardized calculations based on effective reactor volume, effectively avoiding potential biases associated with conventional measurement approaches.
As shown in Figure 3, during the initial phase, all three reactors demonstrated consistent sludge concentrations (R1: 3.21 g/L; R2: 3.08 g/L; R3: 3.29 g/L). When salinity increased to 5 g/L, all systems exhibited biomass growth trends, with MLVSS increases ranked as R1 (2.96 g/L) > R2 (2.83 g/L) > R3 (1.68 g/L). This pattern likely originated from low-salinity stimulation on microbial growth and the structural advantages of granular sludge. At 10 g/L salinity, morphological influences became more pronounced. R1’s MLVSS continuously increased to 7.24 g/L, confirming granular structure’s effectiveness in maintaining metabolic activity; R2 maintained stable biomass (6.12 ± 0.15 g/L) through carrier interception; while R3 showed 0.55 g/L MLVSS reduction due to floc loss, directly attributable to its loose structural characteristics.
Under 15 g/L salinity, microbial communities faced intensified environmental stress. R1 and R3 systems displayed 6.1% and 18.8% MLVSS decreases, respectively, while R2 surprisingly achieved 2.1% growth. This divergence demonstrated the remarkable dual-protection effect (carrier interception + bottom sludge) in carrier systems, with granular sludge exhibiting significantly lower loss rates than floccular sludge. Final data under extreme salinity (20 g/L) showed R1 (6.96 g/L) > R2 (5.09 g/L) > R3 (2.45 g/L), where R1 maintained 117% biomass growth even after disinfection byproduct shock, conclusively proving granular sludge’s adaptive superiority in high-salinity environments.
Changes in sludge activity index (MLVSS/MLSS) further corroborated these findings. At 5 g/L salinity, the universal increase in ratios confirmed the stimulating effect of low salinity on metabolic activity. During medium-high salinity phases (10–15 g/L), the continuous increase in R1’s ratio reflected the enrichment of salt-tolerant populations, while R2 and R3 remained stable. Under extreme 20 g/L conditions, all systems showed ratio decreases of 0.08–0.12, indicating synergistic inhibition between disinfection byproducts and high salinity. These results collectively demonstrate that during salinity acclimation, granular sludge achieves optimal biomass retention and activity balance through its physical structural advantages (dense structure and abundant EPS) and biological selection effects. This finding provides crucial guidance for sludge selection in high-salinity wastewater treatment systems.

3.2.2. Effects of Salinity on Macroscopic Sludge Morphology

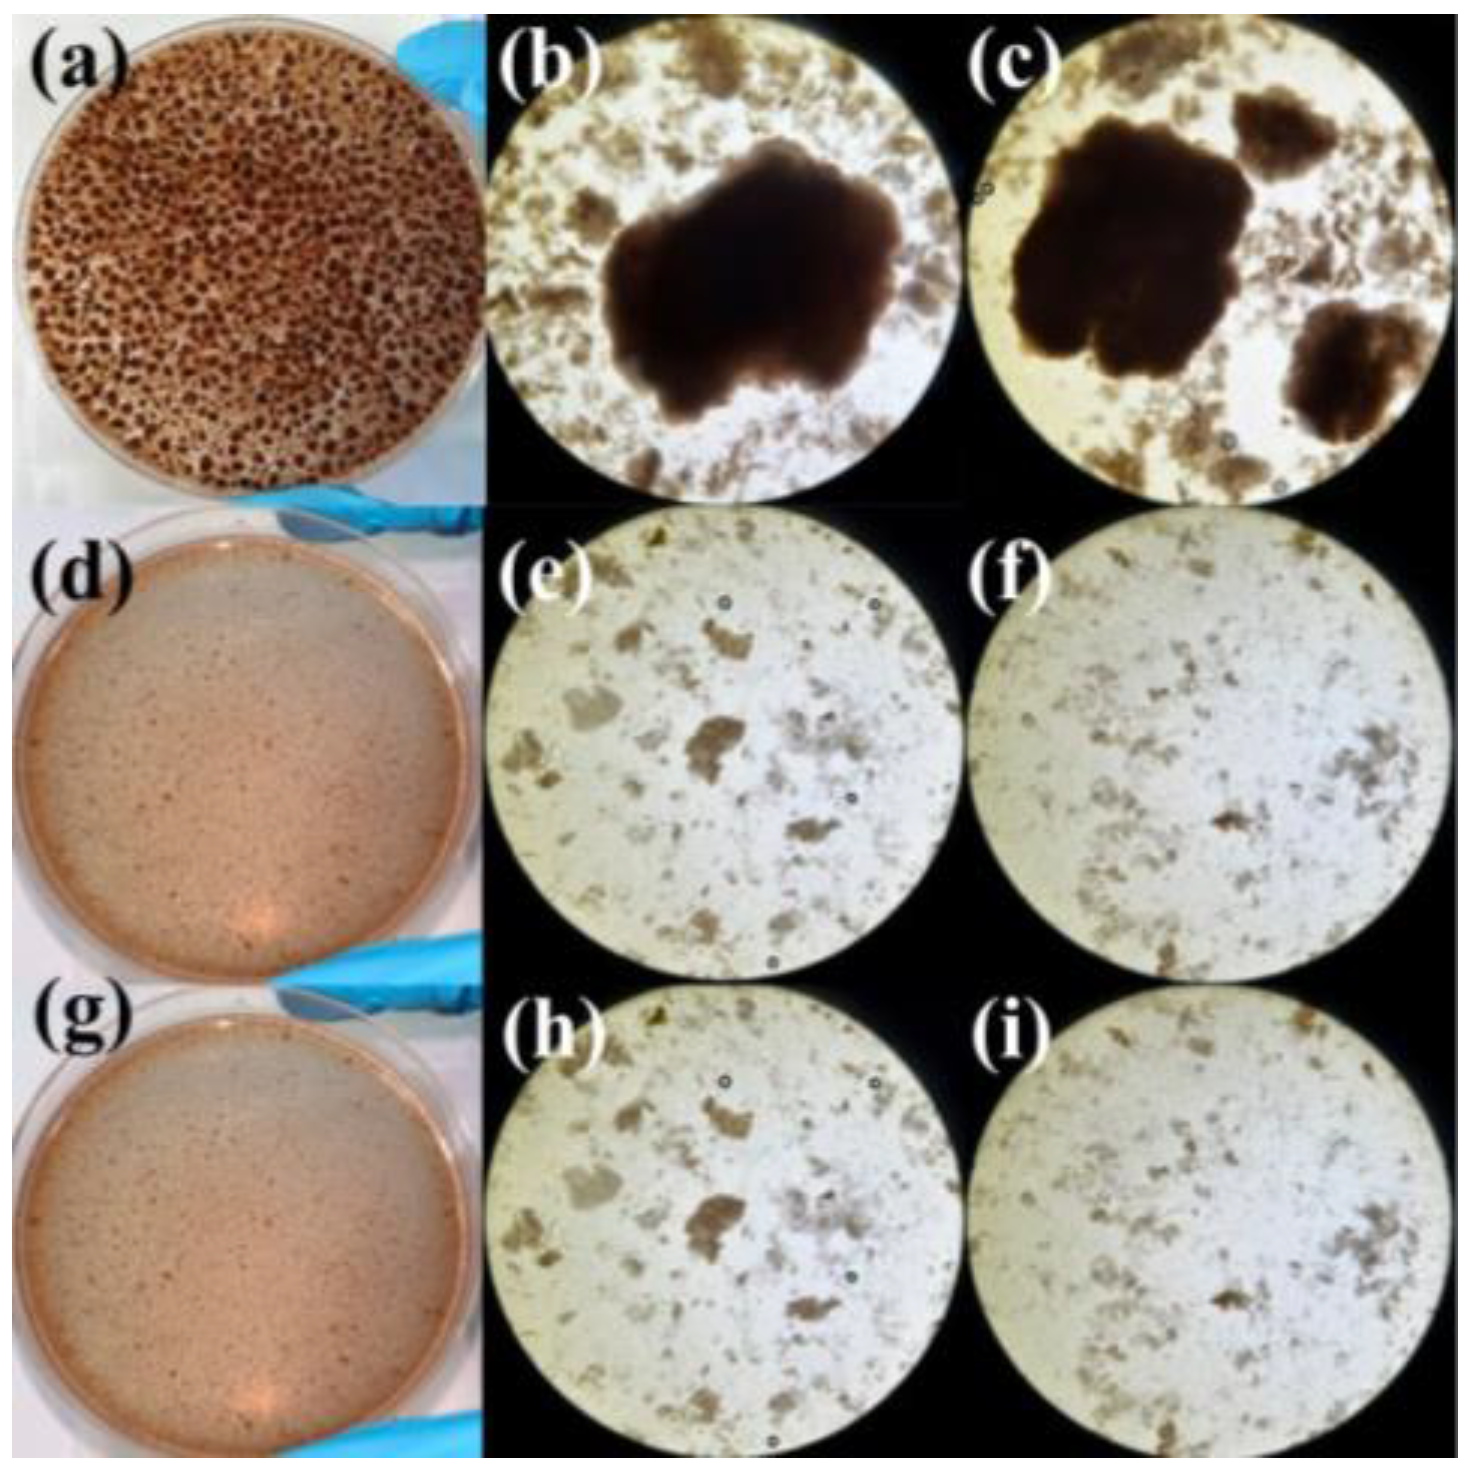
Systematic observations revealed the evolutionary patterns of different sludge morphologies under salinity gradients. The initially inoculated granular sludge (Figure 4a) exhibited uniform brownish-red distribution with an average particle, which completely transformed into loose flocculent structure after grinding (Figure 4d). Following acclimation to 15 g/L salinity, the R1 reactor’s granular sludge (Figure S7a) showed significant physicochemical alterations: a 30–40% reduction in particle size, color change from brownish-red to dark brown, and increased surface roughness. These changes are consistent with the well-documented phenomenon of microbial cell dehydration and inorganic salt precipitation under osmotic stress, which can weaken the structural integrity of granules [29]. These changes intensified under 20 g/L salinity (Figure 5a), with approximately 25% reduction in granule quantity and abundant small reddish-brown particles appearing, indicating granule disintegration and microbial community restructuring under high salinity.
R2 and R3 reactors’ flocculent sludge demonstrated distinct granulation pathways during salinity acclimation. At 15 g/L salinity, the R2 system (Figure S7d) formed numerous brownish-red to dark brown granules, while the R3 system (Figure S7g) developed only limited granular structures, maintaining predominantly loose flocs. The enhanced granulation in R2 is likely attributable to the carrier material, which provides a protected niche and attachment surface, facilitating microbial aggregation and the secretion of EPS that are crucial for building a stable architecture under stress conditions [30]. Upon reaching 20 g/L salinity, the R2 system showed a 40% granule reduction but increased small particle density (Figure 5d), whereas the R3 system (Figure 5g) displayed more dispersed state with further reduced dark brown granules and over 85% floc content. This morphological differentiation confirmed the stabilizing effect of carrier materials on sludge structure.

3.2.3. Effects of Salinity on Micromorphology of Sludge

Microscopic observations revealed more detailed morphological evolution mechanisms. The original granular sludge (Figure 4b,c) exhibited a dense core structure with “fuzzy” edges, primarily composed of EPS and microbial cells. At 15 g/L salinity, R1 sludge (Figure S7b,c) showed significant structural reorganization; granules became composed of multiple subunits with thinned edges and visible fissures. This “fragmentation” characteristic became more pronounced at 20 g/L salinity, with enhanced granule translucency indicating increased internal porosity, a potential sign of cell lysis or EPS hydrolysis under severe osmotic pressure [31].
R2’s flocculent sludge formed granule-like structures at 15 g/L salinity (Figure S7e,f), but with higher porosity than R1 granules. At 20 g/L (Figure 5e,f), its core region became compact while maintaining loose aggregates at the periphery, suggesting a protective mechanism where a dense core is maintained for critical microbial functions while the periphery may sacrifice structure to dissipate salt stress. R3 demonstrated the most unique evolution: forming “grape cluster”-like aggregates lacking complete EPS encapsulation at 15 g/L (Figure S7h), which further dispersed into “small fragments”, with some areas showing new layers at 20 g/L (Figure 5h). Notably, R3 developed abundant filamentous bacteria (200–500 μm in length), forming network structures at 20 g/L (Figure S8), likely representing an ecological strategy for high-salinity adaptation. The proliferation of filamentous bacteria is often observed in stressed environments, as their large surface area-to-volume ratio can be advantageous for nutrient uptake under diffusion-limited conditions and their network can help maintain the overall structure of the microbial community [32,33].
These microscopic changes correlated well with macroscopic performance; R1 maintained stability through core structure preservation, R2 achieved partial granulation via carrier support, while R3 transitioned to a filament-dominated loose structure. These morphological adaptation differences provide a structural basis for understanding the salinity tolerance mechanisms of different systems. Meanwhile, different fixed forms are also important factors influencing the differentiated performance of reactors [34].

3.3. Effects of Salinity on Chemical Characteristics of Three Sludge Morphologies

3.3.1. Regulation Mechanism of Salinity on Formation and Function of EPS

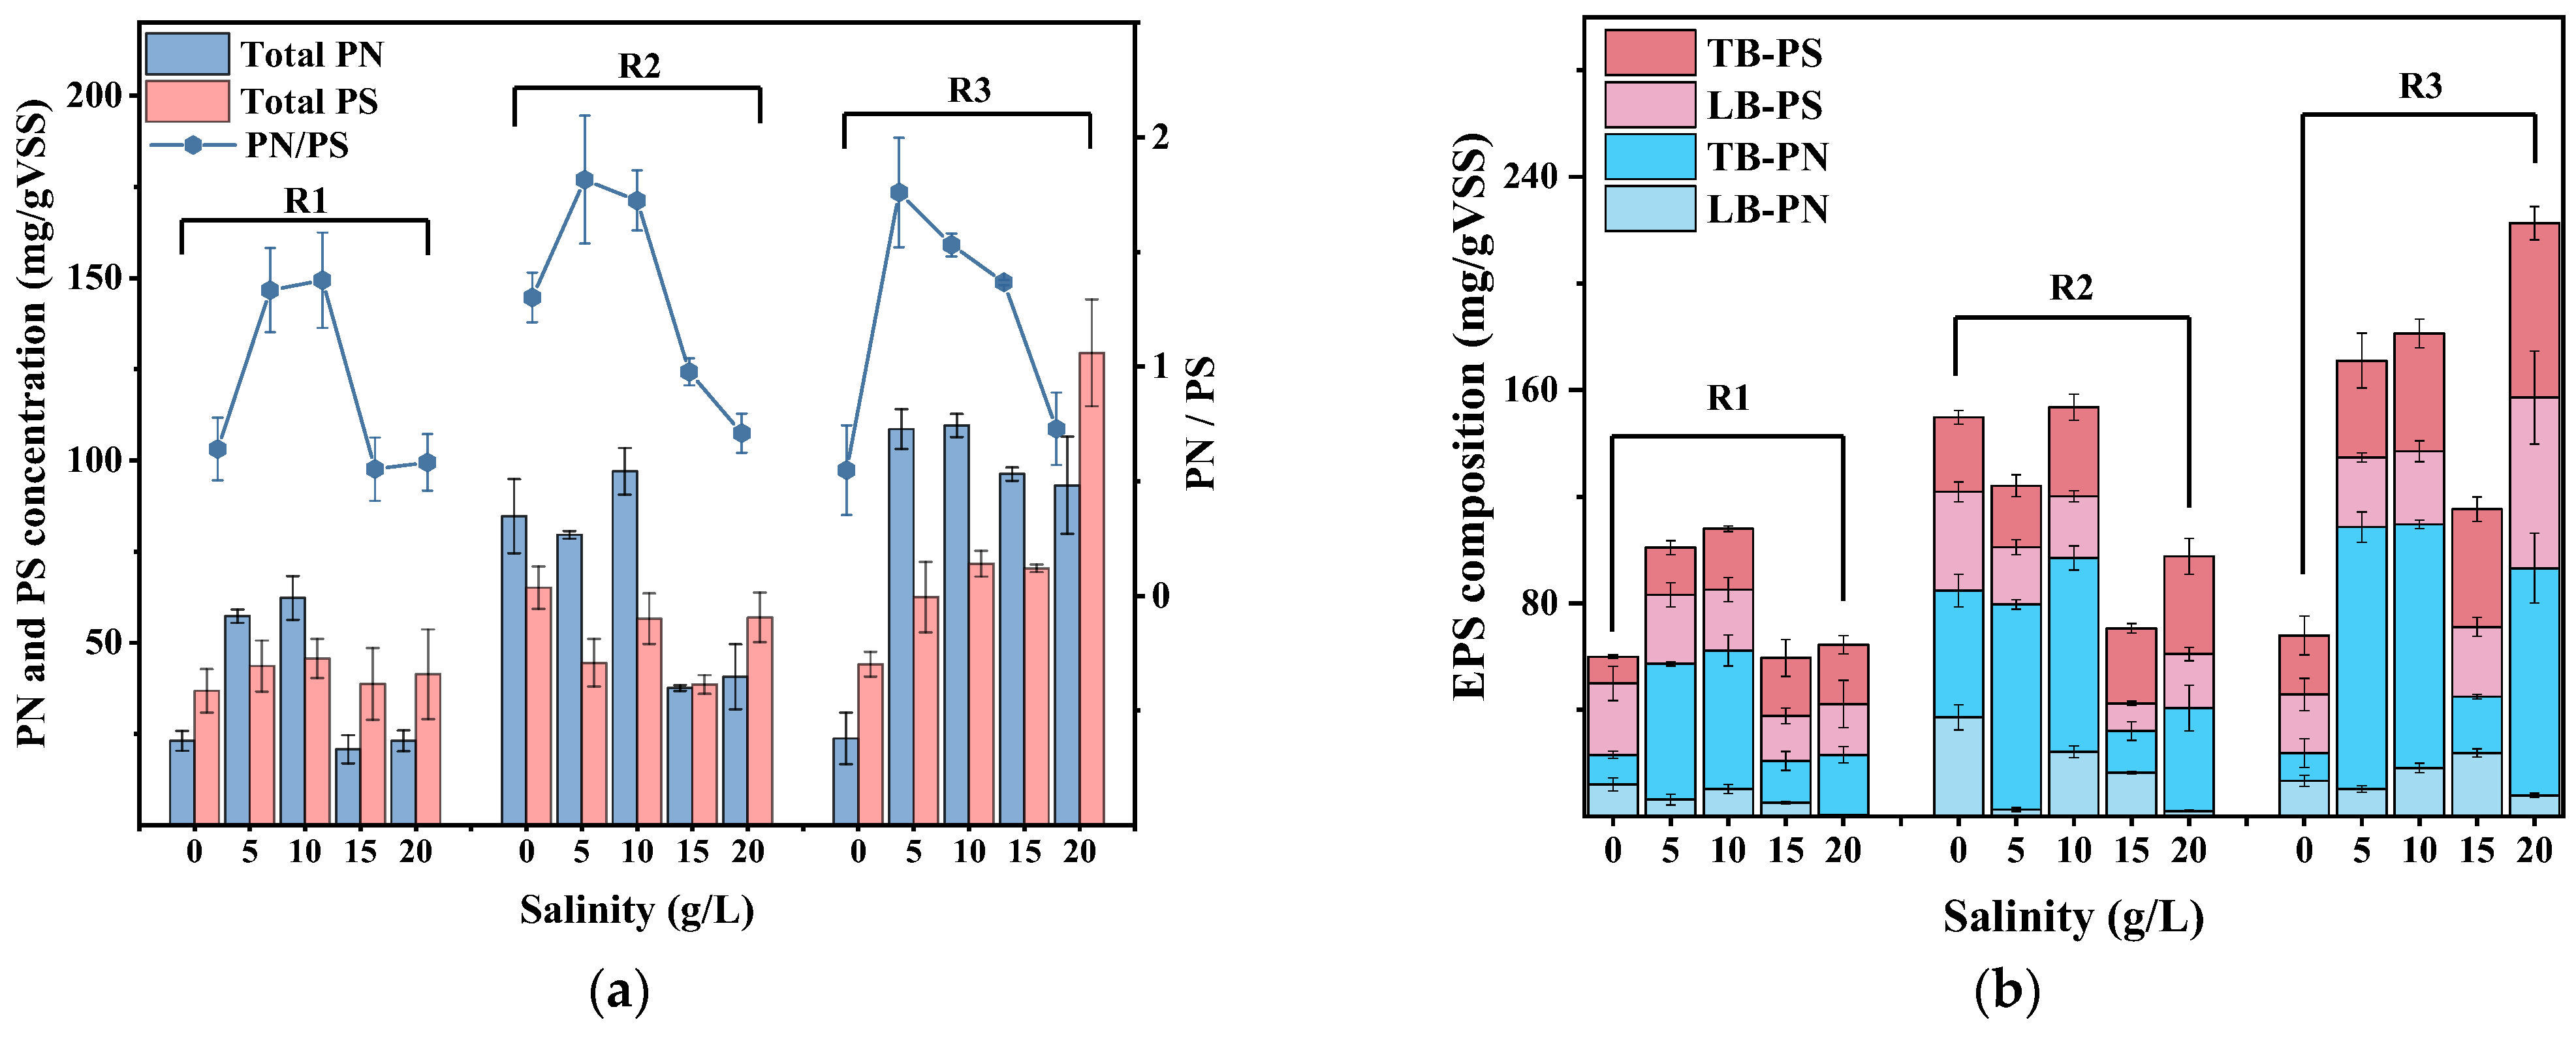
This study systematically elucidates the regulatory patterns of salinity gradients on EPS composition and function, and their impact on sludge aggregation morphology (Figure 6). Experimental data reveal that salinity variations significantly alter EPS compositional characteristics and spatial distribution, consequently affecting sludge physicochemical properties. Under initial salt-free conditions, different reactor systems already exhibited distinct EPS composition patterns; R1 and R3 systems showed PS-dominant characteristics (PN/PS < 1), while R2 system, due to biofilm carrier presence, displayed PN dominance (PN/PS = 1.31 ± 0.11), reflecting the special requirements of microbial attachment behavior on carrier surfaces.
When salinity increased to 5–10 g/L, all three systems demonstrated significant EPS synthesis responses, though with distinct characteristics. The R1 system showed a 35.70% increase in TB-EPS, with TB-PN surging by 82.30%, elevating the PN/PS ratio from 0.64 to 1.37. The R3 system exhibited 2.1-fold total EPS growth, with TB-PN dramatically increasing from 23.73 to 109.58 mg/gVSS. The R2 system maintained high PN levels (PN/PS ≈ 1.76), with TB-PN proportion rising to 68%, attributable to the biofilm’s requirement for more EPS to maintain its structure. These changes correlate well with microscopic observations, confirming that PN-mediated hydrophobic interactions play a key role in sludge aggregation: stabilizing granular structures in R1 and driving floc-to-granule transformation in R3. Notably, TB-EPS (particularly TB-PN) became the primary response target during this phase, with variation magnitudes 3–5 times greater than LB-EPS, indicating salinity primarily regulates sludge aggregation behavior through tightly bound layers.
During the next salinity phase (15–20 g/L), significant divergence in EPS responses emerged among the systems. Both R1 and R2 systems exhibited decreased TB-PN levels, reducing PN/PS ratios to below 0.8. This decline in surface hydrophobicity directly correlated with observed structural loosening. In contrast, R3 demonstrated unique PS accumulation (+45%), with LB-PS increasing by 62% to form a “hydrophilic shell”, explaining its final fragmented structure. All systems showed a 30–40% reduction in TB-EPS, indicating that high salinity disrupted EPS cross-linked networks. These findings not only confirm PS’s central role in osmoregulation but also reveal the regulatory mechanism of PN/PS dynamic balance on structural stability, marking the first report of LB-EPS’s special stabilizing effect on floc structures under high salinity.
These results deepen our understanding of microbial response mechanisms to salt stress and provide crucial guidance for optimizing high-salinity wastewater treatment; targeted manipulation of salinity gradients can shape EPS composition and consequently control sludge aggregation morphology, offering practical engineering significance for sludge granulation control. Future research could employ proteomics and other advanced techniques to further elucidate functional mechanisms of key proteins and their molecular roles in sludge aggregation processes.

3.3.2. 3D-EEM and FTIR Characterization Analysis

Both 3D-EEM and FTIR analyses provided molecular-level insights into salinity-induced EPS modifications. As shown in Figures S9 and S10, characteristic protein-associated fluorescence peaks (Peak A/B) in 3D-EEM spectra exhibited notable red-shifts (up to 32 nm), indicating the introduction of polar groups under osmotic stress [35].
This was corroborated by FTIR, which confirmed hydroxyl group enrichment (1080→1137 cm−1 shift) and intensified amide I bands (1638 cm−1), suggesting changes in protein secondary structures crucial for stability [36,37]. Furthermore, a key adaptation strategy was the enhanced synthesis of hydrophobic groups (e.g., C-H at 2964 cm−1) within the TB-EPS fraction, which facilitates microbial aggregation and granulation by reducing hydrophilicity and strengthening hydrophobic interactions [38]. These structural modifications—increased protein-related polarity and hydrophobicity—collectively demonstrate a microbial ecological strategy to counteract ionic stress by reinforcing the physical scaffold of the sludge.
Further analysis suggested that microorganisms may maintain osmotic balance through multiple mechanisms under salinity stress: increasing tyrosine/tryptophan protein synthesis to enhance structural stability while potentially producing compatible solutes such as ectoine and trehalose [39]. Future research could integrate proteomic analysis to further elucidate the functional roles of specific proteins in salinity adaptation.

3.3.3. Response of DHA, SAA, and Heme C to Salinity Stress

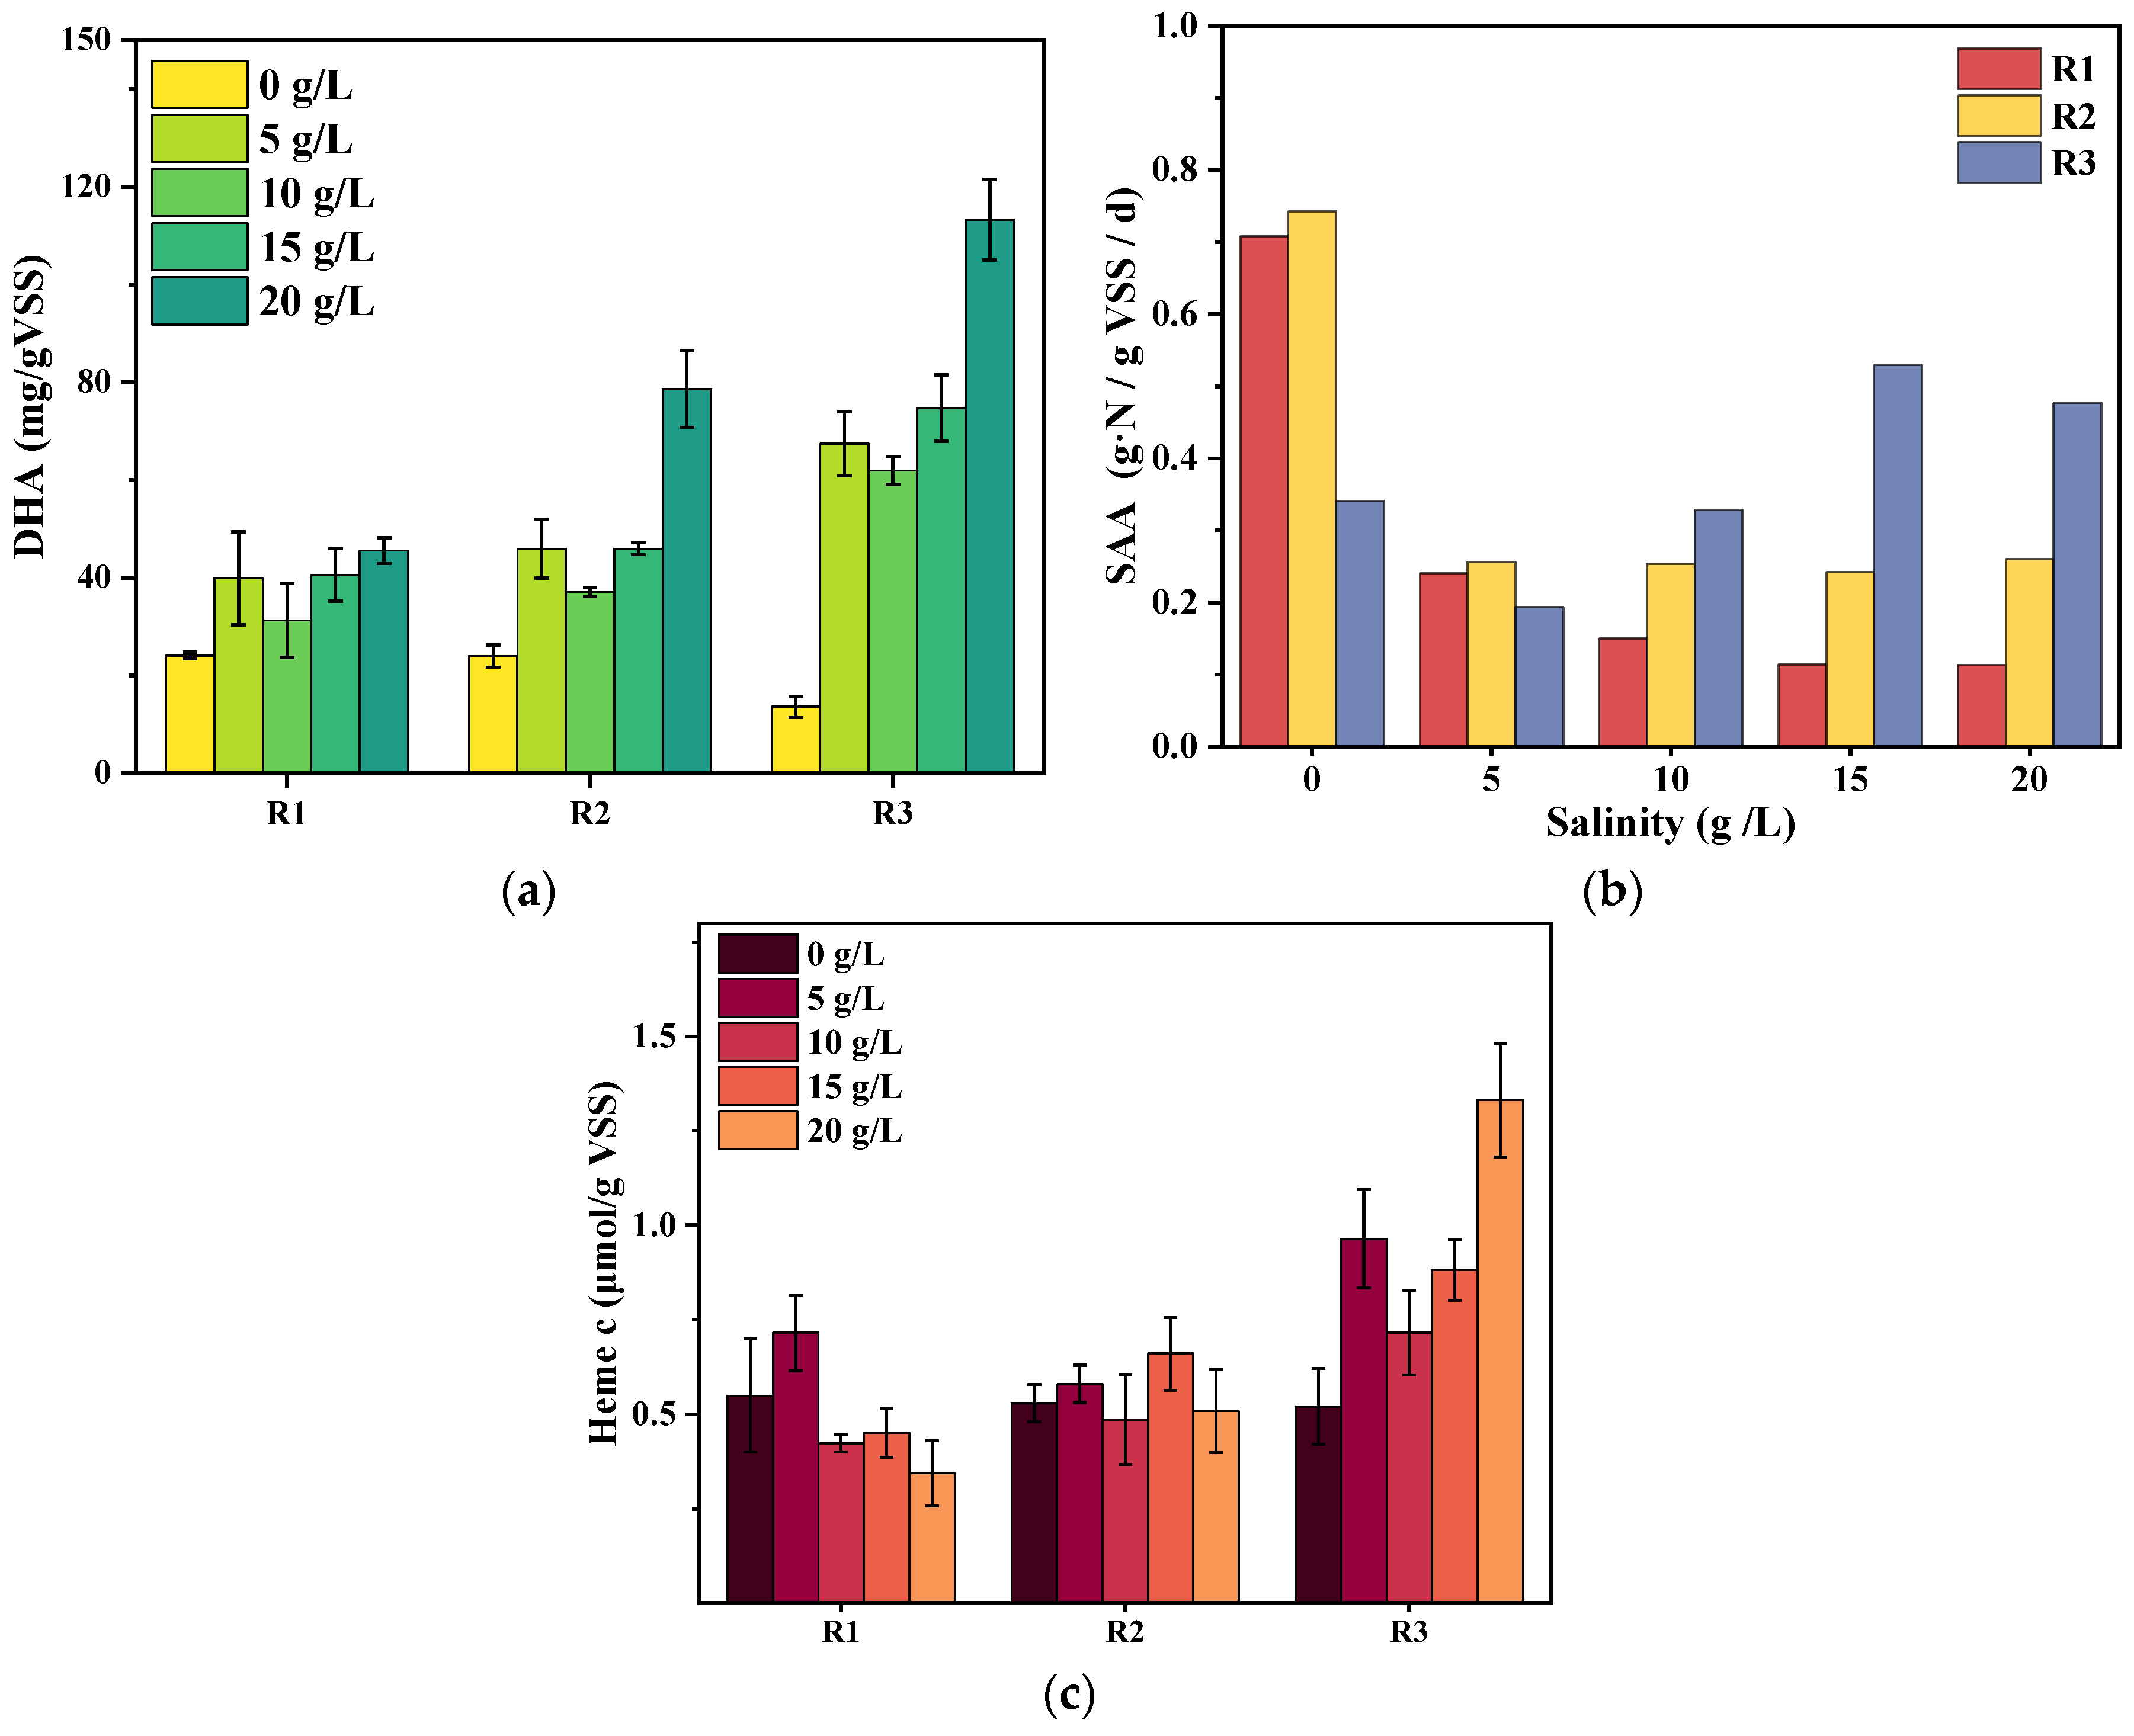
Figure 7a shows DHA dynamics, a key indicator of heterotrophic microbial activity and organic removal capacity [40]. During initial salinity increase (0–5 g/L), all systems showed significant DHA increases (R1: 15.82; R2: 21.94; R3: 53.81 mg/g VSS). Notably, floccular sludge (R3) exhibited stronger response (163% increase) than granular sludge (R1), possibly due to higher sensitivity of loose structures. This initial stimulation could be attributed to the enhanced metabolic activity of halotolerant heterotrophs or the onset of osmoregulatory mechanisms that require increased energy expenditure [41]. At 5–10 g/L, DHA decreased following R1(−8.65) > R2(−8.28) > R3(−5.49) mg/g VSS, consistent with sludge density, confirming granulation-induced mass transfer resistance inhibits heterotrophs.
At 15 g/L, systems showed divergent responses; R1 granules regained 6.2% DHA through structural reorganization, while R2/R3 showed continuous increases via salt-tolerant heterotroph enrichment. Under extreme salinity (20 g/L), differentiation intensified; R1 showed minor fluctuation (+4.98 mg/g VSS) while R2/R3 exhibited significant increases (32.67/38.54 mg/g VSS), related to salt-tolerant community enrichment. This suggests that flocculent and carrier-assisted systems may offer a larger adaptive niche for the proliferation and activity of halophilic heterotrophic communities compared to dense granules [42]. These findings reveal distinct adaptation strategies; granular sludge (R1) maintains metabolic homeostasis through physical restructuring, carrier systems (R2) achieve functional adaptation via biofilm-granule synergy, and floccular sludge (R3) recovers through deep community reconstruction. This provides important guidance for high-salinity wastewater treatment optimization.
SAA and heme c dynamics revealed anammox community adaptation. Initially, SAA followed R2(0.74) > R1(0.71) > R3(0.34) g N/g VSS/d, possibly due to inoculum specificity (Figure 7b). At 5 g/L, all systems showed significant SAA inhibition (47–66% decrease), consistent with reported low-salt sensitivity [43,44]. Higher salinity (5→20 g/L) induced different adaptation patterns; R1 maintained stable SAA (0.11) through structural optimization, R2 preserved activity (0.26) via biofilm retention, and R3 showed unique enhancement (final 0.48, 40% increase), suggesting synergistic effects of sludge morphology and community structure on anammox salt tolerance, potentially through the selection of highly salt-tolerant anammox species or beneficial partnerships with other microbes [45].
Heme c content, directly related to anammox performance and functioning as coenzyme for key enzymes, revealed metabolic adaptation [46]. In Figure 7c, at 5 g/L, all systems showed significant heme c increases (R3: +85%), suggesting low-salt stimulation of heme protein synthesis, possibly as a compensatory mechanism to maintain enzyme activity under initial stress. Notably, 10 g/L caused universal decreases (15–20%) due to chloride inhibition of N2H4 conversion (Section 3.1.3). At 15–20 g/L, R1 showed exceptional recovery (final 1.33 μmol/g VSS, +156%), while R3 decreased 37% due to disinfectant byproduct inhibition, confirming that (1) granular structure protects anammox bacteria from chloride damage, likely by limiting ion permeability through the dense EPS matrix; (2) disinfectant sensitivity varies significantly among sludge types (granular > biofilm > floccular); and (3) heme c correlates with SAA as important anammox performance indicator.

3.4. Response Characteristics of Microbial Community Structure to Salinity Stress

3.4.1. Phylum-Level Microbial Community Evolution

High-throughput sequencing revealed dynamic microbial community changes under salinity gradients (Figure 8). At the phylum level, Planctomycetes, Proteobacteria, Bacteroidetes, and Chloroflexi constituted the dominant microbial groups. With increasing salinity (0→20 g/L), the relative abundance of Planctomycetes (containing AnAOB) decreased from 47.06 to 42.95% to 32.30–26.61%, showing an inhibition gradient of R3 > R2 > R1, consistent with the protective efficiency of each system’s sludge structure. Notably, Pseudomonadota demonstrated remarkable salinity adaptability, increasing from an initial minor status (<5%) to 43.20–47.30%, becoming the dominant phylum under high salinity. This phylum is known to harbor numerous halotolerant and halophilic species capable of synthesizing compatible solutes (e.g., ectoine, betaine) to maintain cellular osmotic balance, explaining its competitive advantage under stress [47]. Chloroflexi exhibited unique dynamics, peaking at 10 g/L salinity (14.53–17.29%) before declining, suggesting that this “increase-then-decrease” pattern may relate to EPS content changes as they can utilize EPS as growth substrate [48]. The initial increase may be linked to their role as filamentous scaffolding providers, which becomes less sustainable as EPS composition alters under severe salinity [49]. In contrast, Proteobacteria and Bacteroidetes showed higher salinity sensitivity, with continuous abundance reduction until exiting dominant populations.

3.4.2. Genus-Level Functional Community Restructuring

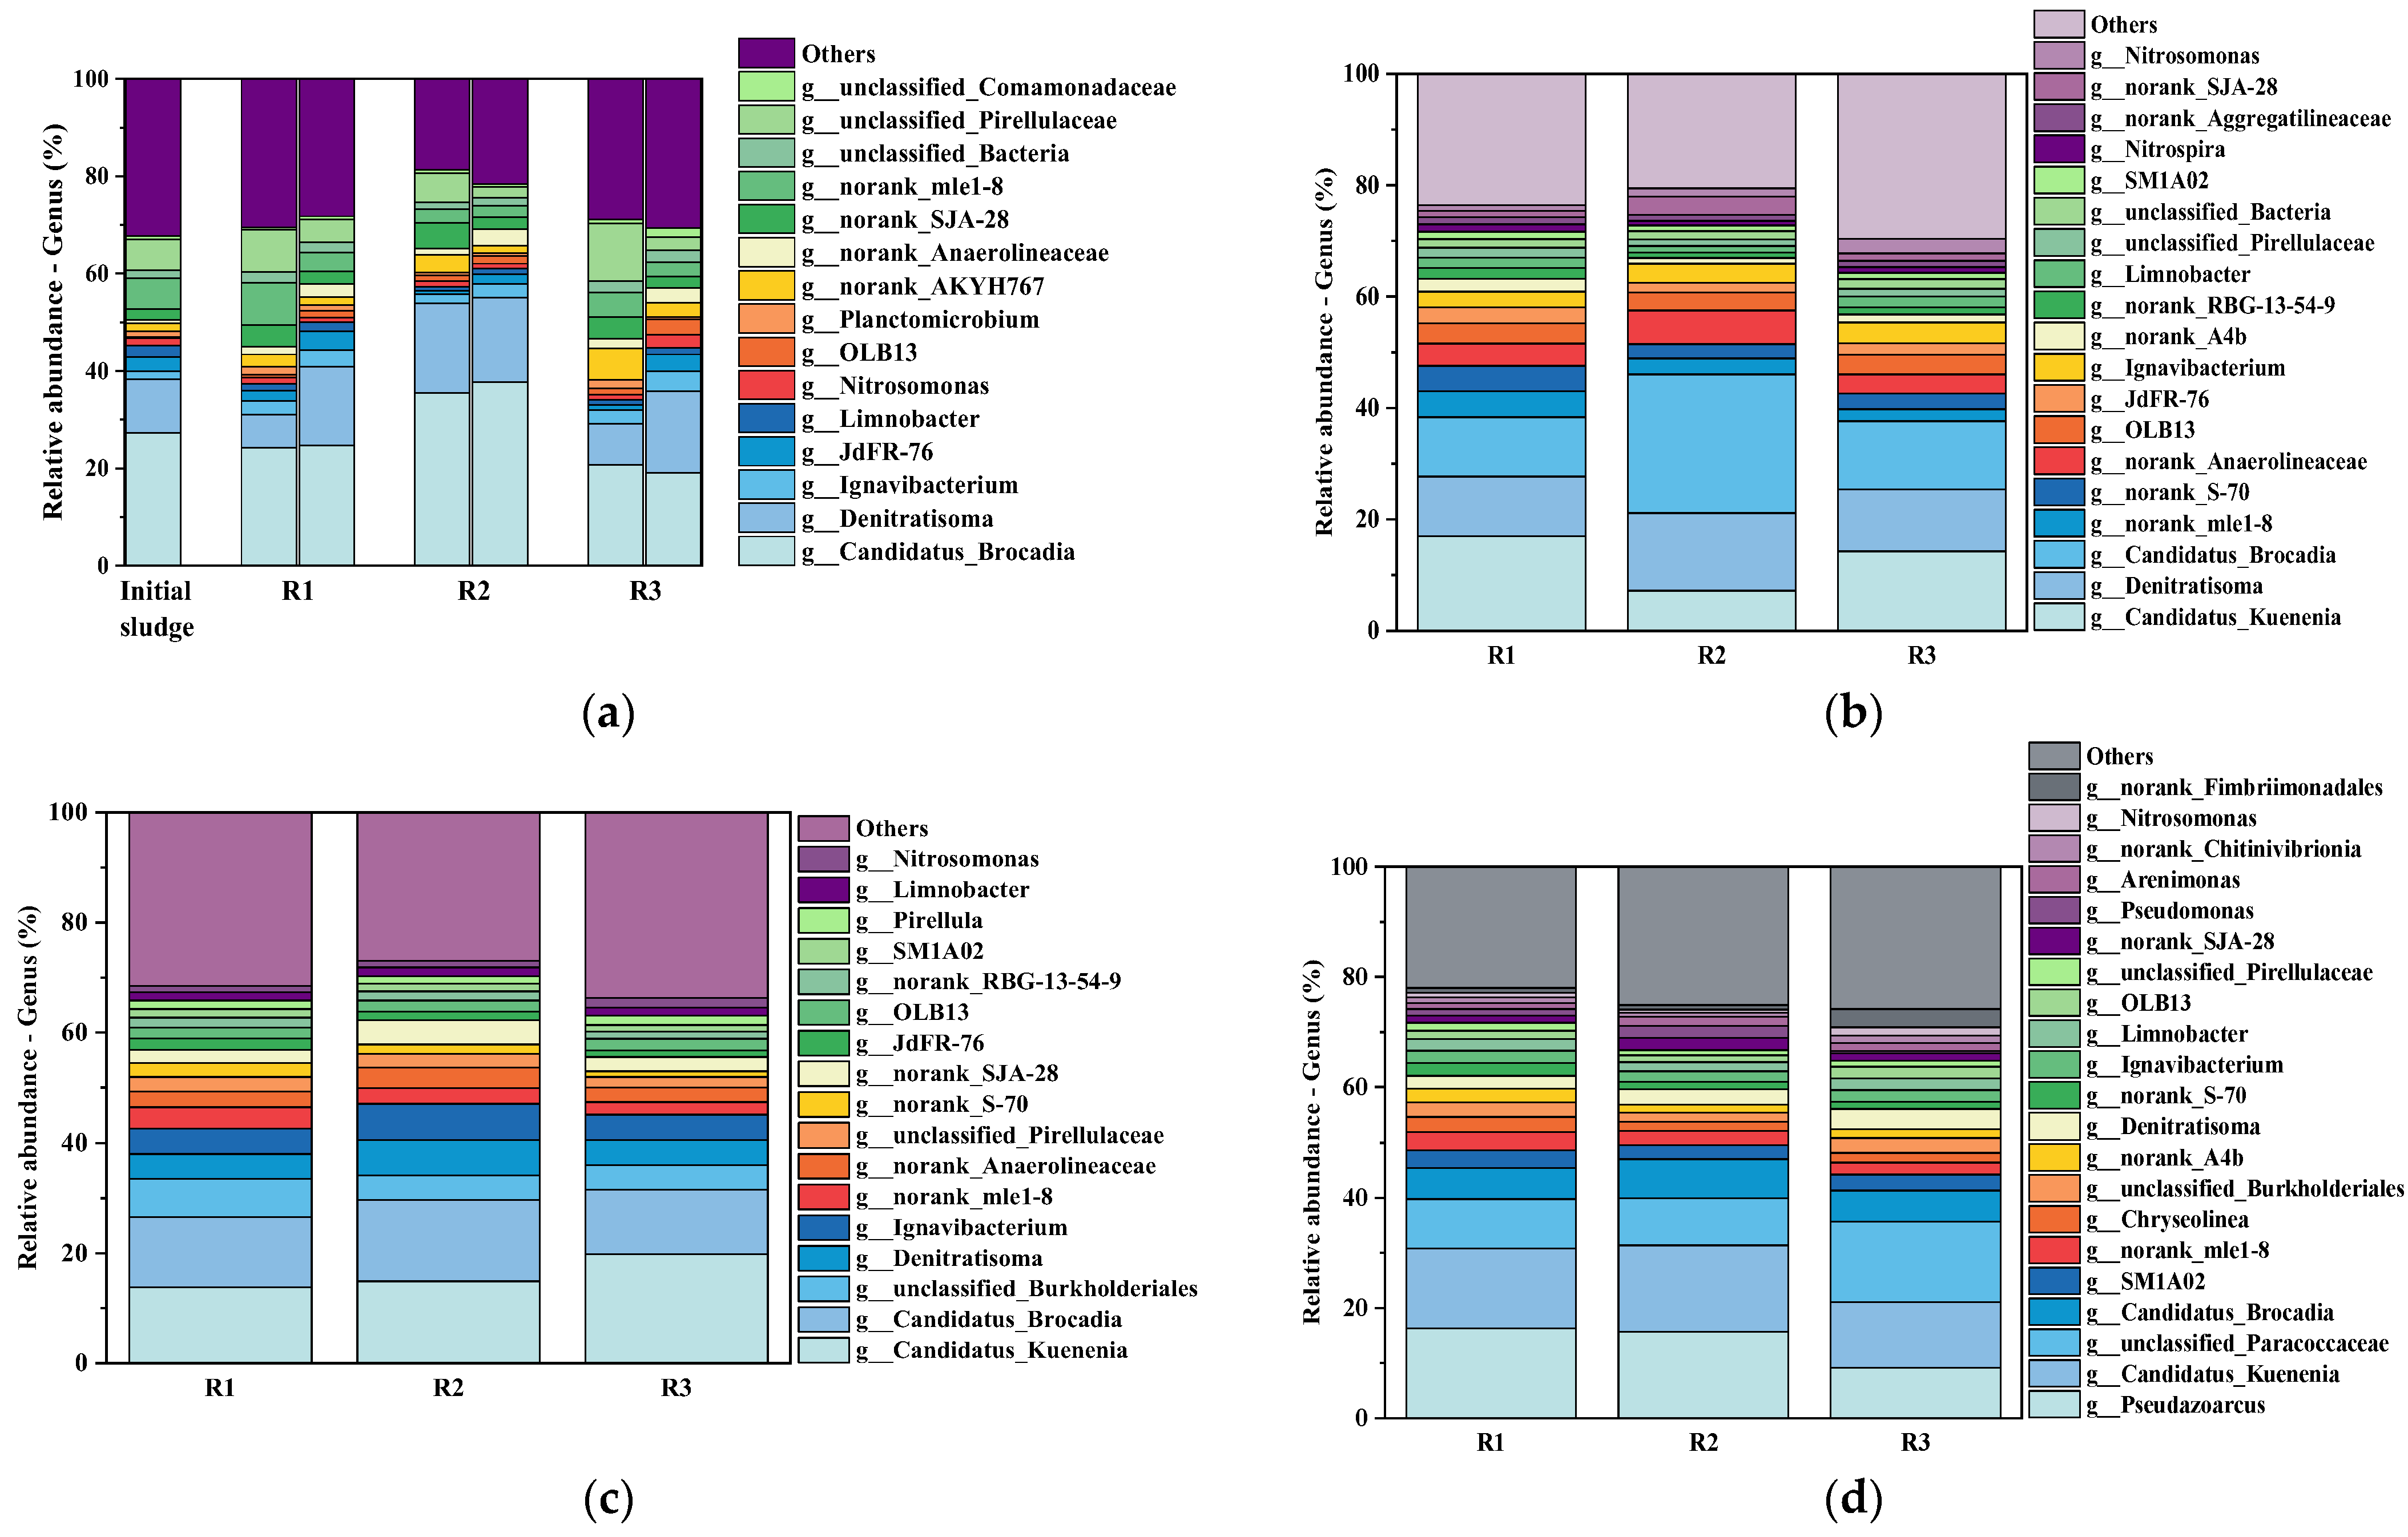
Genus-level analysis (Figure 9) revealed more refined functional community adaptation strategies. Chloroflexi exhibited unique dynamics, peaking at 10 g/L salinity (14.53–17.29%) before declining, suggesting that this “increase-then-decrease” pattern may relate to EPS content changes as they can utilize EPS as growth substrate [48]. The initial increase may be linked to their role as filamentous scaffolding providers, which becomes less sustainable as EPS composition alters under severe salinity [49].
Key functional genus succession patterns showed that the denitrifier Denitratisoma was gradually eliminated (<1.00%) due to organic carbon deficiency [50,51] and Ignavibacterium maintained stable abundance (~2.00%), possibly supporting anammox activity through extracellular electron transfer [52,53], while high-salt-specific genera Pseudazoarcus and unclassified_Paracoccaceae significantly enriched (reaching 16.33% and 14.65%, respectively), whose denitrification and nitrate reduction genes may have altered system nitrogen metabolism pathways. The enrichment of these genera is a typical community-level response to salinity, as they often possess genes for alternative nitrogen transformation pathways that are less sensitive to ionic inhibition [54,55].
Different sludge systems exhibited unique community adaptation patterns; R1 and R2’s granular/biofilm structures formed stratified protection, with salt-tolerant bacteria (e.g., Pseudazoarcus [54]) enriched in the outer layers while preserving some sensitive bacteria internally. This creates a microenvironmental gradient, shielding inner microbes from the full brunt of the salt stress [56], whereas R3’s loose structure caused more drastic community turnover, with Paracoccaceae-dominated (14.65%) nitrate reduction pathways leading to elevated effluent NH 4 + -N [55]. These differences explain previously observed performance divergence; the structural stability of granular systems maintained more balanced community composition, while floccular systems achieved functional transformation through radical community restructuring, albeit at the cost of biomass loss and metabolic pathway alteration. These findings provide new perspectives for understanding sludge morphology-function–microbe coupling relationships.

3.5. Effects of Salinity on Nitrogen Metabolism-Related Genes in Different Anammox Sludge Morphologies

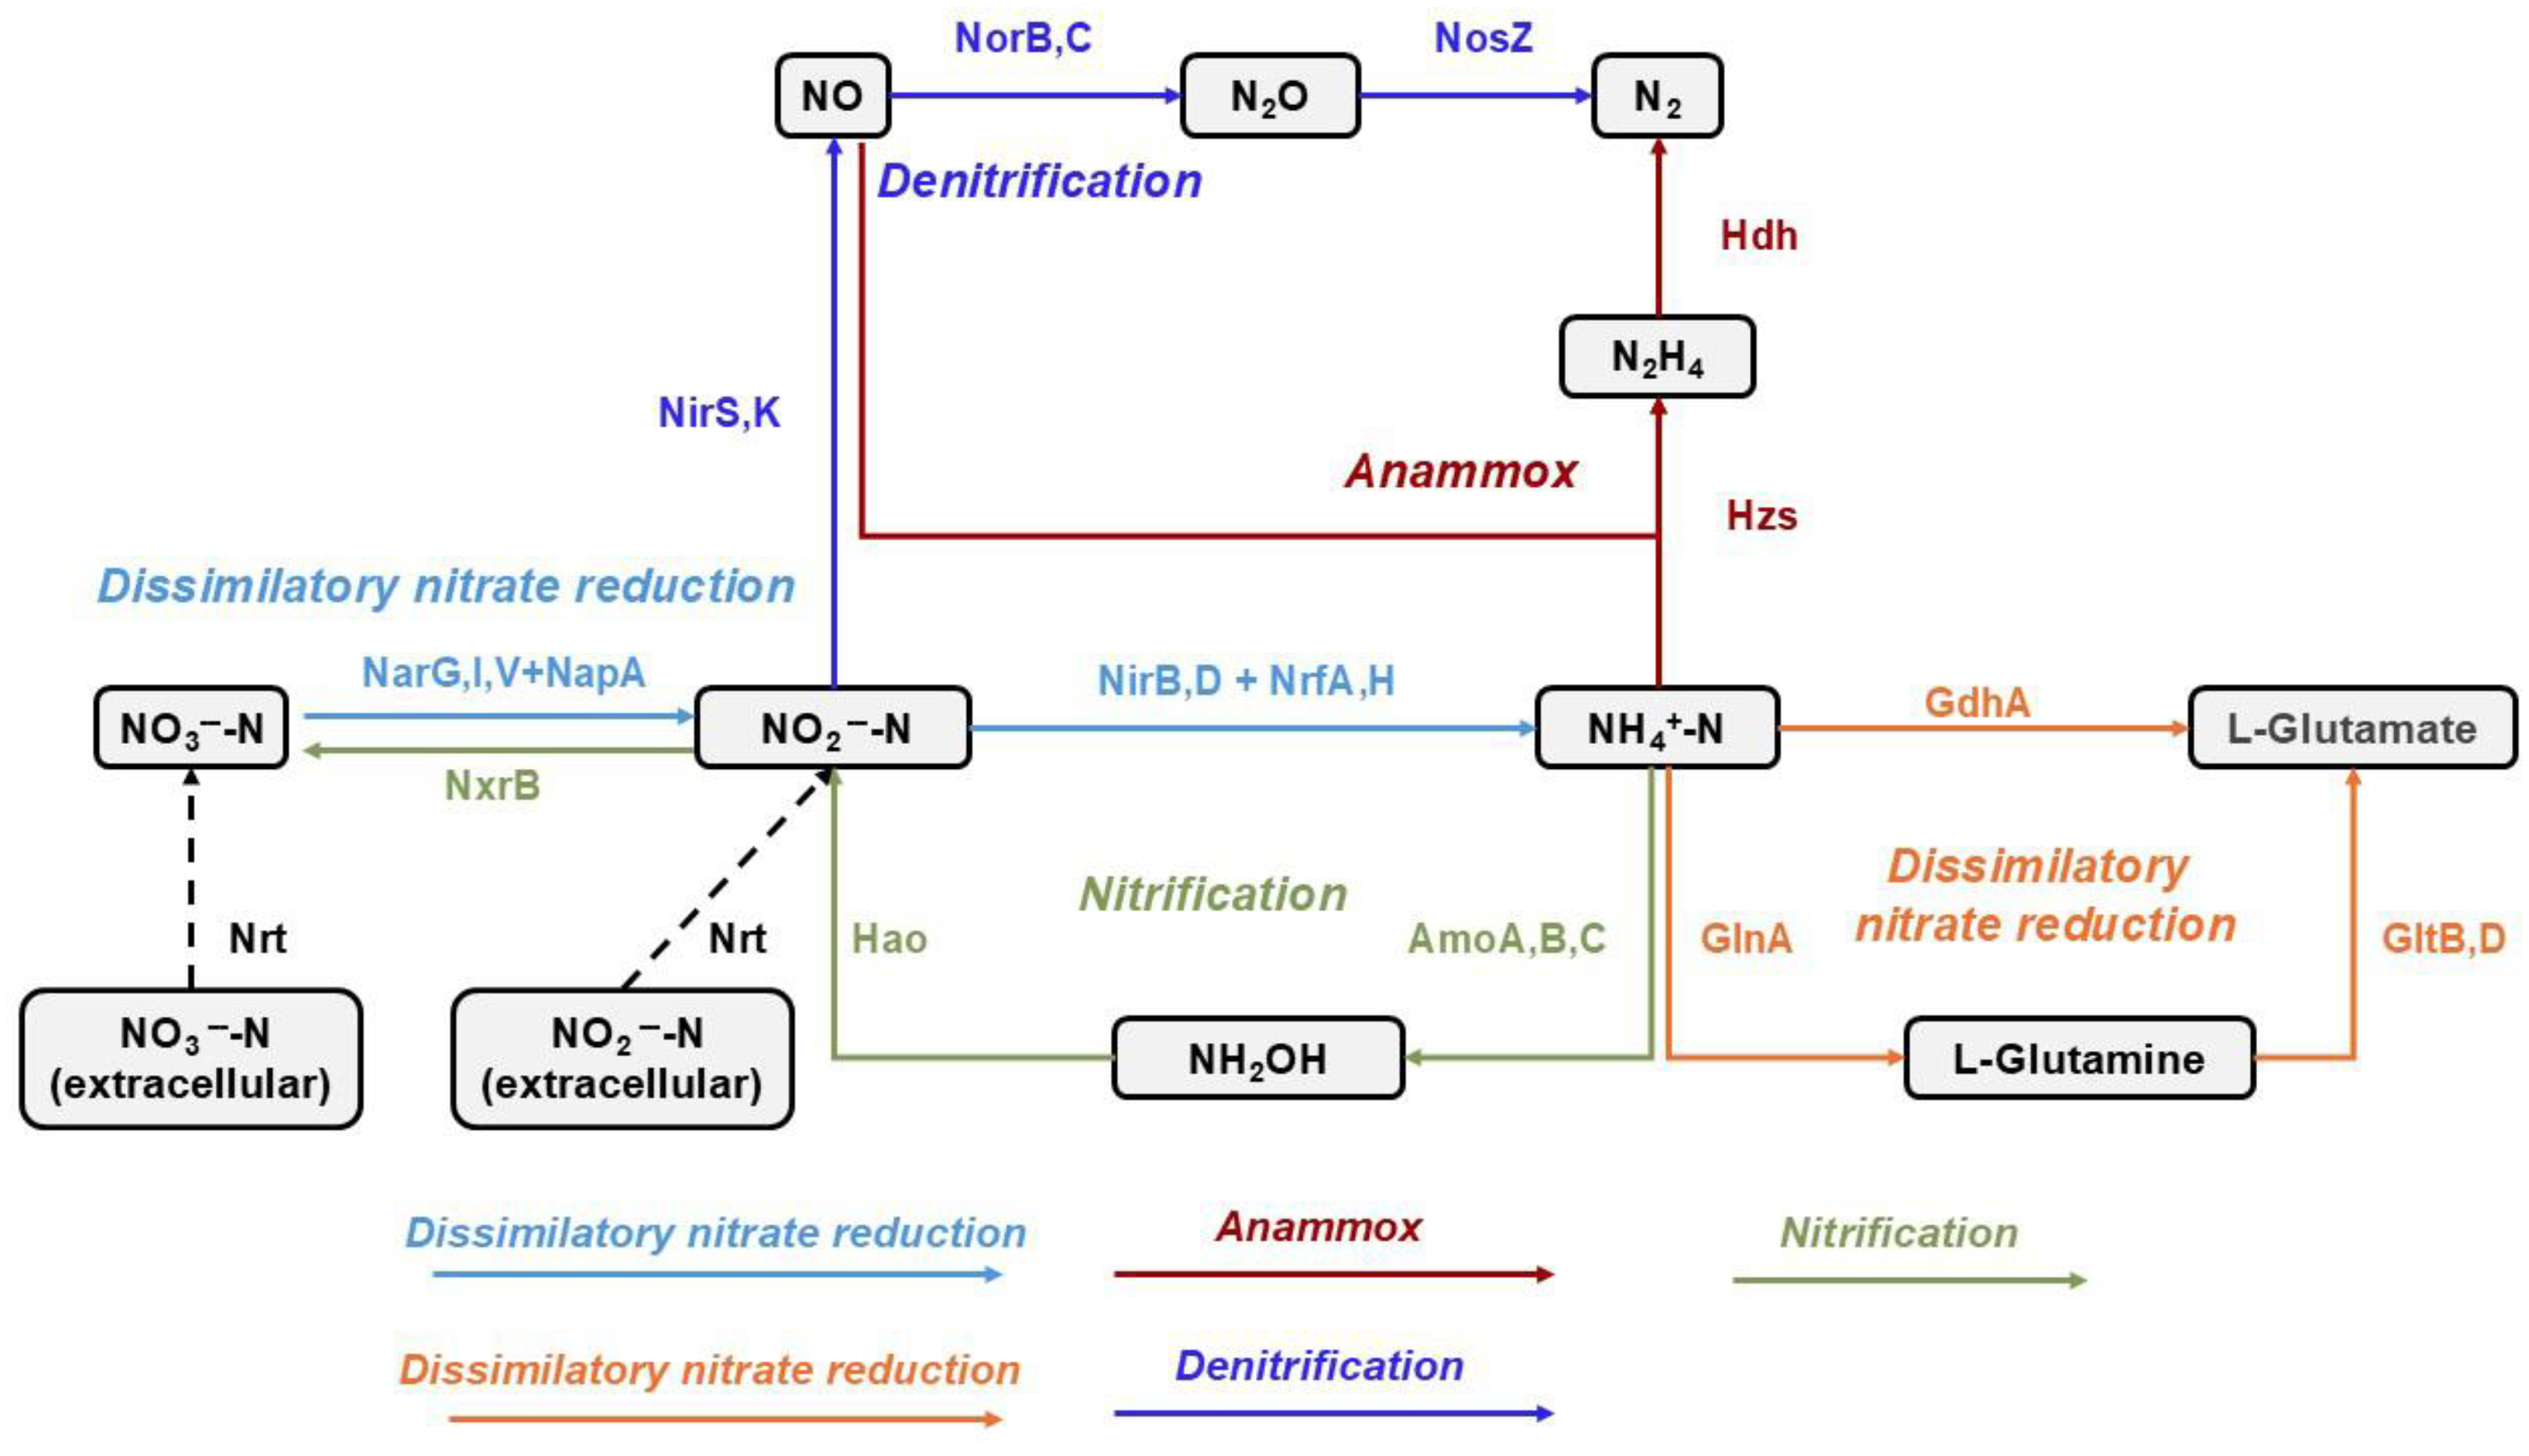
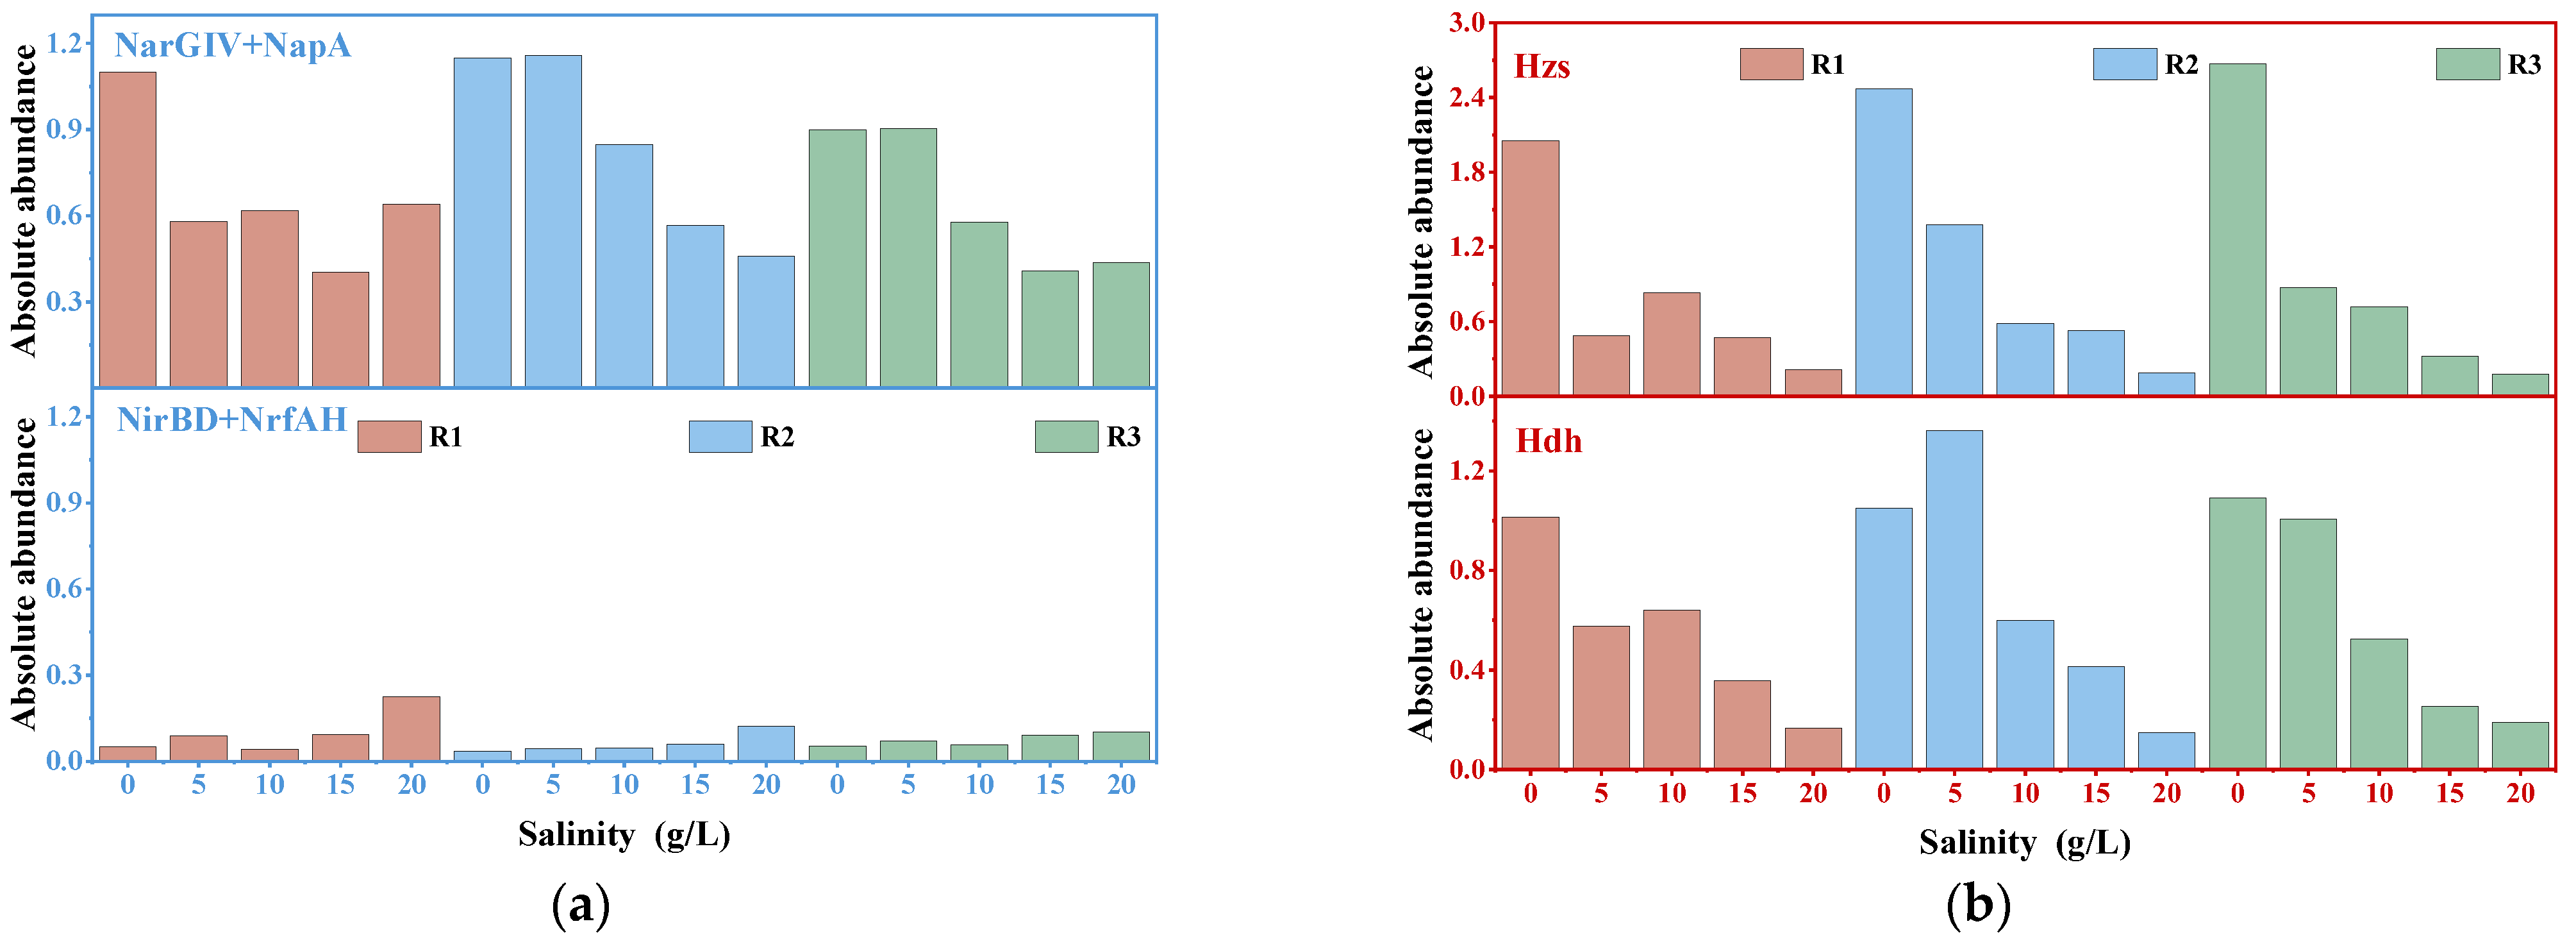
This study revealed the dynamic responses of nitrogen metabolism functional genes to salinity gradients in different anammox sludge morphologies through metagenomic analysis (Figure 10). In the dissimilatory nitrate reduction pathway (Figure 11a), the relative abundance of NarGIV+NapA genes (NO3-N→NO2-N) showed a decreasing trend with increasing salinity. The R1 system exhibited a significant reduction (1.10%→0.58%) at 5 g/L salinity, consistent with the observed increase in effluent NO3-N concentration. This suppression of nitrate reductase genes under salt stress is a common microbial response, possibly to conserve energy or due to direct enzymatic inhibition by ions [57]. Notably, NirBD+NrfAH genes (NO2-N→ NH 4 + -N) displayed an opposite response pattern (Figure 11b), increasing from an initial 0.03–0.05% to 0.10–0.23%, providing a molecular-level explanation for elevated NH 4 + -N concentration at high salinity (20 g/L). The activation of this pathway could be a community-level strategy to accumulate ammonium as a compatible solute precursor to counteract osmotic pressure [58]. Gene abundance analysis showed that nitrate reduction was predominantly mediated by NarGIV+NapA (75–80% contribution), while the maintained low NO2-N concentration suggested the crucial roles of nitrification (NxrB) and denitrification (NirSK) pathways in competitive NO2-N consumption (Figure 11d).
In addition, the salinity enhancement process in this experiment showed a salt-resistant microbiome, which may provide a further research perspective on the system for marine luminescent bacteria to detect biological toxicity [59].
Anammox functional genes (Hzs and Hdh) showed high sensitivity to salinity. At 5 g/L salinity, Hzs gene ( NH 4 + -N +NO→N2H4) abundance decreased by 50–70%, eventually stabilizing at low levels (0.18–1.19%). The Hdh gene (N2H4→N2) followed a similar trend but showed temporary recovery in R1 (10 g/L) and R2 (5 g/L), coinciding with enrichment peaks of C. Kuenenia in these systems. This gene–community co-response reveals anammox bacteria’s salinity adaptation strategy: maintaining core metabolic functions through dominant species replacement, where certain taxa like C. Kuenenia might possess genetic or physiological traits conferring higher salt tolerance [60].
As shown in Figure 11c, nitrification functional genes exhibited differential response; AmoABC ( NH 4 + -N→NH2OH) and Hao (NH2OH→NO2-N) gene abundances decreased by 30–50% and 80–85%, respectively, while NxrB (NO2-N→NO3-N) remained relatively stable (0.18–0.28%). This “upstream inhibition, downstream maintenance” pattern may lead to incomplete nitrification, partially explaining the absence of NO2-N accumulation. The particular sensitivity of ammonia oxidizers (Amo, Hao) to salinity is widely reported, often leading to a bottleneck in the nitrification process under salt stress [61,62]. In denitrification pathways, NirSK gene (NO2-N→NO) abundance increased by 45–90%, while NorBC (NO→N2O) and NosZ (N2O→N2) decreased by 20–30%. This “promotion–inhibition” regulation pattern may relate to Hzs gene competition for NO, though NosZ’s relative dominance (2–3 times higher than NorBC) ensured N2 as the main product. The accumulation of nitric oxide (NO) due to impaired NorBC activity could itself be inhibitory or act as a signaling molecule under stress [63]. Figure 11e shows metabolic flux redirection in ammonia assimilation; GlnA (glutamine synthetase) gene abundance decreased by 40–60%, while GltBD (glutamate synthase) increased by 70–90%, directing more NH 4 + -N towards glutamate synthesis [64] for compatible solute production (e.g., proline, glycine betaine) against osmotic stress, a fundamental microbial osmoregulation strategy [65]. Notably, in Figure 11f nitrate transporter genes (Nrt) [66] showed coordinated regulation, with significantly higher abundance in R2/R3 (0.21–0.22%) than R1 (0.16%), complementing NarGIV+NapA and NxrB genes to jointly regulate NO3-N balance. The differential expression of transporter genes highlights how sludge morphology influences the community’s ability to acquire essential nutrients under salinity-induced physiological limitations [67].
These genetic-level findings provide mechanistic explanations for macroscopic phenomena: (1) elevated NH4+-N under high salinity results from combined Hzs inhibition and NirBD/NrfAH activation; (2) sustained low NO2-N is maintained by competitive consumption through NxrB and NirSK genes; (3) system-specific nitrogen removal performance reflects sludge-type-specific gene network regulation. Overall, salinity stress triggers collaborative reprogramming of nitrogen metabolic gene networks, achieving functional maintenance through metabolic flux redistribution and key enzyme activity adjustment. This plasticity forms the fundamental basis for stable operation of high-salinity anammox systems.

4. Conclusions

This study systematically revealed the differential impact mechanisms of gradient salinity on various anammox sludge morphologies, with the following key findings:
1. Nitrogen removal performance characteristics: Granular sludge (R1) > carrier-attached sludge (R2) > floccular sludge (R3). R1 maintained over 90% NH4+-N removal efficiency. R3 showed reduced removal efficiency (75.45%) due to biomass loss.
2. Physicochemical adaptation mechanisms: Low salinity favored protein (PN) for aggregation (R2: 97.00 mg/g VSS); high salinity increased polysaccharide (PS) (R3: 129.50 mg/g VSS). Both 3D-EEM and FTIR showed hydrophobic shifts stabilized granules.
Salinity drove dynamic EPS composition adjustments: Protein (PN) dominated at low salinity (R2 reached 97.00 mg/g VSS) to promote aggregation, while polysaccharide (PS) proportion increased at high salinity (R3 reached 129.50 mg/g VSS) to enhance water retention. Both 3D-EEM and FTIR confirmed enhanced granular stability through red-shifted hydrophobic groups, while preferential LB-EPS degradation revealed salinity action sites.
3. Microbial community evolution: Dominant phyla shifted from Planctomycetes/Proteobacteria to Pseudomonadota. C. Kuenenia (67–72%) became core under high salinity. R1/R2 enriched Pseudazoarcus (16.33%); R3 relied on Paracoccaceae (14.65%).
4. Gene Network Regulation Strategies: (1) NarGIV/NapA decreased (1.10%→0.58%), raised NO3-N; (2) Hzs inhibition and NirBD/NrfAH activation elevated NH 4 + -N; (3) NxrB/NirSK maintained low NO2-N; (4) GltBD (0.22%→0.43%) enhanced osmoregulation.
These results support sludge selection and process control for saline wastewater, emphasizing granular sludge’s stability. The adaptation mechanisms guide optimization under salt stress. Future studies should target key genes and microbes to improve salinity resistance.

Supplementary Materials

The following supporting information can be downloaded at https://www.mdpi.com/article/10.3390/w17172611/s1: Figure S1. Diagram of actual UASB reactor; Figure S2. 1 cm−3 foam cube and suspension ball; Figure S3. Actual picture of foam and suspension ball assembly; Figure S4. Changes of NH 4 + -N (a) and NO 2 -N (b) conversion rates of R1, R2, and R3 reactors at different salinities; Figure S5. Changes in TN and conversion concentrations in influent water and effluent water from R1, R2, and R3 reactors under different salinity; Figure S6. Changes in the stoichiometric ratio of anammox reaction of R1, R2, and R3 reactors under different salinity; Figure S7. Physical images of R1, R2, and R3 at 15 g/L (a), (d), (g) and microscopic images (b), (e), (h) (×40), (c), (f), (i) (×100); Figure S8. Microscopic image (×100) of filamentous bacteria in Reactor R3 under 20 g/L salinity; Figure S9. Three-dimensional-EEM fluorescence spectra of LB-EPS and TB-EPS derived from R1 (a), R2 (b), R3 (c); Figure S10. FTIR spectra of LB-EPS (a) and TB-EPS (b) of R1, R2, and R3 reactors under different salinity.

Author Contributions

Conceptualization, K.S. and H.Z.; methodology, K.S. and Z.P.; software, K.S.; investigation, K.S.; writing—original draft preparation, K.S.; writing—review and editing, H.Z. and J.M.; supervision, H.Z. and K.Z.; funding acquisition, H.Z. and S.Z. All authors have read and agreed to the published version of the manuscript.

Funding

This research was funded by the Ningbo Municipal Bureau of Science and Technology Key Research and Development Plan (2023Z045, 2023Z146) and Dongguan Social Development Science and Technology Project (20231800936122).

Data Availability Statement

The original contributions presented in this study are included in the article. Further inquiries can be directed to the corresponding author.

Conflicts of Interest

The authors declare no conflicts of interest.

Abbreviations

The following abbreviations are used in this manuscript:
AOBammonia oxidizing bacteria
AnAOBanaerobic ammonium oxidation bacteria
Anammoxanaerobic ammonium oxidation
CODchemical oxygen demand
DHAdehydrogenase activity
DOdissolved oxygen
EPSextracellular polymeric substances
Ememission wavelength
Exexcitation wavelength
FTIRFourier transform infrared spectroscopy
HRThydraulic retention time
LB-EPSloosely bound-eps
MLSSmixed liquor suspended solids
MLVSSmixed liquor volatile suspended solids
NH 4 + -Nammonia nitrogen
NO 2 -Nnitrite nitrogen
NO 3 -Nnitrate nitrogen
NOBnitrite-oxidizing bacteria
NLRvolumetric nitrogen loading rate
NRRvolumetric nitrogen removal rate
PCRpolymerase chain reaction
PNproteins
PSpolysaccharides
SAAspecific anammox activity
SAGssingle-amplified genomes
SBRsequencing batch reactor
TB-EPStightly bound eps
TDStotal dissolved solids
TPtotal nitrogen
UASBup-flow anaerobic sludge blanket
3D-EEMthree-dimensional excitation–emission matrix

References

  1. Tsipa, A.; Papalli, M.; Christou, A.; Pissaridou, P.; Vasquez, M.I. Ex-Situ Biological Treatment of Industrial Saline Seafood Wastewater by Salt-Tolerant Mixed Cultures and Phytotoxicity Evaluation. J. Environ. Chem. Eng. 2023, 11, 109195. [Google Scholar] [CrossRef]
  2. Shao, G.; Zhou, Z.; Tu, Y.; Chen, J.; Zhang, F.; Tian, S.; Ren, Z. Calcium-Based Catalyst for Ozone Catalytic Oxidation for Advanced Treatment of High Salt Organic Wastewater. Colloids Surf. A Physicochem. Eng. Asp. 2022, 654, 130149. [Google Scholar] [CrossRef]
  3. Feng, Y.; Yang, C.; Li, J.; Ding, X.; Xia, R.; Hu, M.; Tian, Y.; Pan, Y.; Zhang, Q.; Li, A. Acclimatization of Salt-Tolerant Bacteria in a Pilot-Scale Biological Treatment System for Actual High-Salinity Wastewater from a Chemical Industrial Park. J. Environ. Chem. Eng. 2025, 13, 117397. [Google Scholar] [CrossRef]
  4. Xiong, Y.-T.; Yan, Z.-L.; He, J.-H.; Liu, S.-Y.; Chen, Y.-P.; Guo, J.-S.; Fang, F.; Yan, P. Adaptation of Anammox Bacteria in Granular Sludge under the Different Temperature Rhythms. Chem. Eng. J. 2025, 521, 166721. [Google Scholar] [CrossRef]
  5. Hao, B.; He, B.; Zhang, S.; Wu, H. Endophytic Bacteria Enhance Macrophyte Resilience but Reduce Microbial Network Stability under Eutrophication. Ecol. Indic. 2025, 177, 113804. [Google Scholar] [CrossRef]
  6. Chen, Y.; Liu, Y.; Zhao, Y.; Geng, N.; Baeyens, J.; Wang, S.; Su, H. Fe3O4-Mediated Regulation of Aerobic Granular Sludge under High Salinity and Fluctuating C/N Ratio: Mechanisms and Implications for Seafood Processing Wastewater Treatment. Environ. Res. 2025, 284, 122257. [Google Scholar] [CrossRef]
  7. Bi, C.; Yu, D.; Wang, X.; Du, S.; Wang, J.; Gong, X.; Du, Y.; Zhao, J. Performance and Microbial Structure of Partial Denitrification in Response to Salt Stress: Achieving Stable Nitrite Accumulation with Municipal Wastewater. Bioresour. Technol. 2020, 311, 123559. [Google Scholar] [CrossRef]
  8. Lin, L.; Pratt, S.; Crick, O.; Xia, J.; Duan, H.; Ye, L. Salinity Effect on Freshwater Anammox Bacteria: Ionic Stress and Ion Composition. Water Res. 2021, 188, 116432. [Google Scholar] [CrossRef]
  9. Wen, X.; Cui, L.; Lin, H.; Zhu, W.; Shao, Z.; Wang, Y. Comparison of Nitrification Performance in SBR and SBBR with Response to NaCl Salinity Shock: Microbial Structure and Functional Genes. Environ. Res 2024, 252, 118917. [Google Scholar] [CrossRef]
  10. Zhang, X.; Zhang, H.; Ma, B.; Song, Y.; Wang, L.; Wang, Q.; Ma, Y. Can Anammox Process Be Adopted for Treating Wastewater with High Salinity Exposure Risk? Chemosphere 2022, 293, 133660. [Google Scholar] [CrossRef] [PubMed]
  11. Su, Y.; Yang, H. Response of ANAMMOX Bacteria to Salinity under Different Environments and the Role of Biomass. Ind. Water Treat. 2022, 42, 163–169. [Google Scholar] [CrossRef]
  12. Li, A.; Guowei, G. The Treatment of Saline Wastewater Using a Two-Stage Contact Oxidation Method. Water Sci. Technol. 1993, 28, 31–37. [Google Scholar] [CrossRef]
  13. Chen, J.; Han, Y.; Wang, Y.; Gong, B.; Zhou, J.; Qing, X. Start-up and Microbial Communities of a Simultaneous Nitrogen Removal System for High Salinity and High Nitrogen Organic Wastewater via Heterotrophic Nitrification. Bioresour. Technol. 2016, 216, 196–202. [Google Scholar] [CrossRef]
  14. Hudayah, N.; Krainara, S.; Kongduan, V.; Chaiprasert, P.; Suraraksa, B. Efficiencies of Anaerobic Hybrid and UASB Reactors to Alleviate the Adverse Effect of Elevated Salinity in Wastewater. J. Chem. Technol. Biotechnol. 2021, 96, 3426–3435. [Google Scholar] [CrossRef]
  15. Jamal Khan, S.; Ilyas, S.; Javid, S.; Visvanathan, C.; Jegatheesan, V. Performance of Suspended and Attached Growth MBR Systems in Treating High Strength Synthetic Wastewater. Bioresour. Technol. 2011, 102, 5331–5336. [Google Scholar] [CrossRef]
  16. Li, X.Y.; Yang, S.F. Influence of Loosely Bound Extracellular Polymeric Substances (EPS) on the Flocculation, Sedimentation and Dewaterability of Activated Sludge. Water Res. 2007, 41, 1022–1030. [Google Scholar] [CrossRef] [PubMed]
  17. Ji, B.; Zhang, H.; Zhou, L.; Yang, J.; Zhang, K.; Yuan, X.; Ma, J.; Qian, Y. Effect of the Rapid Increase of Salinity on Anoxic-Oxic Biofilm Reactor for Treatment of High-Salt and High-Ammonia–Nitrogen Wastewater. Bioresour. Technol. 2021, 337, 125363. [Google Scholar] [CrossRef] [PubMed]
  18. Chen, Y.; He, H.; Liu, H.; Li, H.; Zeng, G.; Xia, X.; Yang, C. Effect of Salinity on Removal Performance and Activated Sludge Characteristics in Sequencing Batch Reactors. Bioresour. Technol. 2018, 249, 890–899. [Google Scholar] [CrossRef] [PubMed]
  19. Wei, Y.; Li, K.; Tong, S. A Linear Regression Method for the Study of the Coomassie Brilliant Blue Protein Assay. Talanta 1997, 44, 923–930. [Google Scholar] [CrossRef] [PubMed]
  20. Leyva, A.; Quintana, A.; Sánchez, M.; Rodríguez, E.N.; Cremata, J.; Sánchez, J.C. Rapid and Sensitive Anthrone–Sulfuric Acid Assay in Microplate Format to Quantify Carbohydrate in Biopharmaceutical Products: Method Development and Validation. Biologicals 2008, 36, 134–141. [Google Scholar] [CrossRef]
  21. Yin, J.; Tan, X.J.; Ren, N.Q.; Cui, Y.B.; Tang, L. Evaluation of Heavy Metal Inhibition of Activated Sludge by TTC and INT-Electron Transport System Activity Tests. Water. Sci. Technol. 2005, 52, 231–239. [Google Scholar] [CrossRef] [PubMed]
  22. Wu, D.; Li, G.-F.; Shi, Z.-J.; Zhang, Q.; Huang, B.-C.; Fan, N.-S.; Jin, R.-C. Co-Inhibition of Salinity and Ni(II) in the Anammox-UASB Reactor. Sci. Total Environ. 2019, 669, 70–82. [Google Scholar] [CrossRef]
  23. Yang, G.F.; Jin, R.C. Reactivation of Effluent Granular Sludge from a High-Rate Anammox Reactor after Storage. Biodegradation 2013, 24, 13–32. [Google Scholar] [CrossRef]
  24. Zhang, Z.-Z.; Zhang, Q.-Q.; Xu, J.-J.; Deng, R.; Ji, Z.-Q.; Wu, Y.-H.; Jin, R.-C. Evaluation of the Inhibitory Effects of Heavy Metals on Anammox Activity: A Batch Test Study. Bioresour. Technol. 2016, 200, 208–216. [Google Scholar] [CrossRef]
  25. Berry, E.A.; Trumpower, B.L. Simultaneous Determination of Hemes a, b, and c from Pyridine Hemochrome Spectra. Anal. Biochem. 1987, 161, 1–15. [Google Scholar] [CrossRef]
  26. Burian, A.; Pinn, D.; Peralta-Maraver, I.; Sweet, M.; Mauvisseau, Q.; Eyice, O.; Bulling, M.; Roethig, T.; Kratina, P. Predation Increases Multiple Components of Microbial Diversity in Activated Sludge Communities. ISME J. Emultidisciplinary J. Microb. Ecol. 2022, 16, 1086–1094. [Google Scholar] [CrossRef] [PubMed]
  27. Ji, J.; Yang, H.; Li, Y.; Wang, Q.; Dong, Y.; Hu, F.; Wu, G.; Bai, Z.; Chai, F.; Liu, L.; et al. Response of the Partial Denitrification Coupled with Anaerobic Ammonia Oxidation System to Disinfectant Residues Stress. J. Hazard. Mater. 2025, 489, 137723. [Google Scholar] [CrossRef]
  28. Dapena-Mora, A.; Vázquez-Padín, J.R.; Campos, J.L.; Mosquera-Corral, A.; Jetten, M.S.M.; Méndez, R. Monitoring the Stability of an Anammox Reactor under High Salinity Conditions. Biochem. Eng. J. 2010, 51, 167–171. [Google Scholar] [CrossRef]
  29. Liu, Z.; Zhang, D.; Ning, F.; Zhang, S.; Hou, Y.; Gao, M.; Wang, J.; Aining, Z.; Liu, Y. Resistance and Adaptation of Mature Algal-Bacterial Granular Sludge under Salinity Stress. Sci. Total Environ. 2022, 861, 160558. [Google Scholar] [CrossRef]
  30. Peng, T.; Wang, Y.; Wang, J.; Fang, F.; Yan, P.; Liu, Z. Effect of Different Forms and Components of EPS on Sludge Aggregation during Granulation Process of Aerobic Granular Sludge. Chemosphere 2022, 303, 135116. [Google Scholar] [CrossRef]
  31. Manavi, N.; Kazemi, A.S.; Bonakdarpour, B. The Development of Aerobic Granules from Conventional Activated Sludge under Anaerobic-Aerobic Cycles and Their Adaptation for Treatment of Dyeing Wastewater. Chem. Eng. J. 2017, 312, 375–384. [Google Scholar] [CrossRef]
  32. de Graaff, D.R.; van Loosdrecht, M.C.M.; Pronk, M. Stable Granulation of Seawater-Adapted Aerobic Granular Sludge with Filamentous Thiothrix Bacteria. Water Res. 2020, 175, 115683. [Google Scholar] [CrossRef] [PubMed]
  33. Liu, X.; Li, R.; Chen, R.; Chen, Y.; Zeng, A.; Deng, Y.; Ma, J.; Chen, M. Formation of Filamentous Fungal Pellets in Aerobic Granular Sludge via Reducing Temperature and Dissolved Oxygen: Characteristics of Filamentous Fungi and Denitrification Performance. Bioresour. Technol. 2021, 332, 125056. [Google Scholar] [CrossRef]
  34. Strotmann, U.J.; Windecker, G. Kinetics of Ammonium Removal with Suspended and Immobilized Nitrifying Bacteria in Different Reactor Systems. Chemosphere 1997, 35, 2939–2952. [Google Scholar] [CrossRef]
  35. Chen, L.; Huang, X.; Yang, Z.; Song, W.; Wu, Z.; Li, J.; Tu, C.; Zheng, G.; Zhang, X.; Bai, X. Ammonium Salt Stress-Dependent Compositional Alteration in EPS from Desulfovibrio desulfuricans Subsp. desulfuricans and Its Mediating Role in PbS QDs Biosynthesis. Chem. Eng. J. 2025, 512, 162360. [Google Scholar] [CrossRef]
  36. Tian, Y.; Li, Z.; Ding, Y.; Lu, Y. Identification of the Change in Fouling Potential of Soluble Microbial Products (SMP) in Membrane Bioreactor Coupled with Worm Reactor. Water Res. 2013, 47, 2015–2024. [Google Scholar] [CrossRef]
  37. Yang, Q.; Sun, J.; Wang, D.; Wang, S.; Chen, F.; Yao, F.; An, H.; Zhong, Y.; Xie, T.; Wang, Y.; et al. Effect of Nickel on the Flocculability, Settleability, and Dewaterability of Activated Sludge. Bioresour. Technol. 2017, 224, 188–196. [Google Scholar] [CrossRef] [PubMed]
  38. Wang, S.; Liu, L.; Li, H.; Fang, F.; Yan, P.; Chen, Y.; Guo, J.; Ma, T.; Shen, Y. The Branched Chains and Branching Degree of Exopolysaccharides Affecting the Stability of Anammox Granular Sludge. Water Res. 2020, 178, 115818. [Google Scholar] [CrossRef]
  39. Wang, Z.; Gao, P.; Ji, Y.; Zhang, H.; Wu, X.; Ma, J.; Li, S. Effects of Salinity on the Simultaneous Anammox and Denitrification Process: Performance, Sludge Morphology and Shifts in Microbial Communities. R. Soc. Open Sci. 2021, 8, 202099. [Google Scholar] [CrossRef]
  40. Sang, W.; Li, D.; He, Y.; Zhan, C.; Zhang, Q.; Li, C.; Singh, R.P. Sludge Reduction and Pollutants Removal in Anaerobic-Anoxic-Oxic Reactor with 2450 MHz Electromagnetic Wave Loading on Returned Sludge: Performance and Mechanism. Process Saf. Environ. Prot. 2021, 147, 68–79. [Google Scholar] [CrossRef]
  41. Hu, J.; Yan, J.; Wu, L.; Bao, Y.; Yu, D.; Li, J. Insight into Halotolerance of a Robust Heterotrophic Nitrifying and Aerobic Denitrifying Bacterium Halomonas Salifodinae. Bioresour. Technol. 2022, 351, 126925. [Google Scholar] [CrossRef]
  42. Ma, J.; Wang, K.; Gong, H.; Yuan, Q.; Yang, M.; He, C.; Shi, C.; San, E. Integrating Floc, Aggregate and Carrier to Reap High-Quality Anammox Biofilm. Bioresour. Technol. 2020, 309, 123325. [Google Scholar] [CrossRef]
  43. Jeong, D.; Kim, W.; Lim, H.; Bae, H. Shift in Bacterial Community Structure in Response to Salinity in a Continuous Anaerobic Ammonium Oxidation (Anammox) Reactor. Int. Biodeterior. Biodegrad. 2020, 147, 104873. [Google Scholar] [CrossRef]
  44. Jeong, S.; Kim, J.; Direstiyani, L.C.; Kim, Y.; Yu, J.; Lee, T. Long-Term Adaptation of Two Anammox Granules with Different Ratios of Candidatus Brocadia and Candidatus Jettenia under Increasing Salinity and Their Application to Treat Saline Wastewater. Sci. Total Environ. 2023, 860, 160494. [Google Scholar] [CrossRef] [PubMed]
  45. Zhang, Q.; Fu, J.-J.; Wu, Q.-Y.; Chen, J.-Y.; Fan, N.-S.; Huang, B.-C.; Jin, R.-C. Build the Expressway for the Salt-Tolerant Anammox Process: Acclimation Strategy Tells the Story. J. Clean. Prod. 2021, 278, 123921. [Google Scholar] [CrossRef]
  46. Deore, R.; Kumar, R.; Waqqas Mirza, M.; Ali Khan, A. Selecting Suitable Seed Sludge for Anammox Enrichment: Role of Influent Characteristics and Reactor Operational Conditions. Bioresour. Technol. 2022, 347, 126719. [Google Scholar] [CrossRef]
  47. Malik, S.S.; Loganathachetti, D.S.; Khan, M.A.; Sadaiappan, B.; Mundra, S. Bacterial Resistome in Different Stages of Wastewater Treatment Plant Is Highly Impacted by the Abundance of the Pseudomonadota Community. Bioresour. Technol. Rep. 2024, 26, 101814. [Google Scholar] [CrossRef]
  48. Bovio-Winkler, P.; Guerrero, L.D.; Erijman, L.; Oyarzúa, P.; Suárez-Ojeda, M.E.; Cabezas, A.; Etchebehere, C. Genome-Centric Metagenomic Insights into the Role of Chloroflexi in Anammox, Activated Sludge and Methanogenic Reactors. BMC Microbiol 2023, 23, 45. [Google Scholar] [CrossRef] [PubMed]
  49. Shi, K.; Xue, G.; Gao, P.; Wu, F. Impacts of Filamentous Bulking on Treatment Effect and Fouling Characteristics of Nonwoven Bioreactor. Environ. Sci. 2014, 35, 2241–2248. [Google Scholar] [CrossRef]
  50. Yu, G.; Shen, G.; Zhao, L.; Liu, W.; Zhao, W.; Wang, F.; Ai, S.; Bian, D.; Zou, D. Sewage Treatment Effect of MPSRs under Different Influent NH4+-N Concentrations and Its Mechanism of Nitrogen Removal. J. Environ. Chem. Eng. 2025, 13, 115521. [Google Scholar] [CrossRef]
  51. Zhou, Y.; Wang, C.; Xu, X.; Jin, W.; Liu, L.; Meng, F.; Yang, F. Deciphering the Partial Denitrification Function of Companion Bacteria in Mixotrophic Anammox Systems under Different Carbon/Nitrogen Ratios. J. Environ. Chem. Eng. 2023, 11, 111232. [Google Scholar] [CrossRef]
  52. Wang, Z.; Jiang, C.; Nnorom, M.-A.; Avignone-Rossa, C.; Yang, K.; Guo, B. Multi-Faceted Effects and Mechanisms of Granular Activated Carbon to Enhance Anaerobic Ammonium Oxidation (Anammox) for Nitrogen Removal from Wastewater. Bioresour. Technol. 2025, 418, 132001. [Google Scholar] [CrossRef] [PubMed]
  53. Sun, K.; Yu, M.; Zhu, X.-Y.; Xue, C.-X.; Zhang, Y.; Chen, X.; Yao, P.; Chen, L.; Fu, L.; Yang, Z.; et al. Microbial Communities Related to the Sulfur Cycle in the Sansha Yongle Blue Hole. Microbiol. Spectr. 2023, 11, e01149-23. [Google Scholar] [CrossRef] [PubMed]
  54. Reyes-Umana, V.M.; Coates, J.D. A Description of the Genus Denitromonas Nom. Rev.: Denitromonas Iodatirespirans Sp. Nov., a Novel Iodate-Reducing Bacterium, and Two Novel Perchlorate-Reducing Bacteria, Denitromonas halophila and Denitromonas ohlonensis, Isolated from San Francisco Bay Intertidal Mudflats. Microbiol. Spectr. 2023, 11, e0091523. [Google Scholar] [CrossRef]
  55. Su, R.; Zhao, D.; Zhang, X.; Zhang, H.; Cheng, J.; Xu, L.; Wu, Q.L.; Zeng, J. Dissimilatory Nitrate Reduction Pathways Drive High Nitrous Oxide Emissions and Nitrogen Retention under the Flash Drought in the Largest Freshwater Lake in China. Water Res. 2025, 274, 123075. [Google Scholar] [CrossRef]
  56. Zhou, J.; Wu, L.; Wu, C.; Chen, S.; Zhou, C.; Zhang, Y.; Zhang, Z.; Zhu, L.; Xu, X. Operation Performance of Aerobic Granular Sludge Process Treating Saline Wastewater: Granular Structure, Microbial Activity, and Effluent Quality. J. Environ. Chem. Eng. 2025, 13, 118894. [Google Scholar] [CrossRef]
  57. Rohilla, P.; Yadav, J.P. Acute Salt Stress Differentially Modulates Nitrate Reductase Expression in Contrasting Salt Responsive Rice Cultivars. Protoplasma 2019, 256, 1267–1278. [Google Scholar] [CrossRef] [PubMed]
  58. Van Nuland, A.; Vandormael, P.; Donaton, M.; Alenquer, M.; Lourenço, A.; Quintino, E.; Versele, M.; Thevelein, J.M. Ammonium Permease-Based Sensing Mechanism for Rapid Ammonium Activation of the Protein Kinase A Pathway in Yeast. Mol. Microbiol. 2006, 59, 1485–1505. [Google Scholar] [CrossRef]
  59. Araújo, C.V.M.; Nascimento, R.B.; Oliveira, C.A.; Strotmann, U.J.; da Silva, E.M. The use of Microtox® to assess toxicity removal of industrial effluents from the industrial district of Camaçari (BA, Brazil). Chemosphere 2005, 58, 1277–1281. [Google Scholar] [CrossRef]
  60. Okabe, S.; Kamizono, A.; Zhang, L.; Kawasaki, S.; Kobayashi, K.; Oshiki, M. Salinity Tolerance and Osmoadaptation Strategies in Four Genera of Anammox Bacteria: Brocadia, Jettenia, Kuenenia, and Scalindua. Environ. Sci. Technol. 2024, 58, 5357–5371. [Google Scholar] [CrossRef]
  61. Jung, M.-Y.; Sedlacek, C.J.; Kits, K.D.; Mueller, A.J.; Rhee, S.-K.; Hink, L.; Nicol, G.W.; Bayer, B.; Lehtovirta-Morley, L.; Wright, C.; et al. Ammonia-Oxidizing Archaea Possess a Wide Range of Cellular Ammonia Affinities. ISME J. 2022, 16, 272–283. [Google Scholar] [CrossRef]
  62. Wang, Y.; Zhao, W.; Bai, M.; Qin, Y. Research Progress on Ammonia Oxidizing Microorganisms: The Discovery, Nitrogen Metabolic Pathways, Influencing Factors and Contribution Rate. J. Environ. Chem. Eng. 2025, 13, 117477. [Google Scholar] [CrossRef]
  63. Pappas, G.; Wilkinson, M.L.; Gow, A.J. Nitric Oxide Regulation of Cellular Metabolism: Adaptive Tuning of Cellular Energy. Nitric Oxide 2023, 131, 8–17. [Google Scholar] [CrossRef] [PubMed]
  64. Ke, X.; Wu, Z.-D.; Zhang, X.-Y.; Zhou, S.; Zhang, Y.-C.; Xue, Y.; Zheng, Y.-G. Nitrogen Removal Characteristics and Salt Tolerance Mechanisms of the Novel Bacterium Halomonas Sp. W07 in Saline Wastewater Treatment. Bioresour. Technol. 2025, 426, 132338. [Google Scholar] [CrossRef] [PubMed]
  65. Derkaoui, K.M.; Sahnoune, M.; Belkohodja, M. The Effect of Salinity on Accumulation Proline, Glycine Betaine and Mineral Elements in Four Varieties of Tomatoes. Ukr. J. Ecol. 2022, 12, 58–63. [Google Scholar] [CrossRef]
  66. Xing, J.; Cao, X.; Zhang, M.; Wei, X.; Zhang, J.; Wan, X. Plant Nitrogen Availability and Crosstalk with Phytohormones Signallings and Their Biotechnology Breeding Application in Crops. Plant Biotechnol. J. 2023, 21, 1320–1342. [Google Scholar] [CrossRef] [PubMed]
  67. Mohamed, A.Y.A.; Gill, L.; Monleon, A.; Pronk, M.; Loosdrecht, M.V.; Saikaly, P.E.; Ali, M. Genome-Resolved Metatranscriptomics Unveils Distinct Microbial Functionalities Across Aggregate Sizes in Aerobic Granular Sludge. Environ. Sci. Ecotechnology 2025, 25, 100560. [Google Scholar] [CrossRef]
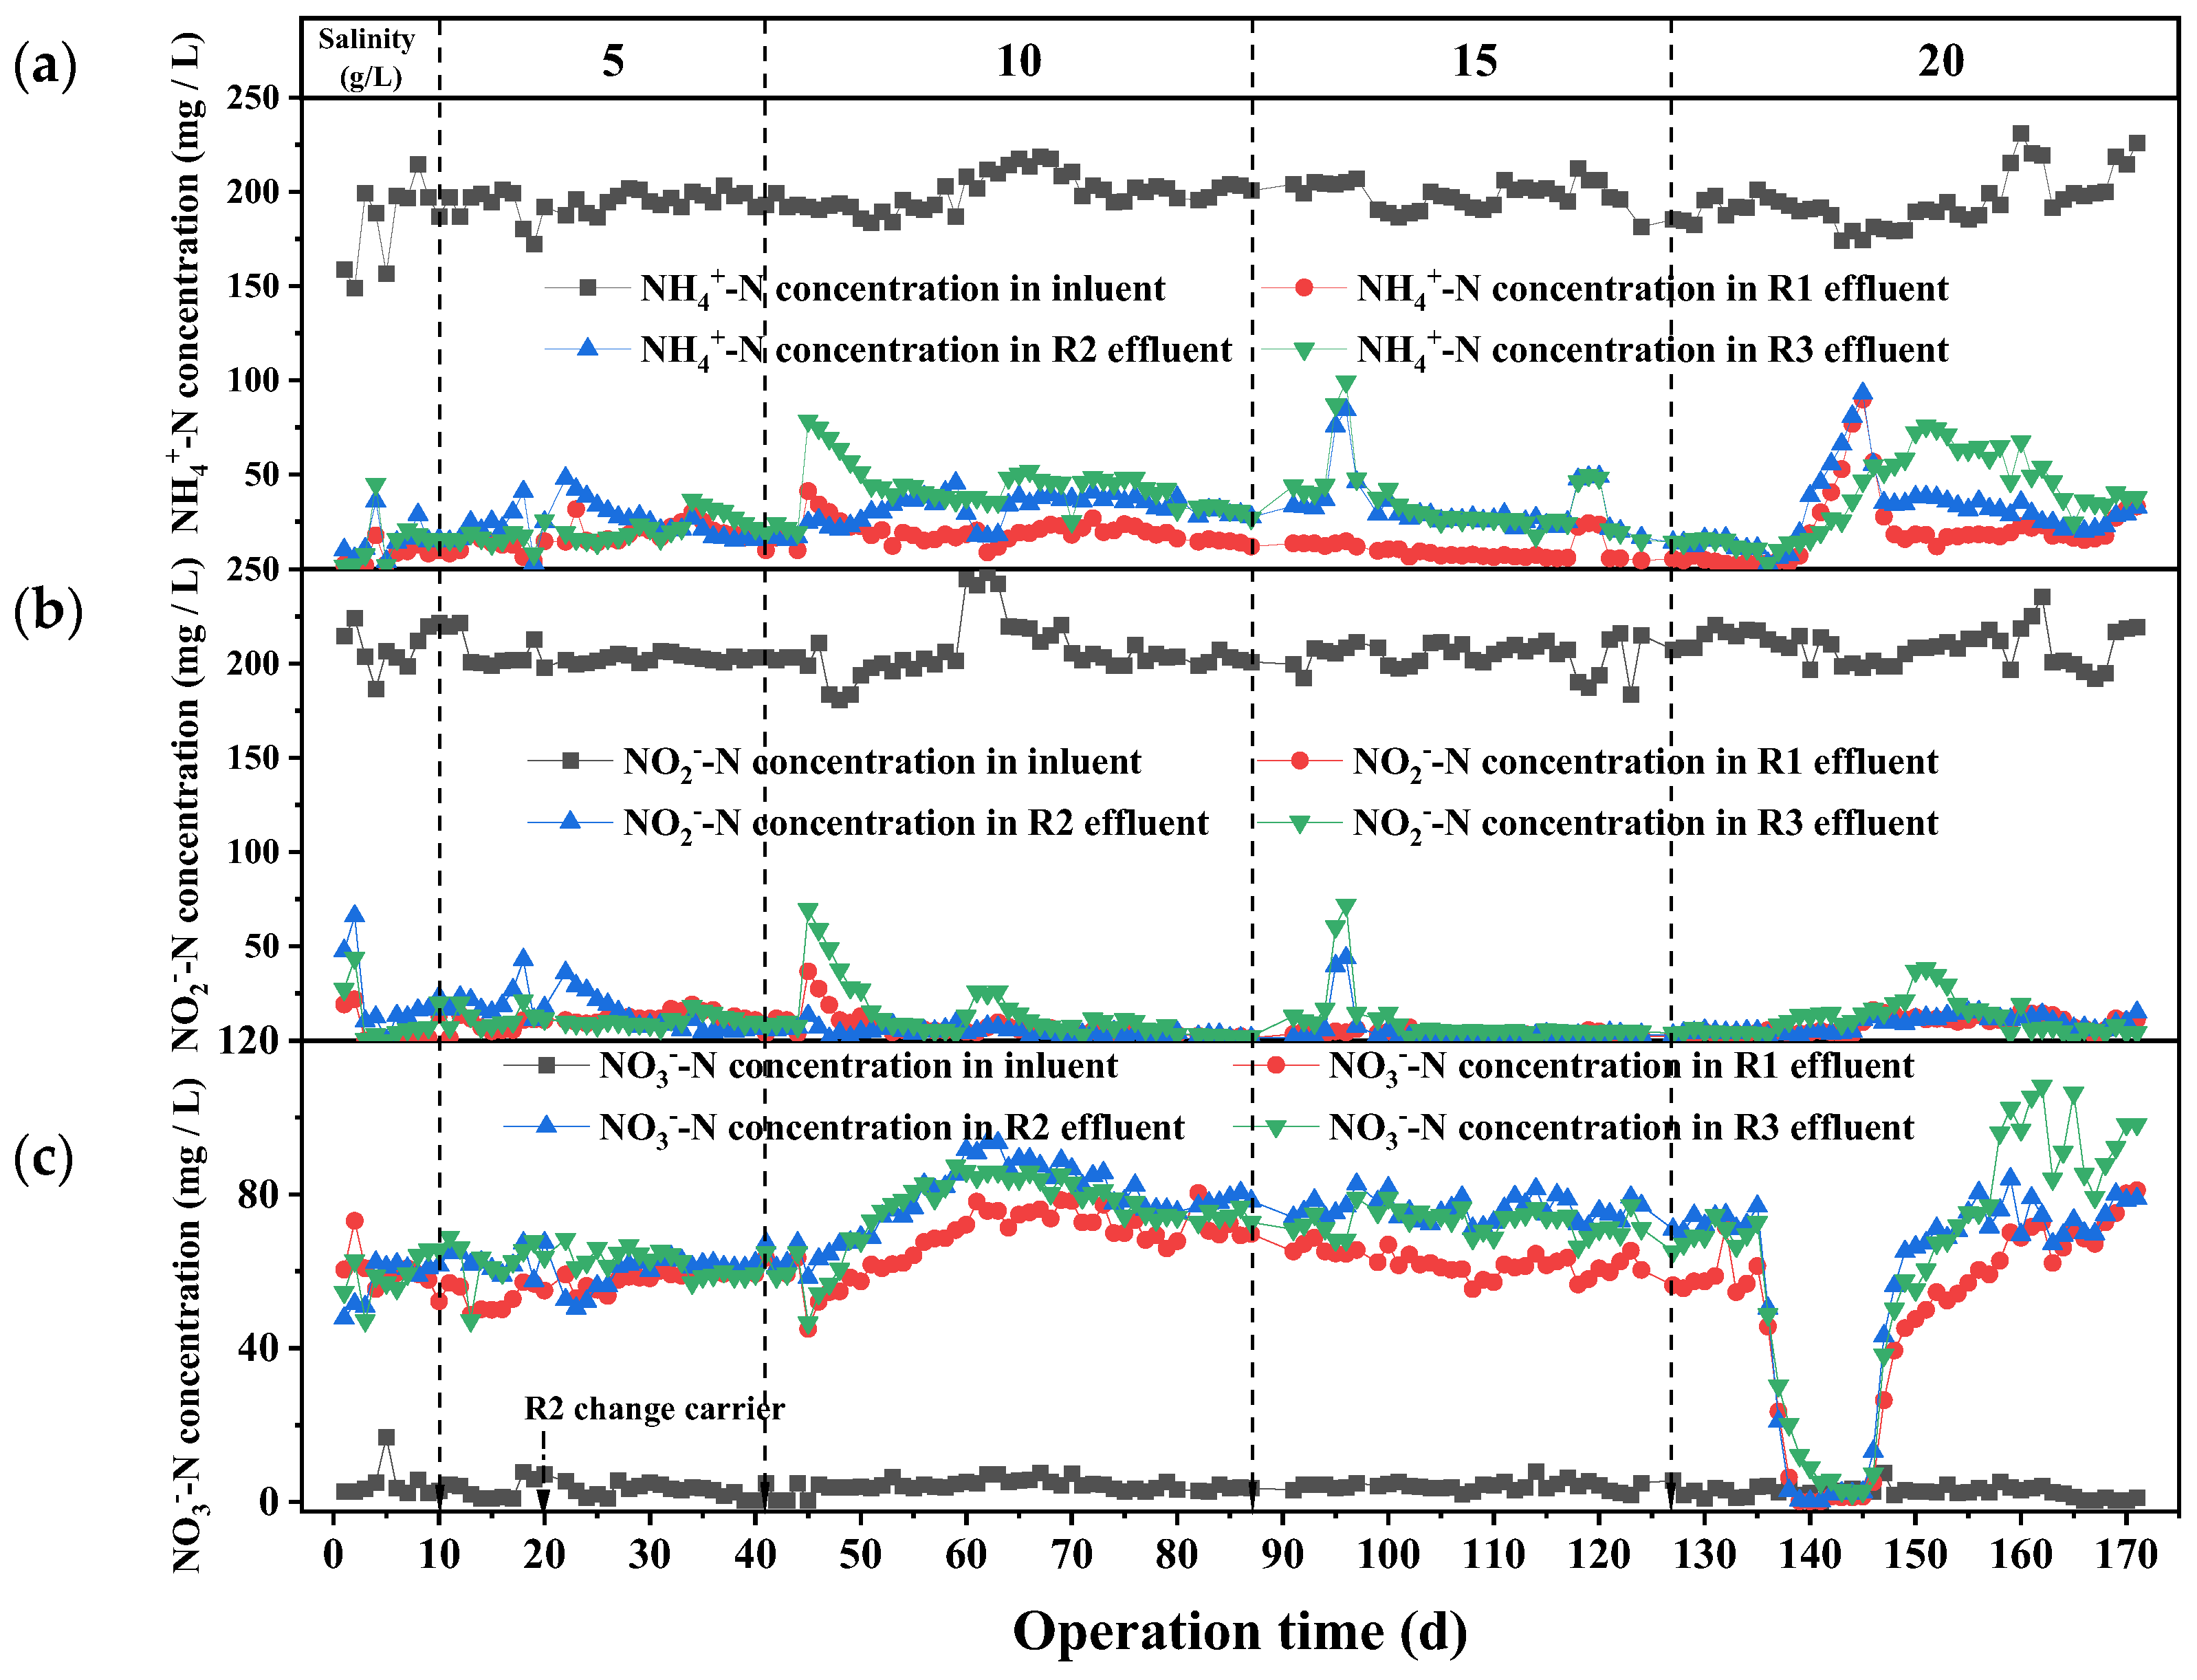
Figure 1. Changes of NH 4 + -N (a), NO 2 -N (b), and NO 3 -N (c) concentration in influent and effluent of R1, R2, and R3 reactors at different salinities.
Water 17 02611 g001
Figure 2. Changes in NRR and NRE of R1, R2, and R3 reactors under different salinity.
Water 17 02611 g002
Figure 3. Changes in MLSS, MLVSS, and MLVSS/MLSS ratio of anammox reaction of R1, R2, and R3 reactors under different salinity.
Water 17 02611 g003
Figure 4. Physical images of R1, R2, and R3 without salinity (a,d,g) and microscopic images (b,e,h) (×40) (c,f,i) (×100).
Water 17 02611 g004
Figure 5. Physical images of R1, R2, and R3 at 20 g/L (a,d,g) and microscopic images: (b,e,h) (×40) (c,f,i) (×100).
Water 17 02611 g005
Figure 6. Changes in extracellular polymeric substances (EPS) of sludge under different salinity levels in R1, R2, and R3: (a) PN, PS, and PN/PS ratio; (b) LB-EPS and TB-EPS composition.
Water 17 02611 g006
Figure 7. Changes in DHA (a), SAA (b), and heme c (c) of activated sludge under different salinity levels in R1, R2, and R3.
Water 17 02611 g007
Figure 8. Relative abundance of the microbial community of R1, R2, and R3 at the phylum levels in different salinity: (a) 0 and 5 g/L, (b) 10 g/L, (c) 15 g/L, (d) 20 g/L.
Water 17 02611 g008
Figure 9. Relative abundance of the microbial community of R1, R2, and R3 at the genus levels in different salinity: (a) 0 and 5 g/L, (b) 10 g/L, (c) 15 g/L, (d) 20 g/L.
Water 17 02611 g009
Figure 10. Genes and pathways involved in nitrogen metabolism in different reactors under the influence of salinity.
Water 17 02611 g010
Figure 11. Expression of different genes related to (a) dissimilatory nitrate reduction; (b) anammox reaction, (c) nitrification, (d) denitrification, (e) ammonium assimilation, and (f) nitrate transport in different reactors under the influence of salinity.
Water 17 02611 g011aWater 17 02611 g011b
Disclaimer/Publisher’s Note: The statements, opinions and data contained in all publications are solely those of the individual author(s) and contributor(s) and not of MDPI and/or the editor(s). MDPI and/or the editor(s) disclaim responsibility for any injury to people or property resulting from any ideas, methods, instructions or products referred to in the content.