Article

Impacts of Reclaimed River-Water Recharge on Groundwater of a Multi-Layered Aquifer System: Combining Hydrochemical Analysis and End-Member Mixing Approaches

1
Key Laboratory of Water Cycle & Related Land Surface Processes, Institute of Geographic Sciences and Natural Resources Research, Chinese Academy of Sciences, Beijing 100101, China
2
Inner Mongolia Coal Geological Exploration (Group) 472 Co., Ltd., Tongliao 028000, China
*
Authors to whom correspondence should be addressed.
Water 2025, 17(17), 2575; https://doi.org/10.3390/w17172575
Submission received: 20 June 2025 / Revised: 25 August 2025 / Accepted: 28 August 2025 / Published: 31 August 2025
(This article belongs to the Section Hydrology)

Abstract

A managed aquifer recharge (MAR) project utilizing reclaimed water has been operated for over 10 years in northeastern Beijing, China, with the goal of restoring the long-dried Chaobai River and replenishing the region’s depleted groundwater resources. To ensure the safe implementation of the project, we quantitatively assessed the impact of river water recharge on the multi-layered groundwater system by investigating the hydrochemical compositions of the reclaimed water, river water, and groundwater. Results show that river water is characterized by higher concentrations of Na+, Cl, and SO42− than found in groundwater, and that river water recharge has altered the groundwater types in the 30 m-depth unconfined layer, changing them from Ca-Mg-HCO3 and Ca-HCO3 types to Na-Ca-HCO3-Cl and Ca-Mg-Na-HCO3 types. End-member mixing analyses of river water samples indicate that three end-members are needed to represent the seasonal and spatial variations in river water. A five-end-member mixing model is then developed to quantify fractions of river water (fR) in different aquifer layers. The estimated fR values vary from 18.4% to 100%, with an average of 67.6% in the 30 m-depth layer, while fR values in the 80 m-depth confined layer are mainly below 30%, with an average of 13.3%, which corresponds well to the known site geology. Overall, combining hydrochemical analysis with the end-member mixing approach is useful for assessing the impact of river recharge on groundwater. This study also highlights the need for high-resolution characterization of subsurface heterogeneity in MAR sites.

1. Introduction

With the increasing demand for and depletion of conventional portable water resources, reclaimed water (or treated wastewater) has been used as a promising alternative for agricultural, industrial, and domestic purposes in arid and semi-arid regions [1,2,3]. One important reuse scheme for reclaimed water is managed aquifer recharge (MAR), during which the treated wastewater is intentionally recharged into aquifers through river channels [4], infiltration ponds [5], or other types of facilities [6]. Over the past 60 years, MAR has been studied and practiced globally [3,7,8] for subsequent recovery or environmental purposes [9] and to compensate for water shortages [10], etc.
Although the utilization of reclaimed water can provide ecological benefits for urban streams, potential impacts on both aquatic systems and human health cannot be overlooked [11], especially when a large quantity of reclaimed water is used for groundwater recharge [12]. For example, the long-term infiltration of reclaimed water and triggered soil–water interactions can lead to elevated concentrations of organic pollutants [4], nitrates, and heavy metals [13], as well as high numbers of pathogenic microorganisms [14] in groundwater. Therefore, it is critically important to thoroughly assess the potential impacts of reclaimed municipal wastewater infiltration at MAR sites [15,16].
In northeastern Beijing, China, one MAR project utilizing the river recharge strategy has been implemented since 2007 to restore the long-dried Chaobai River and to replenish the depleting groundwater in the underlying multi-layered aquifer system. Previous studies at this MAR site have shown that the river water recharge affected the hydrodynamic field of the underlying multi-layered aquifer system [17]. The hydrochemistry of groundwater in the shallow unconfined and deep confined aquifer layers has also been affected to different extents [18,19,20]. In addition, Li et al. [19] and He et al. [20] have also calculated the mixing ratios of the recharged water in groundwater, utilizing Cl as a conservative tracer for mixing analyses.
When performing mixing analysis in river-water-connected aquifer systems, the efficiency of conventional approaches depends highly on the distinct differences in concentrations or ratios of components between the ambient groundwater and recharging sources [21,22,23]. In mixing-dominated aquifer systems, conventional single- or multiple-component methods are not always straightforward, as both the input and background concentrations can vary spatially and temporally (e.g., [4,21]). In addition, although seasonal and spatial changes in water quality have been documented by Yang et al. [22] at the Chaobai River, its impacts on river water recharge and river water-groundwater mixing processes have not been considered.
To address this issue, the application of multiple tracers [24] and the joint use of multivariate statistical methods (e.g., principal component analysis, PCA) and end-member mixing analyses (EMMA) have been developed to extract information from heterogeneous datasets (e.g., [25,26]). Unlike previous studies, which used a single component for mixing ratio calculations and ignored the seasonal changes in water quality at the Chaobai River [18,19,20], this study quantitatively investigates the impacts of reclaimed river water recharge on the groundwater system by developing mixing models that consider multiple end-members at this long-term MAR site.
Therefore, the primary objective of this study is to delineate the impacts of river water recharge on a multi-layered aquifer system, through combining hydrochemical analysis and end-member mixing approaches. We first investigated the hydrochemical characteristics and controlling processes of the river water and groundwater geochemistry. Then, PCA was performed to delineate the main controlling factors. A series of EMMA was then performed to quantify the contribution of river water recharge on groundwater. Our study provides a general understanding of the status of the groundwater at the Chaobai River MAR site, which is of great importance for the future management of this and other sites operating in the multi-layered aquifer systems.

2. Materials and Methods

2.1. Site Description and Hydrogeology

The Chaobai River MAR site is located in northeastern Beijing, and it belongs to the semi-arid monsoon climate characterized by cold, dry winters and hot, dry summers. The pan evaporation rate is 1690 mm/a. The average precipitation ranges from 400 to 600 mm/a, with 70% of the rainfall occurring during July and September [27]. Since 1999, the section of the Chaobai River between Xiangyang sluicegate and Henan rubber dam (Figure 1a) has been in a state of no flow.
To restore river ecology, municipal wastewater treated using a membrane bioreactor was transferred to supply the surface runoff of the Jian River and Chaobai River starting in October of 2007. The Jian River generally flows from west to east. The river section between the Xiangyang sluicegate and the Henan rubber dam of the Chaobai River is about 7.3 km long, with most of the river channel ranging from 200 to 400 m wide. Since October of 2008, the section between the Xiangyang sluicegate and the earthen dam has received water only in May and October each year. In contrast, the Jian River and the section between the earthen dam and the Henan rubber dam of the Chaobai River have consistently received reclaimed water, indicated as the intermittent and permanent intake areas in Figure 1a, respectively. Downstream of the Henan rubber dam has received reclaimed water since early 2012. In the permanent intake area, the average water depth is 2.5 m, and the width of the impoundment channel ranges from 200 to 400 m. In the intermittent intake area, the river channel gradually dried up due to evaporation and infiltration after receiving water [19].
The aquifer system in the study area is composed of multiple layers of fine sand and gravel of the Chaobai River alluvial fan, which are separated by several silty clay layers, as shown in Figure 1b for the site geology along cross-section I–I’. In Figure 1b, the lengths of the well screens are scaled to the well construction details. For example, well 1 (30) is screened from 10.4 to 38.5 m below the ground surface (mbgs), well 1 (50) from 47 to 53 mbgs, and well 1 (80) from 64 to 81 mbgs. In addition, scales are provided in Figure 1a to show the relative distances of the wells to the riverbank. Generally, this MAR site can be conceptualized as an aquifer system with three aquifer layers: a thick unconfined/semi-confined layer, the 30 m-depth aquifer, and two thin confined layers, the 50 m- and 80 m-depth aquifers. Groundwater in this area generally flows from south to north, with the water in the upper aquifer layer gradually recharging the deep aquifers through silty clay layers.

2.2. Sample Collection and Analysis

The water sampling locations are shown in Figure 1a. A total of 18 river water samples were collected in September and November of 2017, and in May of 2018, to examine the hydrochemical variations in both the dry and wet seasons. Forty-eight groundwater samples were collected from three aquifer layers in May of 2018, covering both the intermittent and permanent intake areas.
The hydrochemical parameters analyzed in this study include on-site indices (e.g., pH and electrical conductivity (EC)), cations (K+, Na+, Ca2+, and Mg2+), anions (Cl, SO42−, and HCO3), nitrogen (NH4-N, NO3-N, and NO2-N), total organic carbon (TOC), permanganate index (CODMn), and total dissolved solids (TDS). EC and pH were measured using a WTW portable multi-parameter instrument. Water samples were filtered through the 0.45 μm membrane during on-site sampling. The hydrochemistry compositions of the water samples were analyzed in the physical and chemical analysis laboratory at the Institute of Geographic Sciences and Natural Resources Research, Chinese Academy of Sciences. Cations were analyzed using inductively coupled plasma-mass spectrometry (ICP-MS; Perkin-Elmer Optima5300DV, Waltham, MA, USA), with a detection limit of 0.01 mg/L. The main anions were determined by Ion Chromatograph (LC-10AD, Shimadzu, Tokyo, Japan), with a detection limit of 1 mg/L and accuracy of 1%. The content of HCO3 was determined by titration with the addition of sulfuric acid (0.02 mol/L), using methyl orange as the indicator. CODMn was determined by the acidic potassium permanganate method, with a detection limit of 0.05 mg/L. Generally, charge balance errors were less than 5% for 96% of the samples, and below 10% for the other samples.

2.3. Data Analysis Methods

The chemical weathering of minerals (e.g., calcite, dolomite, Ca-, Na-, and K-feldspar) in the Chaobai River basin could yield various combinations of dissolved ions, as illustrated by distinct ionic ratios in river water and groundwater [28]. As a result, milligram equivalent ratios of Na/Cl, K/Cl, Ca/Cl, and Mg/Cl, as well as bivariate relationships of HCO32− + SO42− vs. Ca2+ + Mg2+, HCO3 vs. Ca2+ + Mg2+, SO42− vs. Ca2+, TDS vs. Na/(Ca + Na), and Mg/Na vs. Ca/Na were used to gain insight into the geochemical processes controlling the changes in water quality.
Multivariate statistical analyses were conducted to extract site-specific geochemical information from water samples produced by water–rock reactions and mixing processes. PCA was applied to explain the variability within the dataset. Unlike the direct analysis of the measured data, PCA is a data transformation technique that attempts to reveal the underlying structures within the multivariate dataset. Principal components (PCs) were extracted from the correlation matrix computed for the variables, with each PC representing a linear combination of the original variables. During the PCA of the current study, the varimax rotation of the eigenvalues was applied to extract PCs that could be readily explained in terms of hydrochemical or anthropogenic processes [25]. The Kaiser criterion [29] was used to determine the number of PCs extracted to explain the underlying data structure. The statistical treatment of the hydrochemical dataset was performed using the SPSS software version 19.0 (SPSS, Inc., Chicago, IL, USA).
To quantify the impact of river water recharge, a mixing analysis was conducted to estimate the proportions of water from different sources in groundwater samples from the multi-layered aquifer system. The maximum likelihood method developed by Carrera et al. [30] was adopted to delineate the mixing problems of river water with groundwater in different layers of the MAR sites. In this approach, end-member concentrations as well as their mixing ratios could be jointly estimated while maximizing the likelihood of concentration measurements of water samples. The reliability of the measurements for both the end-member and mixed sample was required and defined as standard deviation values, which represent the weights assigned to each parameter depending on their consistency during end-member analyses. The generally constrained optimization problem was iteratively solved using the MIX algorithm [30]. This code has been successfully applied in various studies (e.g., [26,31]).
In the current study, EMMA involved PCA to determine the minimum number of end-members required to explain the majority of the spatiotemporal variability of chemical species in all samples [31,32]. This approach has previously been utilized to identify sources of stream water recharge [33,34]. Then, an initial mixing calculation using all available species was conducted to identify potentially non-conservative processes, by examining the species that display large residuals from conservative mixing calculations, thus eliminating the impact of the non-conservative mixing. Once the number of end-members needed to explain the sample variance was defined, EMMA analyses were systematically performed with conservative species using the MIX code [30].

3. Results

3.1. Hydrochemical Characteristics

Descriptive statistics of in situ parameters such as pH, together with major ions in groundwater and river water samples, are presented in Table 1. The pH values range from 7.3 to 9.6 for groundwater, and from 7.7 to 9.0 for river water, respectively, indicating that both kinds of water are alkaline. River water samples have higher average concentrations of K+, Na+, Cl, SO42−, NO3-N, CODMn, and TOC than those of the groundwater samples, while the latter have higher average values of Ca2+, Mg2+, and HCO3 than those of the former. Concentrations of Ca2+, HCO3, Na+, Cl, SO42−, and TDS show greater variations than the other parameters in terms of standard deviation values, in both groundwater and river water samples.
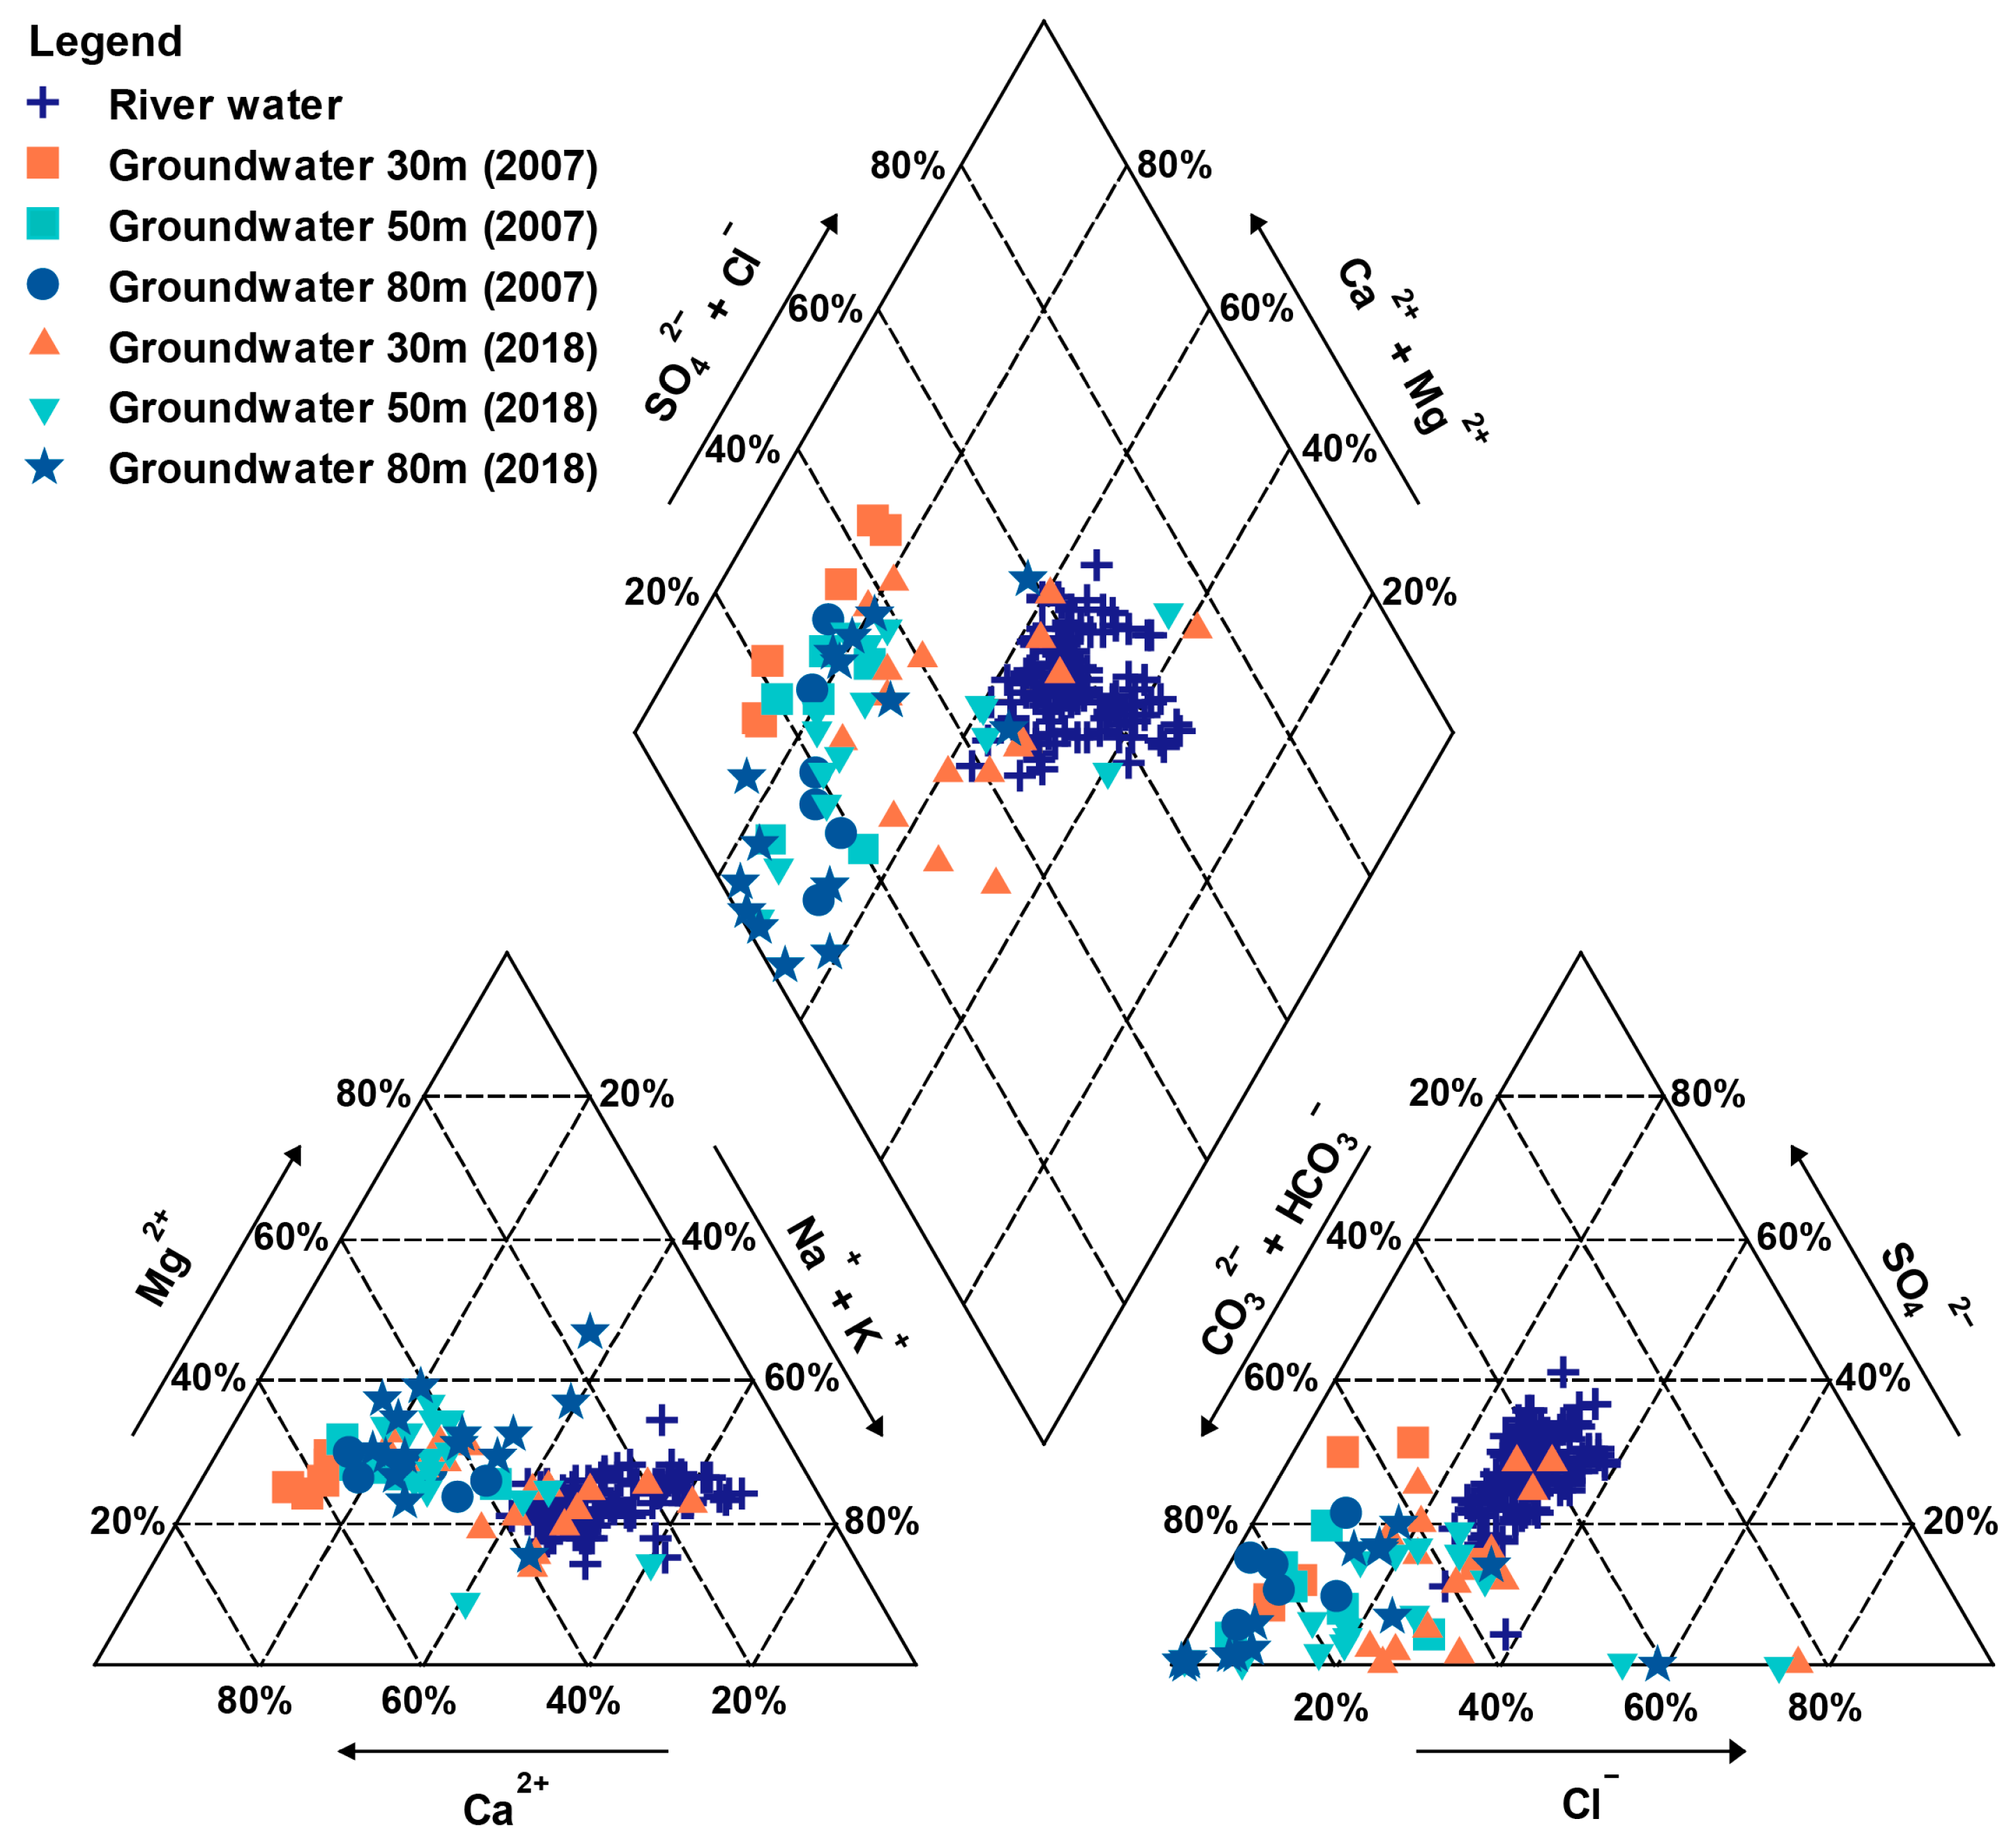
Based on the hydrochemical data, river water samples were mainly characterized by Na-Ca-HCO3-Cl and Na-Ca-HCO3-SO4 types. Groundwater samples collected in May of 2018 mainly belonged to Na-Ca-HCO3-Cl and Ca-Mg-Na-HCO3 types for the 30 m-depth aquifer, Ca-Mg-Na-HCO3 and Ca-Mg-HCO3 types for the 50 m-depth aquifer, and Ca-Mg-HCO3 and Ca-Mg-Na-HCO3 types for the 80 m-depth aquifer (Figure 2).
To illustrate the temporal changes in the hydrochemistry of different aquifer layers, groundwater samples collected in September and October of 2007 were compiled from [35] and also plotted in Figure 2. These samples mainly fell within the Ca-Mg-HCO3 and Ca-HCO3 types.
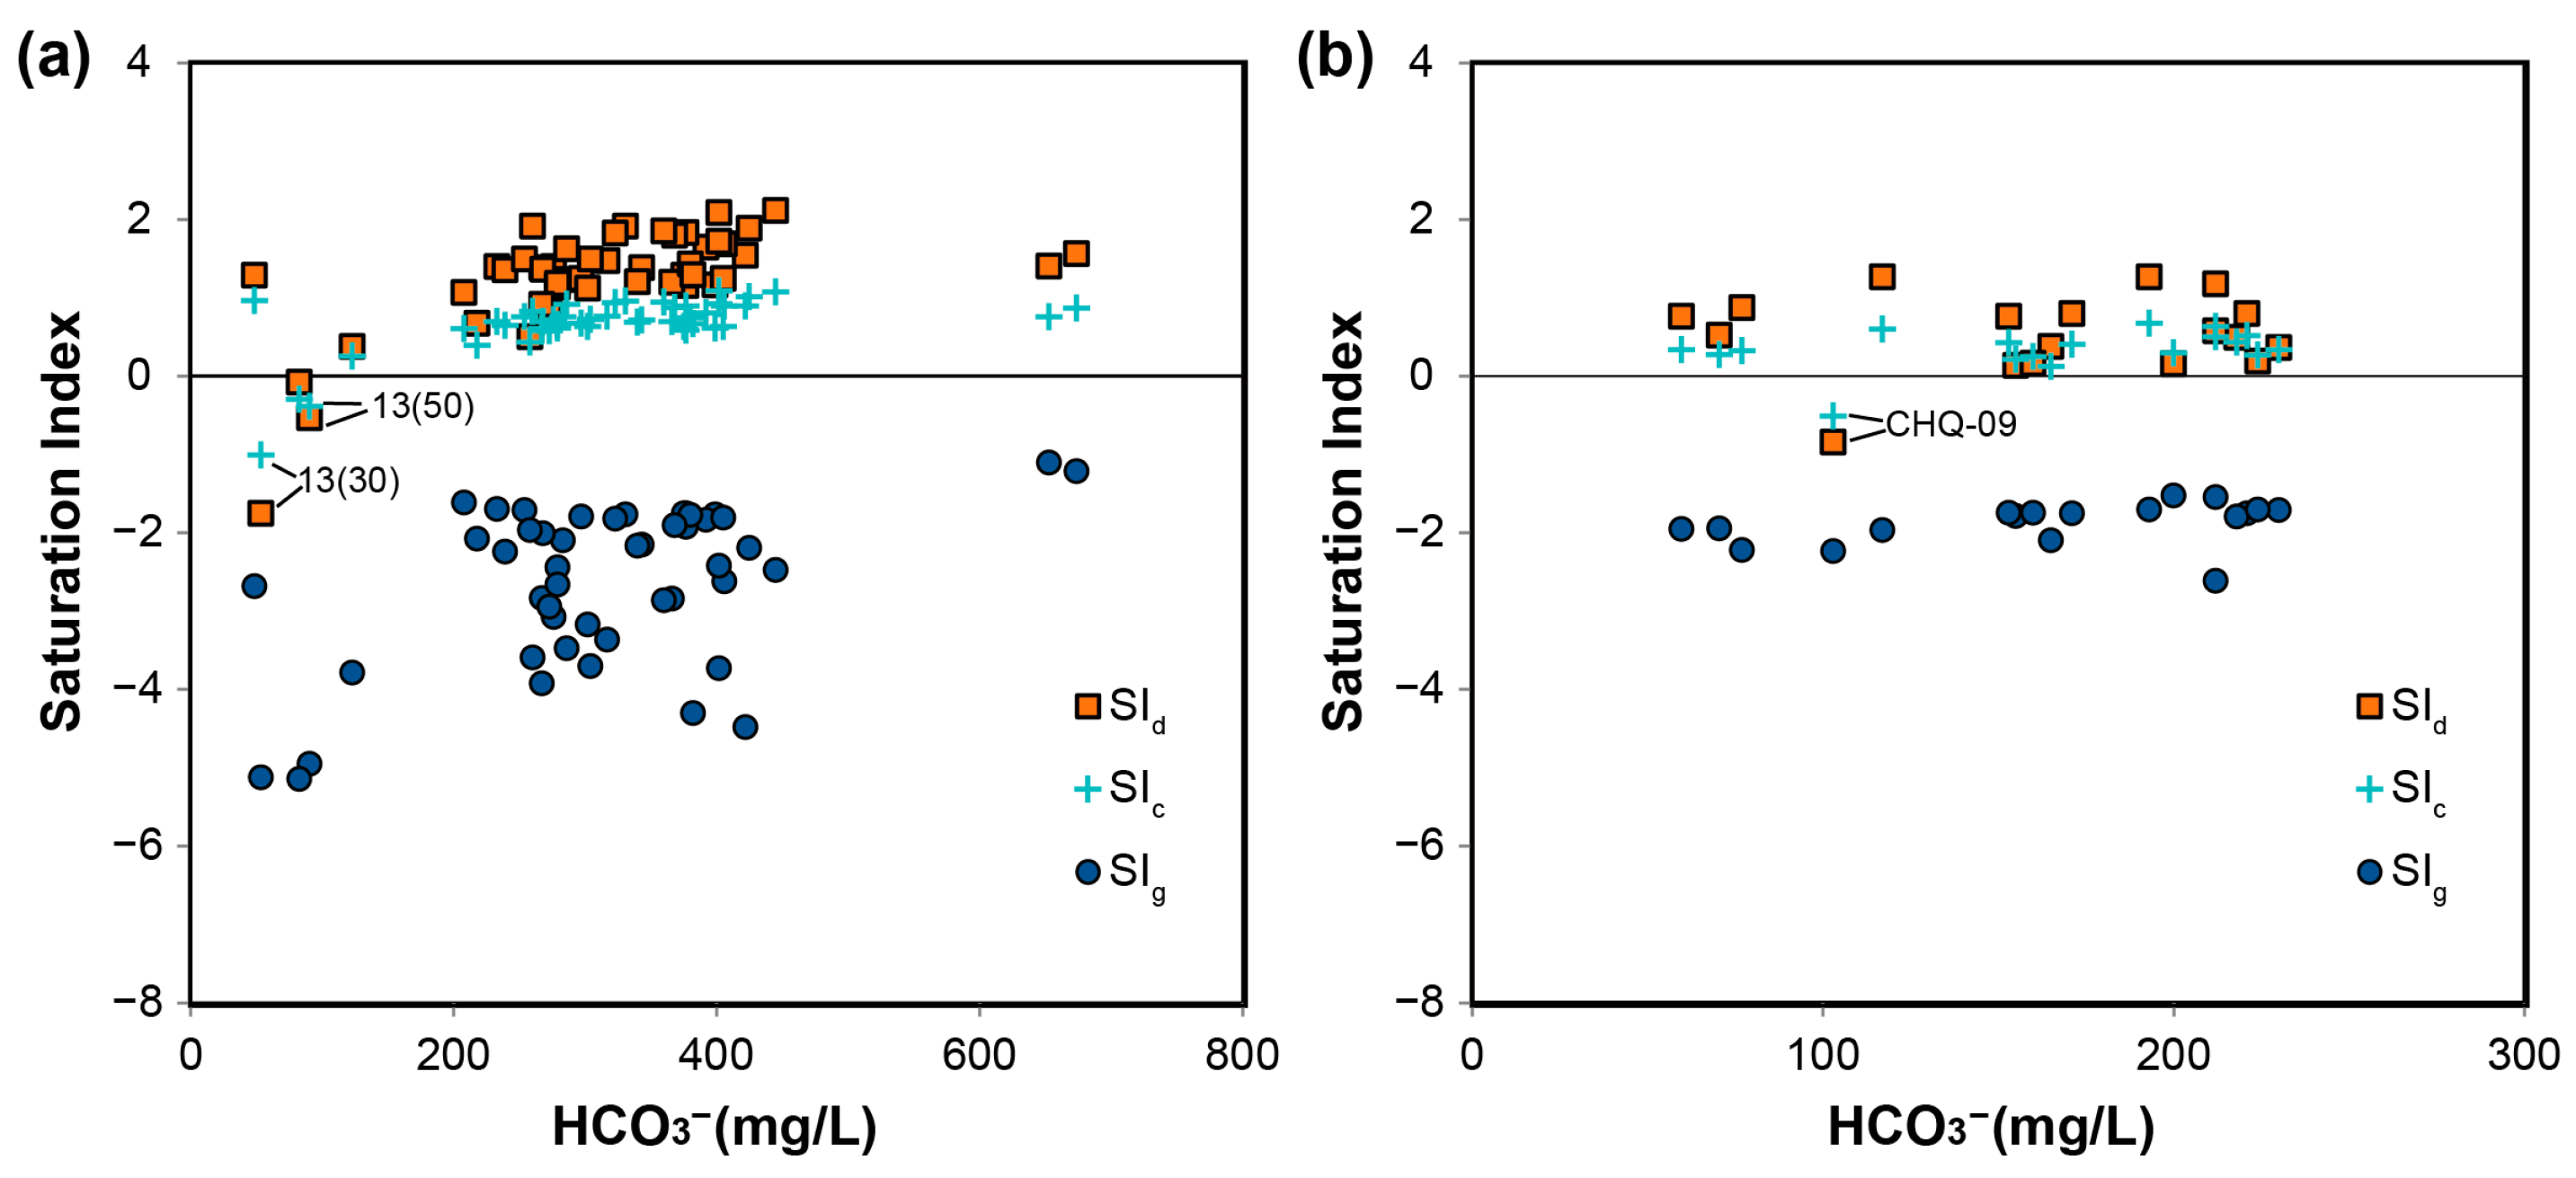
The mineral saturation indices of calcite, dolomite, and gypsum are calculated for water samples and plotted in Figure 3. Generally, most of the samples were oversaturated with both dolomite and calcite (Figure 3a), except for those taken from the 30 m-depth and 50 m-depth aquifer layers at monitoring well 13. River water samples, except for CHQ-09, were also oversaturated with both dolomite and calcite (Figure 3b), but generally to a lesser extent than those of the groundwater samples. All water samples were under-saturated in gypsum, suggesting a tendency for gypsum minerals to dissolve in both river water and groundwater.

3.2. Principal Component Analysis

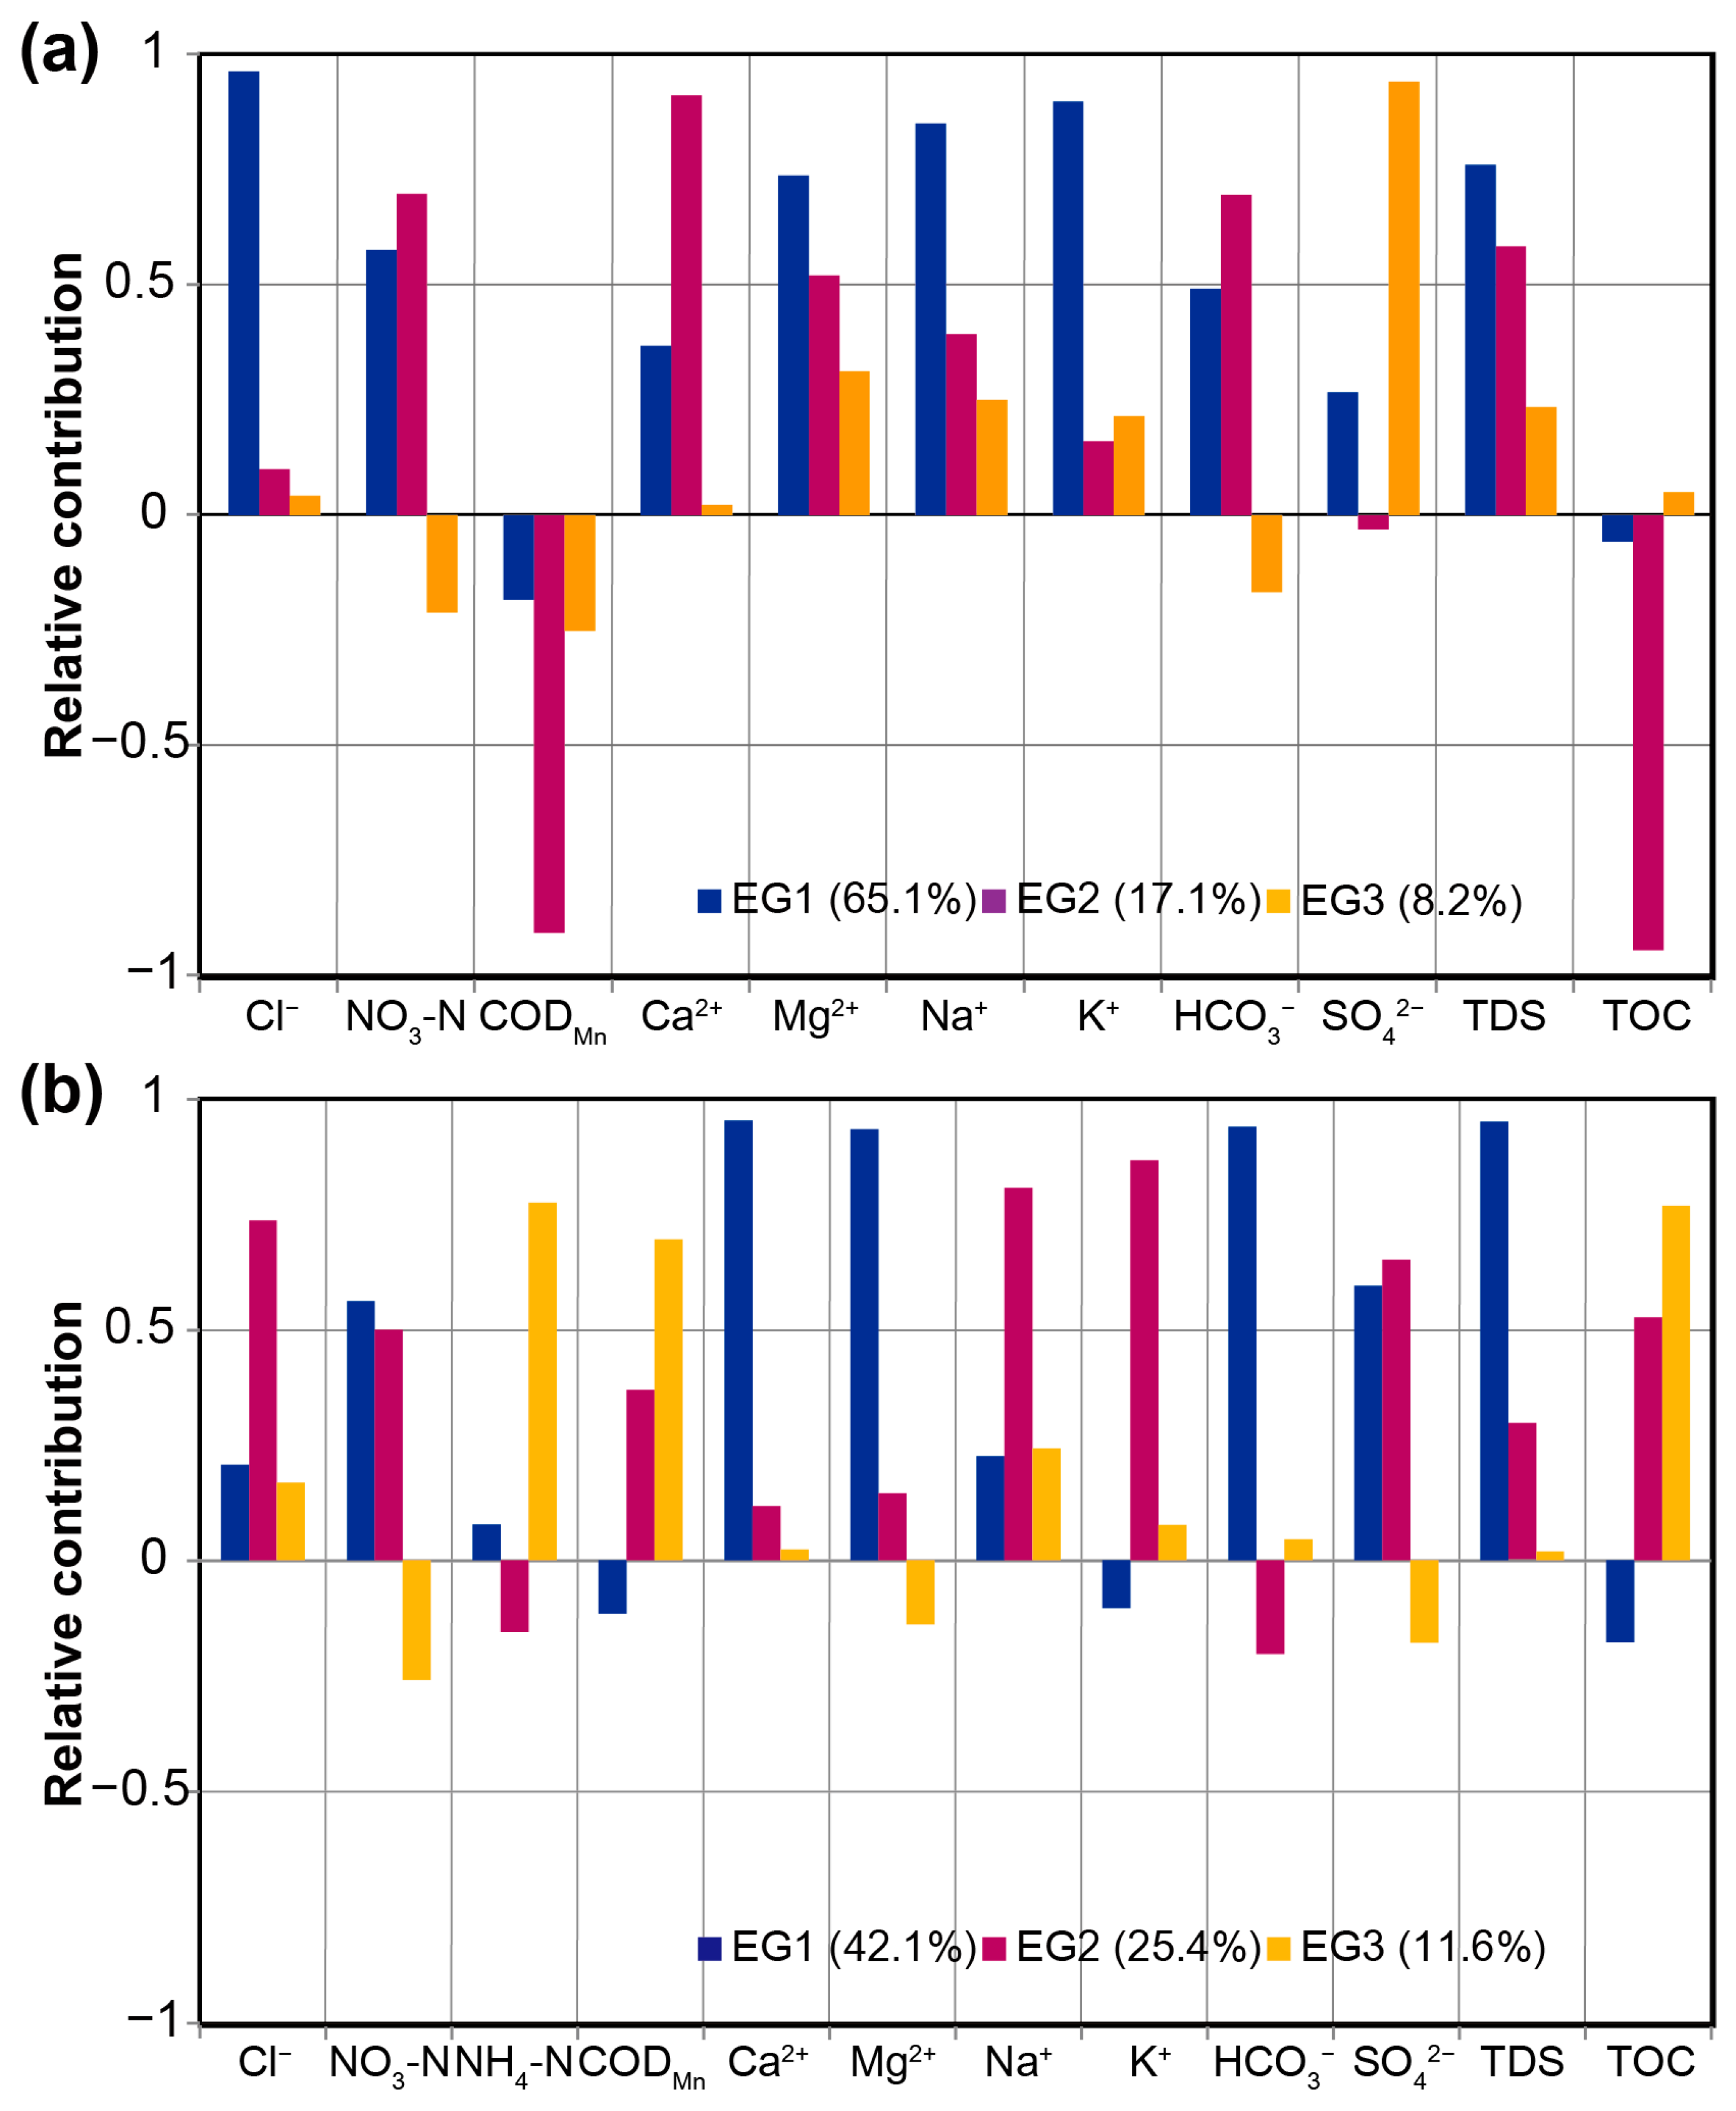
Principal component analyses were performed separately for (a) river water samples and (b) groundwater samples. The results of PCA analysis for river water samples are shown in Figure 4a. Eleven species were selected for the PCA, including K+, Na+, Cl, SO42−, NO3-N, Ca2+, Mg2+, HCO3, CODMn, TDS, and TOC, while pH and NH4-N were excluded due to their low data variations (Table 1).
For river water samples, the first three principal components, which explained a total of 90.4% of the variance, were selected. The first component (EG1, accounting for 65.1% of the variance) had high positive loadings for Cl, Mg2+, Na+, K+, and TDS. The second component (EG2, accounting for 17.1% of the variance) had high positive loadings for NO3-N, Ca2+, and HCO3 and high negative loadings for CODMn and TOC. The third component (EG3, accounting for 8.2% of the variance) had a high positive loading for SO42−.
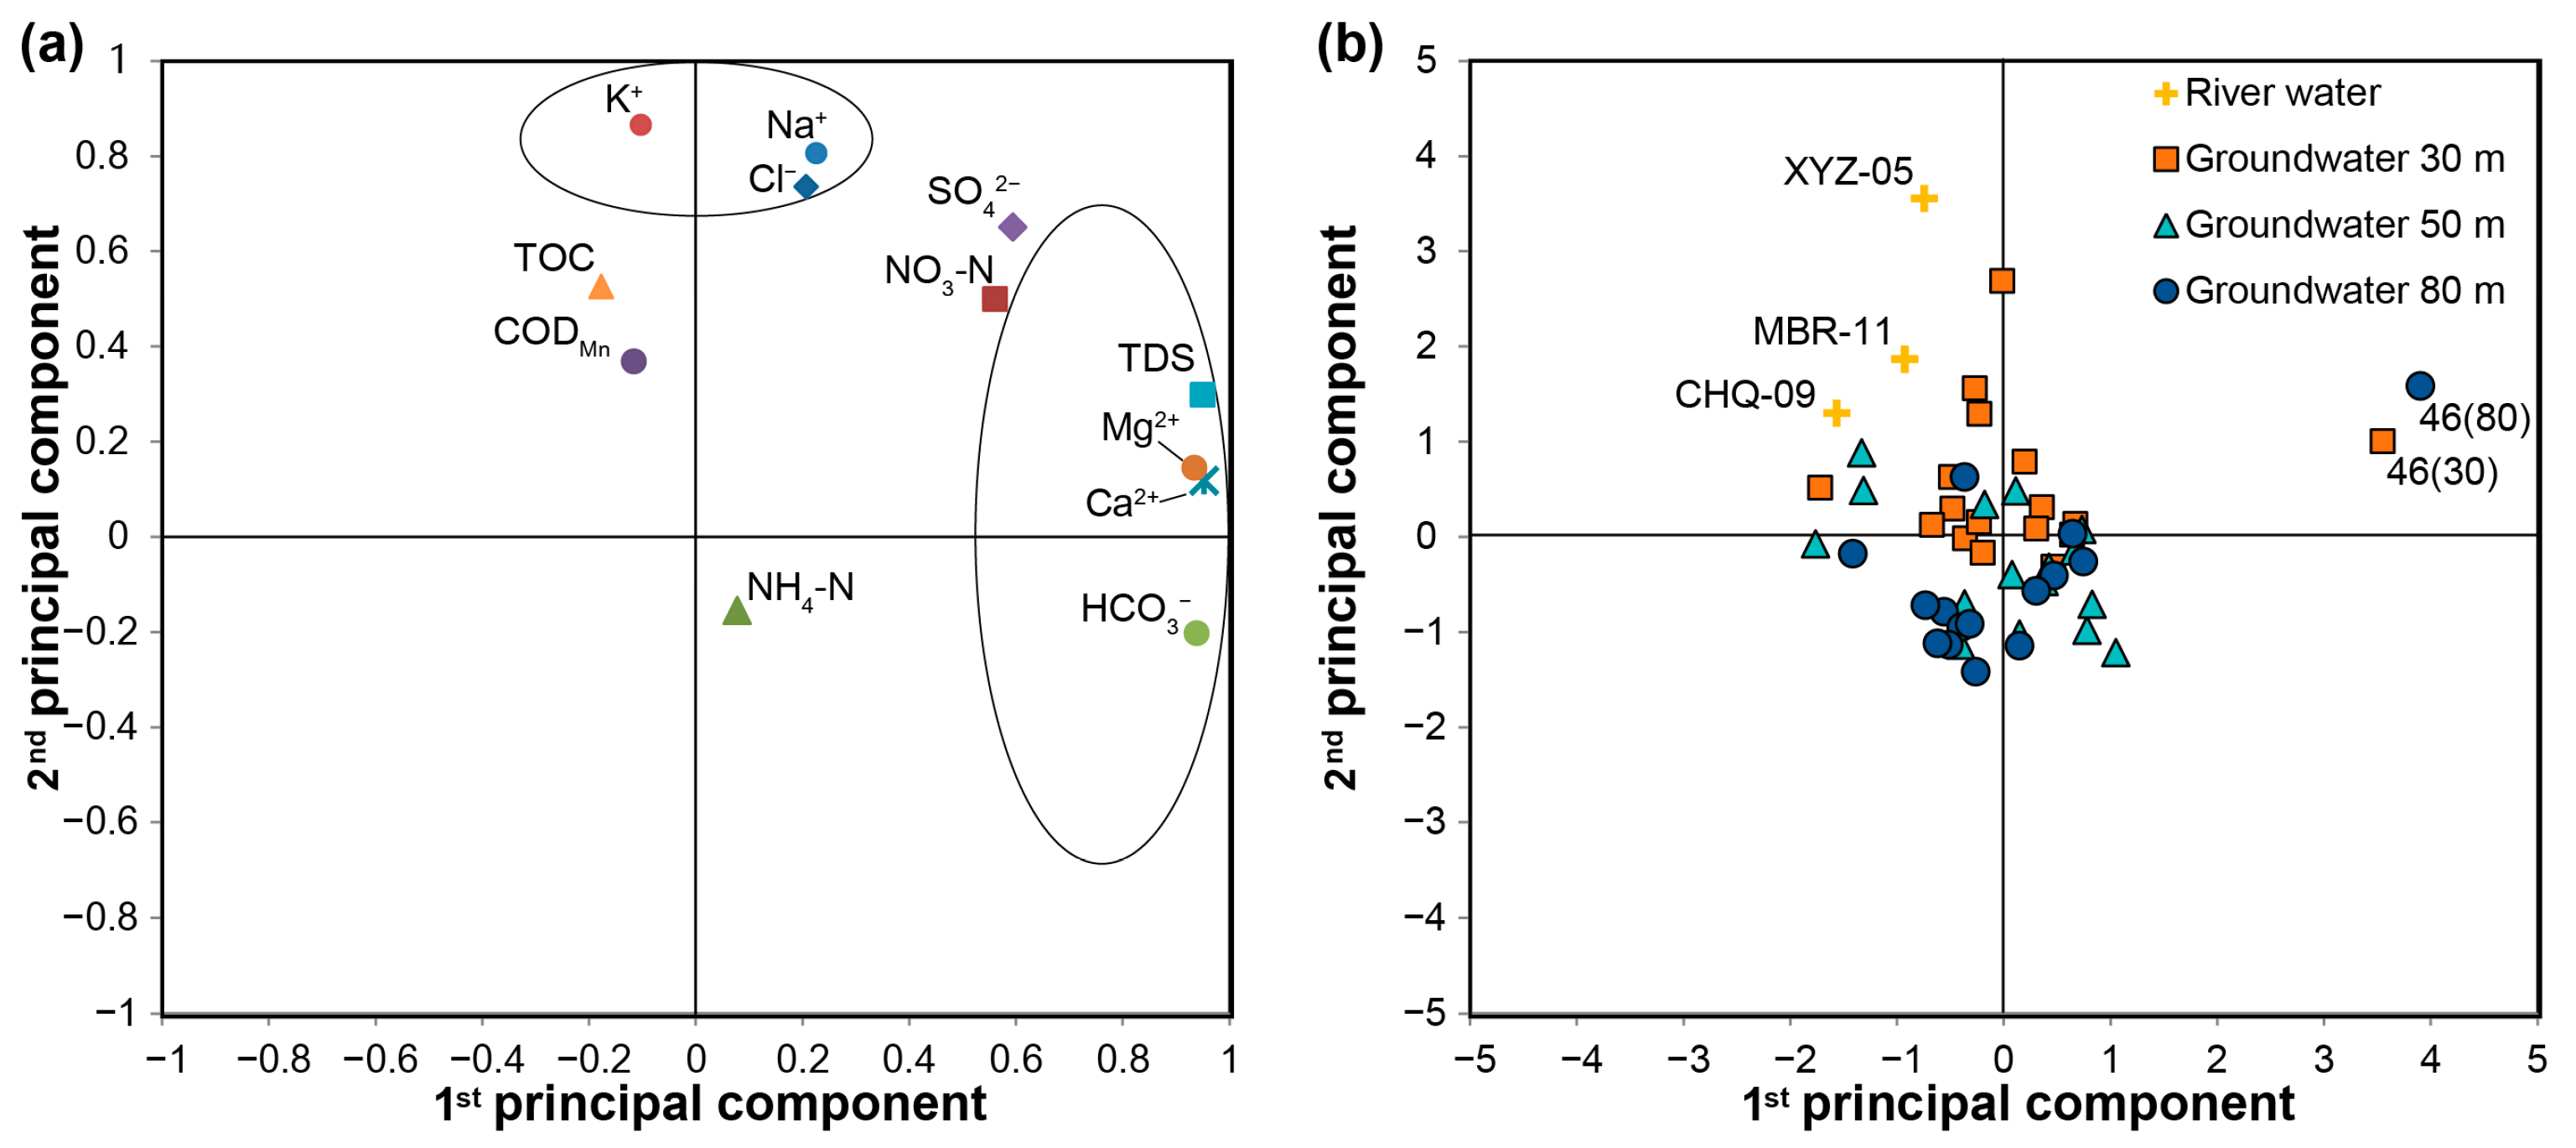
For the groundwater samples, 12 species were selected for PCA, and the first three principal components, explaining a total of 79.1% of the variance, were retained (Figure 4b). The first component (EG1, accounting for 42.1% of the variance) had a high positive loading for Ca2+, Mg2+, HCO3, and TDS. The second component (EG2, accounting for 25.4% of the variance) had high positive loadings for Cl, Na+, and K+. The third component (EG3, accounting for 11.6% of the variance) had high positive loadings for NO3-N, NH4-N, and TOC. The distinct contribution patterns of the variables to the principal components in the two analyses above may indicate that different factors control the hydrochemistry of the river and groundwater samples.

3.3. EMMA for River Water and Groundwater

In this study, river water could be considered as a mixture of the MBR water and rainwater, and is affected by factors like evaporation and seasonal variations of reclaimed water. End-members of river water were selected through performing PCA of the collected water samples, which has been proven as an effective approach (e.g., [25,26]) to extract information from the heterogeneous dataset and to define potential end-members that are representative enough to characterize the spatiotemporal variations in water chemistry.
The scores of the first and second principal components for river water samples are projected in Figure 5. The first component distinguishes river water collected in the rainy season (samples of September 2017) and the dry season (samples of May 2018), while samples collected from the reclaimed water outlets (e.g., MBR-09, MBR-11) and locations (CJ and BBQ in Figure 1a) close to the outlet have high scores for the second component.
Based on the projection of the first and second principal component scores, three samples could be defined as initial end-members for the mixing analysis. The concentrations of these three initial end-members are listed in Table 2. The first end-member (EM1) corresponds to the CHQ-09 sample, which had the lowest value of TDS (310.9 mg/L) and the lowest concentrations of Ca2+, Mg2+, Na+, K+, and Cl (17.6 mg/L, 12.9 mg/L, 40.1 mg/L, 8.2 mg/L, and 53.1 mg/L, respectively) of all river water samples (Table 1). This end-member can be attributed to river water possibly diluted by rainfall during the rainy September. The second initial end-member (EM2) is defined as the MBR-11 sample, which had the minimum values of CODMn and TOC (3.1 mg/L and 3.3 mg/L, respectively). Sample XYZ-05 was selected as the third initial end-member (EM3), which had the maximum value of Cl (104.0 mg/L) in river water samples. Given the conservative feature of Cl, its high concentration in the XYZ-05 sample could be attributed to a water sample collected during the dry period.
From the PCA results for river water samples in Figure 5, it is clear that river water showed strong seasonal and spatial variations in terms of scores for the first and second principal components, respectively. Therefore, the selected end-members were deemed to represent the spatiotemporal variations in river water chemistry, instead of only the spatial variation. For example, the scores for the first and second principal components of the XYZ-05 sample are closer to those of the CHQ-05 sample than those of the XYZ-09 sample in Figure 5.
Groundwater in the Chaobai River MAR site was affected by the river recharge, and three end-members were needed to characterize the spatiotemporal variations in river water chemistry. Therefore, the relative contributions of river water to groundwater in the multi-layer aquifer system can be conceptualized as the mixture of river water and ambient groundwater end-members. The results of PCA for groundwater samples are projected in Figure 6a,b for loadings of 12 variables and PCA scores for all groundwater samples. The high positive loadings for Ca2+, Mg2+, HCO3, and TDS of the first PC suggest the impact of mineral dissolution on groundwater chemistry, while the high positive loadings for K+, Na+, and Cl of the second PC clearly suggest the contribution of river water recharge. In Figure 6b, three river water samples (XYZ-05, MBR-11, and CHQ-09), which are identified as end-members in the previous Section 4.2, are also included. Groundwater samples (e.g., 13 (30), 13 (50), 46 (30), and 46 (80)) showing impact from anthropogenic sources were excluded for end-member identification. Based on the distribution pattern of sample scores in Figure 6b, samples 32 (50) and 31 (80) were selected as two new end-members, as EM4 and EM5, for mixing analyses in addition to the three end-members of the river water. In Figure 6b, groundwater samples from the same aquifer layer are more closely clustered, suggesting the validity of PCA in defining potential end-members.

4. Discussion

4.1. Processes Controlling Hydrochemical Variations

The relationship between Na+ and Cl ions in river water and groundwater samples is plotted in Figure 7a. At low Na+ concentration (<2 mmol/L), the contents of Na+ in the groundwater samples of the 50 m- and 80 m-depth aquifer layers were higher than those of Cl in Figure 7a, indicating Na+ sources such as silicate mineral (e.g., feldspar in the current study) dissolution in the groundwater [13,36]. At high Na+ concentrations, Na+ and Cl ions were strongly correlated, and groundwater samples from different aquifers generally followed a similar deviating trend as river water samples, with only several outliers showing a Cl concentration greater than that of Na+. As described in Section 3.1 and Table 1, the reclaimed water recharging river water was characterized by high Na+ concentrations. Therefore, points below the 1:1 line in Figure 7a could be attributed to the mixing of river water with groundwater, while points (e.g., 13 (30) and 13 (50)) above the 1:1 line may indicate an anthropogenic source of Cl, such as Cl bearing waste water.
To explain the potential impact of mineral dissolution on water chemistry, Ca2+ + Mg2+ versus HCO3 and HCO3 + SO42−, and Ca2+ versus SO42−, are plotted in Figure 7b–d. It is expected that the carbonates, gypsum, and Ca-Mg-silicates dissolution provide a 1:1 equivalent ratio between these indices. In Figure 7b, both groundwater and river water data points show a strong linear correlation between Ca2+ + Mg2+ and HCO3 + SO42−, although HCO3 + SO42− is consistently higher than Ca2+ + Mg2+. The scatterplot between Ca2+ + Mg2+ and HCO3 shows an improved correspondence of data points with the 1:1 line in Figure 7c. These results suggest the prevalence of calcite, dolomite, and Ca-Mg-silicates dissolution over gypsum, or the potential depletion of Ca2+ and Mg2+ by cation exchange reactions [13,37]. The scatterplot of Ca2+ versus SO42− illustrates that ambient groundwater tends to have low SO42− concentrations (Figure 7d), and mixing with river water leads to the increased SO42− concentrations in 30 m-, 50 m-, and 80 m-depth aquifer layers.
The Gibbs plot can be applied to identify the controlling mechanisms of water chemistry [38]. The weight ratios of groundwater Na/(Na + Ca) showed no discernible trend towards evaporation, and some of them overlapped with river water samples, suggesting that rock weathering and mixing played a major role in controlling the hydrochemistry of the groundwater (Figure 7e). We further plotted molar ratios of Ca/Na versus Mg/Na to relate the influence of carbonate and silicate weathering on water samples [39], as shown in Figure 7f. Most of the 50 m- to 80 m-depth groundwater samples were located near the silicates end-member, while towards the carbonates end-member, indicating that dominance of silicate mineral weathering as well as the possible contribution of carbonate weathering are the major lithogeny sources for Ca2+ and Mg2+. River water samples were located near the silicates, and some groundwater samples of the 30 m-depth aquifer showed similar features, suggesting the impact of the mixing process.
In groundwater systems, Cl has been widely used as a conservative element to study water–rock interactions (e.g., [40,41,42,43]). The relationships of Na/Cl, K/Cl, Ca/Cl, and Mg/Cl versus Cl for both river water and groundwater are plotted in Figure S1a–d, respectively. The changes in Na/Cl, Ca/Cl, and Mg/Cl show clear mixing trends between groundwater and river water, while a sudden decrease in K/Cl is evident between river water and groundwater samples, suggesting more severe cation exchange reactions of K+ than those of Na+ with Ca2+ or Mg2+ during the recharge of river water into aquifers [42].

4.2. Qualitative Evaluation of Mixing Ratio

4.2.1. River Water EMMA

In the study area, rainwater could be an important end-member for the mixing calculation for river water, as illustrated in Figure 5, especially when the river water flows several kilometers from the MBR towards the Henan Rubber Dam (Figure 1a). As one of our ultimate goals is to evaluate the impact of river water recharge on groundwater, end-members were selected by performing PCA of river water samples, which has been proven as an effective approach (e.g., [25,26]) to extract information from heterogeneous datasets and to define potential end-members that are representative enough to characterize the spatiotemporal variations in river water chemistry.
Based on the PCA results for river water samples in Figure 5, it is clear that river water showed strong seasonal and spatial variations in terms of scores for the first and second principal components, respectively. Therefore, the selected end-members were deemed to represent the spatiotemporal variations in river water chemistry, instead of only the spatial variation. For example, the scores for the first and second principal components of the XYZ-05 sample are closer to those of the CHQ-05 sample than those of the XYZ-09 sample in Figure 5.
A series of mixing analyses were performed for the river water samples using the maximum likelihood method [30]. First, a mixing analysis was conducted using the same dataset selected for PCA of river water. This step was performed to qualitatively evaluate the conservative behavior of all selected species, since the estimated and measured concentrations of conservative elements tend to align closely with the 1:1 mixing line [44,45]. Then, end-member analyses were performed using only the conservative component to calculate mixing ratios for each sample. In the MIX code, standard deviation values are needed as inputs for all species of end-members and water samples to represent uncertainty associated with the unknown real end-members and seasonal and spatial variations. The standard deviations for less conservative species are usually suggested to be higher than those for conservative ones [30]. These standard deviation values are used to quantify the measurement errors of species, as well as the conservative behavior for both water samples and end-members [30]. Since the cations and anions in the water samples were determined with relatively high accuracy, and charge balance errors were less than 5% for most of the samples, a ratio of 5% was assigned to species other than Cl to calculate the standard deviation values for the water samples in the mixing analyses using the MIX code. An even smaller ratio of 1% was assigned to Cl, in order to reflect its relatively high conservative behavior. For the species in the end-members, standard deviation values were calculated as the arithmetic means of standard deviation values for all the water samples, in order to define the overall reliability and restrict the calculation of the concentrations.
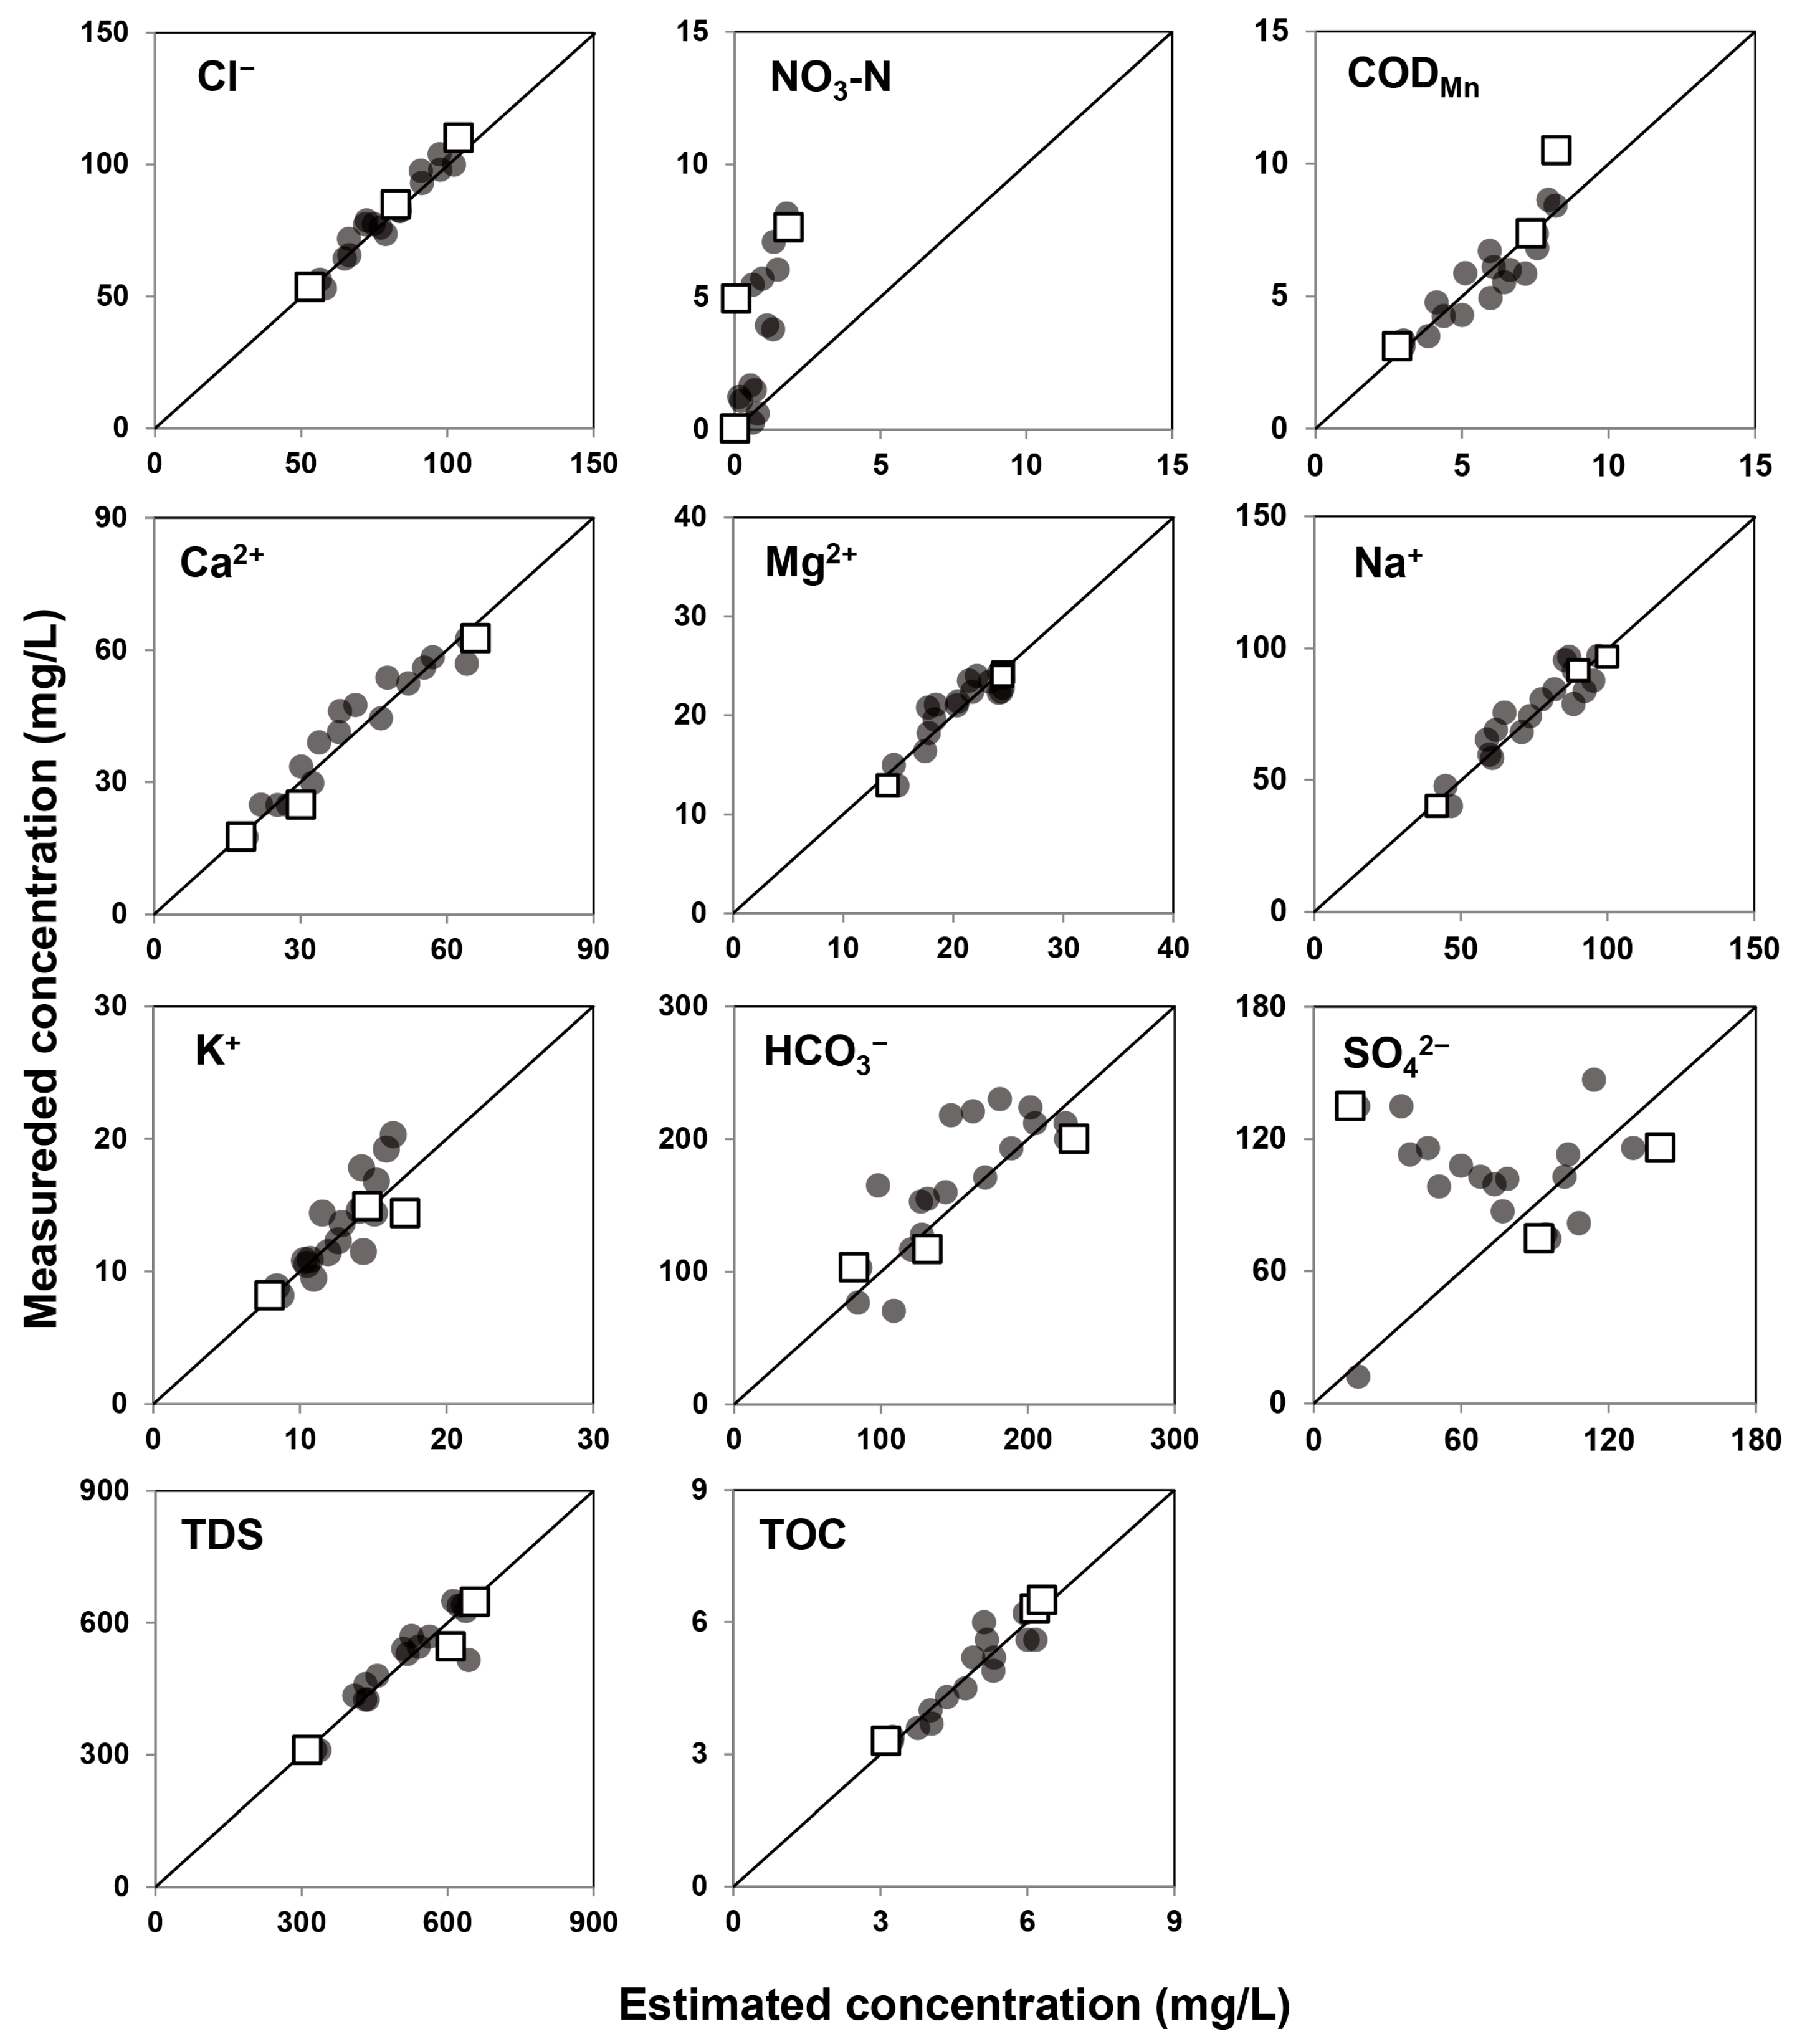
The concentrations of the initial and estimated end-members are listed in Table 2, and the estimated versus measured concentrations for river water samples and end-members are plotted in Figure 8. From the scatterplots of the estimated versus measured concentrations, we see that NO3-N, HCO3, and SO42− of water samples show obvious deviations from the 1:1 mixing line, suggesting that other processes apart from simple mixing are involved [45]. The CODMn and TOC were excluded from mixing ratio calculation due to their reactive nature during river water recharge into the aquifer [46]. K+ was also excluded for potential cation exchange processes, which led to the obvious change in K/Cl ratios shown in Figure S1b. Therefore, only five species (i.e., Cl, Ca2+, Mg2+, Na+, and TDS) listed in Table 2 were utilized to perform mixing analysis for river water samples using the MIX code [30].
In groundwater systems, Cl has been widely recognized as a conservative element for studying water–rock interactions and solute transport issues, as well as for estimating the mixing ratios in mixing-dominated conditions. A previous study at the Chaobai River site by He et al. [20] has also proved the usefulness of Cl for calculating mixing ratios. Results in Figure 8 of our EMMA show a close alignment of data points along the 1:1 line for the estimated and measured Cl concentrations, which confirms its conservative behavior at the MAR site. During the EMMA and MIX analyses in the published studies [47,48,49,50], matching estimated and measured concentrations has been suggested as a useful way of identifying conservative and reaction processes. Significant bias of data points from the 1:1 line for the certain species has been attributed to potential dissolutions, cation exchange processes, etc. We followed the same protocol for selecting relative “conservative” species, thus excluding less conservative species (e.g., NO3-N, HCO3, and SO42−) for subsequent mixing analyses.
A nice feature of the maximum likelihood approach is that the quality of estimation results can be improved by increasing the number of samples or conservative species used in the mixing analysis [30]. To examine this, additional mixing analyses were performed by the MIX algorithm, considering three, four, and five species of Cl, Ca2+, Mg2+, Na+, and TDS. Initial values were the same as the values listed in Table 2.
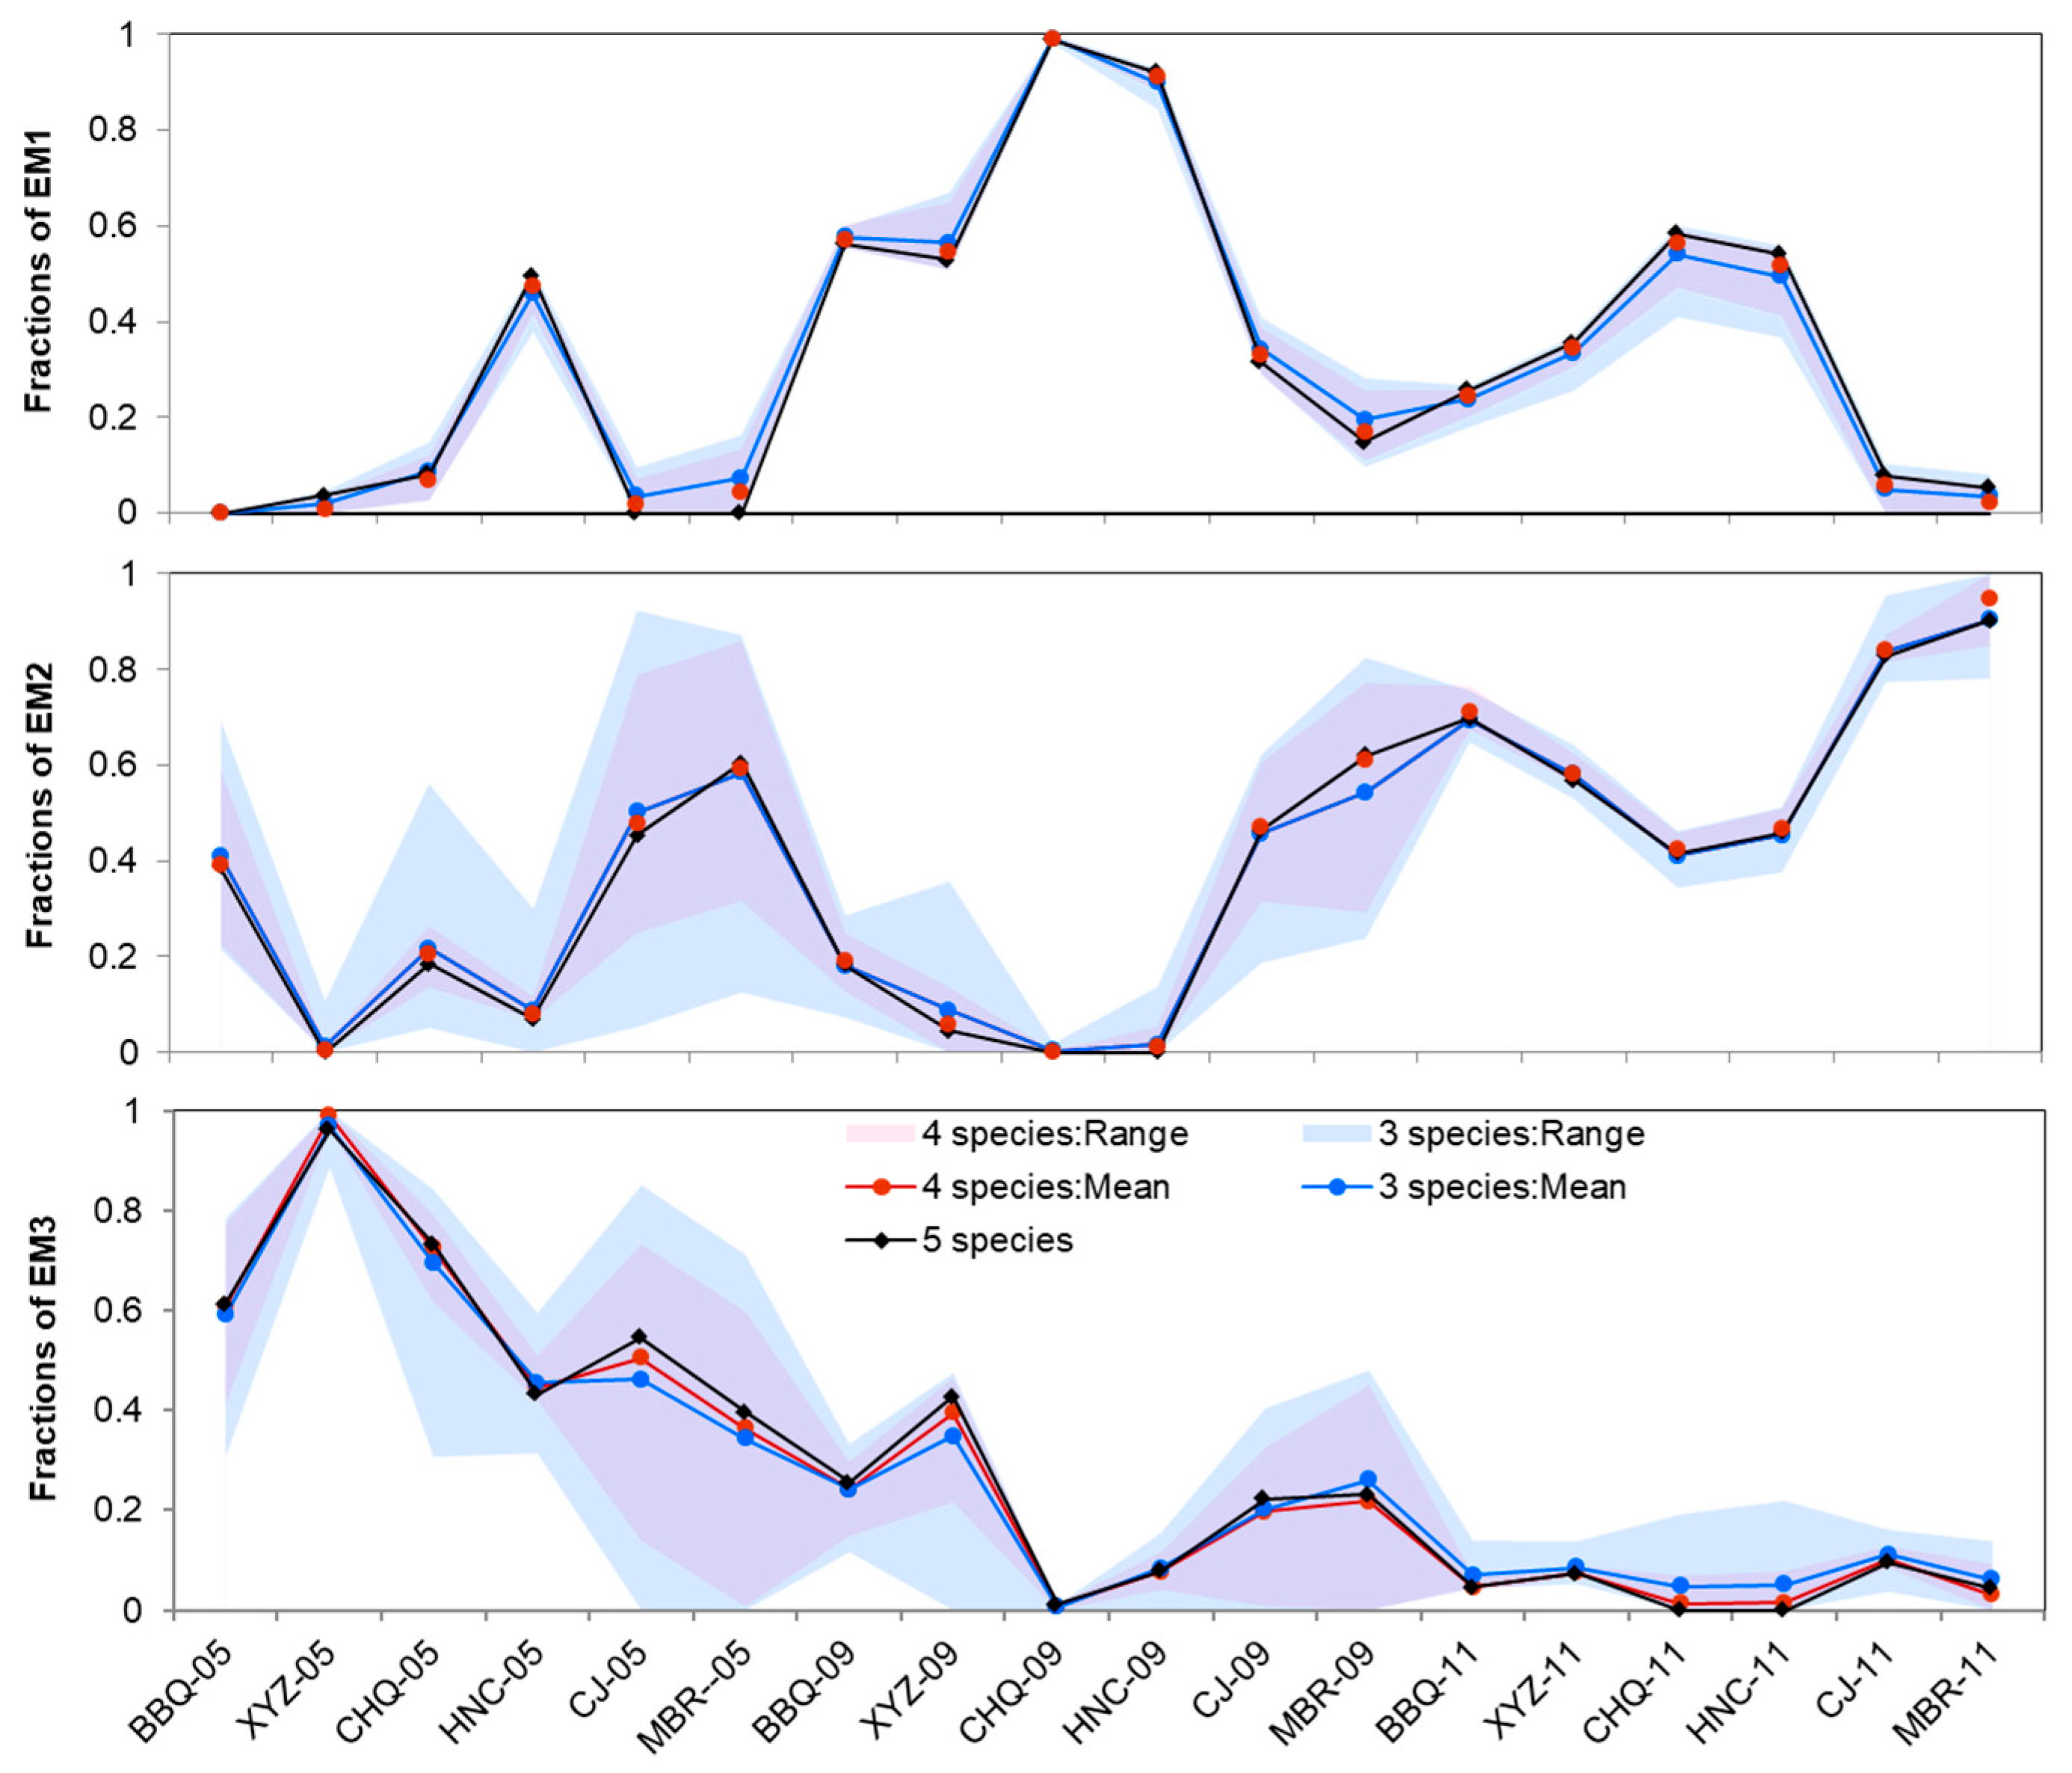
For the scenario of three species, three out of five species of Cl, Ca2+, Mg2+, Na+, and TDS were selected to perform EMMA mixing analysis. Therefore, 10 combinations (e.g., Cl, Ca2+, Mg2+ or Cl, Ca2+, Na+) were simulated using the MIX code [45]. The mean, minimum, and maximum values of fractions of EM1, EM2, and EM3 were calculated and summarized for each river sample. For the scenario of four species, five combinations (e.g., Cl, Ca2+, Mg2+, Na+ or Cl, Ca2+, Na+, TDS) were simulated using the MIX code [45]. For the scenario of five species, only one combination was simulated. The mean values and variation ranges of the calculated mixing ratios for each river water sample are plotted in Figure 9, and the estimated mean concentrations for all five species are summarized in Table 2.
The estimated mixing ratios of EMMA using five species are also included in Figure 9. The variation ranges for the EMMA using four species were significantly narrower than those from the scenario using three species, while the estimated mean fractions of three end-members were quite consistent with all river water samples. Meanwhile, the estimated concentrations for end-members were also quite similar in both scenarios. These results, on one hand, further confirm the findings, obtained by Carrera et al. [30] and Popp et al. [51], that uncertainties of mixing analysis could be reduced by increasing the number of conservative tracers. On the other hand, they suggest the validity of using Cl, Ca2+, Mg2+, Na+, and TDS as conservative species for the end-member analysis of river water. Therefore, the estimated values of the three end-members (EM1, EM2, and EM3) were used for the mixing analysis of river water and groundwater.
In Figure 9, we provide the fraction ranges for scenarios involving only three and four species of Cl, Ca2+, Mg2+, Na+, and TDS, due to the fact that the estimated fractions could vary obviously, depending on which combination of three or four species out of five was selected for the mixing calculations. As there was strong consistency between the mean values of three or four species and the five-species scenario in Figure 9, it was reasonable to use all five species to estimate the fraction values for both the river water samples in Figure 9 and the groundwater samples.

4.2.2. Ground Water EMMA

During the mixing analyses of groundwater samples, Cl, Ca2+, Mg2+, Na+, and TDS were used as conservative species, and their standard deviations were set the same as those in the previous section. Concentrations of species in EM1, EM2, and EM3 in Table 2 were set unchanged for the five-end-member mixing model. A mixing analysis using all five species was performed, and the results are plotted in Figure 10. Generally, the measured concentrations corresponded to the estimated concentrations very well for groundwater samples from the 30 m-, 50 m-, and 80 m-depth aquifer layers, suggesting the reliability of using these species for mixing analyses.
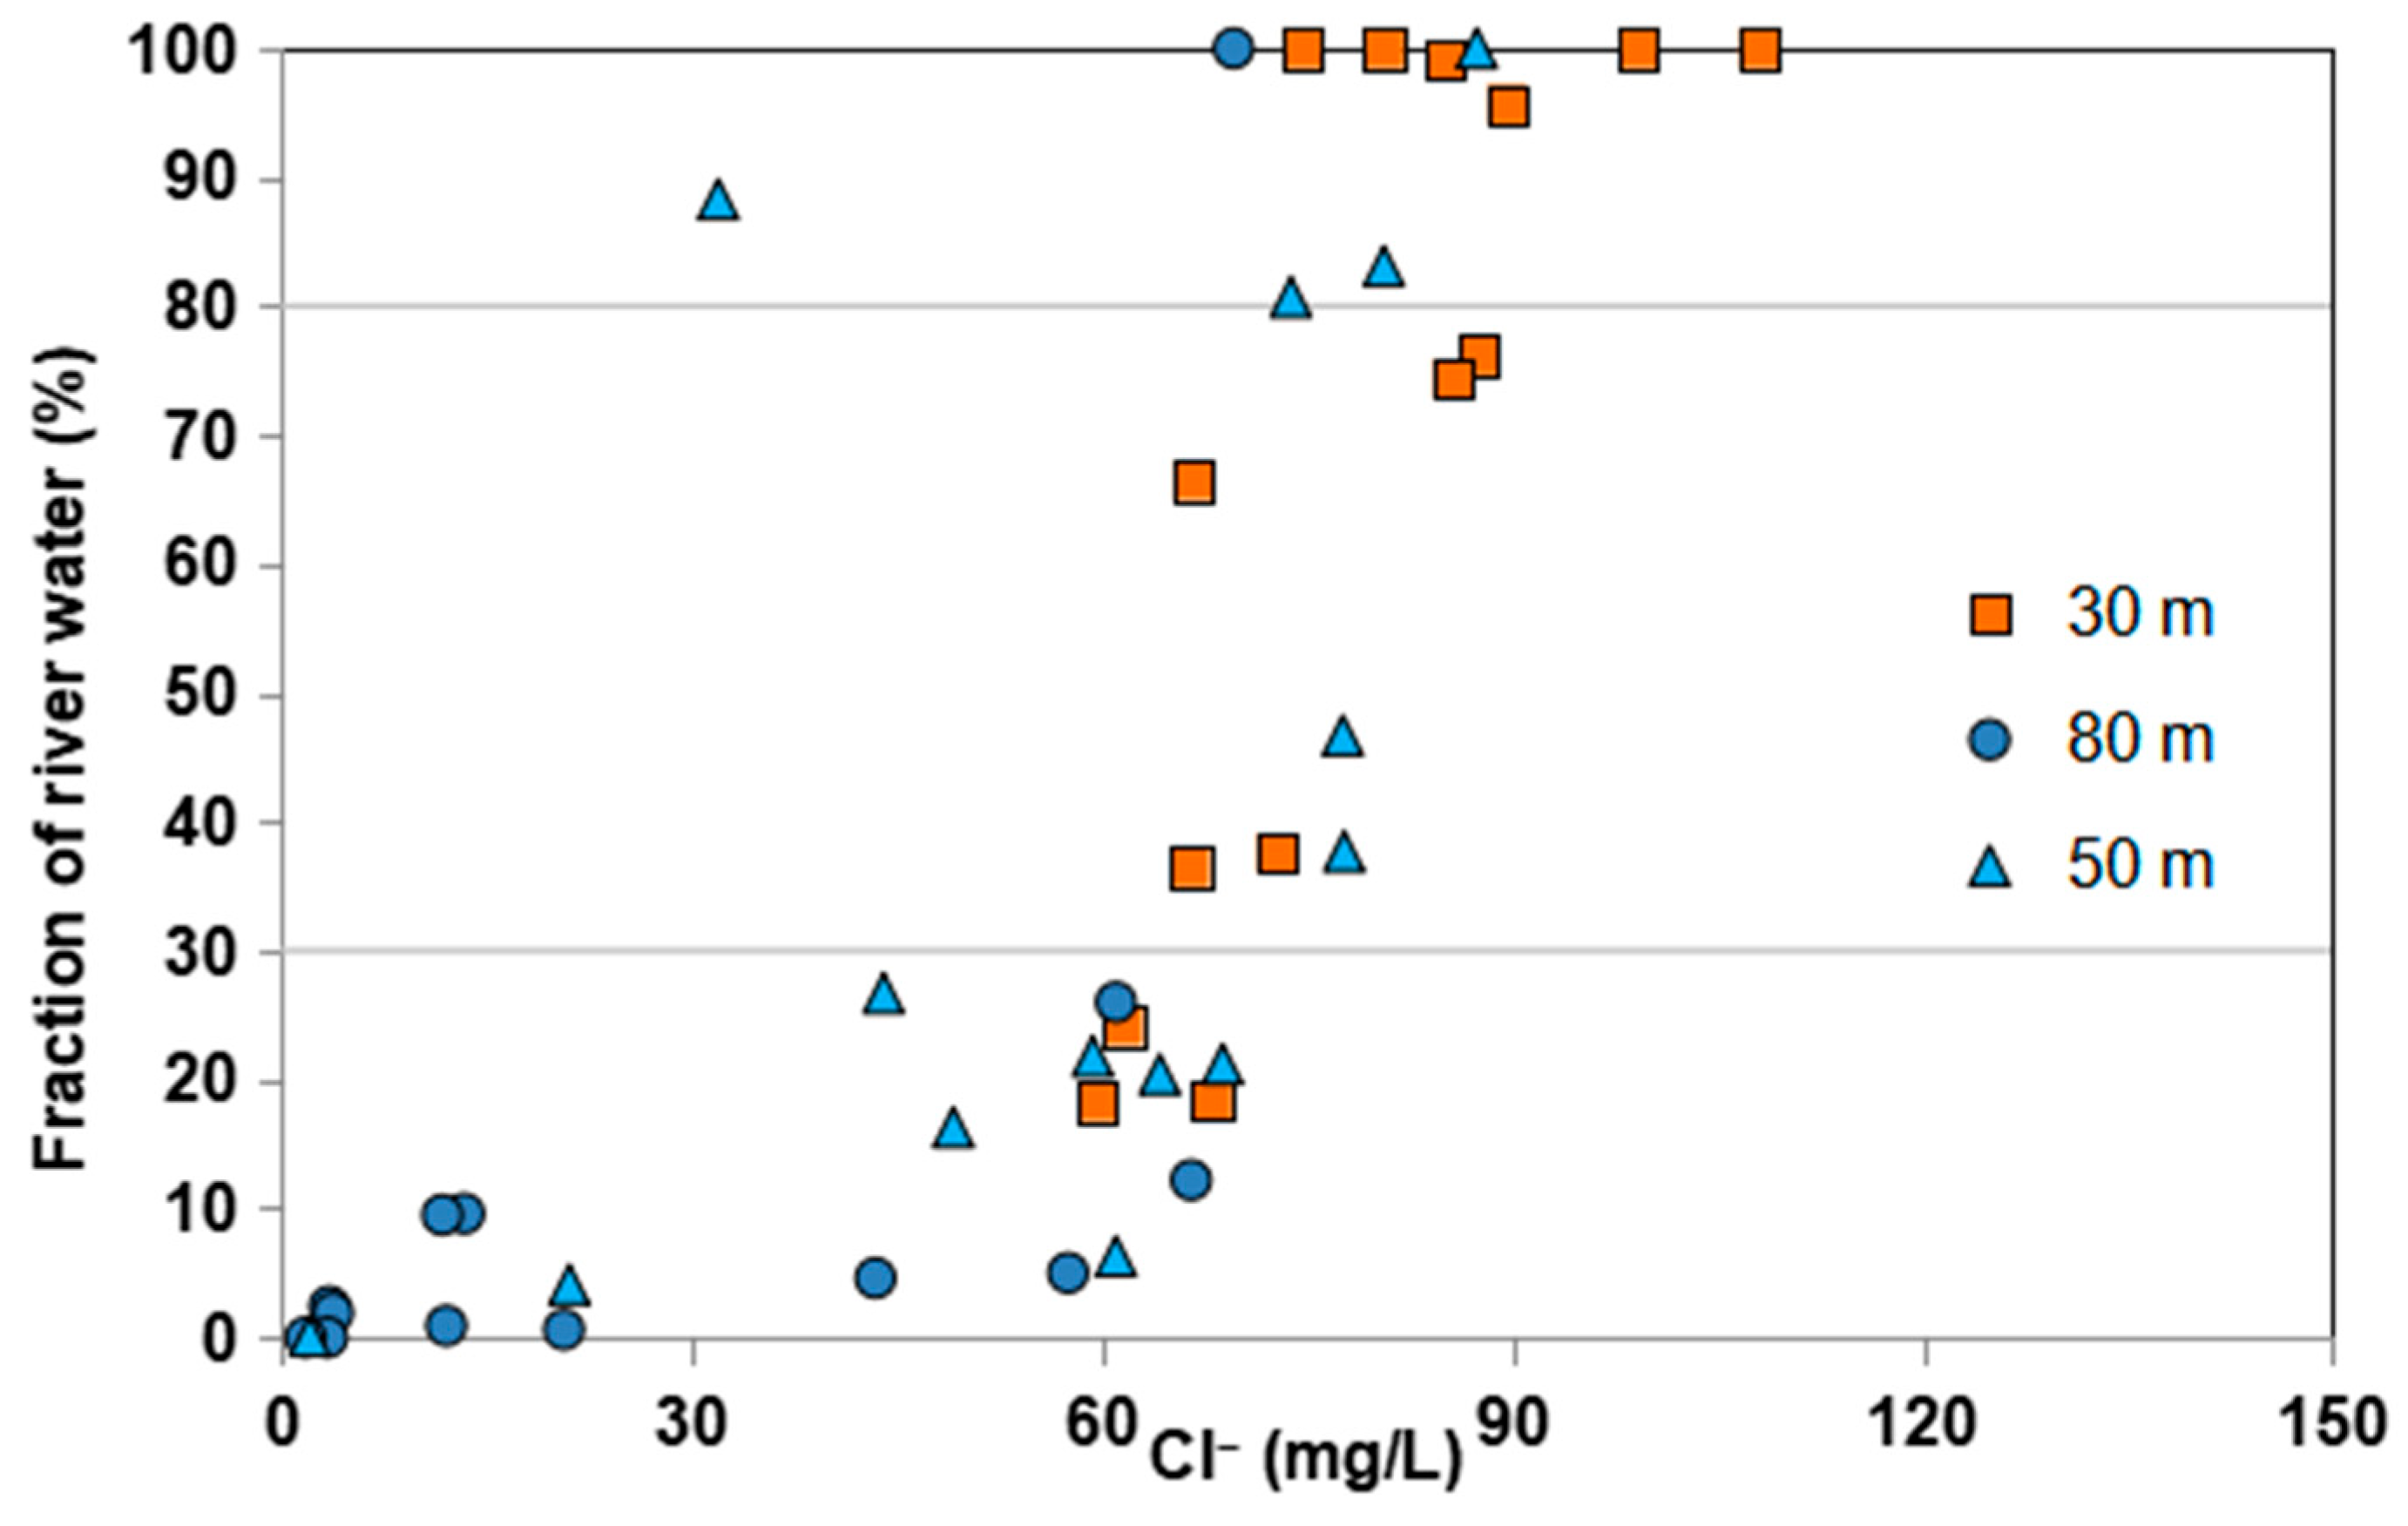
To quantify the impact of river water recharge on groundwater, the percentages of river water (EM1, EM2, and EM3) in groundwater (fR) are summarized in Table S1 and plotted versus Cl concentrations in Figure 11. Generally, there was a decreasing trend in fR values with increasing depth of groundwater samples, as can be clearly seen from Table S1 for wells 01, 02, 22, 14, 23, and 35. Values of fR in groundwater samples from the 30 m-depth aquifer layer varied from 18.3% to 100%. Samples that were close (within 1 km) to the river channel of the permanent intake area (i.e., 22 (30), 23 (30), 26 (30), 30 (30), 31 (30), and 35 (14)), showed high fR values, ranging from 66.5% to 100%. Samples close to (within 1 km) the river channel of the intermittent intake area, 01 (30), 02 (30), and 03 (30), showed relatively low fR values, ranging from 37.9% to 47.7%. Such a distinct difference is quite reasonable and may be attributed to the different water intake schemes, intermittent versus permanent. Samples 32 (30) and 03 (30) had the lowest fR values for samples collected from the 30 m-depth aquifer layer due to their greater distance from the river channel. Sample 35 (30) also had a relatively low fR value of 37.6%, although it was located near the river channel. One potential explanation is that well 35 (30) may be screened in the silty clay layer, which will require additional geological evidence.
Values of fR in groundwater samples from the 50 m-depth aquifer layer were mainly close to and above 30%, as shown in Figure 11. Specifically, samples 14 (50), 15 (50), 16 (50), and 33 (50) showed higher fR values than the other samples in the 50 m-depth aquifer layer. In Figure 1b, we see that well 15 (50) is screened in the shallow unconfined aquifer, which renders groundwater in this area more likely to be affected by the infiltrated river water. Therefore, it is geologically reasonable.
Values of fR in groundwater samples from the 80 m-depth aquifer layer were close to or below 30%, except for sample 15 (80). Based on the geological data in Figure 1b and the fact that groundwater flows downwards, it was likely for this sample to have fR values similar to or lower than those found in the shallower aquifer layers (i.e., 15 (30) and 15 (50)). The relatively high values of fR in samples 15 (30) and 15 (50) clearly confirmed the strong impact of river water recharge. However, the value of fR in sample 15 (30) was lower than those in samples 15 (30) and 15 (50), suggesting that it is necessary to perform mixing analyses using additional conservative species. Overall, the results of mixing analyses conducted in this study corresponded well with the known site geology, indicating the validity of the five-end-member mixing model.

4.3. Implications for Impacts of Reclaimed River-Water Recharge on Groundwater of Multi-Layered Aquifer Systems

Based on discussions in previous sections, the river-water recharge had a great impact on geochemical variations in the underlying multi-layered groundwater system of the Chaobai River. This is consistent with the findings from geochemical analyses [19,43], endocrine disrupting chemicals [45], and isotopic data [20]. Due to the dominant vertical flow pattern within the upper 100 m of the study site [43], quantitative evaluation is critical for the safe operation of long-term MAR practice.
Based on the fluctuation of Cl concentrations in the reclaimed water, river water, and groundwater, the relative contributions of river water recharge to groundwater were estimated to be 95%, 84%, and 36% for the 30 m-, 50 m-, and 80 m-depth aquifer layers, respectively [43]. Another mixing model based also on Cl concentrations showed that the averaged proportions of the river water in the 30 m-, 50 m-, and 80 m-depth aquifer layers were 53%, 39%, and 15%, respectively [20]. For the two wells (31 and 22 in Figure 1a) closely adjacent to the river bank, the mixing ratios of river water in groundwater were estimated as varying between 80% and 100% based on samples collected from the 30 m-depth aquifer layer [52]. Evidence from the occurrences and concentrations of endocrine disrupting chemicals among different aquifer layers also showed a pattern decreasing from 100.0%, 94.4%, to 40.0% in the 30 m-, 50 m-, and 80 m-depth layers, respectively [19].
The general tendency revealed by these various studies clearly suggests that a single chemical component may not be sufficient for the correct identification of mixing ratios in river water–groundwater mixing systems. On one hand, it is not easy for a single component or end-member to fully represent the spatial and temporal variations in the hydrochemistry of a river restored by reclaimed water [28,53]. As clearly illustrated in Section 4.2, three end-members are needed to represent the hydrogeochemical features of river water samples collected over the dry and rainy seasons.
On the other hand, the complex hydrogeological conditions at the study site, with sediments changing from coarse gravel to fine sand and to silty clay, indicate a highly heterogeneous feature of the subsurface, which may lead to more complicated vertical flow variations during the recharge process. Therefore, a thorough understanding and quantification of the impact of river water recharge will require a more reliable characterization of the heterogeneous aquifer system at the MAR site of the Chaobai River. However, this is beyond the scope of the current study. Nevertheless, by combining hydrochemical analysis and end-member mixing approaches, our results revealed five end-members to quantify the impact of river water recharge. For the multi-layered aquifer, arithmetic mean values of 67.6%, 39.5%, and 13.3% were estimated for the 30 m-, 50 m-, and 80 m-depth aquifer layers, respectively, with clear variations as seen in Figure 11. These values are somewhat in between those derived from two mixing models [20,43], suggesting the high reasonability and consistency with the groundwater flow pattern and site geology. A quantitative comparison of historic fR estimates from well to well versus the current study would more clearly demonstrate the results estimated by different approaches. However, this would require detailed data from other studies. An important advantage of the current study over previous ones is that the seasonal variations in river water quality were considered and addressed as additional end-members.
Overall, while a more detailed understanding of aquifer heterogeneity will require additional large-scale geophysical surveys and costly drilling efforts, our study demonstrates that combining hydrochemical analysis and end-member mixing approaches is useful in providing the first-cut and comprehensive insights into the impacts of reclaimed river-water recharge on the groundwater of multi-layered aquifer systems.

5. Conclusions

In this study, multiple statistical analyses and end-member analyses have been used to investigate the impact of reclaimed water recharge on the groundwater of a multi-layer aquifer system in northeastern Beijing, China. Hydrochemical indicators of river water and groundwater were used to identify the hydrochemical processes and mixing between river water and groundwater.
The results lead to the following main findings and conclusions: (1) Hydrochemistry data show that reclaimed water used to supply river water features higher Na+, K+, Cl, and SO42− concentrations, and the recharge of river water led to increased Na+, Cl, and SO42− concentrations in groundwater of the 30 m-, 50 m-, and 80 m-depth aquifer layers; (2) Rather than simply conceptualizing river water as a single end-member in mixing analyses, our study demonstrates the necessity of using multiple species from seasonal and spatial samples for the EMMA of river water at the Chaobai River MAR site; (3) Mixing analyses show that the percentages of river water in groundwater decrease with increasing aquifer depth and distance from the river channel, suggesting that the subsurface heterogeneity plays a critical role in controlling recharge volumes as well as recharge rates.
Overall, this study demonstrates the usefulness of a combined hydrochemical, statistical, and end-member mixing analysis approach in providing a comprehensive understanding of river water recharge at the Chaobai River MAR site. However, it is important to acknowledge that the PCA and EMMA approach did not explicitly consider potential variations in the groundwater flow field, which could be affected by regional groundwater flow or changes in recharge regimes. Future studies using more up-to-date and long-term data would be beneficial for this purpose. Additionally, constructions of three-dimensional groundwater flow and transport models based on the high-resolution characterization of subsurface heterogeneity through approaches such as hydraulic tomography [54] would be useful for a more quantitative understanding of solute transport in highly heterogeneous aquifer systems and the appropriate management of MAR sites.

Supplementary Materials

The following supporting information can be downloaded at: https://www.mdpi.com/article/10.3390/w17172575/s1, Figure S1: Milligram equivalent ratios of (a) Na/Cl, (b) K/Cl, (c) Ca/Cl, and (d) Mg/Cl versus Cl for river water and groundwater samples; Table S1: Estimated percentages of river water (fR) in groundwater samples of different aquifer layers.

Author Contributions

Conceptualization, Z.Z. and X.S.; methodology, Z.Z.; formal analysis, Z.Z. and L.Y.; investigation, Z.Z., L.Y. and X.S.; resources, X.S.; data curation, L.Y. and S.W.; writing—original draft preparation, Z.Z. and X.S.; writing—review and editing, Z.Z., X.S., L.Y. and S.W.; visualization, Z.Z. and X.S.; supervision, X.S.; project administration, X.S.; funding acquisition, Z.Z., X.S., L.Y. and S.W. All authors have read and agreed to the published version of the manuscript.

Funding

This research was funded by the National Natural Science Foundation of China (Grant No. 42377064, No. 41807202, and No. 41730749). Shuyuan Wang acknowledges the support of the Science and Technology Innovation Project (Grant No. DKZDYF-202515) from the Inner Mongolia Geology and Mineral Resources Group Co. Ltd.

Data Availability Statement

The original contributions presented in this study are included in the article/Supplementary Material. Further inquiries can be directed to the corresponding author(s).

Conflicts of Interest

Author Shuyuan Wang was employed by the company Inner Mongolia Coal Geological Exploration (Group) 472 Co., Ltd. The remaining authors declare that the research was conducted in the absence of any commercial or financial relationships that could be construed as a potential conflict of interest. The funders had no role in the design of the study; in the collection, analyses, or interpretation of data; in the writing of the manuscript; or in the decision to publish the results.

References

  1. Crook, J.; MacDonald, J.A.; Trussell, R.R. Potable use of reclaimed water. J. AWWA 1999, 91, 40–49. [Google Scholar] [CrossRef]
  2. Anderson, J. The environmental benefits of water recycling and reuse. Water Supply 2003, 3, 1–10. [Google Scholar] [CrossRef]
  3. Dillon, P.; Stuyfzand, P.; Grischek, T.; Lluria, M.; Pyne, R.D.G.; Jain, R.C.; Bear, J.; Schwarz, J.; Wang, W.; Fernandez, E.; et al. Sixty years of global progress in managed aquifer recharge. Hydrogeol. J. 2019, 27, 1–30. [Google Scholar] [CrossRef]
  4. Gilabert-Alarcón, C.; Daesslé, L.W.; Salgado-Méndez, S.O.; Pérez-Flores, M.A.; Knöller, K.; Kretzschmar, T.G.; Stumpp, C. Effects of reclaimed water discharge in the Maneadero coastal aquifer, Baja California, Mexico. Appl. Geochem. 2018, 92, 121–139. [Google Scholar] [CrossRef]
  5. Bekele, E.; Zhang, Y.; Donn, M.; McFarlane, D. Inferring groundwater dynamics in a coastal aquifer near wastewater infiltration ponds and shallow wetlands (Kwinana, Western Australia) using combined hydrochemical, isotopic and statistical approaches. J. Hydrol. 2019, 568, 1055–1070. [Google Scholar] [CrossRef]
  6. Narr, C.F.; Singh, H.; Mayer, P.; Keeley, A.; Faulkner, B.; Beak, D.; Forshay, K.J. Quantifying the effects of surface conveyance of treated wastewater effluent on groundwater, surface water, and nutrient dynamics in a large river floodplain. Ecol. Eng. 2019, 129, 123–133. [Google Scholar] [CrossRef] [PubMed]
  7. Bourg, A.C.M.; Bertin, C. Biogeochemical processes during the infiltration of river water into an alluvial aquifer. Environ. Sci. Technol. 1993, 27, 661–666. [Google Scholar] [CrossRef]
  8. Irmscher, R.; Teermann, I. Riverbank filtration for drinking water supply—A proven method, perfect to face today’s challenges. Water Supply 2002, 2, 1–8. [Google Scholar] [CrossRef]
  9. Missimer, T.M.; Drewes, J.E.; Amy, G.; Maliva, R.G.; Keller, S. Restoration of Wadi Aquifers by Artificial Recharge with Treated Waste Water. Groundwater 2012, 50, 514–527. [Google Scholar] [CrossRef]
  10. Ortuño, F.; Molinero, J.; Garrido, T.; Custodio, E. Seawater injection barrier recharge with advanced reclaimed water at Llobregat delta aquifer (Spain). Water Sci. Technol. 2012, 66, 2083–2089. [Google Scholar] [CrossRef]
  11. Chen, W.; Lu, S.; Jiao, W.; Wang, M.; Chang, A.C. Reclaimed water: A safe irrigation water source? Environ. Dev. 2013, 8, 74–83. [Google Scholar] [CrossRef]
  12. Szabo, D.; Coggan, T.L.; Robson, T.C.; Currell, M.; Clarke, B.O. Investigating recycled water use as a diffuse source of per- and polyfluoroalkyl substances (PFASs) to groundwater in Melbourne, Australia. Sci. Total Environ. 2018, 644, 1409–1417. [Google Scholar] [CrossRef] [PubMed]
  13. Wang, Y.; Song, X.; Li, B.; Ma, Y.; Zhang, Y.; Yang, L.; Bu, H.; Holm, P.E. Temporal variation in groundwater hydrochemistry driven by natural and anthropogenic processes at a reclaimed water irrigation region. Hydrol. Res. 2018, 49, 1652–1668. [Google Scholar] [CrossRef]
  14. Toze, S.; Bekele, E.; Page, D.; Sidhu, J.; Shackleton, M. Use of static Quantitative Microbial Risk Assessment to determine pathogen risks in an unconfined carbonate aquifer used for Managed Aquifer Recharge. Water Res. 2010, 44, 1038–1049. [Google Scholar] [CrossRef]
  15. Asano, T.; Cotruvo, J.A. Groundwater recharge with reclaimed municipal wastewater: Health and regulatory considerations. Water Res. 2004, 38, 1941–1951. [Google Scholar] [CrossRef]
  16. Wu, W.; Liao, R.; Hu, Y.; Wang, H.; Liu, H.; Yin, S. Quantitative assessment of groundwater pollution risk in reclaimed water irrigation areas of northern China. Environ. Pollut. 2020, 261, 114173. [Google Scholar] [CrossRef]
  17. Zheng, F.; Liu, L.; Li, B.; Yang, Y.; Guo, M. Effects of Reclaimed Water Use for Scenic Water on Groundwater Environment in a Multilayered Aquifer System beneath the Chaobai River, Beijing, China: Case Study. J. Hydrol. Eng. 2015, 20, B5014003. [Google Scholar] [CrossRef]
  18. Li, J.; Fu, J.; Zhang, H.; Li, Z.; Ma, Y.; Wu, M.; Liu, X. Spatial and seasonal variations of occurrences and concentrations of endocrine disrupting chemicals in unconfined and confined aquifers recharged by reclaimed water: A field study along the Chaobai River, Beijing. Sci. Total Environ. 2013, 450–451, 162–168. [Google Scholar] [CrossRef]
  19. Li, C.; Li, B.; Bi, E. Characteristics of hydrochemistry and nitrogen behavior under long-term managed aquifer recharge with reclaimed water: A case study in north China. Sci. Total Environ. 2019, 668, 1030–1037. [Google Scholar] [CrossRef]
  20. He, Z.; Han, D.; Song, X.; Yang, L.; Zhang, Y.; Ma, Y.; Bu, H.; Li, B.; Yang, S. Variations of Groundwater Dynamics in Alluvial Aquifers with Reclaimed Water Restoring the Overlying River, Beijing, China. Water 2021, 13, 806. [Google Scholar] [CrossRef]
  21. Rueedi, J.; Cronin, A.A.; Morris, B.L. Estimation of sewer leakage to urban groundwater using depth-specific hydrochemistry. Water Environ. J. 2009, 23, 134–144. [Google Scholar] [CrossRef]
  22. Yang, L.; He, J.; Liu, Y.; Wang, J.; Jiang, L.; Wang, G. Characteristics of change in water quality along reclaimed water intake area of the Chaobai River in Beijing, China. J. Environ. Sci. 2016, 50, 93–102. [Google Scholar] [CrossRef]
  23. McCance, W.; Jones, O.A.H.; Edwards, M.; Surapaneni, A.; Chadalavada, S.; Currell, M. Contaminants of Emerging Concern as novel groundwater tracers for delineating wastewater impacts in urban and peri-urban areas. Water Res. 2018, 146, 118–133. [Google Scholar] [CrossRef]
  24. Moeck, C.; Radny, D.; Popp, A.; Brennwald, M.; Stoll, S.; Auckenthaler, A.; Berg, M.; Schirmer, M. Characterization of a managed aquifer recharge system using multiple tracers. Sci. Total Environ. 2017, 609, 701–714. [Google Scholar] [CrossRef]
  25. Helena, B.; Pardo, R.; Vega, M.; Barrado, E.; Fernandez, J.M.; Fernandez, L. Temporal evolution of groundwater composition in an alluvial aquifer (Pisuerga River, Spain) by principal component analysis. Water Res. 2000, 34, 807–816. [Google Scholar] [CrossRef]
  26. Scheiber, L.; Cendón, D.I.; Iverach, C.P.; Hankin, S.I.; Vázquez-Suñé, E.; Kelly, B.F.J. Hydrochemical apportioning of irrigation groundwater sources in an alluvial aquifer. Sci. Total Environ. 2020, 744, 140506. [Google Scholar] [CrossRef]
  27. Aji, K.; Tang, C.; Song, X.; Kondoh, A.; Sakura, Y.; Yu, J.; Kaneko, S. Characteristics of chemistry and stable isotopes in groundwater of Chaobai and Yongding River basin, North China Plain. Hydrol. Process 2008, 22, 63–72. [Google Scholar] [CrossRef]
  28. Yu, Y.; Song, X.; Zhang, Y.; Zheng, F. Assessment of Water Quality Using Chemometrics and Multivariate Statistics: A Case Study in Chaobai River Replenished by Reclaimed Water, North China. Water 2020, 12, 2551. [Google Scholar] [CrossRef]
  29. Kaiser, H.F. The Application of Electronic Computers to Factor Analysis. Educ. Psychol. Meas. 1960, 20, 141–151. [Google Scholar] [CrossRef]
  30. Carrera, J.; Vázquez-Suñé, E.; Castillo, O.; Sánchez-Vila, X. A methodology to compute mixing ratios with uncertain end-members. Water Resour. Res. 2004, 40, 1–11. [Google Scholar] [CrossRef]
  31. Tubau, I.; Vàzquez-Suñé, E.; Jurado, A.; Carrera, J. Using EMMA and MIX analysis to assess mixing ratios and to identify hydrochemical reactions in groundwater. Sci. Total Environ. 2014, 470–471, 1120–1131. [Google Scholar] [CrossRef]
  32. Behrouj-Peely, A.; Mohammadi, Z.; Scheiber, L.; Vázquez-Suñé, E. An integrated approach to estimate the mixing ratios in a karst system under different hydrogeological conditions. J. Hydrol. Reg. Stud. 2020, 30, 100693. [Google Scholar] [CrossRef]
  33. Christophersen, N.; Hooper, R.P. Multivariate analysis of stream water chemical data: The use of principal components analysis for the end-member mixing problem. Water Resour. Res. 1992, 28, 99–107. [Google Scholar] [CrossRef]
  34. Pan, X.; Sun, B.; Zhang, S.; Li, G.; Tian, Z.; Guo, Z.; Yu, H.; Yang, Z. Ion sources and seasonal recharge characteristics of groundwater around Dali Lake in semi-arid region of Inner Mongolia Plateau, China. J. Geochemical Explor. 2025, 269, 107612. [Google Scholar] [CrossRef]
  35. Zheng, F. Case Study on Effects Of reclaimed Water Use for Scenic Water on Groundwater environment in Chaobai River; China University of Geosciences: Beijing, China, 2012. [Google Scholar]
  36. Yuan, R.; Wang, M.; Wang, S.; Song, X. Water transfer imposes hydrochemical impacts on groundwater by altering the interaction of groundwater and surface water. J. Hydrol. 2020, 583, 124617. [Google Scholar] [CrossRef]
  37. Rajmohan, N.; Masoud, M.H.Z.; Niyazi, B.A.M. Impact of evaporation on groundwater salinity in the arid coastal aquifer, Western Saudi Arabia. Catena 2021, 196, 104864. [Google Scholar] [CrossRef]
  38. Gibbs, R.J. Mechanisms controlling world water chemistry. Science (80-) 1970, 170, 1088–1090. [Google Scholar] [CrossRef]
  39. Mostaza-Colado, D.; Carreño-Conde, F.; Rasines-Ladero, R.; Iepure, S. Hydrogeochemical characterization of a shallow alluvial aquifer: 1 baseline for groundwater quality assessment and resource management. Sci. Total Environ. 2018, 639, 1110–1125. [Google Scholar] [CrossRef] [PubMed]
  40. Edmunds, W.M.; Carrillo-Rivera, J.J.; Cardona, A. Geochemical evolution of groundwater beneath Mexico City. J. Hydrol. 2002, 258, 1–24. [Google Scholar] [CrossRef]
  41. Huang, T.; Pang, Z.; Li, J.; Xiang, Y.; Zhao, Z. Mapping groundwater renewability using age data in the Baiyang alluvial fan, NW China. Hydrogeol J. 2017, 25, 743–755. [Google Scholar] [CrossRef]
  42. Kim, J.H.; Kim, K.H.; Thao, N.T.; Batsaikhan, B.; Yun, S.T. Hydrochemical assessment of freshening saline groundwater using multiple end-members mixing modeling: A study of Red River delta aquifer, Vietnam. J. Hydrol. 2017, 549, 703–714. [Google Scholar] [CrossRef]
  43. Li, S.; Bian, R.; Li, B.; Huang, J.; Qi, W.; Liu, H. Hyporheic zone geochemistry of a multi-aquifer system used for managed aquifer recharge in Beijing, China. Appl. Geochem. 2021, 131, 105032. [Google Scholar] [CrossRef]
  44. Martinez, J.L.; Raiber, M.; Cendón, D.I. Using 3D geological modelling and geochemical mixing models to characterise alluvial aquifer recharge sources in the upper Condamine River catchment, Queensland, Australia. Sci. Total Environ. 2017, 574, 1–18. [Google Scholar] [CrossRef] [PubMed]
  45. Roques, C.; Aquilina, L.; Boisson, A.; Vergnaud-Ayraud, V.; Labasque, T.; Longuevergne, L.; Laurencelle, M.; Dufresne, A.; De Dreuzy, J.R.; Pauwels, H.; et al. Autotrophic denitrification supported by biotite dissolution in crystalline aquifers: (2) transient mixing and denitrification dynamic during long-term pumping. Sci. Total Environ. 2018, 619–620, 491–503. [Google Scholar] [CrossRef]
  46. Pan, W.; Huang, Q.; Huang, G. Nitrogen and Organics Removal during Riverbank Filtration along a Reclaimed Water Restored River in Beijing, China. Water 2018, 10, 491. [Google Scholar] [CrossRef]
  47. Armengol, S.; Ajami, H.; Acero Triana, J.S.; OSickman, J.; Ortega, L. Isogeochemical Characterization of Mountain System Recharge Processes in the Sierra Nevada, California. Water. Resour. Res. 2024, 60, e2023WR035719. [Google Scholar] [CrossRef]
  48. Scheiber, L.; Jurado, A.; Pujades, E.; Criollo, R.; Suñé, E.V. Applied multivariate statistical analysis as a tool for assessing groundwater reactions in the Niebla-Posadas aquifer, Spain. Hydrogeol. J. 2023, 31, 521–536. [Google Scholar] [CrossRef]
  49. Zhao, H.; Zhou, H.; Huang, K.; Pan, Y.; Peng, Y.; He, X.; Wang, S.; Wan, J. Epikarst Controls of Runoff Composition in Subterranean Stream After Rainstorm Events. Hydrol. Process 2024, 38, e15305. [Google Scholar] [CrossRef]
  50. Pelizardi, F.; Bea, S.A.; Carrera, J.; Vives, L. Identifying geochemical processes using End Member Mixing Analysis to decouple chemical components for mixing ratio calculations. J. Hydrol. 2017, 550, 144–156. [Google Scholar] [CrossRef]
  51. Popp, A.L.; Scheidegger, A.; Moeck, C.; Brennwald, M.S.; Kipfer, R. Integrating Bayesian Groundwater Mixing Modeling With On-Site Helium Analysis to Identify Unknown Water Sources. Water Resour. Res. 2019, 55, 10602–10615. [Google Scholar] [CrossRef]
  52. Xia, Q.; He, J.; Li, B.; He, B.; Huang, J.; Guo, M.; Luo, D. Hydrochemical evolution characteristics and genesis of groundwater under long-term infiltration (2007—2018) of reclaimed water in Chaobai River, Beijing. Water Res. 2022, 226, 119222. [Google Scholar] [CrossRef] [PubMed]
  53. Zhao, R.; Bu, H.; Song, X.; Zhang, Y. A multivariate analysis of the spatial variations of water quality during high-flow period in the Chaobai River (Beijing, China) restored by reclaimed water. Water Supply 2021, 21, 3168–3179. [Google Scholar] [CrossRef]
  54. Yeh, T.C.J.; Liu, S. Hydraulic tomography: Development of a new aquifer test method. Water Resour. Res. 2000, 36, 2095. [Google Scholar] [CrossRef]
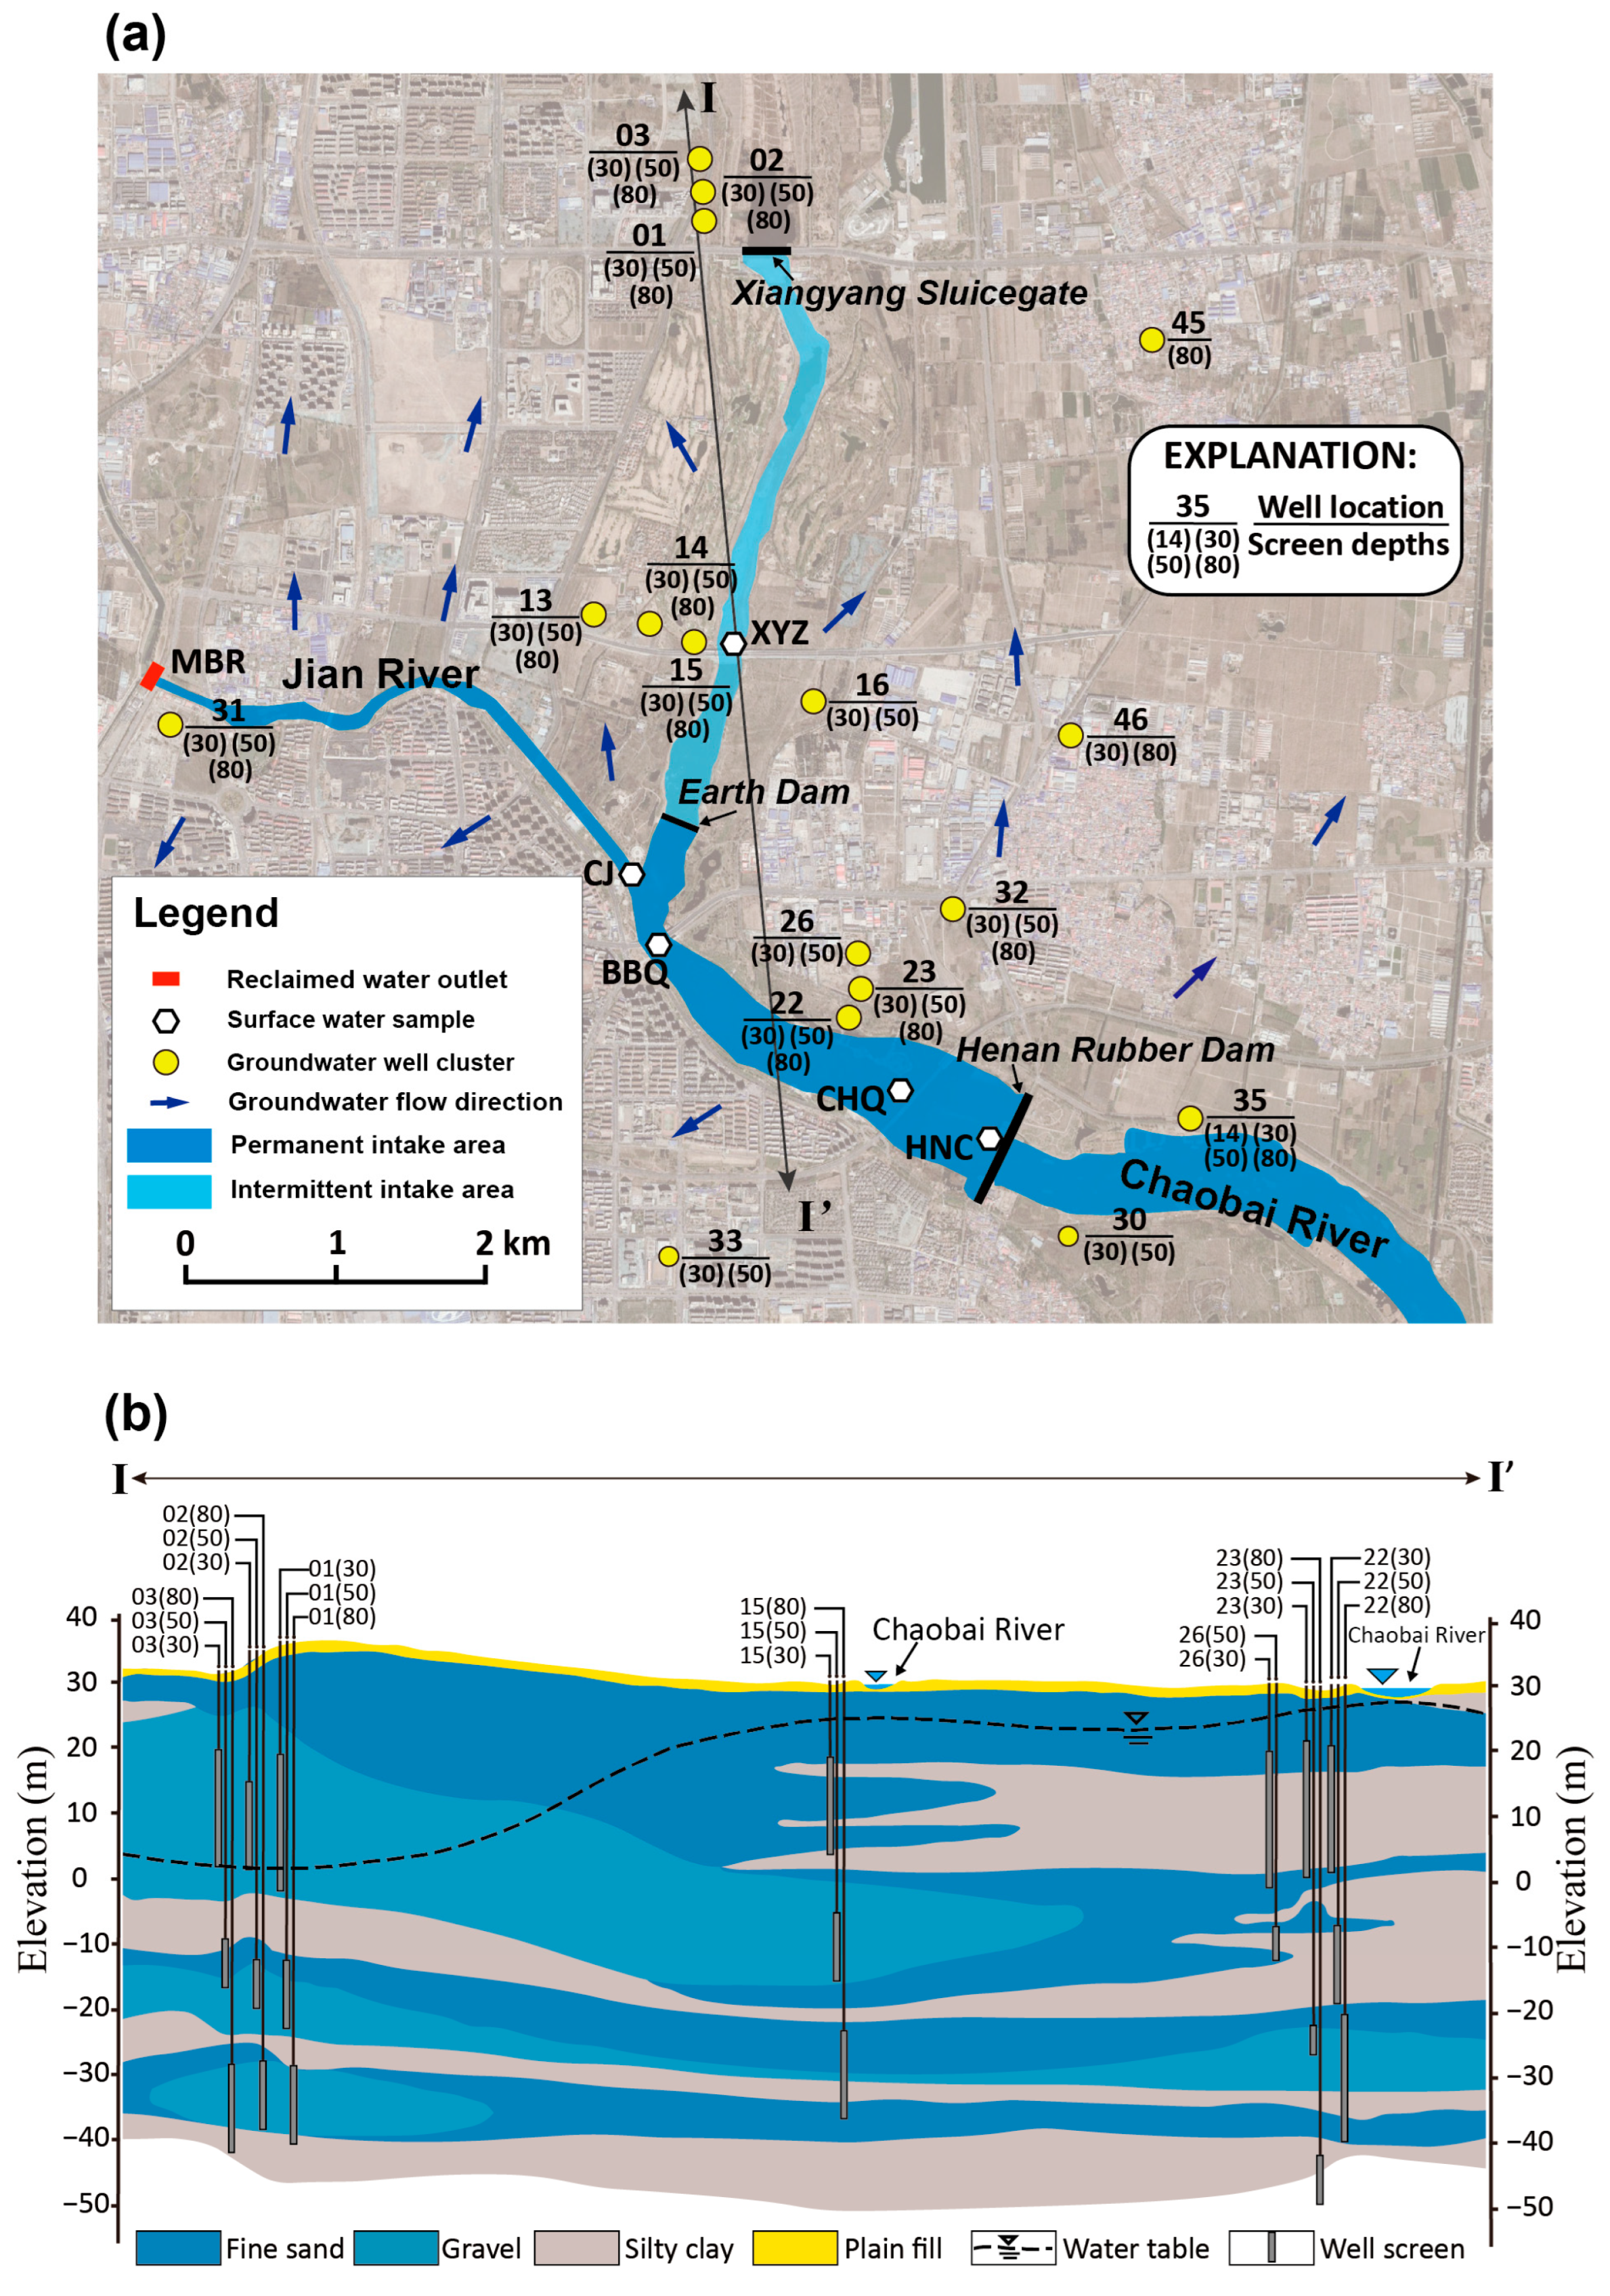
Figure 1. Maps showing (a) the location of well fields of the Chaobai River MAR site; (b) distribution of geological layers along the cross-section I–I’.
Water 17 02575 g001
Figure 2. Piper diagram showing the hydrochemical facies for river water samples collected during the years 2017 and 2018 and groundwater samples collected during May 2018. Groundwater sample data from 2007 were compiled from [35].
Water 17 02575 g002
Figure 3. Relationships between HCO3 and SI in dolomite (SId), calcite (SIc), and gypsum (SIg) for (a) groundwater and (b) river water samples. Samples 13 (30) and 13 (50) represent groundwater collected from 30 m-depth and 50 m-depth aquifer layers at observation well 13, respectively. Sample CHQ-09 represents river water collected in September 2017 at location CHQ.
Water 17 02575 g003
Figure 4. Contribution of variables to eigenvectors 1, 2, and 3 resulting from PCA of (a) river water data and (b) groundwater data. Percentages of variance explained by the first three eigenvectors are enclosed in parentheses for both analyses.
Water 17 02575 g004
Figure 5. Results of PCA and EMMA analyses for MBR and river water samples.
Water 17 02575 g005
Figure 6. Results of PCA for groundwater sampled during May 2018: (a) projection of variables and (b) sample scores on the plot of the 1st versus 2nd principal component. In (b), three river water samples (XYZ-05, MBR-11, and CHQ-09) are also included.
Water 17 02575 g006
Figure 7. Bivariate relationship of ions and ion ratios for river water and samples in the study area. (a) Na+ vs. Cl; (b) Ca2++ Mg2+ vs. HCO32− + SO42−; (c) Ca2++ Mg2+ vs. HCO32−; (d) Ca2+ vs. SO42−; (e) Na/(Ca+Na) vs. TDS; and (f) Ca/Na vs. Mg/Na. In (f), Ca/Na and Mg/Na represent molar ratios.
Water 17 02575 g007
Figure 8. Estimated versus measured concentrations in the river water samples. Squares indicate end members, and solid circles indicate river water samples. The 45-degree lines indicate a 1:1 perfect match of the estimated with measured concentrations.
Water 17 02575 g008
Figure 9. Estimated fractions and corresponding variation ranges for river water samples in EMMA using different numbers of species.
Water 17 02575 g009
Figure 10. Measured versus estimated concentrations in the groundwater samples. The 45-degree lines indicate 1:1 perfect match of the estimated with measured concentrations.
Water 17 02575 g010
Figure 11. Relationship of Cl concentration and estimated percentages of river water in groundwater samples for EMMA scenario 4.
Water 17 02575 g011
Table 1. Descriptive statistics for groundwater and river water samples collected between November 2017 and May 2018.
ParametersGroundwater (n = 48)River Water (n = 18)
MeanMedianMinimumMaximumStandard
Deviation
MeanMedianMinimumMaximumStandard
Deviation
Ca2+ (mg/L)59.958.310.8188.033.140.743.017.662.614.3
Mg2+ (mg/L)24.421.62.767.012.020.921.912.924.33.2
K+ (mg/L)2.52.00.411.82.013.313.08.220.33.4
Na+ (mg/L)51.846.420.696.420.275.377.340.197.216.1
HCO3 (mg/L)314.9310.548.6674.0120.4167.2168.070.5230.049.7
Cl (mg/L)61.066.51.7151.033.879.978.253.1104.014.3
SO42− (mg/L)42.220.30.1225.048.2101.2103.012.2147.028.8
NO3-N (mg/L)1.20.00.016.12.73.32.70.08.22.8
NH4-N (mg/L)0.40.10.03.00.70.10.10.00.50.1
pH8.08.17.39.60.38.38.37.79.00.3
COD (mg/L)2.21.50.315.22.45.95.93.110.51.9
TOC (mg/L)2.11.80.56.11.25.05.23.36.51.1
TDS (mg/L)563.3555.2172.71373.0217.1517.9535.2310.9649.4104.3
Table 2. Initial and estimated concentrations for end-members (EM) of EMMA considering 11 and five species.
ParametersInitial ConcentrationsEstimated End-Members
11 Species5 Species
EM1EM2EM3EM1EM2EM3EM1EM2EM3
Cl (mg/L)53.182.4104.053.584.8110.152.3 83.1 106.3
NO3-N (mg/L)0.037.624.930.031.860.06---
CODMn (mg/L)10.53.17.48.22.87.4---
Ca2+ (mg/L)17.662.624.817.965.930.217.7 68.2 26.9
Mg2+ (mg/L)12.924.324.014.124.524.513.7 24.9 23.2
Na+ (mg/L)40.191.596.841.990.299.940.9 91.4 92.2
K+ (mg/L)8.1714.914.48.014.617.2---
HCO3 (mg/L)10320011781.8231.6131.8---
SO42− (mg/L)74.9135.0116.091.815.0141.1---
TDS (mg/L)310.9646.6545.9312.6656.2606.9302.2 663.2 558.8
TOC (mg/L)6.33.36.56.23.16.3---
Note: ‘-’ denotes species not used for EMMA.
Disclaimer/Publisher’s Note: The statements, opinions and data contained in all publications are solely those of the individual author(s) and contributor(s) and not of MDPI and/or the editor(s). MDPI and/or the editor(s) disclaim responsibility for any injury to people or property resulting from any ideas, methods, instructions or products referred to in the content.